Embed Size (px)
Citation preview

Microbial Competition in Reactors with Wall Attachment: A Mathematical Comparison ofChemostat and Plug Flow ModelsAuthor(s): M. M. Ballyk, D. A. Jones, H. L. SmithSource: Microbial Ecology, Vol. 41, No. 3 (Apr., 2001), pp. 210-221Published by: SpringerStable URL: http://www.jstor.org/stable/4251814Accessed: 18/06/2009 13:48
Your use of the JSTOR archive indicates your acceptance of JSTOR's Terms and Conditions of Use, available athttp://www.jstor.org/page/info/about/policies/terms.jsp. JSTOR's Terms and Conditions of Use provides, in part, that unlessyou have obtained prior permission, you may not download an entire issue of a journal or multiple copies of articles, and youmay use content in the JSTOR archive only for your personal, non-commercial use.
Please contact the publisher regarding any further use of this work. Publisher contact information may be obtained athttp://www.jstor.org/action/showPublisher?publisherCode=springer.
Each copy of any part of a JSTOR transmission must contain the same copyright notice that appears on the screen or printedpage of such transmission.
JSTOR is a not-for-profit organization founded in 1995 to build trusted digital archives for scholarship. We work with thescholarly community to preserve their work and the materials they rely upon, and to build a common research platform thatpromotes the discovery and use of these resources. For more information about JSTOR, please contact [email protected].
Springer is collaborating with JSTOR to digitize, preserve and extend access to Microbial Ecology.
http://www.jstor.org
ECOLOGY Microb Ecol (2001) 41:210-221
DOI: 10.1007/s002480000005 ? 2001 Springer-Verlag New York Inc.
Microbial Competition in Reactors with Wall Attachment: A Mathematical Comparison of Chemostat and Plug Flow Models
M.M. Ballyk, D.A. Jones, H.L Smith
Department of Mathematics, Arizona State University, Tempe, AZ 85287-1804, USA
Received: 8 July 1999; Accepted: 5 November 1999; Online Publication: 23 April 2001
IA B S T R A C T
Competition for nutrient and the ability of bacteria to colonize the gut wall are factors believed to
play a role in the observed stability of the indigenous microbiota of the mammalian large intestine.
These factors were incorporated into the two-strain continuous-stirred tank reactor (CSTR) model
formulated and numerically investigated by Freter et al. In their model simulations, the reactor is
parameterized using data for the mouse intestine. An invading bacterial strain is introduced into a
CSTR that has already been colonized by a resident strain. The two strains compete for a single
growth-limiting nutrient and for limited adhesion sites on the wall of the reactor. The mathematical
model described in this paper is motivated in part by the CSTR model, but is based on the plug flow
reactor (PFR). Parameter values and initial conditions are chosen so that the numerical perfor-
mance of the PFR can be compared to that of the CSTR. In simulations bearing a remarkable
qualitative and quantitative resemblance to those of the CSTR it is found that the invader is virtually
eliminated, despite the fact that it has uptake rate and affinity for the wall identical to those of the
resident. The PFR model is then parametrized using data for the human large intestine, and the
two-strain simulations are repeated. Though obvious quantitative differences are noted, the more
important qualitative outcome is preserved. It is also found that when three strains compete for a
single nutrient and for adhesion sites there exists a steady-state solution characterized by the
segregation of the bacterial strains into separate nonoverlapping segments along the wall of the
reactor.
Introduction
The indigenous microbiota of the human large intestine is part of a highly complex ecosystem consisting of several
Correspondence to: M. Ballyk, Department of Mathematical Sciences, New Mexico State University, Las Cruces, NM 88003, USA
hundred species of microorganisms together with host cells lining the gut wall and digestive remnants in the lumen. The composition of the microbiota is remarkably stable; the spe- cies coexist without one or a few becoming dominant [13]. One of its most important contributions to the host is its ability to impede the colonization of the intestinal tract by nonindigenous microorganisms [23]. The term "coloniza- tion resistance" [27] is used to describe all mechanisms in-
Microbial Competition in Reactors with Wall Attachment 211
volved in this function. An understanding of these mecha- nisms would represent a major contribution to human health. Competition for nutrients and competition for ad- hesion sites appear to be widely accepted as among the most important components of colonization resistance [5, 13, 16, 17, 23, 24].
The difficulties associated with in vivo studies of the hu- man intestinal microbiota are self-evident. A number of in vitro models of bacterial interactions in the gut have been proposed by various authors. Rolfe [23] states that the che- mostat, or continuous-stirred tank reactor (CSTR), is likely the best system for the study of bacterial interactions, since complex population levels of several different organisms can be maintained. Freter and his co-workers [7-12] use the CSTR as an in vitro model of the mouse large intestine. Hume [131 suggests that, when examining digestive pro- cesses in the larger hindgut fermenters, this region of the gut is best modeled by a modified plug flow reactor, which con- sists of a number of stirred tanks connected in series. Mac- farlane et al. [181 use a three-vessel modified plug flow re- actor as an in vitro model of the physiology and ecology of microorganisms in the human colon. Penry and Jumars [21 ] assert that as the number of stirred tanks increases, this reactor system becomes more and more like the plug flow reactor (PFR). In this paper we focus on a mathematical model of microbial interactions in the PFR.
In a series of papers [7-12] Freter and his co-workers examine, both experimentally and mathematically, the ob- served stability of indigenous intestinal microbiota. The role of competition for limiting nutrient and competition for adhesion sites in colonization resistance is investigated via mathematical modeling in [7]. A two-strain mathematical model with the CSTR as its basis and incorporating wall growth is formulated and numerically investigated. One strain of Escherichia coli, termed the resident strain, is first established in the absence of competition. A second strain of E. coli, termed the invader strain, is then introduced. In order to highlight the effects of competition for available wall attachment sites on the success or failure of this inva- sion, Freter assumes that resident and invading strains have identical nutrient uptakes, wall affinities, and slough-off rates. Their numerical simulations indicate that the invader is virtually eliminated. If this outcome were observed when the invader was given some advantage or disadvantage in terms of nutrient uptake or affinity for the wall, then one could not necessarily point to competition for wall space for an explanation.
One can ask whether a model consisting of just two bac-
terial strains can have any relevance to the highly complex intestinal biota. Obviously, our simple models are only aimed at illuminating the effects of nutrient competition and wall adherence on the ability of an invading E. coli strain to colonize a niche occupied by a resident strain. As to the relevance of considering only two strains, we offer two in- terpretations. First, there is a long tradition in ecological modeling of lumping together species (strains) at the same trophic level into a single aggregate species (e.g., phytoplank- ton and zooplankton in a marine setting) having properties which are a weighted average of the corresponding proper- ties of the strain involved. In the same way, we may view Freter's "resident strain" as a surrogate for the indigenous E. coli biota. It is also possible that an invading strain competes most strongly with only one resident strain such that it is reasonable to neglect interactions with other strains.
Motivated by Freter's work on the gut, the authors for- mulated a general model of multistrain competition for lim- iting nutrient and for limited adhesion sites in [2]. The two-strain model considered here is essentially a synthesis of the model of [7] and the PFR model of Kung and Baltzis [15] as modified by Ballyk et al. in [I]. Instead of the CSTR as in Freter's work, the model is based on the PFR. Penry and Jumars [21] argue that the PFR model is more appro- priate for the human gut (and most other mammals). Sub- strate concentrations in the PFR are maintained at higher levels at the inlet and decline along the length of the reactor. In contrast, the concentration of substrate in the CSTR is diluted immediately upon entering the growth vessel. The PFR model also allows for spatial heterogeneity and material flow, neither of which can be considered in the CSTR.
Kung and Baltzis [15] consider a two-strain model of competition for a single growth-limiting nutrient in a PFR in which neither strain has recourse to adhere to the wall of the reactor. They note that rapid nutrient diffusion and rapid microbial motility in their model closely approximate per- fect mixing as it occurs in the ideal CSTR. Incorporating such an assumption into our model would not affect the wall-bound bacteria, since they are assumed to be immobile. This, together with the inherent differences between the PFR and CSTR noted above, would make a correspondence be- tween our model and that of Freter [7] somewhat surprising. However, for certain initial distributions of the resident and invading strains, the assumption of rapid nutrient diffusion and rapid cell motility in our model leads to a remarkable correspondence with the numerical results of Freter [7]. Similarities and differences between the numerical perfor- mances of the PFR and CSTR models are fulrther explored as
212 M.M. Ballyk et al.
the initial distributions of resident and invading strains are varied.
We also present a numerical investigation of the perfor- mance of the PFR using physical parameters appropriate for the human large intestine. Specifically, reactor dimensions (length, radius) are chosen in accordance with data on the large intestine, while the velocity of the medium is varied to reflect realistic transit times. The diffusivity and random motility coefficients are taken to approximate experimen- tally determined values. Nutrient uptake functions, rates of adhesion and shedding, and the nutrient input concentra- tion are maintained, so that comparisons can be made. Again, an invading strain is introduced at the steady state of an already established strain. Similarities and differences of both a qualitative and quantitative nature are noted and investigated. In particular, when competition is between two strains which have identical growth rates and affinities for wall adhesion sites, the qualitative outcome is as in [7].
The final example is motivated by the surprising coexist- ence result of Jones and Smith [14] in their study of two- strain competition in pure plug flow. Three bacterial popu- lations compete for one growth-limiting nutrient and for adhesion sites. Each population is the dominant competitor on one of three intervals of nutrient concentrations. At steady state each establishes on the wall of the reactor along the nutrient gradient at the nutrient concentrations corre- sponding to its interval of superiority. Hume [ 13] states that bacteria adhering to the gut wall occur in virtually pure cultures. Our example is consistent with this finding and suggests that environmental factors might contribute to this specificity of adhesion sites.
Materials and Methods
The CSTR Model of [7]
We begin by describing the model of [7]. The following assump- tions are made:
1. Both strains compete for the same adhesion sites on the gut wall. 2. Both "resident" and "invader" strains compete for the same
limiting nutrient. 3. Offspring of adherent microorganisms occupy additional adhe-
sion sites or, when most sites are filled, are shed into the lumen. 4. Adhesion of bacteria is reversible, governed by rate constants for
adhesion and dissociation in a mass action type of relation.
Additionally, the intrinsic death rate is assumed to be insignificant. Since both strains are able to attach themselves to the wall of the growth vessel, there are four populations under consideration. The "resident" strain (respectively, "invader" strain) will be referred to
as strain one (respectively, strain two). Using the notation of [2], the CSTR model of [7] is given by the equations
D 2
S' (t) = Vi (S? -S(t))- #yT((t))[Uft) + wi(t)/V, i=l
UV(r) = ui(t) YS(t)) - V- ki - (cz,A/V)(1 - O(t))]
+ (wi(t)/V)[f(S(t))(1 - Gi(W(t))) + Pi], (1) w'(t) = wi(t)(f(S(t))Gi(W(t)) - ki - Ii)
+ (ui(t)V)(d'A/V)(l - W(t)), with initial conditions
S(O) =So > 0, ui(O) = uio 2 0, wi(O) = wio 2 0.
Given that the volume of the growth vessel V is taken to be 1 ml, the quantities in the above equations are described as follows. The concentration of free bacteria of strain i in the culture vessel at time t is denoted ui(t), and the number of adherent bacteria of strain i at time t is denoted wi(t). The constant S? represents the concen- tration of resource S in the feed bottle. The concentration of re- source S in the culture vessel at time t is denoted S(t). As noted by Freter [7], this concentration "is meant to represent the portion of the limiting substrate that is not utilized by the predominantly anaerobic microflora (i.e., it represents the concentration of this substrate that would establish itself in the absence of resident and invader E. coli populations)." The constant D is the input rate from the feed vessel to the culture vessel as well as the washout rate from the culture vessel to the receptacle. Thus constant volume is main- tained. The intrinsic death rate of bacterial strain i is denoted ki and is taken to be zero in the present context.
The functions -y'1f(S(t)) represent the rate of consumption of resource S per unit of biomass of strain i (given by ui(t) +wi(t)IV) as a function of the concentration S(t) in the culture vessel. The conversion of nutrient to biomass is assumed to be proportional (with growth yield constant yi) to the amount of nutrient con- sumed. The functions fg are assumed to satisfy Monod kinetics:
m~S fi(S) -
m s-
The total number of sites available for adhesion of bacteria is given by the constant A. In accordance with assumption 1, the fraction of occupied sites on the wall at time t is then given by W(t) = (wl(t) +w2(t))/A. The fraction of offspring of population wi finding sites on the wall at time t is taken to be a function of the occupancy fraction and is denoted by Gi(W(t)). In [7] it is assumed to be of the form
1-W(t) Gi(W(t)) = 1.1 - V(t)
Free bacteria of strain i are attracted to the wall at a rate propor- tional (with constant &4;A/V) to the product of the free cell den- sity ui(t) and the fraction of available wall sites (1 - W(t)). (Here,
&;j is the specific rate constant of adhesion in the notation of [7].) Wall-attached bacteria are sloughed off the wall by mechanical forces at a rate proportional (with constant F R) to their density wi(t). Note that we have allowed for the possibility that these rate
Microbial Competition in Reactors with Wall Attachment 213
7.0 y TOTAL NO. OF RESIDENTS
<: st_ ---- ------ -- -- -- -- -- - ----- - ---- - - -
w O 5.0 '. NO. OF
cn *.ADHERENT ml *. RESIDENTS
o 30O -. TOTAL NO. OF : INVADERS
co NO. OF D ADHERENT z 1.0 INVADERS
-1.C
0 60 120 180 240 HOURS AFTFR INGFSTION OF THE INVADERS
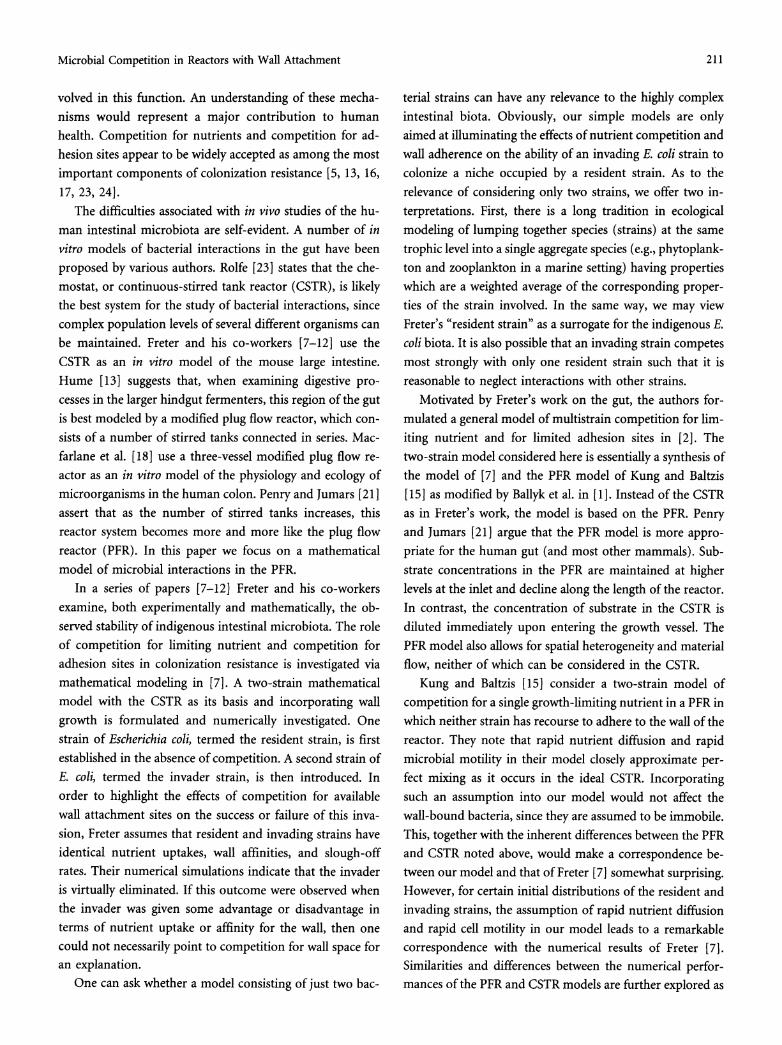
Fig. 1. Time series for the CSTR model in which an invading strain competes with a resident strain for the same adhesion sites and the same limiting nutrient. (From [7], p. 45. Copyright 1983, Academic Press. Reproduced by permission.)
constants are strain-specific, a slight generalization of the model considered in [7].
The focus of Freter's mathematical investigation is the impact of competition for nutrient and competition for wall attachment sites on the ability of an invader to colonize the reactor. In order to highlight these effects, Freter assumes that the strains are identical in terms of nutrient uptake, wall affinities, and slough-off rates. The related parameter values are mi = 1.66 h-1, -yi = 0.5, ai = 9.0 x 10⁻⁷g
ml-', f3i = 0.1 h-1, and c&; = 1 x 10⁷L/h g for i = 1, 2. The other parameter values are DIV = 0.23 h-1, So = 2.09 x 10⁻⁶ g ml-', A = 3 x 10⁷ sites, and 1 g of bacterial mass is assumed to contain 1.8 x 10¹² cells. The initial concentration of free residents is ulo = 1.82 x 10⁶cells ml-' and the initial concentration of free invaders is u20 =
1 x 10⁸ cells ml-'. We reproduce here Figs. 1 and 2 of [7]; see Figs. 1 and 2, respectively. Assuming from Figure 1 that log 10 of the total number of residents is initially 6.5 yields 3.16 x 10⁶ cells, so that the number of adherent residents is initiallywlo = 1.34 x 10⁶
cells. (Note that log 10(1.34 x 10⁶) = 6.13, in good agreement with Fig. 1.)
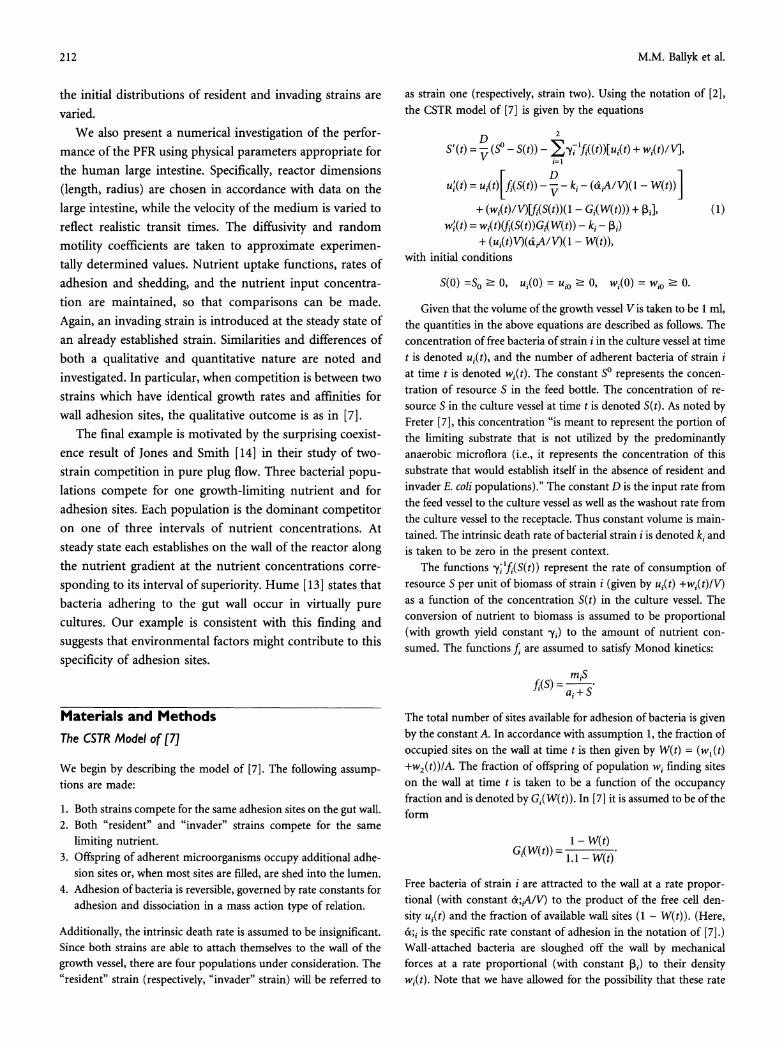
As indicated by Fig. 1, the system equilibrates in approximately 200 h. At that time the invaders number 2.5 cells, approximately half of the total population of each strain is adherent, and only 6.5% of the total number of adhesion sites are occupied. Thus, a large inoculum of an invading strain with growth, adherence, and dissociation parameters identical to those of the resident strain will be largely washed out. The experimental results of [10], involving a continuous flow culture of mouse large intestinal flora, support this theory. To examine the importance of wall associated growth, Freter then takes wio = 0 and &i = 0. See Fig. 2. In this case, the invader successfully replaces the resident as the predominant strain. Thus, Freter's model predicts that colonization is possible without recourse to association with the gut wall, but that such wall-
X J TOTAL NO. OF INVADERS
< 6.0 i ..........................................................................
Oi- \ TOTAL NO. OF RESIDENTS
o 4.0 2
0 ______________
0 - 0 60 120 180 240
HOURS AFTER INGESTION OF THE INVADERS
Fig. 2. Time series for the CSTR model of the same interactions shown in Fig. 1 except that neither strain can colonize the wall. (From [7], p. 46. Copyright 1983, Academic Press. Reproduced by
associated growth is requisite for maintaining the stability of the ecosystem.
The PFR Model Description
We now describe the corresponding model equations for the PFR. They account for the concentration of free bacteria ui(x,t), the areal density of wall-attached bacteria wi(x,t), and the concentration of nutrient S(x,t). As in the "resident" strain (respectively, "invader" strain) is referred to as strain one (respectively, strain two). The resultant equations are a special case of Model I of [2]; further details can be found there. See Table 1 for a summary of the mathematical notation.
Consider a long thin tube of radius p extending along the x-axis. The reactor occupies the portion of the tube from x = 0 to x = L. It is fed with growth medium at a constant rate at x = 0 due to a constant laminar flow of fluid in the vessel in the direction of increasing x and at velocity v. The external feed contains all nutri- ents in near optimal amounts except one, denoted S, which is supplied in growth-limiting amounts and at a constant input con- centration So. The laminar flow of medium in the tube carries medium, depleted nutrients, organisms, and by-products out of the reactor at x = L. Nutrient is assumed to diffuse throughout with diffusivity do. Free microorganisms are assumed to be capable of random movement, modeled by diffusion coefficients di. Wall- attached bacteria are assumed to be immobile. We assume negli- gible variation of free bacteria and nutrient concentration trans- verse to the axial direction of the tube.
The model of two-strain competition in a PFR with wall growth takes the form of a system of partial differential equations coupled with a system of ordinary differential equations and is given by
2
= d0S. - vS, - EYa f1(S)[ui + 8wi], i=l
(ui)t = di(ui), - v(ui). + uif(S) - ki - oLi(l - W)] + 6wi-(S)(1 - Gr(W)) + TA I-% (2)
() = wi(f(S)Gi(W - ki - i) + 8 iil-
214 M.M. Ballyk et al.
Table 1. Notation used in PFR model (2)
Symbol Units Description
ui(x,t) g ml-' Bacteria-in-solution density of population ui di cm2 h-' Diffusion coefficient for population ui wi(x, t) g cm-2 Bacteria-on-wall density of population wi W. g cm-2 Maximum bacteria-on-wall density W(x,t) Occupation fraction Gi Fraction of offspring of population wi
which find sites on the wall S(x,t) g ml-' Nutrient density do cm2 h-1 Diffusion coefficient for resource S So g ml-l Input concentration of resource S fi(S) hr-1 Resource dependent growth rate of
population i per unit of population i Yi - Growth yield constant for strain i on
resource S ki h-1 Intrinsic death rate of population i otj h-1 Rate coefficient of attachment for
population ui P3i h-1 Rate coefficient of detachment for
population wi L cm Length of the reactor p cm Radius of the reactor 'v cm h-' Volumetric flow rate
for i = 1, 2 together with the boundary conditions
as d -(0, t) - vS(0, t) -vS?, Oax au
d- a (o, t) - vui(O, t) = 0,
AS aU, a (L, t) - -(L, t) =0, ax ax
and the initial conditions
S(x,0) = SO(x) - 0, ui(x,0) =uio(x) ? 0, wi(x,0) =wio(x) 2 0,
for 0 ' x ' L. The nutrient uptake functions y;'f1(S(xt)) are again assumed to
satisfy Monod kinetics. The maximum bacteria-on-wall density is given by the constant w,. The occupation fraction is W(x,t) = (w,(x,t) + w2(x,t))/w,, and the function Gi(W (xt)) is again giv- en by
1 - W(x, t) G t 1 - W(x, t)
Free bacteria are attracted to the wall at a rate proportional (with constant ai) to the product of the free cell density ui(x,t) and the fraction of available wall sites (1 - W(x,t)). The rate coefficient of detachment for population wi(x,t) is again denoted P3i. The quantity 8 = 2/p serves as a conversion factor for the areal density of ad- herent bacteria as they dissociate from the wall and for the volu- metric density of free bacteria as they adhere to the wall. As such, it is comparable to the quantity 1/V in (21).
10
Total number of residents
E . . .. . S. .. . . . .. . . . .. . . .. . . .
86. Number of adherent residents
4 -
E Z
2 .,
- - Total number of invaders
o _ _ / Number of adherent invaders
-2 1 . . /. t.. ,f O 50 100 150 200 250
Time (hours)
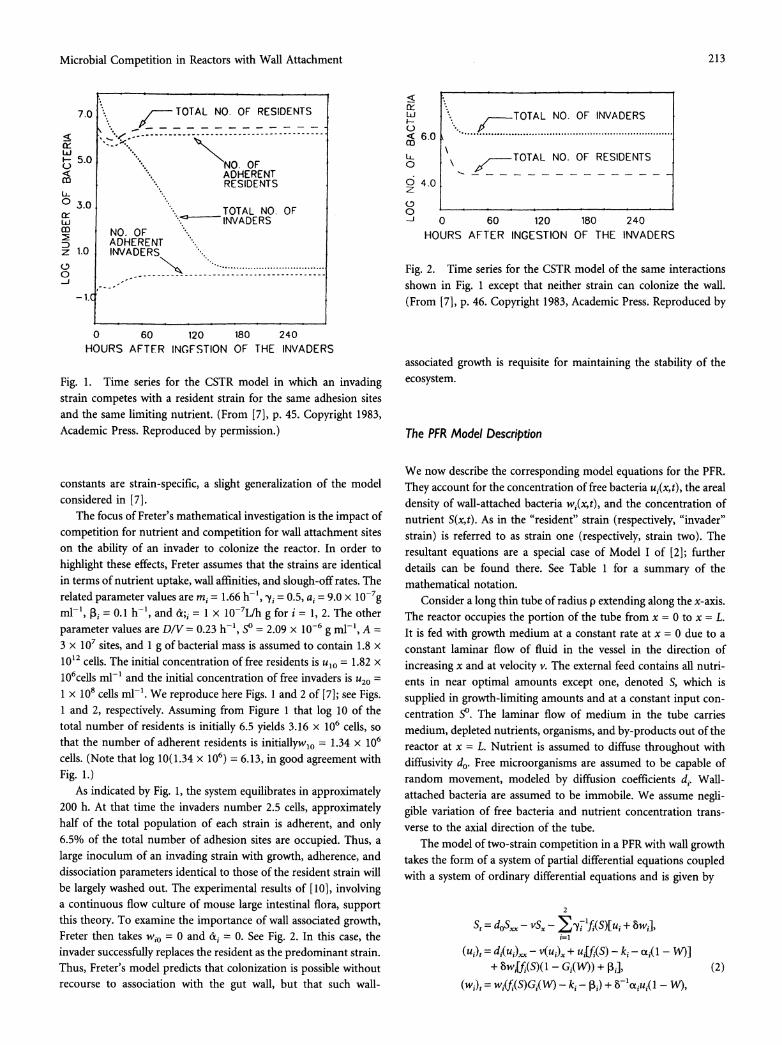
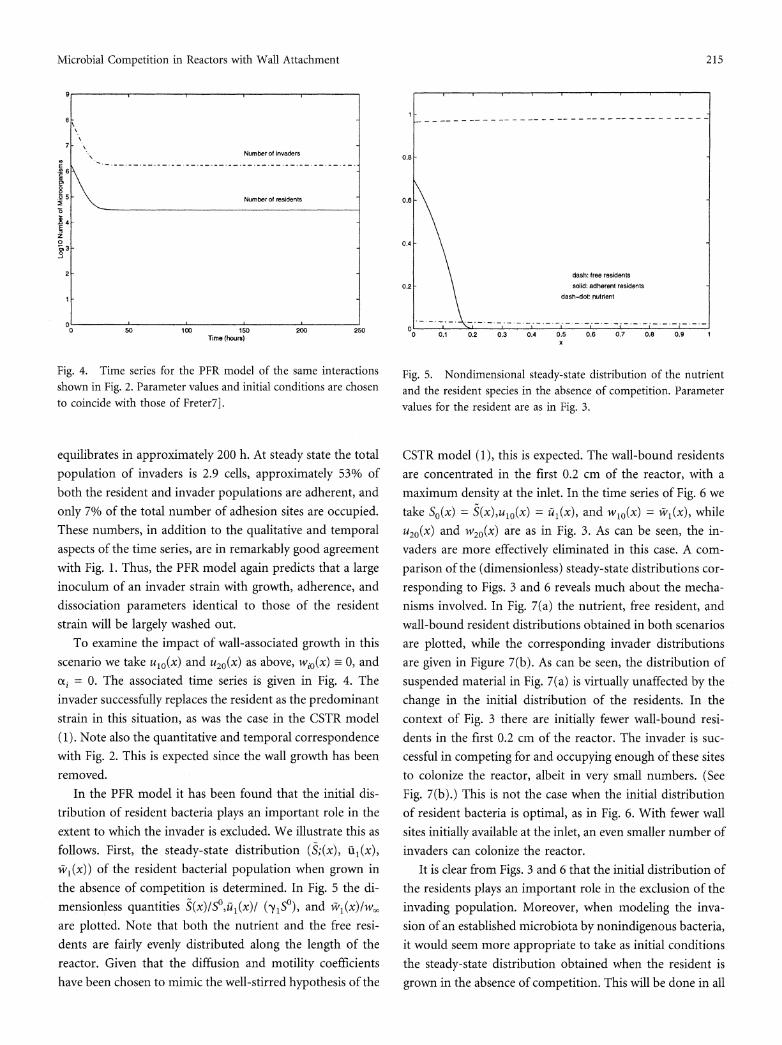
Fig. 3. Time series for the PFR model of the same interactions shown in Fig. 1. Parameter values and initial conditions are chosen to coincide with those of Freter [7].
Results and Discussion
In Fig. 3 we use the parameter values of [7] with appropriate modifications for the PFR. First, mi, ai, yi, ki, Pi) and So are as in the discussion of the CSTR model (1). As in [7] we assume that 1 g of bacterial mass contains 1.8 x 10¹² cells, and we choose L = 1 cm and p = 0.564 cm so that the volume of the reactor is approximately 1 ml. The following modifi- cations are made in the PFR model: ci = [(1 x 10⁻⁷ L h-1 g-1) (3 x 10⁷ sites)]/[(1.8 x 1012 cells g-1)(1 x i0-3 L)] = 1.67 x 10⁻⁹ h-1, we,. = (3 x 10⁷ sites)/[(1.8 x 10 cells g'l)(2irpL cm2)] = (1.67 x 10⁻⁵)/(2irpL) g cm-2, and v =
0.23 cm h-1 since DIV = 0.23 hr-1 implies v = D/AC= 0.23L cm h-1 and the length of the reactor is assumed to be 1 cm. To approximate the perfect mixing hypothesis inherent to the CSTR model (1) we take di = 3 cm2h-1, i = 0, 1, 2.
We obtain the initial conditions as follows. The initial concentration of free residents in Fig. 1 is 1.82 x 10⁶ cells ml-l, so that the mass of residents in the lumen is initially 1.0 x 10⁻⁶ g. Dividing by the volume of the reactor, we obtain ulo(x) (1.0 x 10⁶)I(7rp2L) g ml-' in the PFR model. The initial conditions wlo(x) - (7.4 x 10⁻⁷)/(2TFpL) g cm-2 and u20(x) (5.56 x 10⁻⁵)/(Ip2L) g m-'are obtained similarly. Since it is assumed that no invaders have occupied sites on the wall at time t = 0, w20(x) - 0. Note that both the free and wall-bound resident and invader populations are initially evenly distributed along the length of the reactor.
The time series for the PFR model with these parameter values and initial conditions is given in Fig. 3. The system
Microbial Competition in Reactors with Wall Attachment 215
7 \ Numberof invaders
c 6
Numberof residents
34
z
2-
0 50 100 150 200 250 Time (hours)
Fig. 4. Time series for the PFR model of the same interactions shown in Fig. 2. Parameter values and initial conditions are chosen to coincide with those of Freter7].
equilibrates in approximately 200 h. At steady state the total population of invaders is 2.9 cells, approximately 53% of both the resident and invader populations are adherent, and only 7% of the total number of adhesion sites are occupied. These numbers, in addition to the qualitative and temporal aspects of the time series, are in remarkably good agreement with Fig. 1. Thus, the PFR model again predicts that a large inoculum of an invader strain with growth, adherence, and dissociation parameters identical to those of the resident strain will be largely washed out.
To examine the impact of wall-associated growth in this scenario we take ulo(x) and u20(x) as above, wio(x) _ 0, and
-i = 0. The associated time series is given in Fig. 4. The invader successfully replaces the resident as the predominant strain in this situation, as was the case in the CSTR model (1). Note also the quantitative and temporal correspondence with Fig. 2. This is expected since the wall growth has been removed.
In the PFR model it has been found that the initial dis- tribution of resident bacteria plays an important role in the extent to which the invader is excluded. We illustrate this as follows. First, the steady-state distribution (S;(x), ft1(x), fi1(x)) of the resident bacterial population when grown in the absence of competition is determined. In Fig. 5 the di- mensionless quantities S(x)15,fi1(x)l (y1S0), and i1,'(x)Iwvvry
are plotted. Note that both the nutrient and the free resi-
dents are fairly evenly distributed along the length of the
reactor. Given that the diffusion and motility coefficients have been chosen to mimic the well-stirred hypothesis of the
0.8
0.8
0.4-
dash: free residents 0.2 - solid: adherent residents
dash-dot: nutnent
0 O,1 0.2 0.3 0.4 0.5 0.6 0.7 0,8 0.9 1
Fig. 5. Nondimensional steady-state distribution of the nutrient and the resident species in the absence of competition. Parameter values for the resident are as in Fig. 3.
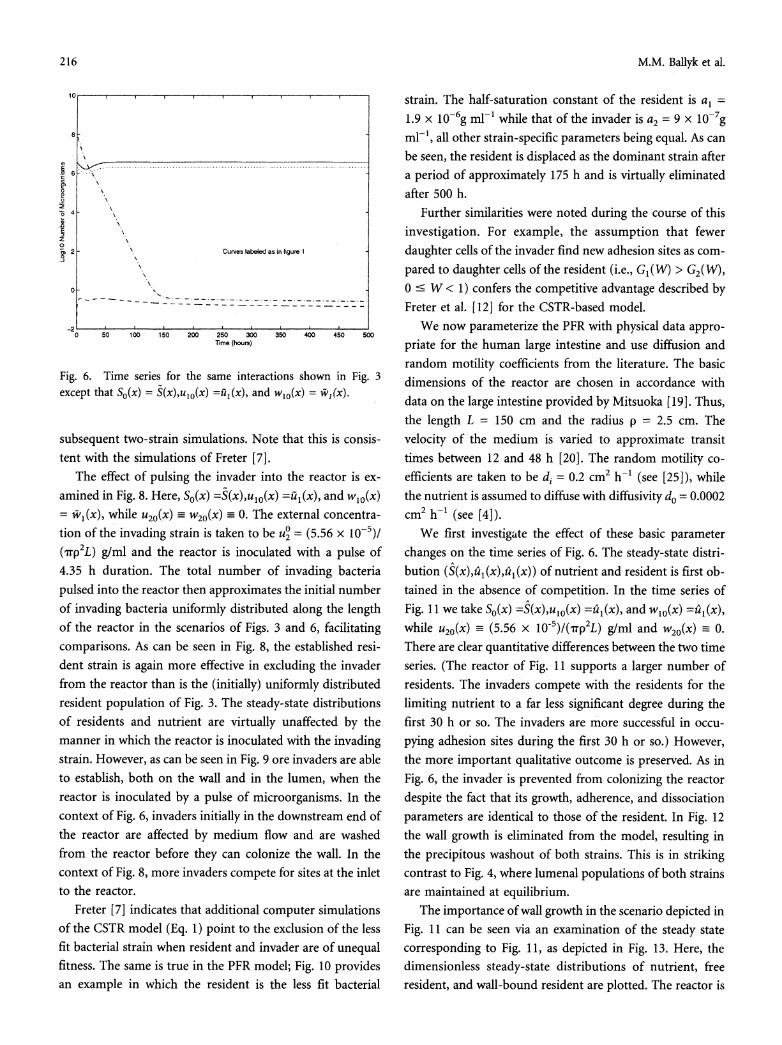
CSTR model (1), this is expected. The wall-bound residents are concentrated in the first 0.2 cm of the reactor, with a maximum density at the inlet. In the time series of Fig. 6 we take SO(x) = S(x),u10(x) = t1(x), and w10(x) = 1il(x), while
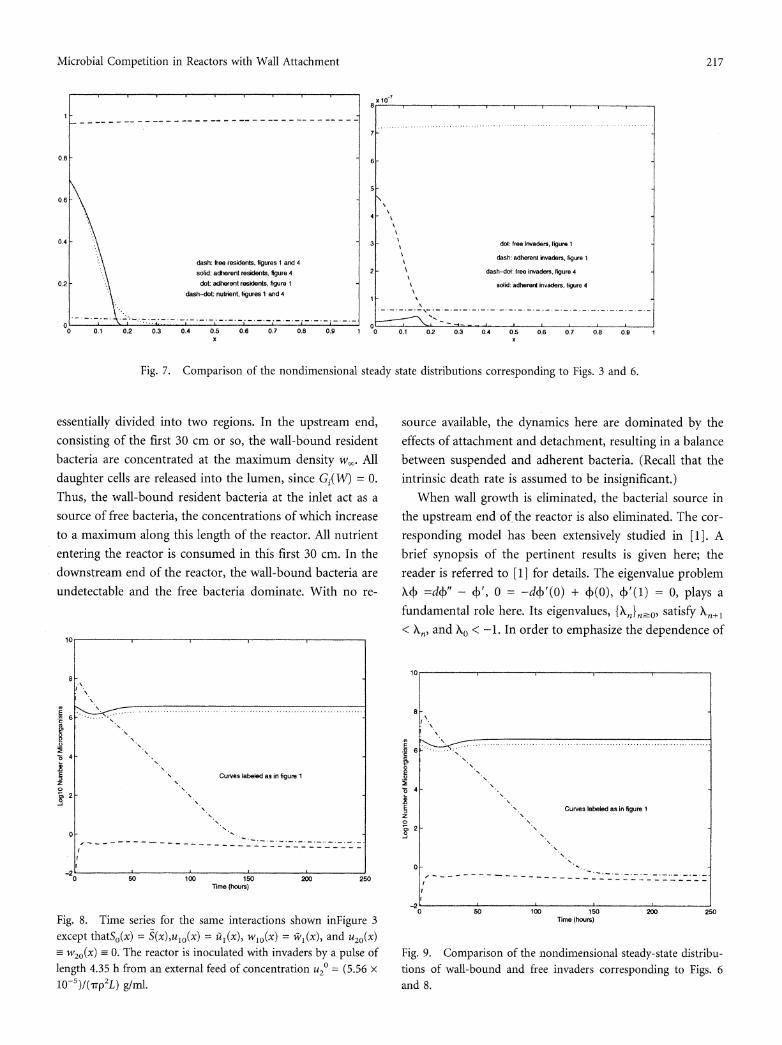
u20(x) and w20(x) are as in Fig. 3. As can be seen, the in- vaders are more effectively eliminated in this case. A com- parison of the (dimensionless) steady-state distributions cor- responding to Figs. 3 and 6 reveals much about the mecha- nisms involved. In Fig. 7(a) the nutrient, free resident, and wall-bound resident distributions obtained in both scenarios are plotted, while the corresponding invader distributions are given in Figure 7(b). As can be seen, the distribution of suspended material in Fig. 7(a) is virtually unaffected by the change in the initial distribution of the residents. In the context of Fig. 3 there are initially fewer wall-bound resi- dents in the first 0.2 cm of the reactor. The invader is suc- cessful in competing for and occupying enough of these sites to colonize the reactor, albeit in very small numbers. (See Fig. 7(b).) This is not the case when the initial distribution of resident bacteria is optimal, as in Fig. 6. With fewer wall sites initially available at the inlet, an even smaller number of invaders can colonize the reactor.
It is clear from Figs. 3 and 6 that the initial distribution of the residents plays an important role in the exclusion of the invading population. Moreover, when modeling the inva- sion of an established microbiota by nonindigenous bacteria, it would seem more appropriate to take as initial conditions the steady-state distribution obtained when the resident is grown in the absence of competition. This will be done in all
216 M.M. Ballyk et al.
* 6 ..:<~~~~~~~~~~~~~~~~~............ EC
z .
2 Curves labeled as in figure 1
0
0 50 100 150 200 250 300 350 400 450 500 Time (hours)
Fig. 6. Time series for the same interactions shown in Fig. 3 except that SO(x) = S(x),u,0(x) =ii(x), and w,o(x) = w1(x).
subsequent two-strain simulations. Note that this is consis- tent with the simulations of Freter [7].
The effect of pulsing the invader into the reactor is ex- amined in Fig. 8. Here, SO(x) =S(x),u1o(x) =a1(x), and wlo(x) = vl(x), while u20(x) _ w20(x) 0 O. The external concentra- tion of the invading strain is taken to be uo = (5.56 x 10⁻⁵)/
(-rrp2L) g/ml and the reactor is inoculated with a pulse of 4.35 h duration. The total number of invading bacteria pulsed into the reactor then approximates the initial number of invading bacteria uniformly distributed along the length of the reactor in the scenarios of Figs. 3 and 6, facilitating comparisons. As can be seen in Fig. 8, the established resi- dent strain is again more effective in excluding the invader from the reactor than is the (initially) uniformly distributed resident population of Fig. 3. The steady-state distributions of residents and nutrient are virtually unaffected by the manner in which the reactor is inoculated with the invading strain. However, as can be seen in Fig. 9 ore invaders are able to establish, both on the wall and in the lumen, when the reactor is inoculated by a pulse of microorganisms. In the context of Fig. 6, invaders initially in the downstream end of the reactor are affected by medium flow and are washed from the reactor before they can colonize the wall. In the context of Fig. 8, more invaders compete for sites at the inlet to the reactor.
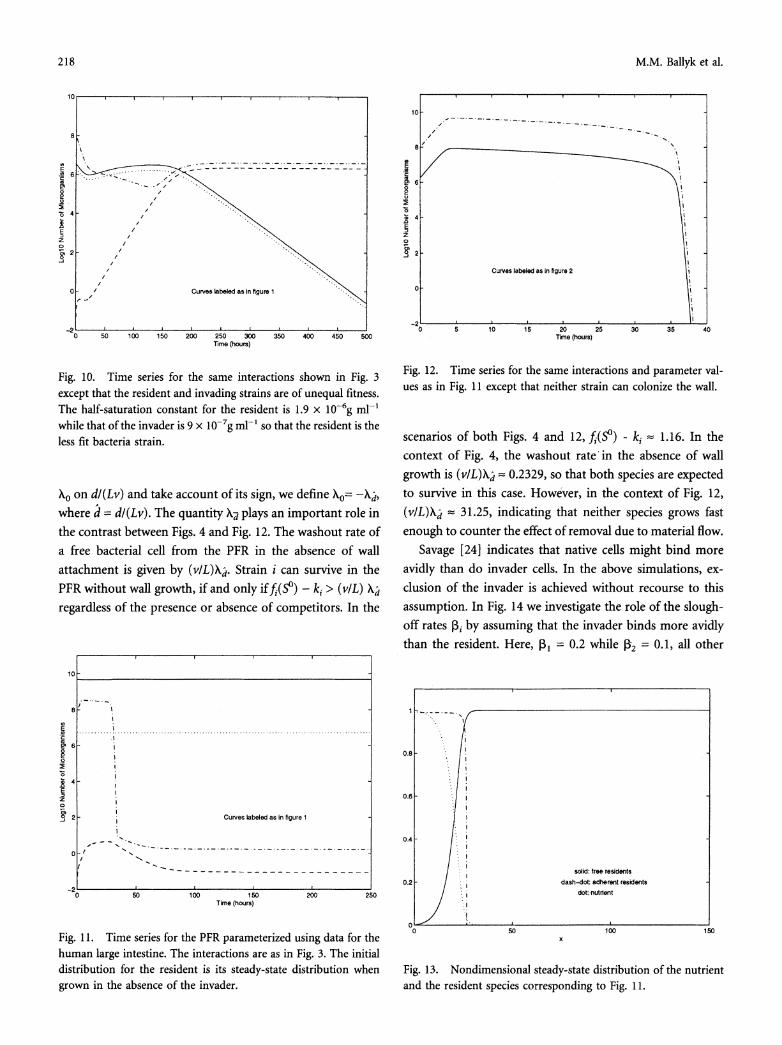
Freter [7] indicates that additional computer simulations of the CSTR model (Eq. 1) point to the exclusion of the less fit bacterial strain when resident and invader are of unequal fitness. The same is true in the PFR model; Fig. 10 provides an example in which the resident is the less fit bacterial
strain. The half-saturation constant of the resident is al = 1.9 x 10⁻⁶g ml-' while that of the invader is a2 = 9 x 10⁻⁷g
ml-,, all other strain-specific parameters being equal. As can be seen, the resident is displaced as the dominant strain after a period of approximately 175 h and is virtually eliminated after 500 h.
Further similarities were noted during the course of this investigation. For example, the assumption that fewer daughter cells of the invader find new adhesion sites as com- pared to daughter cells of the resident (i.e., GJ(V) > G2(V), 0 ' W < 1) confers the competitive advantage described by Freter et al. [12] for the CSTR-based model.
We now parameterize the PFR with physical data appro- priate for the human large intestine and use diffusion and random motility coefficients from the literature. The basic dimensions of the reactor are chosen in accordance with data on the large intestine provided by Mitsuoka [19]. Thus, the length L = 150 cm and the radius p = 2.5 cm. The velocity of the medium is varied to approximate transit times between 12 and 48 h [20]. The random motility co- efficients are taken to be di = 0.2 cm2 h-' (see [25]), while the nutrient is assumed to diffuse with diffusivity do = 0.0002 cm2 h-' (see [4]).
We first investigate the effect of these basic parameter changes on the time series of Fig. 6. The steady-state distri-
A
bution (S(x),,u(x),au(x)) of nutrient and resident is first ob- tained in the absence of competition. In the time series of Fig. 11 we take SO(x) =S(x),u0(x) =ul (x), and wlo(x) =u1 (x), while u20(x) - (5.56 x 10⁻⁵)I(QTp2L) g/ml and w20(x) - 0. There are clear quantitative differences between the two time series. (The reactor of Fig. 11 supports a larger number of residents. The invaders compete with the residents for the limiting nutrient to a far less significant degree during the first 30 h or so. The invaders are more successful in occu- pying adhesion sites during the first 30 h or so.) However, the more important qualitative outcome is preserved. As in Fig. 6, the invader is prevented from colonizing the reactor despite the fact that its growth, adherence, and dissociation parameters are identical to those of the resident. In Fig. 12 the wall growth is eliminated from the model, resulting in the precipitous washout of both strains. This is in striking contrast to Fig. 4, where lumenal populations of both strains are maintained at equilibrium.
The importance of wall growth in the scenario depicted in Fig. 11 can be seen via an examination of the steady state corresponding to Fig. 11, as depicted in Fig. 13. Here, the dimensionless steady-state distributions of nutrient, free resident, and wall-bound resident are plotted. The reactor is
Microbial Competition in Reactors with Wall Attachment 217
I~~~~~~~~~~~~~~~~~~~~~~~~~~~~~~~~~~~~~~~~~~~~~~~~~~~~~~~~~~~~~ . . . . . . . . . .1
7
0.6 8
5
0.6
4
0.4 3 dot: free Invaders, figure 1
. \ \ ~~~~~~~~~~~~~~~~~~~~~~~~~~~~~~~~~~dash: adherent invaders, figure 1 dash: free residents, figures 1 and 4 d
solid: adherent residents, figure 4 2 - \ dash-dot: tree invaders, figure 4
0.2 - . dot: adherent residents, figure 1 solid: adherenr invaders, figure 4
dash-dot: nutient, figures 1 and 4
O f & t ' ' * 4 ., | | ; ; ; X _ j _ w * O L. -. A_ 2 _ X _ j i t~~~~~~~~~~~~~~~~~~~~~~~~ . .. .. .. . . . .. o 0~~~~~~~~~~~~~~~~~~~~~~~~ 0 0.1 0.2 0.3 0.4 0.5 0.6 0.7 0.8 0.9 1 0 0.1 0.2 0.3 0.4 0.5 0.6 0.7 0.8 0.8 1
F 7
Fig. 7. Comparison of the nondimensional steady state distributions corresponding to Figs. 3 and 6.
essentially divided into two regions. In the upstream end, consisting of the first 30 cm or so, the wall-bound resident bacteria are concentrated at the maximum density wOO. All daughter cells are released into the lumen, since Gj(W) = 0. Thus, the wall-bound resident bacteria at the inlet act as a source of free bacteria, the concentrations of which increase to a maximum along this length of the reactor. All nutrient entering the reactor is consumed in this first 30 cm. In the downstream end of the reactor, the wall-bound bacteria are undetectable and the free bacteria dominate. With no re-
10
E 6 . < < i ^ + ~~~~~~~~~~~~.. .. , , , .. .. . . .. . . ..... .
4 -
E Curves labeled as in figure 1
0 -
o 50 100 150 200 250 lime (hours)
Fig. 8. Time series for the same interactions shown inFigure 3 except thatSO(x) = S(x),uj0(x) = al(x), wlo(x) = *l(x), and u20(x)
w20(x) 0. The reactor is inoculated with invaders by a pulse of length 4.35 h from an external feed of concentration u20 = (5.56 x 10⁵)/(rp2 L) g/ml.
source available, the dynamics here are dominated by the effects of attachment and detachment, resulting in a balance between suspended and adherent bacteria. (Recall that the intrinsic death rate is assumed to be insignificant.)
When wall growth is eliminated, the bacterial source in the upstream end of the reactor is also eliminated. The cor- responding model has been extensively studied in [1]. A brief synopsis of the pertinent results is given here; the reader is referred to [1] for details. The eigenvalue problem Xx) =d4V' - )', 0 = -d4+'(0) + 4)(O), 4)'(1) = 0, plays a fundamental role here. Its eigenvalues, {XjO,A0, satisfy Xn+, < Xn, and Xo < -1. In order to emphasize the dependence of
1C
10 . . . , . .. .,... . j6
E C Curves labeled as in figure 1
0
-2 . 0 SO 100 150 200 250
Time (hours)
Fig. 9. Comparison of the nondimensional steady-state distribu- tions of wall-bound and free invaders corresponding to Figs. 6 and 8.
218 M.M. Ballyk et al.
-6
2-
S / L
0 / Curves labeled as in figure I
-21 L 0 50 100 150 200 250 300 350 400 450 500
lime (hours)
Fig. 10. Time series for the same interactions shown in Fig. 3 except that the resident and invading strains are of unequal fitness. The half-saturation constant for the resident is 1.9 x 10⁻⁶g ml-'
while that of the invader is 9 x 10⁻⁷g ml-' so that the resident is the less fit bacteria strain.
Ao on dl(Lv) and take account of its sign, we define XO= -AX, where d = dl(Lv). The quantity XA plays an important role in the contrast between Figs. 4 and Fig. 12. The washout rate of a free bacterial cell from the PFR in the absence of wall attachment is given by (v/L)Xk. Strain i can survive in the PFR without wall growth, if and only if fi(S0) - ki > (vIL) XA regardless of the presence or absence of competitors. In the
10
.5. 8 !
E 6 ...........- ............ .................. ...................... ...........................
26 I
.0
z
g 2 - i Curves labeled as in figure 1
i
-2 0 50 100 150 200 250
Time (hours)
Fig. 11. Time series for the PFR parameterized using data for the human large intestine. The interactions are as in Fig. 3. The initial distribution for the resident is its steady-state distribution when grown in the absence of the invader.
10
8'
E
Curves labeled as In figure 2
0-
-2 0 5 10 15 20 25 30 35 40
Time (hours)
Fig. 12. Time series for the same interactions and parameter val- ues as in Fig. 11 except that neither strain can colonize the wall.
scenarios of both Figs. 4 and 12, fi(S) - ki = 1.16. In the context of Fig. 4, the washout rate in the absence of wall growth is (vIL)XA = 0.2329, so that both species are expected to survive in this case. However, in the context of Fig. 12, (vIL)Xk = 31.25, indicating that neither species grows fast enough to counter the effect of removal due to material flow.
Savage [24] indicates that native cells might bind more avidly than do invader cells. In the above simulations, ex- clusion of the invader is achieved without recourse to this assumption. In Fig. 14 we investigate the role of the slough- off rates P3i by assuming that the invader binds more avidly than the resident. Here, PI3 = 0.2 while R2 = 0.1, all other
0.8 -
0.6 -
0.4 -
solid: free residents
0.2 - dash-dot: adherent residents
dot: nutrient
0 50 100 150
Fig. 13. Nondimensional steady-state distribution of the nutrient and the restdent species corresponding to Fig. 11.
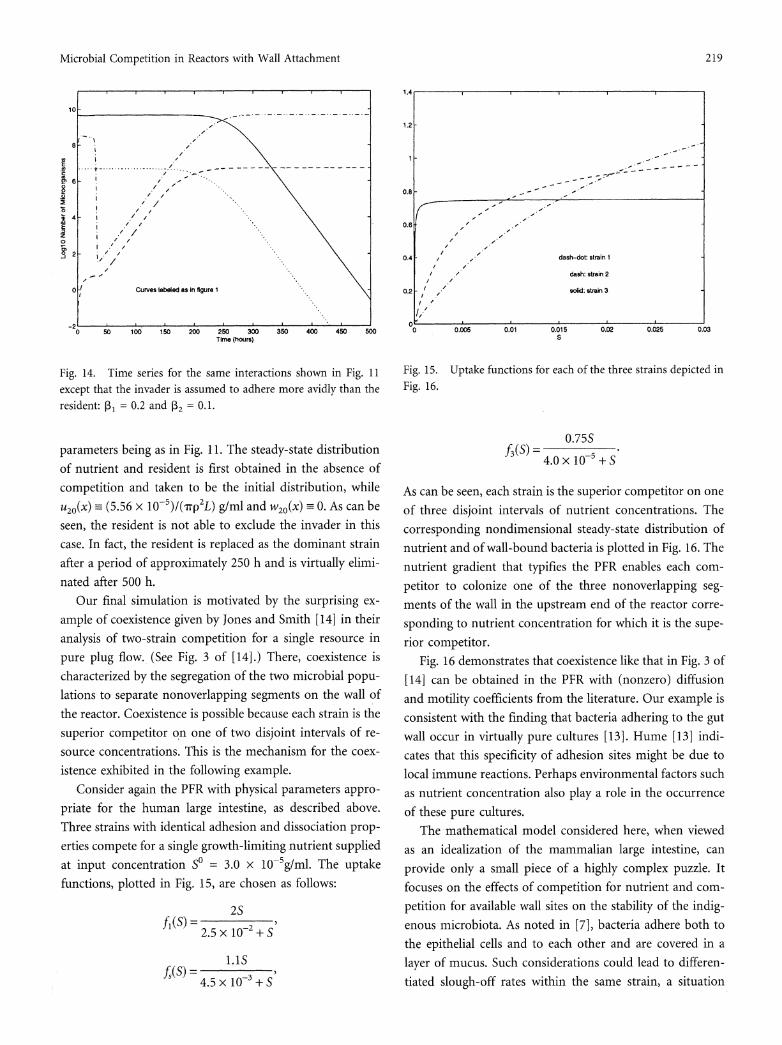
Microbial Competition in Reactors with Wall Attachment 219
10 - - - - - - - - -
B
S
Fig 14 CTmesrves forbthed asamfgue ineatossoni i.1
-2~~~~~~~'
except that the invader is assumed to adhere more avidly than the resident: P, = 0.2 and P32 = 0-1
parameters being as in Fig. 11. The steady-state distribution
of nutrient and resident is first obtained in the absence of
competition and taken to be the initial distribution, while
u20(X) =_ (5.56 x 10⁻⁵)/(7rp2 L) g/ml and w2o(x) =- 0. As can be
seen, the resident is not able to exclude the invader in this
case. In fact, the resident is replaced as the dominant strain
after a period of approximately 250 h and is virtually elimi-
nated after 500 h.
Our final simulation is motivated by the surprising ex-
ample of coexistence given by Jones and Smith [ 14] in their
analysis of two-strain competition for a single resource in
pure plug flow. (See Fig. 3 of [14].) There, coexistence is
characterized by the segregation of the two microbial popu-
lations to separate nonoverlapping segments on the wall of
the reactor. Coexistence is possible because each strain is the
superior competitor on one of two disjoint intervals of re-
source concentrations. This is the mechanism for the coex-
istence exhibited in the following example.
Consider again the PFR with physical parameters appro-
priate for the human large intestine, as described above.
Three strains with identical adhesion and dissociation prop-
erties compete for a single growth-limiting nutrient supplied
at input concentration So = 3.0 x 10⁻⁵ g/ml. The uptake functions, plotted in Fig. 15, are chosen as follows:
2S
o ~ ~~~~~~ 1S
4 /=
2~~~~~~.5x1-
0 Crvs lbeed s n fgu e I1
1.4
1.2-
0.8 -
0.6 - -
0.4 r - dash-dot: strain 1
/ . ' dash: strain 2
0.2 solid: strain 3 I .f
0 0.005 0.01 0.015 0.02 0.025 0.03
Fig. 15. Uptake functions for each of the three strains depicted in Fig. 16.
0.75S
4.0x 10⁻⁵+S
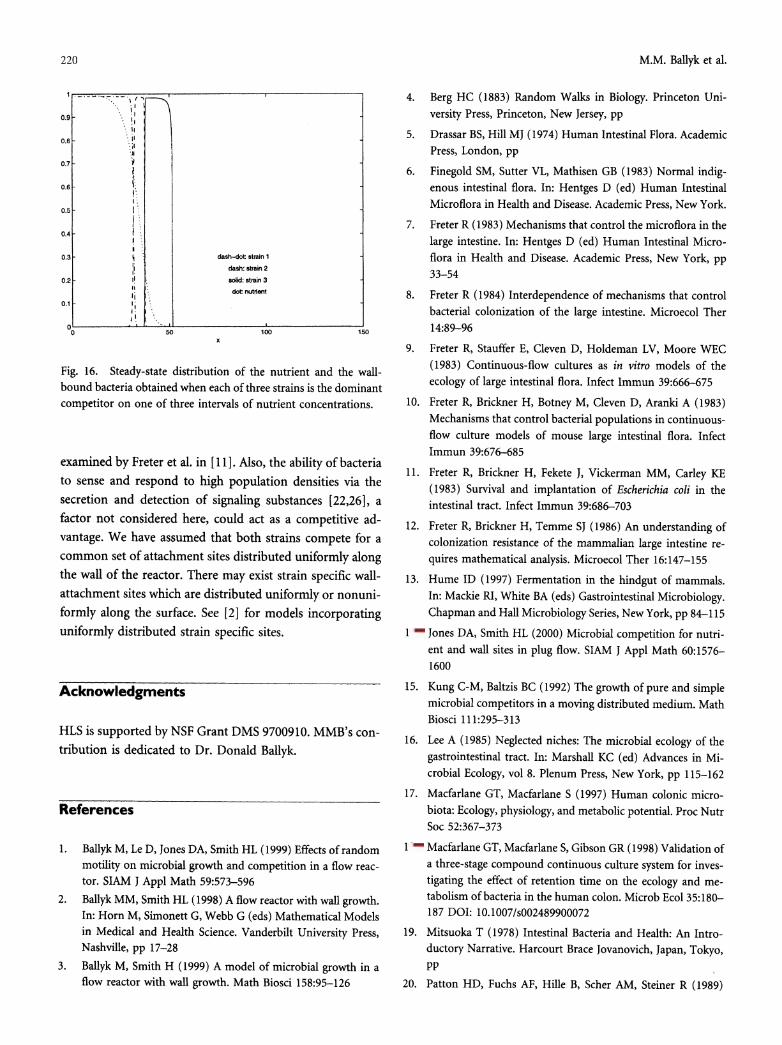
As can be seen, each strain is the superior competitor on one of three disjoint intervals of nutrient concentrations. The
corresponding nondimensional steady-state distribution of
nutrient and of wall-bound bacteria is plotted in Fig. 16. The
nutrient gradient that typifies the PFR enables each com-
petitor to colonize one of the three nonoverlapping seg- ments of the wall in the upstream end of the reactor corre-
sponding to nutrient concentration for which it is the supe- rior competitor.
Fig. 16 demonstrates that coexistence like that in Fig. 3 of
[14] can be obtained in the PFR with (nonzero) diffusion and motility coefficients from the literature. Our example is
consistent with the finding that bacteria adhering to the gut wall occur in virtually pure cultures [13]. Hume [13] indi-
cates that this specificity of adhesion sites might be due to
local immune reactions. Perhaps environmental factors such
as nutrient concentration also play a role in the occurrence of these pure cultures.
The mathematical model considered here, when viewed as an idealization of the mammalian large intestine, can
provide only a small piece of a highly complex puzzle. It
focuses on the effects of competition for nutrient and com-
petition for available wall sites on the stability of the indig- enous microbiota. As noted in [7], bacteria adhere both to the epithelial cells and to each other and are covered in a layer of mucus. Such considerations could lead to differen-
tiated slough-off rates within the same strain, a situation
220 M.M. Ballyk et al.
0.9 i
0.8 i
0.7 -
0.6
0.5-
0.4 -
0.3 - dash-dot: strain 1
dash: strain 2
0.2 solid: strain 3
0S1 J . dot: nutdent
0.1 1
0 s0 100 150
Fig. 16. Steady-state distribution of the nutrient and the wall- bound bacteria obtained when each of three strains is the dominant competitor on one of three intervals of nutrient concentrations.
examined by Freter et al. in [ 11 ]. Also, the ability of bacteria to sense and respond to high population densities via the secretion and detection of signaling substances [22,26], a factor not considered here, could act as a competitive ad- vantage. We have assumed that both strains compete for a common set of attachment sites distributed uniformly along the wall of the reactor. There may exist strain specific wall- attachment sites which are distributed uniformly or nonuni- formly along the surface. See [2] for models incorporating uniformly distributed strain specific sites.
Acknowledgments
HLS is supported by NSF Grant DMS 9700910. MMB's con- tribution is dedicated to Dr. Donald Ballyk.
References
1. Ballyk M, Le D, Jones DA, Smith HL (1999) Effects of random motility on microbial growth and competition in a flow reac- tor. SIAM J Appl Math 59:573-596
2. Ballyk MM, Smith HL (1998) A flow reactor with wall growth. In: Horn M, Simonett G, Webb G (eds) Mathematical Models in Medical and Health Science. Vanderbilt University Press, Nashville, pp 17-28
3. Ballyk M, Smith H (1999) A model of microbial growth in a flow reactor with wall growth. Math Biosci 158:95-126
4. Berg HC (1883) Random Walks in Biology. Princeton Uni- versity Press, Princeton, New Jersey, pp
5. Drassar BS, Hill MJ (1974) Human Intestinal Flora. Academic Press, London, pp
6. Finegold SM, Sutter VL, Mathisen GB (1983) Normal indig- enous intestinal flora. In: Hentges D (ed) Human Intestinal Microflora in Health and Disease. Academic Press, New York.
7. Freter R (1983) Mechanisms that control the microflora in the large intestine. In: Hentges D (ed) Human Intestinal Micro- flora in Health and Disease. Academic Press, New York, pp 33-54
8. Freter R (1984) Interdependence of mechanisms that control bacterial colonization of the large intestine. Microecol Ther 14:89-96
9. Freter R, Stauffer E, Cleven D, Holdeman LV, Moore WEC (1983) Continuous-flow cultures as in vitro models of the
ecology of large intestinal flora. Infect Immun 39:666-675
10. Freter R, Brickner H, Botney M, Cleven D, Aranki A (1983) Mechanisms that control bacterial populations in continuous- flow culture models of mouse large intestinal flora. Infect Immun 39:676-685
11. Freter R, Brickner H, Fekete J, Vickerman MM, Carley KE (1983) Survival and implantation of Escherichia coli in the intestinal tract. Infect Immun 39:686-703
12. Freter R, Brickner H, Temme SJ (1986) An understanding of colonization resistance of the mammalian large intestine re- quires mathematical analysis. Microecol Ther 16:147-155
13. Hume ID (1997) Fermentation in the hindgut of mammals. In: Mackie RI, White BA (eds) Gastrointestinal Microbiology. Chapman and Hall Microbiology Series, New York, pp 84-115
14. Jones DA, Smith HL (2000) Microbial competition for nutri- ent and wall sites in plug flow. SIAM J Appl Math 60:1576- 1600
15. Kung C-M, Baltzis BC (1992) The growth of pure and simple microbial competitors in a moving distributed medium. Math Biosci 11 1:295-313
16. Lee A (1985) Neglected niches: The microbial ecology of the gastrointestinal tract. In: Marshall KC (ed) Advances in Mi- crobial Ecology, vol 8. Plenum Press, New York, pp 115-162
17. Macfarlane GT, Macfarlane S (1997) Human colonic micro- biota: Ecology, physiology, and metabolic potential. Proc Nutr Soc 52:367-373
18. Macfarlane GT, Macfarlane S, Gibson GR (1998) Validation of a three-stage compound continuous culture system for inves- tigating the effect of retention time on the ecology and me- tabolism of bacteria in the human colon. Microb Ecol 35:180- 187 DOI: 10.1007/s002489900072
19. Mitsuoka T (1978) Intestinal Bacteria and Health: An Intro- ductory Narrative. Harcourt Brace Jovanovich, Japan, Tokyo, Pn

Microbial Competition in Reactors with Wall Attachment 221
Textbook of Physiology, vol 2, 21st edition. WB Saunders Co, Philadelphia, pp
21. Penry D, Jumars P (1987) Modeling animal guts as chemical reactors. Am Nat 129:69-96
22. Kolter R, Losick R (1998) One for all and all for one. Science 280:226-227
23. Rolfe RD (1997) Colonization Resistance. In: Mackie RI, White BA, Isaacson RE (eds) Gastrointestinal Microbiology. Chapman and Hall Microbiology Series, New York, pp 501- 536
24. Savage DC (1985) Effects on host animals of bacteria adhering to epithelial surfaces. In: Savage DC, Fletcher MM (eds) Bac- terial Adhesion. Plenum Press, New York, pp 437-463
25. Segel LA (1984) Modeling Dynamic Phenomena in Molecular and Cellular Biology. Cambridge University Press, New York,
pp 26. Strauss E (1999) A symphony of bacterial voices. Science
2884:1302-1304 27. Van der Waaij D, Berghuis-de vries JM, Lekkerkerk-van der
Wees JEC (1971) Colonization resistance of the digestive tract in conventional and antibiotic-treated mice. J Hyg 69:405-413


![Inferring interactions in complex microbial communities ...€¦ · The composition of microbial communities is a key driver of ecological processes [1–3]. ... tifarious (competition,](https://img.pdfslide.us/doc/110x75/5b82e95b7f8b9a64618c01e3/inferring-interactions-in-complex-microbial-communities-the-composition.jpg)