Embed Size (px)
Citation preview

MicroArray Evolution:expression to mapping and back again
Justin BorevitzSalk Institutenaturalvariation.org
MicroArray Evolution:expression to mapping and back again
Justin BorevitzSalk Institutenaturalvariation.org
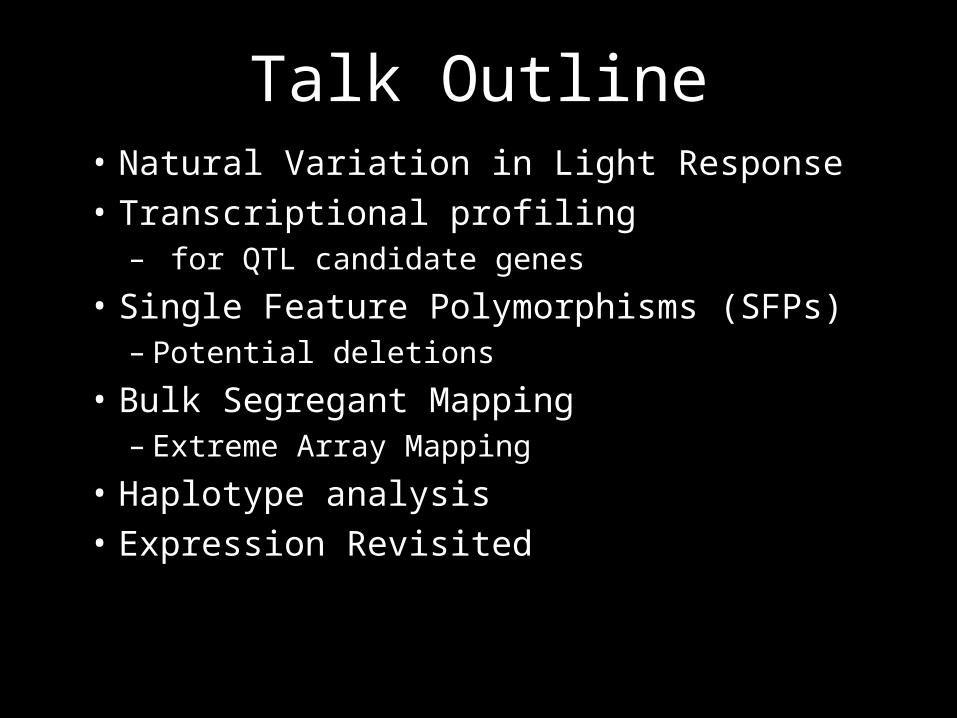
Talk Outline• Natural Variation in Light Response
• Transcriptional profiling– for QTL candidate genes
• Single Feature Polymorphisms (SFPs)– Potential deletions
• Bulk Segregant Mapping– Extreme Array Mapping
• Haplotype analysis
• Expression Revisited

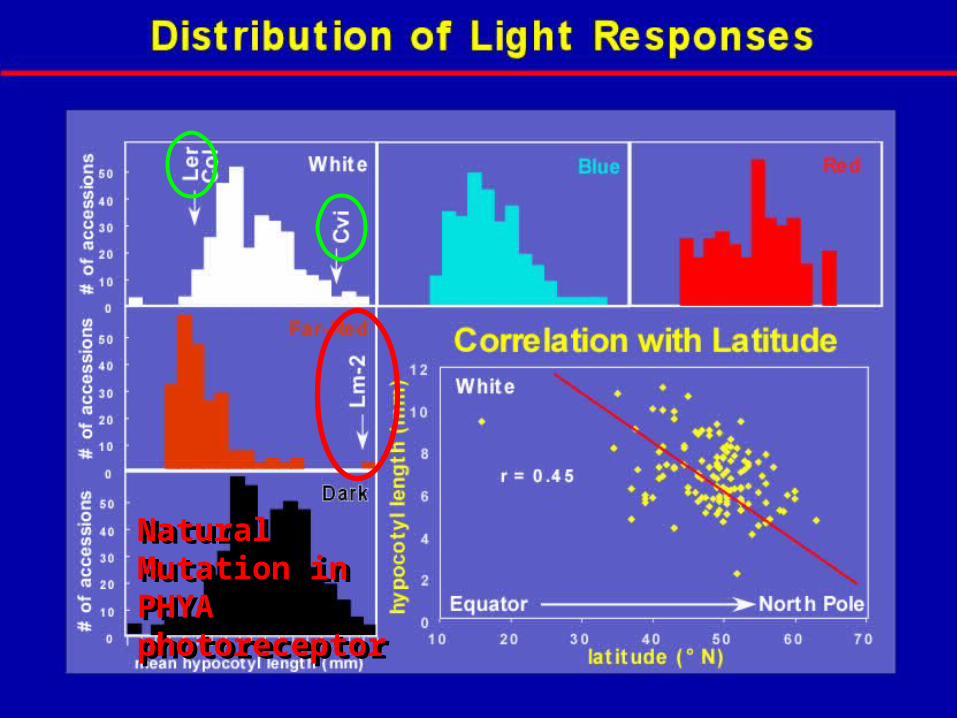
Natural Mutation in PHYA photoreceptorNatural Mutation in PHYA photoreceptor

Quantitative Trait Loci
EPI1 EPI2

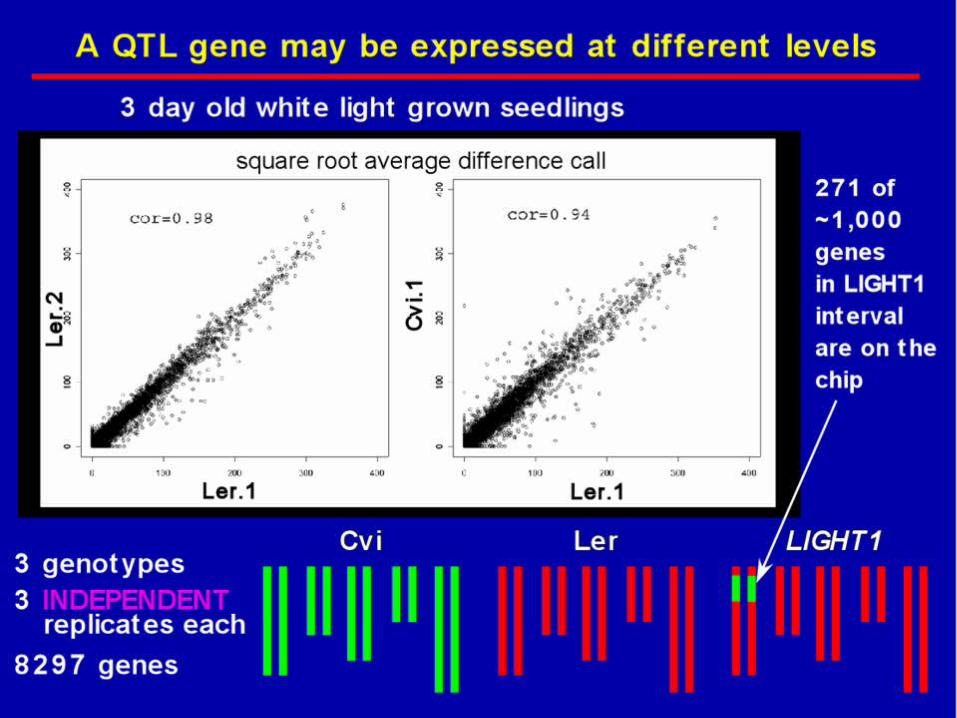

differences may be due to expression or hybridization

What is Array Genotyping?
• Affymetrix expression GeneChips contain 202,806 unique 25bp oligo nucleotides.
• 11 features per probset for 21546 genes• New array’s have even more• Genomic DNA is randomly labeled with
biotin, product ~50bp.• 3 independent biological replicates
compared to the reference strain Col
GeneChip
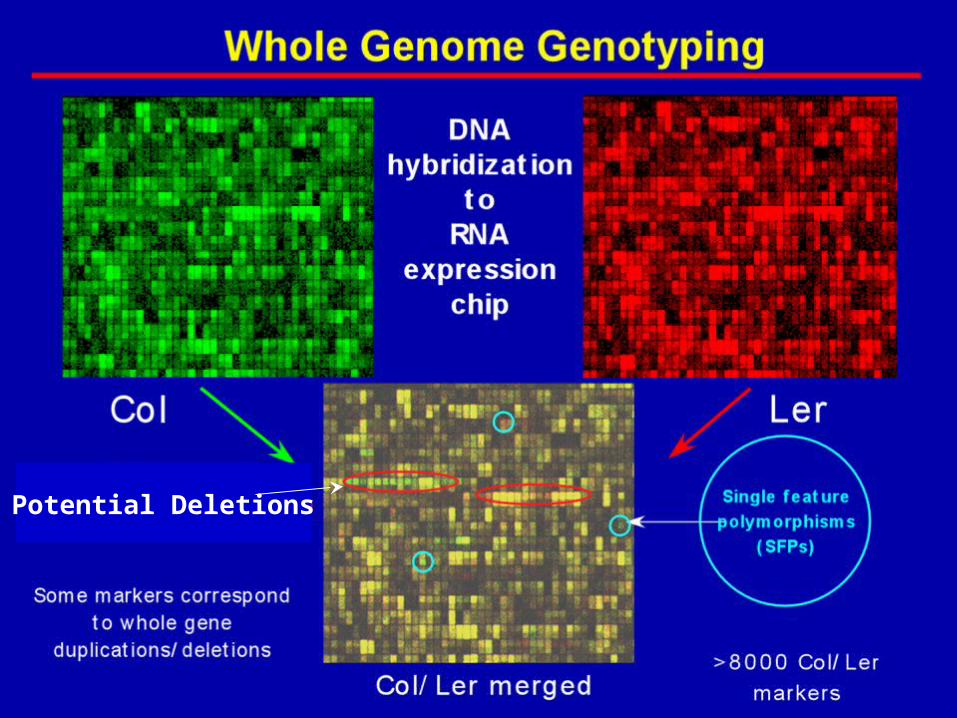
Potential Deletions
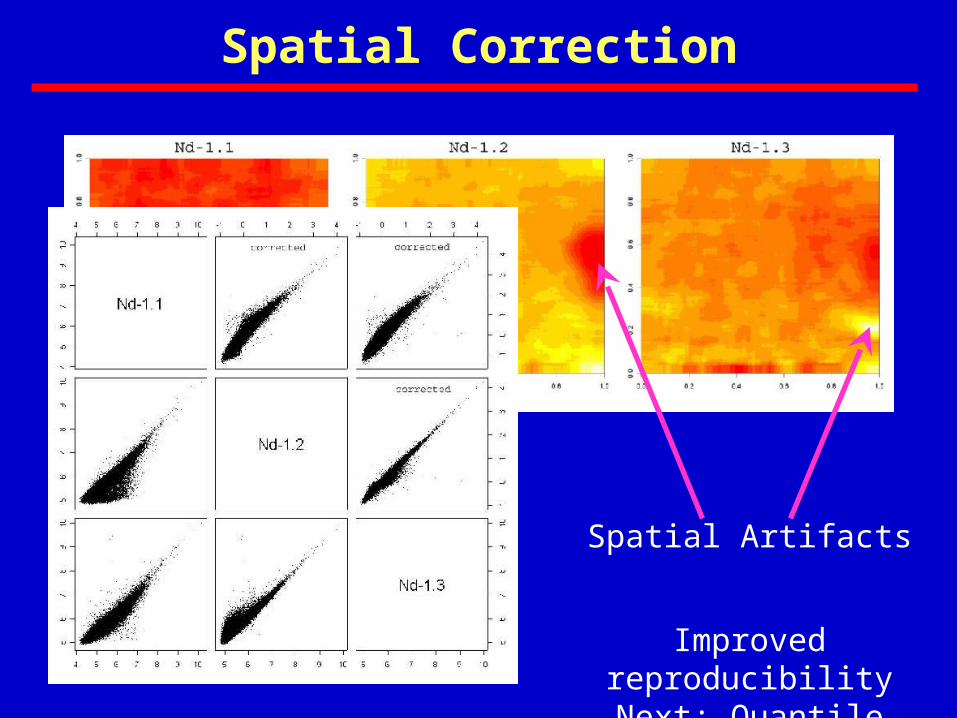
Spatial Correction
Spatial Artifacts
Improved reproducibilityNext: Quantile Normalization

False Discovery and Sensitivity
Permuted data
real data
5% FDR
PM only SAM threshold
5% FDR
GeneChip SFPs nonSFPs Cereon marker accuracy 3806 89118 100% Sequence 817 121 696 Sensitivity
Polymorphic 340 117 223 34% Non-polymorphic 477 4 473
False Discovery rate: 3% Test for independence of all factors: Chisq = 177.34, df = 1, p- value = 1.845e- 40
Observed t statistics vsNull (permuted) t statistics


Chip genotyping of a Recombinant Inbred Line
29kb interval
Discovery 6 replicates X $500 12,000 SFPs = $0.25Typing 1 replicate X $500 12,000 SFPs = $0.041

Potential Deletions
>500 potential deletions45 confirmed by Ler sequence
23 (of 114) transposons
Disease Resistance(R) gene clusters
Single R gene deletions
Genes involved in Secondary metabolism
Unknown genes
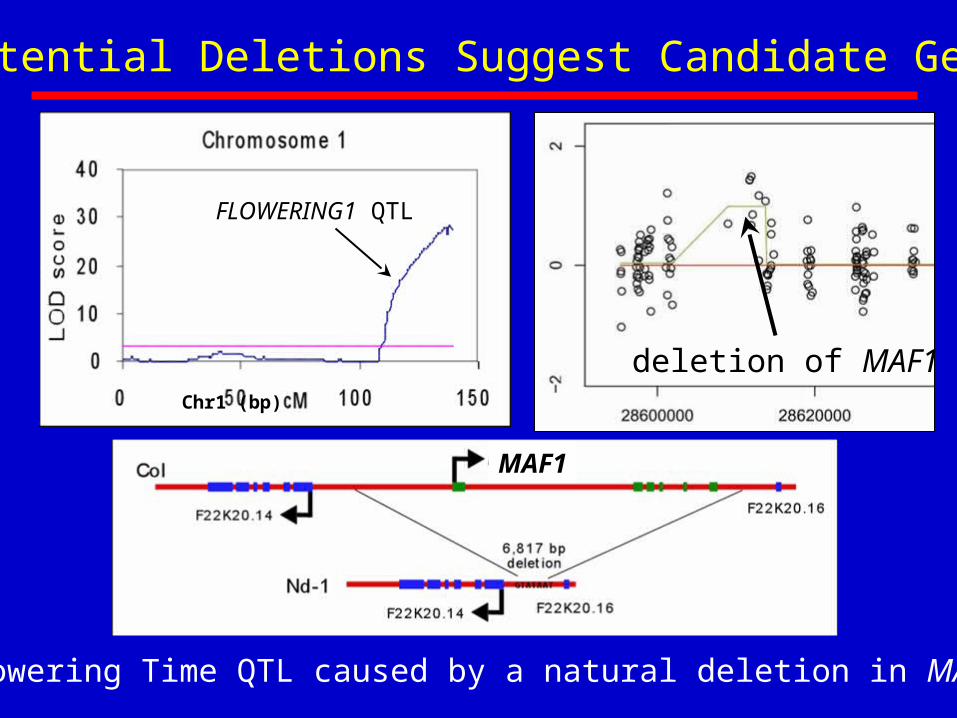
Potential Deletions Suggest Candidate Genes
deletion of MAF1
FLOWERING1 QTL
Chr1 (bp)
Flowering Time QTL caused by a natural deletion in MAF1
MAF1

Fast Neutron deletions
FKF1 80kb deletion CHR1 cry2 10kb deletion CHR1
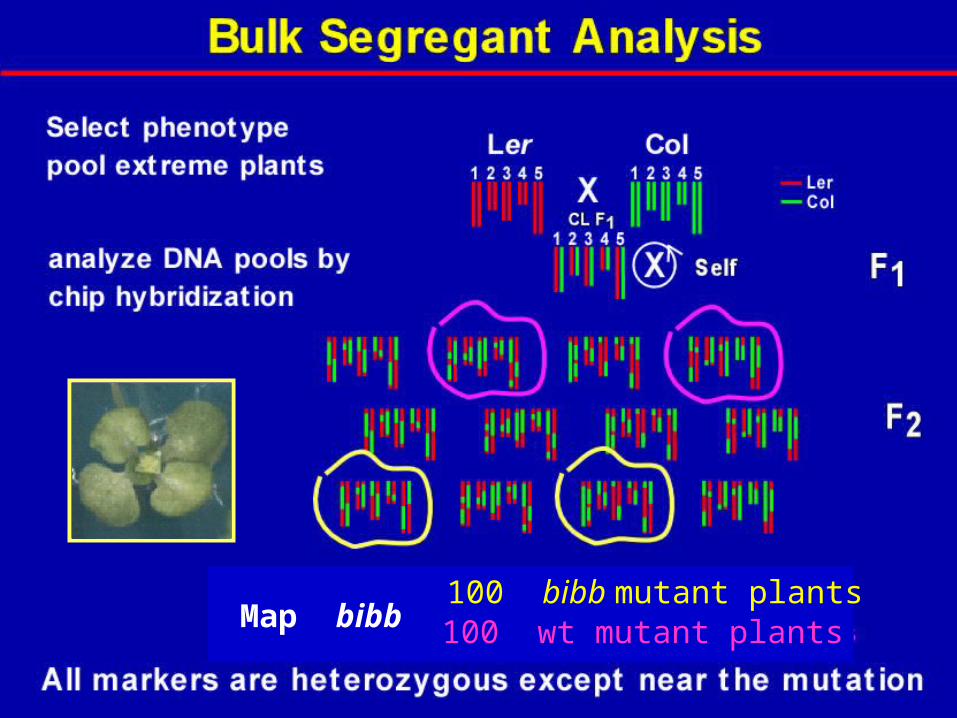
Map bibb100 bibb mutant plants100 wt mutant plants
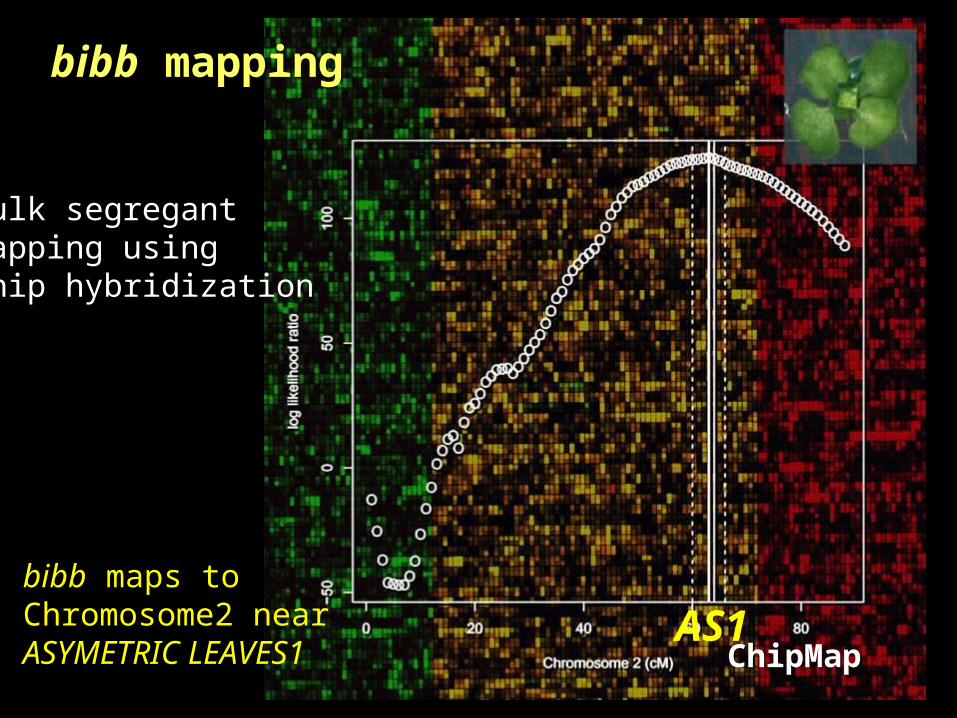
bibb mapping
ChipMapAS1
Bulk segregantMapping usingChip hybridization
bibb maps toChromosome2 near ASYMETRIC LEAVES1

BIBB = ASYMETRIC LEAVES1
Sequenced AS1 coding region from bib-1 …found g -> a change that would introduce a stop codon in the MYB domain
bibb as1-101
MYB
bib-1W49*
as-101Q107*
as1bibb
AS1 (ASYMMETRIC LEAVES1) =MYB closely related toPHANTASTICA located at 64cM
LOD
0 50 100 150
-200
020
040
0
log
likel
ihoo
d ra
tio
Chromosome 1
0 50 100 150
-200
020
040
0
log
likel
ihoo
d ra
tio
Chromosome 2
0 50 100 150
-200
020
040
0
log
likel
ihoo
d ra
tio
Chromosome 3
0 50 100 150
-200
020
040
0
log
likel
ihoo
d ra
tio
Chromosome 4
0 50 100 150
-200
020
040
0
log
likel
ihoo
d ra
tio
Chromosome 5
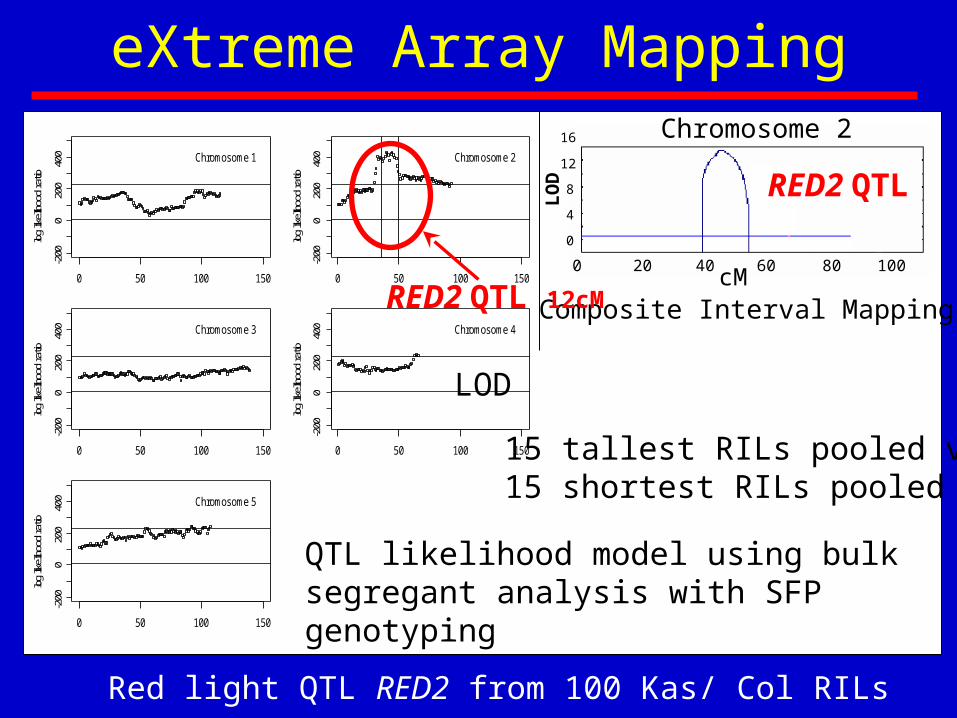
eXtreme Array Mapping
Red light QTL RED2 from 100 Kas/ Col RILs
QTL likelihood model using bulk segregant analysis with SFP genotyping
0
4
8
12
16
0 20 40 60 80 100cM
LO
D
Composite Interval Mapping
RED2 QTL
Chromosome 2
15 tallest RILs pooled vs15 shortest RILs pooled
RED2 QTL 12cM

Simulation Likelihood
0 20 40 60 80 100 120
0500
1500
cM
log li
kelih
ood r
atio
Chromosome 1 (cM)
0 20 40 60 80
0500
1500
cM
log li
kelih
ood r
atio
Chromosome 2 (cM)
0 20 40 60 80 100 120 140
0500
1500
cM
log li
kelih
ood r
atio
Chromosome 3 (cM)
0 10 20 30 40 50 60
0500
1500
cM
log li
kelih
ood r
atio
Chromosome 4 (cM)
0 20 40 60 80 100
0500
1500
cM
log li
kelih
ood r
atio
Chromosome 5 (cM) 50 eXtremeof 500 F2s chr2 QTL 37% varchr5 QTL 13% var
Can detect additive or epistatic QTL but hard to determine which
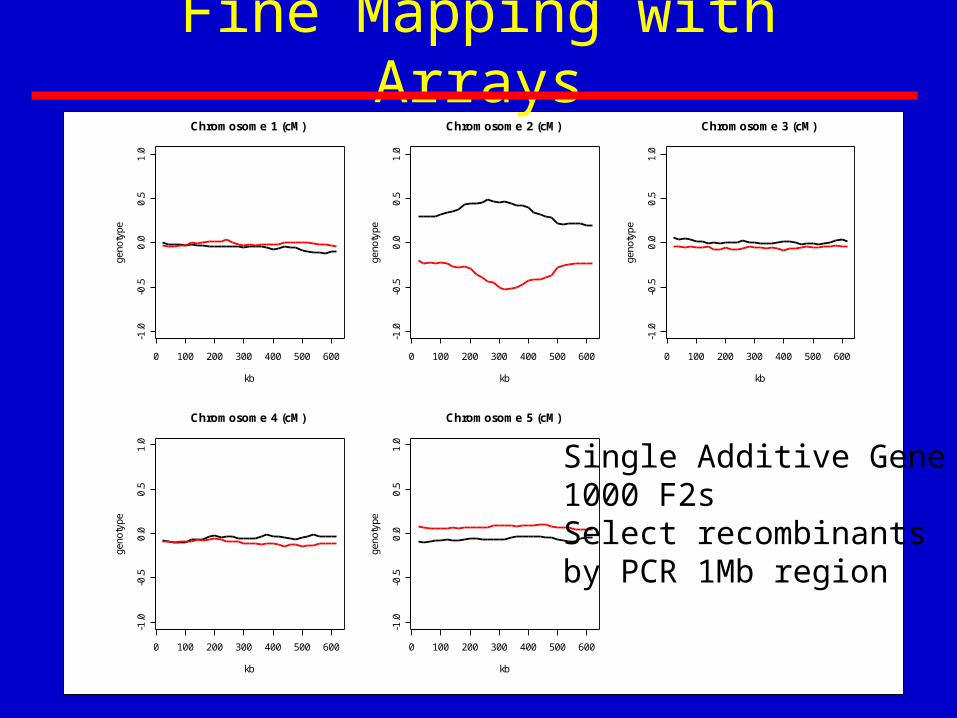
Fine Mapping with Arrays
0 100 200 300 400 500 600
-1.0
-0.5
0.0
0.5
1.0
Chromosome 1 (cM)
kb
geno
type
0 100 200 300 400 500 600
-1.0
-0.5
0.0
0.5
1.0
Chromosome 2 (cM)
kbge
noty
pe
0 100 200 300 400 500 600
-1.0
-0.5
0.0
0.5
1.0
Chromosome 3 (cM)
kb
geno
type
0 100 200 300 400 500 600
-1.0
-0.5
0.0
0.5
1.0
Chromosome 4 (cM)
kb
geno
type
0 100 200 300 400 500 600
-1.0
-0.5
0.0
0.5
1.0
Chromosome 5 (cM)
kb
geno
type
Single Additive Gene1000 F2sSelect recombinantsby PCR 1Mb region

Array Haplotyping
• What about Diversity/selection across the genome?
• A genome wide estimate of population genetics parameters, θw, π, Tajima’D, ρ
• LD decay, Haplotype block size
• Deep population structure?
• Col, Lz, Ler, Bay, Shah, Cvi, Kas, C24,
Est, Kin, Mt, Nd, Sorbo, Van, Ws2
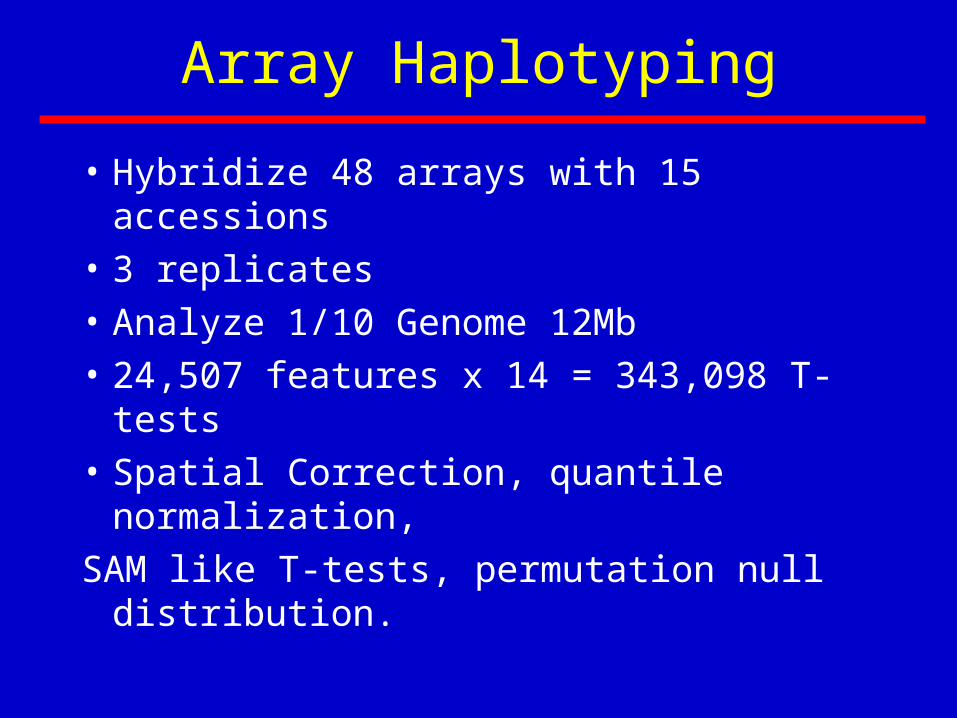
Array Haplotyping
• Hybridize 48 arrays with 15 accessions
• 3 replicates
• Analyze 1/10 Genome 12Mb
• 24,507 features x 14 = 343,098 T-tests
• Spatial Correction, quantile normalization,
SAM like T-tests, permutation null distribution.

Array Haplotyping
Inbred lines
Low effectiverecombinationdue to partialselfing
Extensive LDblocks
Col Ler Cvi Kas Bay Shah Lz Nd
Chr
omos
ome1
~50
0kb

(-4,-3.5] (-3,-2.5] (-2,-1.5] (-1,-0.5] (0,0.5] (1,1.5] (2,2.5] (3,3.5]
T statistic
fre
qu
en
cy
0
e+
00
4
e+
04
8
e+
04
Distribution of T-stats
null (permutation)actual
Not Col ColNA NA duplications
32,427Calls
208,729
12,250 SFPs

Diversity
6000000 6200000 6400000 6600000 6800000 7000000
-3-2
-10
12
3
Chromosome 1 (Mb)
Div
ers
ity
7000000 7200000 7400000 7600000 7800000 8000000
-3-2
-10
12
3
Chromosome 1 (Mb)
Div
ers
ity
8000000 8200000 8400000 8600000 8800000 9000000
-3-2
-10
12
3
Chromosome 1 (Mb)
Div
ers
ity

Tajima’s D
8000000 8200000 8400000 8600000 8800000 9000000
-2-1
01
2
Chromosome 1 (Mb)
Ta
jima
's D
like
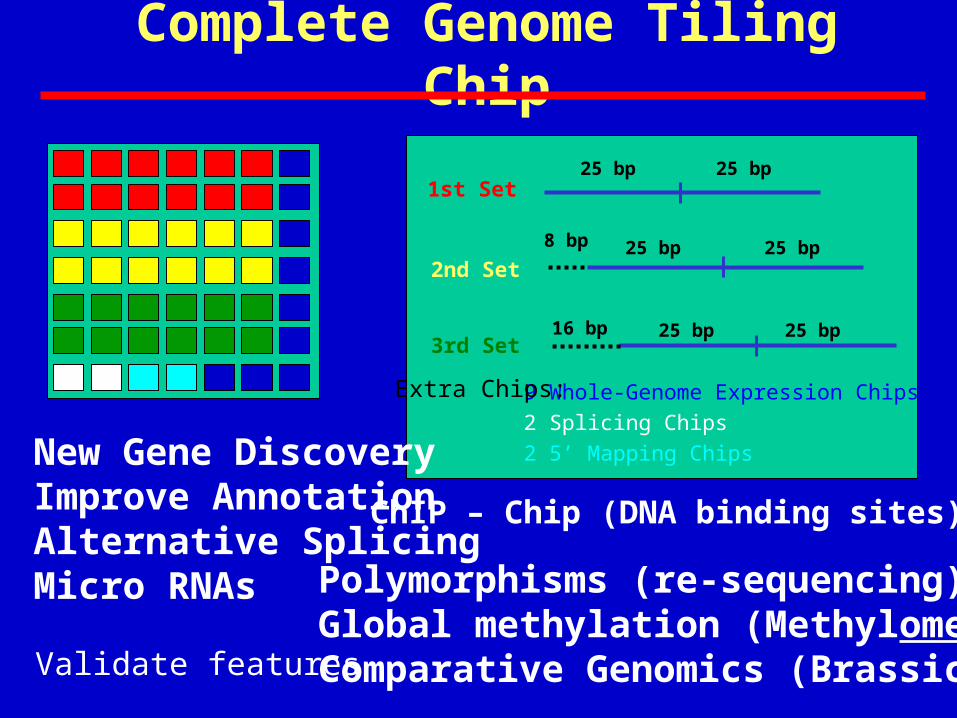
25 bp 25 bp
25 bp 25 bp16 bp
25 bp 25 bp8 bp
1st Set
2nd Set
3rd Set
Complete Genome Tiling Chip
Polymorphisms (re-sequencing)Global methylation (Methylome)Comparative Genomics (Brassica)
New Gene DiscoveryImprove AnnotationAlternative SplicingMicro RNAs
9 Whole-Genome Expression Chips2 Splicing Chips2 5’ Mapping Chips
Validate features
Extra Chips:
ChIP – Chip (DNA binding sites)
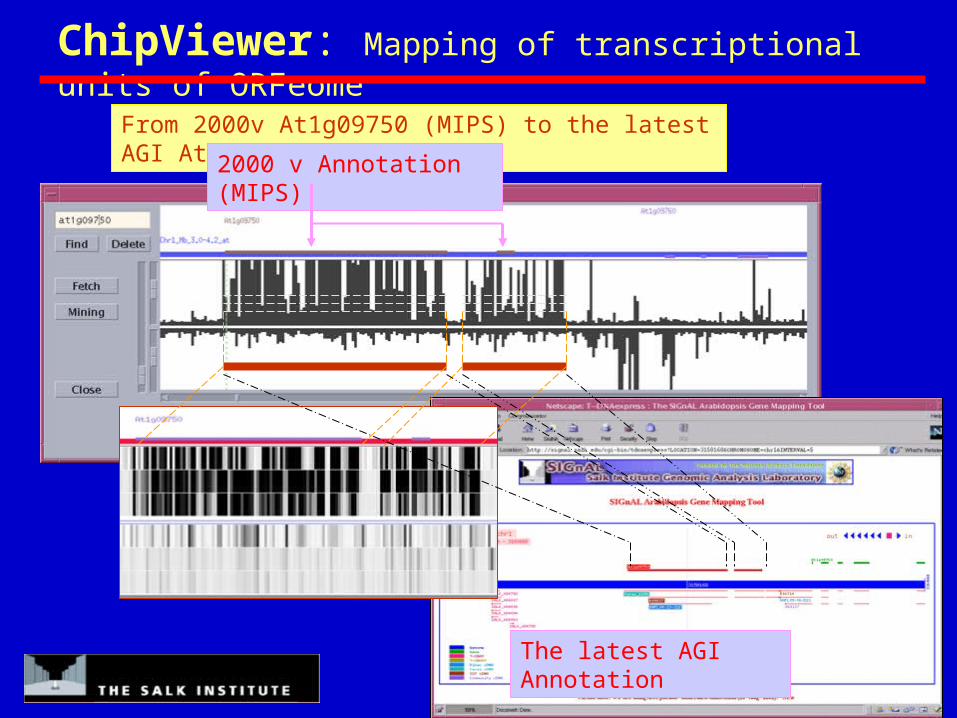
ChipViewer: Mapping of transcriptional units of ORFeome
From 2000v At1g09750 (MIPS) to the latest AGI At1g09750
2000 v Annotation (MIPS)
The latest AGI Annotation

Expression Analysis Revisited
FLC controls flowering time Difference detected it 3 day old seedlings
Feature level model Gene Expression index that accounts for feature effect and polymorphisms

PAG1 down regulated in Cvi
PLALE GREEN1 knock out has long hypocotyl in red light
Review
• Transcriptional profiling to identify candidate genes and downstream responses that consider polymorphisms
• Single Feature Polymorphisms (SFPs) can be used to identify recombination breakpoints, potential deletions, for eXtreme Array mapping, and haplotyping
NaturalVariation.org
SyngentaHur-Song ChangTong Zhu
SyngentaHur-Song ChangTong Zhu
Salk
Jon WernerTodd MocklerSarah LiljegrenJoanne ChoryDetlef WeigelJoseph Ecker
UC Davis
Julin Maloof
UC San Diego
Charles Berry
Scripps
Sam HazenElizabeth Winzeler
University of Guelph, CanadaDave WolynUniversity of Guelph, CanadaDave Wolyn
Salk
Jon WernerTodd MocklerSarah LiljegrenJoanne ChoryDetlef WeigelJoseph Ecker
UC Davis
Julin Maloof
UC San Diego
Charles Berry
Scripps
Sam HazenElizabeth Winzeler
NaturalVariation.org

Effect of SNP position
340 CandidatePolymorphisms
False negative
True Positive

Fine Mapping LIGHT1
500kb
2nd NorthQTL
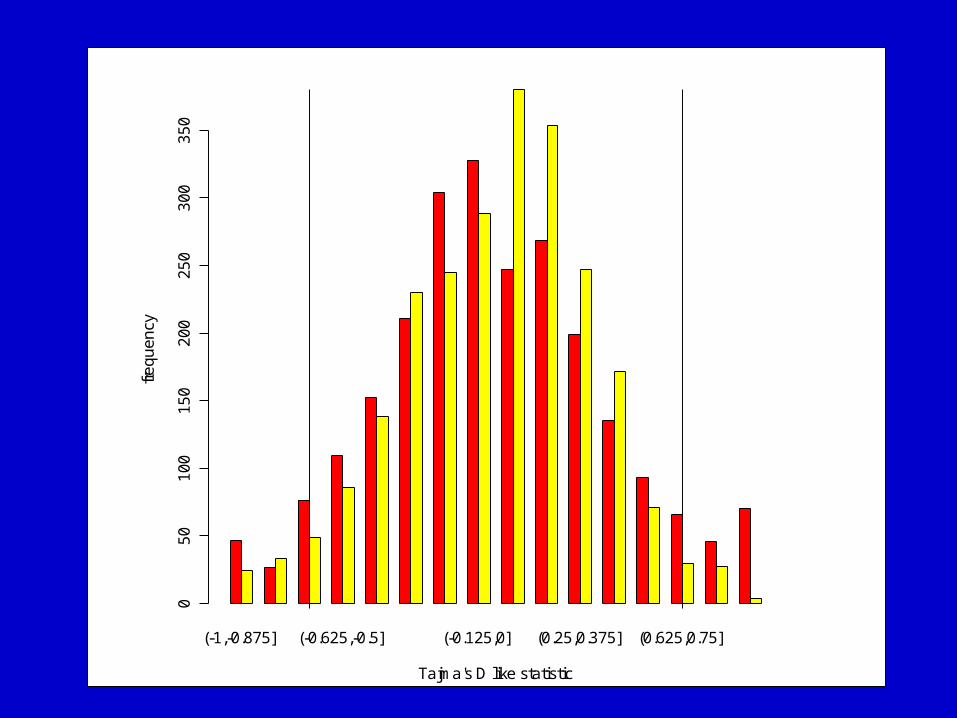
(-1,-0.875] (-0.625,-0.5] (-0.125,0] (0.25,0.375] (0.625,0.75]
Tajma's D like statistic
fre
qu
en
cy
05
01
00
15
02
00
25
03
00
35
0

Future Projects
Design 2nd generation expression array $200
350,000 25mer features, expect 12,000 SFPs (2 accessions)Validated gene models (exon intron)2 features per exon, alternative splicing5’ 3’ Untranslated region for gene family/ polymorphismMicro RNAsValidated “good” hybridization intensities
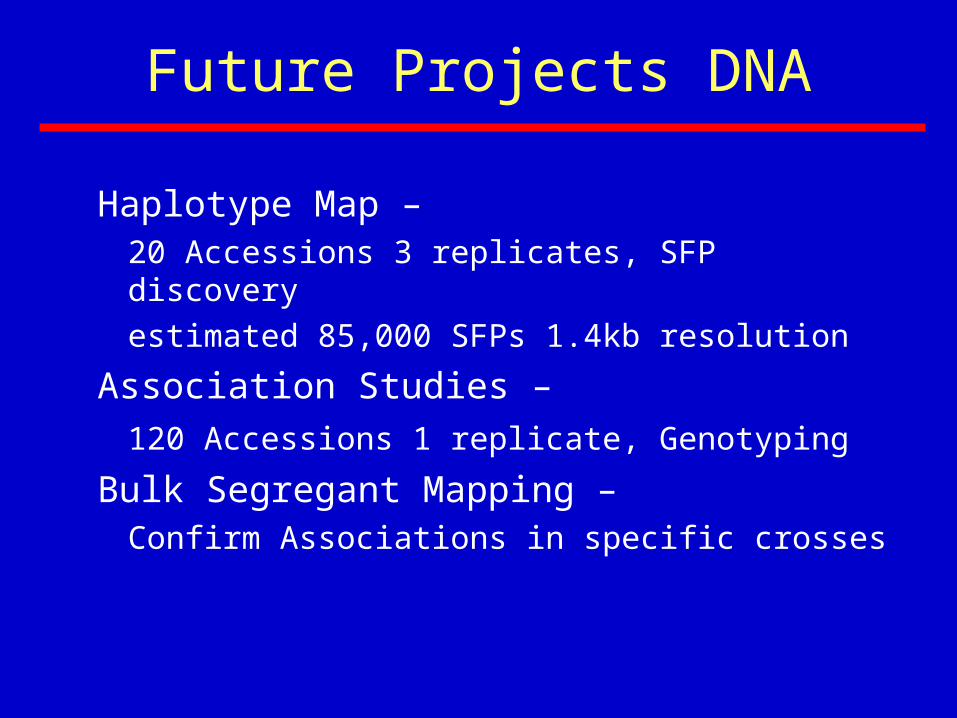
Haplotype Map –20 Accessions 3 replicates, SFP discovery
estimated 85,000 SFPs 1.4kb resolution
Association Studies –
120 Accessions 1 replicate, Genotyping
Bulk Segregant Mapping –Confirm Associations in specific crosses
Future Projects DNA

True natural variation in gene expression20 Accessions 3 replicates, (polymorphism accounted for)
Cis regulatory variation/ Imprintingreciprocal F1s 3 replicates
Transcriptome QTL Map –100 best VanC Advanced Intercross Lines
How many loci control the variation in gene transcription? Candidate TF and binding sites?
Future Projects RNA
C c c c C c C j j j j j j L L L B B B S S C C C k k c c E E E K K M M M N N N S S S v v V WWW
Cc
cc
Cc
Cj
jj
jj
jL
LL
BB
BS
SC
CC
kk
cc
EE
EK
KM
MM
NN
NS
SS
vv
VW
WW
o o o o o o o w w w w w w e e e a a a h h v v v a a 2 2 s s s e e t t t d d d o o o a a a s s s
oo
oo
oo
ow
ww
ww
we
ee
aa
ah
hv
vv
aa
22
ss
se
et
tt
dd
do
oo
aa
as
ss
l l l l l l l C C C L L L r r r y y y a a i i i s s 4 4 t t t n n 0 0 0 - - - r r r n n n - - -
ll
ll
ll
lC
CC
LL
Lr
rr
yy
ya
ai
ii
ss
44
tt
tn
n0
00
--
-r
rr
nn
n-
--
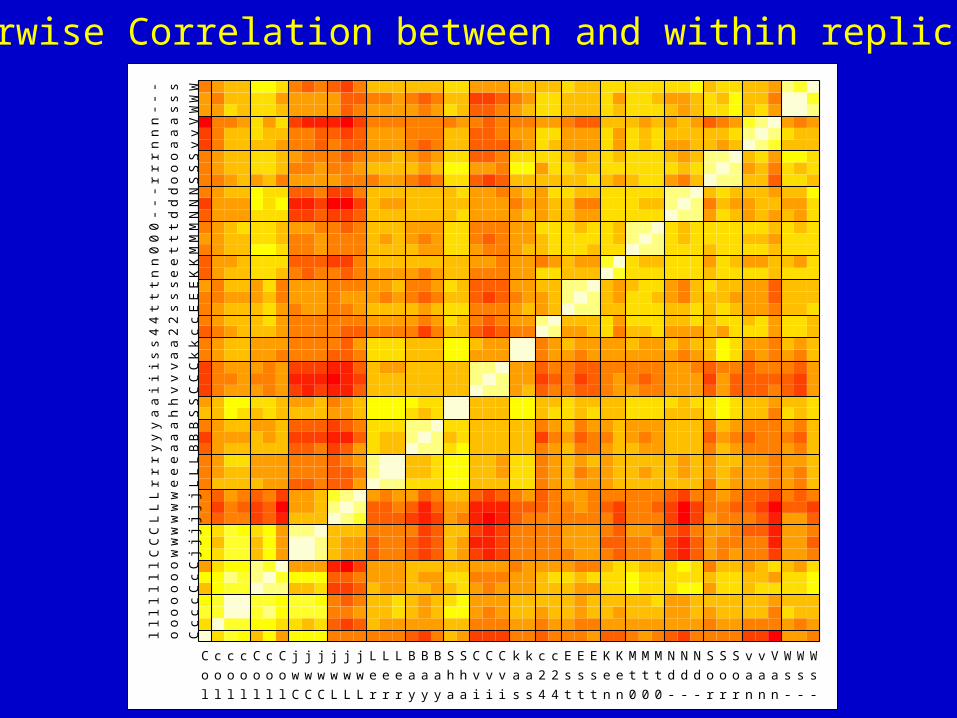
Pairwise Correlation between and within replicates
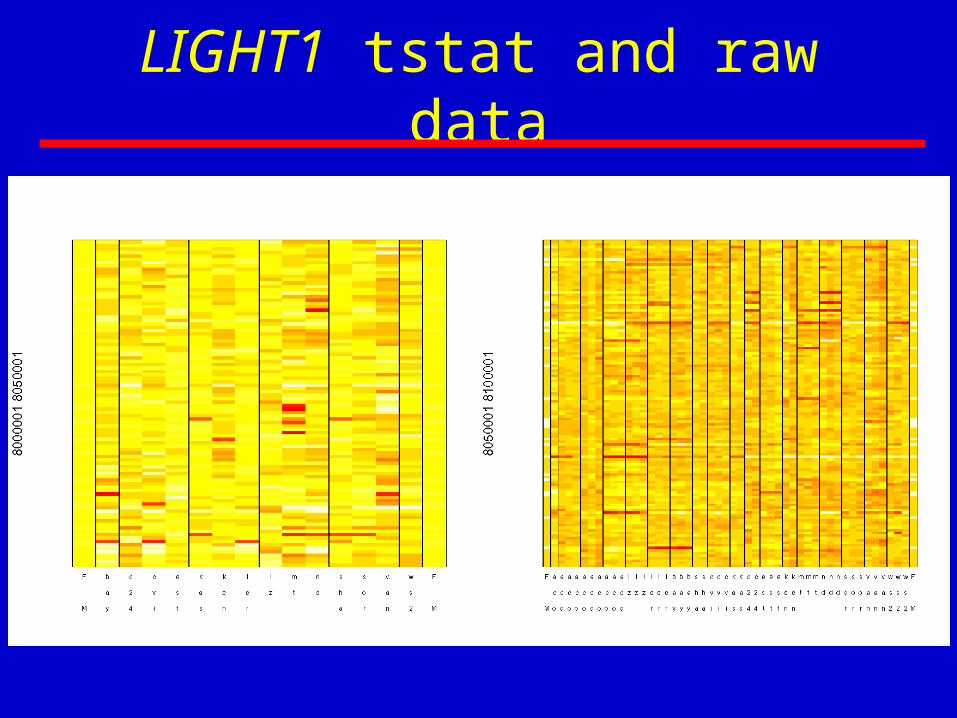
LIGHT1 tstat and raw data
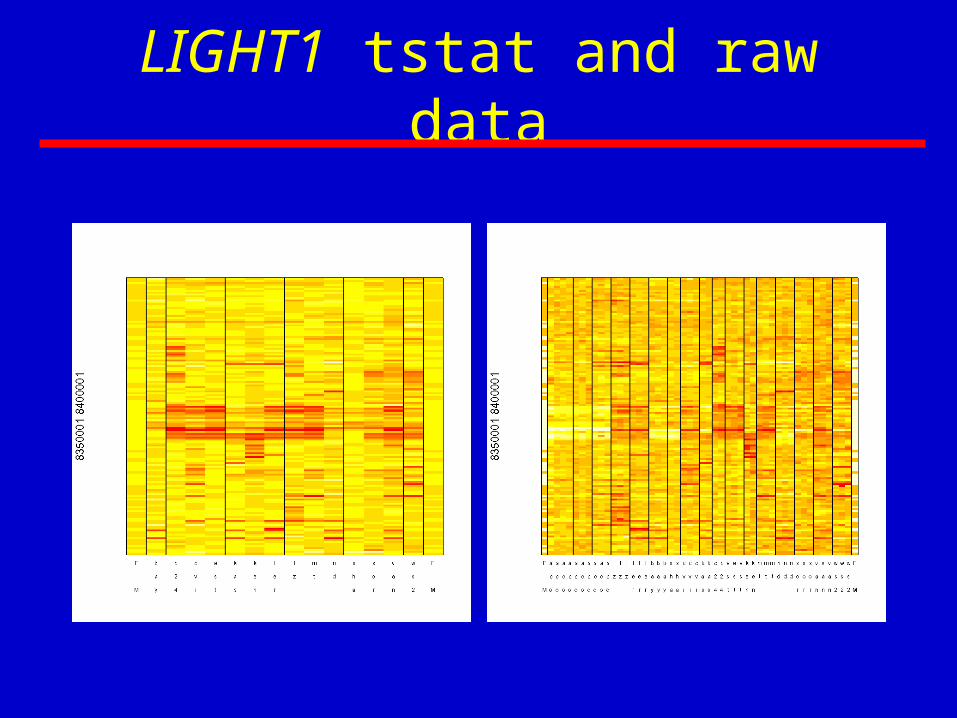
LIGHT1 tstat and raw data