Embed Size (px)
Citation preview
1
Microarray Data AnalysisMicroarray Data AnalysisUsing BRBUsing BRB--ArrayToolsArrayToolsVersion 4.2.0 Version 4.2.0 ––Beta_2Beta_2
Supriya Menezes Supriya Menezes
BRBBRB-- ArrayTools Development TeamArrayTools Development Team
May 17May 17hh 20112011
2
AgendaAgenda
What is BRBWhat is BRB--ArrayTools?ArrayTools?I.I. Installing BRBInstalling BRB--ArrayToolsArrayTools and its required components.and its required components.II.II. Creating a collated project workbook.Creating a collated project workbook.III.III. Data filtering and normalization optionsData filtering and normalization optionsIV.IV. Break. Break. V.V. GraphicsGraphicsVI.VI. Class ComparisonClass ComparisonVII.VII. Gene Set comparisonGene Set comparisonVIII.VIII. ClusteringClusteringIX.IX. MDSMDSX.X. Class PredictionClass PredictionXI.XI. PlugPlug--insinsXII.XII. Tutorial.Tutorial.XIII.XIII. QuestionsQuestions
3
Part I:Part I:
What is BRBWhat is BRB--ArrayTools?ArrayTools?
4
BRBBRB--ArrayToolsArrayTools
Developed under the direction of Dr. Richard Simon of the Developed under the direction of Dr. Richard Simon of the Biometrics Research Branch, NCI.Biometrics Research Branch, NCI.
Software was developed with the purpose of deploying Software was developed with the purpose of deploying powerful statistical tools for use by biologists.powerful statistical tools for use by biologists.
Analyses are launched from userAnalyses are launched from user--friendly Excel interface. friendly Excel interface. Also requires installation of a free software called R for Also requires installation of a free software called R for running backrunning back--end programs. Current requirement for R is v end programs. Current requirement for R is v 2.12.0. Publicly available from BRB website:2.12.0. Publicly available from BRB website:
http://linus.nci.nih.gov/BRB-ArrayTools.html
An Integrated Software Tool forDNA Microarray Analysis
5
Features of BRBFeatures of BRB--ArrayToolsArrayTools
Capability to collate (sort into an expression data matrix) micrCapability to collate (sort into an expression data matrix) microarray data oarray data from a set of experiments, and apply filtering and normalizationfrom a set of experiments, and apply filtering and normalization. . Compute RMA/GCCompute RMA/GC--RMA/MAS5.0 probeset summaries and RMA/MAS5.0 probeset summaries and normalization. BRBnormalization. BRB--ArrayTools was designed to analyze a ArrayTools was designed to analyze a setset of arrays of arrays rather than a single array.rather than a single array.
The focus of the software has been the implementation of statistThe focus of the software has been the implementation of statistical ical methodology which utilizes the sample descriptors (supervised anmethodology which utilizes the sample descriptors (supervised analysis).alysis).
Scatterplots, hierarchical clustering, and multidimensional scalScatterplots, hierarchical clustering, and multidimensional scaling analyses ing analyses also provide powerful visualization tools.also provide powerful visualization tools.
Gene annotations are integrated into analysis output to inform tGene annotations are integrated into analysis output to inform the he analysis results. Also, includes analyses using Biocarta,KEGG ananalysis results. Also, includes analyses using Biocarta,KEGG and d Broad/MIT pathways.Broad/MIT pathways.
Advanced users may program their own plugin analysis tools withiAdvanced users may program their own plugin analysis tools within BRBn BRB--ArrayTools.ArrayTools.
6
Limitations of BRBLimitations of BRB--ArrayToolsArrayTools
Available only on the PC. As well as on an Available only on the PC. As well as on an Apple macbook Apple macbook pro machine with Windows OSpro machine with Windows OS installed with Appleinstalled with Apple’’s s bootcamp softwarebootcamp software
Currently compatible with MS Vista/ Windows 7 and Excel Currently compatible with MS Vista/ Windows 7 and Excel 2007/ 2010 .2007/ 2010 .
Also works on a 64Also works on a 64-- bit machine with Windows OS.bit machine with Windows OS. Importation of Affymetrix CEL files using RMA/GCImportation of Affymetrix CEL files using RMA/GC--
RMA method requires a large memory capacity even for RMA method requires a large memory capacity even for relatively large sets of arrays and may further limit the relatively large sets of arrays and may further limit the number of arrays which can be imported. number of arrays which can be imported.
7
New to ArrayToolsv4.1New to ArrayToolsv4.1
AffyAffy ST array importer.ST array importer. Enhanced visualizations and interactive plots.Enhanced visualizations and interactive plots. Enhanced the Enhanced the HeatmapHeatmap in clustering.in clustering. New plugNew plug--ins: ins: AdaboostAdaboost and Lassoed PC.and Lassoed PC. A new gene filtering to handle redundant probe sets A new gene filtering to handle redundant probe sets
that correspond to the same gene.that correspond to the same gene. Utility: To obtain drug information based on a gene Utility: To obtain drug information based on a gene
list.list. Ability to import custom expression arrays and Ability to import custom expression arrays and
annotations by using the gene identifiers.annotations by using the gene identifiers.
8
Installing BRBInstalling BRB--ArrayToolsArrayTools
http://linus.nci.nih.gov/BRBhttp://linus.nci.nih.gov/BRB--ArrayTools.htmlArrayTools.html
Register to obtain a user name and password by going to Register to obtain a user name and password by going to the guestbook.the guestbook.
Select the version you wish to download.Select the version you wish to download.
Currently available BRBCurrently available BRB--ArrayToolsv4.1.0ArrayToolsv4.1.0
Additionally, v4.2 beta release.Additionally, v4.2 beta release.
9
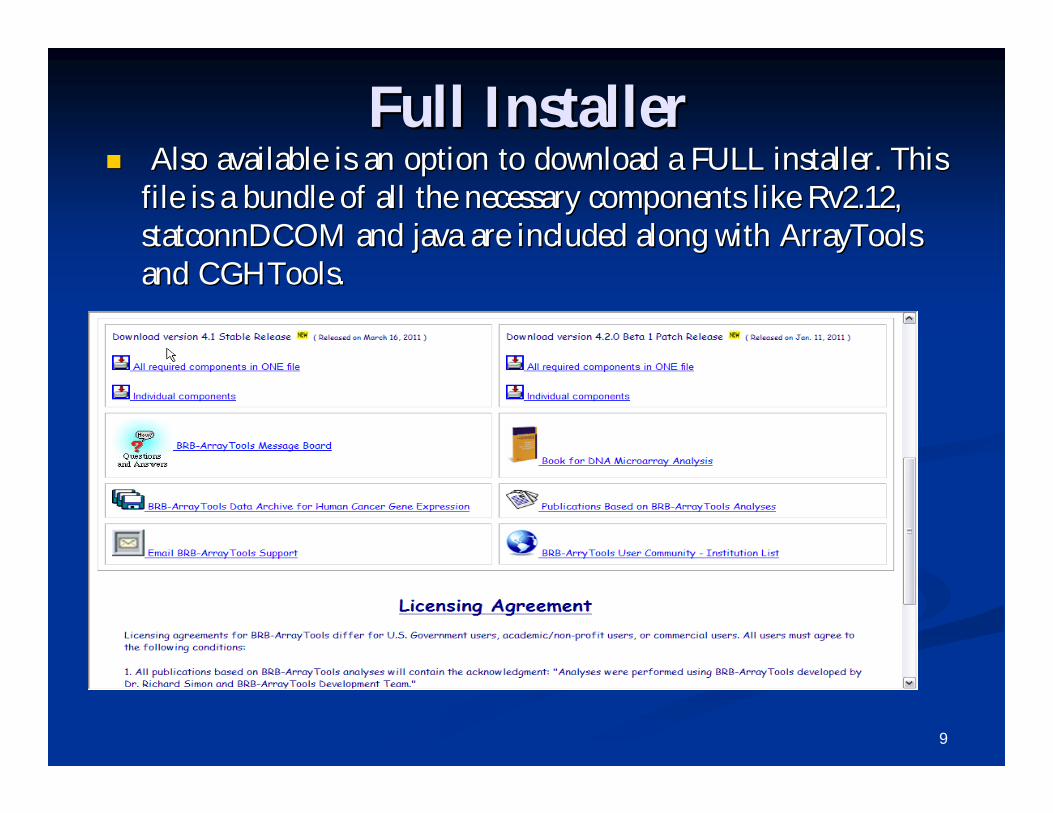
Full InstallerFull Installer Also available is an option to download a FULL installer. This Also available is an option to download a FULL installer. This
file is a bundle of all the necessary components like Rv2.12, file is a bundle of all the necessary components like Rv2.12, statconnDCOMstatconnDCOM and java are included along with ArrayTools and java are included along with ArrayTools and CGHTools.and CGHTools.
10
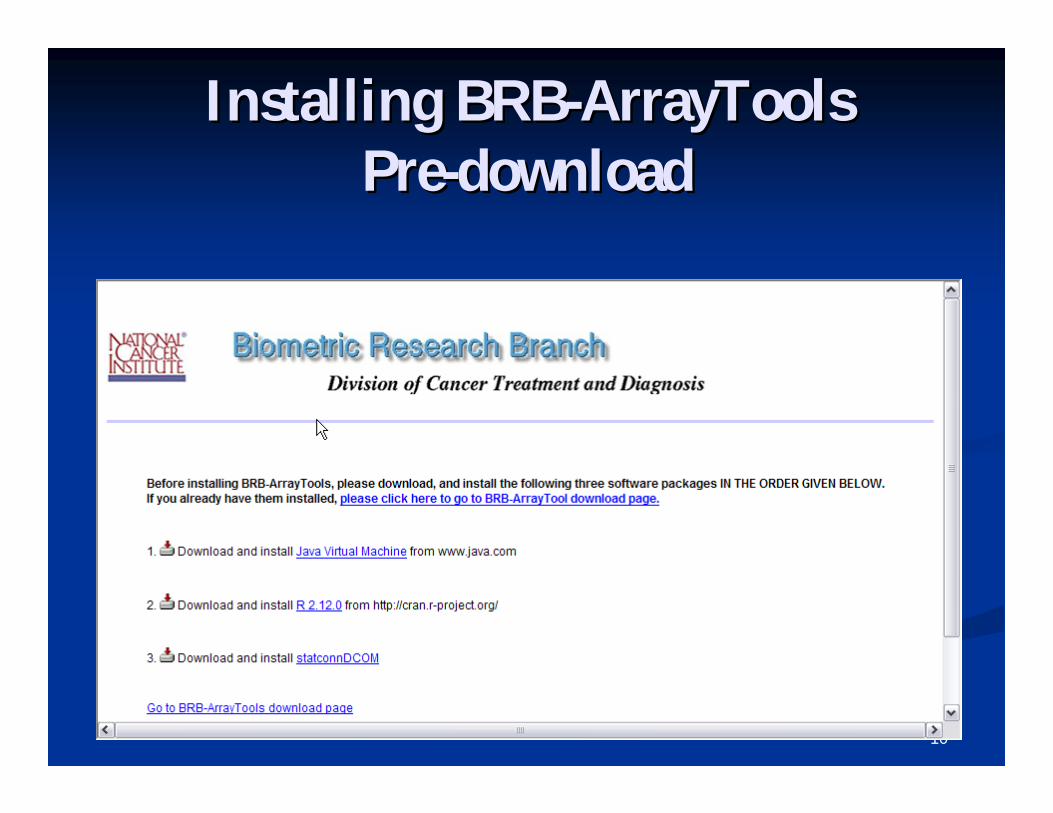
Installing BRBInstalling BRB--ArrayToolsArrayToolsPrePre--downloaddownload
11
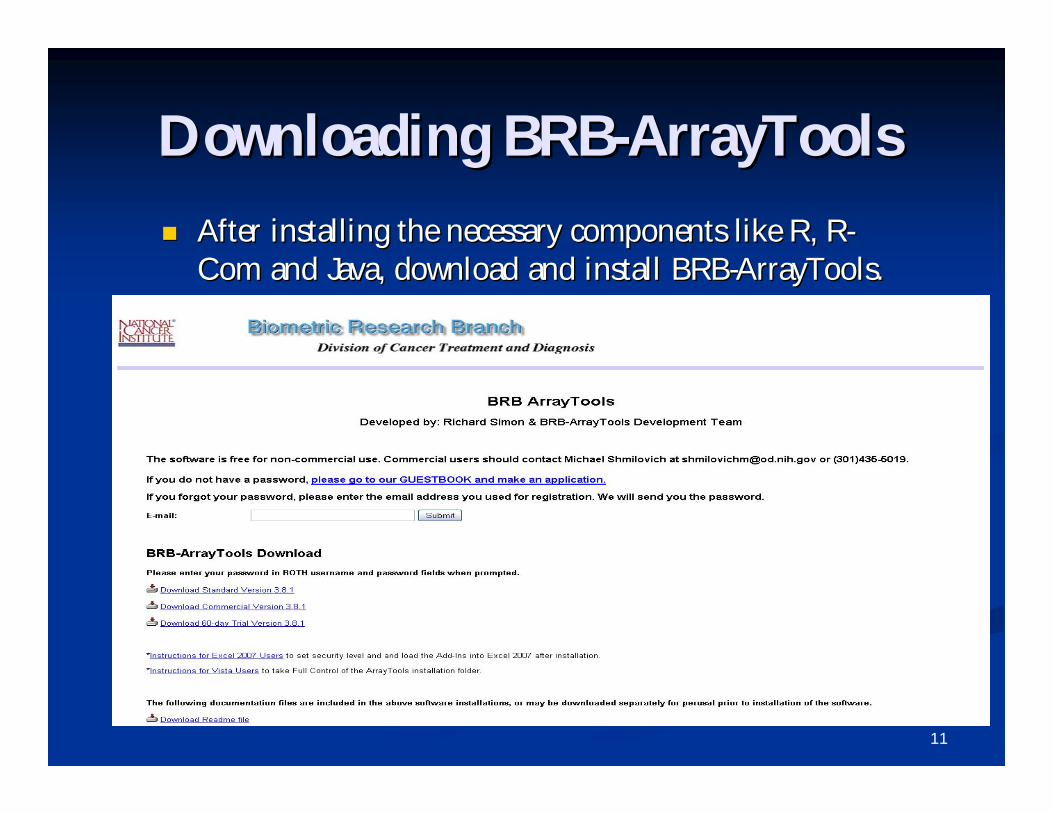
Downloading BRBDownloading BRB--ArrayToolsArrayTools
After installing the necessary components like R, RAfter installing the necessary components like R, R--Com and Java, download and install BRBCom and Java, download and install BRB--ArrayTools.ArrayTools.
12
Installing BRBInstalling BRB--ArrayToolsArrayTools
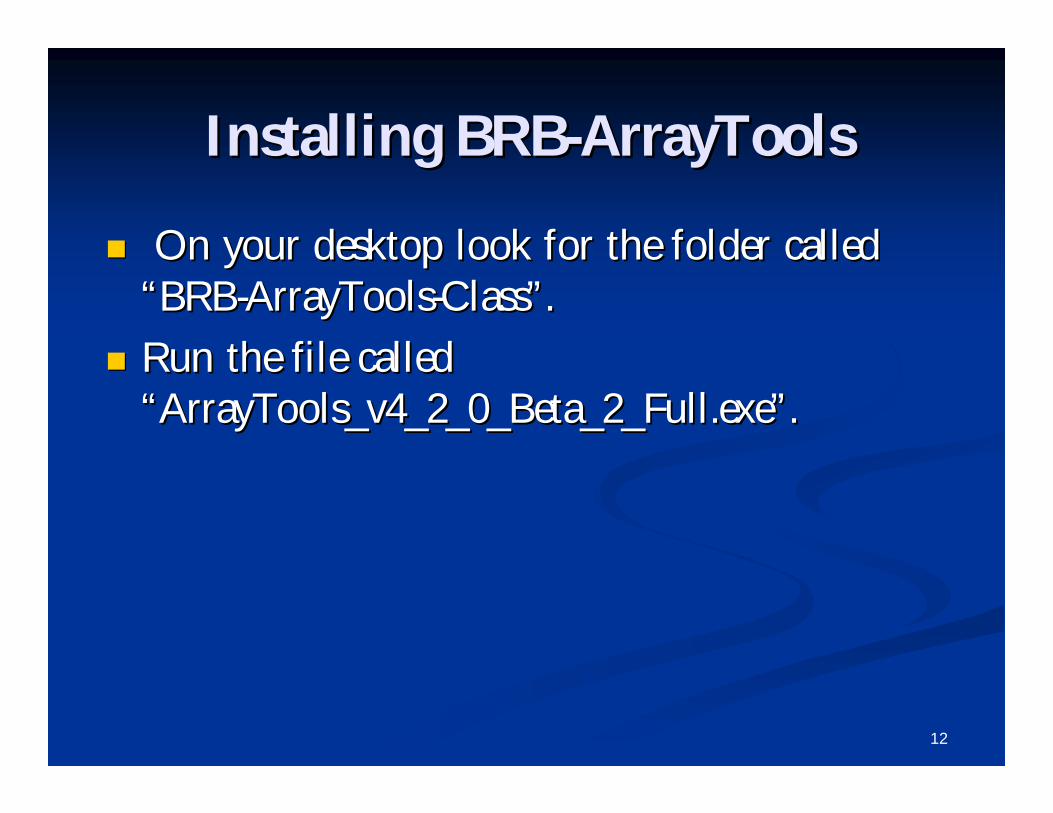
On your desktop look for the folder called On your desktop look for the folder called ““BRBBRB--ArrayToolsArrayTools--ClassClass””..
Run the file called Run the file called ““ArrayTools_v4_2_0_Beta_2_Full.exeArrayTools_v4_2_0_Beta_2_Full.exe””..
13
Installing BRBInstalling BRB--ArrayToolsArrayTools
14
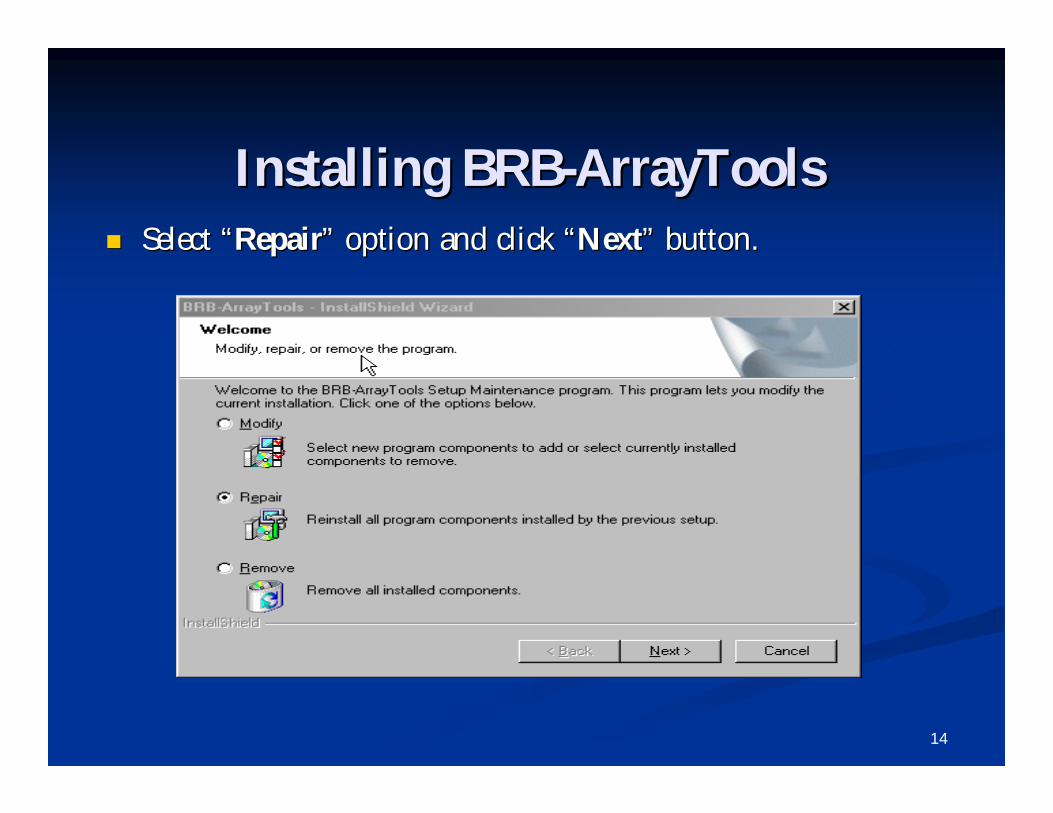
Installing BRBInstalling BRB--ArrayToolsArrayTools Select Select ““RepairRepair”” option and click option and click ““NextNext”” button.button.
15
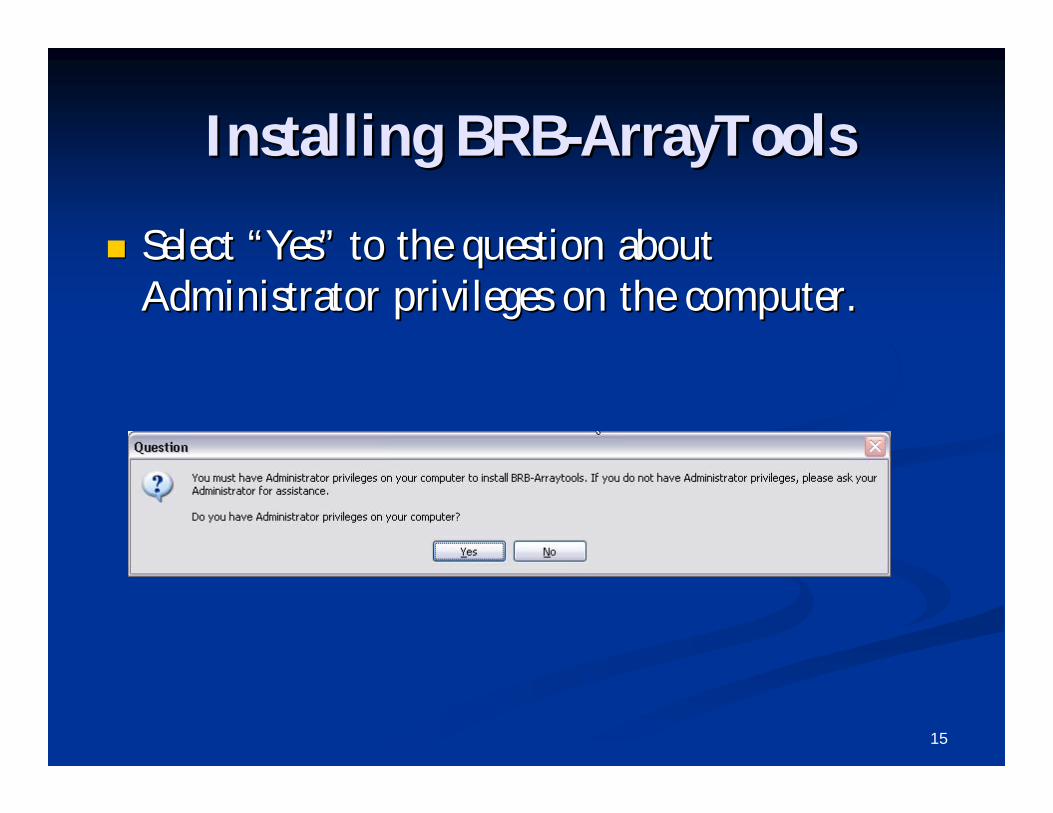
Installing BRBInstalling BRB--ArrayToolsArrayTools
Select Select ““YesYes”” to the question about to the question about Administrator privileges on the computer.Administrator privileges on the computer.
16
Installing BRBInstalling BRB--ArrayToolsArrayTools
Click Click ““OKOK”” to install R, RCOM and Java.to install R, RCOM and Java.
17
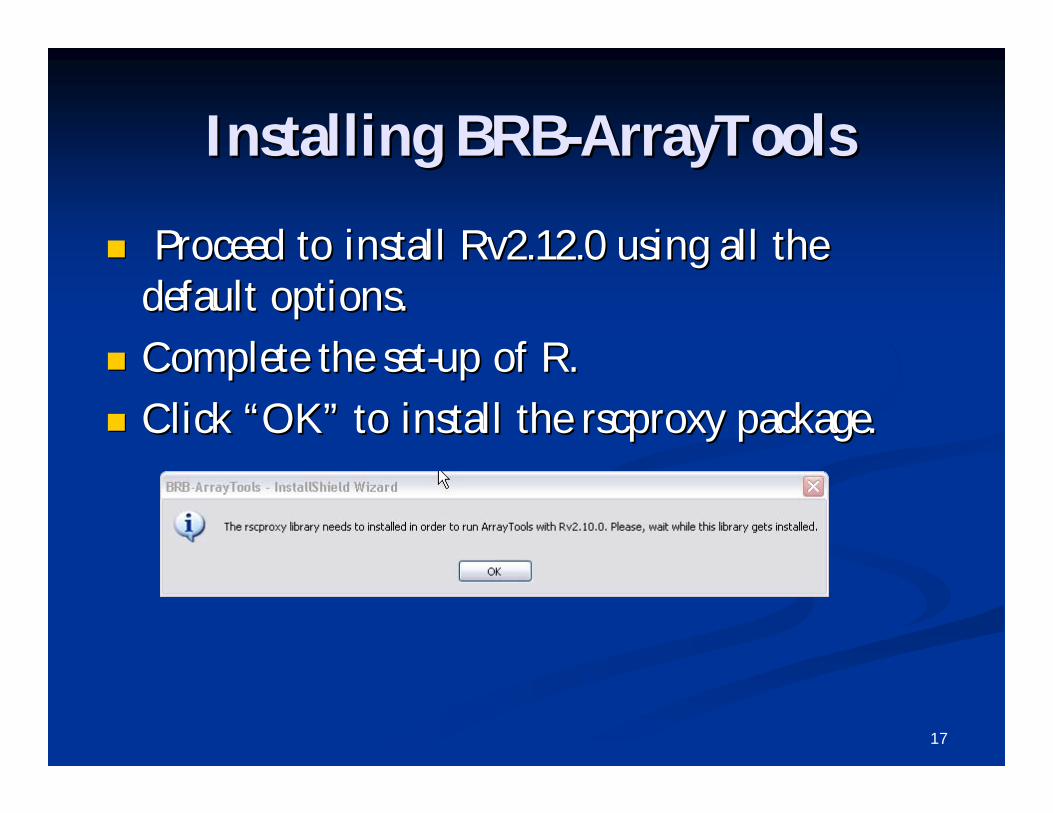
Installing BRBInstalling BRB--ArrayToolsArrayTools
Proceed to install Rv2.12.0 using all the Proceed to install Rv2.12.0 using all the default options.default options.
Complete the setComplete the set--up of R.up of R.
Click Click ““OKOK”” to install the to install the rscproxyrscproxy package.package.
18
Installing BRBInstalling BRB--ArrayToolsArrayTools
Proceed to install RCOM and Java using the Proceed to install RCOM and Java using the default options.default options.
Install Install CGHToolsCGHTools..
19
Installing BRBInstalling BRB--ArrayToolsArrayTools
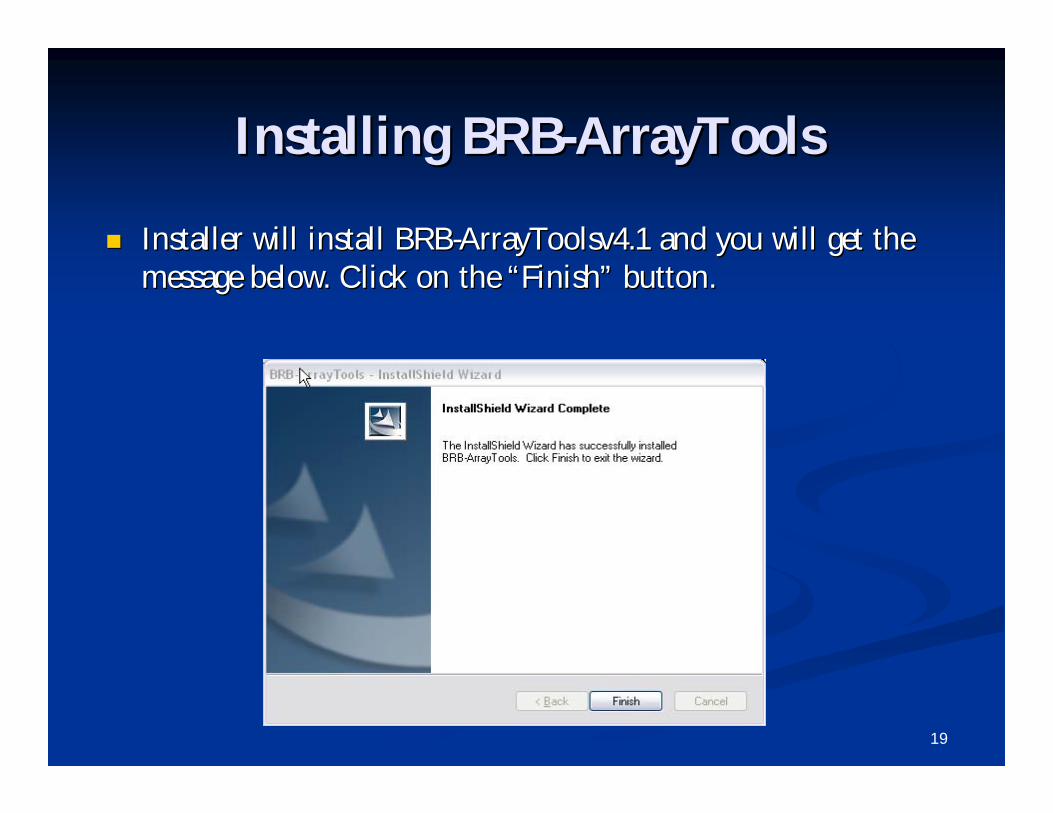
Installer will install BRBInstaller will install BRB--ArrayToolsv4.1 and you will get the ArrayToolsv4.1 and you will get the message below. Click on the message below. Click on the ““FinishFinish”” button.button.
20
Installing BRBInstalling BRB--ArrayToolsArrayTools
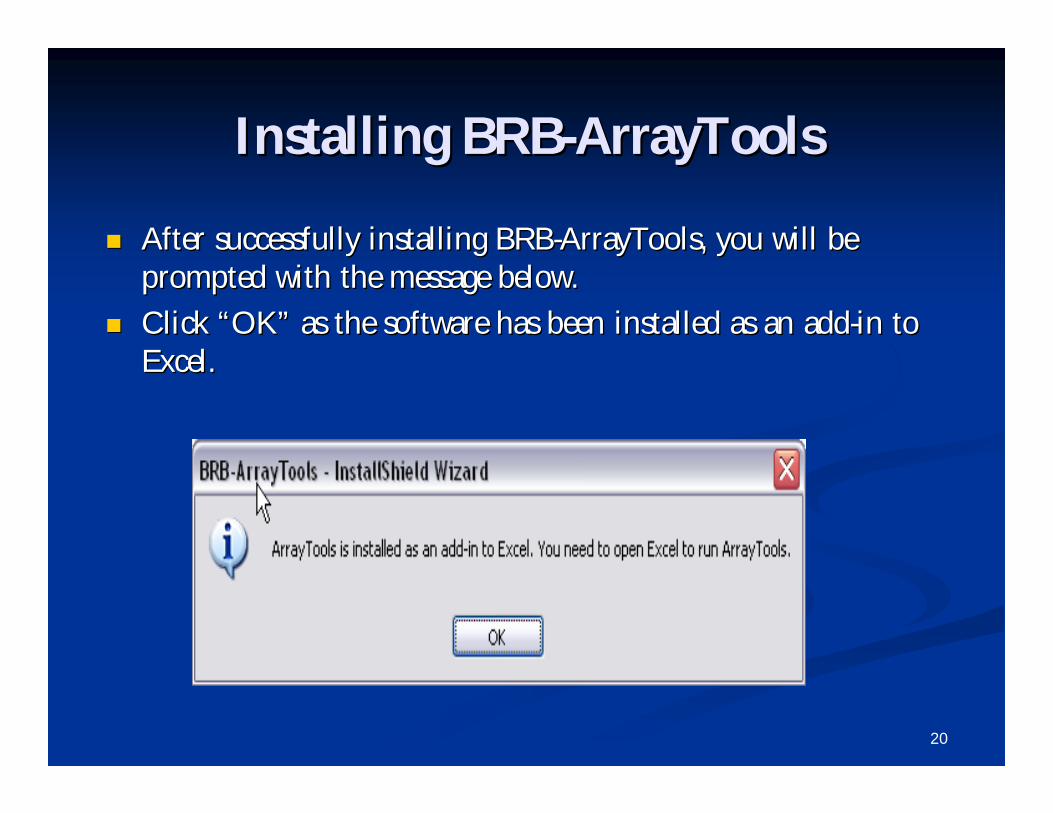
After successfully installing BRBAfter successfully installing BRB--ArrayTools, you will be ArrayTools, you will be prompted with the message below. prompted with the message below.
Click Click ““OKOK”” as the software has been installed as an addas the software has been installed as an add--in to in to Excel.Excel.
21
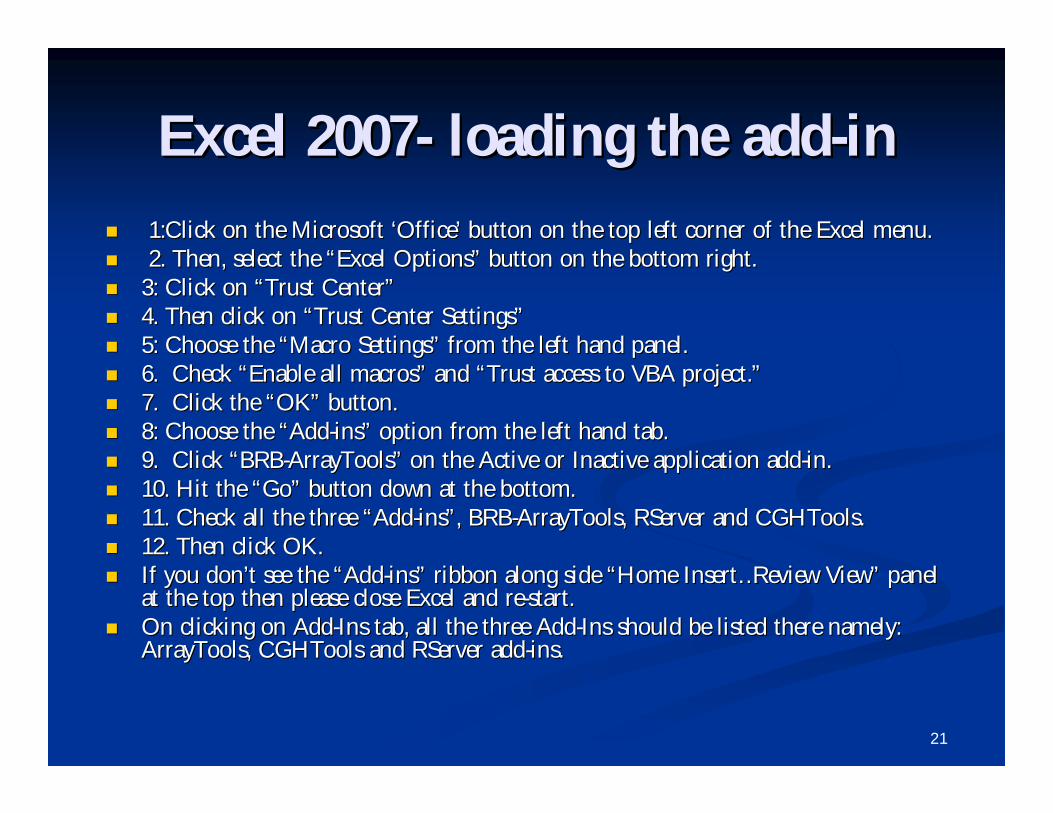
Excel 2007Excel 2007-- loading the addloading the add--inin 1:Click on the Microsoft 1:Click on the Microsoft ‘‘OfficeOffice’’ button on the top left corner of the Excel menu.button on the top left corner of the Excel menu. 2. Then, select the 2. Then, select the ““Excel OptionsExcel Options”” button on the bottom right.button on the bottom right. 3: Click on 3: Click on ““Trust CenterTrust Center”” 4. Then click on 4. Then click on ““Trust Center SettingsTrust Center Settings”” 5: Choose the 5: Choose the ““Macro SettingsMacro Settings”” from the left hand panel. from the left hand panel. 6. Check 6. Check ““Enable all macrosEnable all macros”” and and ““Trust access to VBA project.Trust access to VBA project.”” 7. Click the 7. Click the ““OKOK”” button.button. 8: Choose the 8: Choose the ““AddAdd--insins”” option from the left hand tab. option from the left hand tab. 9. Click 9. Click ““BRBBRB--ArrayToolsArrayTools”” on the Active or Inactive application addon the Active or Inactive application add--in. in. 10. Hit the 10. Hit the ““GoGo”” button down at the bottom.button down at the bottom. 11. Check all the three 11. Check all the three ““AddAdd--insins””, BRB, BRB--ArrayToolsArrayTools, , RServerRServer and and CGHToolsCGHTools. . 12. Then click OK. 12. Then click OK. If you donIf you don’’t see the t see the ““AddAdd--insins”” ribbon along side ribbon along side ““Home InsertHome Insert……Review ViewReview View”” panel panel
at the top then please close Excel and reat the top then please close Excel and re--start. start. On clicking on AddOn clicking on Add--Ins tab, all the three AddIns tab, all the three Add--Ins should be listed there namely: Ins should be listed there namely:
ArrayToolsArrayTools, , CGHToolsCGHTools and and RServerRServer addadd--ins.ins.
22
[Hands[Hands--on instructions]on instructions][Getting started][Getting started]
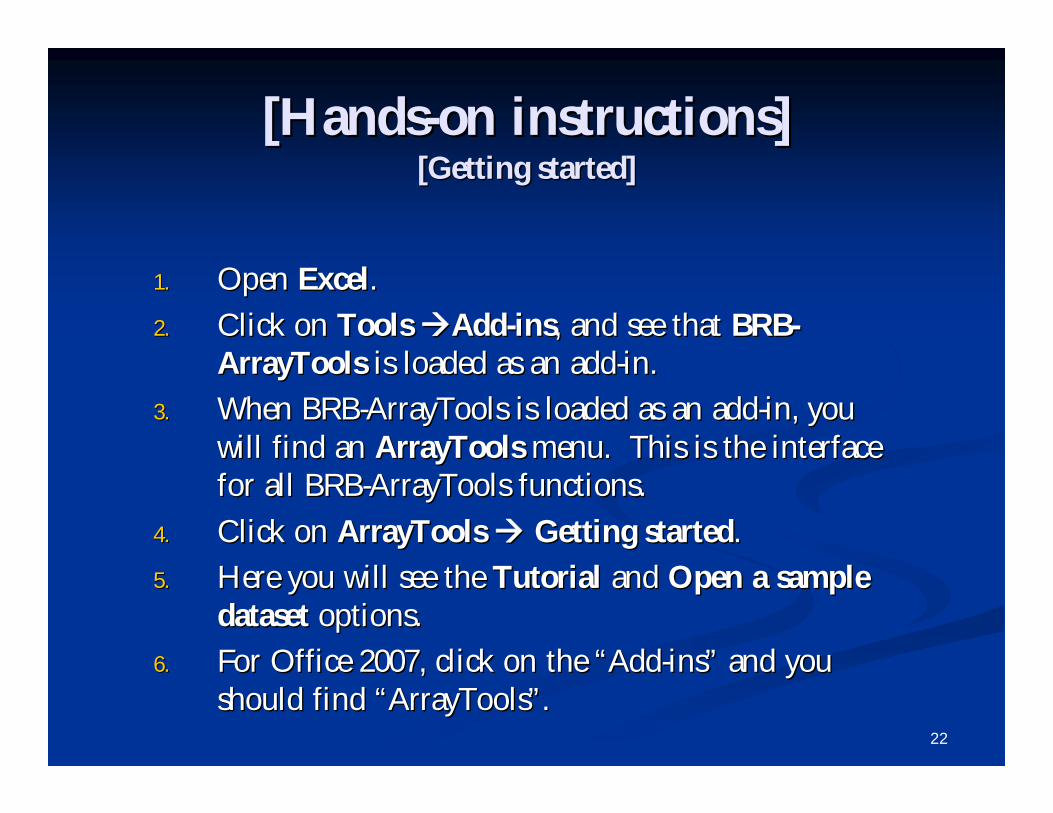
1.1. Open Open ExcelExcel..
2.2. Click on Click on Tools Tools AddAdd--insins, and see that , and see that BRBBRB--ArrayToolsArrayTools is loaded as an addis loaded as an add--in.in.
3.3. When BRBWhen BRB--ArrayTools is loaded as an addArrayTools is loaded as an add--in, you in, you will find an will find an ArrayToolsArrayTools menu. This is the interface menu. This is the interface for all BRBfor all BRB--ArrayTools functions.ArrayTools functions.
4.4. Click on Click on ArrayTools ArrayTools Getting startedGetting started..
5.5. Here you will see the Here you will see the TutorialTutorial and and Open a sample Open a sample datasetdataset options.options.
6.6. For Office 2007, click on the For Office 2007, click on the ““AddAdd--insins”” and you and you should find should find ““ArrayToolsArrayTools””. .
23
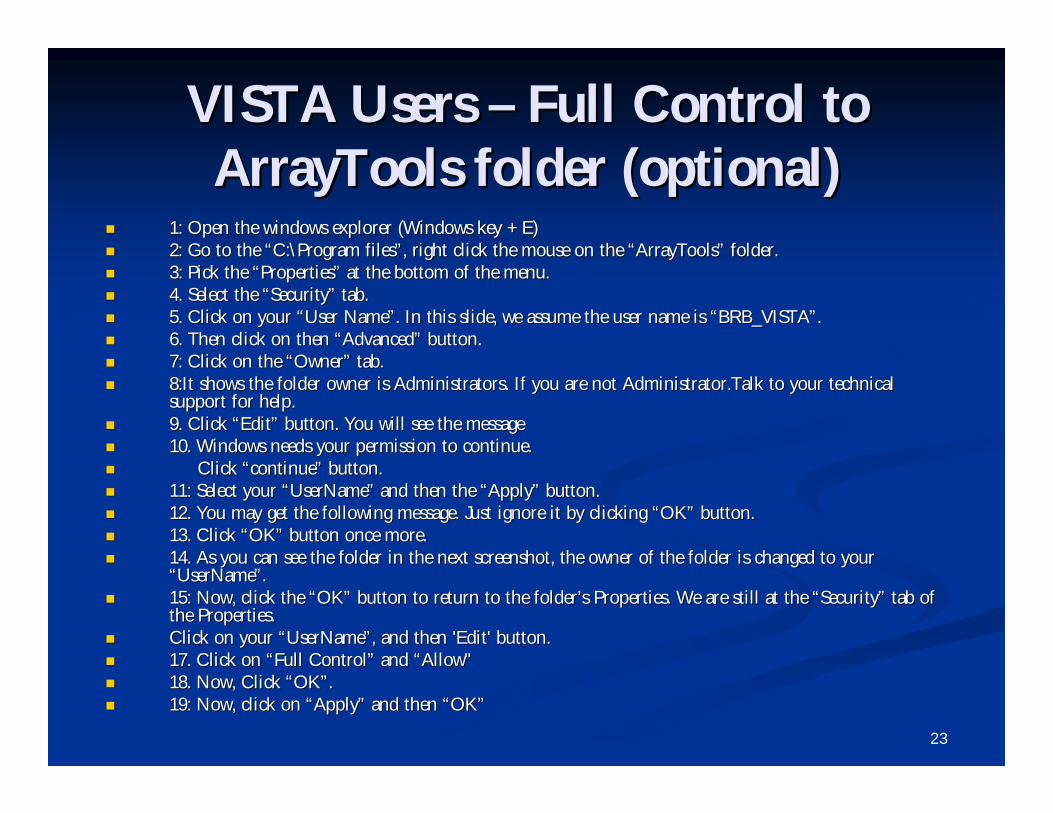
VISTA Users VISTA Users –– Full Control to Full Control to ArrayToolsArrayTools folder (optional)folder (optional)
1: Open the windows explorer (Windows key + E) 1: Open the windows explorer (Windows key + E) 2: Go to the 2: Go to the ““C:C:\\Program filesProgram files””, right click the mouse on the , right click the mouse on the ““ArrayToolsArrayTools”” folder. folder. 3: Pick the 3: Pick the ““PropertiesProperties”” at the bottom of the menu. at the bottom of the menu. 4. Select the 4. Select the ““SecuritySecurity”” tab. tab. 5. Click on your 5. Click on your ““User NameUser Name””. In this slide, we assume the user name is . In this slide, we assume the user name is ““BRB_VISTABRB_VISTA””. . 6. Then click on then 6. Then click on then ““AdvancedAdvanced”” button.button. 7: Click on the 7: Click on the ““OwnerOwner”” tab. tab. 8:It shows the folder owner is Administrators. If you are not 8:It shows the folder owner is Administrators. If you are not Administrator.TalkAdministrator.Talk to your technical to your technical
support for help. support for help. 9. Click 9. Click ““EditEdit”” button. You will see the message button. You will see the message 10. Windows needs your permission to continue. 10. Windows needs your permission to continue. Click Click ““continuecontinue”” button. button. 11: Select your 11: Select your ““UserNameUserName”” and then the and then the ““ApplyApply”” button. button. 12. You may get the following message. Just ignore it by clickin12. You may get the following message. Just ignore it by clicking g ““OKOK”” button. button. 13. Click 13. Click ““OKOK”” button once more. button once more. 14. As you can see the folder in the next screenshot, the owner 14. As you can see the folder in the next screenshot, the owner of the folder is changed to your of the folder is changed to your
““UserNameUserName””. . 15: Now, click the 15: Now, click the ““OKOK”” button to return to the folderbutton to return to the folder’’s Properties. We are still at the s Properties. We are still at the ““SecuritySecurity”” tab of tab of
the Properties. the Properties. Click on your Click on your ““UserNameUserName””, and then 'Edit' button. , and then 'Edit' button. 17. Click on 17. Click on ““Full ControlFull Control”” and and ““Allow" Allow" 18. Now, Click 18. Now, Click ““OKOK””.. 19: Now, click on 19: Now, click on ““ApplyApply”” and then and then ““OKOK””
24
Part II:Part II:
Getting your data intoGetting your data intoBRBBRB--ArrayTools:ArrayTools:Creating a project Creating a project
workbookworkbook

25
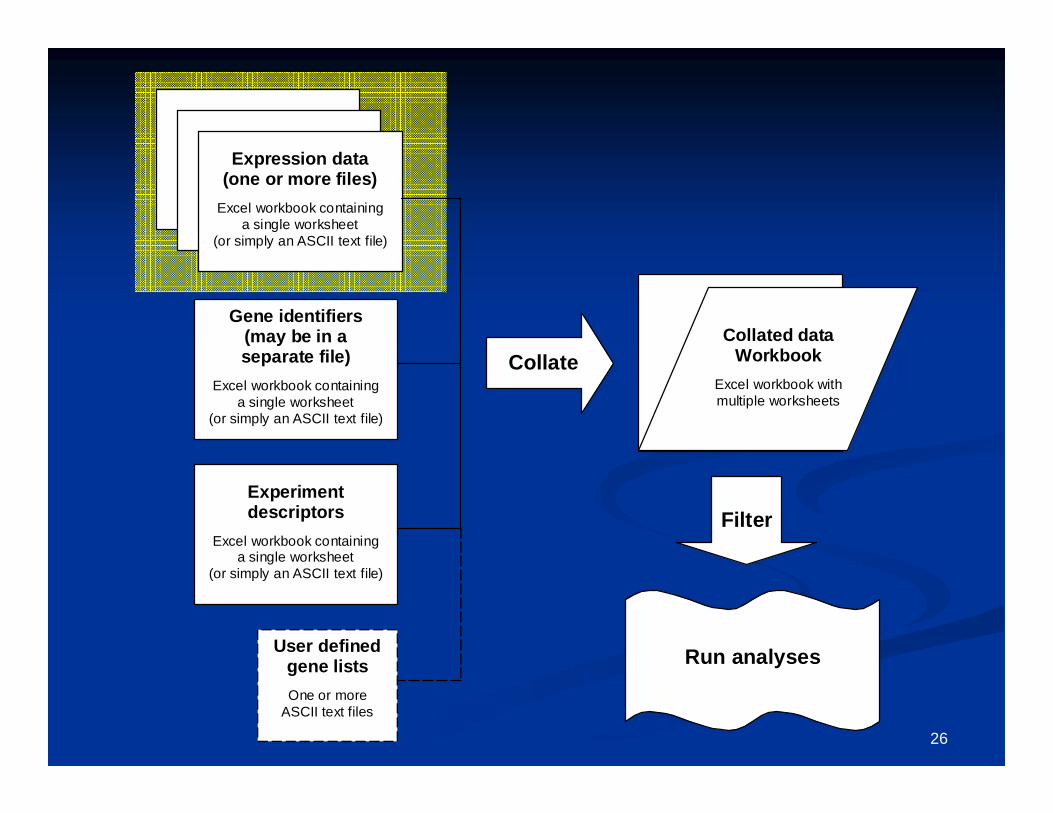
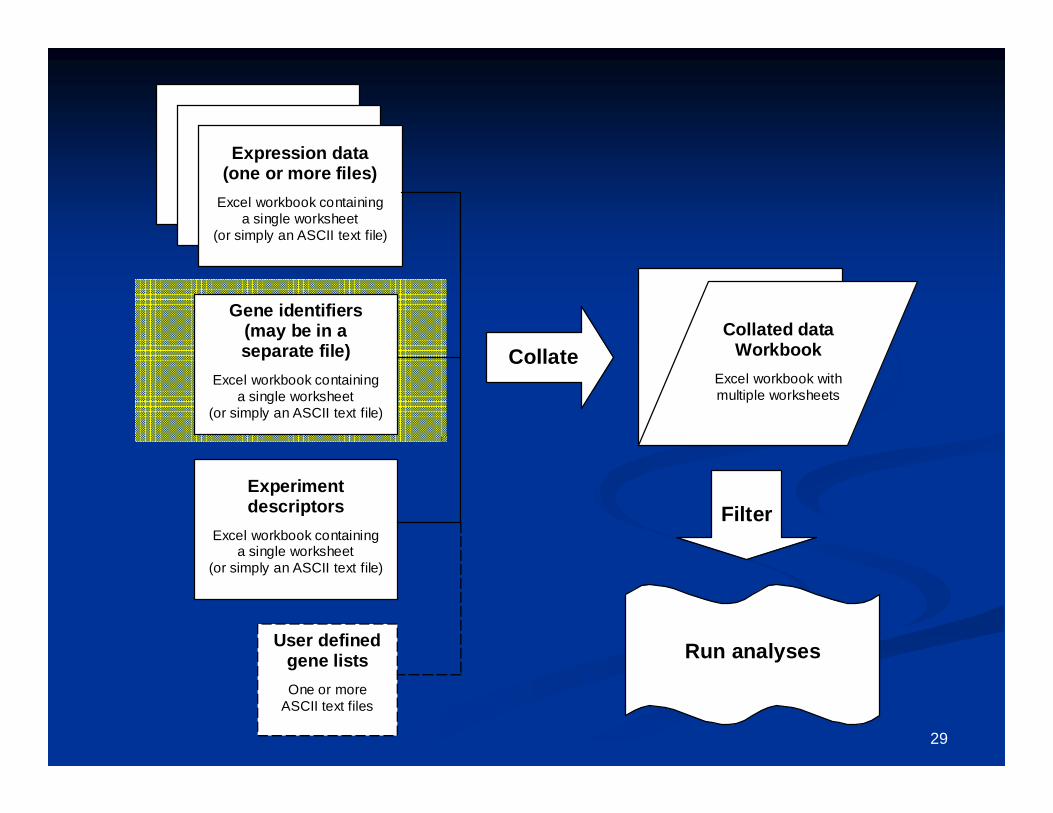
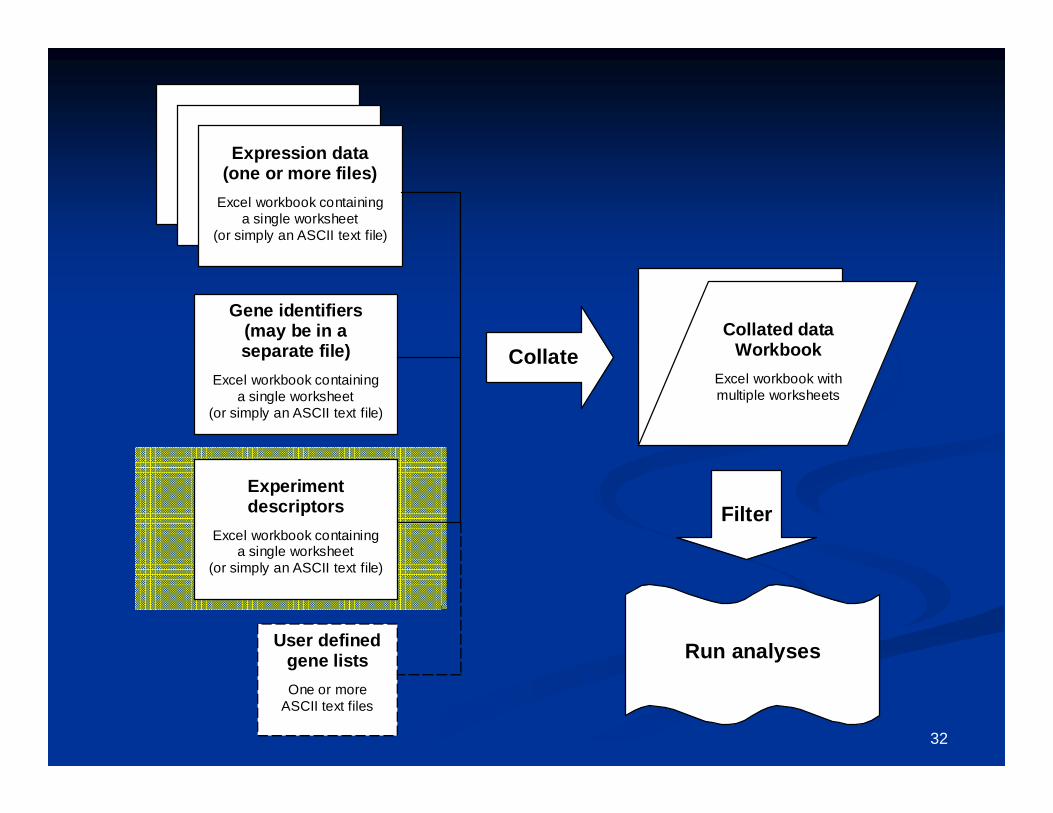
Expression data(one or more files)
Excel workbook containinga single worksheet
(or simply an ASCII text file)
Gene identifiers(may be in aseparate file)
Excel workbook containinga single worksheet
(or simply an ASCII text file)
Experimentdescriptors
Excel workbook containinga single worksheet
(or simply an ASCII text file)
CollateCollated data
WorkbookExcel workbook withmultiple worksheets
User definedgene listsOne or more
ASCII text files
Run analyses
Filter
26
Expression data(one or more files)
Excel workbook containinga single worksheet
(or simply an ASCII text file)
Gene identifiers(may be in aseparate file)
Excel workbook containinga single worksheet
(or simply an ASCII text file)
Experimentdescriptors
Excel workbook containinga single worksheet
(or simply an ASCII text file)
CollateCollated data
WorkbookExcel workbook withmultiple worksheets
User definedgene listsOne or more
ASCII text files
Run analyses
Filter
27
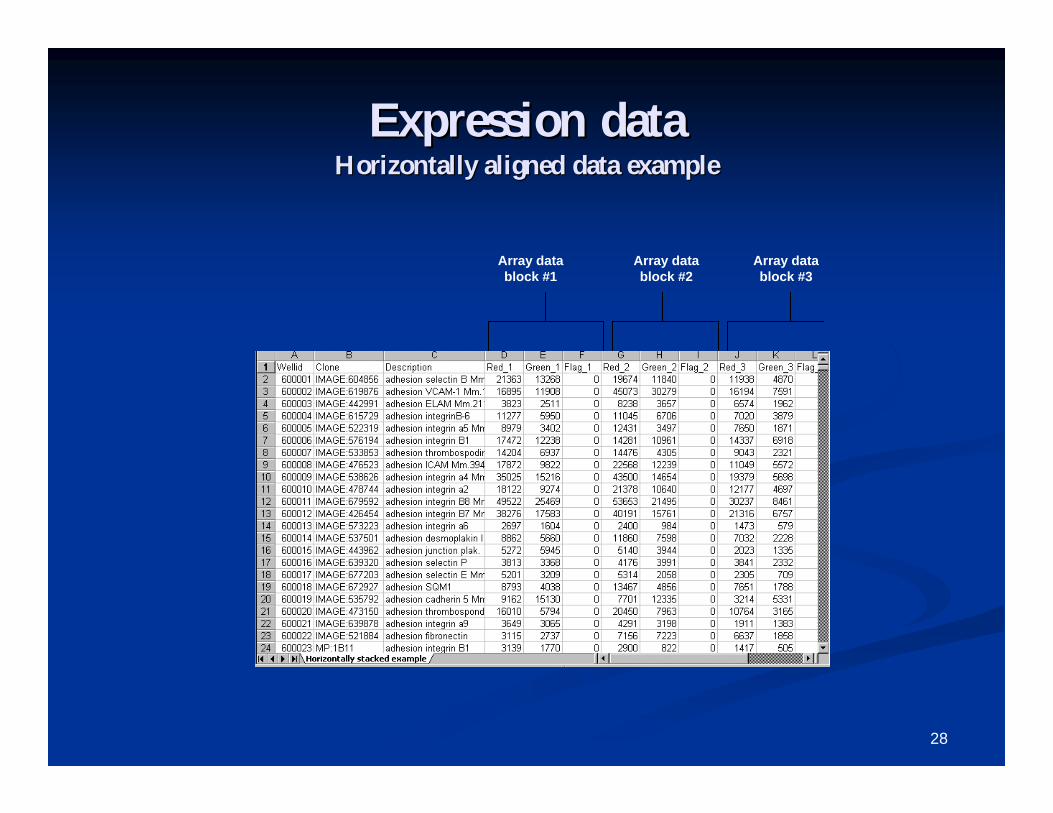
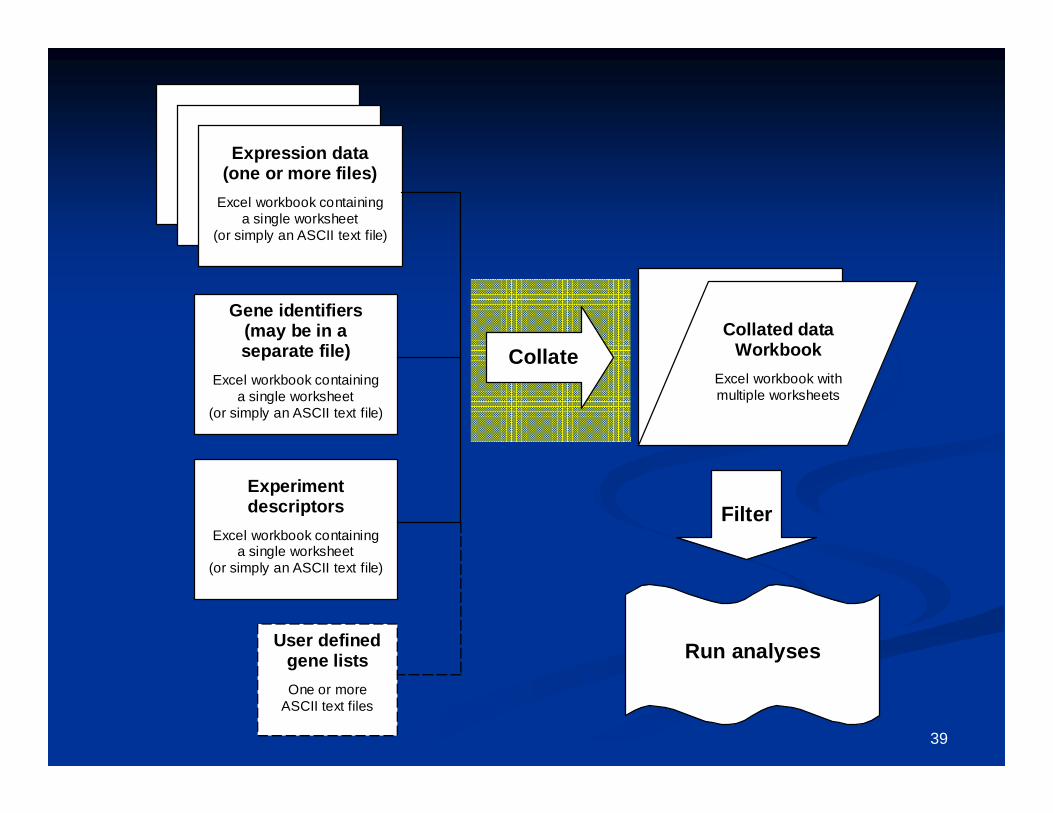
Expression dataExpression data Input data as tabInput data as tab--delimited ASCII files (or Excel delimited ASCII files (or Excel
spreadsheets) in one of the following three formats:spreadsheets) in one of the following three formats:1. Horizontally aligned1. Horizontally aligned2. Separate files2. Separate files3. Multi3. Multi--chip setschip sets
Files may contain expression data in the form of signal (or Files may contain expression data in the form of signal (or singlesingle--channel expression summary), dualchannel expression summary), dual--channel channel intensities, or expression ratios (for dualintensities, or expression ratios (for dual--channel data). channel data). Data may or may not have been already logData may or may not have been already log--transformed. transformed. Flags, detection call, and spot size may also be used. All Flags, detection call, and spot size may also be used. All other variables will be ignored.other variables will be ignored.
For Affymetrix data, expression data files should be For Affymetrix data, expression data files should be PROBESETPROBESET--level data if using the Data Import Wizard. level data if using the Data Import Wizard. Affymetrix CEL files should be imported using a Affymetrix CEL files should be imported using a specialized utility included with BRBspecialized utility included with BRB--ArrayTools.ArrayTools.
28
Expression dataExpression dataHorizontally aligned data exampleHorizontally aligned data example
Array data block #1
Array data block #2
Array data block #3
29
Expression data(one or more files)
Excel workbook containinga single worksheet
(or simply an ASCII text file)
Gene identifiers(may be in aseparate file)
Excel workbook containinga single worksheet
(or simply an ASCII text file)
Experimentdescriptors
Excel workbook containinga single worksheet
(or simply an ASCII text file)
CollateCollated data
WorkbookExcel workbook withmultiple worksheets
User definedgene listsOne or more
ASCII text files
Run analyses
Filter
30
Gene identifiersGene identifiers
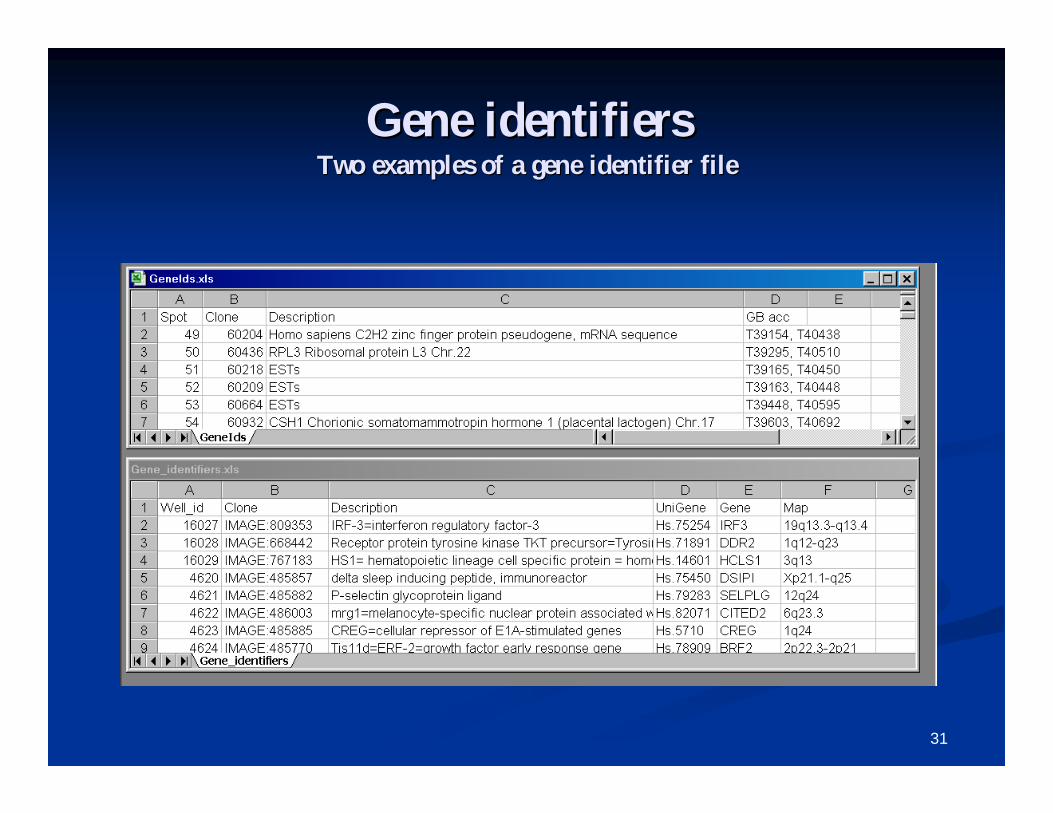
A gene identifiers file is optional, but highly A gene identifiers file is optional, but highly recommended for annotation purposes.recommended for annotation purposes.
Gene identifiers which may be used for hyperlinking Gene identifiers which may be used for hyperlinking are: clone ids, UniGene cluster id or gene symbol, are: clone ids, UniGene cluster id or gene symbol, GenBank accessions, and probe set ids.GenBank accessions, and probe set ids.
31
Gene identifiersGene identifiersTwo examples of a gene identifier fileTwo examples of a gene identifier file
32
Expression data(one or more files)
Excel workbook containinga single worksheet
(or simply an ASCII text file)
Gene identifiers(may be in aseparate file)
Excel workbook containinga single worksheet
(or simply an ASCII text file)
Experimentdescriptors
Excel workbook containinga single worksheet
(or simply an ASCII text file)
CollateCollated data
WorkbookExcel workbook withmultiple worksheets
User definedgene listsOne or more
ASCII text files
Run analyses
Filter
33
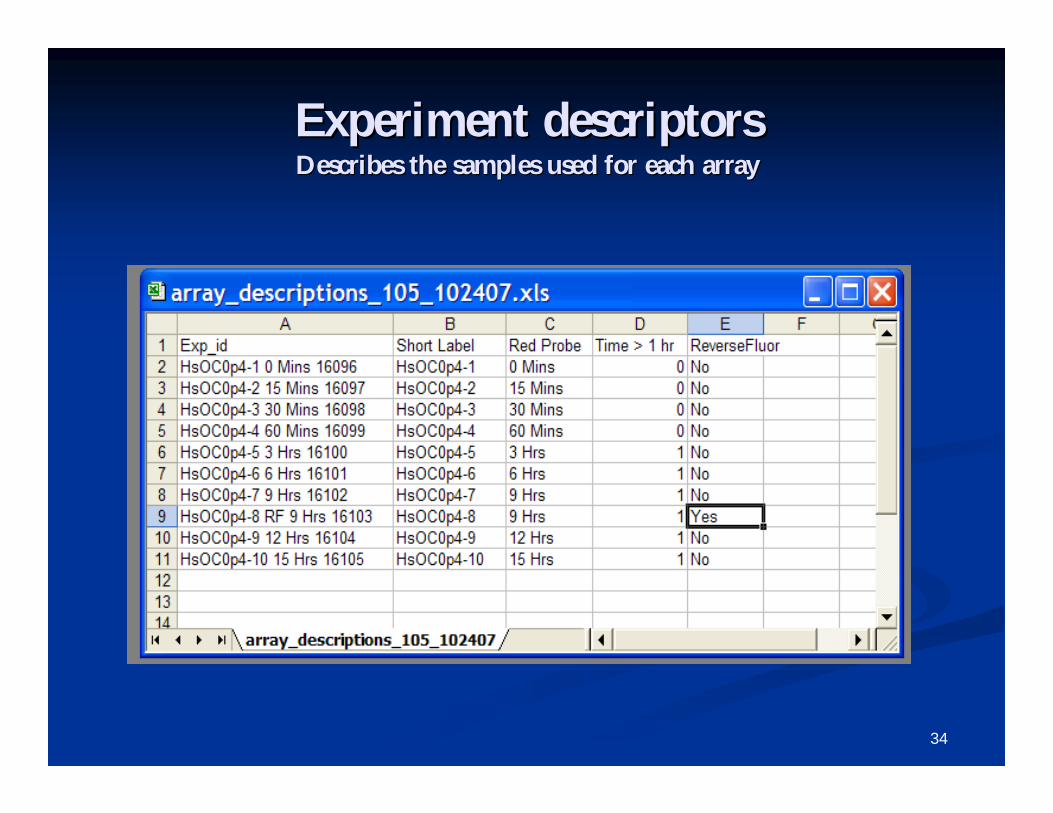
Experiment (Array) descriptorsExperiment (Array) descriptors An experiment descriptors file describes the samples used for eaAn experiment descriptors file describes the samples used for each ch
array, and is mandatory.array, and is mandatory. For multiFor multi--chip sets, use one line per sample, not per array.chip sets, use one line per sample, not per array. After the header row, each row in this file represents one arrayAfter the header row, each row in this file represents one array or or
sample, and each column represents one descriptor variable.sample, and each column represents one descriptor variable. First column contains array id, which is matched against file naFirst column contains array id, which is matched against file names mes
when expression data is in separate files format.when expression data is in separate files format. Subsequent columns contain descriptions, phenotype class labels,Subsequent columns contain descriptions, phenotype class labels,
patient outcome, and other sample or experiment information.patient outcome, and other sample or experiment information. The descriptor variable columns may include information such as:The descriptor variable columns may include information such as:
patient ids, class labels, technical replicate indicators, reverpatient ids, class labels, technical replicate indicators, reverse fluor se fluor indicators, and other variables used for labeling purposes.indicators, and other variables used for labeling purposes.
A COPY of the original experiment descriptor file will appear inA COPY of the original experiment descriptor file will appear in the the experiment descriptor sheet of the collated project workbook. Texperiment descriptor sheet of the collated project workbook. The he experiment descriptor sheet in the collated project workbook mayexperiment descriptor sheet in the collated project workbook may be be further edited as you analyze the data.further edited as you analyze the data.
34
Experiment descriptorsExperiment descriptorsDescribes the samples used for each arrayDescribes the samples used for each array
35
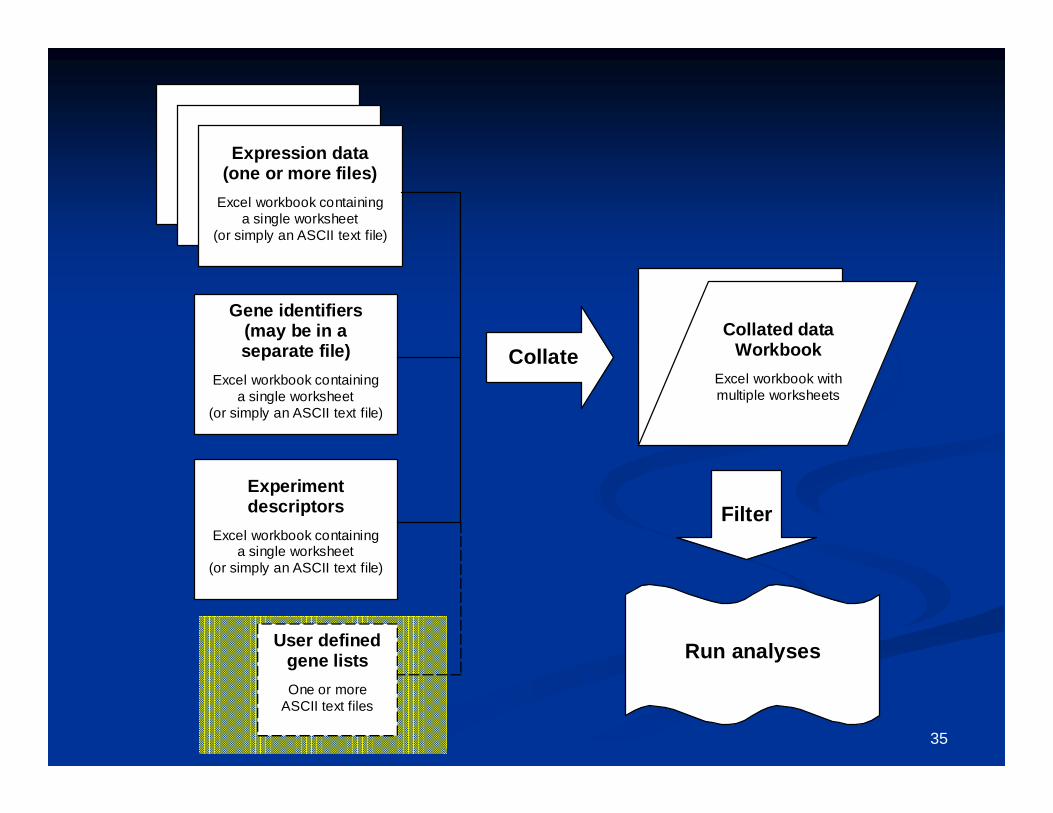
Expression data(one or more files)
Excel workbook containinga single worksheet
(or simply an ASCII text file)
Gene identifiers(may be in aseparate file)
Excel workbook containinga single worksheet
(or simply an ASCII text file)
Experimentdescriptors
Excel workbook containinga single worksheet
(or simply an ASCII text file)
CollateCollated data
WorkbookExcel workbook withmultiple worksheets
User definedgene listsOne or more
ASCII text files
Run analyses
Filter
36
Gene listsGene lists Genelists are used for annotation and for defining subsets for aGenelists are used for annotation and for defining subsets for analysis. nalysis.
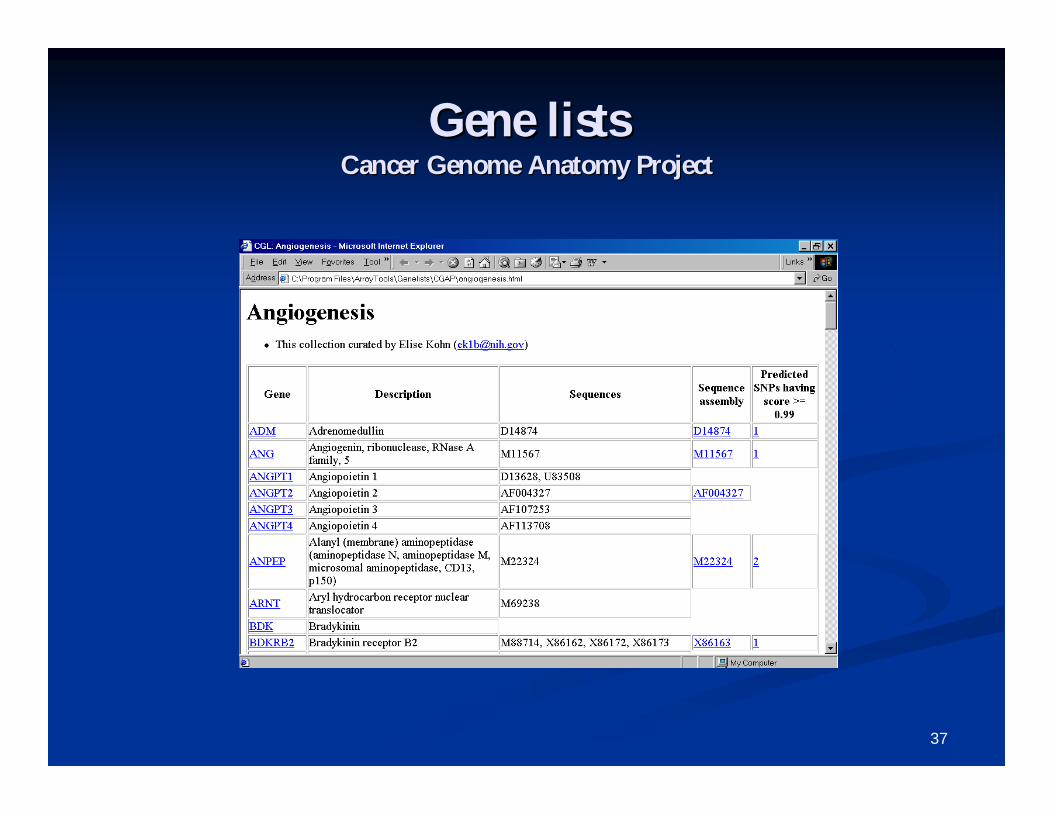
These files are located in the ArrayTools installation folder.These files are located in the ArrayTools installation folder. Two types of genelists: CGAP, and userTwo types of genelists: CGAP, and user--defineddefined CGAP (Cancer Genome Anatomy Project) genelists are preCGAP (Cancer Genome Anatomy Project) genelists are pre--loaded with loaded with
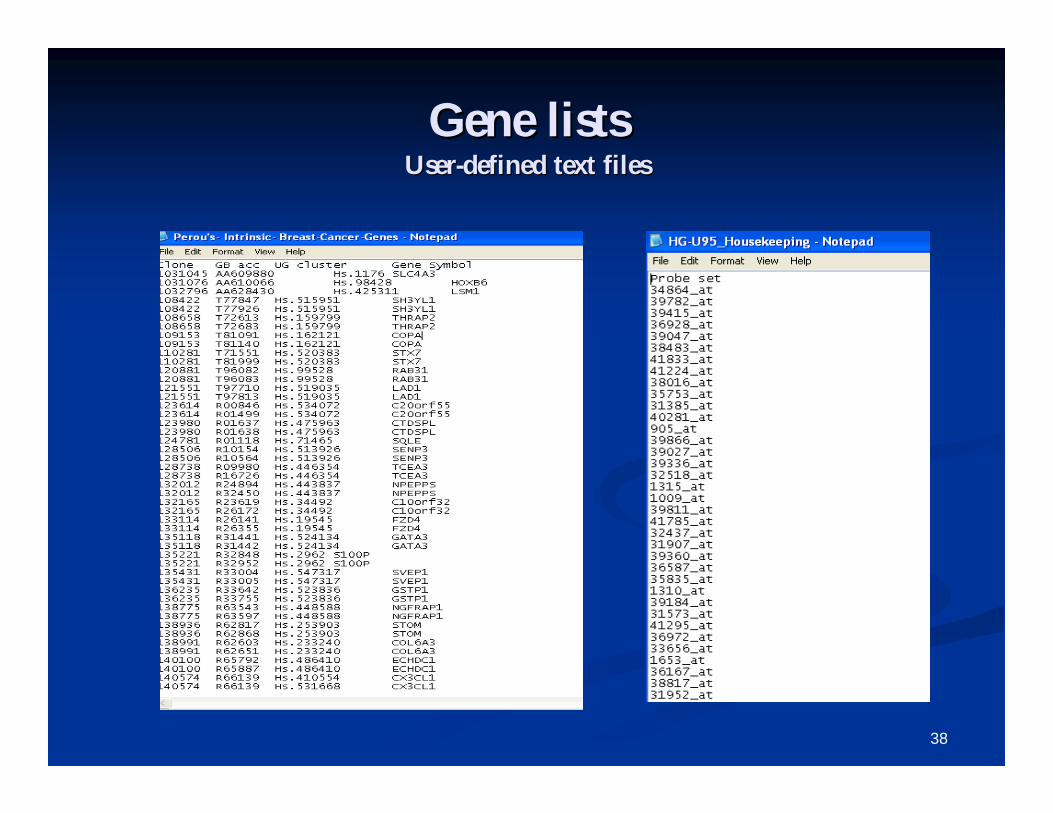
BRBBRB--ArrayTools.ArrayTools. UserUser--defined genelists are simply text files which the user creates, defined genelists are simply text files which the user creates,
containing a label specifying the type of identifier, followed bcontaining a label specifying the type of identifier, followed by a list of y a list of gene identifiers. The file should be appropriately named to indgene identifiers. The file should be appropriately named to indicate icate what type of genes are in the list. Some userwhat type of genes are in the list. Some user--defined genelists are defined genelists are automatically produced as the result of an analysis, such as claautomatically produced as the result of an analysis, such as class ss comparison, class prediction, survival analysis, and hierarchicacomparison, class prediction, survival analysis, and hierarchical l clustering of genes.clustering of genes.
UserUser--defined genelists are stored in the defined genelists are stored in the ““projectproject”” folder (for project folder (for project specific) or ArrayTools folder (visible to all projects.)specific) or ArrayTools folder (visible to all projects.)
37
Gene listsGene listsCancer Genome Anatomy ProjectCancer Genome Anatomy Project
38
Gene listsGene listsUserUser--defined text filesdefined text files
39
Expression data(one or more files)
Excel workbook containinga single worksheet
(or simply an ASCII text file)
Gene identifiers(may be in aseparate file)
Excel workbook containinga single worksheet
(or simply an ASCII text file)
Experimentdescriptors
Excel workbook containinga single worksheet
(or simply an ASCII text file)
CollateCollated data
WorkbookExcel workbook withmultiple worksheets
User definedgene listsOne or more
ASCII text files
Run analyses
Filter
40
Specify data using theSpecify data using thecollate dialog formcollate dialog form
Expression data:Expression data: Specify the expression data Specify the expression data file (or folder), and data columns within the file (or folder), and data columns within the data file(s)data file(s)
Gene identifiers:Gene identifiers: Specify the file, and columns Specify the file, and columns containing the identifiers (specify containing the identifiers (specify hyperlinkable gene identifiers separately)hyperlinkable gene identifiers separately)
Experiment descriptors:Experiment descriptors: Specify the file, and Specify the file, and reverse fluor indicators (if any)reverse fluor indicators (if any)
41
Automatic data importersAutomatic data importers General format data:General format data: The data import wizard can The data import wizard can
be used to guide you through the specification of be used to guide you through the specification of the data componentsthe data components
mAdb data archives:mAdb data archives: Please see separate handout Please see separate handout for specific instructions on downloading the for specific instructions on downloading the formatted archive from mAdb.formatted archive from mAdb.
GenePix:GenePix: Specify the folder containing the .GPR Specify the folder containing the .GPR files and in addition you can import gene files and in addition you can import gene identifiers from the .GAL or .GPR fileidentifiers from the .GAL or .GPR file
Affymetrix data:Affymetrix data: Automatically imports data by Automatically imports data by searching for searching for ““Probe Set NameProbe Set Name””, , ““SignalSignal”” (or (or ““Avg Avg DiffDiff””), and ), and ““DetectionDetection”” (or (or ““Abs_CallAbs_Call””) column ) column header labels. For complete details please refer to header labels. For complete details please refer to the Userthe User’’s Manual.s Manual.
42
Affymetrix CEL file importation• For importing Affymetrix CEL files, go to the following
menu items: (Data Import Wizard)• You will need to browse for a data folder containing the
.CEL files, and provide an Experiment Descriptors file. Gene identifiers will be imported automatically from the BRB server.
• This utility currently uses the RMA/GC-RMA functions included in the ‘affy’/’gcrma’ package of BioConductor. Future versions of BRB-ArrayTools will include other methods for computing expression summaries.
• Additionally can compute MAS5.0 summaries from .CEL files.
• For large number of arrays (more than 100), a new method called ‘almostRMA’ is available that avoids previous memory limitations.
43
Recently ImplementedRecently Implemented
Can Can automatically import a GDS dataset from the NCBI automatically import a GDS dataset from the NCBI Gene Expression Omnibus (GEO) database into BRBGene Expression Omnibus (GEO) database into BRB--ArrayTools.ArrayTools.
Can directly import dual channel Agilent data into BRBCan directly import dual channel Agilent data into BRB--ArrayTools using the data import wizard.ArrayTools using the data import wizard.
Ability to import illumina data using the data import wizard Ability to import illumina data using the data import wizard with the lumi package.with the lumi package.

44
Part III:Part III:
The collated project The collated project workbookworkbook
45
Pomeroy DatasetPomeroy Dataset
On the DesktopOn the Desktop, browse for the folder called , browse for the folder called ““ BRBBRB--ArrayToolsArrayTools--ClassClass””..
Under this folder, look for the subUnder this folder, look for the sub--folder folder ““PomeroyPomeroy””..
In this folder there are two files namely:In this folder there are two files namely:Dataset_A2_multiple_tumor_samples.txt Dataset_A2_multiple_tumor_samples.txt
ExpDescrMedulo.xlsExpDescrMedulo.xls
The The Dataset_A2_multiple_tumor samples.txtDataset_A2_multiple_tumor samples.txt contains the contains the raw expression MAS5.0 summary values for all the arrays.raw expression MAS5.0 summary values for all the arrays.
The The ExpDescrMedulo.xlsExpDescrMedulo.xls contains the experiment contains the experiment descriptor file.descriptor file.
46
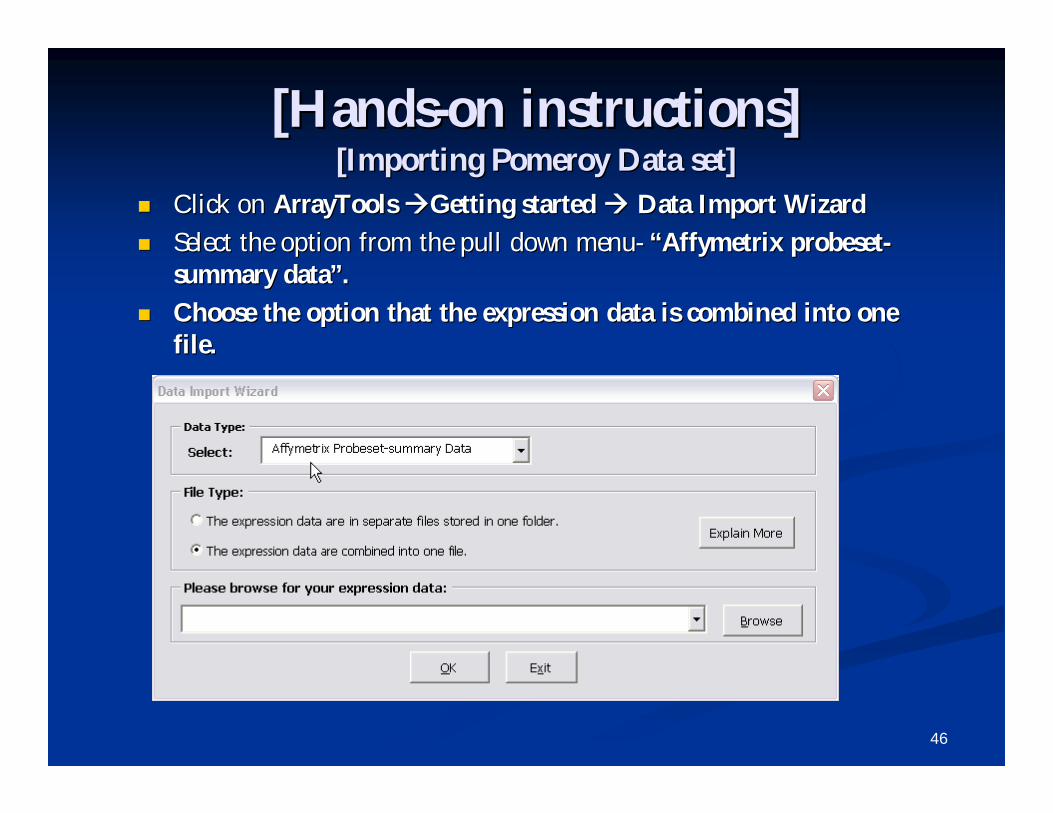
[Hands[Hands--on instructions]on instructions][Importing Pomeroy Data set][Importing Pomeroy Data set]
Click on Click on ArrayTools ArrayTools Getting started Getting started Data Import WizardData Import Wizard
Select the option from the pull down menuSelect the option from the pull down menu-- ““AffymetrixAffymetrix probesetprobeset--summary datasummary data””..
Choose the option that the expression data is combined into one Choose the option that the expression data is combined into one file.file.
47
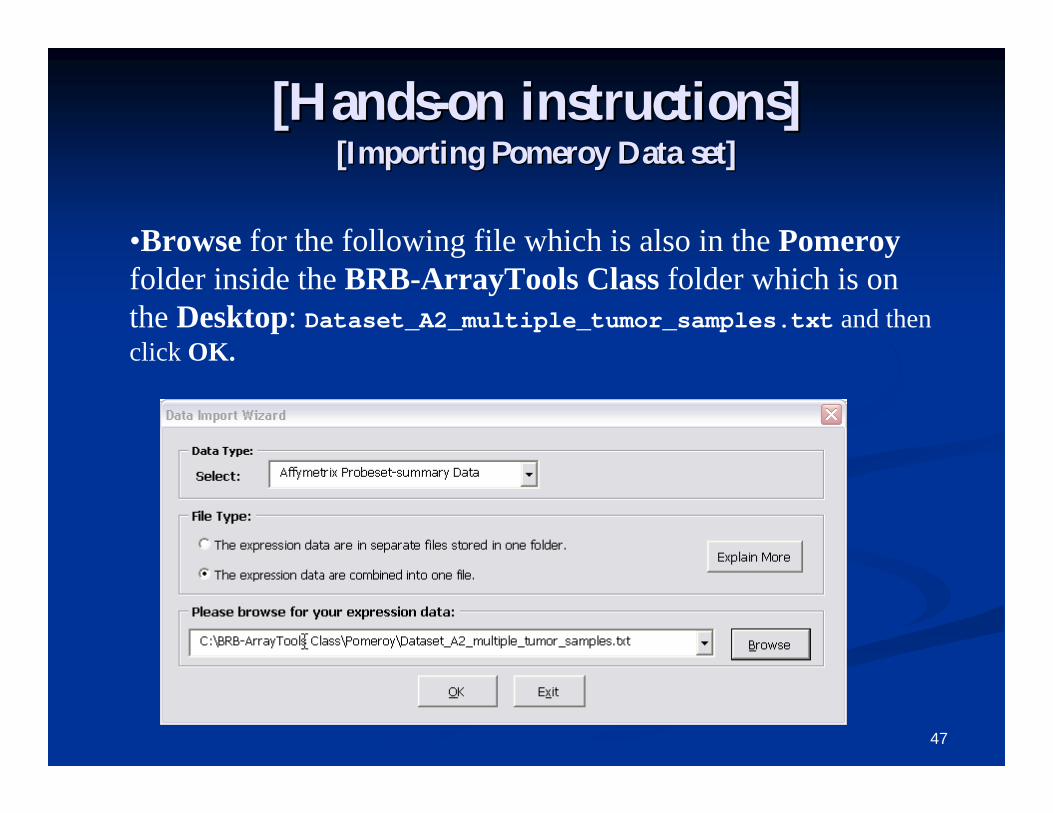
[Hands[Hands--on instructions]on instructions][Importing Pomeroy Data set][Importing Pomeroy Data set]
•Browse for the following file which is also in the Pomeroyfolder inside the BRB-ArrayTools Class folder which is on the Desktop: Dataset_A2_multiple_tumor_samples.txt and then click OK.
48
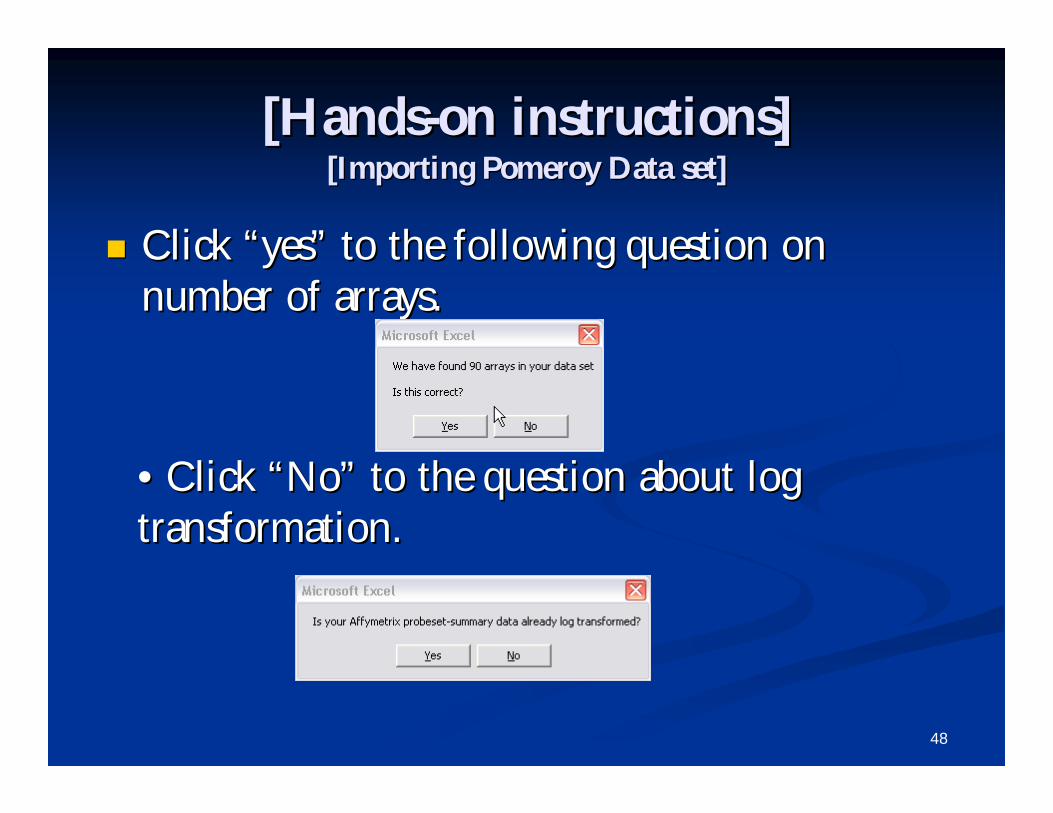
[Hands[Hands--on instructions]on instructions][Importing Pomeroy Data set][Importing Pomeroy Data set]
Click Click ““yesyes”” to the following question on to the following question on number of arrays.number of arrays.
••Click Click ““NoNo”” to the question about log to the question about log transformation.transformation.
49
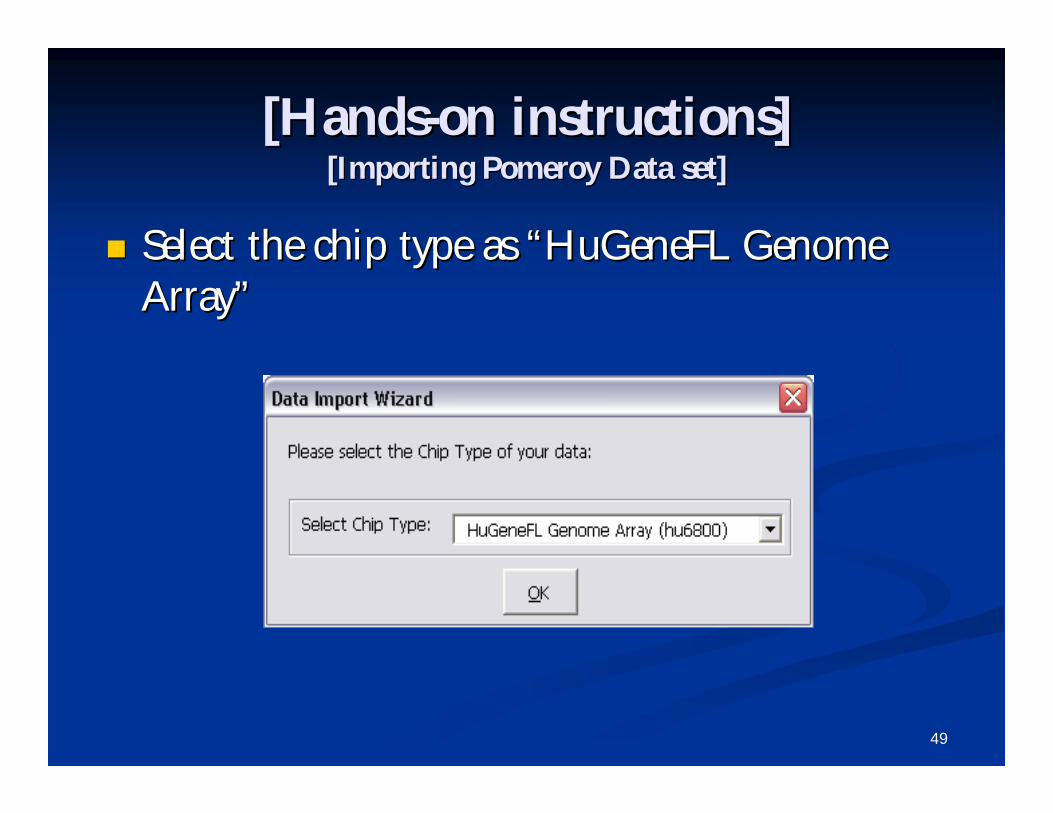
[Hands[Hands--on instructions]on instructions][Importing Pomeroy Data set][Importing Pomeroy Data set]
Select the chip type as Select the chip type as ““HuGeneFL Genome HuGeneFL Genome ArrayArray””
50
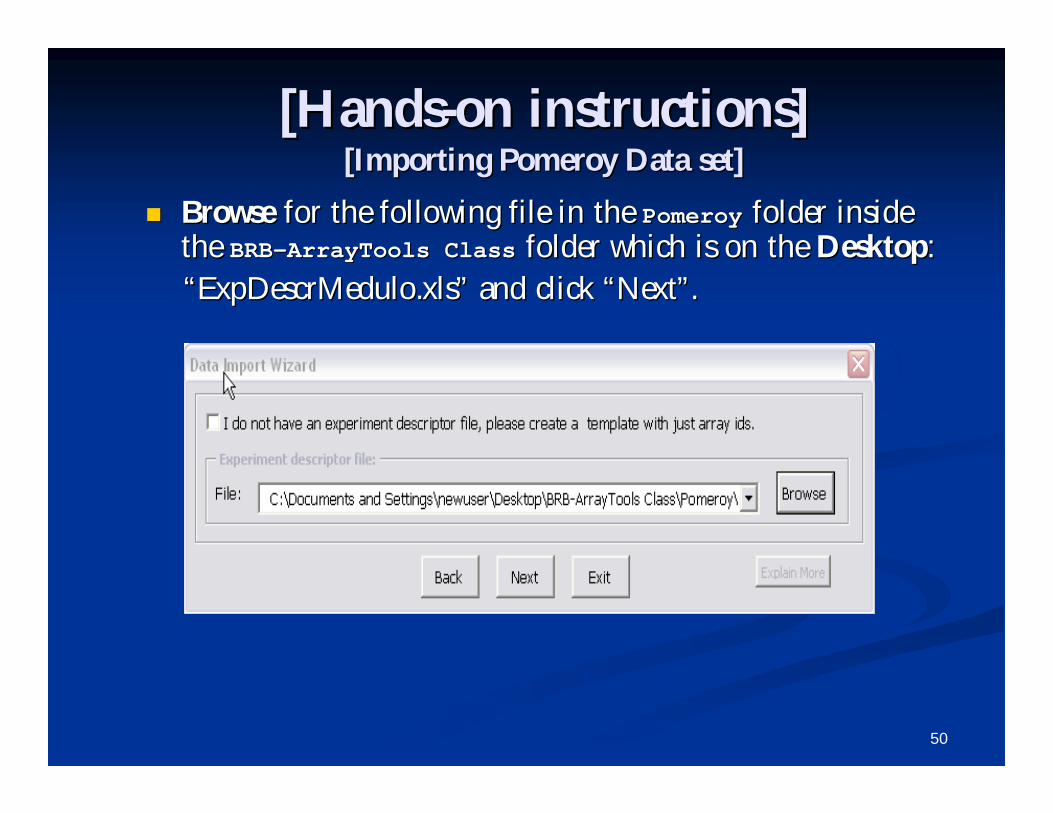
[Hands[Hands--on instructions]on instructions][Importing Pomeroy Data set][Importing Pomeroy Data set]
BrowseBrowse for the following file in the for the following file in the PomeroyPomeroy folder inside folder inside the the BRBBRB--ArrayTools ClassArrayTools Class folder which is on the folder which is on the DesktopDesktop::““ExpDescrMedulo.xlsExpDescrMedulo.xls”” and click and click ““NextNext””..
51
[Hands[Hands--on instructions]on instructions][Importing Pomeroy Data set][Importing Pomeroy Data set]
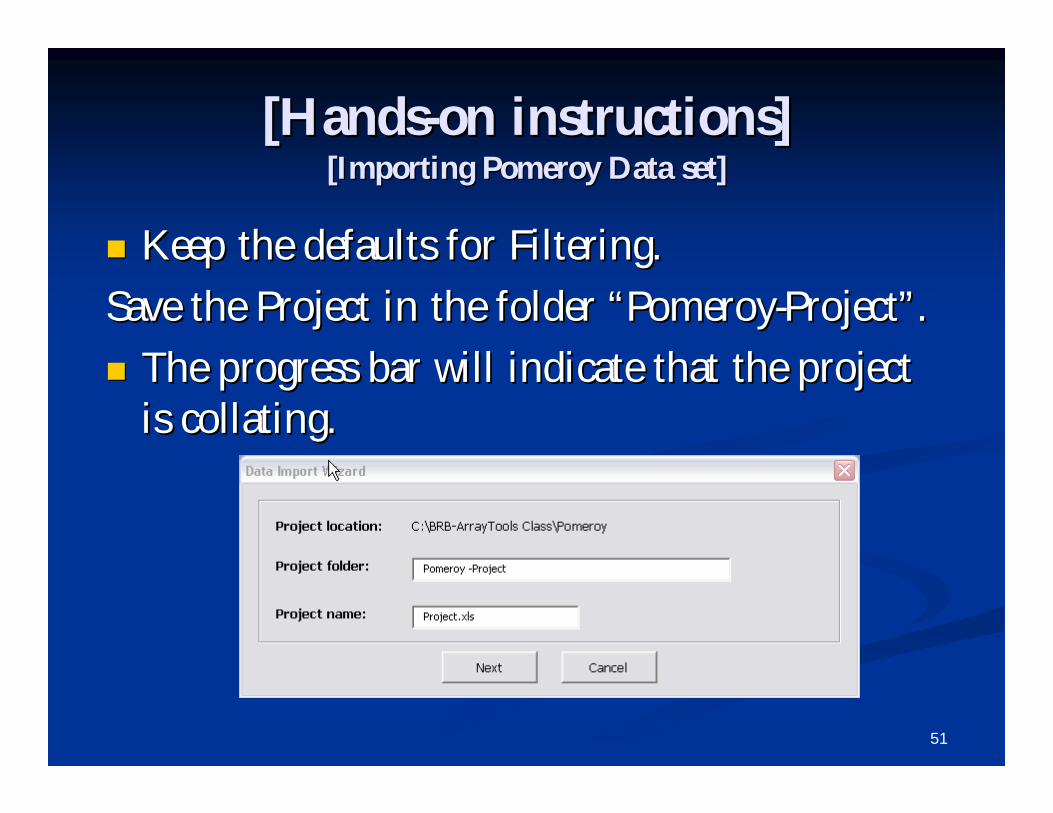
Keep the defaults for Filtering. Keep the defaults for Filtering.
Save the Project in the folder Save the Project in the folder ““PomeroyPomeroy--ProjectProject””..
The progress bar will indicate that the project The progress bar will indicate that the project is collating.is collating.
52
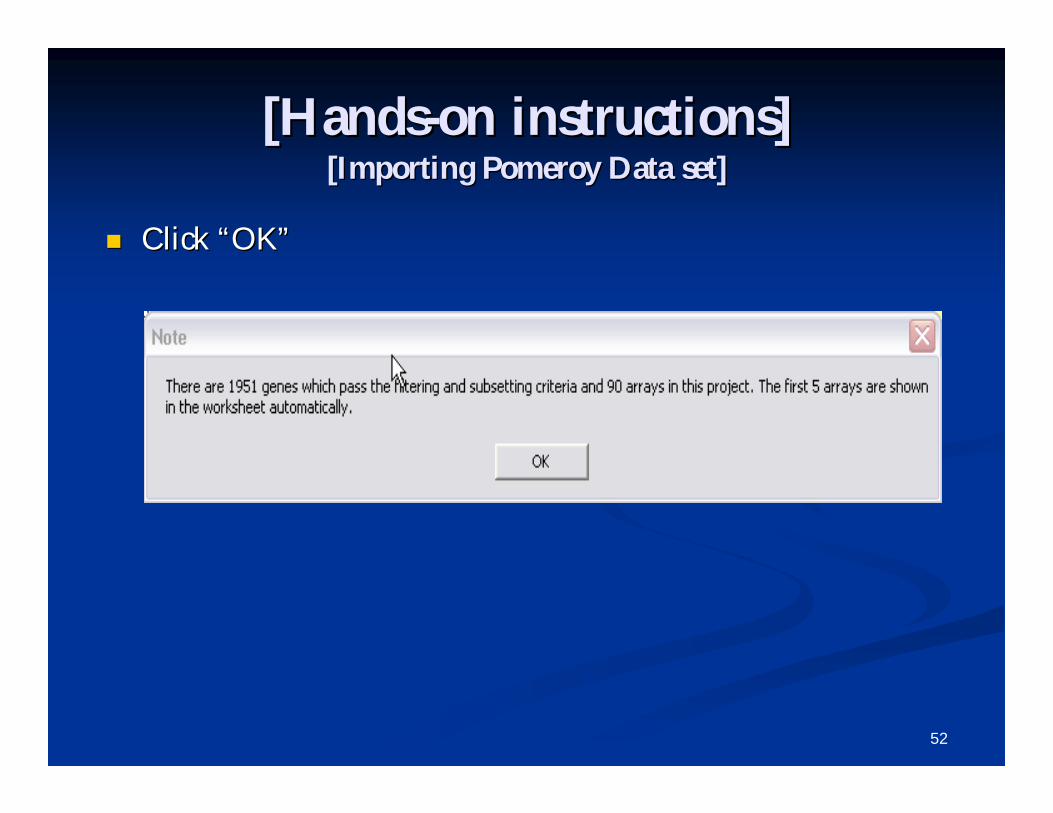
[Hands[Hands--on instructions]on instructions][Importing Pomeroy Data set][Importing Pomeroy Data set]
Click Click ““OKOK””
53
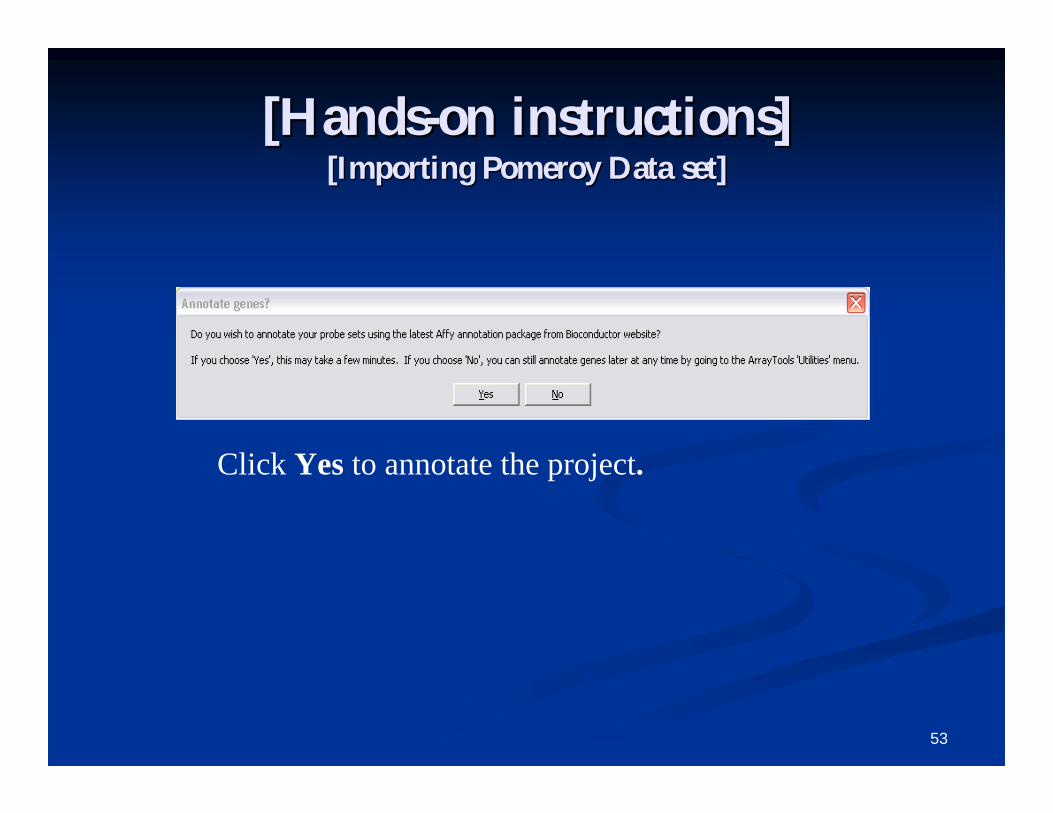
[Hands[Hands--on instructions]on instructions][Importing Pomeroy Data set][Importing Pomeroy Data set]
Click Yes to annotate the project.
54
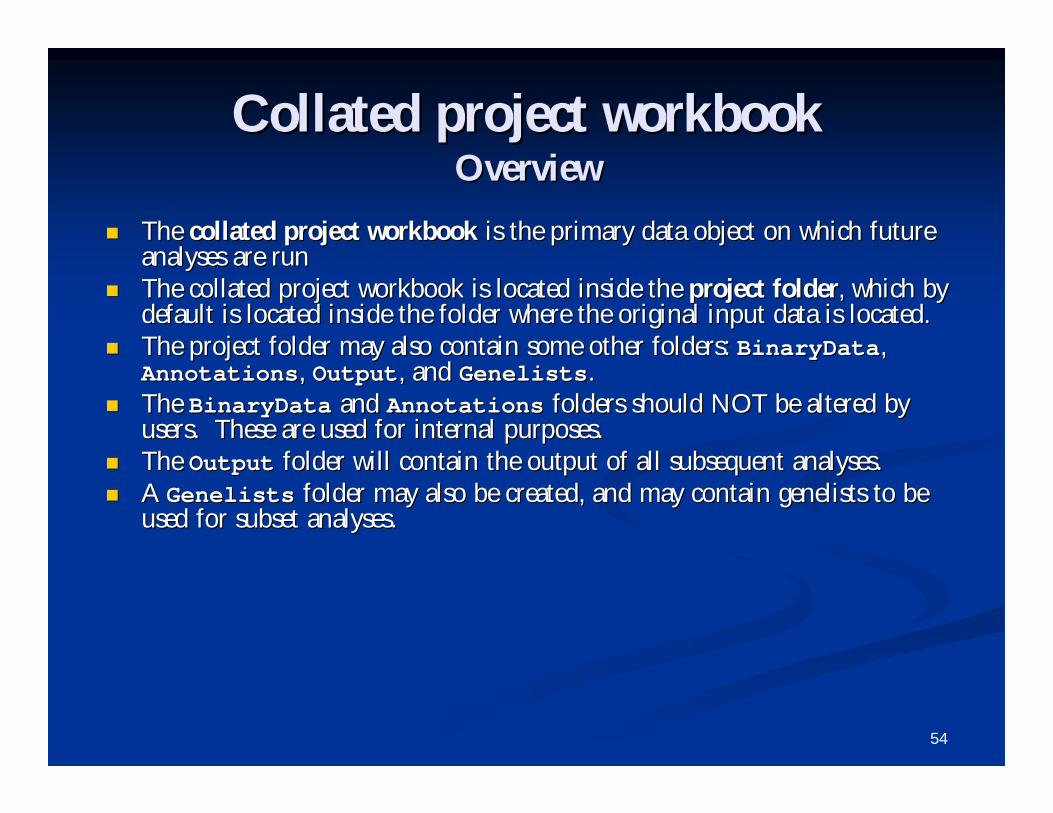
Collated project workbookCollated project workbookOverviewOverview
The The collated project workbookcollated project workbook is the primary data object on which future is the primary data object on which future analyses are runanalyses are run
The collated project workbook is located inside the The collated project workbook is located inside the project folderproject folder, which by , which by default is located inside the folder where the original input dadefault is located inside the folder where the original input data is located.ta is located.
The project folder may also contain some other folders: The project folder may also contain some other folders: BinaryDataBinaryData, , AnnotationsAnnotations, , OutputOutput, and , and GenelistsGenelists..
The The BinaryDataBinaryData and and AnnotationsAnnotations folders should NOT be altered by folders should NOT be altered by users. These are used for internal purposes.users. These are used for internal purposes.
The The OutputOutput folder will contain the output of all subsequent analyses.folder will contain the output of all subsequent analyses. A A GenelistsGenelists folder may also be created, and may contain genelists to be folder may also be created, and may contain genelists to be
used for subset analyses.used for subset analyses.
55
The collated project workbookThe collated project workbook
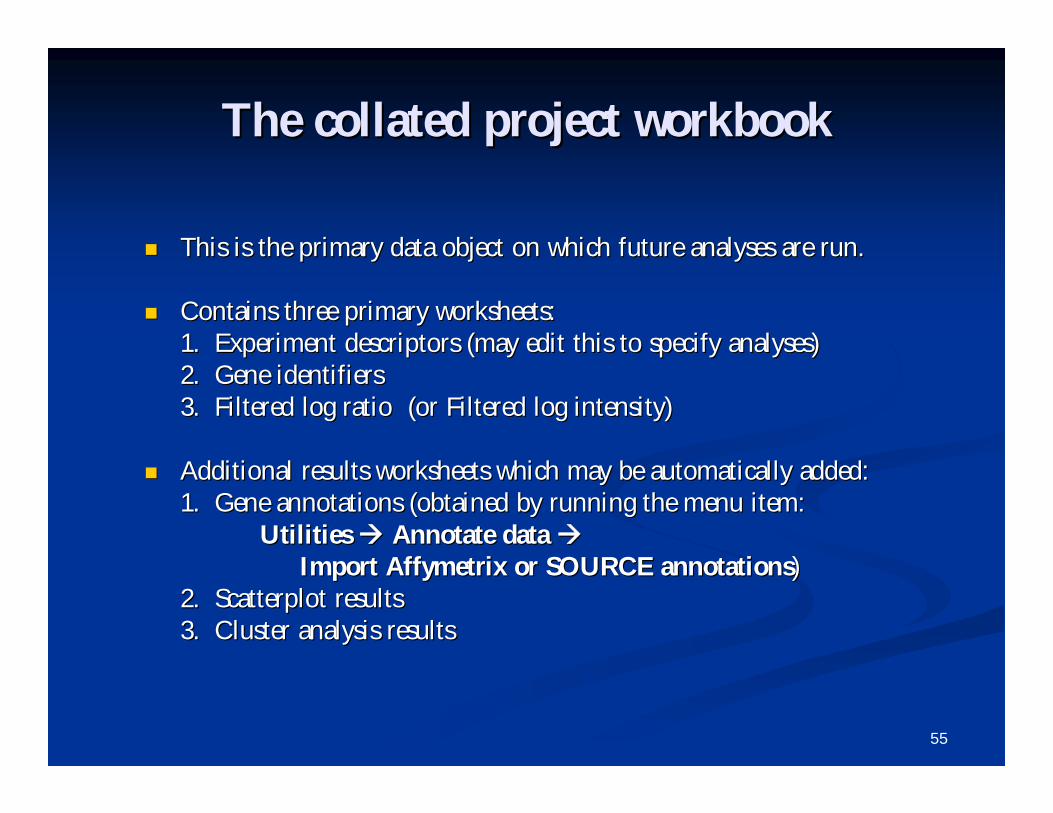
This is the primary data object on which future analyses are runThis is the primary data object on which future analyses are run..
Contains three primary worksheets:Contains three primary worksheets:1. Experiment descriptors (may edit this to specify analyses)1. Experiment descriptors (may edit this to specify analyses)2. Gene identifiers2. Gene identifiers3. Filtered log ratio (or Filtered log intensity)3. Filtered log ratio (or Filtered log intensity)
Additional results worksheets which may be automatically added:Additional results worksheets which may be automatically added:1. Gene annotations (obtained by running the menu item:1. Gene annotations (obtained by running the menu item:
Utilities Utilities Annotate data Annotate data Import Affymetrix or SOURCE annotationsImport Affymetrix or SOURCE annotations))
2. Scatterplot results2. Scatterplot results3. Cluster analysis results3. Cluster analysis results
56
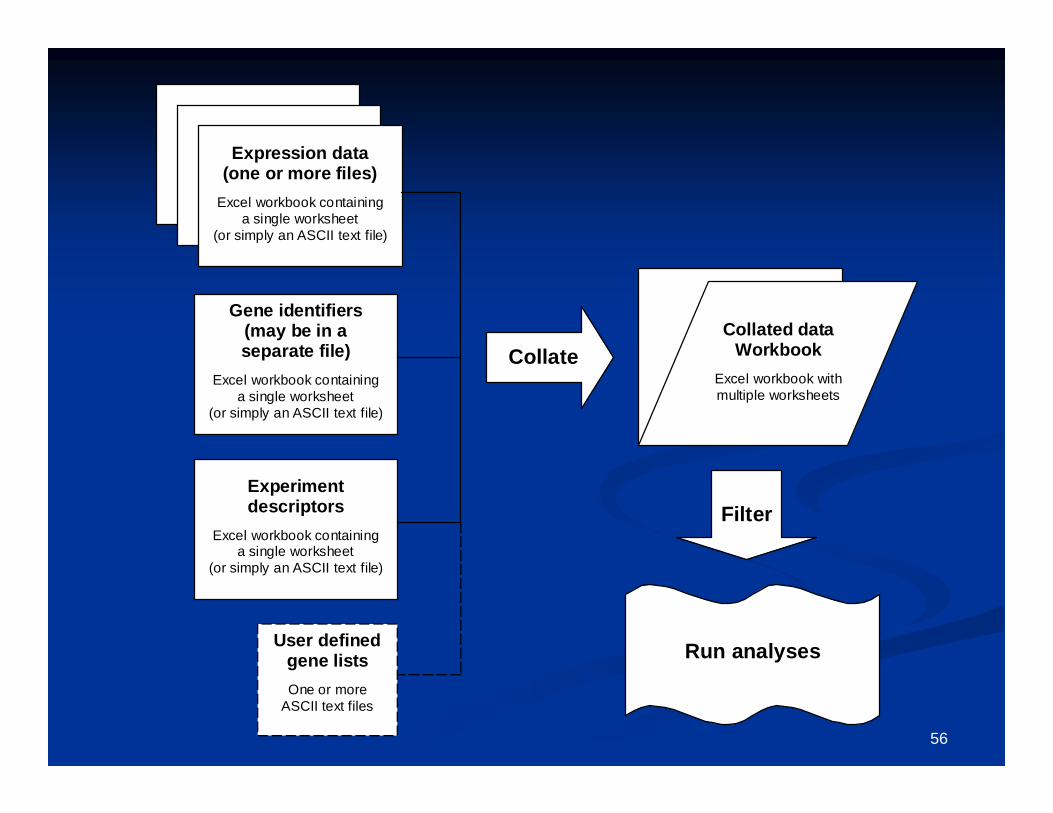
Expression data(one or more files)
Excel workbook containinga single worksheet
(or simply an ASCII text file)
Gene identifiers(may be in aseparate file)
Excel workbook containinga single worksheet
(or simply an ASCII text file)
Experimentdescriptors
Excel workbook containinga single worksheet
(or simply an ASCII text file)
CollateCollated data
WorkbookExcel workbook withmultiple worksheets
User definedgene listsOne or more
ASCII text files
Run analyses
Filter
57
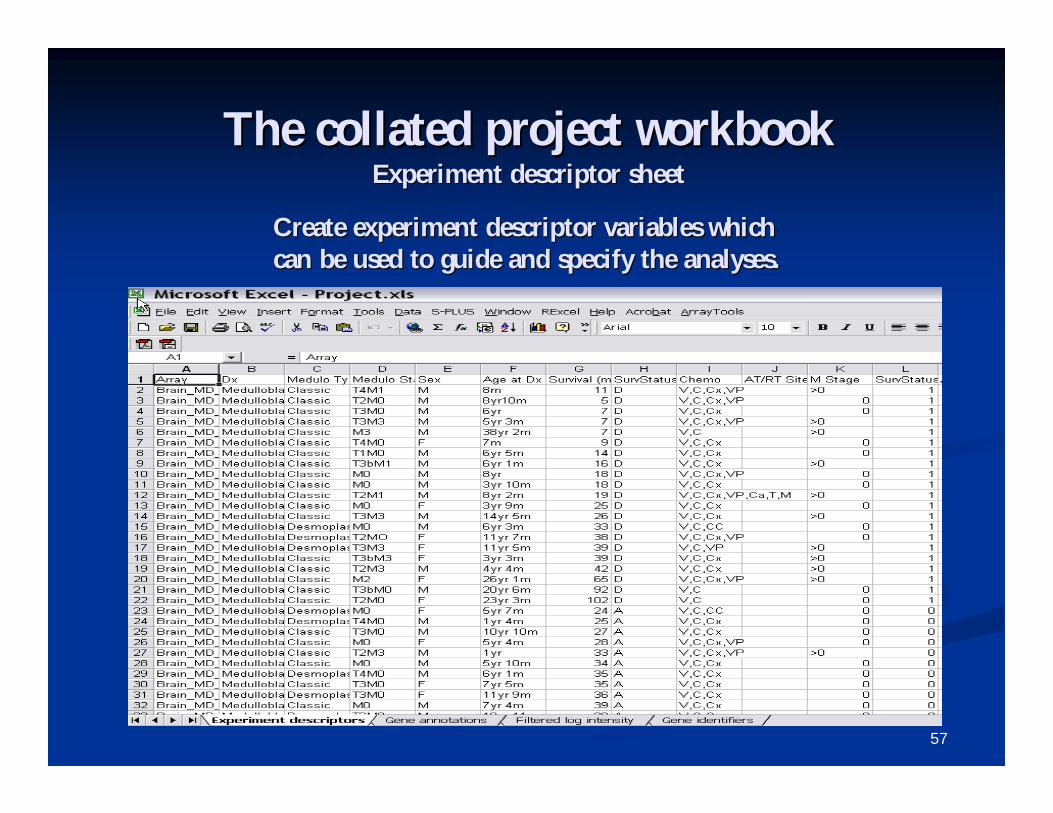
The collated project workbookThe collated project workbookExperiment descriptor sheetExperiment descriptor sheet
Create experiment descriptor variables which Create experiment descriptor variables which can be used to guide and specify the analyses.can be used to guide and specify the analyses.
58
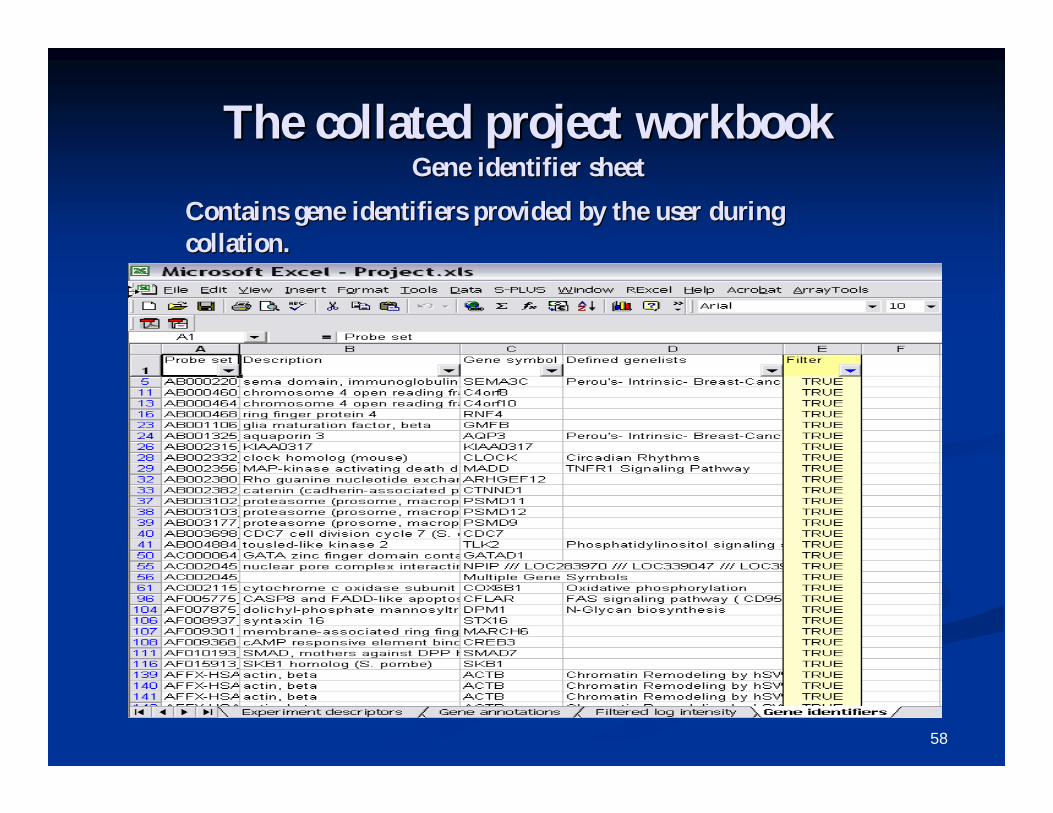
The collated project workbookThe collated project workbookGene identifier sheetGene identifier sheet
Contains gene identifiers provided by the user during Contains gene identifiers provided by the user during collation.collation.
59
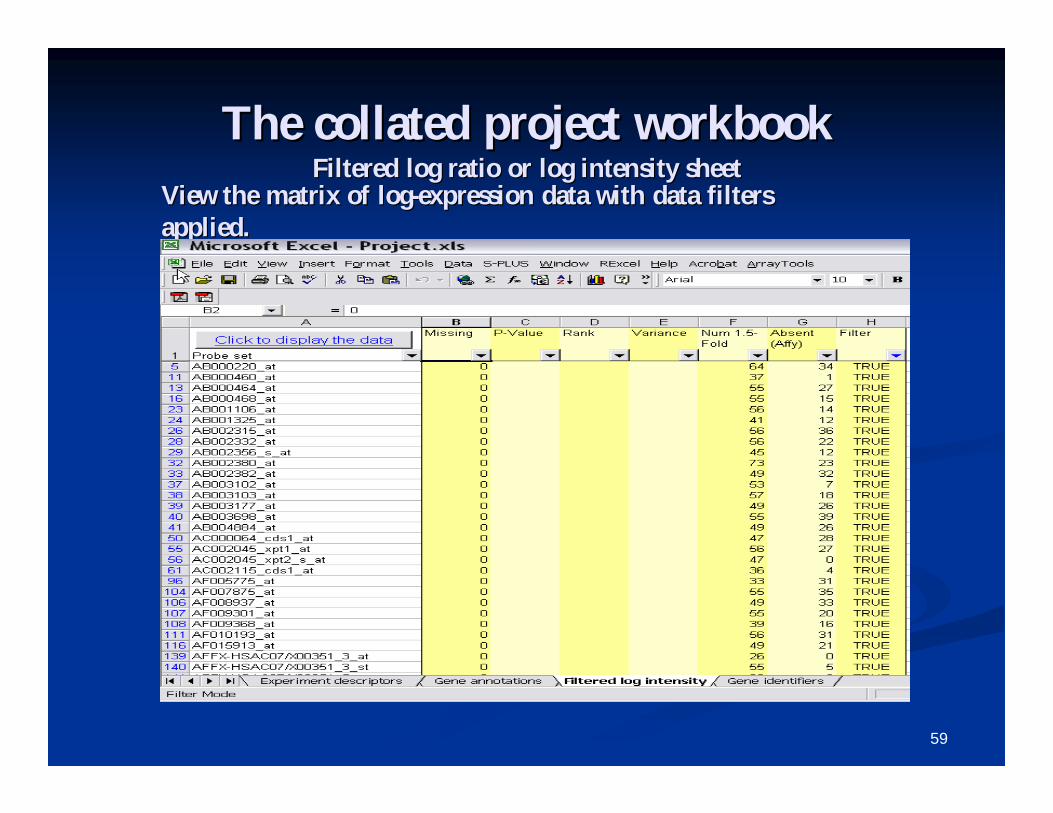
The collated project workbookThe collated project workbookFiltered log ratio or log intensity sheetFiltered log ratio or log intensity sheet
View the matrix of logView the matrix of log--expression data with data filters expression data with data filters applied.applied.
60
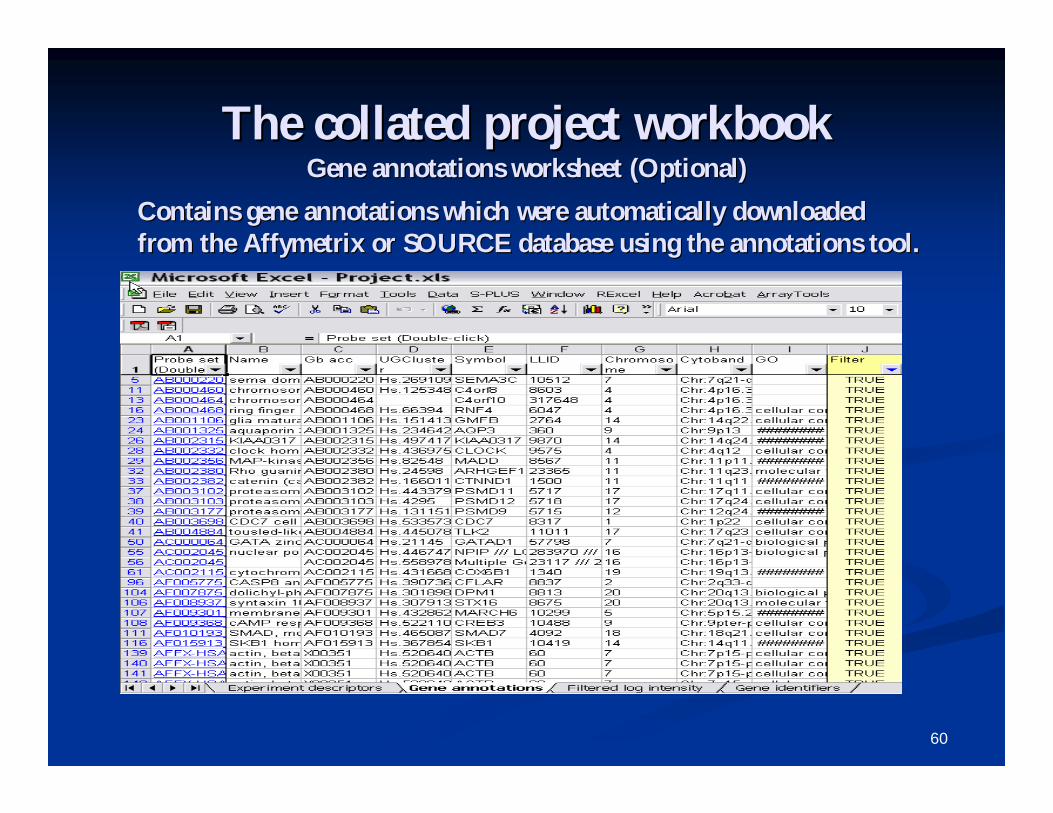
The collated project workbookThe collated project workbookGene annotations worksheet (Optional)Gene annotations worksheet (Optional)
Contains gene annotations which were automatically downloaded Contains gene annotations which were automatically downloaded from the Affymetrix or SOURCE database using the annotations toofrom the Affymetrix or SOURCE database using the annotations tool.l.
61
Part IV:Part IV:
Data filtering andData filtering andnormalization optionsnormalization options
62
[Hands[Hands--on instructions]on instructions][Data filtering[Data filtering--Pomeroy]Pomeroy]
1.1. Click on Click on ArrayTools ArrayTools ReRe--Filter, normalize and Filter, normalize and subset the datasubset the data..
2.2. Click on the four buttons Click on the four buttons Spot filterSpot filter, , NormalizationNormalization, , Gene filter and Gene SubsetGene filter and Gene Subset at the at the TOP of the form, to see the available options and TOP of the form, to see the available options and view the current settings applied on the dataset. view the current settings applied on the dataset.
3.3. By clicking By clicking ““OKOK”” the default filtering and the default filtering and normalization is performed on the data set.normalization is performed on the data set.
63
Data filtering optionsData filtering optionsSingleSingle--Channel: Spot filterChannel: Spot filter
Intensity filter:Intensity filter: May filter out spots with low May filter out spots with low intensity in single channel or threshold low intensity in single channel or threshold low intensity in forming log intensities.intensity in forming log intensities.
Detection CallDetection Call: Exclude a probeset if the : Exclude a probeset if the Detection call value is Detection call value is ““AA””,,””MM”” ,,““PP”” or or ““No No CallCall””..
Dual channel: Background correction and Dual channel: Background correction and averaging replicate spots can be performed.averaging replicate spots can be performed.
64
Data filtering optionsData filtering optionsNormalization and truncationNormalization and truncation
Normalization and truncation steps are applied Normalization and truncation steps are applied afterafterdata has been spotdata has been spot--filtered, but filtered, but beforebefore screening out screening out genesgenes
Arrays are normalized before outlying expression Arrays are normalized before outlying expression levels are truncated.levels are truncated.
Purpose of truncation is primarily to prevent Purpose of truncation is primarily to prevent extremely large ratios from being formed by small extremely large ratios from being formed by small denominators in dualdenominators in dual--channel data. The truncation channel data. The truncation option is useful if the dualoption is useful if the dual--channel intensities have channel intensities have not been thresholded.not been thresholded.
65
Data filtering optionsData filtering optionsData transformation optionsData transformation options
Normalization:Normalization:For singleFor single--channel data:channel data: Default option is Default option is
to medianto median--center all arrays to a reference center all arrays to a reference array, based on all genes or only a set of array, based on all genes or only a set of housekeeping genes. The reference array housekeeping genes. The reference array may be explicitly chosen, or a may be explicitly chosen, or a ““medianmedian””array can be automatically found.array can be automatically found.
Truncation:Truncation: Truncate extreme values (large Truncate extreme values (large loglog--intensities for singleintensities for single--channel data, or channel data, or large absolute loglarge absolute log--ratios for dual channel ratios for dual channel data)data)
66
Data filtering optionsData filtering optionsGene filters: Gene variationGene filters: Gene variation
FoldFold--change filter:change filter: Specify a minimum Specify a minimum percentage of logpercentage of log--expression values which must expression values which must meet a specified foldmeet a specified fold--change criteriachange criteria
LogLog--ratio (or logratio (or log--intensity) variation filterintensity) variation filter::Screen genes which do not vary much over the Screen genes which do not vary much over the set of samples:set of samples:
1. Significance criterion compares the 1. Significance criterion compares the variance of each gene against the variance of each gene against the ““averageaverage”” genegene
2. Percentile criterion screens a specified2. Percentile criterion screens a specifiedpercentage of genes with smallest variancepercentage of genes with smallest variance
67
Data filtering optionsData filtering optionsGene filters: Gene qualityGene filters: Gene quality
Missing value filter:Missing value filter: Screens out genes which Screens out genes which contain too many missing values over the set of contain too many missing values over the set of samplessamples
Percent absent filter:Percent absent filter: For Affymetrix data, can For Affymetrix data, can filter out a probeset if too many expression filter out a probeset if too many expression values had an Absent callvalues had an Absent call
Minimum Intensity:Minimum Intensity: This option is only This option is only available for single channel data. It filters out available for single channel data. It filters out genes whose 50genes whose 50thth percentile normalized log percentile normalized log intensity is less than the log of the user defined intensity is less than the log of the user defined value.value.
68
Data filtering optionsData filtering optionsGene subsetsGene subsets
Select genelists for analysis:Select genelists for analysis: User may subset the data by User may subset the data by selecting one or more genelists to INCLUDE or selecting one or more genelists to INCLUDE or EXCLUDE. If more than one genelist is selected, then the EXCLUDE. If more than one genelist is selected, then the UNION of all genes on those genelists will be used.UNION of all genes on those genelists will be used.
Specify gene labels to exclude:Specify gene labels to exclude: User may exclude genes User may exclude genes based on gene identifier labels. For example, all genes with based on gene identifier labels. For example, all genes with ““EmptyEmpty”” in the gene description field may be excluded.in the gene description field may be excluded.
CAUTION: Gene subsetting is applied globally to the CAUTION: Gene subsetting is applied globally to the entire dataset, not just to a specific analysis.entire dataset, not just to a specific analysis.
Probe reduction: Reduce multiple probe sets per gene by Probe reduction: Reduce multiple probe sets per gene by choosing the most variably expressed or the maximally choosing the most variably expressed or the maximally expressed probe/expressed probe/probesetprobeset. .
69
Part V:Part V:
Overview of some analysis Overview of some analysis toolstools
70
Scatterplot toolsScatterplot tools Scatterplot of experiment v. experiment: Scatterplot of experiment v. experiment:
Plots intensity, geometric mean of the red Plots intensity, geometric mean of the red and green intensities, and intensity ratio on and green intensities, and intensity ratio on loglog--scale. The Mscale. The M--A plot can be implemented A plot can be implemented for twofor two--channel data as a plot of the logchannel data as a plot of the log--ratio versus the average logratio versus the average log--intensity.intensity.
Scatterplot of phenotype averages: Plots Scatterplot of phenotype averages: Plots averages over experiment classesaverages over experiment classes
Online demo Online demo http://http://linus.nci.nih.gov/PowerPointSlides/Sclinus.nci.nih.gov/PowerPointSlides/Scatterplot.wmvatterplot.wmv

71
[Optional: Hands[Optional: Hands--on instructions]on instructions][Scatterplot of phenotype averages][Scatterplot of phenotype averages]
1.1. Now click on Now click on ArrayTools ArrayTools Graphics Graphics --> > ScatterplotScatterplot Phenotype Phenotype averagesaverages..
2.2. Select the variable Select the variable DxDx as the phenotype class to average over, and then click as the phenotype class to average over, and then click OKOK..
3.3. This launches a 2This launches a 2--D and 3D and 3--D scatter plot.D scatter plot.
4.4. Right click on the 2Right click on the 2--D plot to modify scatter plot properties, select up/down D plot to modify scatter plot properties, select up/down regulated genes as well as link genes in other plots.regulated genes as well as link genes in other plots.
72
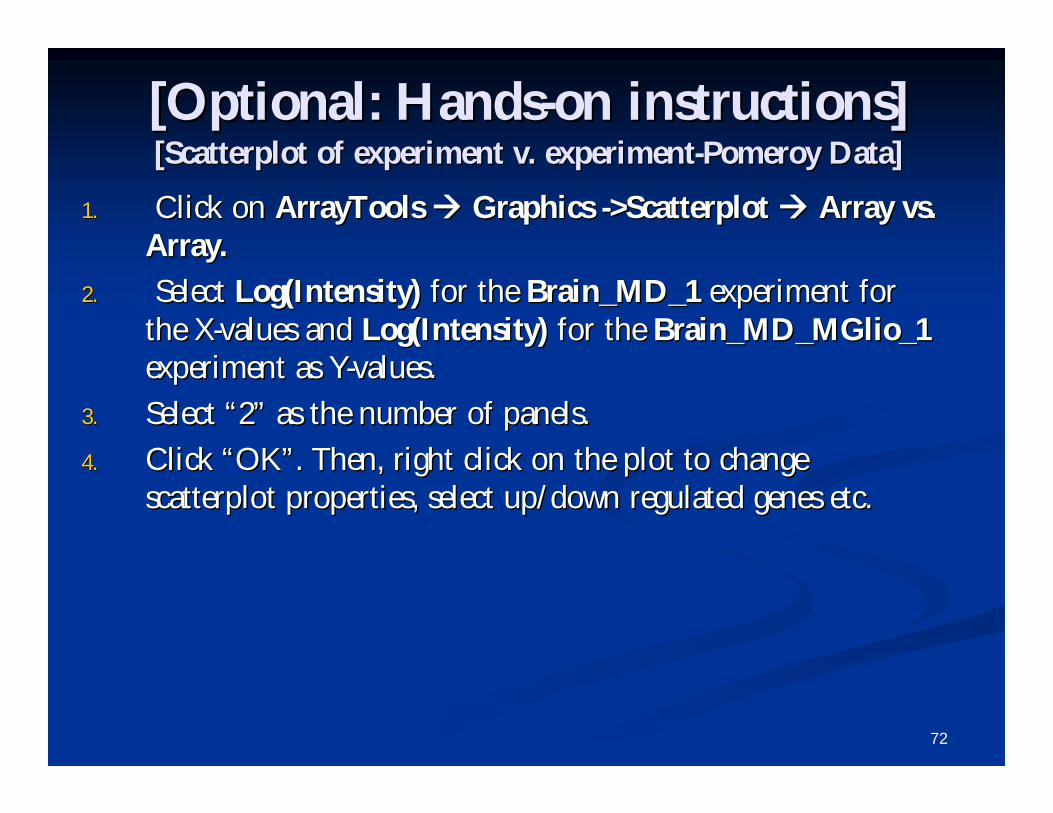
[Optional: Hands[Optional: Hands--on instructions]on instructions][Scatterplot of experiment v. experiment[Scatterplot of experiment v. experiment--Pomeroy Data]Pomeroy Data]
1.1. Click on Click on ArrayTools ArrayTools Graphics Graphics -->>ScatterplotScatterplot Array vs. Array vs. Array.Array.
2.2. Select Select Log(Intensity)Log(Intensity) for the for the Brain_MD_1Brain_MD_1 experiment for experiment for the Xthe X--values and values and Log(Intensity)Log(Intensity) for the for the Brain_MD_MGlio_1Brain_MD_MGlio_1experiment as Yexperiment as Y--values. values.
3.3. Select Select ““22”” as the number of panels.as the number of panels.
4.4. Click Click ““OKOK””. Then, right click on the plot to change . Then, right click on the plot to change scatterplotscatterplot properties, select up/down regulated genes etc.properties, select up/down regulated genes etc.
73
Analysis WizardAnalysis Wizard
Click on Click on ““ArrayToolsArrayTools”” pull down menu.pull down menu.
Select Select ““Analysis WizardAnalysis Wizard””
Our research interest is to find genes that are Our research interest is to find genes that are differentially expressed among predifferentially expressed among pre--defined defined classes of samples.classes of samples.
74
Analysis WizardAnalysis Wizard
Finding GenesFinding Genes
Finding differentially expressed genes/gene sets amongst Finding differentially expressed genes/gene sets amongst classes.classes.
PredictionPrediction
Develop a classifier for predicting the class of a sampleDevelop a classifier for predicting the class of a sample
Clustering/VisualizingClustering/Visualizing
Visualizing/Clustering of Genes and Samples.Visualizing/Clustering of Genes and Samples.
75
Finding GenesFinding Genes
Comparing classes (Comparing classes (Class ComparisonClass Comparison))
Correlated with a quantitative trait Correlated with a quantitative trait ((Quantitative Trait AnalysisQuantitative Trait Analysis))
Correlated with survival (Correlated with survival (Survival AnalysisSurvival Analysis))
Time Course Analysis (Time Course Analysis (PlugPlug--inin))
76
Tools for finding Genes/Genesets Tools for finding Genes/Genesets comparing classescomparing classes
Class Comparison Between groups of arraysClass Comparison Between groups of arrays
SAMSAM
Gene Set Expression Comparison.Gene Set Expression Comparison.
ANOVA modelsANOVA models
77
Class comparison toolClass comparison toolBetween groups of arraysBetween groups of arrays
FOR SINGLEFOR SINGLE--CHANNEL DATA, OR DUALCHANNEL DATA, OR DUAL--CHANNEL REFERENCE DESIGNS.CHANNEL REFERENCE DESIGNS.
Class comparison tool uses univariate t/FClass comparison tool uses univariate t/F--tests, tests, with multivariate permutation testswith multivariate permutation tests
Permutation tests are nonparametric, and take Permutation tests are nonparametric, and take correlation among genes into accountcorrelation among genes into account
Paired analysis optionPaired analysis option Produces a gene list which can be used for further Produces a gene list which can be used for further
analysis.analysis. Produces chromosomal distribution and GO Produces chromosomal distribution and GO
analysis if genes have already been annotated using analysis if genes have already been annotated using the Affymetrix or SOURCE database.the Affymetrix or SOURCE database.
78
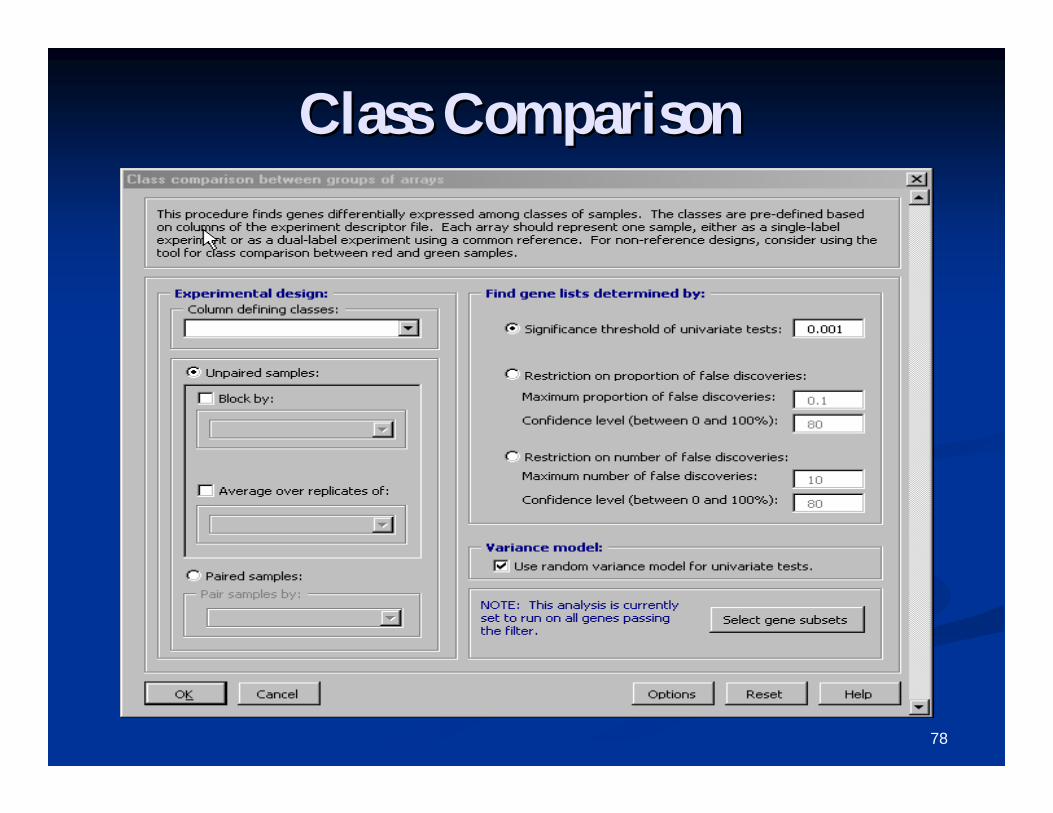
Class ComparisonClass Comparison
79
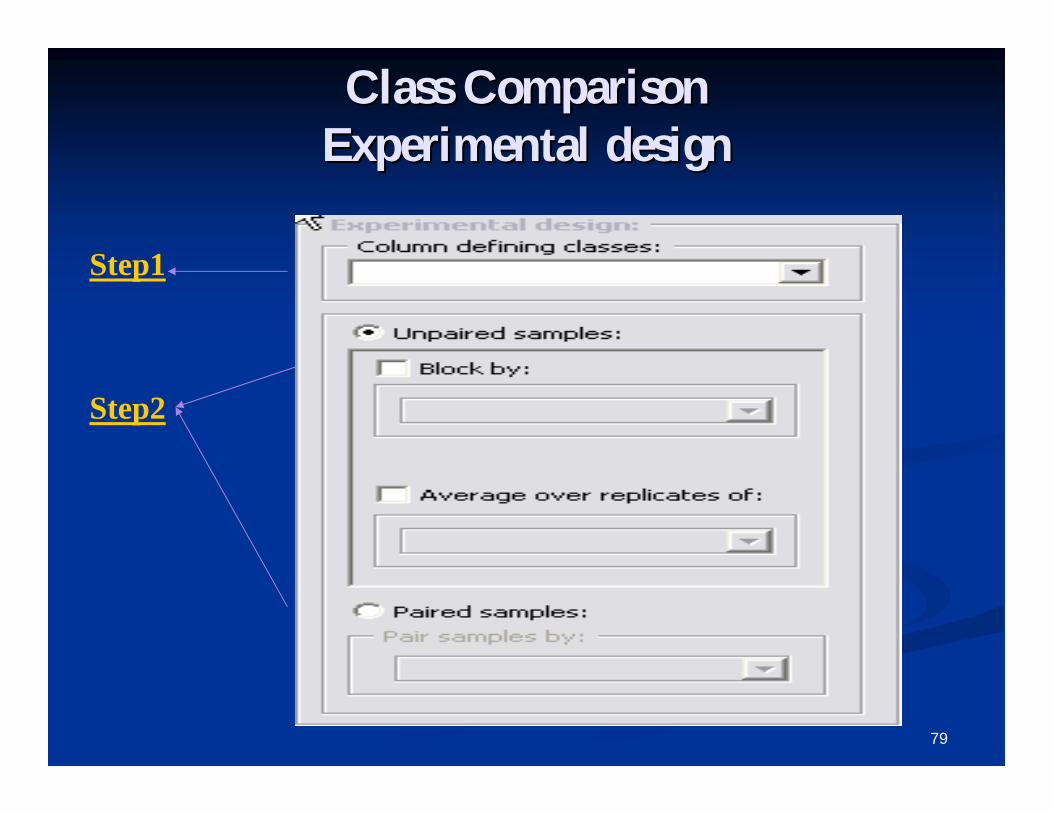
Class ComparisonClass ComparisonExperimental designExperimental design
Step1
Step2
80
Class comparison tool Class comparison tool
1.1. Enter the class column from the Enter the class column from the ‘‘Experiment descriptorExperiment descriptor’’worksheet that defines the classes for the samples. worksheet that defines the classes for the samples.
2.2. Specify if this is a paired or unSpecify if this is a paired or un--paired analysis. An paired analysis. An analysis is said to be paired if for example, you have the analysis is said to be paired if for example, you have the same sample from a patient before and after a treatment. same sample from a patient before and after a treatment. You then need a column in the experiment descriptor You then need a column in the experiment descriptor worksheet that will contain identical values for pair of worksheet that will contain identical values for pair of arrays.arrays.
3.3. If this is an unpaired analysis, do you have a If this is an unpaired analysis, do you have a blocking blocking factor?factor?
4.4. If this is an unpaired analysis, do you have an If this is an unpaired analysis, do you have an replicatesreplicatesyou want to average across?you want to average across?
81
Class comparison toolClass comparison toolBlocking FactorBlocking Factor
Experimental designs containing a blocking factor can be performed by specifying which column in the Experiment descriptor worksheet contains a blocking variable. When selected, the influence of the blocking variable is taken into consideration when analyzing the differences between classes.
Examples of variables that may be considered as Blocking factors: Clinical Site for patient data Print set for cDNA spotted arrays Batch of arrays
82
Average over replicatesAverage over replicates
If multiple arrays have been performed using the same sample If multiple arrays have been performed using the same sample RNA then an average of these replicates should be used instead RNA then an average of these replicates should be used instead of the individual arrays in the analysis.of the individual arrays in the analysis.
In the In the ‘‘experiment descriptorexperiment descriptor’’ worksheet, there should be worksheet, there should be column containing sample ids for these arrays.column containing sample ids for these arrays.
Arrays that contain the identical values of the sample id Arrays that contain the identical values of the sample id variable are considered as replicates and will be averaged in thvariable are considered as replicates and will be averaged in the e analysis.analysis.
83
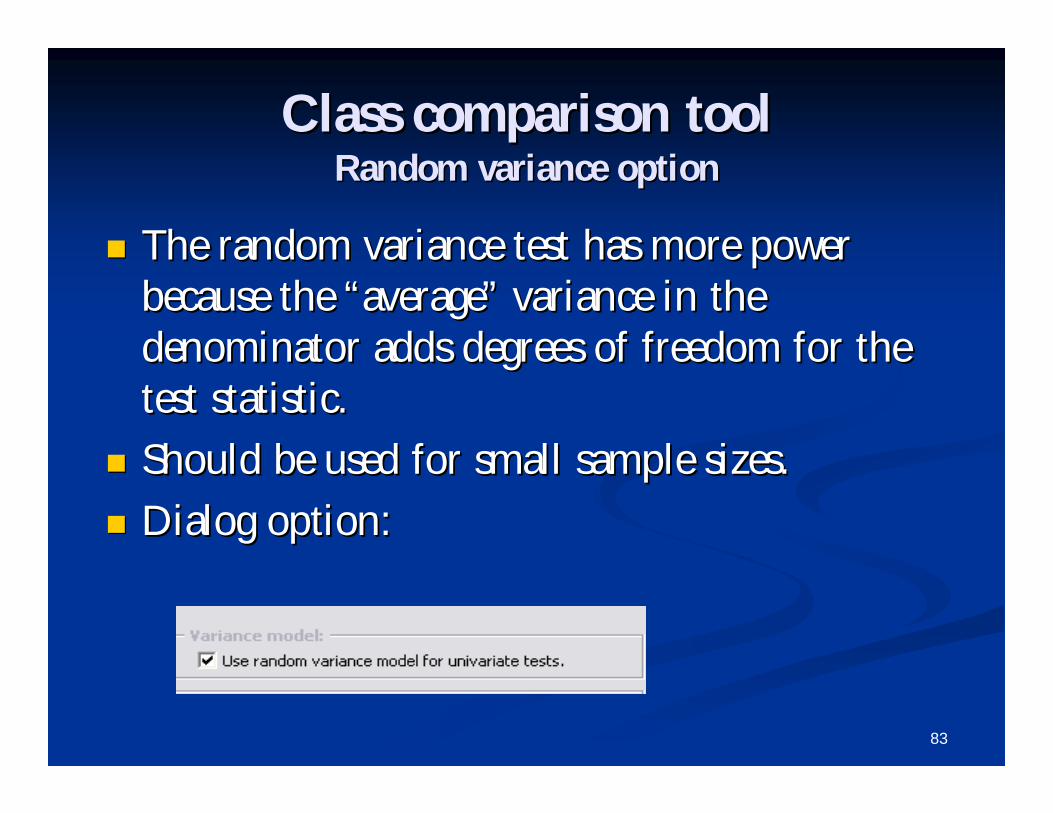
Class comparison toolClass comparison toolRandom variance optionRandom variance option
The random variance test has more power The random variance test has more power because the because the ““averageaverage”” variance in the variance in the denominator adds degrees of freedom for the denominator adds degrees of freedom for the test statistic.test statistic.
Should be used for small sample sizes.Should be used for small sample sizes.
Dialog option:Dialog option:
84
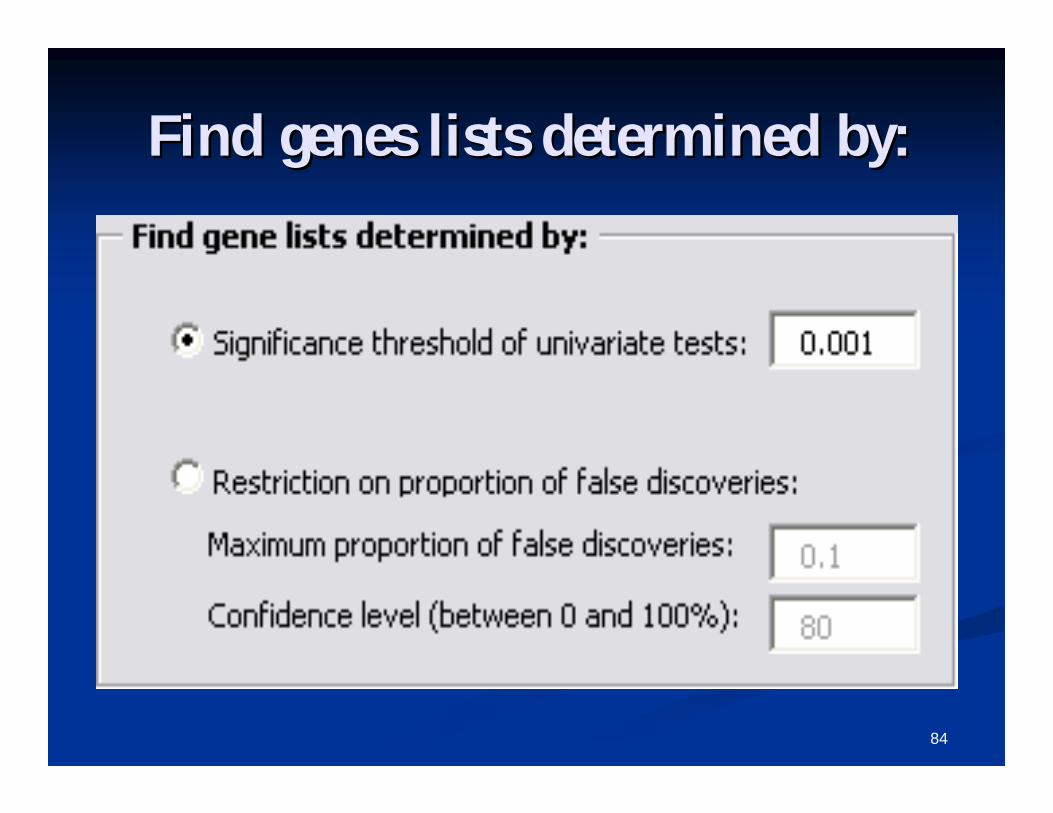
Find genes lists determined by:Find genes lists determined by:
85
Class comparison toolClass comparison toolUnivariate significance testUnivariate significance test
Compute the univariate pCompute the univariate p--value for each gene, value for each gene, and sort list of genes by smallest pand sort list of genes by smallest p--value.value.
In the univariate setting (i.e., testing In the univariate setting (i.e., testing significance of one gene at a time), the psignificance of one gene at a time), the p--value value is defined to be the probability of obtaining a is defined to be the probability of obtaining a false positive result.false positive result.
However, once a list of univariately significant However, once a list of univariately significant genes is found, it is not clear how many of genes is found, it is not clear how many of those genes are false positives.those genes are false positives.
86
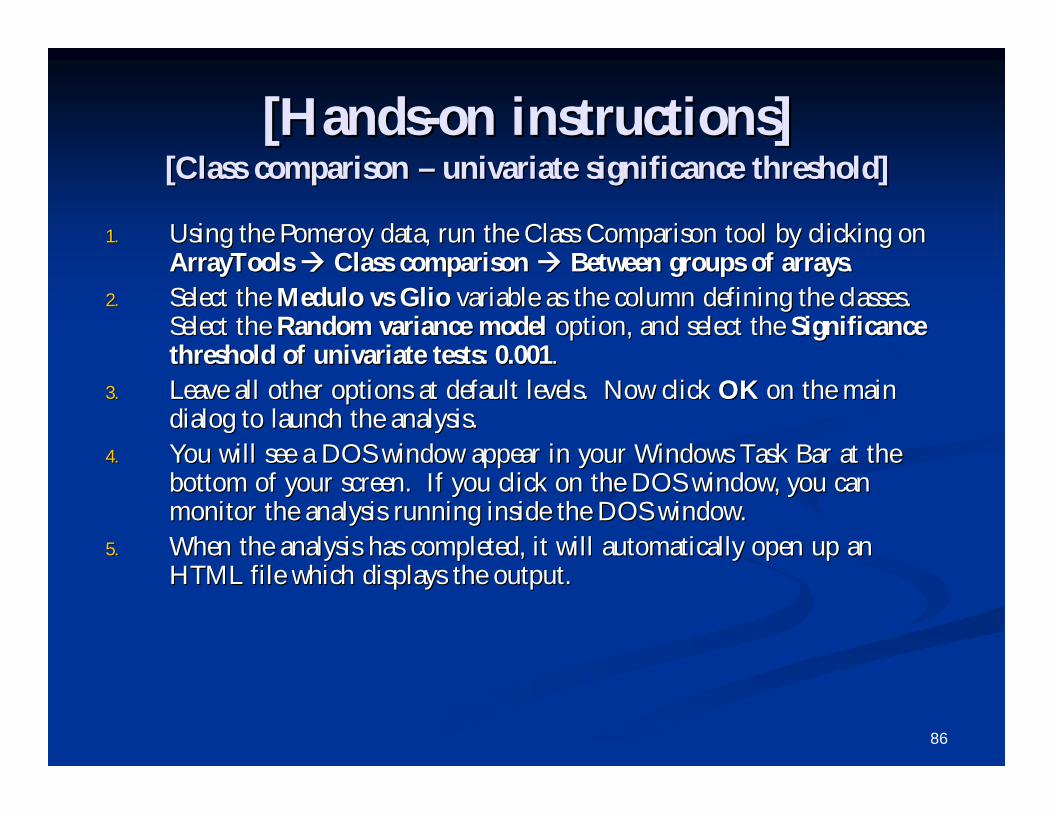
[Hands[Hands--on instructions]on instructions][Class comparison [Class comparison –– univariate significance threshold]univariate significance threshold]
1.1. Using the Pomeroy data, run the Class Comparison tool by clickinUsing the Pomeroy data, run the Class Comparison tool by clicking on g on ArrayTools ArrayTools Class comparison Class comparison Between groups of arraysBetween groups of arrays..
2.2. Select the Select the Medulo vs GlioMedulo vs Glio variable as the column defining the classes. variable as the column defining the classes. Select the Select the Random variance modelRandom variance model option, and select the option, and select the Significance Significance threshold of univariate tests: 0.001threshold of univariate tests: 0.001..
3.3. Leave all other options at default levels. Now click Leave all other options at default levels. Now click OKOK on the main on the main dialog to launch the analysis.dialog to launch the analysis.
4.4. You will see a DOS window appear in your Windows Task Bar at theYou will see a DOS window appear in your Windows Task Bar at thebottom of your screen. If you click on the DOS window, you can bottom of your screen. If you click on the DOS window, you can monitor the analysis running inside the DOS window.monitor the analysis running inside the DOS window.
5.5. When the analysis has completed, it will automatically open up aWhen the analysis has completed, it will automatically open up an n HTML file which displays the output.HTML file which displays the output.
87
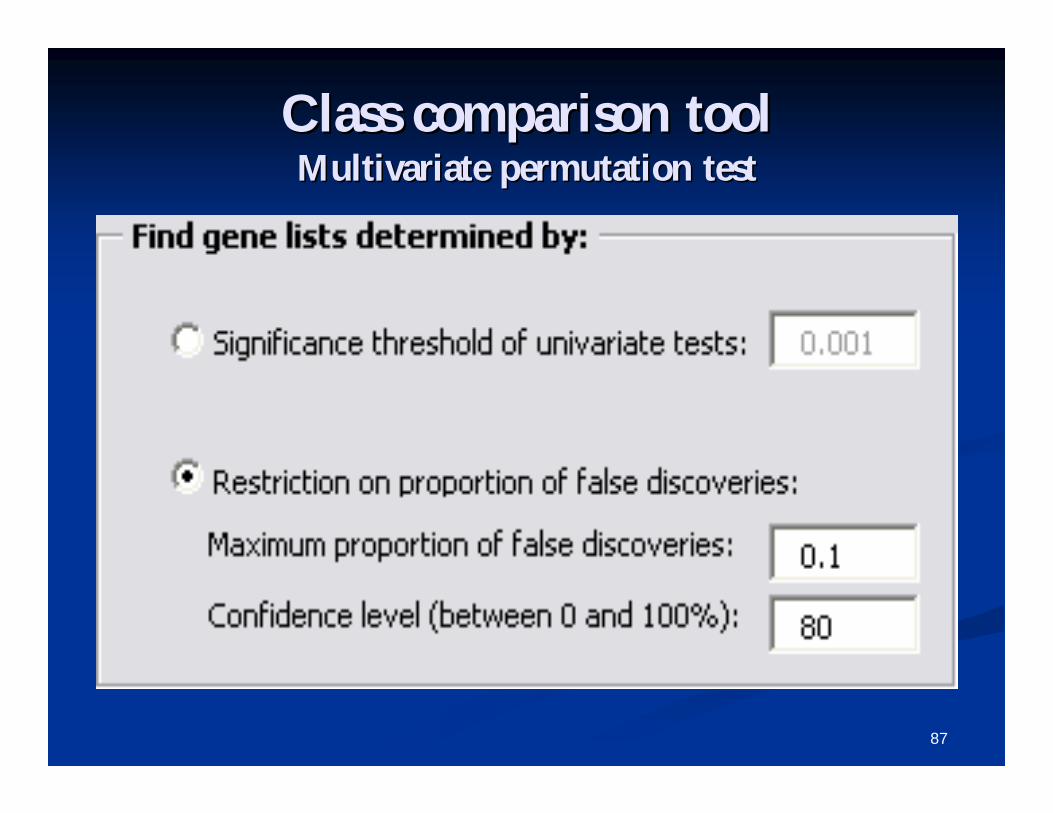
Class comparison toolClass comparison toolMultivariate permutation testMultivariate permutation test
88
Class comparison toolClass comparison toolMultivariate permutation testMultivariate permutation test
In the multivariate setting (i.e., when testing many genes In the multivariate setting (i.e., when testing many genes for significance at the same time), ask the question: for significance at the same time), ask the question: What pWhat p--value cutoff should I use to guarantee that 90% value cutoff should I use to guarantee that 90% of the time, I get less than P proportion of false positives of the time, I get less than P proportion of false positives (where P is specified by the user)?(where P is specified by the user)?
To answer this question, we compute the permutation To answer this question, we compute the permutation distribution of the pdistribution of the p--value cutoffs for which we would value cutoffs for which we would get P proportion of false positives.get P proportion of false positives.
The output tells us how far down the list we would be The output tells us how far down the list we would be able to go in order to be assured (with a certain able to go in order to be assured (with a certain confidence) of getting less than P proportion of false confidence) of getting less than P proportion of false positives.positives.
89
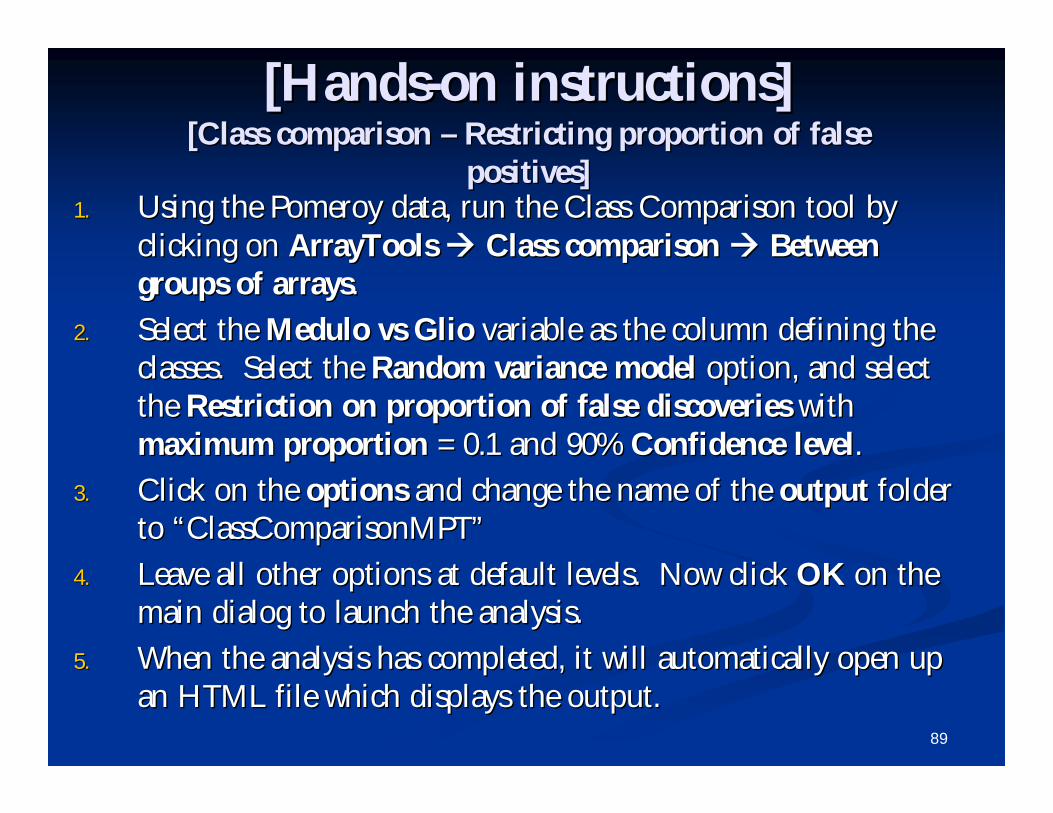
[Hands[Hands--on instructions]on instructions][Class comparison [Class comparison –– Restricting proportion of false Restricting proportion of false
positives]positives]1.1. Using the Pomeroy data, run the Class Comparison tool by Using the Pomeroy data, run the Class Comparison tool by
clicking on clicking on ArrayTools ArrayTools Class comparison Class comparison Between Between groups of arraysgroups of arrays..
2.2. Select the Select the Medulo vs GlioMedulo vs Glio variable as the column defining the variable as the column defining the classes. Select the classes. Select the Random variance modelRandom variance model option, and select option, and select the the Restriction on proportion of false discoveriesRestriction on proportion of false discoveries with with maximum proportionmaximum proportion = 0.1 and 90% = 0.1 and 90% Confidence levelConfidence level..
3.3. Click on the Click on the optionsoptions and change the name of the and change the name of the outputoutput folder folder to to ““ClassComparisonMPTClassComparisonMPT””
4.4. Leave all other options at default levels. Now click Leave all other options at default levels. Now click OKOK on the on the main dialog to launch the analysis.main dialog to launch the analysis.
5.5. When the analysis has completed, it will automatically open up When the analysis has completed, it will automatically open up an HTML file which displays the output.an HTML file which displays the output.
90
Gene ontology analysisGene ontology analysis
In the class comparison, class prediction, In the class comparison, class prediction, survival analysis, or quantitative traits analysis survival analysis, or quantitative traits analysis output, the observed vs. expected frequency is output, the observed vs. expected frequency is computed for each Gene Ontology class computed for each Gene Ontology class represented in the selected genelist, as well as represented in the selected genelist, as well as for each upstream Gene Ontology class. By for each upstream Gene Ontology class. By default, results are printed only for classes default, results are printed only for classes represented by at least five genes in the selected represented by at least five genes in the selected genelist, and with an observed versus expected genelist, and with an observed versus expected ratio of at least 2.ratio of at least 2.
91
Class comparisonClass comparisonSignificance Analysis of Microarrays (SAM)Significance Analysis of Microarrays (SAM)
SAM is another popular method for false discovery SAM is another popular method for false discovery control, which controls the control, which controls the averageaverage proportion of proportion of false discoveries rather than the false discoveries rather than the probabilityprobability of a given of a given number or proportion of false discoveries.number or proportion of false discoveries.
It is a slightly less stringent control than the It is a slightly less stringent control than the multivariate permutation test for controlling false multivariate permutation test for controlling false discoveries used in the other class comparison tools, discoveries used in the other class comparison tools, but is included in BRBbut is included in BRB--ArrayTools because of its ArrayTools because of its popularity.popularity.
92
[Hands-on instructions][Significance Analysis of Microarrays – Pomeroy data]
1.1. Still using the Pomeroy data, run the SAM tool by clicking on Still using the Pomeroy data, run the SAM tool by clicking on ArrayTools ArrayTools Class comparison Class comparison Significance Analysis of Significance Analysis of Microarrays (SAM)Microarrays (SAM)..
2.2. Again, select the Again, select the Medulo vs Glio Medulo vs Glio variable as the column variable as the column defining the classes, select the defining the classes, select the 9090thth percentilepercentile option, and leave option, and leave all other parameters at default levels. all other parameters at default levels.
3.3. Check the option to perform Check the option to perform Gene ontology Observed vs Gene ontology Observed vs Expected analysis.Expected analysis.
4.4. Now click Now click OK OK to exit the options dialog, and click to exit the options dialog, and click OKOK on the on the main dialog to launch the analysis.main dialog to launch the analysis.
93
Gene set Expression Gene set Expression ComparisonComparison
Allows users to find significant Allows users to find significant setssets of genes rather than just significant of genes rather than just significant genes.genes.
For the For the Gene Ontology comparisonGene Ontology comparison, all Gene Ontology classes that , all Gene Ontology classes that are represented in the data are tested for significance.are represented in the data are tested for significance.
For For Pathway ComparisonPathway Comparison, all the pathways that are represented in the , all the pathways that are represented in the data are tested. For Human, the BioCarta or KEGG pathways are tedata are tested. For Human, the BioCarta or KEGG pathways are tested sted and for mouse, the BioCarta pathways are compared. Additionally,and for mouse, the BioCarta pathways are compared. Additionally,Broad/MIT pathways can be downloaded to be used in analyses.Broad/MIT pathways can be downloaded to be used in analyses.
For the For the User Gene Lists comparisonUser Gene Lists comparison, the user can select specific , the user can select specific genelists that the user would like to test for significance.genelists that the user would like to test for significance.
Transcription factor target gene lists and microRNA target genelTranscription factor target gene lists and microRNA target genelists ists have been added to the Gene List comparison tool.have been added to the Gene List comparison tool.
New to v3.8, the ability to handle multiple probe sets that corrNew to v3.8, the ability to handle multiple probe sets that correspond espond to the same gene either using the average intensity (single chanto the same gene either using the average intensity (single channel data nel data only) or inter quartile range.only) or inter quartile range.
94
Gene Set Expression Gene Set Expression ComparisonComparison
Compute pCompute p--value of differential expression for each value of differential expression for each gene in the gene set(k=number of genes)gene in the gene set(k=number of genes)
Compute a summary (S) of these pCompute a summary (S) of these p--valuesvalues Determine whether the summary test (S) is more Determine whether the summary test (S) is more
extreme than would be expected from a random extreme than would be expected from a random sample of sample of ““kk”” genes on that platform.genes on that platform.
Two types of summaries provided:Two types of summaries provided:-- Average of log pAverage of log p--valuesvalues
-- KolmogrovKolmogrov--Smirnov statistic.Smirnov statistic.
95
EfronEfron--Tibshirani's GSA maxmean Tibshirani's GSA maxmean test test
Tests the null hypothesis that for a gene set the average degreeTests the null hypothesis that for a gene set the average degreeof differential expression is greater than expected from a of differential expression is greater than expected from a random set of genes.random set of genes.
Uses the maxmean statistic as follows:Uses the maxmean statistic as follows: Take the di scores for all the genes within a geneset.Take the di scores for all the genes within a geneset. Set negative scores to 0 and compute Set negative scores to 0 and compute ‘‘avposavpos’’ as the average of as the average of
the positive scores and zeros.the positive scores and zeros. Similarly set the positive scores to 0 and compute the Similarly set the positive scores to 0 and compute the ‘‘avnegavneg’’
as the averages of the negative scores and zeros. as the averages of the negative scores and zeros. A gene set is scored A gene set is scored ‘‘avposavpos’’ if |avpos| > |avneg| or else the if |avpos| > |avneg| or else the
gene set is scored gene set is scored ‘‘avnegavneg’’
96
GoemanGoeman’’s Global tests Global test
Tests the null hypothesis that no genes within Tests the null hypothesis that no genes within a geneset are differentially expressed.a geneset are differentially expressed.
A gene set is said to be significant if the A gene set is said to be significant if the corresponding parametric global pcorresponding parametric global p--value is less value is less than the threshold value selected by the user.than the threshold value selected by the user.
97
[Hands[Hands--on instructions]on instructions][Class Comparison [Class Comparison –– Pathway Comparison: Pomeroy Pathway Comparison: Pomeroy
data]data]
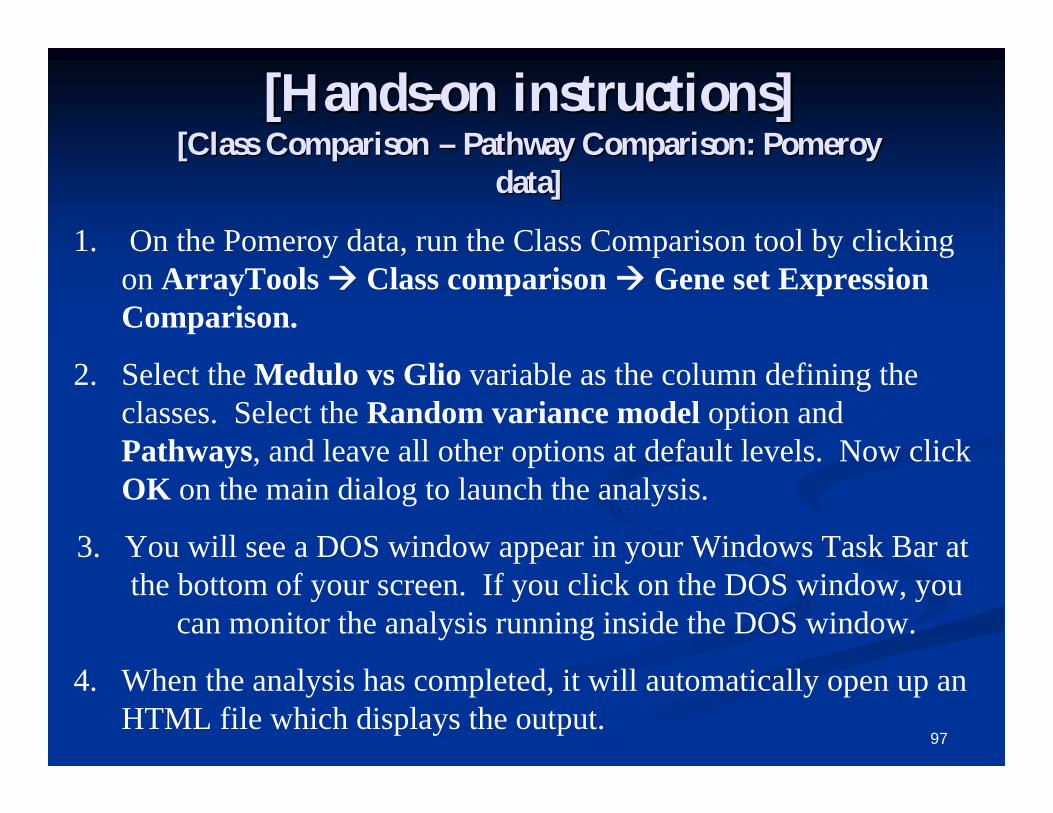
1. On the Pomeroy data, run the Class Comparison tool by clicking on ArrayTools Class comparison Gene set Expression Comparison.
2. Select the Medulo vs Glio variable as the column defining the classes. Select the Random variance model option and Pathways, and leave all other options at default levels. Now click OK on the main dialog to launch the analysis.
3. You will see a DOS window appear in your Windows Task Bar at the bottom of your screen. If you click on the DOS window, you
can monitor the analysis running inside the DOS window.
4. When the analysis has completed, it will automatically open up an HTML file which displays the output.
98
Quantitative trait toolQuantitative trait tool Selects genes which are univariately correlated with Selects genes which are univariately correlated with
a quantitative trait such as age or time point.a quantitative trait such as age or time point. Controls number and proportion of false Controls number and proportion of false
discoveries in entire list: uses a multivariate discoveries in entire list: uses a multivariate permutation test which takes advantage of the permutation test which takes advantage of the correlation among genes.correlation among genes.
Produces a gene list which can be used for further Produces a gene list which can be used for further analysis.analysis.
Produces chromosomal distribution and GO Produces chromosomal distribution and GO analysis if genes have already been annotated using analysis if genes have already been annotated using the SOURCE database.the SOURCE database.
99
Survival analysis toolsSurvival analysis tools Find Genes Correlated with Survival tool, selects genes Find Genes Correlated with Survival tool, selects genes
which are univariately correlated with survivalwhich are univariately correlated with survival Controls number and proportion of false discoveries in Controls number and proportion of false discoveries in
entire list: uses a multivariate permutation test which takes entire list: uses a multivariate permutation test which takes advantage of the correlation among genesadvantage of the correlation among genes
Produces a gene list which can be used for further analysis.Produces a gene list which can be used for further analysis. Produces chromosomal distribution and GO analysis if Produces chromosomal distribution and GO analysis if
genes have already been annotated using the SOURCE genes have already been annotated using the SOURCE database.database.
100
Survival Gene Set analysisSurvival Gene Set analysis
This analysis tool finds sets of genes for which the This analysis tool finds sets of genes for which the expression levels are correlated to survival. Similar to expression levels are correlated to survival. Similar to the Gene Set Expression comparison tool, this tool the Gene Set Expression comparison tool, this tool can be used to analyze Gene Ontology categories, can be used to analyze Gene Ontology categories, Pathways, micro RNA targets, transcription factor Pathways, micro RNA targets, transcription factor targets and user defined gene lists.targets and user defined gene lists.
The permutation pThe permutation p--values from the LS and KS values from the LS and KS statistics are computed.statistics are computed.
The HTML output lists the sets of genes and the The HTML output lists the sets of genes and the associated passociated p--values.values.
101
Classification of samplesClassification of samples Cluster analysis vs. classificationCluster analysis vs. classification
Use cluster analysis to discover new classes, or for Use cluster analysis to discover new classes, or for visualization purposesvisualization purposes
Use classification when classes are already specifiedUse classification when classes are already specified
Classification is supervised learning, and generally has Classification is supervised learning, and generally has more power because it uses the known information about more power because it uses the known information about the hybridized samples.the hybridized samples.
Use the Class Prediction tool when the primary interest is Use the Class Prediction tool when the primary interest is to form a classifier to predict the class of new samples.to form a classifier to predict the class of new samples.
102
Hierarchical clustering toolsHierarchical clustering tools
Clustering of genes and samples produces visual image Clustering of genes and samples produces visual image plot of logplot of log--expression data, where ordering is determined expression data, where ordering is determined by ordering of dendrogramby ordering of dendrogram
Can compute measures to assess cluster reproducibility Can compute measures to assess cluster reproducibility when clustering samples alonewhen clustering samples alone
May cluster based on gene subsets rather than on the May cluster based on gene subsets rather than on the entire gene setentire gene set
Interface to Cluster 3.0 and TreeView originally Interface to Cluster 3.0 and TreeView originally produced by the Stanford group is also included, and produced by the Stanford group is also included, and allows for easy exportation of results.allows for easy exportation of results.
103
[Hands[Hands--on instructions]on instructions][Cluster analysis [Cluster analysis –– Pomeroy data]Pomeroy data]
1.1. Using the Pomeroy data set.Using the Pomeroy data set.
2.2. Run the cluster analysis by clicking on Run the cluster analysis by clicking on ArrayTools ArrayTools Clustering Clustering Genes (and samples)Genes (and samples)..
3.3. Click on the Click on the Select gene subsetsSelect gene subsets button, and under button, and under Select genes Select genes for analysisfor analysis, choose the , choose the ClassComparisonClassComparison genelist, and click genelist, and click OKOK..
4.4. Now click on the Now click on the Options Options button, and choose button, and choose Medulo vs GlioMedulo vs Glioas the variable under as the variable under Label the experimentsLabel the experiments. Click . Click OKOK to exit to exit the options dialog, and click the options dialog, and click OKOK on the main dialog to launch on the main dialog to launch the analysis.the analysis.
104
[Hands[Hands--on instructions on instructions –– contcont’’d]d][Cluster analysis [Cluster analysis –– Pomeroy data]Pomeroy data]
5.5. The analysis will open up a The analysis will open up a Cluster viewerCluster viewer worksheet inside worksheet inside your project workbook. The first plot presented is the Heat Map your project workbook. The first plot presented is the Heat Map image in a draft form. Using image in a draft form. Using Zoom and RecolorZoom and Recolor button you button you can change the color scheme of the map. Click the button and can change the color scheme of the map. Click the button and on the dialog page select on the dialog page select Red/BlueRed/Blue scheme and descheme and de--select the select the Use Use quantile dataquantile data…… This coloring option should look familiar to the This coloring option should look familiar to the dChip users. dChip users.
6.6. The setting for using the quantile data ranges when distributingThe setting for using the quantile data ranges when distributingcolors on the scale leads to the heat map when two different colors on the scale leads to the heat map when two different major colors on the map represent not the range of values of major colors on the map represent not the range of values of equal length but rather the sets with the equal number of pointsequal length but rather the sets with the equal number of points. .
105
[Hands[Hands--on instructions on instructions –– contcont’’d]d][Cluster analysis [Cluster analysis –– Pomeroy data]Pomeroy data]
7.7. You can also use You can also use Zoom and RecolorZoom and Recolor option to zoom in option to zoom in which will present the fragment of the map in a separate which will present the fragment of the map in a separate window and zoom out when you have too many genes for the window and zoom out when you have too many genes for the regular map to fit into window but want to see the whole regular map to fit into window but want to see the whole picture. Select genes 50 to 60 and arrays 6 to 30 to zoom in.picture. Select genes 50 to 60 and arrays 6 to 30 to zoom in.
8.8. Right click on the one of the gene Right click on the one of the gene InfoInfo links in the left part of links in the left part of the IE window and select the IE window and select ““Open in New WindowOpen in New Window””
106
[Hands[Hands--on instructions on instructions –– contcont’’d]d][Cluster analysis [Cluster analysis –– Pomeroy data]Pomeroy data]
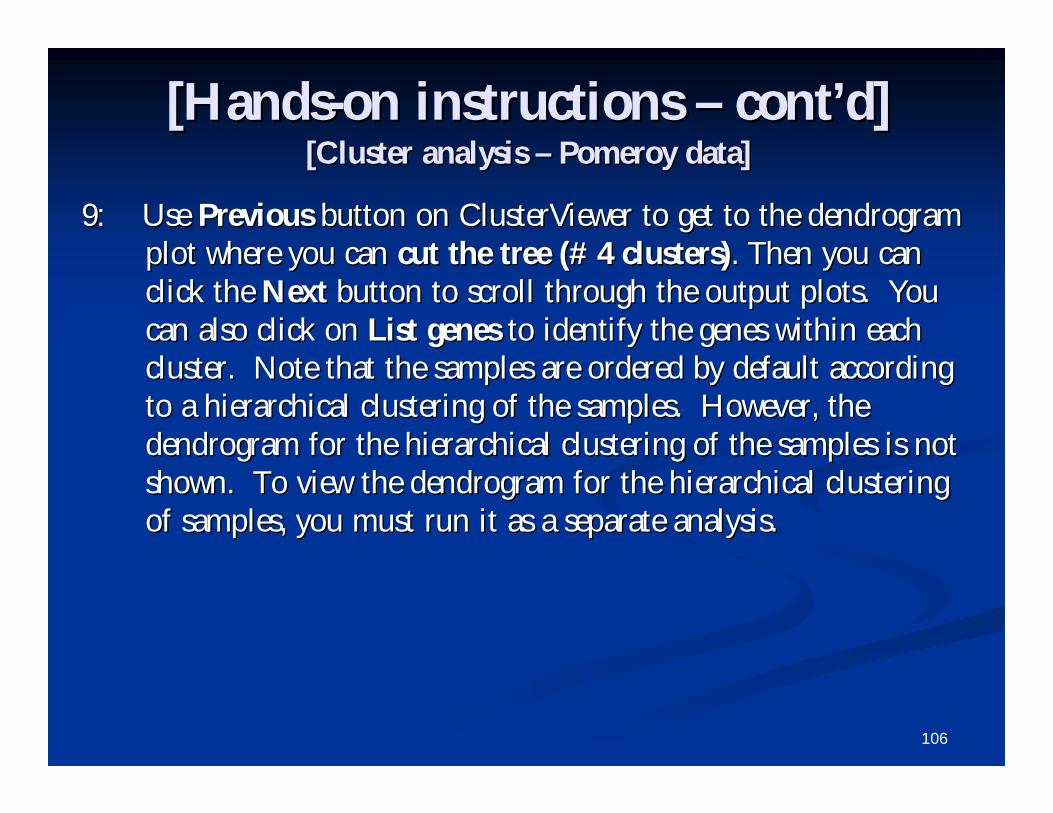
9: Use 9: Use PreviousPrevious button on ClusterViewer to get to the dendrogram button on ClusterViewer to get to the dendrogram plot where you can plot where you can cut the tree (# 4 clusters)cut the tree (# 4 clusters). Then you can . Then you can click the click the Next Next button to scroll through the output plots. You button to scroll through the output plots. You can also click on can also click on List genesList genes to identify the genes within each to identify the genes within each cluster. Note that the samples are ordered by default accordingcluster. Note that the samples are ordered by default accordingto a hierarchical clustering of the samples. However, the to a hierarchical clustering of the samples. However, the dendrogram for the hierarchical clustering of the samples is notdendrogram for the hierarchical clustering of the samples is notshown. To view the dendrogram for the hierarchical clustering shown. To view the dendrogram for the hierarchical clustering of samples, you must run it as a separate analysis.of samples, you must run it as a separate analysis.
107
[Hands[Hands--on instructions on instructions –– contcont’’d]d][Cluster analysis [Cluster analysis –– Pomeroy data]Pomeroy data]
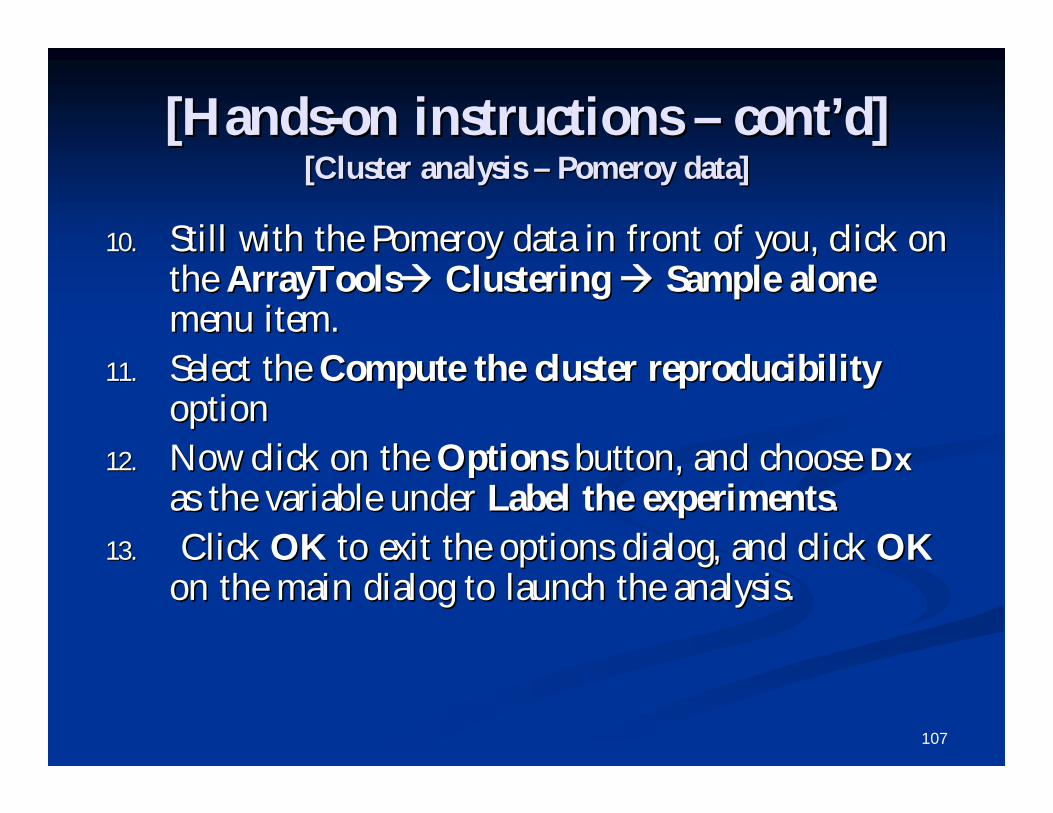
10.10. Still with the Pomeroy data in front of you, click on Still with the Pomeroy data in front of you, click on the the ArrayToolsArrayTools Clustering Clustering Sample aloneSample alonemenu item.menu item.
11.11. Select the Select the Compute the cluster reproducibilityCompute the cluster reproducibilityoptionoption
12.12. Now click on the Now click on the Options Options button, and choose button, and choose DxDxas the variable under as the variable under Label the experimentsLabel the experiments. .
13.13. Click Click OKOK to exit the options dialog, and click to exit the options dialog, and click OKOKon the main dialog to launch the analysis.on the main dialog to launch the analysis.
108
[Hands[Hands--on instructions on instructions –– contcont’’d]d][Cluster analysis [Cluster analysis –– Pomeroy data]Pomeroy data]
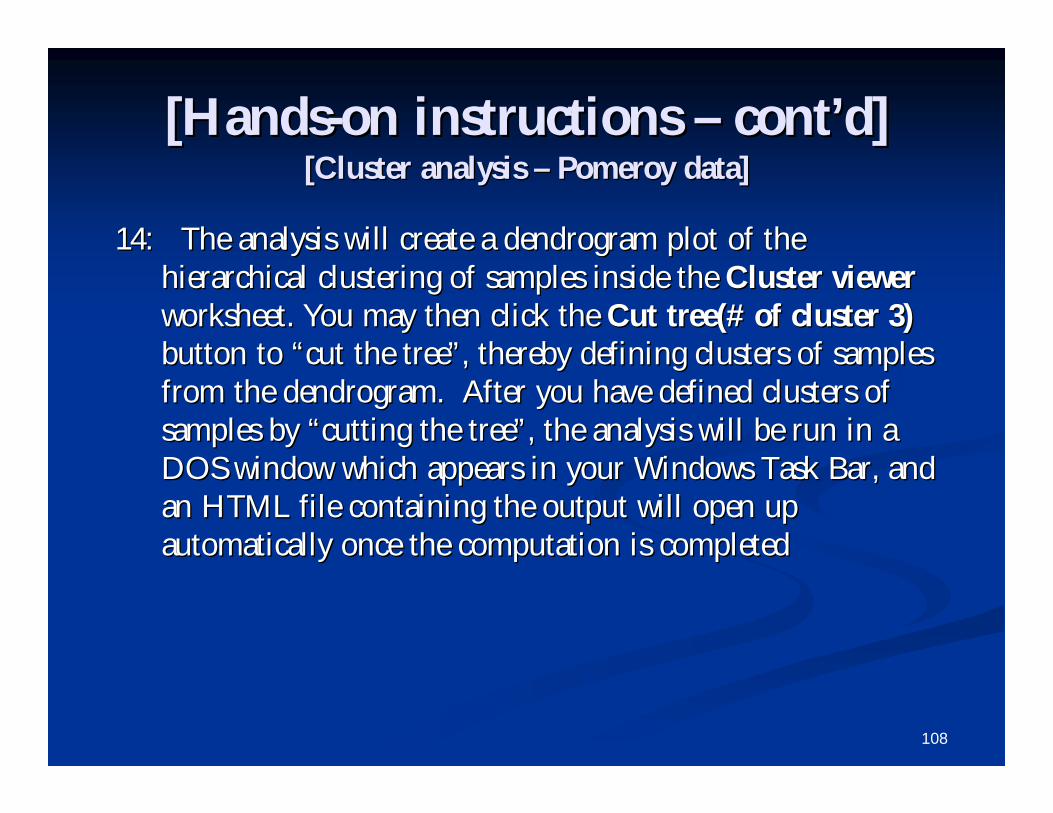
14: The analysis will create a dendrogram plot of the 14: The analysis will create a dendrogram plot of the hierarchical clustering of samples inside the hierarchical clustering of samples inside the Cluster viewerCluster viewerworksheet. worksheet. You may then click the You may then click the Cut tree(# of cluster 3)Cut tree(# of cluster 3)button to button to ““cut the treecut the tree””, thereby defining clusters of samples , thereby defining clusters of samples from the dendrogram. After you have defined clusters of from the dendrogram. After you have defined clusters of samples by samples by ““cutting the treecutting the tree””, the analysis will be run in a , the analysis will be run in a DOS window which appears in your Windows Task Bar, and DOS window which appears in your Windows Task Bar, and an HTML file containing the output will open up an HTML file containing the output will open up automatically once the computation is completedautomatically once the computation is completed
109
Cluster reproducibilityCluster reproducibility
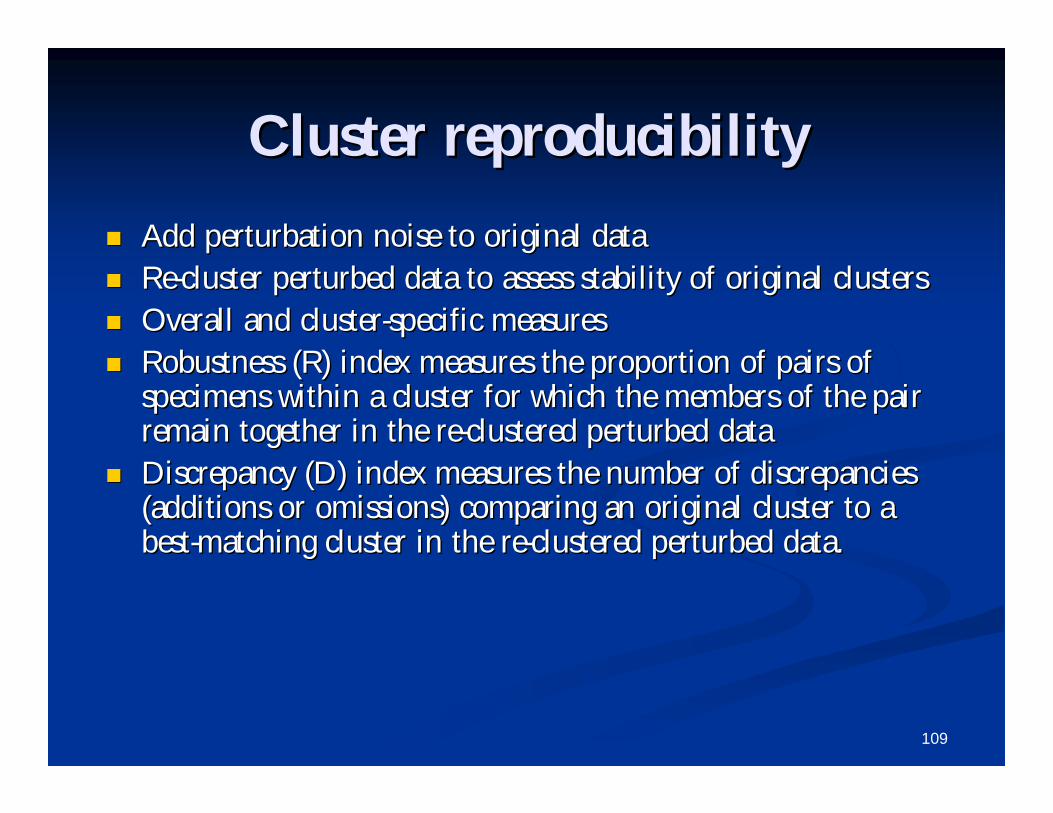
Add perturbation noise to original dataAdd perturbation noise to original data ReRe--cluster perturbed data to assess stability of original clusterscluster perturbed data to assess stability of original clusters Overall and clusterOverall and cluster--specific measuresspecific measures Robustness (R) index measures the proportion of pairs of Robustness (R) index measures the proportion of pairs of
specimens within a cluster for which the members of the pair specimens within a cluster for which the members of the pair remain together in the reremain together in the re--clustered perturbed dataclustered perturbed data
Discrepancy (D) index measures the number of discrepancies Discrepancy (D) index measures the number of discrepancies (additions or omissions) comparing an original cluster to a (additions or omissions) comparing an original cluster to a bestbest--matching cluster in the rematching cluster in the re--clustered perturbed data.clustered perturbed data.
110
Multidimensional scalingMultidimensional scaling
Rotating scatterplot:Rotating scatterplot: Gives threeGives three--dimensional dimensional visualization of relationships between samplesvisualization of relationships between samples
Global test of clustering in samples:Global test of clustering in samples: Compares Compares spatial distribution of data to white noise. spatial distribution of data to white noise. Large deviation from Gaussian normal Large deviation from Gaussian normal distribution indicates presence of clustering.distribution indicates presence of clustering.
111
[Hands[Hands--on instructions]on instructions][Multidimensional scaling [Multidimensional scaling ––Pomeroy data]Pomeroy data]
1.1. Still using the Still using the PomeroyPomeroy dataset, run the multidimensional dataset, run the multidimensional scaling by clicking on scaling by clicking on ArrayTools ArrayTools Graphics Graphics -->>Multidimensional scaling Multidimensional scaling of samplesof samples..
2.2. Now choose Now choose DxDx as the variable to as the variable to Color the rotating Color the rotating scatterplotscatterplot. click . click OKOK on the main dialog to launch the analysis.on the main dialog to launch the analysis.
3.3. A Java window will be launched, containing a scatterplot which A Java window will be launched, containing a scatterplot which can be rotated using arrow control buttons. Each point can be rotated using arrow control buttons. Each point represents a sample, and points can be identified by brushing represents a sample, and points can be identified by brushing over them with your mouse.over them with your mouse.
4.4. A PowerPoint slide is automatically created, so that you can alsA PowerPoint slide is automatically created, so that you can also o launch the rotating scatterplot at a later point from PowerPointlaunch the rotating scatterplot at a later point from PowerPoint..
112
Analysis WizardAnalysis Wizard-- PredictionPrediction
Class PredictionClass Prediction
PAMPAM
Top scoring pair plugTop scoring pair plug--inin
Random Forest plugRandom Forest plug--inin
Binary Tree PredictionBinary Tree Prediction

113
Components of Class PredictionComponents of Class Prediction
C1. Feature(gene) selectionC1. Feature(gene) selection
--which genes will be included in the model.which genes will be included in the model.
C2. Select model type. C2. Select model type.
--choose prediction method (DLDA,CCP etc)choose prediction method (DLDA,CCP etc)
Fit the parameters for the model.Fit the parameters for the model.
C3. Evaluating the ClassifierC3. Evaluating the Classifier
-- CrossCross--validationvalidation
114
C1. Gene Selection CriteriaC1. Gene Selection Criteria
Selection of genes may be based on univariate significance Selection of genes may be based on univariate significance criterion or univariate misclassification rate, and minimum criterion or univariate misclassification rate, and minimum foldfold--ratio of geometric means. The univariate ratio of geometric means. The univariate misclassification rate criterion is available when there are misclassification rate criterion is available when there are only two classes. The option to optimize over a grid of only two classes. The option to optimize over a grid of alpha values.alpha values.
In addition,we have added the option to select genes using In addition,we have added the option to select genes using ““gene pairsgene pairs””by the by the ““greedy pairgreedy pair””method method ––Bo & JonassenBo & Jonassen
New to v3.6, is the Recursive feature elimination methodNew to v3.6, is the Recursive feature elimination method..
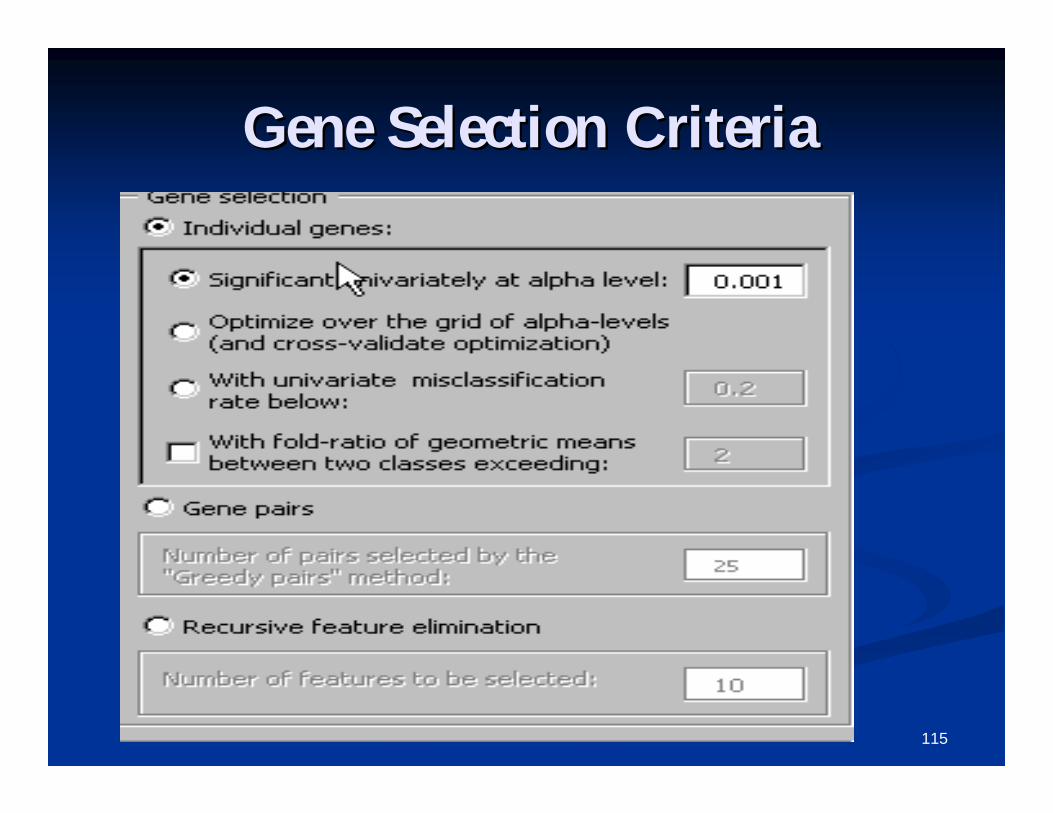
115
Gene Selection CriteriaGene Selection Criteria
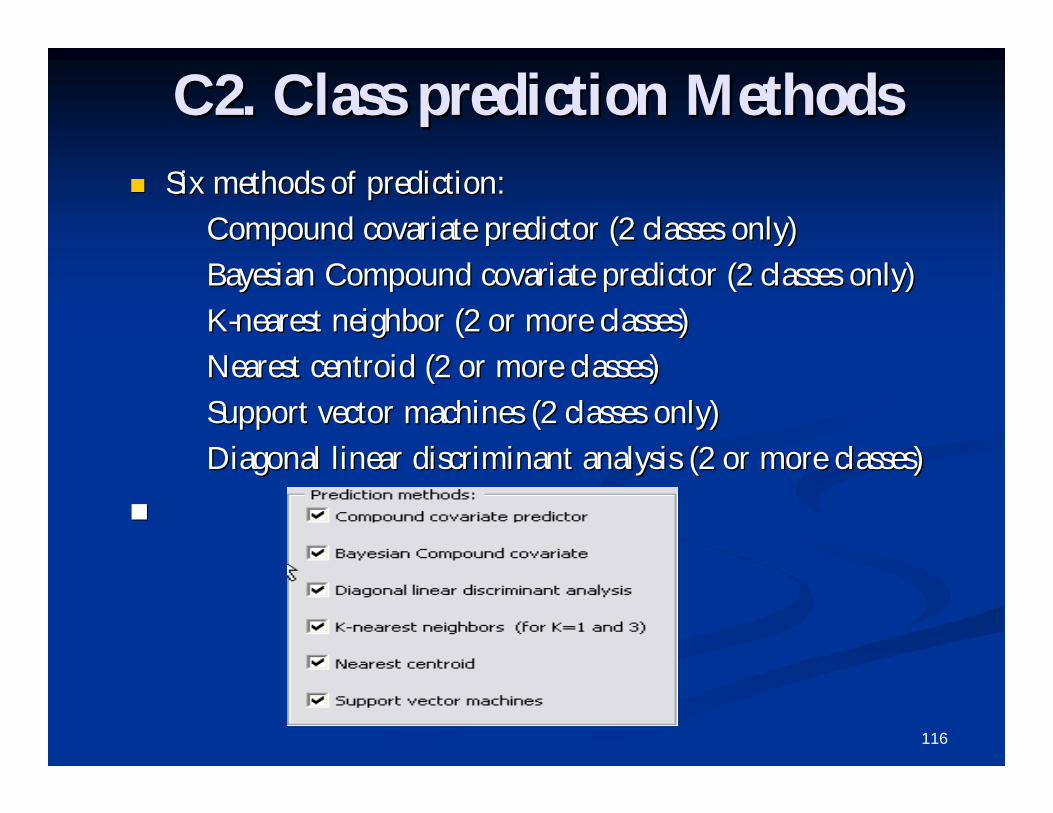
116
C2. Class prediction MethodsC2. Class prediction Methods Six methods of prediction:Six methods of prediction:
Compound covariate predictor (2 classes only)Compound covariate predictor (2 classes only)
Bayesian Compound covariate predictor (2 classes only)Bayesian Compound covariate predictor (2 classes only)
KK--nearest neighbor (2 or more classes)nearest neighbor (2 or more classes)
Nearest centroid (2 or more classes)Nearest centroid (2 or more classes)
Support vector machines (2 classes only)Support vector machines (2 classes only)
Diagonal linear discriminant analysis (2 or more classesDiagonal linear discriminant analysis (2 or more classes))
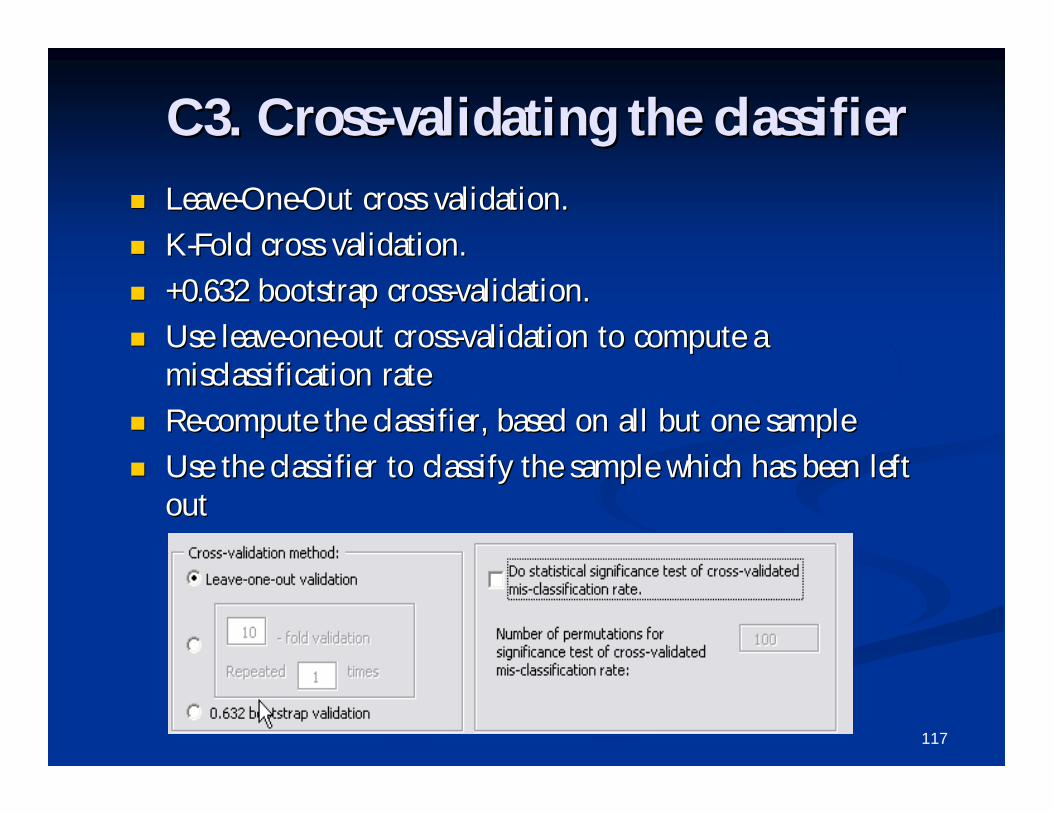
117
C3. CrossC3. Cross--validating the classifiervalidating the classifier LeaveLeave--OneOne--Out cross validation.Out cross validation.
KK--Fold cross validation.Fold cross validation.
+0.632 bootstrap cross+0.632 bootstrap cross--validation.validation.
Use leaveUse leave--oneone--out crossout cross--validation to compute a validation to compute a misclassification ratemisclassification rate
ReRe--compute the classifier, based on all but one samplecompute the classifier, based on all but one sample
Use the classifier to classify the sample which has been left Use the classifier to classify the sample which has been left outout
118
Permutation testPermutation test
Use a permutation test to assess the significance of the Use a permutation test to assess the significance of the misclassification rate and univariate significance of misclassification rate and univariate significance of each geneeach gene
For each permutation of the class labels, reFor each permutation of the class labels, re--run the run the crosscross--validation and obtain a new crossvalidation and obtain a new cross--validated validated misclassification ratemisclassification rate
The permutation pThe permutation p--value is based upon the rank of value is based upon the rank of the misclassification rate using the original data, the misclassification rate using the original data, compared to all permutationscompared to all permutations
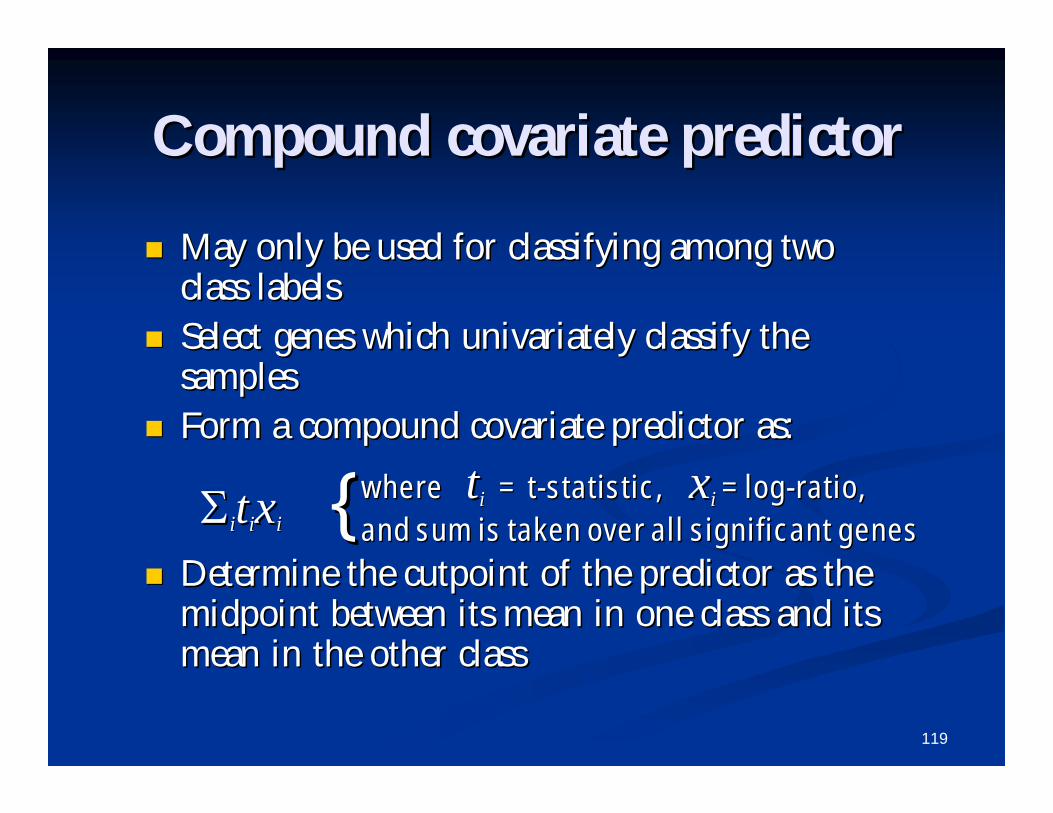
119
Compound covariate predictorCompound covariate predictor
May only be used for classifying among two May only be used for classifying among two class labelsclass labels
Select genes which univariately classify the Select genes which univariately classify the samplessamples
Form a compound covariate predictor as:Form a compound covariate predictor as:
Determine the cutpoint of the predictor as the Determine the cutpoint of the predictor as the midpoint between its mean in one class and its midpoint between its mean in one class and its mean in the other classmean in the other class
iittiixxiiwhere where ttii = t= t--statistic, statistic, xxii = log= log--ratio,ratio,and sum is taken over all significant genesand sum is taken over all significant genes{{
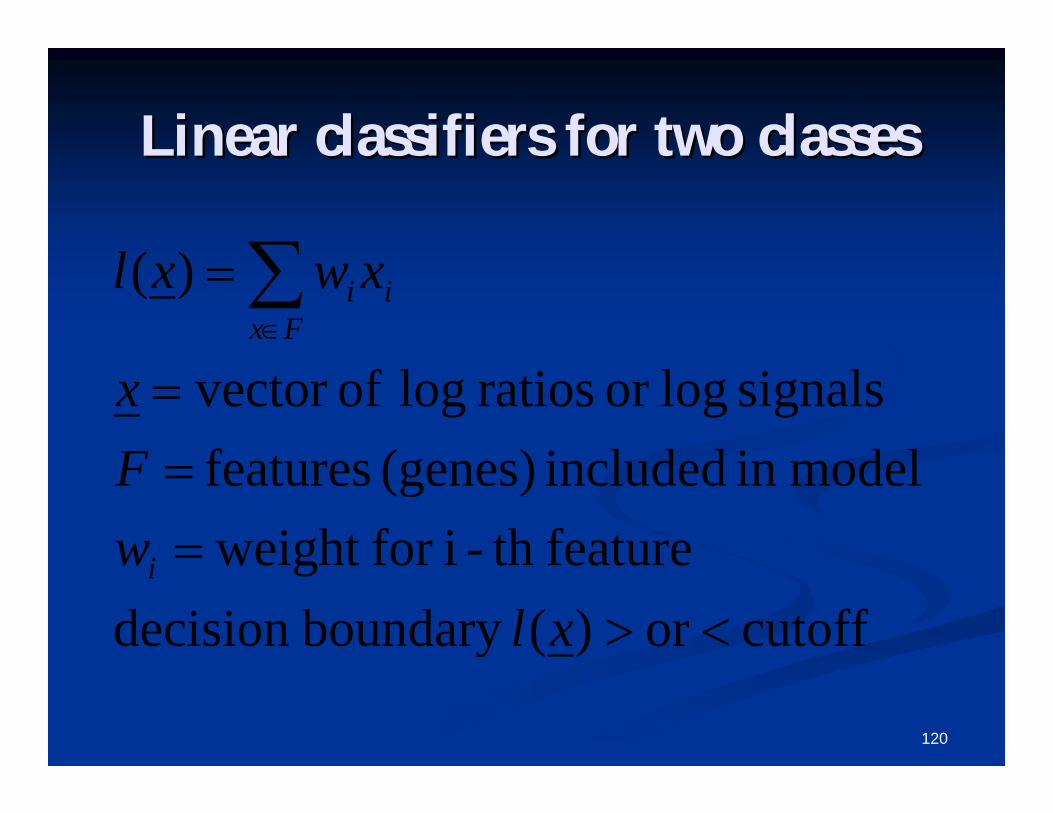
120
Linear classifiers for two classesLinear classifiers for two classes
cutoff or)(boundary decision featureth -ifor weight
modelin included (genes) features signals logor ratios log ofvector
)(
xlwFx
xwxl
i
Fxii
121
Linear classifiers for two classesLinear classifiers for two classes
Diagonal linear discriminant analysis (DLDA)Diagonal linear discriminant analysis (DLDA)
Compound covariate predictorCompound covariate predictor
-- Bayesian compound covariateBayesian compound covariate
Support vector machineSupport vector machine
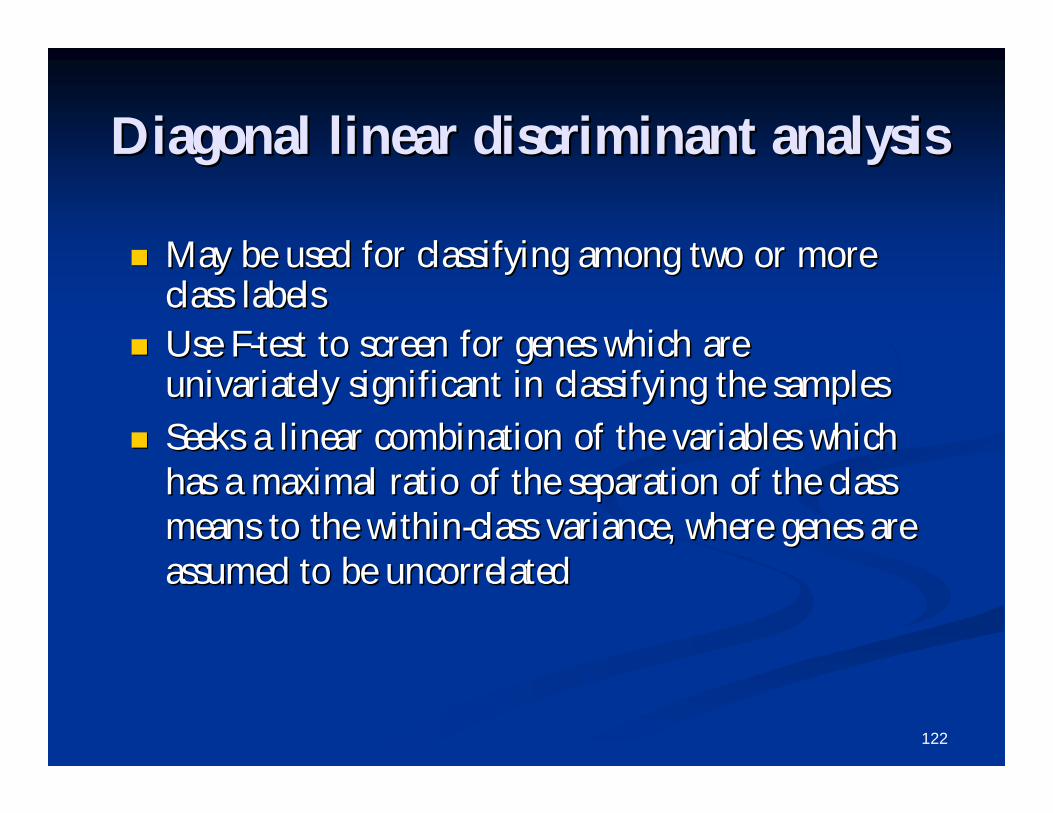
122
Diagonal linear discriminant analysisDiagonal linear discriminant analysis
May be used for classifying among two or more May be used for classifying among two or more class labelsclass labels
Use FUse F--test to screen for genes which are test to screen for genes which are univariately significant in classifying the samplesunivariately significant in classifying the samples
Seeks a linear combination of the variables which Seeks a linear combination of the variables which has a maximal ratio of the separation of the class has a maximal ratio of the separation of the class means to the withinmeans to the within--class variance, where genes are class variance, where genes are assumed to be uncorrelatedassumed to be uncorrelated
123
Bayesian Compound Covariate Bayesian Compound Covariate
Compound Covariate score is computed for all Compound Covariate score is computed for all the samples in the crossthe samples in the cross--validated training set.validated training set.
The CCPThe CCP--scores of samples in each class of the scores of samples in each class of the training set are assumed to be from a Gaussian training set are assumed to be from a Gaussian distribution.distribution.
If prior probabilities are If prior probabilities are ½½ -- the BCCP is the BCCP is similar to the CCP.similar to the CCP.
124
KK--nearest neighbornearest neighbor
May be used for classifying among two or more May be used for classifying among two or more class labelsclass labels
Use FUse F--test to screen for genes which are test to screen for genes which are univariately significant in classifying the samplesunivariately significant in classifying the samples
For k=1 and k=3, finds the kFor k=1 and k=3, finds the k--nearest neighbors nearest neighbors in terms of Euclidean distance over only those in terms of Euclidean distance over only those genes which were univariately significantgenes which were univariately significant
Classify based on the majority vote of the class Classify based on the majority vote of the class labels of the klabels of the k--nearest neighborsnearest neighbors
125
Nearest centroidNearest centroid
May be used for classifying among two or more May be used for classifying among two or more class labelsclass labels
Use FUse F--test to screen for genes which are test to screen for genes which are univariately significant in classifying the samplesunivariately significant in classifying the samples
Compute the centroid of each class as a mean Compute the centroid of each class as a mean over all the training samples with that class labelover all the training samples with that class label
Classify test sample to be same class label as the Classify test sample to be same class label as the nearest centroid, using Euclidean distance over nearest centroid, using Euclidean distance over only those genes which were univariately only those genes which were univariately significantsignificant
126
Support vector machinesSupport vector machines
Implemented only for classifying among two Implemented only for classifying among two class labelsclass labels
Select genes which univariately classify the Select genes which univariately classify the samplessamples
The SVM predictor is implemented as a linear The SVM predictor is implemented as a linear function of the logfunction of the log--ratios or the logratios or the log--intensities intensities over the significant genes, that best separates over the significant genes, that best separates the data subject to penalty costs on the number the data subject to penalty costs on the number of specimens misclassified.of specimens misclassified.
(V. Vapnik)
127
Class prediction toolClass prediction toolClass prediction vs. binary tree predictionClass prediction vs. binary tree prediction
The class prediction tool has more options: may select all The class prediction tool has more options: may select all prediction methods simultaneously, may use paired prediction methods simultaneously, may use paired samples, may use randomized variance option.samples, may use randomized variance option.
The binary tree prediction tool splits the classes into The binary tree prediction tool splits the classes into groups of subclasses. At each node in the tree, the binary groups of subclasses. At each node in the tree, the binary tree prediction tool decides how to split the classes into tree prediction tool decides how to split the classes into two groups based on either a leavetwo groups based on either a leave--oneone--out or a Kout or a K--fold fold crosscross--validation. The binary tree prediction tool may be validation. The binary tree prediction tool may be useful if there is a hierarchical structure to the classes.useful if there is a hierarchical structure to the classes.
However, the binary tree prediction may be very slow for a However, the binary tree prediction may be very slow for a large number of samples. Therefore, a Klarge number of samples. Therefore, a K--fold crossfold cross--validation should be used if the number of samples is validation should be used if the number of samples is large.large.
Currently the tool is limited to five classes, and requires at Currently the tool is limited to five classes, and requires at least four samples per class for good prediction.least four samples per class for good prediction.
128
Prediction Analysis MicroarrayPrediction Analysis MicroarrayPAMPAM
Uses Shrunken Centroid algorithm developed by Uses Shrunken Centroid algorithm developed by TibshiraniTibshirani’’s group (Stanford).s group (Stanford).
Similar to Nearest Centroid but the centroids are Similar to Nearest Centroid but the centroids are shrunk towards each other based on shrinking the shrunk towards each other based on shrinking the class means for each gene towards an overall mean.class means for each gene towards an overall mean.
Amount of shrinking is determined by a tuning Amount of shrinking is determined by a tuning parameter delta and the number of genes included parameter delta and the number of genes included in the classifier is determined by the value of delta.in the classifier is determined by the value of delta.
129
Important notesImportant notes
Cross validation is only valid if the test set is Cross validation is only valid if the test set is not used in any way in the development of the not used in any way in the development of the model. model.
With proper CV, the model must be developed With proper CV, the model must be developed from scratch for each leavefrom scratch for each leave--oneone--out training set. out training set. This means that feature selection must be This means that feature selection must be repeated for each leaverepeated for each leave--oneone--out.out.
130
[Hands[Hands--on instructionson instructions ]][Class prediction [Class prediction ––Pomeroy data]Pomeroy data]
1.1. Run the Class Prediction tool by clicking on Run the Class Prediction tool by clicking on ArrayTools ArrayTools Class prediction Class prediction Class predictionClass prediction..
2.2. Select the Select the MeduloMedulo vsvs GlioGlio variable as the column defining the variable as the column defining the classes. Check the box for using the Random Variance Model.classes. Check the box for using the Random Variance Model.
3.3. Choose the univariate significance alpha=0.001.Choose the univariate significance alpha=0.001.
4.4. Select Select Options, Options, check the box forcheck the box for Use separate test setUse separate test set, and , and select the column select the column ““TrainingSetTrainingSet””..
5.5. Leave all other options at default levels, and click Leave all other options at default levels, and click OKOK..
6.6. Note the Array Ids which have been misclassified by all Note the Array Ids which have been misclassified by all methods.methods.

131
PlugPlug--in utilityin utility
A plugA plug--in utility now allows users to create their own in utility now allows users to create their own tools by writing their own scripts written in the R tools by writing their own scripts written in the R languagelanguage
Tools created using the plugTools created using the plug--in utility can be in utility can be distributed to other users, and added to the Plugin distributed to other users, and added to the Plugin menumenu
The userThe user--created plugcreated plug--ins are stored in the Plugins ins are stored in the Plugins folder of the ArrayTools installation folderfolder of the ArrayTools installation folder
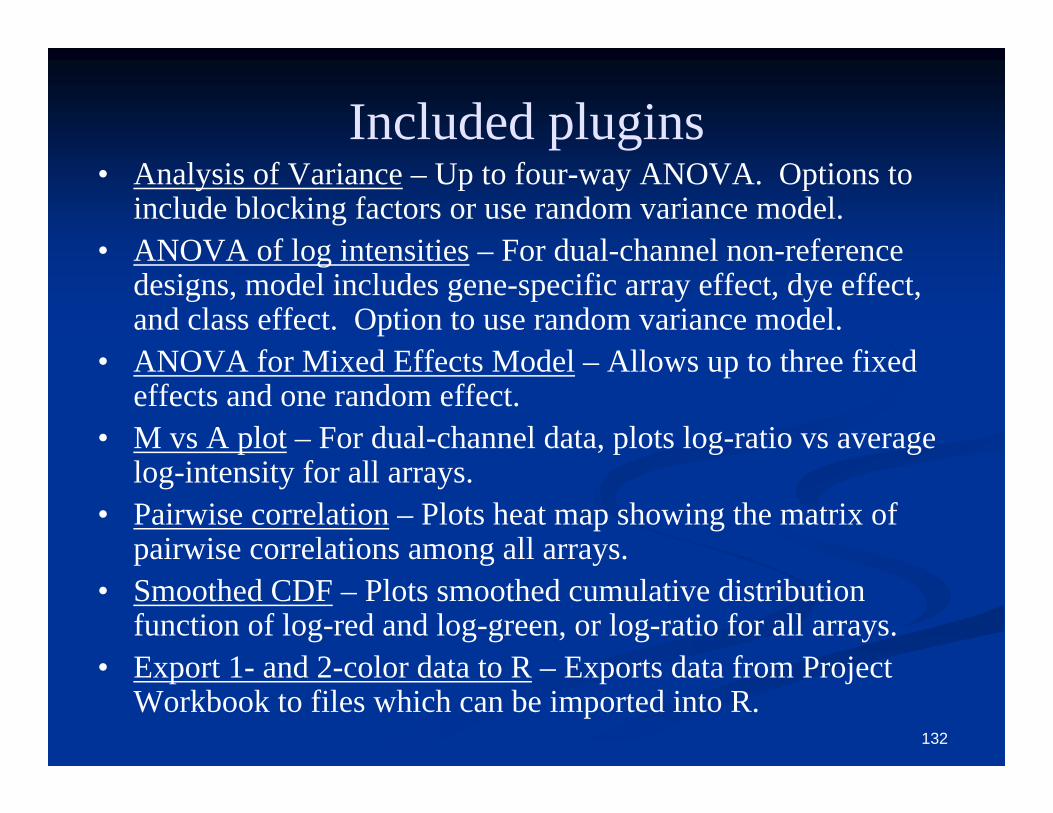
132
Included plugins• Analysis of Variance – Up to four-way ANOVA. Options to
include blocking factors or use random variance model.• ANOVA of log intensities – For dual-channel non-reference
designs, model includes gene-specific array effect, dye effect, and class effect. Option to use random variance model.
• ANOVA for Mixed Effects Model – Allows up to three fixed effects and one random effect.
• M vs A plot – For dual-channel data, plots log-ratio vs average log-intensity for all arrays.
• Pairwise correlation – Plots heat map showing the matrix of pairwise correlations among all arrays.
• Smoothed CDF – Plots smoothed cumulative distribution function of log-red and log-green, or log-ratio for all arrays.
• Export 1- and 2-color data to R – Exports data from Project Workbook to files which can be imported into R.
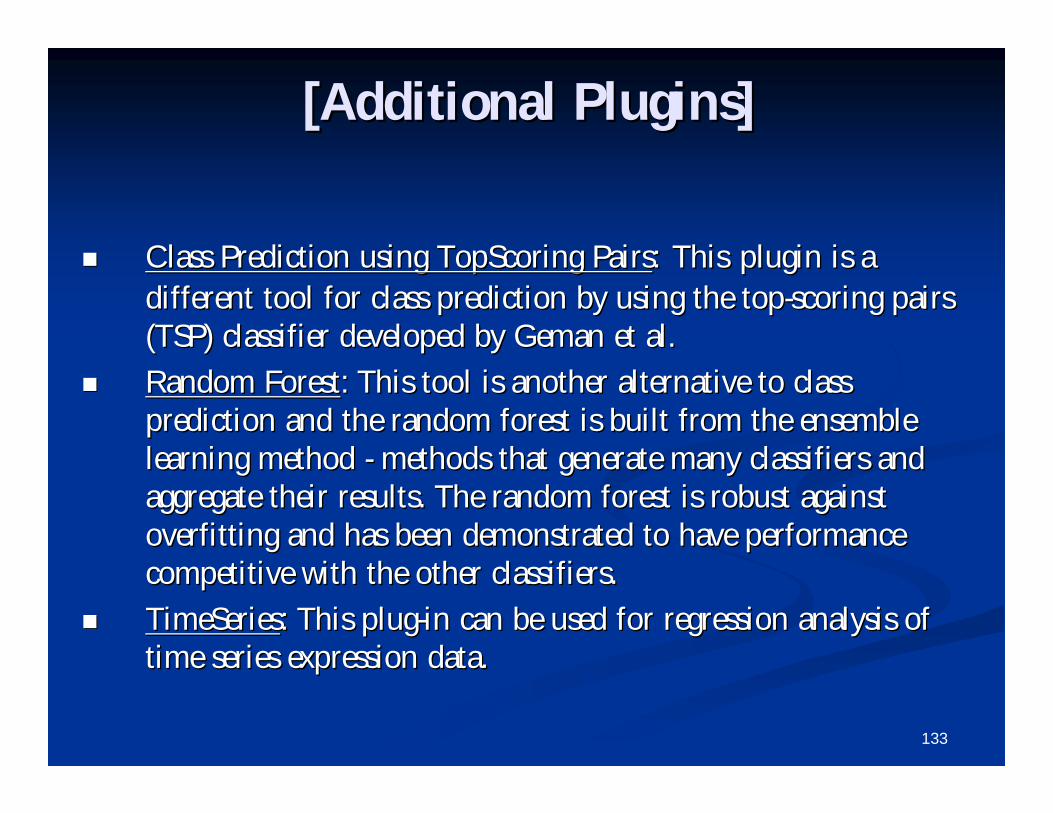
133
[Additional Plugins][Additional Plugins]
Class Prediction using TopScoring PairsClass Prediction using TopScoring Pairs:: ThisThis plugin is a plugin is a different tool for class prediction by using the topdifferent tool for class prediction by using the top--scoring pairs scoring pairs (TSP) classifier developed by Geman et al.(TSP) classifier developed by Geman et al.
Random ForestRandom Forest: This tool is another alternative to class : This tool is another alternative to class prediction and the random forest is built from the ensemble prediction and the random forest is built from the ensemble learning method learning method -- methods that generate many classifiers and methods that generate many classifiers and aggregate their results. The random forest is robust against aggregate their results. The random forest is robust against overfitting and has been demonstrated to have performance overfitting and has been demonstrated to have performance competitive with the other classifiers.competitive with the other classifiers.
TimeSeriesTimeSeries: This plug: This plug--in can be used for regression analysis of in can be used for regression analysis of time series expression data.time series expression data.
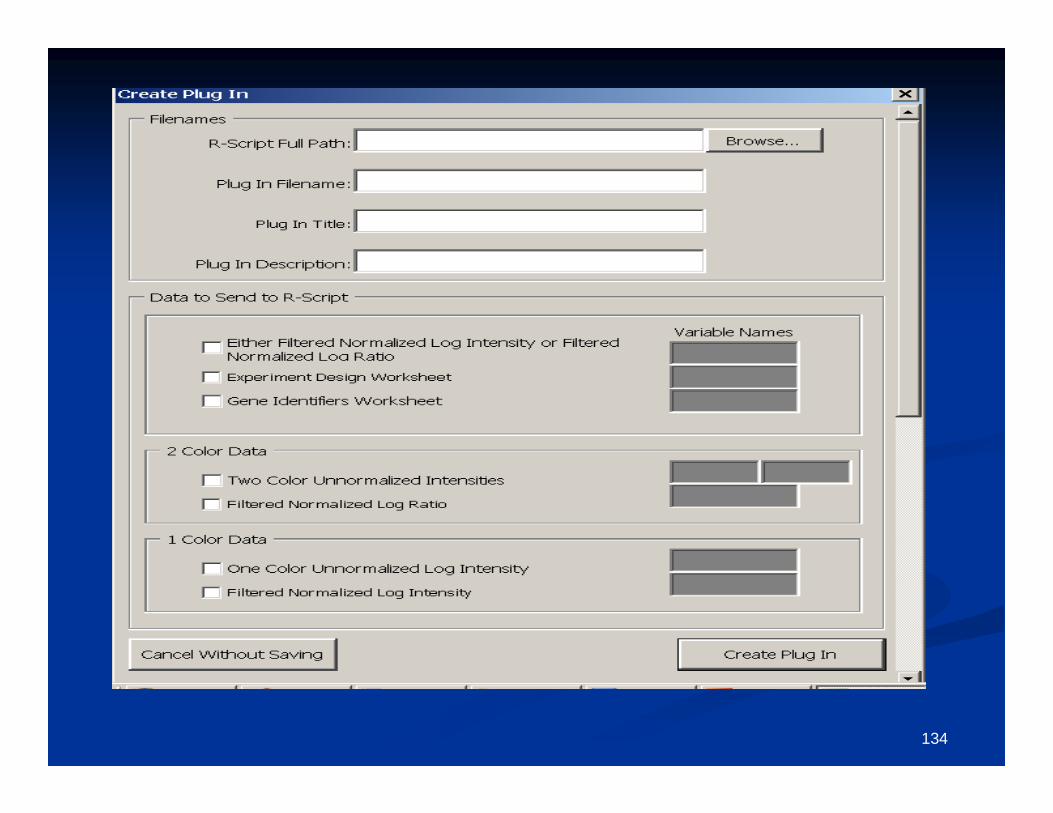
134
135
Part VI:Part VI:
Independent practiceIndependent practice(if time permits)(if time permits)
136
Further help• We hope this class has been helpful to you. This
class was not designed to be comprehensive, but only an introductory overview of the features in BRB-ArrayTools. More information about the software may be obtained from the User’s Manual (may be viewed by clicking on ArrayTools -> Support -> Manuals -> User’s Manual).
• Supplementary material on analysis algorithms may be found in the BRB technical reports: http://linus.nci.nih.gov/~brb/TechReport.htm
137
AcknowledgementsAcknowledgements
Dr. Richard Simon and Biometrics Branch Dr. Richard Simon and Biometrics Branch members.members.
BRBBRB--ArrayToolsArrayTools development team (past and development team (past and present).present).
User community.User community.
138
Technical supportTechnical support
For questions of a general nature, post a message For questions of a general nature, post a message to the BRBto the BRB--ArrayTools Message Board:ArrayTools Message Board:
To report bugs, send email toTo report bugs, send email to
http://linus.nci.nih.gov/cgi-bin/brb/board1.cgi
When sending files to accompany bug reports, please send attachments SEPARATELY from the text of your bug report. This is to ensure that we receive the text of your bug report even if the attachments are blocked either on the sender’s end or receiver’s end. Also, change or remove all .zip file extensions before sending files.
139
BRB-ArrayToools ListServ
with the following in the MESSAGE BODY: subscribe BRB-ArrayTools-L yourname
Once subscribed, you can always unsubscribe or set your subscription to DIGEST mode later.
To participate in ListServ, send email to
Please refrain from sending attachments with your ListServ messages. If a particular ListServ member requests to see a file, please send attachments individually to that member.
140
Feedback on this classFeedback on this class
Please fill out a feedback form before you leave Please fill out a feedback form before you leave the class.the class.
Please make your comments specific enough to Please make your comments specific enough to enable us to adjust this presentation for future enable us to adjust this presentation for future classes.classes.
Thank you for participating in this class!!Thank you for participating in this class!!
141
Exercise SectionExercise Section
UUsing the breast tumors sample data set, find genes that are sing the breast tumors sample data set, find genes that are differentially expressed for patients before and after differentially expressed for patients before and after treatment:treatment:
Obtain a gene list that contain no more than 40% of False Obtain a gene list that contain no more than 40% of False discoveries with 95% confidence.discoveries with 95% confidence.
Choosing an alternative method to the Multivariate Choosing an alternative method to the Multivariate Permutation test to control for false discoveries obtain Permutation test to control for false discoveries obtain another gene list with a 95% confidence level and another gene list with a 95% confidence level and controlling for 40% False discoveries.controlling for 40% False discoveries.
Using all genes in this sample dataset, run a scatter plot of Using all genes in this sample dataset, run a scatter plot of phenotype averages with 2 fold difference and comment on phenotype averages with 2 fold difference and comment on the up/downward regulated genes.the up/downward regulated genes.