Embed Size (px)
Citation preview
1
Month ##, 200X
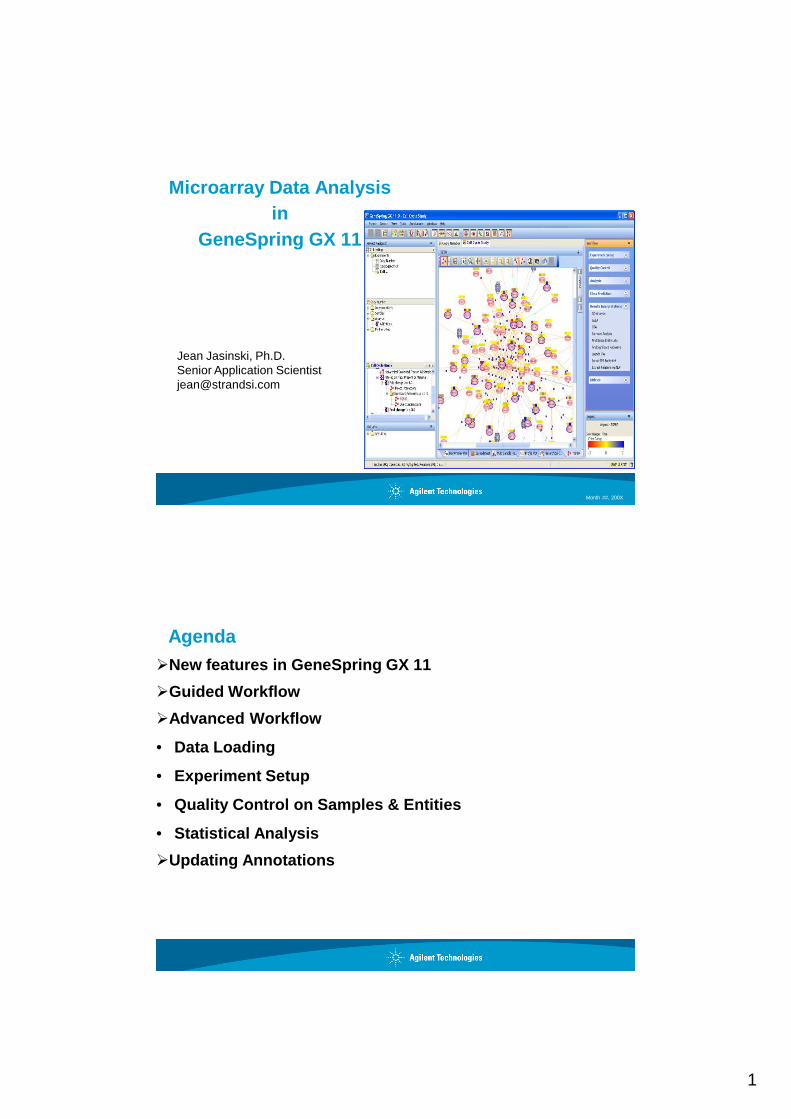
Microarray Data Analysis in
GeneSpring GX 11
Jean Jasinski, Ph.D.Senior Application [email protected]
Agenda�New features in GeneSpring GX 11
�Guided Workflow
�Advanced Workflow
• Data Loading
• Experiment Setup
• Quality Control on Samples & Entities
• Statistical Analysis
�Updating Annotations
2
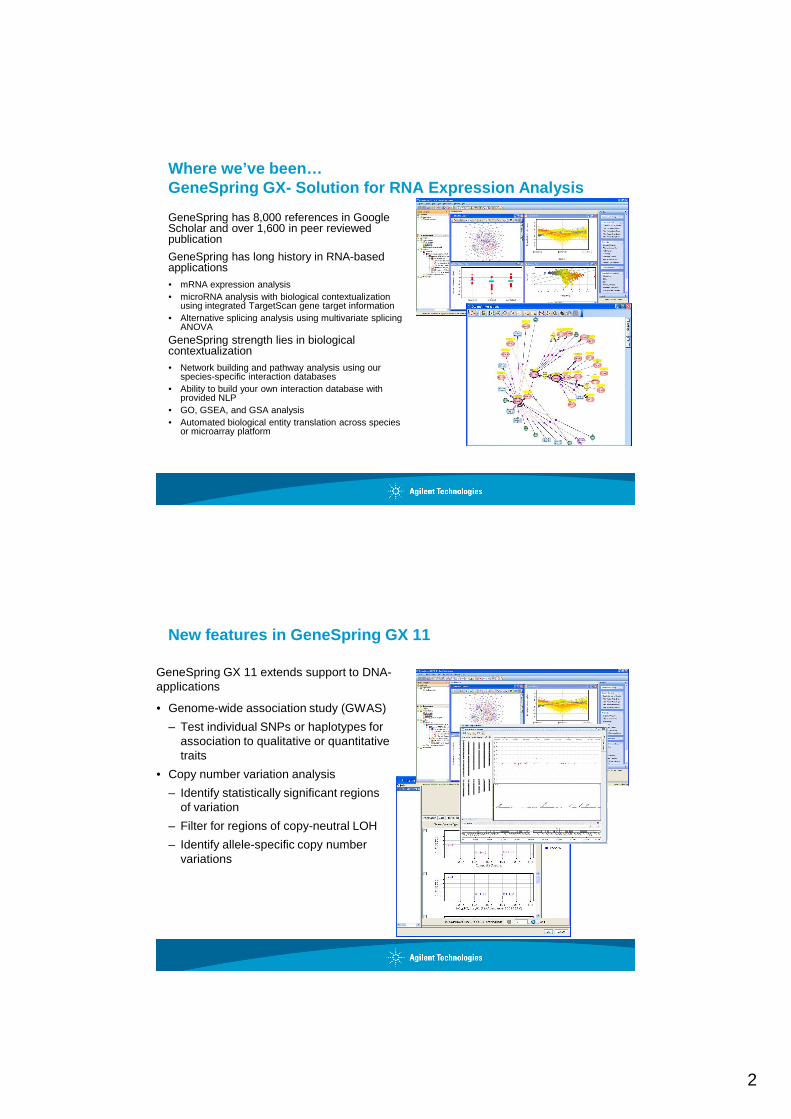
Where we’ve been… GeneSpring GX- Solution for RNA Expression Analysis
GeneSpring has 8,000 references in Google Scholar and over 1,600 in peer reviewed publication
GeneSpring has long history in RNA-based applications • mRNA expression analysis• microRNA analysis with biological contextualization
using integrated TargetScan gene target information• Alternative splicing analysis using multivariate splicing
ANOVA
GeneSpring strength lies in biological contextualization • Network building and pathway analysis using our
species-specific interaction databases• Ability to build your own interaction database with
provided NLP • GO, GSEA, and GSA analysis• Automated biological entity translation across species
or microarray platform
New features in GeneSpring GX 11
GeneSpring GX 11 extends support to DNA-applications
• Genome-wide association study (GWAS)
– Test individual SNPs or haplotypes for association to qualitative or quantitative traits
• Copy number variation analysis
– Identify statistically significant regions of variation
– Filter for regions of copy-neutral LOH
– Identify allele-specific copy number variations
3
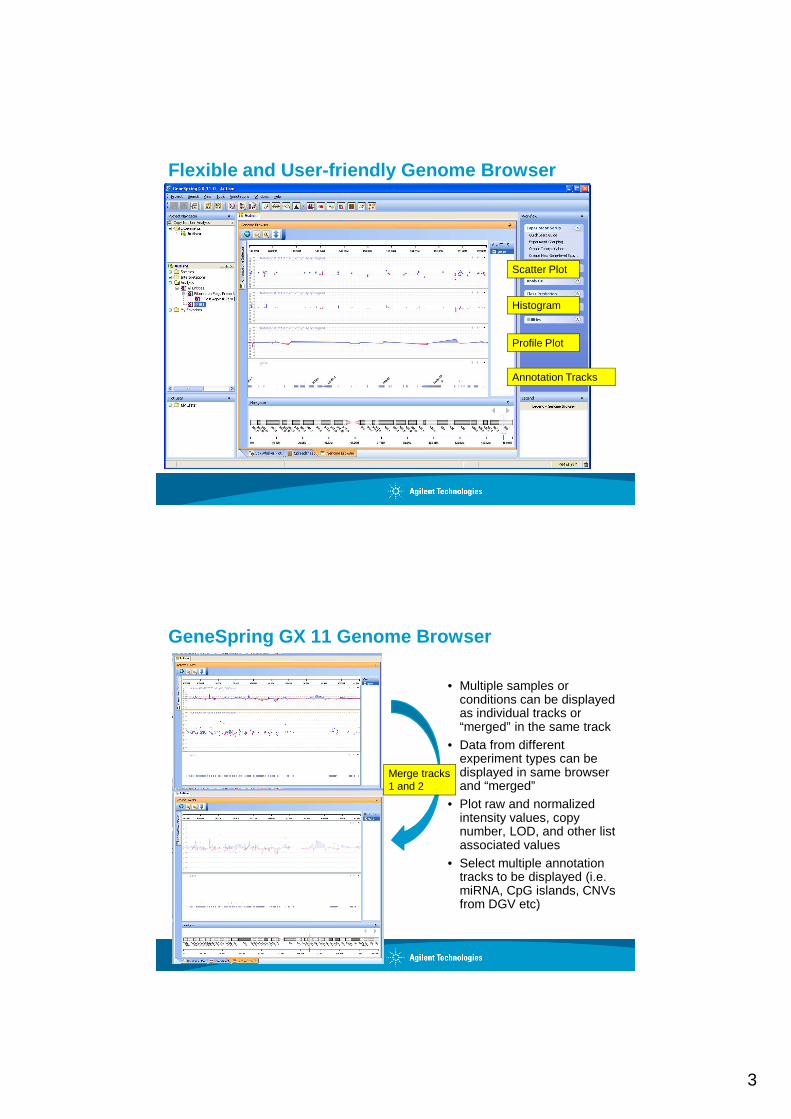
Flexible and User-friendly Genome Browser
Scatter Plot
Histogram
Profile Plot
Annotation Tracks
GeneSpring GX 11 Genome Browser
• Multiple samples or conditions can be displayed as individual tracks or “merged” in the same track
• Data from different experiment types can be displayed in same browser and “merged”
• Plot raw and normalized intensity values, copy number, LOD, and other list associated values
• Select multiple annotation tracks to be displayed (i.e. miRNA, CpG islands, CNVs from DGV etc)
Merge tracks 1 and 2
4
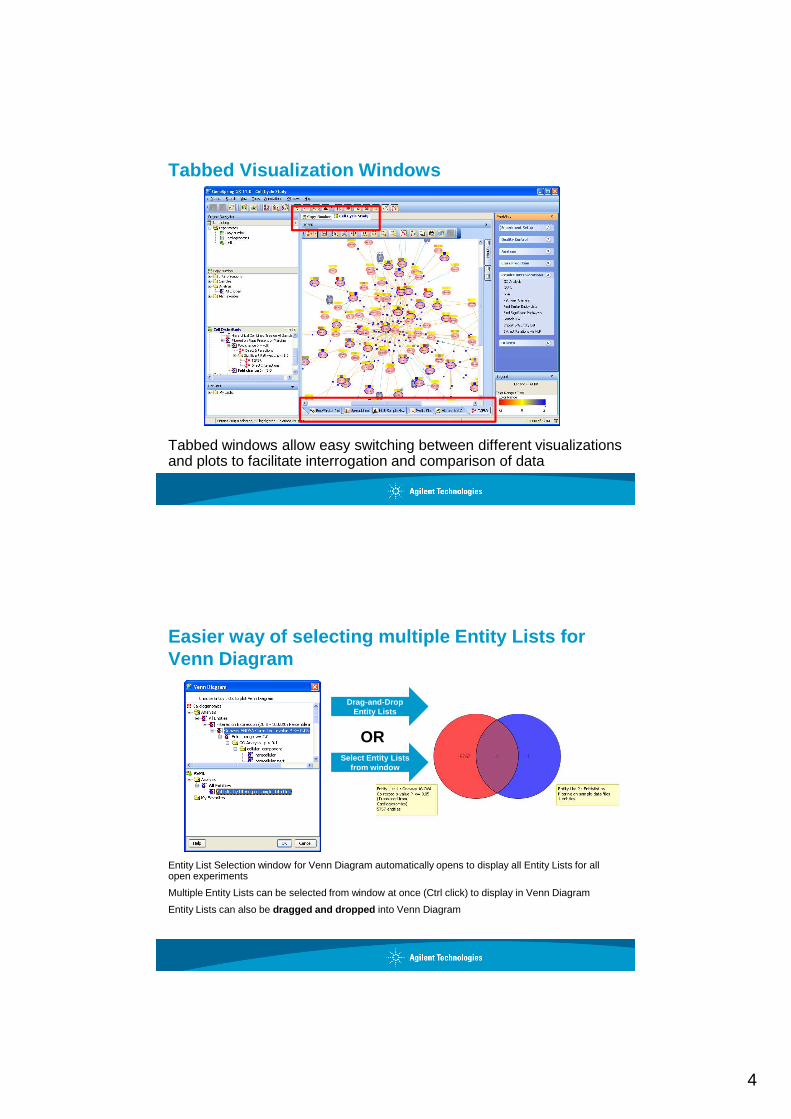
Tabbed Visualization Windows
Tabbed windows allow easy switching between different visualizations and plots to facilitate interrogation and comparison of data
Easier way of selecting multiple Entity Lists for Venn Diagram
Entity List Selection window for Venn Diagram automatically opens to display all Entity Lists for all open experiments
Multiple Entity Lists can be selected from window at once (Ctrl click) to display in Venn Diagram
Entity Lists can also be dragged and dropped into Venn Diagram
Select Entity Lists from window
Drag-and-Drop Entity Lists
OR

5
Find Entity In View
Ctrl + F
Ctrl + I
Support for Affymetrix Text and Pivot Files
• Affymetrix text and pivot files can be now be imported into standard Affymetrix technologies that support .CEL and .CHP files
– No longer need to create Generic Data for Affymetrix text and pivot files, as data file format is automatically recognized
6
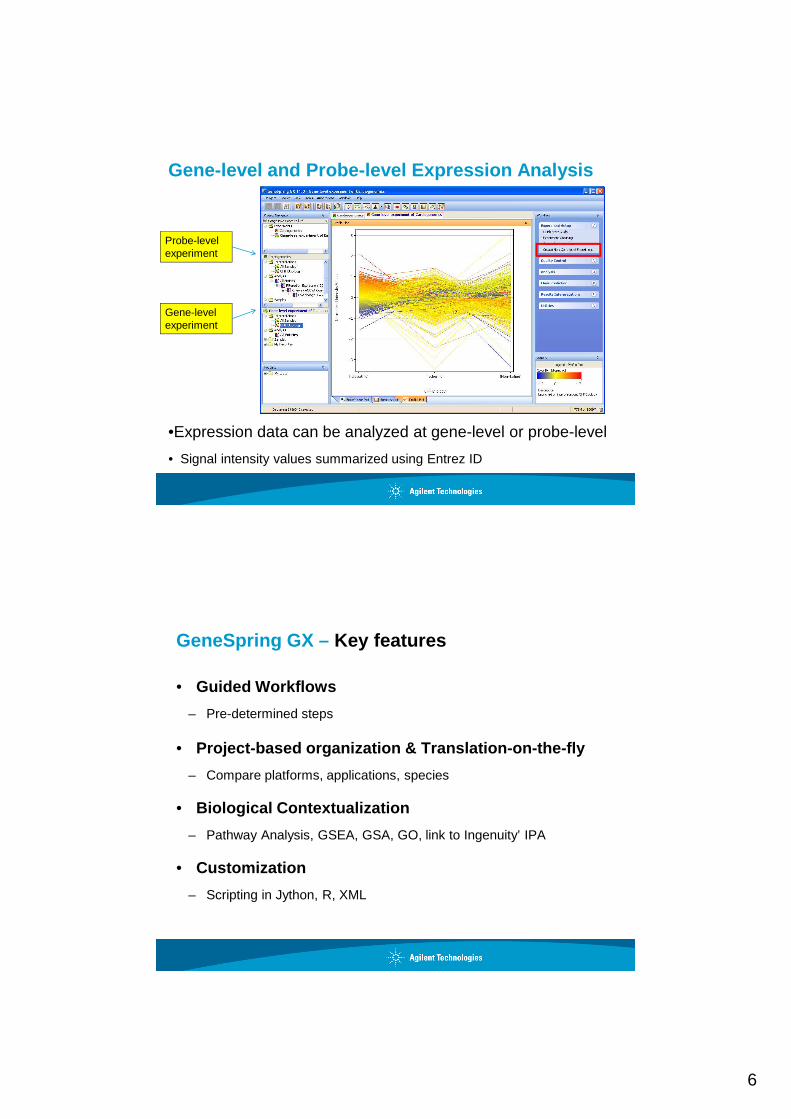
Gene-level and Probe-level Expression Analysis
•Expression data can be analyzed at gene-level or probe-level
• Signal intensity values summarized using Entrez ID
Probe-level experiment
Gene-level experiment
GeneSpring GX – Key features
• Guided Workflows
– Pre-determined steps
• Project-based organization & Translation-on-the-fly
– Compare platforms, applications, species
• Biological Contextualization
– Pathway Analysis, GSEA, GSA, GO, link to Ingenuity’ IPA
• Customization
– Scripting in Jython, R, XML
7
GeneSpring GX Expression Data Formats Continue the tradition of support for multiple vend ors
• Agilent - FE V 8.5 and newer (1 and 2 color)
• Affymetrix- 3’ Expression Arrays: Command Console, GCOS (.CEL, .CHP)- Exon and Gene 1.0 ST Arrays: Command Console, GCOS
• Illumina- BeadStudio and GenomeStudio
• GenePix
– GenePix Pro 3.0/ results format V1.4 and newer
• ABI
– SDS, RQ Manager (for QPCR)
• Custom formats- Text files (1 and 2 color), except Imagene
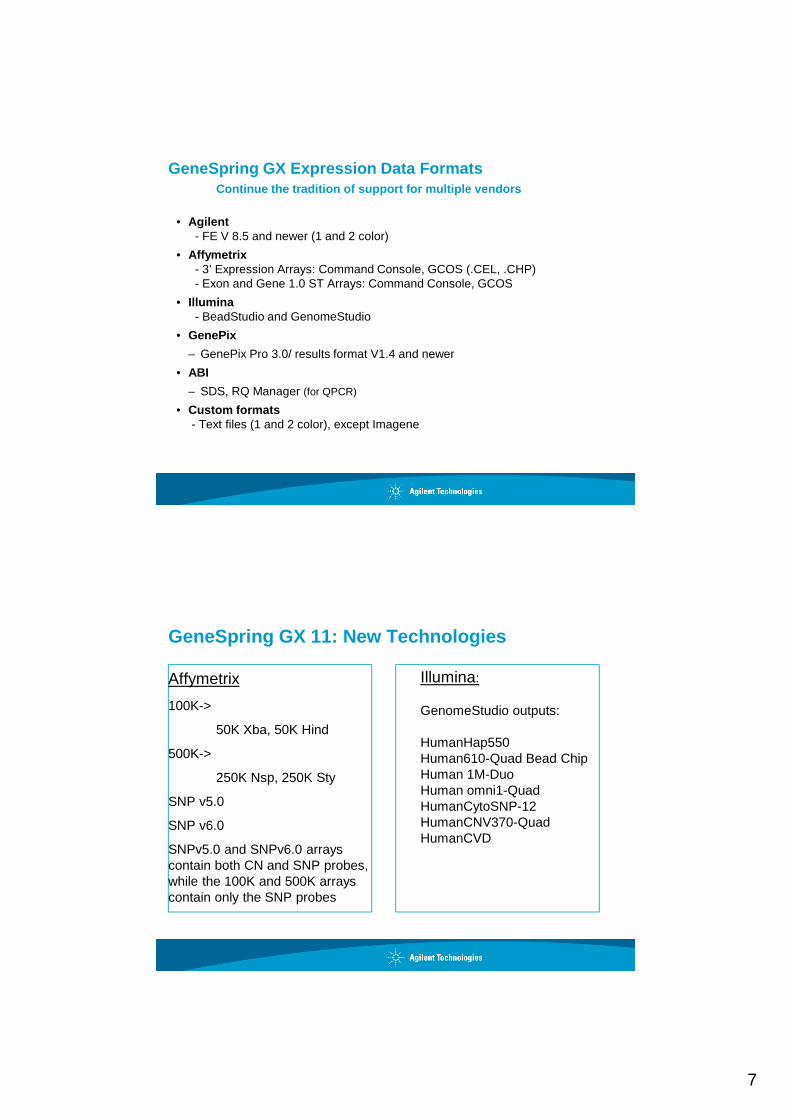
GeneSpring GX 11: New Technologies
Affymetrix
100K->
50K Xba, 50K Hind
500K->
250K Nsp, 250K Sty
SNP v5.0
SNP v6.0
SNPv5.0 and SNPv6.0 arrays contain both CN and SNP probes, while the 100K and 500K arrays contain only the SNP probes
Illumina:
GenomeStudio outputs:
HumanHap550Human610-Quad Bead ChipHuman 1M-DuoHuman omni1-QuadHumanCytoSNP-12HumanCNV370-QuadHumanCVD
8
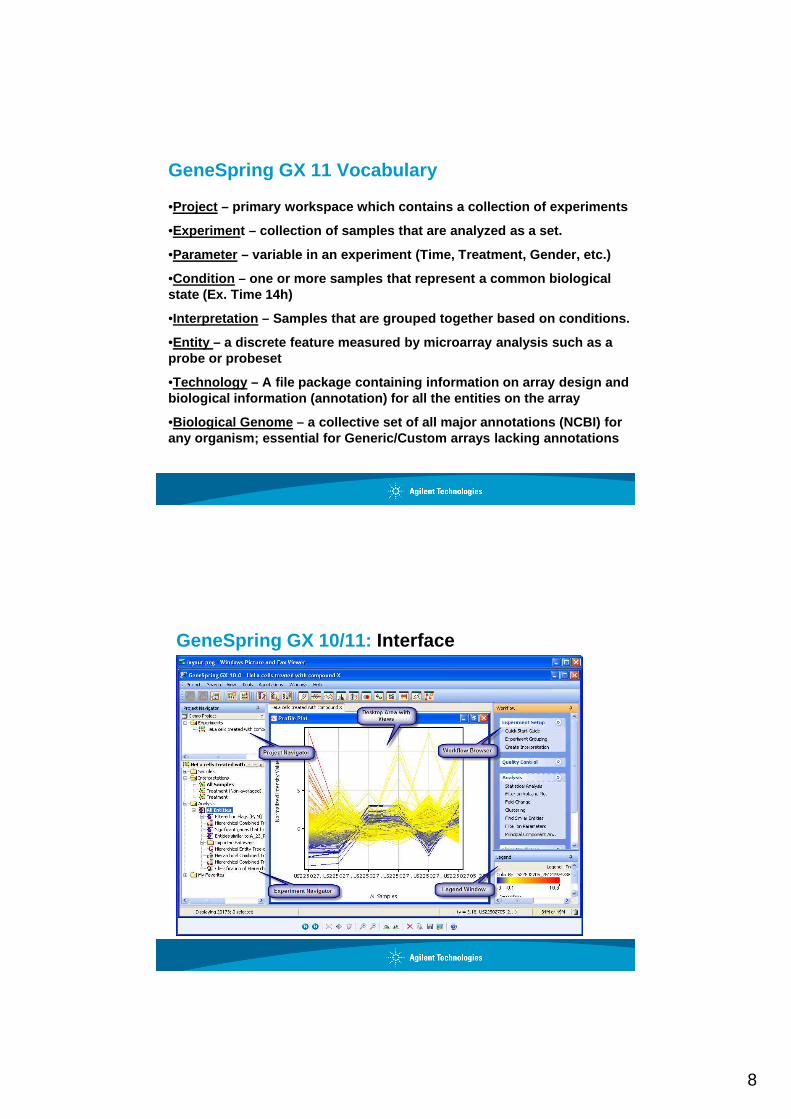
GeneSpring GX 11 Vocabulary
•Project – primary workspace which contains a collection of e xperiments
•Experimen t – collection of samples that are analyzed as a set .
•Parameter – variable in an experiment (Time, Treatment, Gender , etc.)
•Condition – one or more samples that represent a common biolog ical state (Ex. Time 14h)
•Interpretation – Samples that are grouped together based on conditi ons.
•Entity – a discrete feature measured by microarray analysis such as a probe or probeset
•Technology – A file package containing information on array des ign and biological information (annotation) for all the ent ities on the array
•Biological Genome – a collective set of all major annotations (NCBI) f or any organism; essential for Generic/Custom arrays l acking annotations
GeneSpring GX 10/11: Interface
9
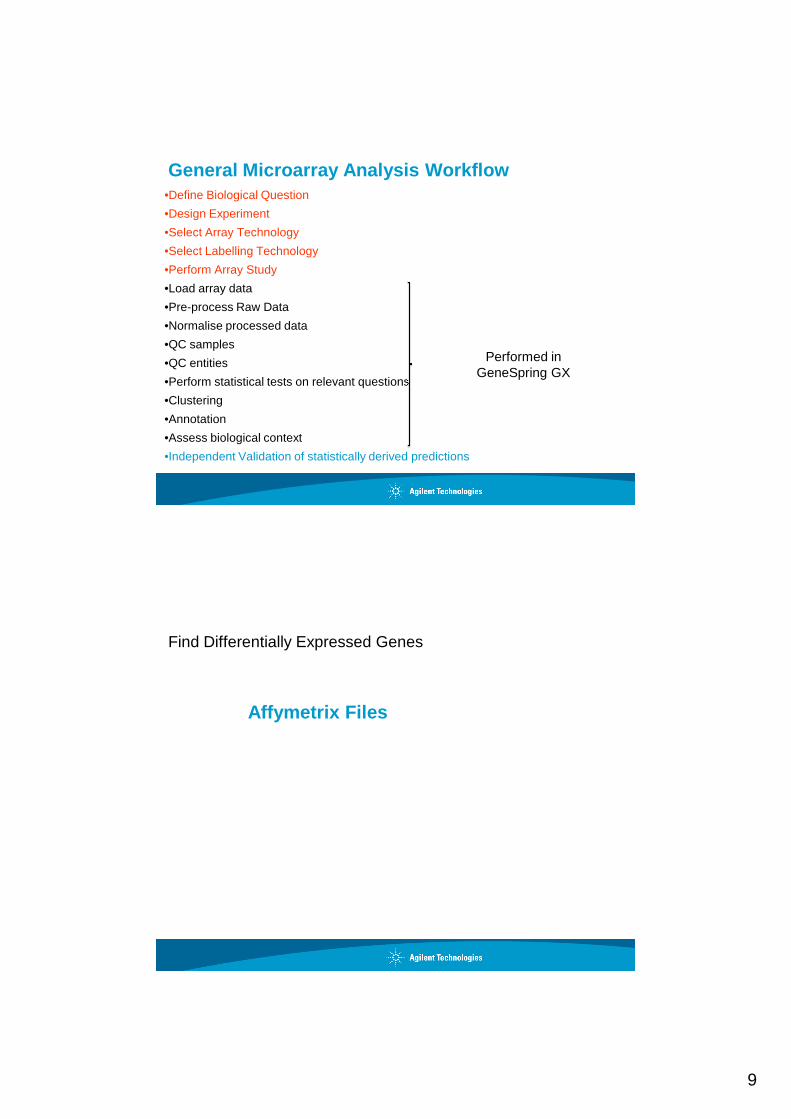
General Microarray Analysis Workflow•Define Biological Question
•Design Experiment
•Select Array Technology
•Select Labelling Technology
•Perform Array Study
•Load array data
•Pre-process Raw Data
•Normalise processed data
•QC samples
•QC entities
•Perform statistical tests on relevant questions
•Clustering
•Annotation
•Assess biological context
•Independent Validation of statistically derived predictions
Performed in GeneSpring GX
Affymetrix Files
Find Differentially Expressed Genes
10
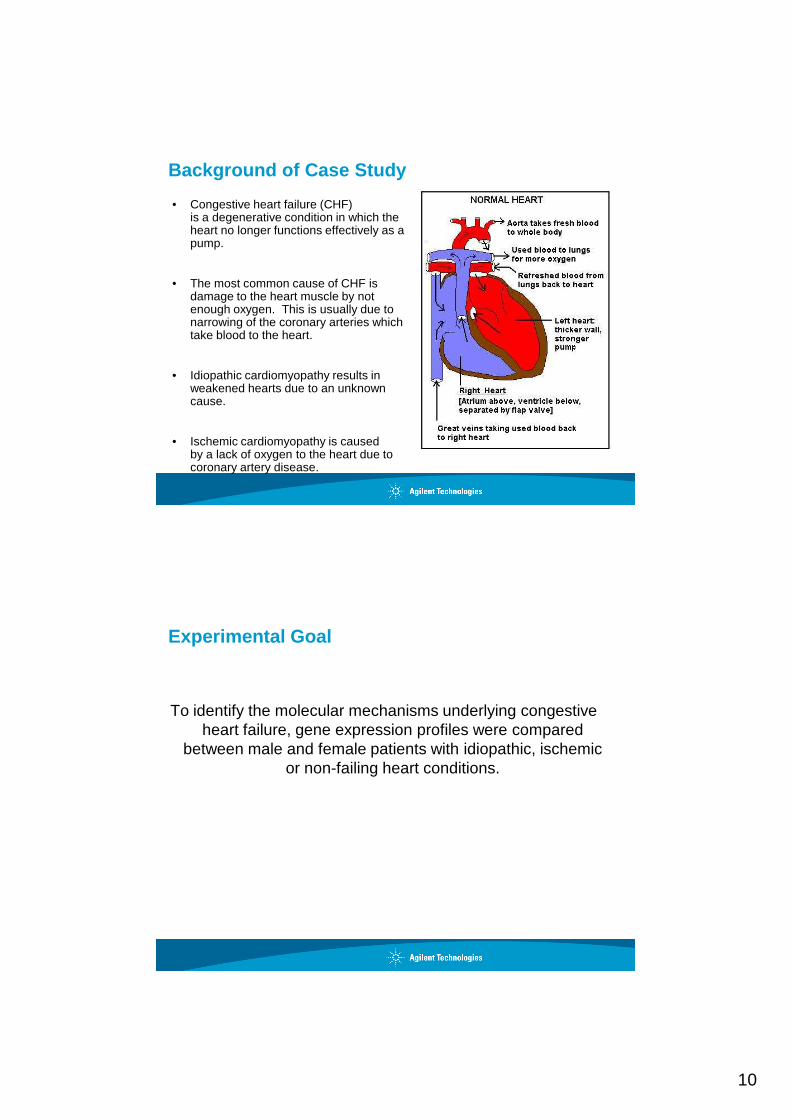
Background of Case Study
• Congestive heart failure (CHF)is a degenerative condition in which the heart no longer functions effectively as a pump.
• The most common cause of CHF isdamage to the heart muscle by not enough oxygen. This is usually due to narrowing of the coronary arteries which take blood to the heart.
• Idiopathic cardiomyopathy results in weakened hearts due to an unknown cause.
• Ischemic cardiomyopathy is causedby a lack of oxygen to the heart due to coronary artery disease.
Experimental Goal
To identify the molecular mechanisms underlying congestive heart failure, gene expression profiles were compared
between male and female patients with idiopathic, ischemic or non-failing heart conditions.
11
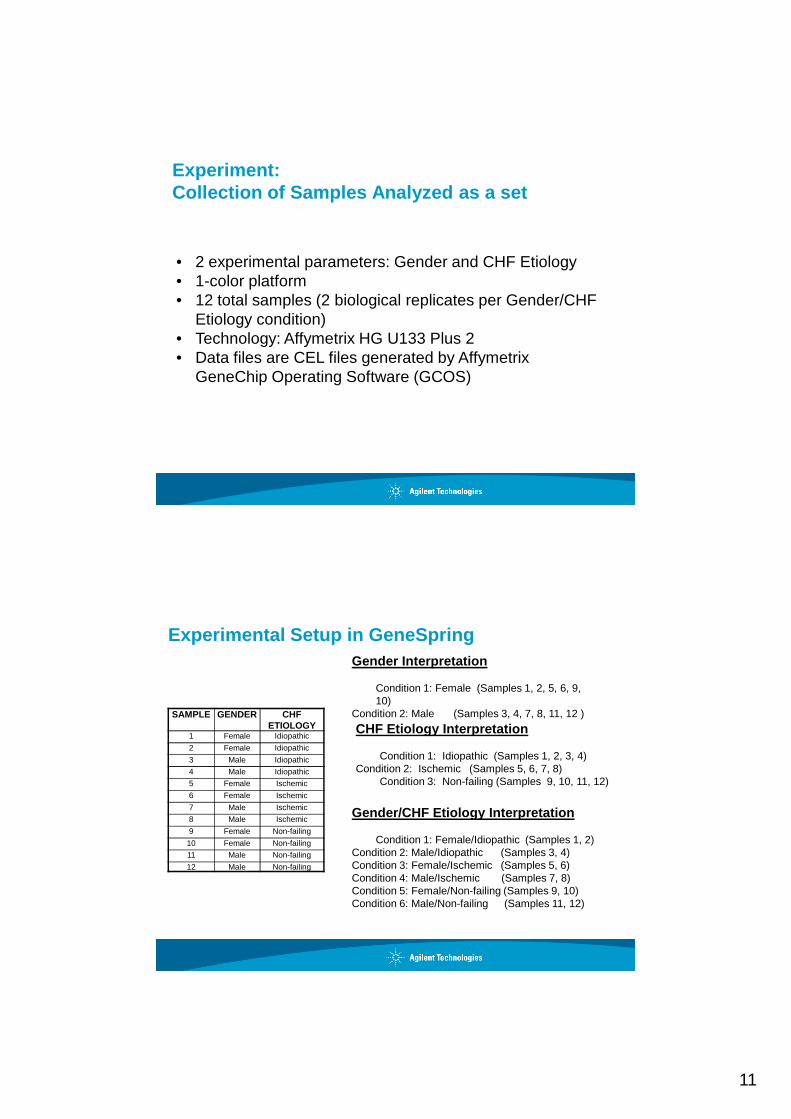
Experiment: Collection of Samples Analyzed as a set
• 2 experimental parameters: Gender and CHF Etiology• 1-color platform• 12 total samples (2 biological replicates per Gender/CHF
Etiology condition)• Technology: Affymetrix HG U133 Plus 2• Data files are CEL files generated by Affymetrix
GeneChip Operating Software (GCOS)
SAMPLE GENDER CHFETIOLOGY
1 Female Idiopathic
2 Female Idiopathic
3 Male Idiopathic
4 Male Idiopathic
5 Female Ischemic
6 Female Ischemic
7 Male Ischemic
8 Male Ischemic
9 Female Non-failing
10 Female Non-failing
11 Male Non-failing
12 Male Non-failing
Experimental Setup in GeneSpringGender Interpretation
Condition 1: Female (Samples 1, 2, 5, 6, 9, 10)
Condition 2: Male (Samples 3, 4, 7, 8, 11, 12 )
CHF Etiology Interpretation
Condition 1: Idiopathic (Samples 1, 2, 3, 4) Condition 2: Ischemic (Samples 5, 6, 7, 8)
Condition 3: Non-failing (Samples 9, 10, 11, 12)
Gender/CHF Etiology Interpretation
Condition 1: Female/Idiopathic (Samples 1, 2) Condition 2: Male/Idiopathic (Samples 3, 4)Condition 3: Female/Ischemic (Samples 5, 6)Condition 4: Male/Ischemic (Samples 7, 8)Condition 5: Female/Non-failing (Samples 9, 10)Condition 6: Male/Non-failing (Samples 11, 12)
12
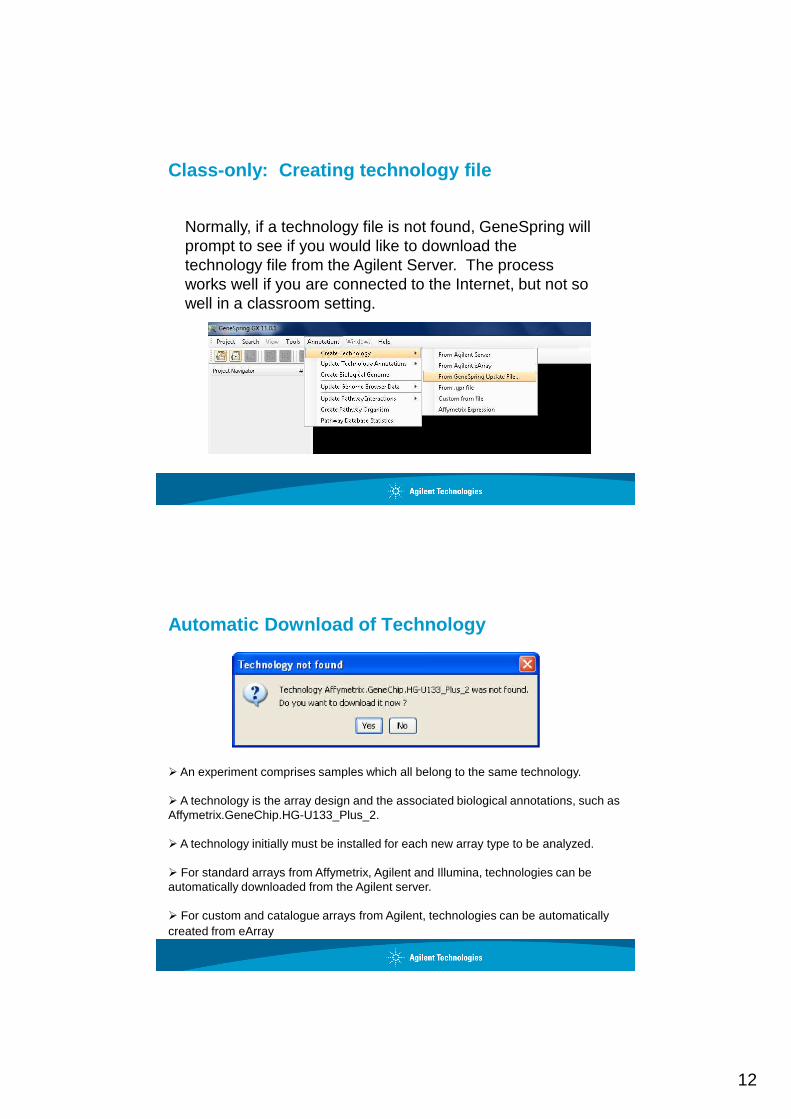
Class-only: Creating technology file
Normally, if a technology file is not found, GeneSpring will prompt to see if you would like to download the technology file from the Agilent Server. The process works well if you are connected to the Internet, but not so well in a classroom setting.
Automatic Download of Technology
� An experiment comprises samples which all belong to the same technology.
� A technology is the array design and the associated biological annotations, such as Affymetrix.GeneChip.HG-U133_Plus_2.
� A technology initially must be installed for each new array type to be analyzed.
� For standard arrays from Affymetrix, Agilent and Illumina, technologies can be automatically downloaded from the Agilent server.
� For custom and catalogue arrays from Agilent, technologies can be automatically created from eArray
13
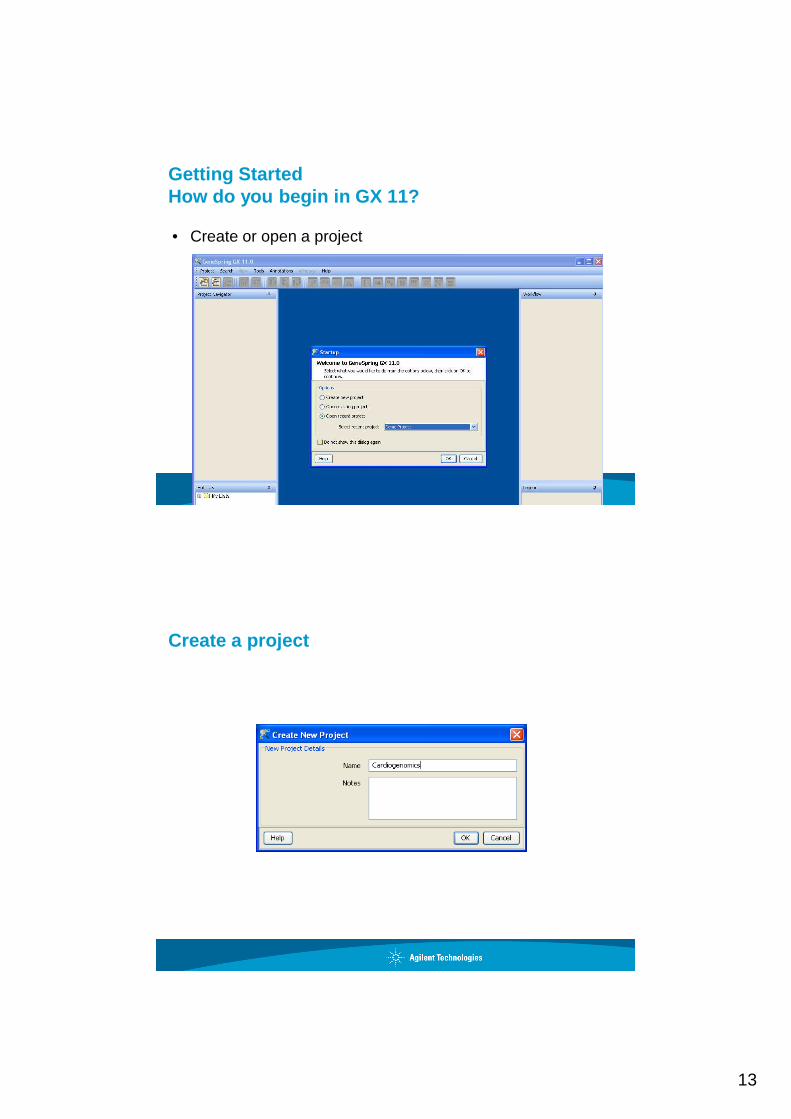
Getting StartedHow do you begin in GX 11?
• Create or open a project
Create a project
14
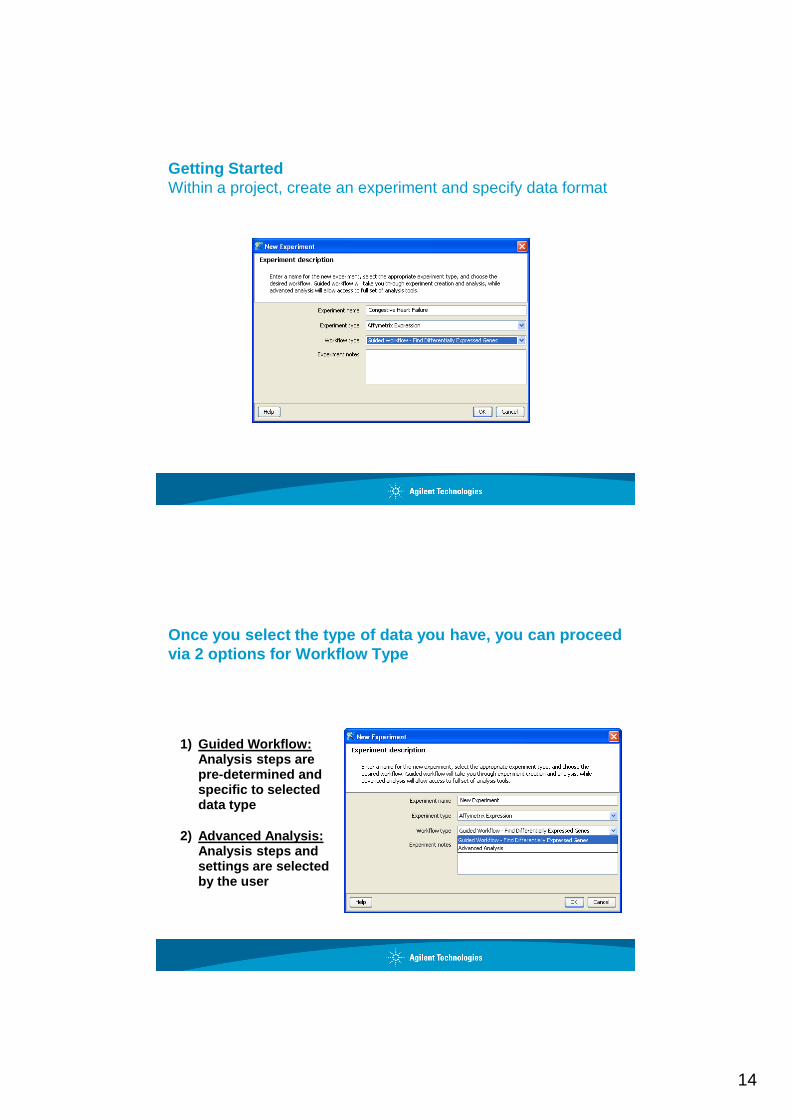
Getting StartedWithin a project, create an experiment and specify data format
Once you select the type of data you have, you can proceed via 2 options for Workflow Type
1) Guided Workflow:Analysis steps are pre-determined and specific to selected data type
2) Advanced Analysis:Analysis steps and settings are selected by the user
15
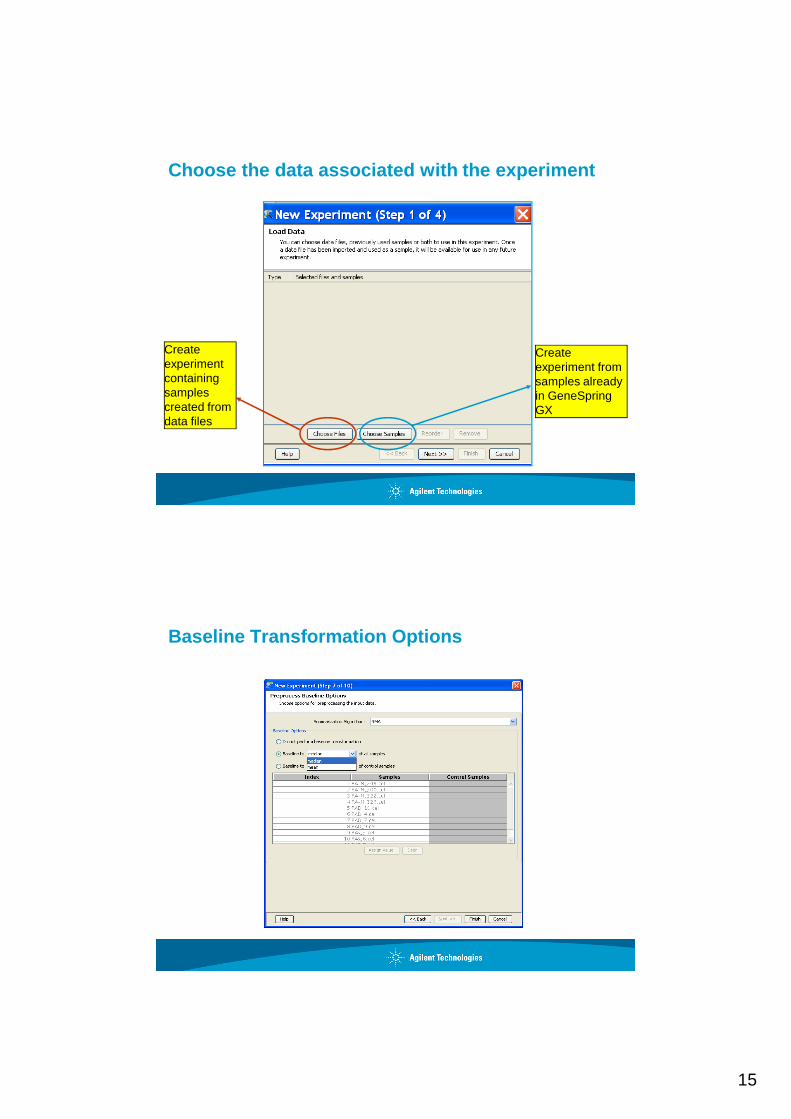
Choose the data associated with the experiment
Create experiment containing samples created from data files
Create experiment from samples already in GeneSpring GX
Baseline Transformation Options
16
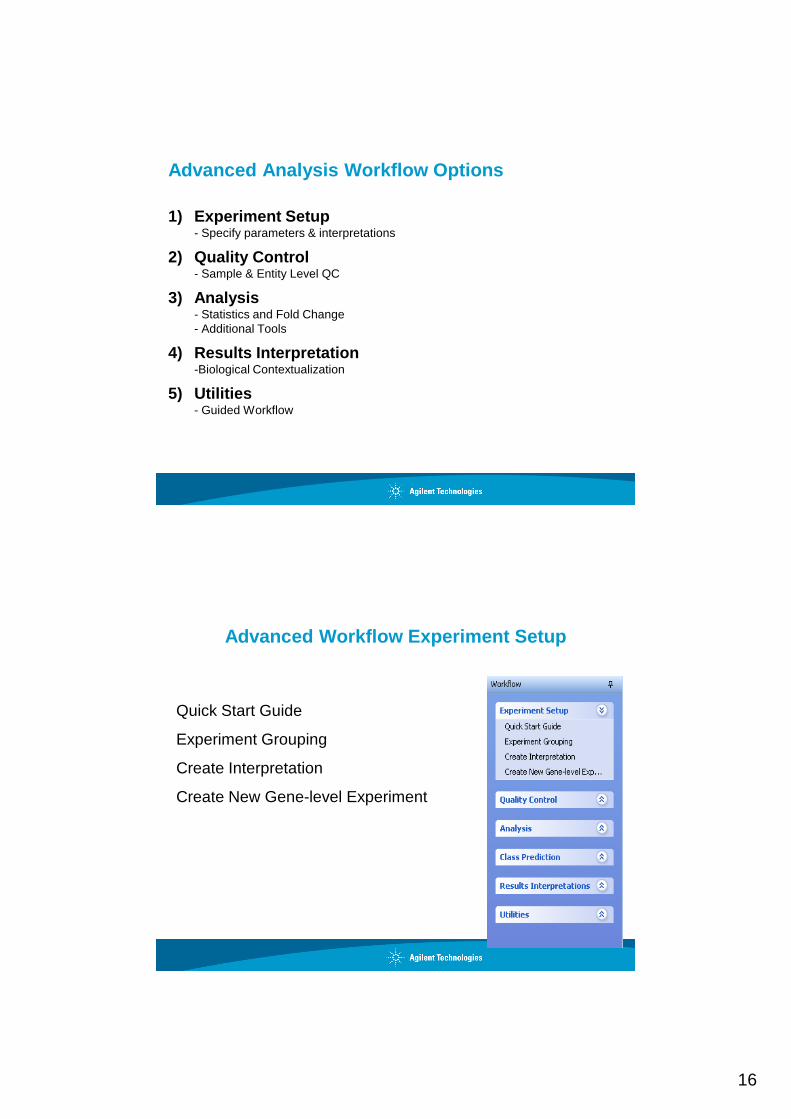
Advanced Analysis Workflow Options
1) Experiment Setup- Specify parameters & interpretations
2) Quality Control- Sample & Entity Level QC
3) Analysis- Statistics and Fold Change- Additional Tools
4) Results Interpretation-Biological Contextualization
5) Utilities- Guided Workflow
Advanced Workflow Experiment Setup
Quick Start Guide
Experiment Grouping
Create Interpretation
Create New Gene-level Experiment
17
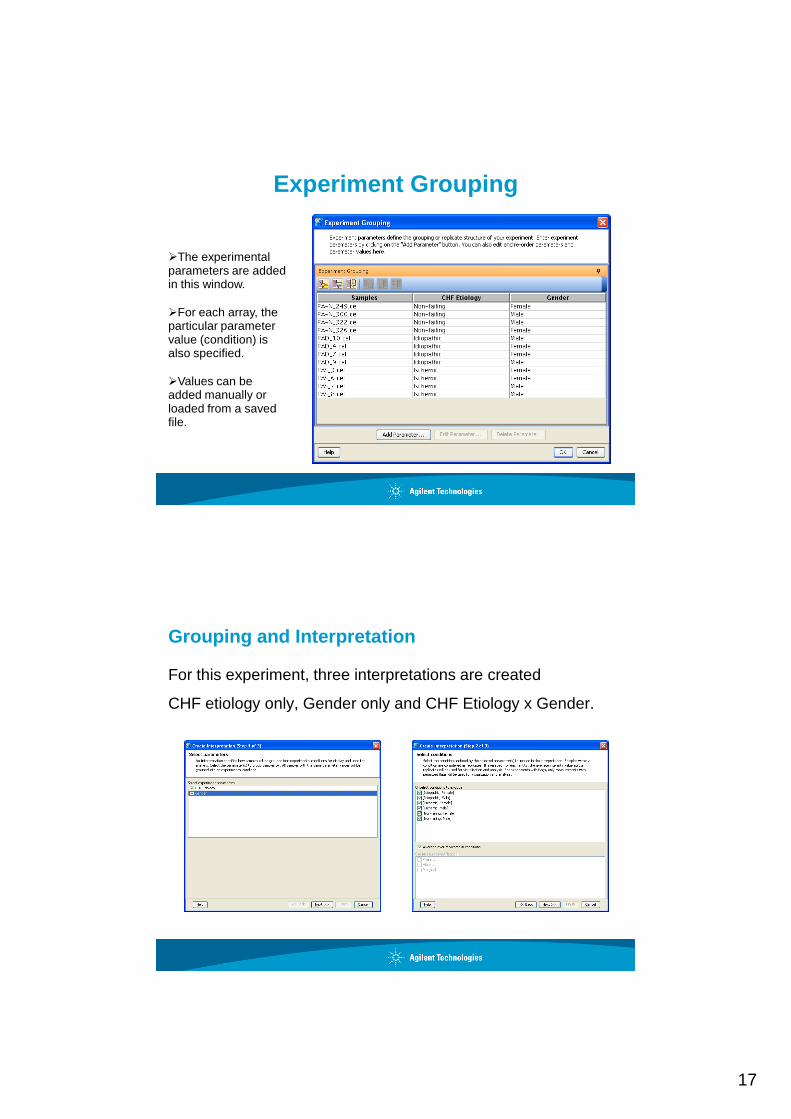
Experiment Grouping
�The experimental parameters are added in this window.
�For each array, the particular parameter value (condition) is also specified.
�Values can be added manually or loaded from a saved file.
Grouping and Interpretation
For this experiment, three interpretations are created
CHF etiology only, Gender only and CHF Etiology x Gender.
18
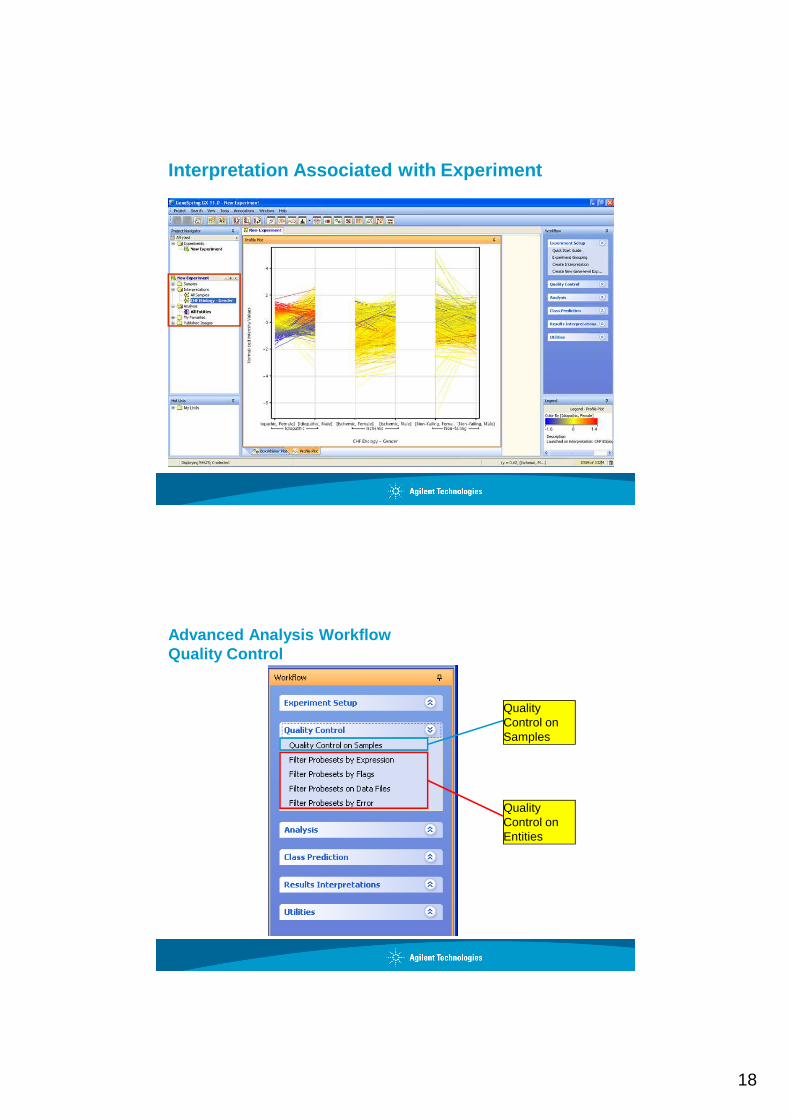
Interpretation Associated with Experiment
Advanced Analysis WorkflowQuality Control
Quality Control on Entities
Quality Control on Samples
19
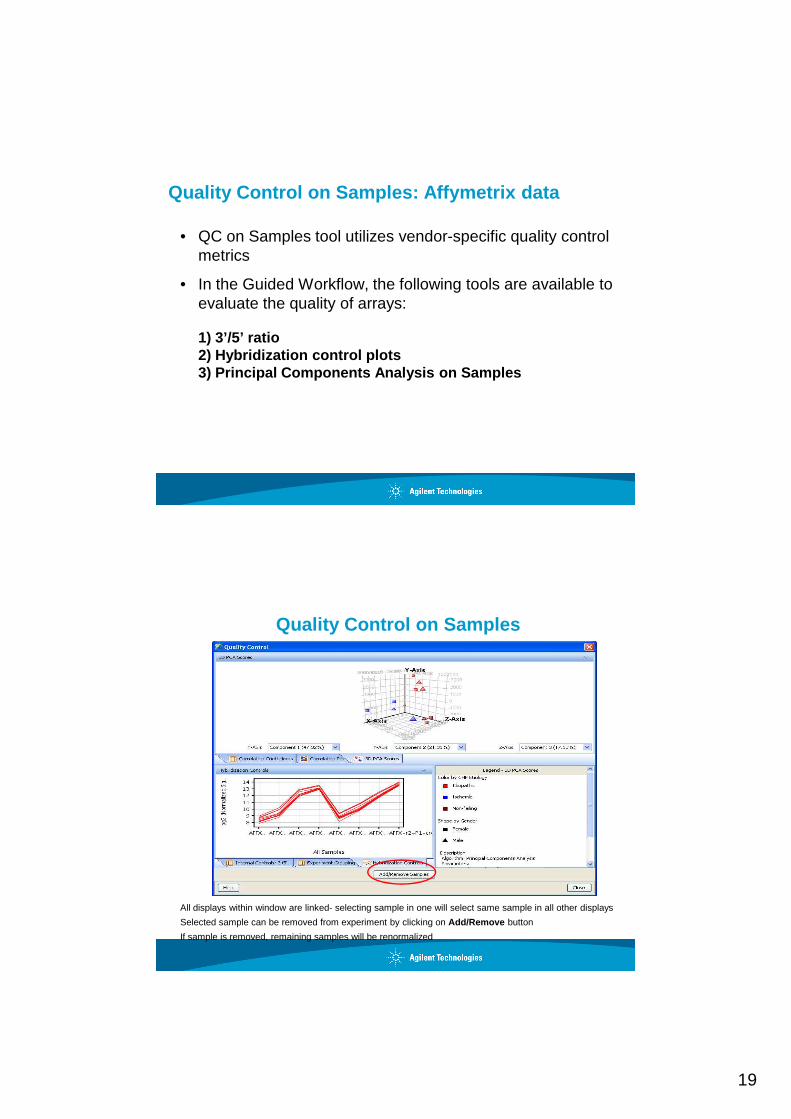
Quality Control on Samples: Affymetrix data
• QC on Samples tool utilizes vendor-specific quality control metrics
• In the Guided Workflow, the following tools are available to evaluate the quality of arrays:
1) 3’/5’ ratio2) Hybridization control plots3) Principal Components Analysis on Samples
Quality Control on Samples
All displays within window are linked- selecting sample in one will select same sample in all other displays
Selected sample can be removed from experiment by clicking on Add/Remove button
If sample is removed, remaining samples will be renormalized
20
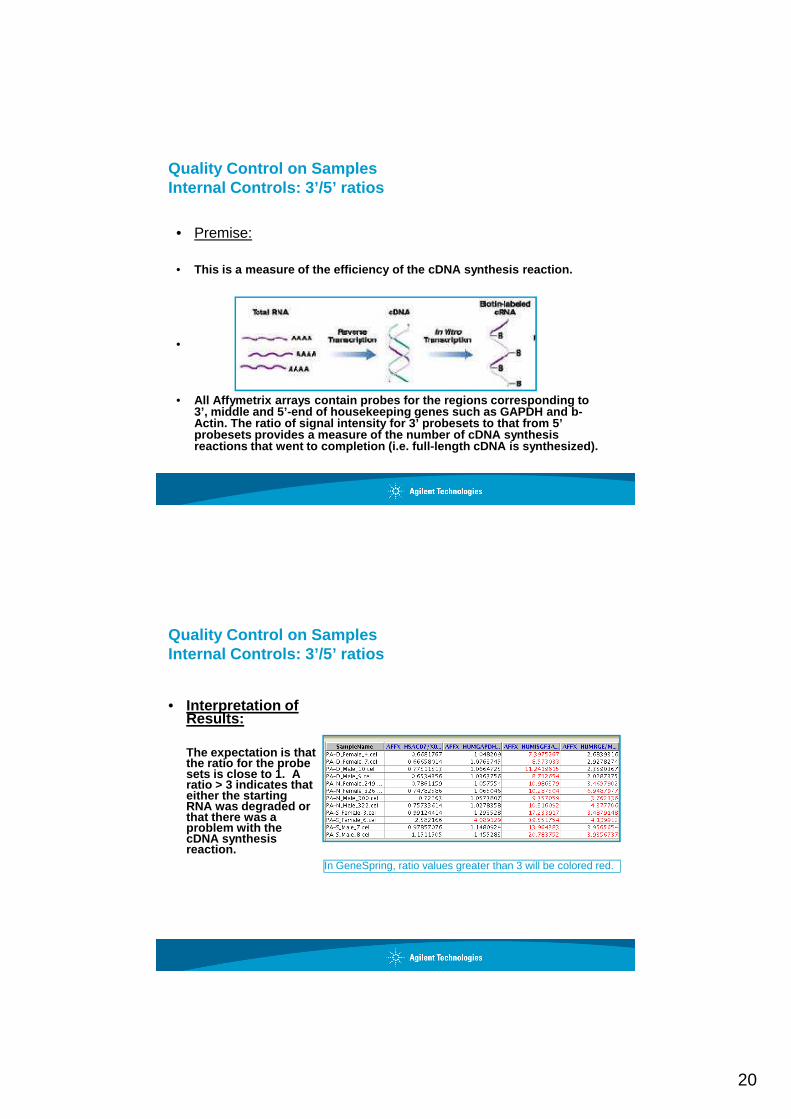
Quality Control on SamplesInternal Controls: 3’/5’ ratios
• Premise:
• This is a measure of the efficiency of the cDNA syn thesis reaction.
•
• All Affymetrix arrays contain probes for the region s corresponding to 3’, middle and 5’-end of housekeeping genes such as GAPDH and b-Actin. The ratio of signal intensity for 3’ probese ts to that from 5’ probesets provides a measure of the number of cDNA synthesis reactions that went to completion (i.e. full-length cDNA is synthesized).
Quality Control on SamplesInternal Controls: 3’/5’ ratios
• Interpretation of Results:
The expectation is that the ratio for the probe sets is close to 1. A ratio > 3 indicates that either the starting RNA was degraded or that there was a problem with the cDNA synthesis reaction.
In GeneSpring, ratio values greater than 3 will be colored red.
21
Quality Control on SamplesHybridization Control Plots
Premise:
• Pre-mixed hybridization control transcripts in know n staggered concentrations are added to the hyb mix. Hybridizat ion controls are composed of a mixture of biotin-labelled cRNA trans cripts of bioB, bioC, bioD, and cre prepared in staggered concentra tions. These controls allow you to monitor the hybridization and washing process. The signal intensity of these controls should incre ase with the concentrations. Deviations from the expected inten sity profile of these controls indicates a potential problem with the hyb or washing process.
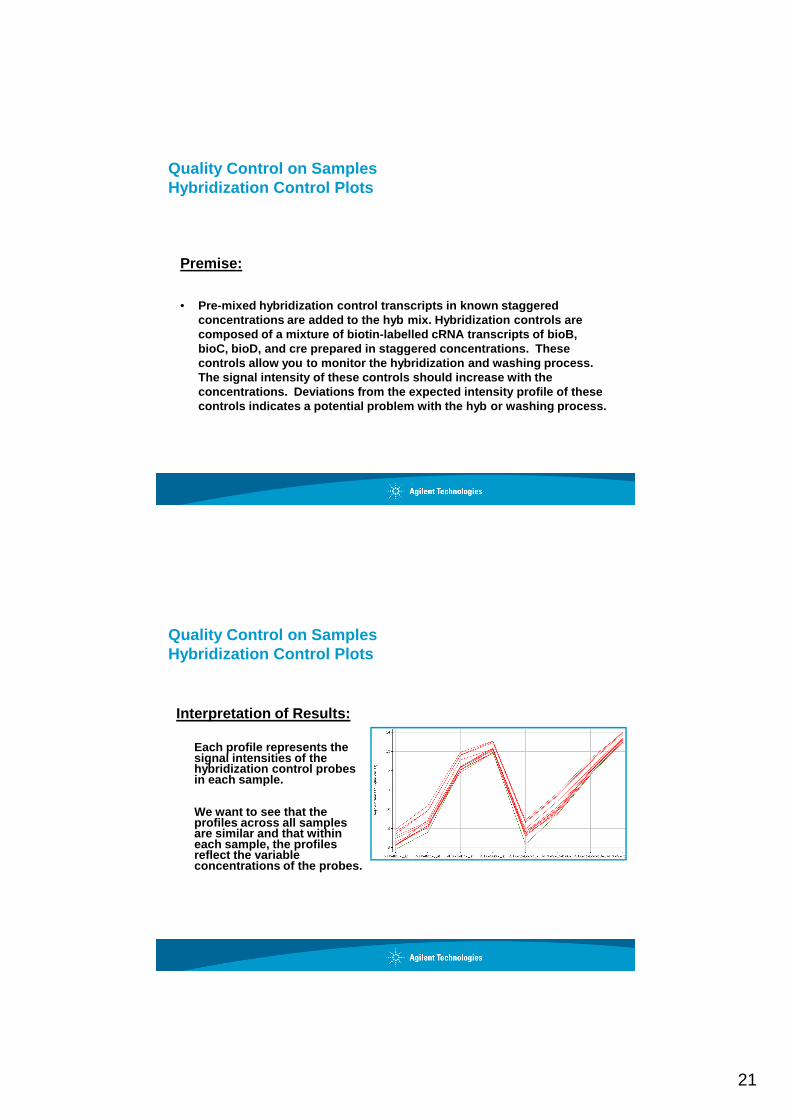
Quality Control on SamplesHybridization Control Plots
Interpretation of Results:
Each profile represents the signal intensities of the hybridization control probes in each sample.
We want to see that the profiles across all samples are similar and that within each sample, the profiles reflect the variable concentrations of the probes.
22
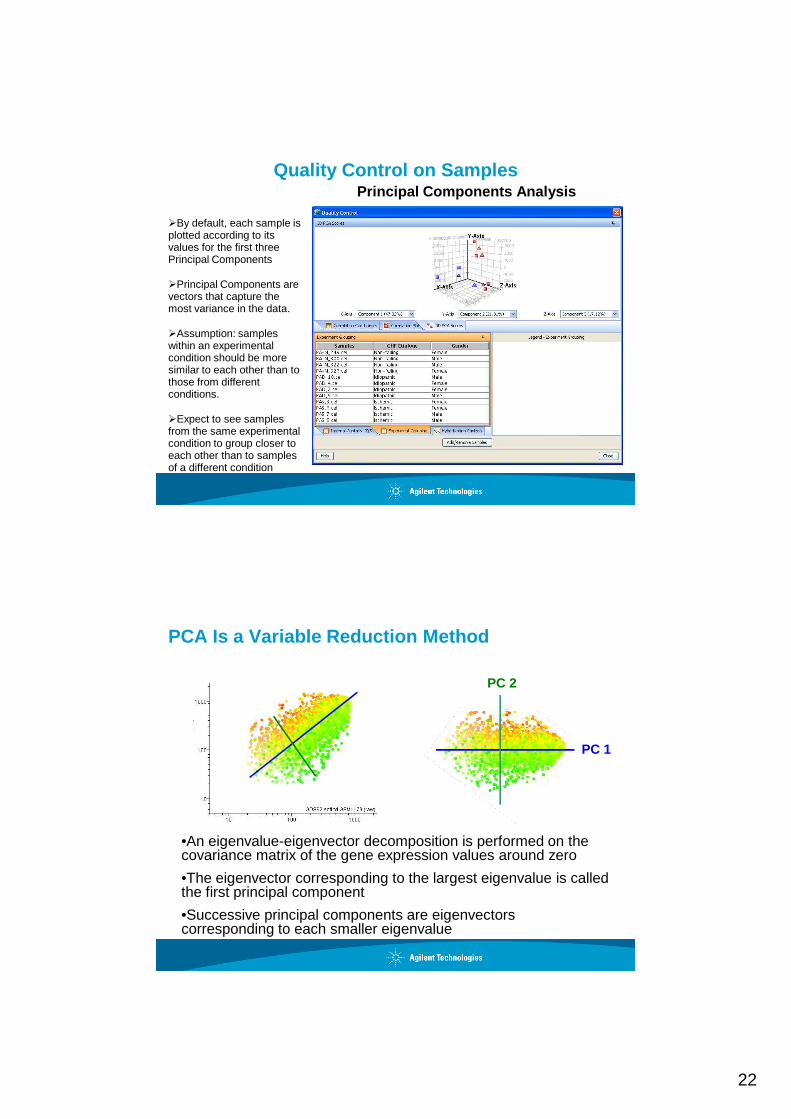
Quality Control on SamplesPrincipal Components Analysis
�By default, each sample is plotted according to its values for the first three Principal Components
�Principal Components are vectors that capture the most variance in the data.
�Assumption: samples within an experimental condition should be more similar to each other than to those from different conditions.
�Expect to see samples from the same experimental condition to group closer to each other than to samples of a different condition
PCA Is a Variable Reduction Method
•An eigenvalue-eigenvector decomposition is performed on the covariance matrix of the gene expression values around zero
•The eigenvector corresponding to the largest eigenvalue is called the first principal component
•Successive principal components are eigenvectors corresponding to each smaller eigenvalue
PC 2
PC 1
23
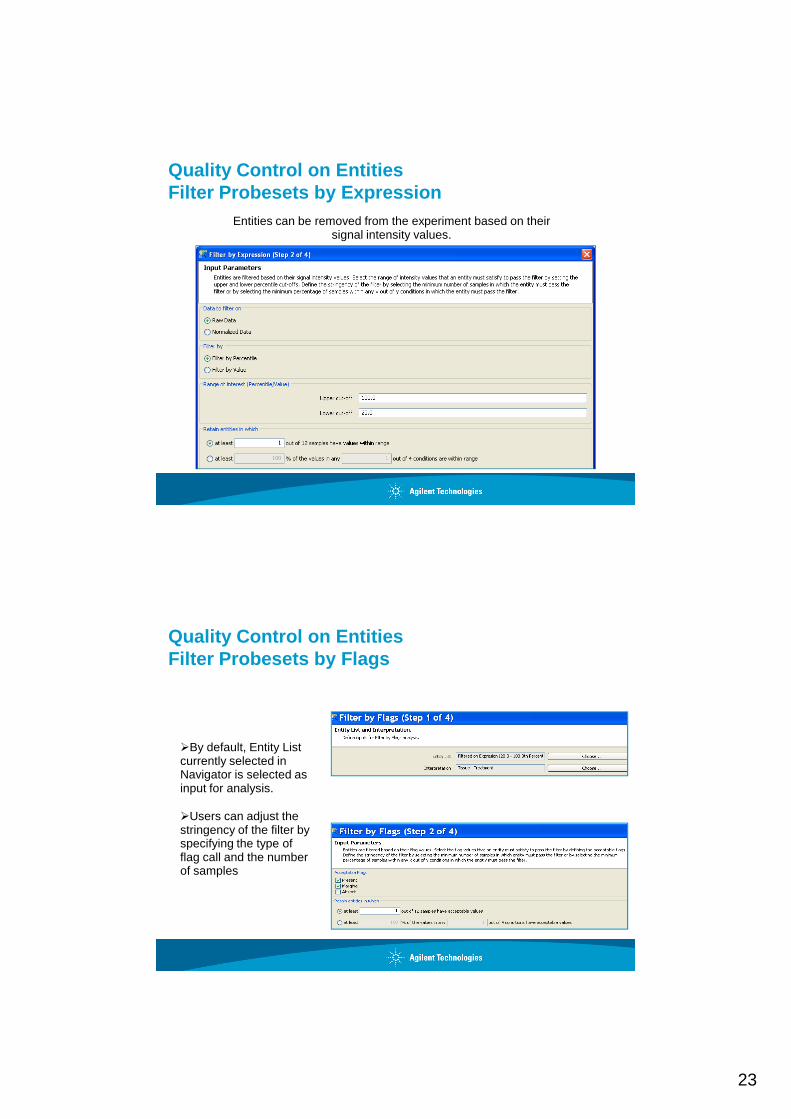
Quality Control on EntitiesFilter Probesets by Expression
Entities can be removed from the experiment based on their signal intensity values.
Quality Control on EntitiesFilter Probesets by Flags
�By default, Entity List currently selected in Navigator is selected as input for analysis.
�Users can adjust the stringency of the filter by specifying the type offlag call and the number of samples
24
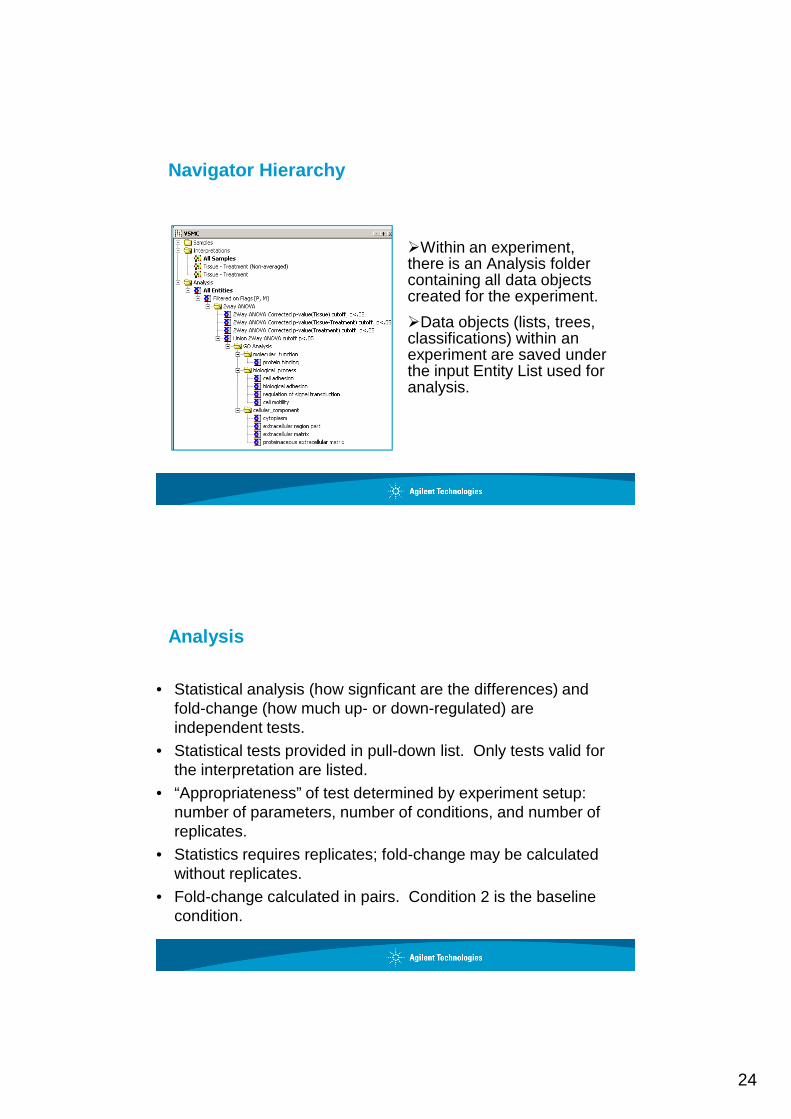
Navigator Hierarchy
�Within an experiment, there is an Analysis folder containing all data objects created for the experiment.
�Data objects (lists, trees, classifications) within an experiment are saved under the input Entity List used for analysis.
Analysis
• Statistical analysis (how signficant are the differences) and fold-change (how much up- or down-regulated) are independent tests.
• Statistical tests provided in pull-down list. Only tests valid for the interpretation are listed.
• “Appropriateness” of test determined by experiment setup: number of parameters, number of conditions, and number of replicates.
• Statistics requires replicates; fold-change may be calculated without replicates.
• Fold-change calculated in pairs. Condition 2 is the baseline condition.
25
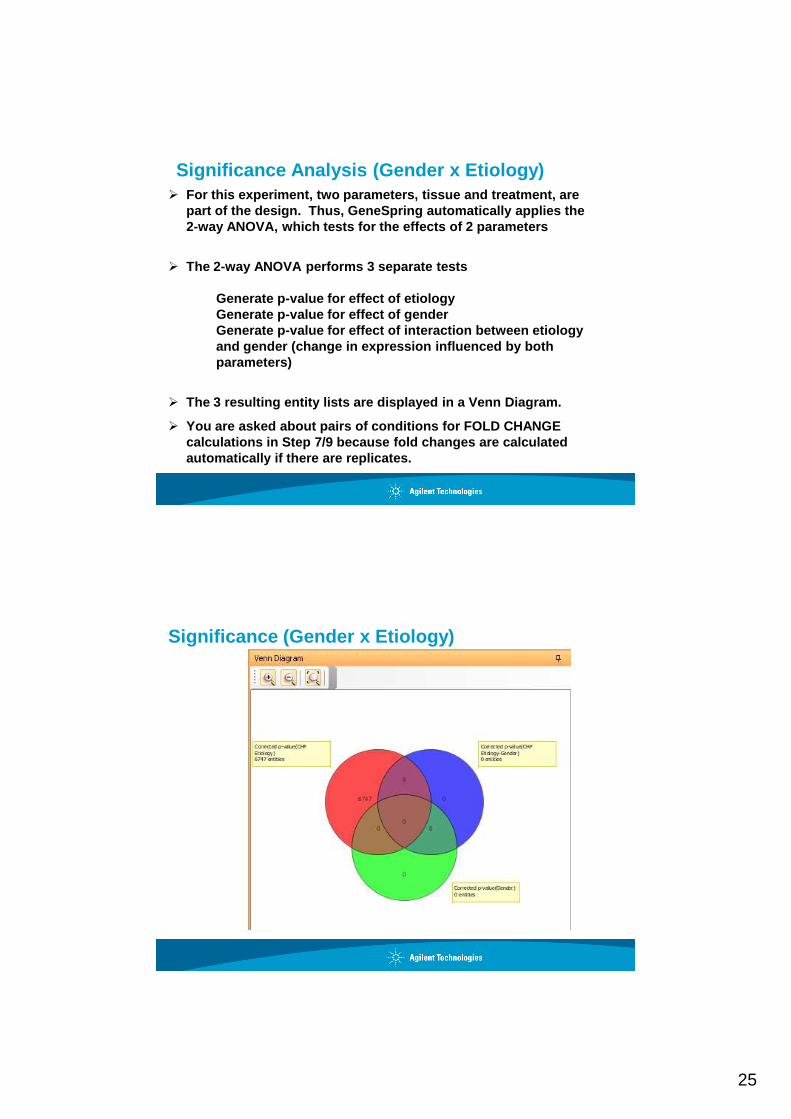
Significance Analysis (Gender x Etiology)� For this experiment, two parameters, tissue and tre atment, are
part of the design. Thus, GeneSpring automatically applies the 2-way ANOVA, which tests for the effects of 2 param eters
� The 2-way ANOVA performs 3 separate tests
Generate p-value for effect of etiologyGenerate p-value for effect of genderGenerate p-value for effect of interaction between etiology and gender (change in expression influenced by both parameters)
� The 3 resulting entity lists are displayed in a Ven n Diagram.
� You are asked about pairs of conditions for FOLD CH ANGE calculations in Step 7/9 because fold changes are c alculated automatically if there are replicates.
Significance (Gender x Etiology)
26
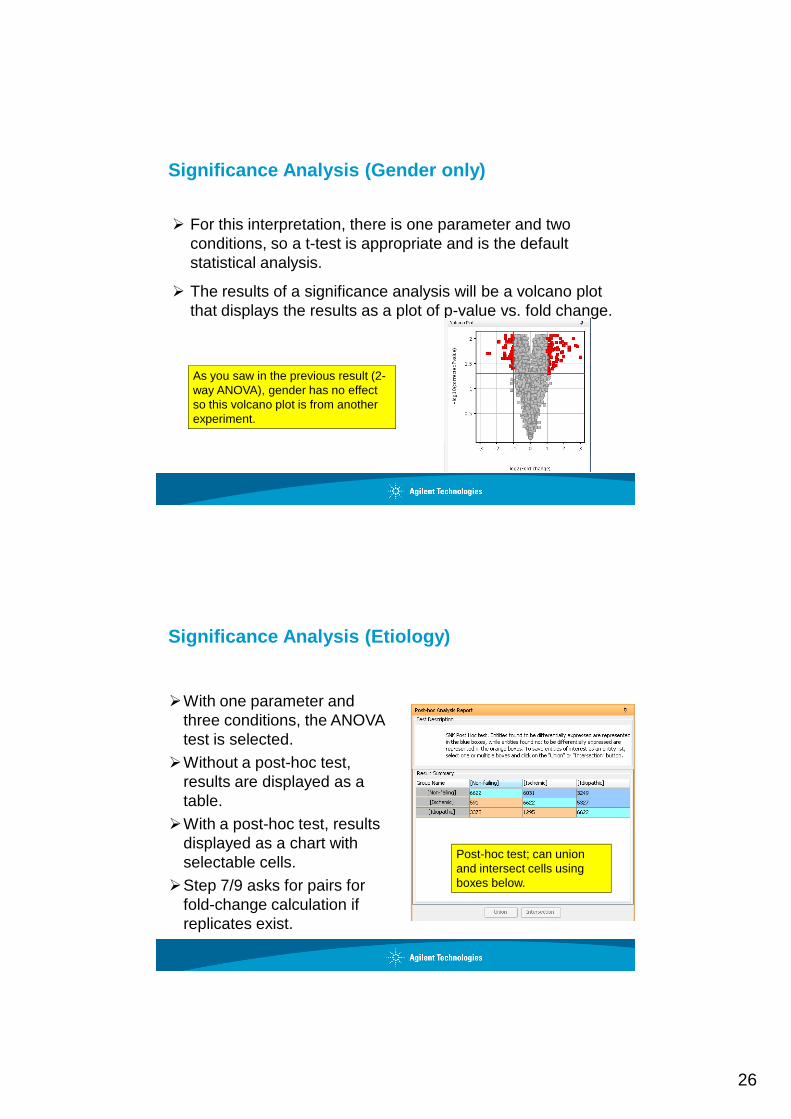
Significance Analysis (Gender only)
� For this interpretation, there is one parameter and two conditions, so a t-test is appropriate and is the default statistical analysis.
� The results of a significance analysis will be a volcano plot that displays the results as a plot of p-value vs. fold change.
As you saw in the previous result (2-way ANOVA), gender has no effect so this volcano plot is from another experiment.
Significance Analysis (Etiology)
�With one parameter and three conditions, the ANOVA test is selected.
�Without a post-hoc test, results are displayed as a table.
�With a post-hoc test, results displayed as a chart with selectable cells.
�Step 7/9 asks for pairs for fold-change calculation if replicates exist.
Post-hoc test; can union and intersect cells using boxes below.
27
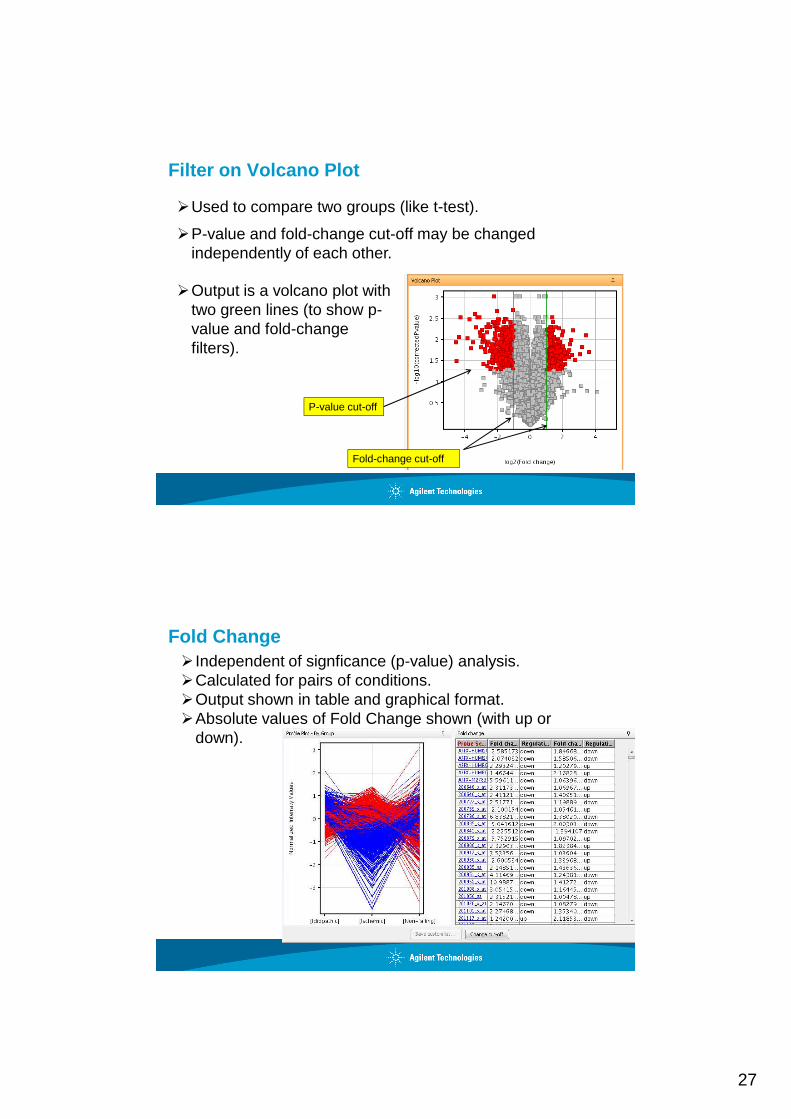
Filter on Volcano Plot
�Used to compare two groups (like t-test).
�P-value and fold-change cut-off may be changed independently of each other.
�Output is a volcano plot with two green lines (to show p-value and fold-change filters).
P-value cut-off
Fold-change cut-off
Fold Change� Independent of signficance (p-value) analysis.�Calculated for pairs of conditions.�Output shown in table and graphical format. �Absolute values of Fold Change shown (with up or
down).
28
Group/Presentation TitleAgilent Restricted
Month ##, 200X
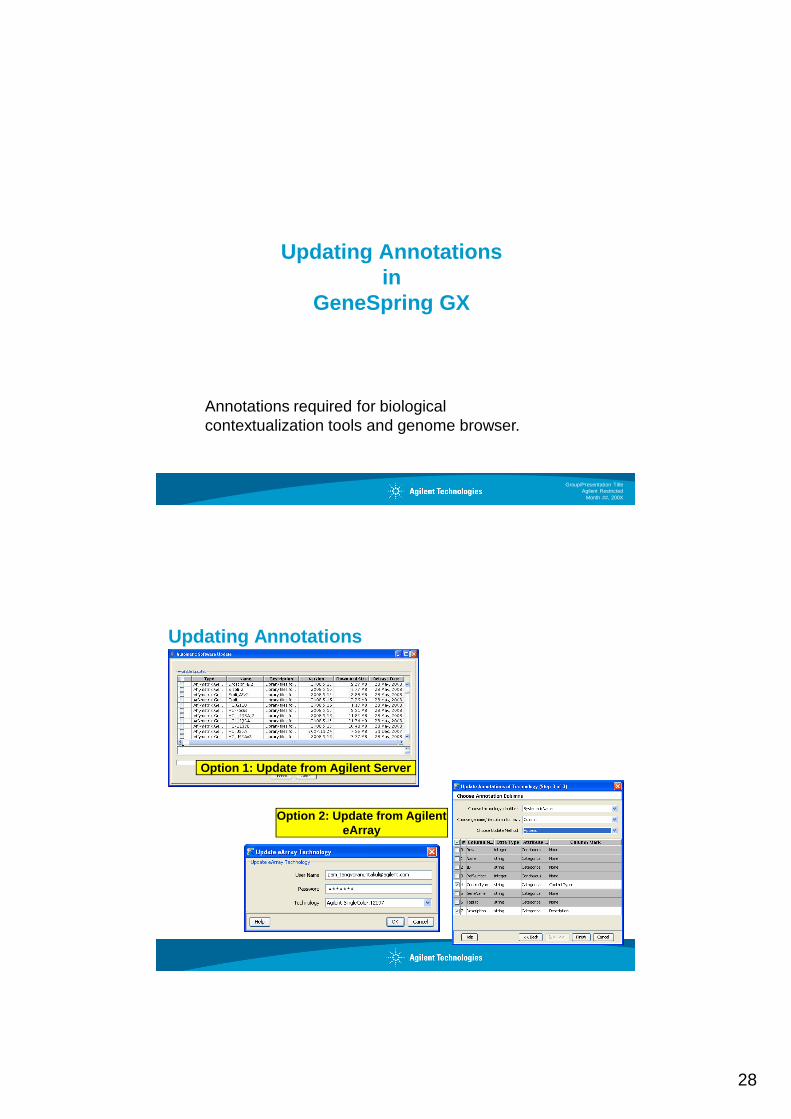
Updating Annotationsin
GeneSpring GX
Annotations required for biological contextualization tools and genome browser.
Updating Annotations
Option 1: Update from Agilent Server
Option 2: Update from Agilent eArray
29
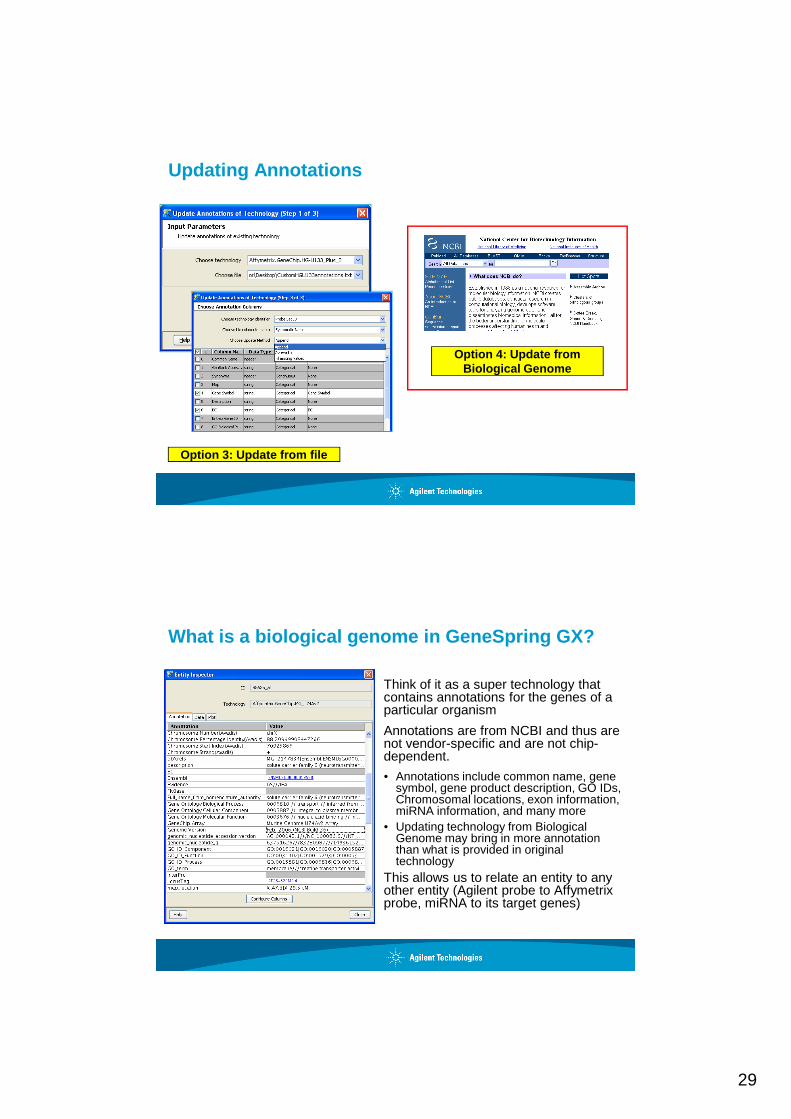
Updating Annotations
Option 3: Update from file
Option 4: Update from Biological Genome
What is a biological genome in GeneSpring GX?
Think of it as a super technology that contains annotations for the genes of a particular organism
Annotations are from NCBI and thus are not vendor-specific and are not chip-dependent.
• Annotations include common name, gene symbol, gene product description, GO IDs, Chromosomal locations, exon information, miRNA information, and many more
• Updating technology from Biological Genome may bring in more annotation than what is provided in original technology
This allows us to relate an entity to any other entity (Agilent probe to Affymetrix probe, miRNA to its target genes)

30
Thank you!