Embed Size (px)
Citation preview
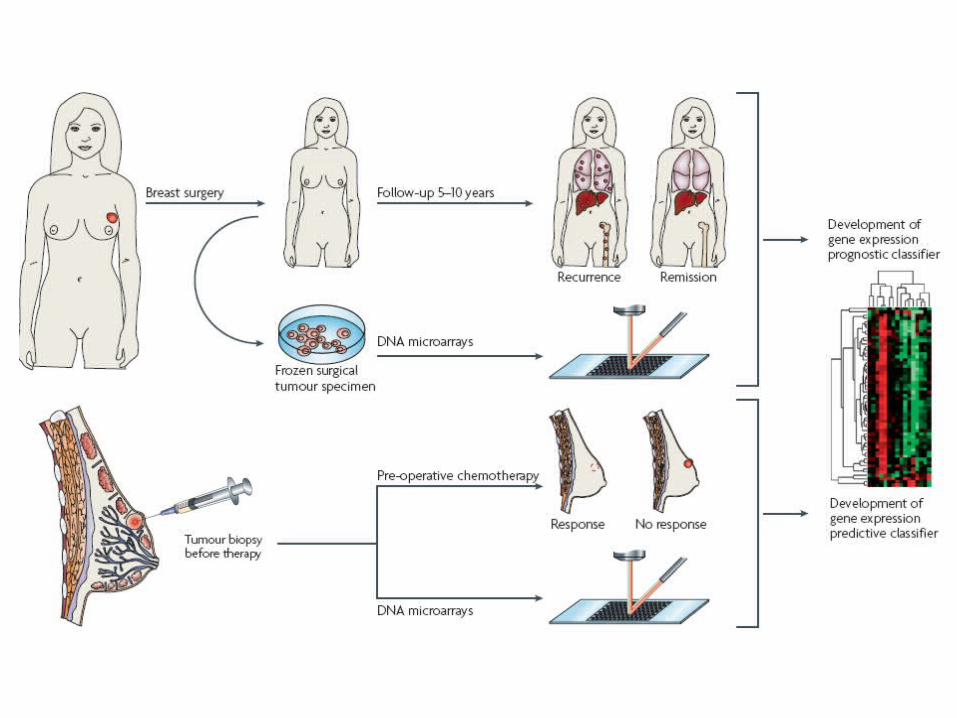
Microarray analysis as a
prognostic and predictive tool:
are we ready?
Enzo Medico
Laboratory of Functional Oncogenomics
Institute for Cancer Research and Treatment
University of Torino
Topics
• Platforms for gene expression profiling
• Breast cancer signatures
• From cell-based models to cancer classifiers
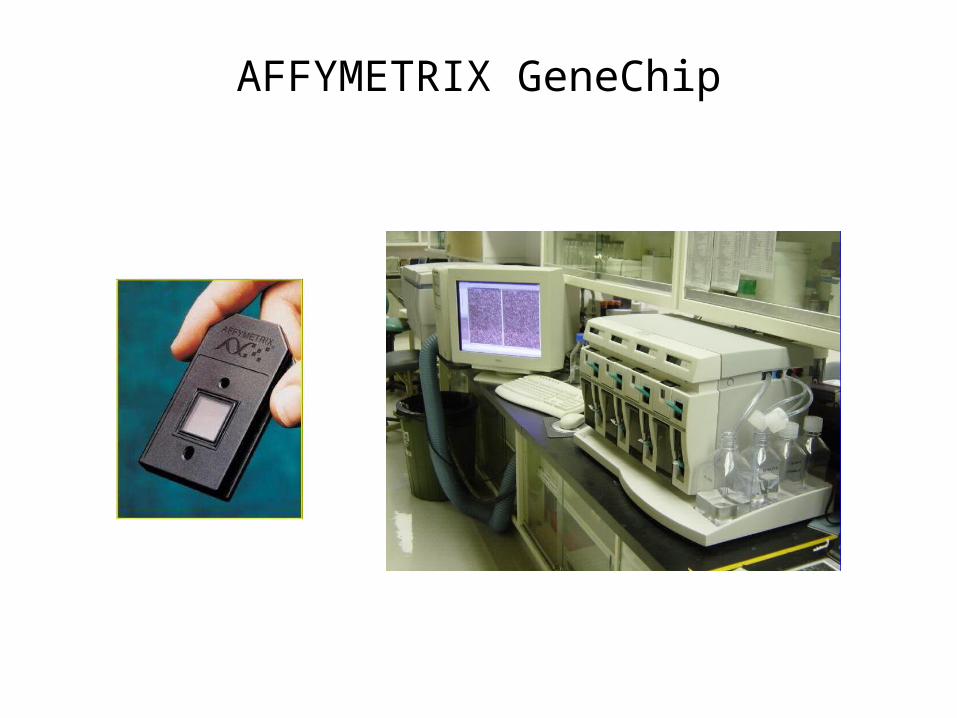
AFFYMETRIX GeneChip
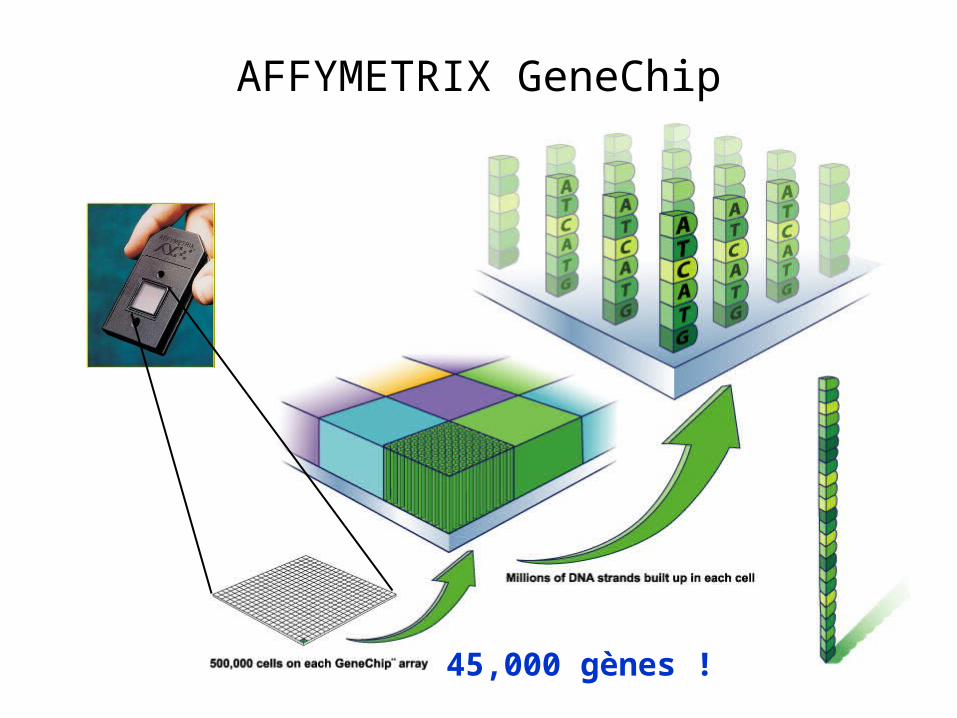
45,000 gènes !
AFFYMETRIX GeneChip
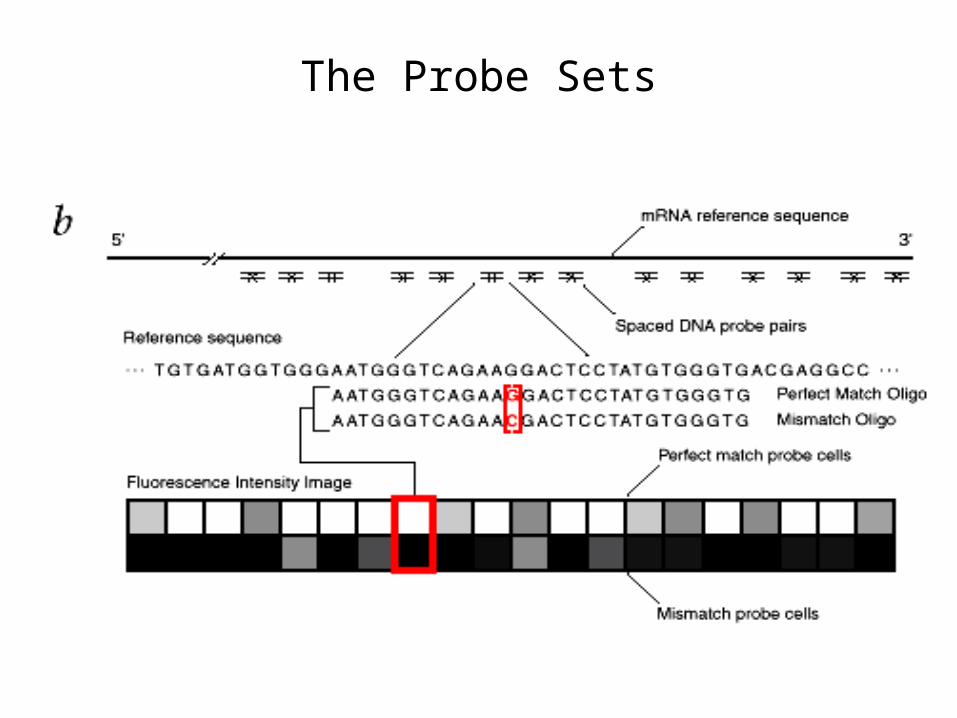
The Probe Sets
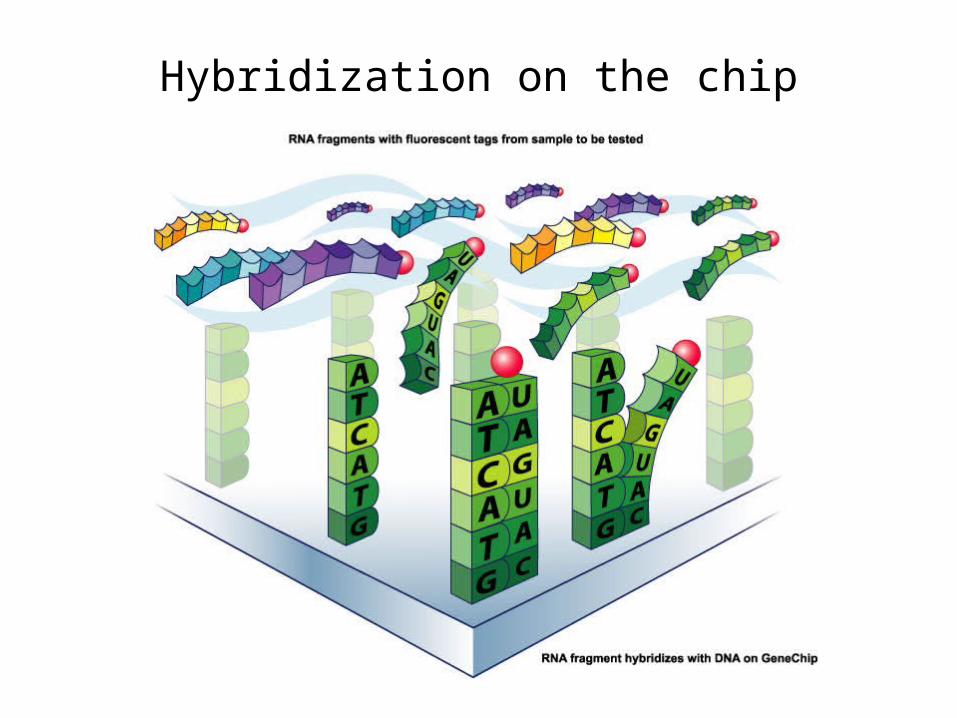
Hybridization on the chip
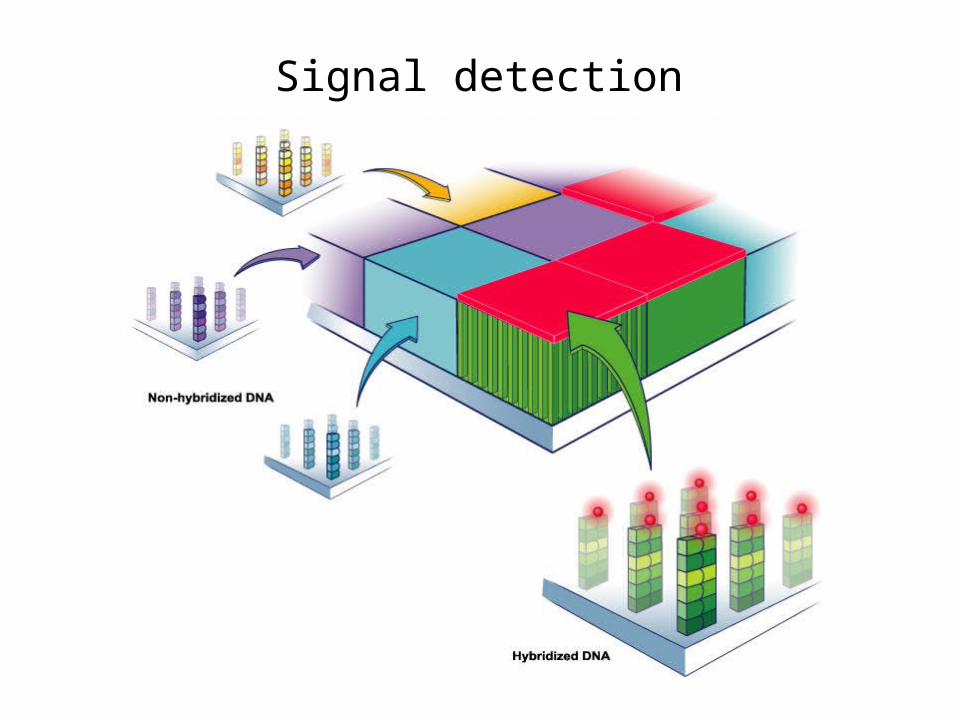
Signal detection
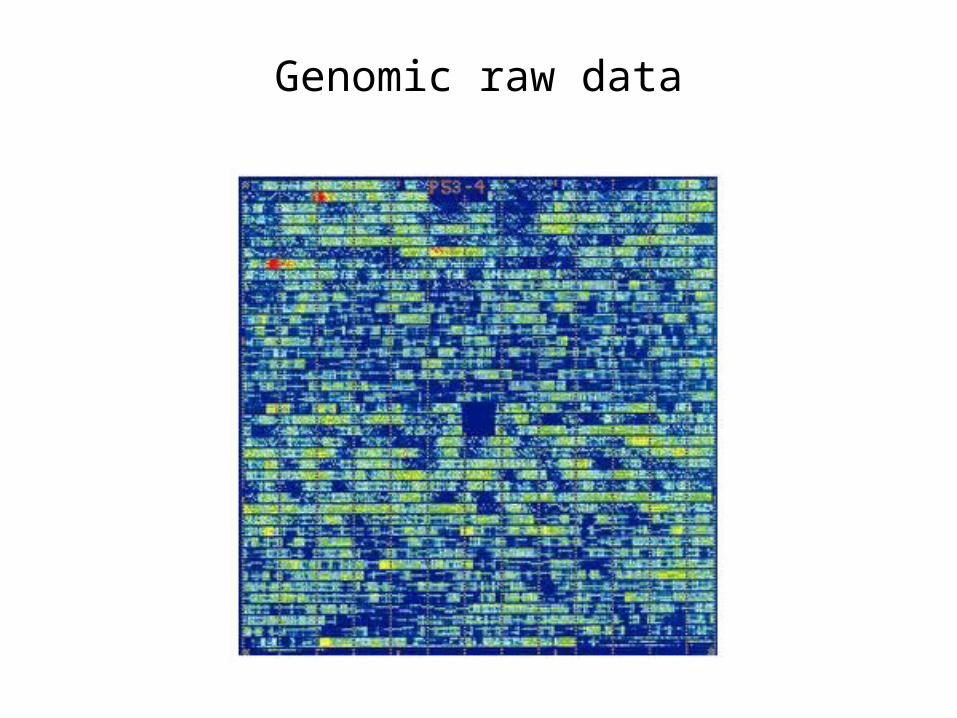
Genomic raw data
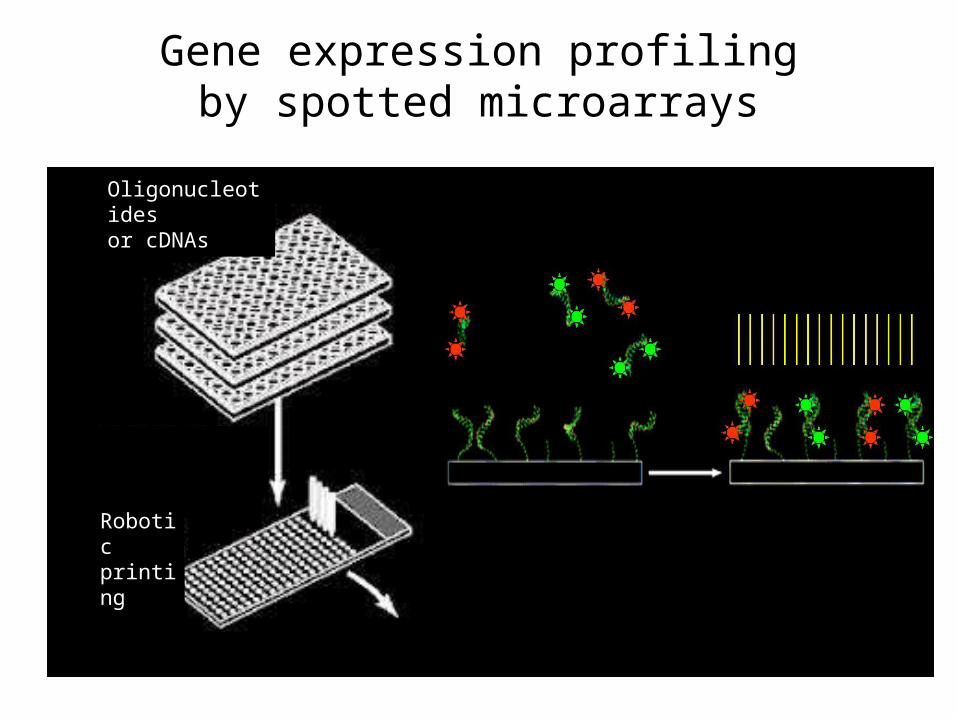
Gene expression profilingby spotted microarrays
Oligonucleotides or cDNAs
Roboticprinting
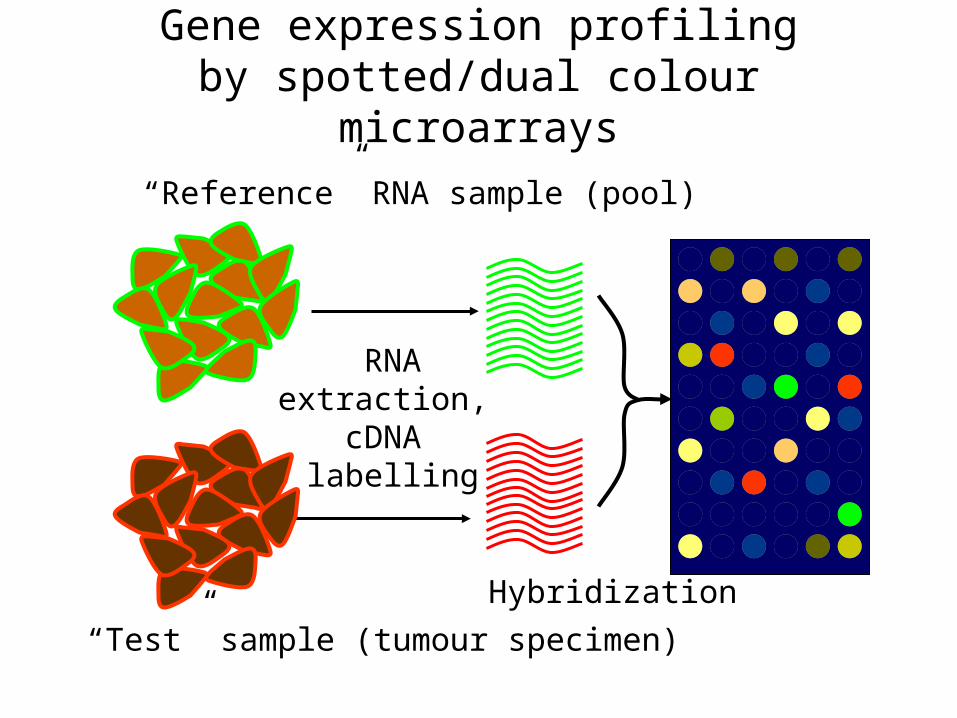
Gene expression profilingby spotted/dual colour microarrays
RNAextraction,
cDNA labelling
Hybridization
“Reference” RNA sample (pool)
“Test” sample (tumour specimen)
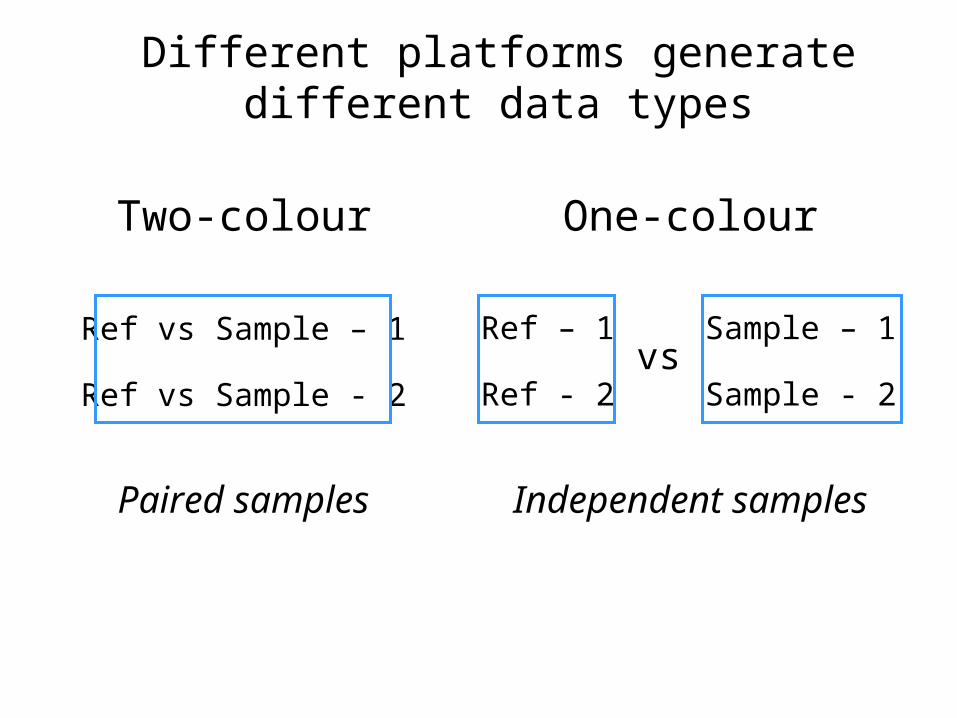
Different platforms generatedifferent data types
Two-colour One-colour
Paired samples Independent samples
Ref vs Sample – 1
Ref vs Sample - 2
Ref – 1
Ref - 2
Sample – 1
Sample - 2vs
Topics
• Platforms for gene expression profiling
• Breast cancer signatures
• From cell-based models to cancer classifiers
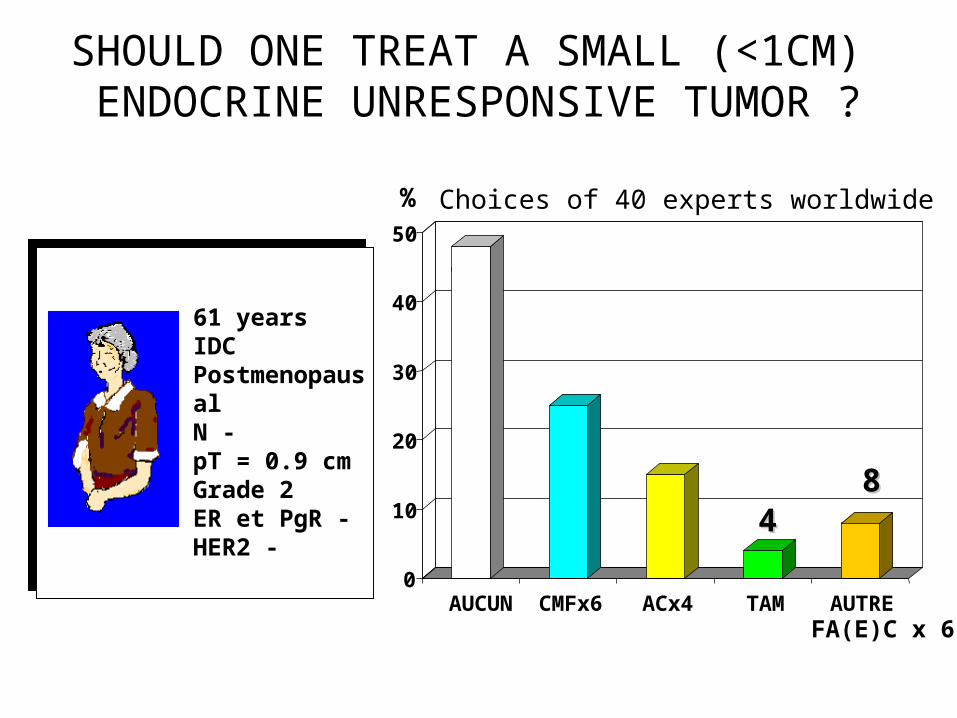
61 years IDC PostmenopausalN -pT = 0.9 cm Grade 2 ER et PgR -HER2 -
FA(E)C x 6
%
4848
2525
151544
88
Choices of 40 experts worldwide
0
10
20
30
40
50
AUCUN CMFx6 ACx4 TAM AUTRE
SHOULD ONE TREAT A SMALL (<1CM) ENDOCRINE UNRESPONSIVE TUMOR ?
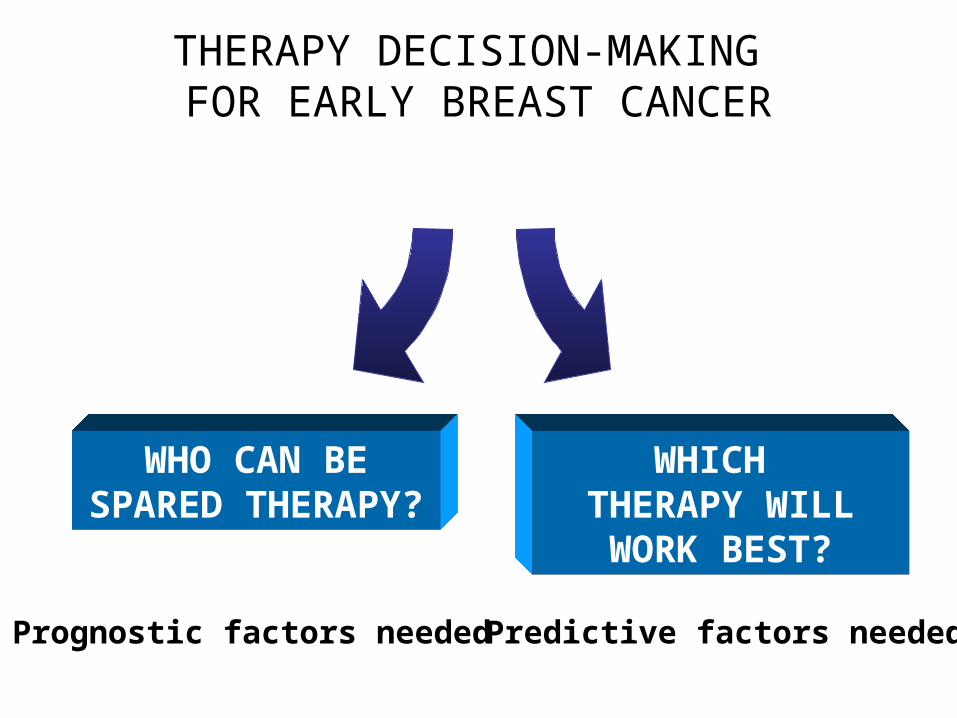
WHO CAN BE SPARED
THERAPY?
WHICH THERAPY WILL
WORK BEST?
Prognostic factors neededPredictive factors needed
THERAPY DECISION-MAKING FOR EARLY BREAST CANCER
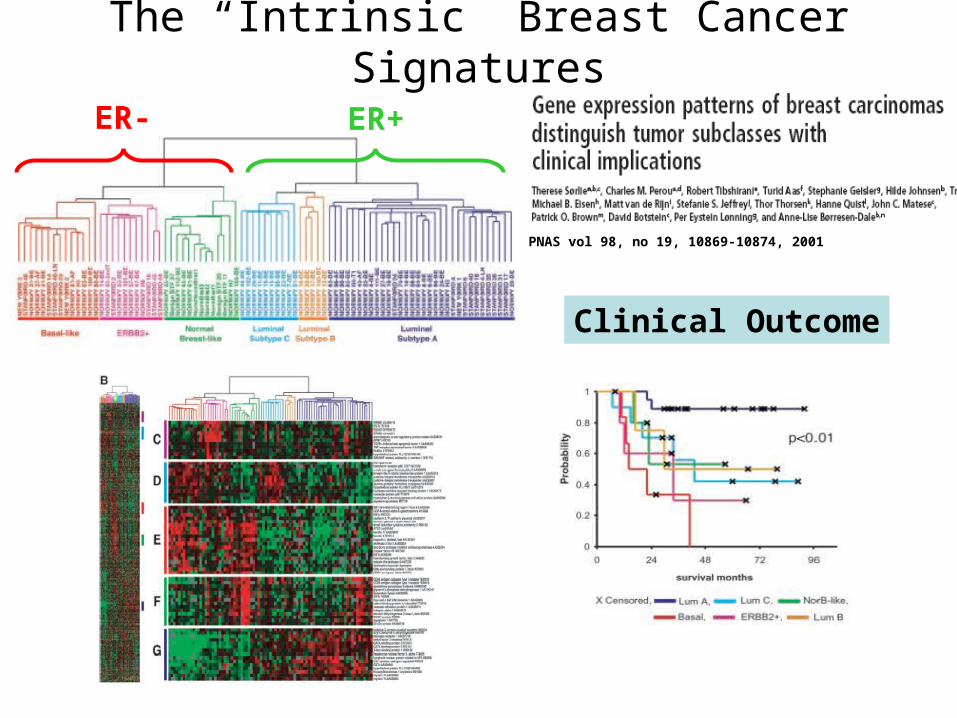
Clinical Outcome
ER- ER+
PNAS vol 98, no 19, 10869-10874, 2001
The “Intrinsic” Breast Cancer Signatures
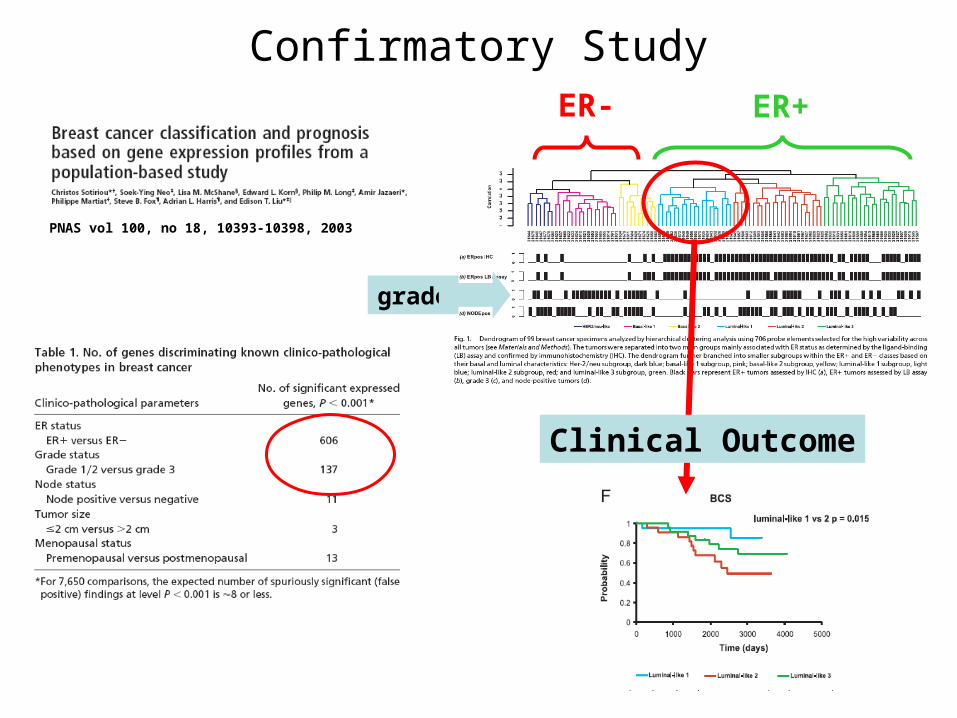
PNAS vol 100, no 18, 10393-10398, 2003
ER- ER+
grade
Clinical Outcome
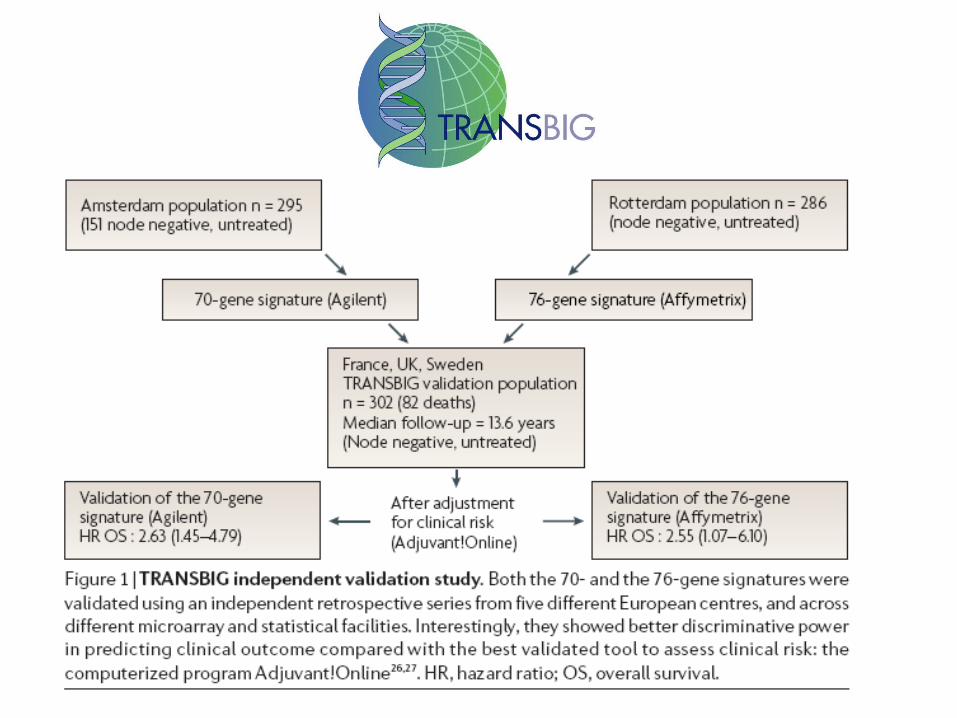
Confirmatory Study
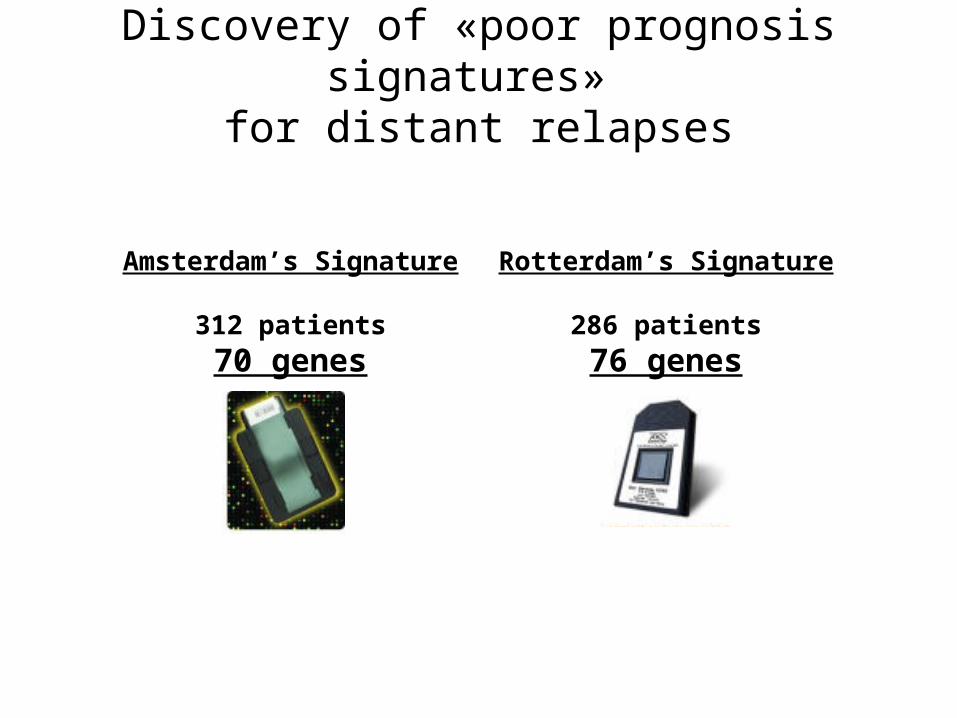
Amsterdam’s Signature
312 patients
70 genes
Rotterdam’s Signature
286 patients
76 genes
Discovery of «poor prognosis signatures» for distant relapses
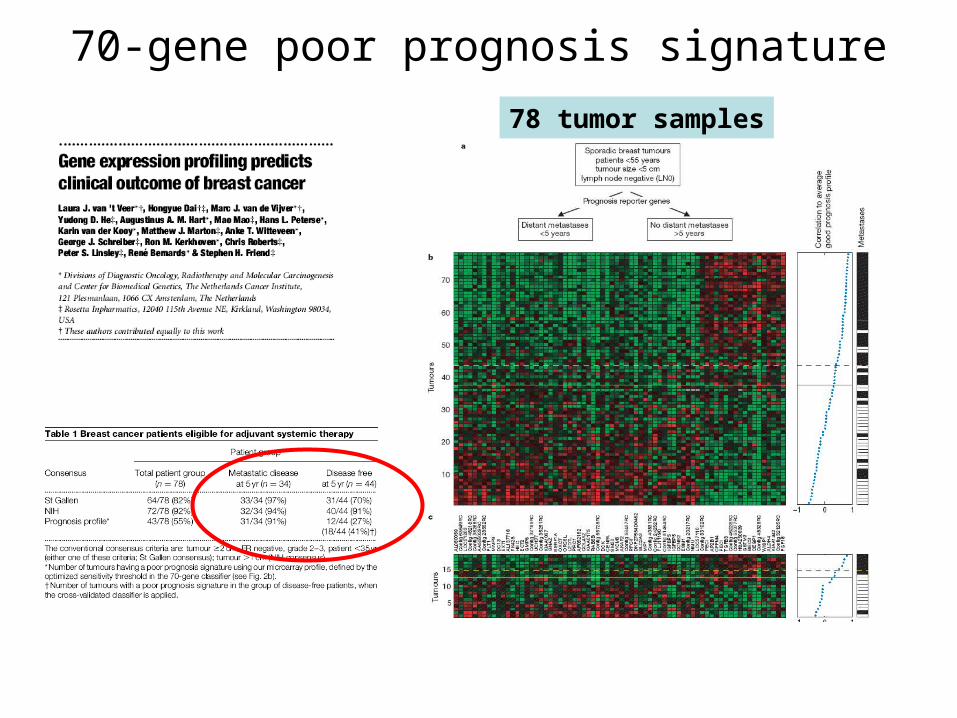
78 tumor samples
70-gene poor prognosis signature
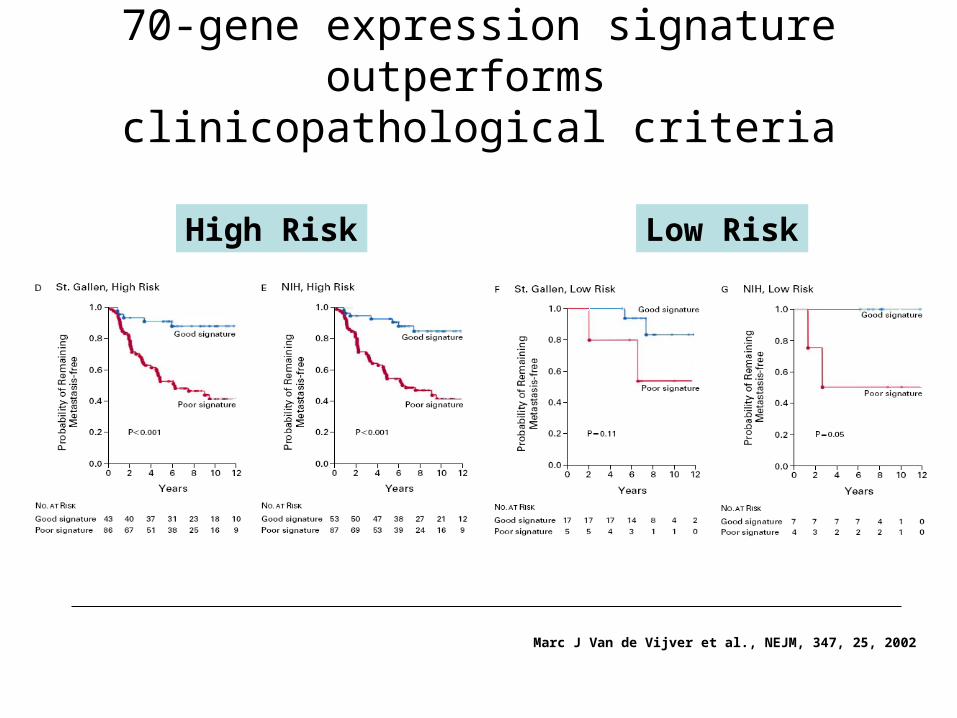
Marc J Van de Vijver et al., NEJM, 347, 25, 2002
High Risk Low Risk
70-gene expression signature outperforms clinicopathological criteria
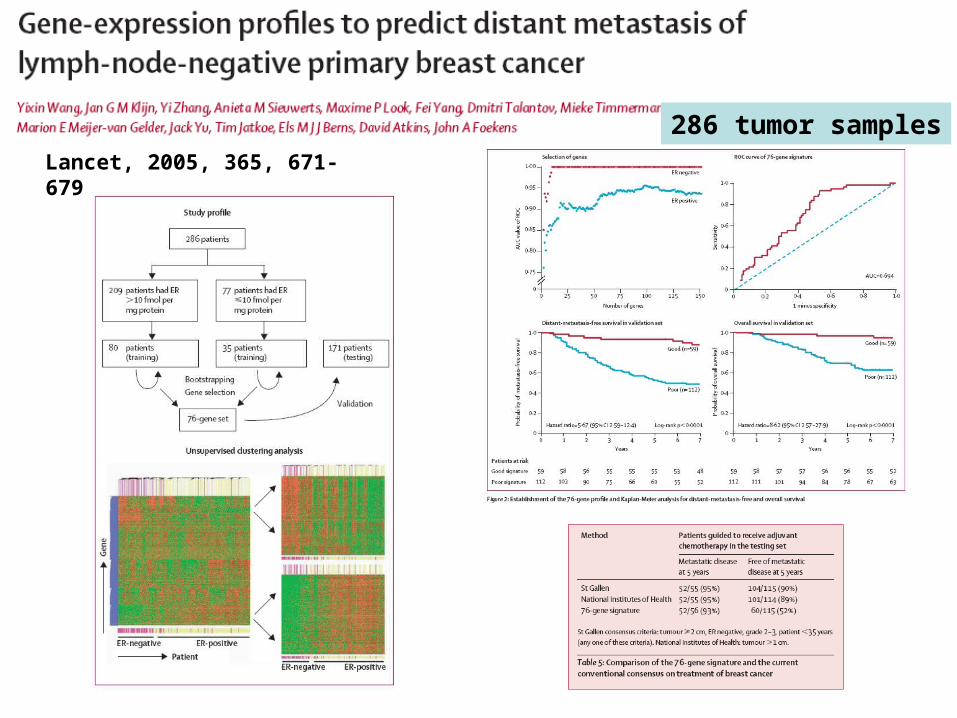
Lancet, 2005, 365, 671-679
286 tumor samples
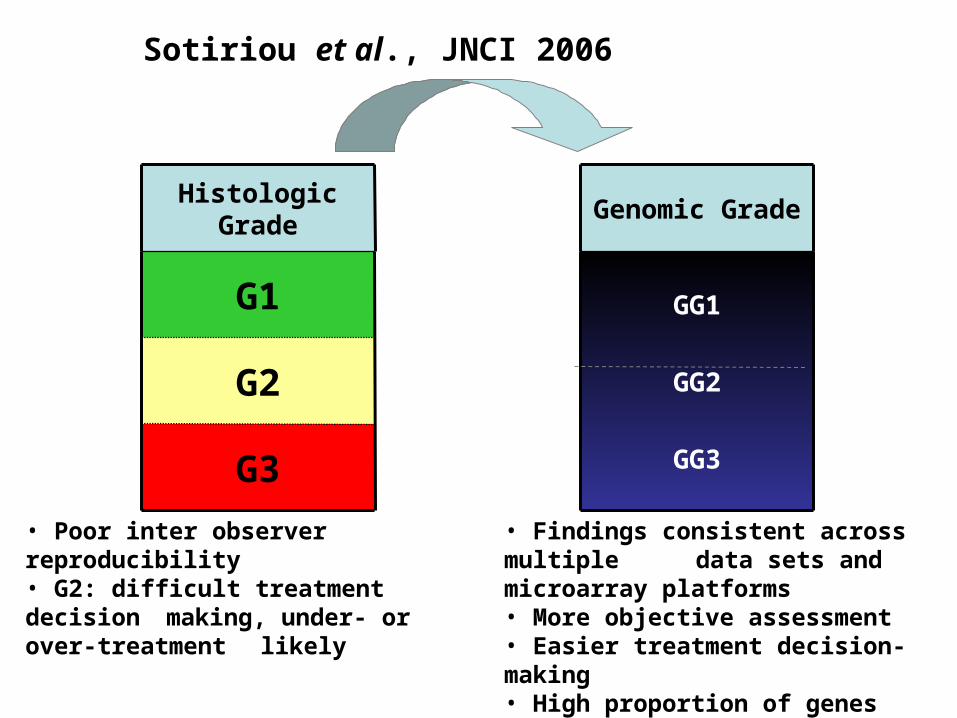
G3
G2
G1
Histologic Grade
GG1
GG2
GG3
Genomic Grade
Sotiriou et al., JNCI 2006
• Poor inter observer reproducibility• G2: difficult treatment decision making, under- or over-treatment likely
• Findings consistent across multiple data sets and microarray platforms• More objective assessment• Easier treatment decision-making• High proportion of genes involved in cell proliferation !
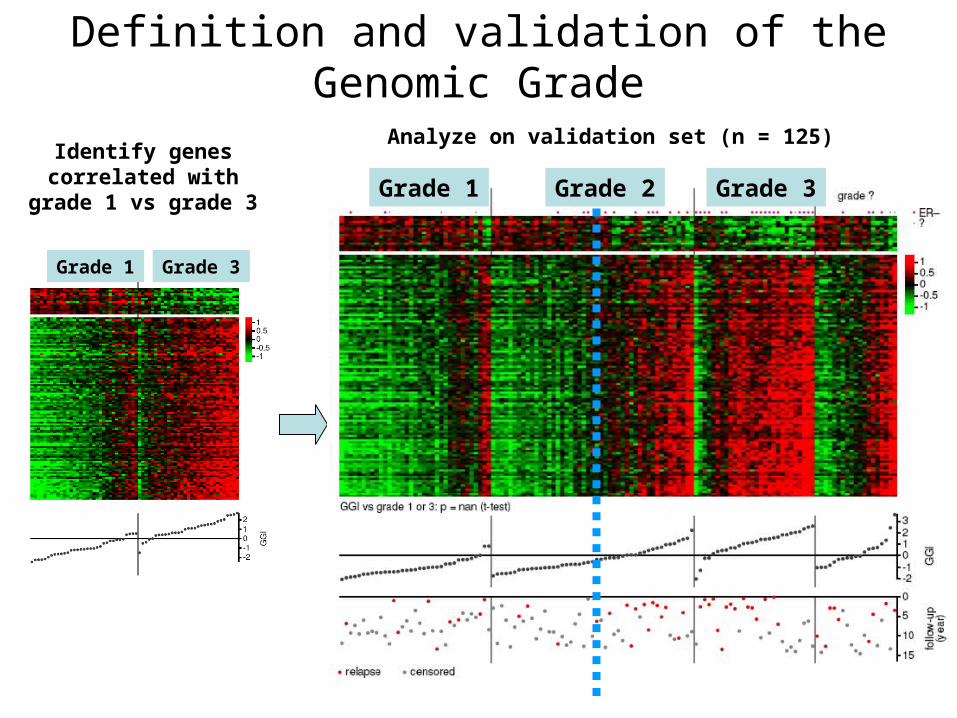
Identify genes correlated with
grade 1 vs grade 3
Grade 1 Grade 3
Grade 1 Grade 2 Grade 3
Analyze on validation set (n = 125)
Definition and validation of the Genomic Grade
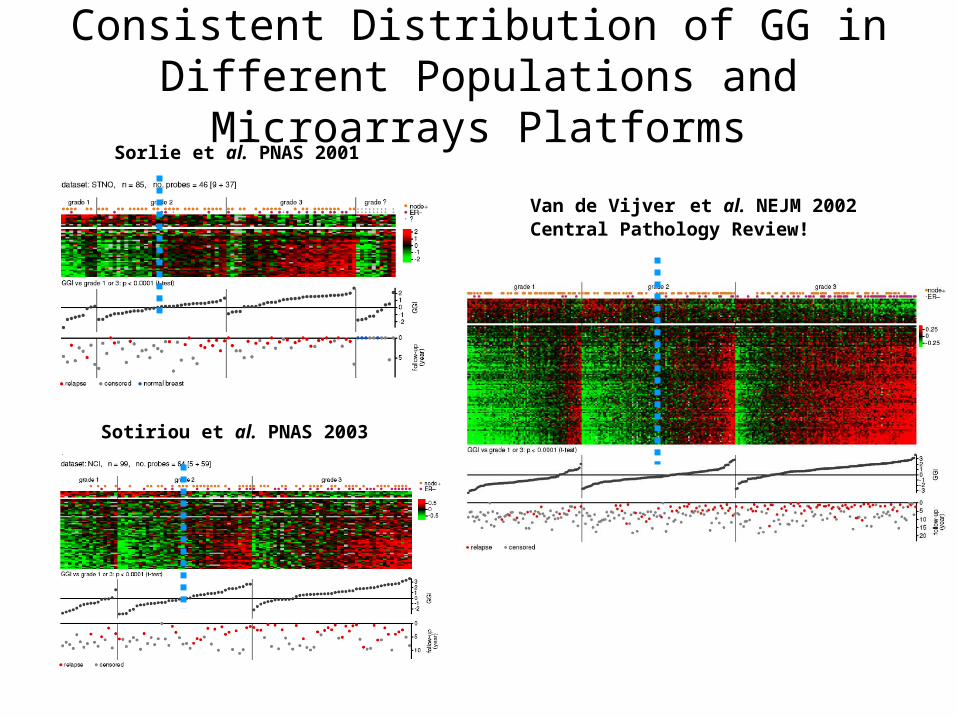
Sorlie et al. PNAS 2001
Sotiriou et al. PNAS 2003
Van de Vijver et al. NEJM 2002Central Pathology Review!
Consistent Distribution of GG in Different Populations and Microarrays Platforms
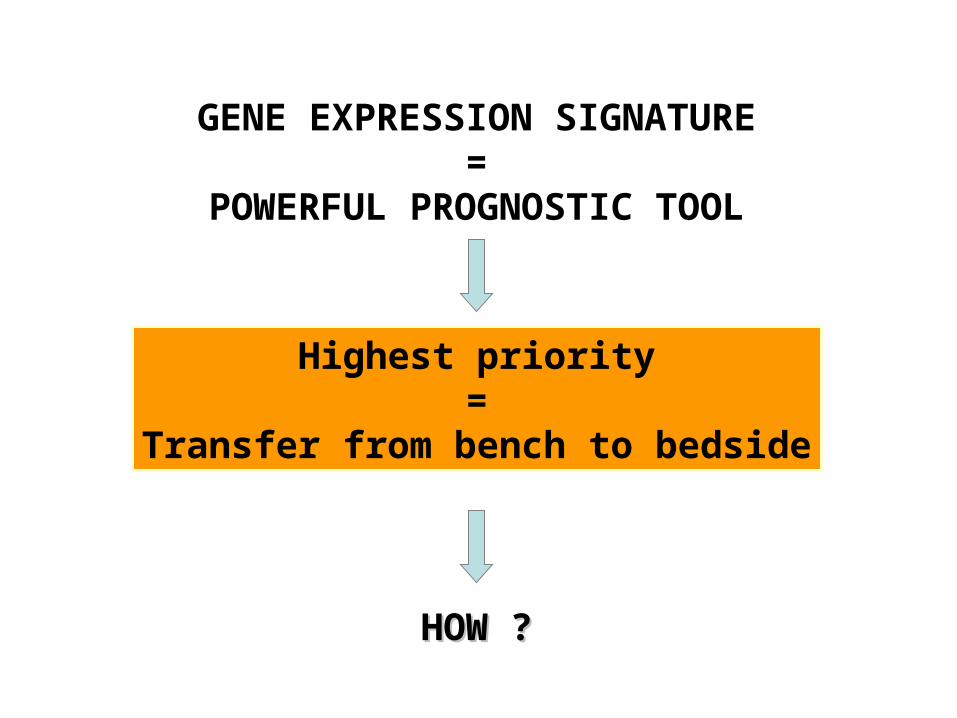
GENE EXPRESSION SIGNATURE=
POWERFUL PROGNOSTIC TOOL
Highest priority=
Transfer from bench to bedside
HOW ?HOW ?
Validation study…
TRANSLATING TRANSLATING MOLECULAR MOLECULAR KNOWLEDGEKNOWLEDGEINTO EARLY INTO EARLY
BREAST CANCER BREAST CANCER MANAGEMENTMANAGEMENT
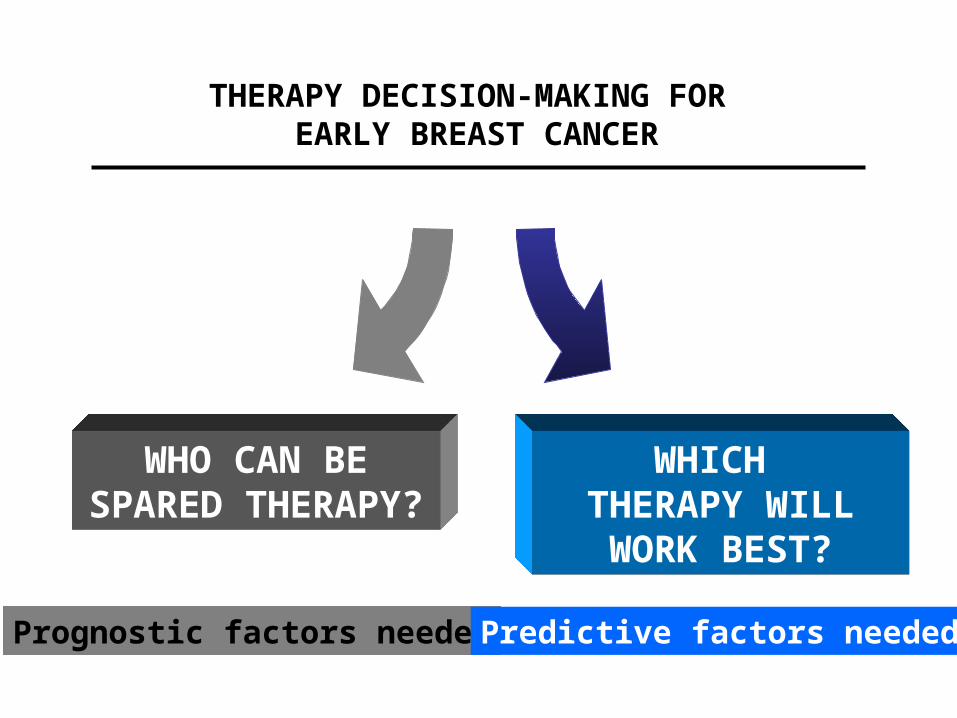
THERAPY DECISION-MAKING FOR EARLY BREAST CANCER
WHO CAN BE SPARED
THERAPY?
WHICH THERAPY WILL
WORK BEST?
Prognostic factors neededPredictive factors needed
Topics
• Platforms for gene expression profiling
• Breast cancer signatures
• From cell-based models to cancer classifiers
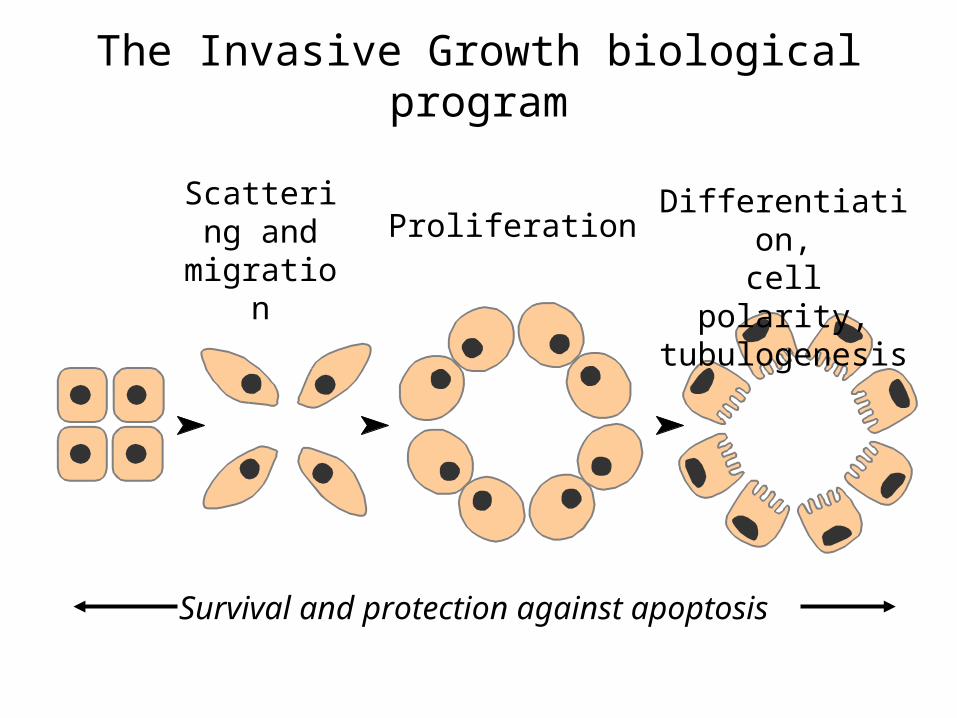
The Invasive Growth biological program
ProliferationDifferentiation,
cell polarity, tubulogenesis
Scattering and
migration
Survival and protection against apoptosis
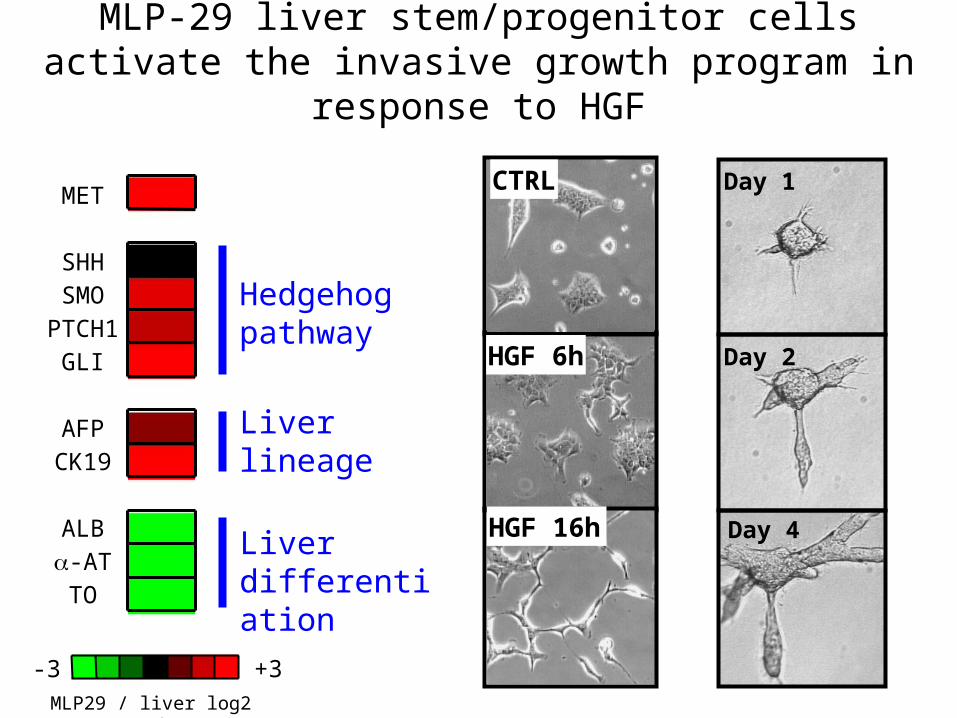
MET
SHHSMO
PTCH1GLI
AFPCK19
ALB-ATTO
MLP-29 liver stem/progenitor cells activate the invasive growth program in response to HGF
Hedgehogpathway
Liver lineage
Liver differentiation
-3 +3MLP29 / liver log2 ratio
CTRL
HGF 6h
HGF 16h
Day 1
Day 2
Day 4
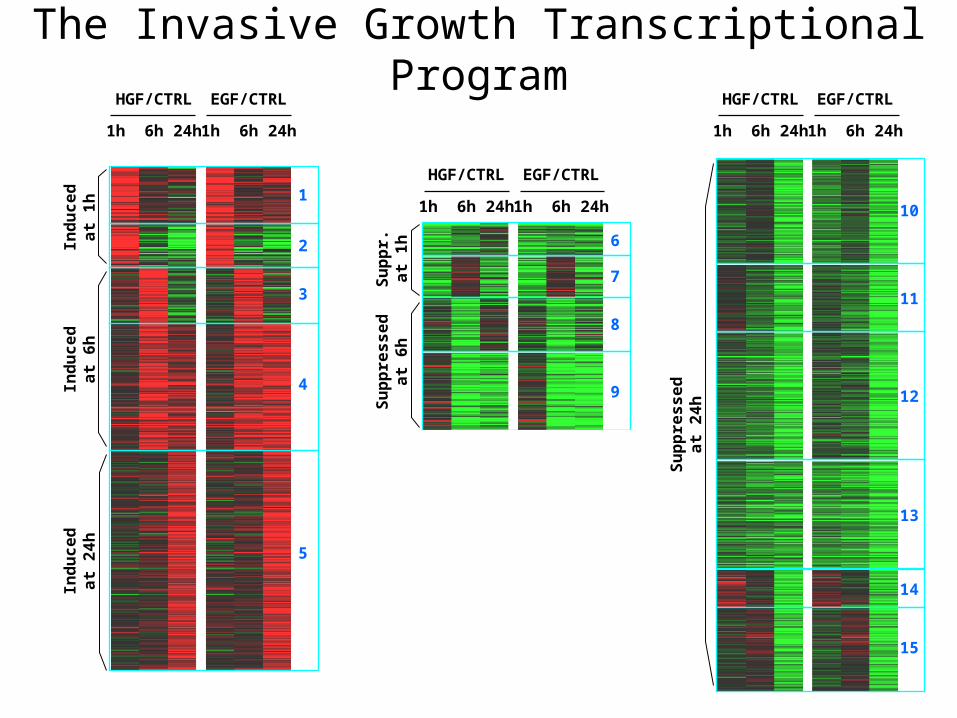
Ind
uc
ed
at
1h
HGF/CTRL
1h 6h 24h
EGF/CTRL
1h 6h 24h
Ind
uc
ed
at
6h
Ind
uc
ed
at
24
h
1
2
3
4
5
Su
pp
res
se
da
t 2
4h
HGF/CTRL
1h 6h 24h
EGF/CTRL
1h 6h 24h
10
11
12
13
14
15
Su
pp
r.a
t 1
hS
up
pre
ss
ed
at
6h
Su
pp
res
se
da
t 2
4h
HGF/CTRL
1h 6h 24h
EGF/CTRL
1h 6h 24h
6
7
8
9
10
11
12
The Invasive Growth Transcriptional Program
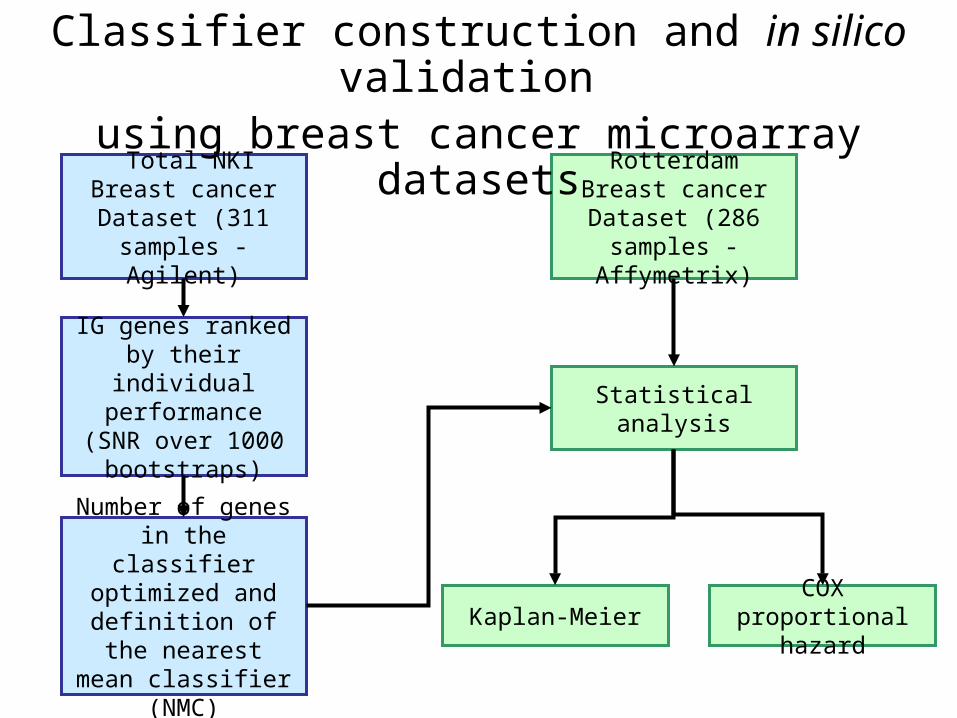
Total NKI Breast cancer Dataset (311 samples -
Agilent)
Rotterdam Breast cancer Dataset (286 samples -
Affymetrix)
Statistical analysis
Kaplan-MeierCOX proportional
hazard
IG genes ranked by their individual
performance(SNR over 1000
bootstraps)
Number of genes in the classifier optimized and
definition of the nearest mean
classifier (NMC)
Classifier construction and in silico validation
using breast cancer microarray datasets
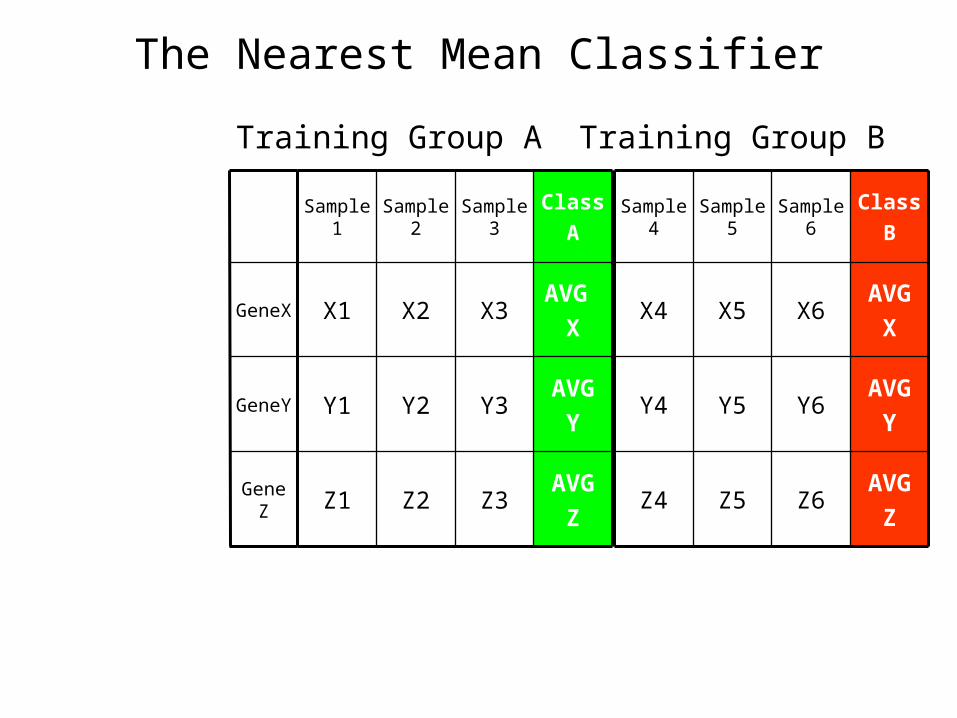
The Nearest Mean Classifier
AVG
ZZ3Z2Z1
AVG
YY3Y2Y1
AVG
XX3X2X1
Class
ASample
3Sample
2Sample
1
AVG
XX6X5X4
AVG
ZZ6Z5Z4
AVG
YY6Y5Y4
Class
BSample
6Sample
5Sample
4
Gene Z
GeneY
GeneX
Training Group A Training Group B
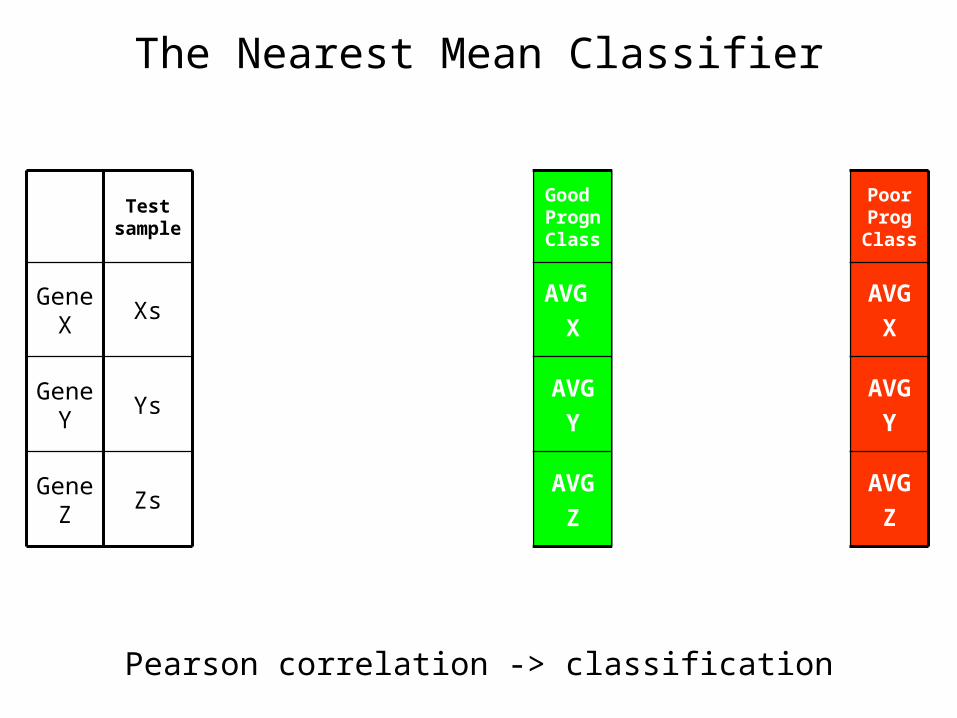
The Nearest Mean Classifier
AVG
ZZ3Z2Z1
AVG
YY3Y2Y1
AVG
XX3X2X1
Good Progn Class
Sample 3
Sample 2
Sample 1
AVG
XX6X5X4
AVG
ZZ6Z5Z4
AVG
YY6Y5Y4
Poor Prog Class
Sample 6
Sample 5
Sample 4
Gene Z
Gene Y
Gene X
Zs
Ys
Xs
Test sample
GeneZ
GeneY
GeneX
Group A Group B
Pearson correlation -> classification
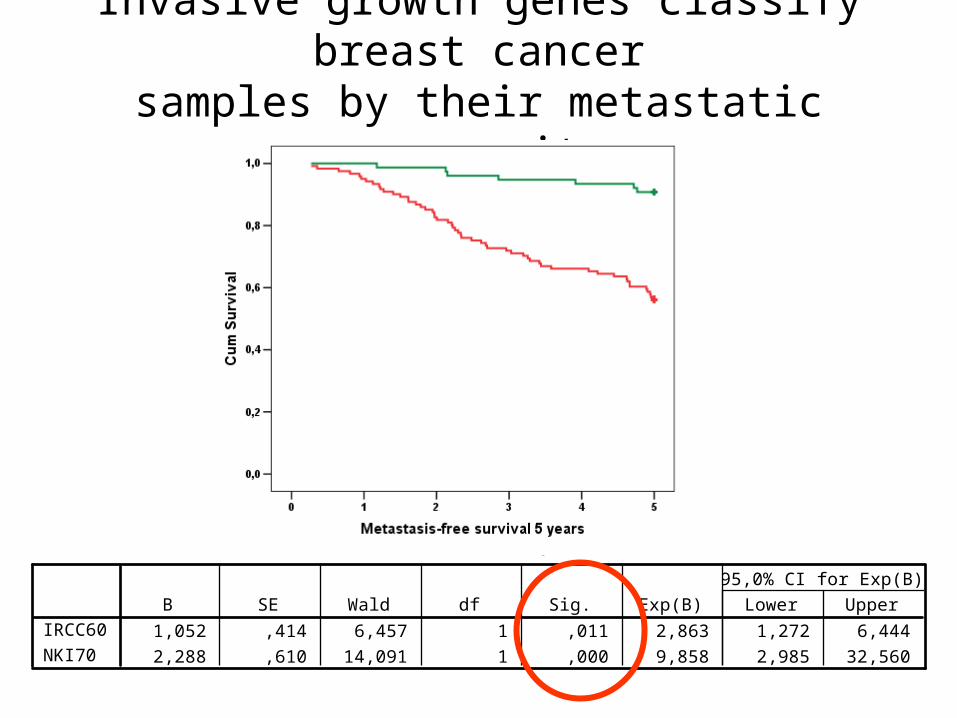
Invasive growth genes classify breast cancersamples by their metastatic propensity
Variables in the Equation
1,052 ,414 6,457 1 ,011 2,863 1,272 6,444
2,288 ,610 14,091 1 ,000 9,858 2,985 32,560
IRCC60
NKI70
B SE Wald df Sig. Exp(B) Lower Upper
95,0% CI for Exp(B)
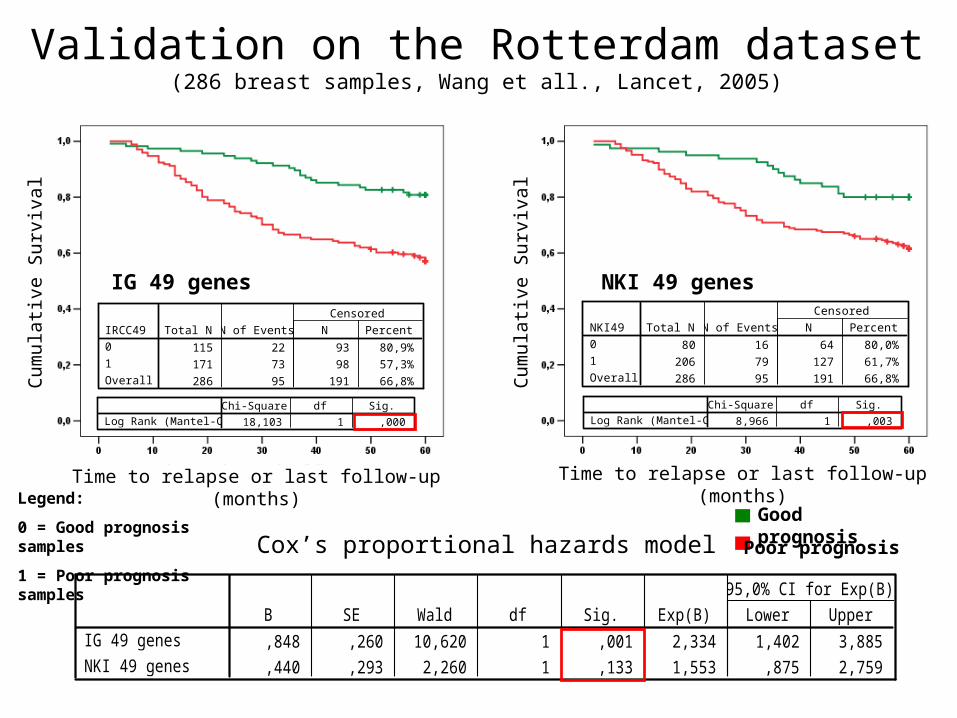
Validation on the Rotterdam dataset(286 breast samples, Wang et all., Lancet, 2005)
Variables in the Equation
,848 ,260 10,620 1 ,001 2,334 1,402 3,885
,440 ,293 2,260 1 ,133 1,553 ,875 2,759
IG 49 genes
NKI 49 genes
B SE Wald df Sig. Exp(B) Lower Upper
95,0% CI for Exp(B)
Cox’s proportional hazards model
Overall Comparisons
18,103 1 ,000Log Rank (Mantel-Cox)Chi-Square df Sig.
Test of equality of survival distributions for the different levels ofIRCC-49 AVG boot on 311 samples.
Case Processing Summary
115 22 93 80,9%
171 73 98 57,3%
286 95 191 66,8%
IRCC490
1
Overall
Total N N of Events N Percent
Censored
IG 49 genes
Cum
ula
tive S
urv
ival
Time to relapse or last follow-up (months)
Case Processing Summary
80 16 64 80,0%
206 79 127 61,7%
286 95 191 66,8%
NKI490
1
Overall
Total N N of Events N Percent
Censored
Overall Comparisons
8,966 1 ,003Log Rank (Mantel-Cox)Chi-Square df Sig.
Test of equality of survival distributions for the different levels ofNKI-0.15.
NKI 49 genes
Cum
ula
tive S
urv
ival
Time to relapse or last follow-up (months)
Poor prognosis
Good prognosis
Legend:
0 = Good prognosis samples
1 = Poor prognosis samples
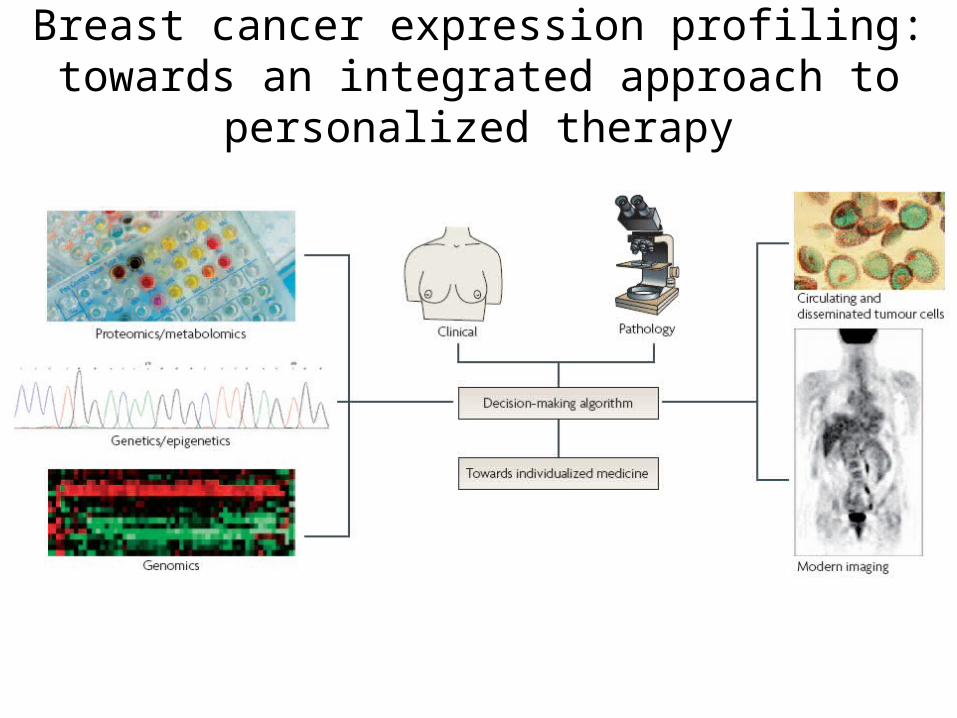
Breast cancer expression profiling: towards an integrated approach to personalized therapy
Acknowledgments
IRCC Laboratory of Functional Oncogenomics
Tommaso RenzulliClaudio Isella
Daniela CantarellaBarbara MartinoglioRoberta Porporato
IRCC Gynaecological Oncology
Daniela CiminoLuca Fuso
Prof. Michele De BortoliProf. Piero Sismondi