Embed Size (px)
Citation preview

energies
Article
The Effect of Light Wavelength on CO2 Capture,Biomass Production and Nutrient Uptake by GreenMicroalgae: A Step Forward on Process Integrationand Optimisation
Ana F. Esteves 1, Olívia S. G. P. Soares 2 , Vítor J. P. Vilar 2, José C. M. Pires 1 andAna L. Gonçalves 1,*
1 LEPABE—Laboratory for Process Engineering, Environment, Biotechnology and Energy,Faculty of Engineering, University of Porto, Rua Dr. Roberto Frias, 4200-465 Porto, Portugal;[email protected] (A.F.E.); [email protected] (J.C.M.P.)
2 Laboratory of Separation and Reaction Engineering-Laboratory of Catalysis and Materials (LSRE-LCM),Faculty of Engineering, University of Porto, Rua Dr. Roberto Frias, 4200-465 Porto, Portugal;[email protected] (O.S.G.P.S.); [email protected] (V.J.P.V.)
* Correspondence: [email protected]; Tel.: +351-22-041-3656
Received: 7 December 2019; Accepted: 7 January 2020; Published: 9 January 2020�����������������
Abstract: Microalgae have drawn the attention of several researchers as an alternative to the traditionalphysicochemical CO2 capture methods, since they can convert CO2 and water into organic matterand release oxygen into the atmosphere. Microalgal growth can be improved by changing lightsupply, such as light intensity, wavelength, and photoperiod. In this study, the effect of different lightwavelengths on CO2 capture, nutrient removal from a synthetic effluent and biomass productionof Chlorella vulgaris, Tetradesmus obliquus and Neochloris oleoabundans was studied. The experimentswere conducted with light-emitting diodes (LEDs) with different wavelengths: 380–750 nm (white),620–750 nm (red) and 450–495 nm (blue). The maximum specific growth rate was obtained byN. oleoabundans with white LEDs (0.264 ± 0.005 d−1), whereas the maximum biomass productivity(14 ± 4 mgdw L−1 d−1) and CO2 fixation rate (11.4 mgCO2 L−1 d−1) were obtained by C. vulgaris(also with white LEDs). Nitrogen and phosphorus removal efficiencies obtained under white lightconditions were also the highest for the three studied microalgae.
Keywords: CO2 capture; LEDs; light wavelength; microalgae; nutrient removal; processintegration; sustainability
1. Introduction
Since the pre-industrial period, the emissions of carbon dioxide (CO2) have been rapidly increasingdue to anthropogenic activities, mainly the combustion of fossil fuels [1]. The increase of the atmosphericCO2 concentration can lead to ocean acidification and the intensification of the greenhouse effect,resulting in various negative impacts, such as [2–4]: (i) the increase of the global average temperature;(ii) the melting of polar ice; and (iii) the rise of sea levels. To address this environmental problem,the scientific community has been exploring diverse options to effectively capture CO2 from theatmosphere or directly from emission sources.
Currently, the most used CO2 capture technologies include physical adsorption, chemicalabsorption, membrane separation and cryogenic fractionation [5]. Physical adsorption uses a solidadsorbent to separate and capture CO2 from flue gases. The main limitations of this technology are:(i) the necessity of a pre-treatment for the flue gas; (ii) the low adsorption capacity of the adsorbents;
Energies 2020, 13, 333; doi:10.3390/en13020333 www.mdpi.com/journal/energies

Energies 2020, 13, 333 2 of 14
and (iii) the high pressure and temperature required for the regeneration of the adsorbent [5]. Chemicalabsorption involves mainly the use of amine solvents to capture CO2 from flue gases and is oneof the most applied techniques. However, this method requires high energy for the regenerationof the applied amine solvent [6]. Besides, the amine solvents often react with SO2, which resultsin their degeneration; they also react with oxygen, generating corrosive products that lead to thecorrosion of mechanical parts [5]. It is also possible to use a membrane to separate CO2 from othergases. The main downsides of this technique are the high cost of the membranes and their low CO2
selectivity [6]. Another method used for CO2 capture is cryogenic fractionation, which is a process thatuses condensation to separate gaseous components. The main disadvantage of this technique is thathigh energy is required to ensure an acceptable refrigeration level for the process [5]. After capture,CO2 can be stored in deep geological formations, in the ocean or in the form of mineral carbonates. Ingeological storage, leakage of CO2 to the atmosphere can occur, posing several negative consequencesfor human and animal health. In the case of ocean storage, the increase of CO2 levels in the ocean cancontribute to its acidification, affecting marine lifeforms. Regarding mineralisation, its use as storagetechnique has limited applicability, due to the high costs associated with this process [7].
Due to sustainability issues, the use of photosynthetic microorganisms (e.g., microalgae) hasattracted the interest of many researchers worldwide as an alternative to the above-mentioned CO2
capture methods. When growing autotrophically, microalgae can convert CO2 and water into organicmatter and release oxygen into the atmosphere [8]. The capacity of microalgae to capture CO2 is 10 to50 times greater than that of terrestrial plants, with approximately 1.83 kg of CO2 being captured perkilogram of microalgal biomass produced [9,10]. Considering that worldwide microalgal cultivationcan reach an average of 5000 tonnes of dry algal biomass per year, it is possible to estimate thatmicroalgae can fix 9.15 kt of CO2 per year [11]. Another advantage of cultivating microalgae is thatarable land is not needed to cultivate these microorganisms, so food supplies, arable land and forestsare not compromised [12]. As photosynthetic organisms, microalgae need nutrients (such as nitrogenand phosphorus) to grow and, since these nutrients are typically found in wastewater, microalgaecan grow and remove them from different effluents containing the referred nutrients [13]. Microalgaecan accumulate large amounts of lipids that can be extracted and converted into biofuels [12]. Whenthe produced biomass is used as a feedstock for biofuels, a sustainable carbon cycle can be achieved:a near-zero balance of carbon emissions is possible because the CO2 emitted from the burning offuels is captured by microalgae for their growth and the consequent production of more biomass,which can be further used as a source for biofuel production [5]. After extraction of the compounds ofinterest, the residual biomass can be used for biomethane (biogas) production and also for applicationas bio-fertiliser [13,14]. When cultivated in controlled conditions, microalgal biomass can have severalother applications, as it is very rich in proteins and carbohydrates, being a valuable resource forapplication as animal feed and human food [15]. Furthermore, these microorganisms can accumulate agreat diversity of compounds, such as pigments, antioxidants, vitamins, among others, which givethem a great commercial appeal [12].
Despite the aforementioned advantages, microalgal production for CO2 capture still presentssome challenges, especially concerning the achievement of high biomass productivities at reducedcosts. Therefore, culture parameters should be optimised to improve biomass productivity. Microalgalgrowth is influenced by a variety of factors, such as light, nutrients availability, pH, temperature,salinity and dissolved oxygen concentration. Since microalgae are photosynthetic microorganisms,they require CO2 and light energy to perform these reactions. CO2 assimilation by microalgae dependson microalgal species, which have different tolerances to CO2 concentration, applied cultivation systemtypes, operating conditions and environmental factors. Since these microorganisms need light fortheir metabolic activity, the growth of microalgae is strongly influenced by this culture parameter,both in terms of quantity (light intensity and light period) and quality (wavelength, the light sourceused, among others). Different artificial light sources can be used for microalgal cultivation, such ashalogen lamps, incandescent bulbs, fluorescent lamps and light-emitting diodes (LEDs). These light
Energies 2020, 13, 333 3 of 14
sources differ from each other in the spectrum, wavelength distribution, energy consumption andcost. Based on these characteristics, the most commonly used light sources for microalgal productionare fluorescent lamps and LEDs. The use of LEDs as light source allows better control of light (whencompared with fluorescent lamps) and the use of different wavelengths, which can be favourablefor biomass production [16]. The light wavelength used in microalgal growth can induce differenteffects. Red light can promote higher growth rates with smaller cells and low nutrient uptake; bluelight affects gene expression and some metabolic pathways of microalgae, triggering a high nutrientuptake, but inducing lower growth rates with larger cells. Green microalgae cannot use yellow andgreen light effectively due to the lack of phycobilins [17]. Taking into account the important role oflight source on microalgal biomass production, this study aimed to evaluate the effect of different lightwavelengths (white, 380–750 nm; red, 620–750 nm; and blue, 450–495 nm) on the growth, biomassproductivity, and therefore CO2 capture, of three green microalgae: Chlorella vulgaris, Tetradesmusobliquus and Neochloris oleoabundans. Considering the ability of microalgae to remove nutrients, nitrogenand phosphorus removal efficiencies were also evaluated in the studied conditions, to assess thepossibility of process integration (microalgal biomass production with CO2 and nutrients uptake) and,consequently, production cost reduction.
2. Materials and Methods
2.1. Microorganisms and Culture Medium
The microalgae C. vulgaris CCAP 211/11B and T. obliquus CCAP 276/34 were obtained from theCulture Collection of Algae and Protozoa (CCAP, Scotland, UK) and N. oleoabundans UTEX 1185 wasobtained from the University of Texas Culture Collection of Algae (UTEX, Texas, USA). The microalgaewere inoculated in modified OECD (Organization for Economic Co-operation and Development) testmedium, with the same composition as the one reported by Gonçalves, et al. [18]. Microalgal stocksolutions were prepared in 100-mL Erlenmeyer flasks (50 mL working volume) using the above-referredculture medium under aseptic conditions. Erlenmeyer flasks were maintained at a constant temperatureof 25 ◦C under continuous light supply with an intensity of approximately 6.50 µmol m−2 s−1 andagitation was promoted by an orbital shaker (Unimax 1010, Heidolph, Germany) set at 100 rpm(rotations per minute).
2.2. Experimental Setup and Cultivation Conditions
Batch experiments using the above-referred culture medium were performed for 12 days in1000-mL flasks with a working volume of 900 mL. The average temperature during the experienceswas 21 ± 2 ◦C. Agitation of the cultures was promoted by the injection of atmospheric air (previouslyfiltered through 0.22-µm cellulose acetate membrane filters). Light was continuously supplied (24:0light:dark ratio) with a light intensity of 8 ± 1 µmol m−2 s−1. The experiments were carried out inan installation with LEDs (see Figure 1) set at different light wavelengths: (i) white (W, 380–750 nm);(ii) red (R, 620–750 nm); and (iii) blue (B, 450–495 nm). These wavelengths were selected becausered light is related to increased biomass growth and blue light is commonly associated with highernutrient consumption [16]. The surface where the cultures were located was at a distance of 49.0 cmfrom the light source. The initial biomass concentrations were: (i) 55 ± 3 mgdw L−1 for C. vulgaris;(ii) 33 ± 1 mgdw L−1 for T. obliquus; and (iii) 19 ± 1 mgdw L−1 for N. oleoabundans. The experimentswere performed in duplicates.
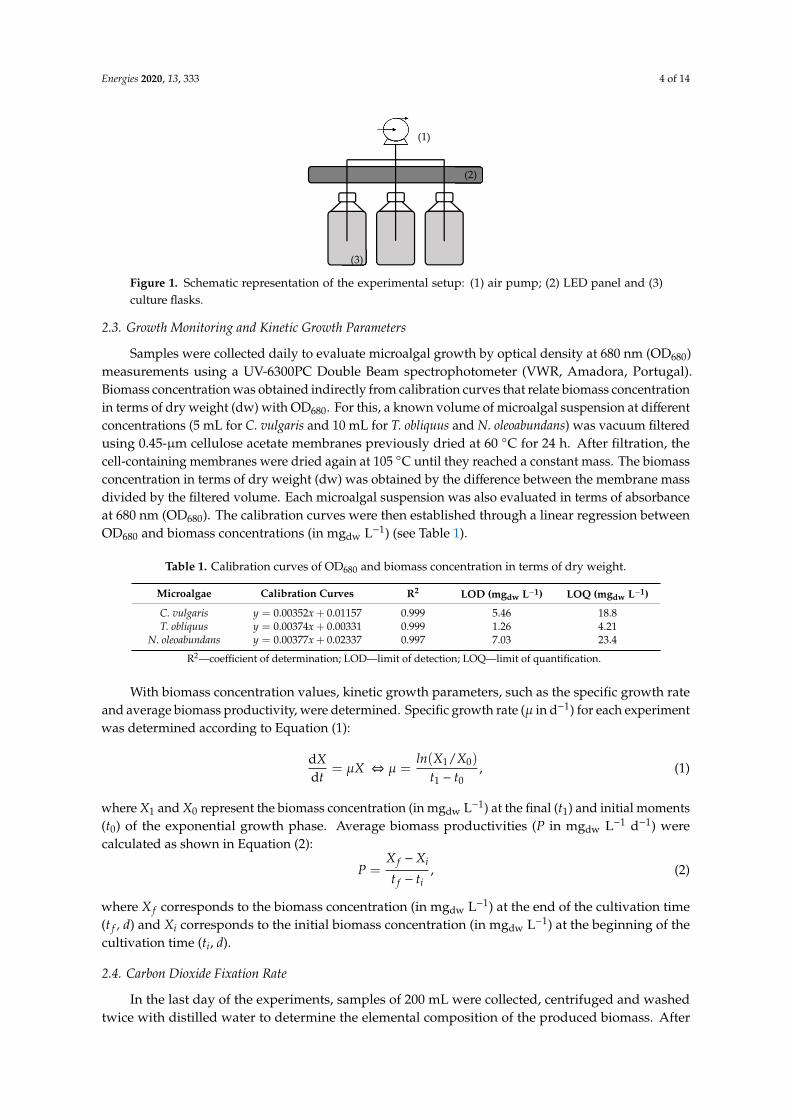
Energies 2020, 13, 333 4 of 14Energies 2019, 12, x FOR PEER REVIEW 4 of 14
Figure 1. Schematic representation of the experimental setup: (1) air pump; (2) LED panel and (3) culture flasks.
2.3. Growth Monitoring and Kinetic Growth Parameters
Samples were collected daily to evaluate microalgal growth by optical density at 680 nm (OD680) measurements using a UV-6300PC Double Beam spectrophotometer (VWR, Amadora, Portugal). Biomass concentration was obtained indirectly from calibration curves that relate biomass concentration in terms of dry weight (dw) with OD680. For this, a known volume of microalgal suspension at different concentrations (5 mL for C. vulgaris and 10 mL for T. obliquus and N. oleoabundans) was vacuum filtered using 0.45-µm cellulose acetate membranes previously dried at 60 °C for 24 h. After filtration, the cell-containing membranes were dried again at 105 °C until they reached a constant mass. The biomass concentration in terms of dry weight (dw) was obtained by the difference between the membrane mass divided by the filtered volume. Each microalgal suspension was also evaluated in terms of absorbance at 680 nm (OD680). The calibration curves were then established through a linear regression between OD680 and biomass concentrations (in mgdw L−1) (see Table 1).
With biomass concentration values, kinetic growth parameters, such as the specific growth rate and average biomass productivity, were determined. Specific growth rate (μ in d−1) for each experiment was determined according to Equation (1): = 𝜇𝑋 ⇔ 𝜇 = ⁄ , (1)
where 𝑋 and 𝑋 represent the biomass concentration (in mgdw L−1) at the final (𝑡 ) and initial moments (𝑡 ) of the exponential growth phase. Average biomass productivities (𝑃 in mgdw L−1 d−1) were calculated as shown in Equation (2): 𝑃 = , (2)
where 𝑋 corresponds to the biomass concentration (in mgdw L−1) at the end of the cultivation time (𝑡 , d) and 𝑋 corresponds to the initial biomass concentration (in mgdw L−1) at the beginning of the cultivation time (𝑡 , d).
2.4. Carbon Dioxide Fixation Rate
In the last day of the experiments, samples of 200 mL were collected, centrifuged and washed twice with distilled water to determine the elemental composition of the produced biomass. After this process, biomass was dried at 70 °C for 48 h. Elemental analysis of microalgal biomass was carried out based on the method described by Rocha, et al. [19]. The average carbon fixation rates (RC in mgCO2 L−1 d−1) were calculated according to Equation (3): 𝑅 = 𝐶 × 𝑃 × , (3)
(1)
(2)
(3)
Figure 1. Schematic representation of the experimental setup: (1) air pump; (2) LED panel and (3)culture flasks.
2.3. Growth Monitoring and Kinetic Growth Parameters
Samples were collected daily to evaluate microalgal growth by optical density at 680 nm (OD680)measurements using a UV-6300PC Double Beam spectrophotometer (VWR, Amadora, Portugal).Biomass concentration was obtained indirectly from calibration curves that relate biomass concentrationin terms of dry weight (dw) with OD680. For this, a known volume of microalgal suspension at differentconcentrations (5 mL for C. vulgaris and 10 mL for T. obliquus and N. oleoabundans) was vacuum filteredusing 0.45-µm cellulose acetate membranes previously dried at 60 ◦C for 24 h. After filtration, thecell-containing membranes were dried again at 105 ◦C until they reached a constant mass. The biomassconcentration in terms of dry weight (dw) was obtained by the difference between the membrane massdivided by the filtered volume. Each microalgal suspension was also evaluated in terms of absorbanceat 680 nm (OD680). The calibration curves were then established through a linear regression betweenOD680 and biomass concentrations (in mgdw L−1) (see Table 1).
Table 1. Calibration curves of OD680 and biomass concentration in terms of dry weight.
Microalgae Calibration Curves R2 LOD (mgdw L−1) LOQ (mgdw L−1)
C. vulgaris y = 0.00352x + 0.01157 0.999 5.46 18.8T. obliquus y = 0.00374x + 0.00331 0.999 1.26 4.21
N. oleoabundans y = 0.00377x + 0.02337 0.997 7.03 23.4
R2—coefficient of determination; LOD—limit of detection; LOQ—limit of quantification.
With biomass concentration values, kinetic growth parameters, such as the specific growth rateand average biomass productivity, were determined. Specific growth rate (µ in d−1) for each experimentwas determined according to Equation (1):
dXdt
= µX ⇔ µ =ln(X1/X0)
t1 − t0, (1)
where X1 and X0 represent the biomass concentration (in mgdw L−1) at the final (t1) and initial moments(t0) of the exponential growth phase. Average biomass productivities (P in mgdw L−1 d−1) werecalculated as shown in Equation (2):
P =X f −Xi
t f − ti, (2)
where X f corresponds to the biomass concentration (in mgdw L−1) at the end of the cultivation time(t f , d) and Xi corresponds to the initial biomass concentration (in mgdw L−1) at the beginning of thecultivation time (ti, d).
2.4. Carbon Dioxide Fixation Rate
In the last day of the experiments, samples of 200 mL were collected, centrifuged and washedtwice with distilled water to determine the elemental composition of the produced biomass. After
Energies 2020, 13, 333 5 of 14
this process, biomass was dried at 70 ◦C for 48 h. Elemental analysis of microalgal biomass wascarried out based on the method described by Rocha, et al. [19]. The average carbon fixation rates(RC in mgCO2 L−1 d−1) were calculated according to Equation (3):
RC = CC × P×MCO2
MC, (3)
where CC is the carbon mass fraction in biomass (in % wt.), P is the average biomass productivity(in mgdw L−1 d−1), MCO2 is the molecular weight of CO2 (in g mol−1) and MC is the molecular weightof C (in g mol−1).
2.5. Nutrients Removal
To analyse nutrients removal, samples were collected on days 0, 1, 2, 4, 7, 9 and 11 of each experiment.The samples were centrifuged (Himac CT6E Centrifuge, VWR, Amadora, Portugal) at 4000 rpm for10 min and then filtered with 0.45-µm nylon membrane syringe filters (Specanalitica, Cascais, Portugal).Nutrient concentrations (PO4
3−, and NO3−) in the filtered samples were analysed by ion chromatography
(ICS-2100, Dionex, VWR, Amadora, Portugal) using an AS9-HC column and the ASRS®300 suppressor.Evaluation of nutrients concentrations within cultivation time allowed the determination of nutrientremoval efficiencies (RE, %) and nutrient uptake rates by the selected microalgae under the studied lightconditions. Nutrients removal efficiencies were determined through Equation (4):
RE (%) =Si − S f
Si× 100, (4)
where Si and S f represent nutrients concentration (in mg L−1) in the beginning and at the end of thecultivation time, respectively.
Nutrient uptake rates were obtained by fitting the modified Gompertz model [20] (Equation (5))to the experimental data (corresponding to the time–course evolution of nutrients concentration):
S(t) = Si +(S f − Si
)× exp(−exp[k× (λ− t) + 1]), (5)
where S(t) is the time–course evolution of nutrients concentration, k is the removal rate (in d−1) and λis the lag time (in d). The kinetic parameters were obtained by minimising the sum of squared residualsusing the Solver supplement of Microsoft Excel 2016. The quality of the model fits was assessed bycalculating the coefficient of determination (R2) and the root mean squared error (RMSE).
2.6. Statistical Analysis
The average and standard deviation were calculated for each parameter. The statistical significanceof the results was assessed using the Student’s paired t-test to verify if the differences between thestudied microalgae and conditions could be considered significant. Statistical tests were performed ata significance level of 0.05.
3. Results and Discussion
3.1. Microalgal Growth
Phototrophic growth is closely related to the light quality used, with light wavelength being a factorthat has a great influence on microalgal growth. Through the monitoring of biomass concentration, itwas possible to analyse and characterise microalgal growth kinetics. Figure 2 presents the growth curvesobtained for C. vulgaris, T. obliquus and N. oleoabundans grown under different light conditions (white,red and blue LEDs). All the species grew under the different light conditions, except N. oleoabundans,which did not grow when cultivated under blue LED. This observation may be related to the low light

Energies 2020, 13, 333 6 of 14
intensity values used in this study and to the light supply in a narrower range of the spectrum, as wellas to the different responses of different microalgae to light conditions. In this case, N. oleoabundansmay be more susceptible to light limitation when growing under low light intensity and in this rangeof the light spectrum. Higher growth was obtained when microalgae were cultured under white LED.Comparing red and blue LEDs, it was found that the growth of C. vulgaris and N. oleoabundans wasfavoured under red LED conditions. In the case of T. obliquus, it was observed that its growth wasslightly higher in blue LED assays, being similar to the one obtained with white LED. From the growthcurves present in Figure 2, it was also possible to infer the adaptation phase of each microalga to thedifferent light conditions. This analysis shows that N. oleoabundans presented the longest adaptationphase (≈2 d) compared to the other studied species (≈0 d), for all tested light conditions. Table 2presents the kinetic growth parameters determined for the selected species in each of the studied lightconditions. The values of specific growth rates ranged between 0.0657 ± 0.0008 d−1 (for C. vulgaris withblue LED) and 0.264 ± 0.005 d−1 (for N. oleoabundans with white LED). C. vulgaris obtained the highestspecific growth rate with red LED (0.090± 0.007 d−1) and the lowest with blue LED (0.0657± 0.0008 d−1).Results in the same order of magnitude were obtained by Mohsenpour, et al. [21]: when cultivatingC. vulgaris under red light at a light intensity of 250 µmol m−2 s−1, the authors reported a specificgrowth rate of 0.07 d−1. Regarding the effect of different light wavelengths on microalgal growth,Li, et al. [22] also concluded that blue LED was not favourable for C. vulgaris growth. The higher valueobtained with red light can be related to the fact that this wavelength can promote an accelerationof the cell cycle, resulting in higher growth rates and smaller cells. This occurs because the mainphotosynthetic pigment absorbs light at approximately 600–700 nm, thus improving photosyntheticefficiency under this range of wavelengths (white and red LEDs). On the other hand, cultivation underblue light can lead to slower growth with the formation of larger cells [23]. In the case of T. obliquus, thehighest specific growth rate was obtained with white LED (0.12 ± 0.02 d−1), whereas the lowest valuewas obtained with red LED (0.08 ± 0.01 d−1). The values obtained are in line with the range of resultspresented by Gonçalves, et al. [24] for white, red and blue LEDs (0.07, 0.08 and 0.17 d−1, respectively).However, the specific growth rate values obtained in the present study followed a different trend:white LED > blue LED > red LED. The specific growth rate obtained by N. oleoabundans with whiteLED (0.264 ± 0.005 d−1) was the highest. This value was statistically higher (p < 0.05) than the specificgrowth rates obtained for the other studied microalgae grown in the same light conditions (white LED).Using red LED, the growth did not exceed 0.17 ± 0.03 d−1. Under blue LED, this microalga was unableto grow, and it was not possible to determine the specific growth rate in these conditions. In the studyperformed by Zhao, et al. [25], this microalga followed the same trend as the present study, though thespecific growth rate value was lower under white LED (0.216 d−1) and similar for red LED (0.179 d−1).However, in this study N. oleoabundans was able to grow under blue LED, with a specific growth rateof 0.134 d−1, which may be related to the lower light intensities provided to the cultures in the presentwork (8 ± 1 µmol m−2 s−1, compared with the 200 µmol m−2 s−1 reported in the above-mentionedstudy). Regarding the maximum biomass concentration, the highest values were obtained with whiteLED for all microalgal species, ranging from 79 ± 9 mgdw L−1 (for T. obliquus) to 128 ± 5 mgdw L−1 (forC. vulgaris). Concerning the red LED assays, the highest value of maximum biomass concentration wasobtained by C. vulgaris (116 ± 2 mgdw L−1), being this value statistically higher (p < 0.05) than thoseobtained by the other studied microalgae (66± 2 and 73± 8 mgdw L−1 for T. obliquus and N. oleoabundans,respectively). For blue LED conditions, C. vulgaris was the microalga that obtained the highest value ofmaximum biomass concentration (111 ± 2 mgdw L−1) and N. oleoabundans the lowest (34 ± 4 mgdw L−1).In terms of maximum biomass productivity values, achieved values are in agreement with the valuesof the specific growth rate. For all species, maximum biomass productivity values followed the trend:white LED > red LED > blue LED. These results are in accordance with previous studies that reporteda similar behaviour of these microalgae in this range of light wavelengths [25]. The highest maximumbiomass productivity values were obtained by C. vulgaris with white LED (14 ± 4 mgdw L−1 d−1) andthe lowest was obtained by T. obliquus with blue LED (5.9 ± 0.2 mgdw L−1 d−1). The values obtained

Energies 2020, 13, 333 7 of 14
are below the values reported by Gonçalves, et al. [24] for the cultivation of Tetradesmus sp. with lightintensity of 13 µmol m−2 s−1 using white LED (70 mgdw L−1 d−1), red LED (90 mgdw L−1 d−1) and blueLED (270 mgdw L−1 d−1). In the case of average biomass productivity values, the same behaviour as theother kinetic growth parameters can be observed, namely the values obtained for the assays performedunder white LED were higher than the ones achieved in the other light conditions. Values obtainedin these light conditions ranged from 4 ± 1 mgdw L−1 d−1 (for T. obliquus) to 6.8 ± 0.5 mgdw L−1 d−1
(for C. vulgaris). Assunção et al. [26] obtained an average productivity of 140 mgdw L−1 d−1 withT. obliquus, using a light intensity of 74 µmol m−2 s−1. These values are significantly higher thanthose obtained in the present study, possibly due to the higher light intensity used in their study.According to Table 2, white LED promotes increased growth rates and productivities of C. vulgaris andN. oleoabundans, while the use of blue LED results in the lowest microalgal growth. These results mightbe related to the emission spectra of the studied light sources and the absorption spectra of the mainpigments present in the studied microalgae. In the case of green microalgae, the main photosyntheticpigments are chlorophylls, which are the most important players in light-harvesting. Considering thatthese pigments absorb light at approximately 600–700 nm, the light sources that promote improvedlight-harvesting and, hence, improved photosynthetic efficiency, are those emitting in this range ofwavelengths, namely white and red LEDs [27,28]. T. obliquus achieved the highest values for allkinetic growth parameters with white LED and the lowest values with red LED. These results showthat the effects of light quality on the growth of microalgae are different, depending on the studiedmicroalgal species.
Energies 2019, 12, x FOR PEER REVIEW 7 of 14
values, the same behaviour as the other kinetic growth parameters can be observed, namely the values obtained for the assays performed under white LED were higher than the ones achieved in the other light conditions. Values obtained in these light conditions ranged from 4 ± 1 mgdw L−1 d−1 (for T. obliquus) to 6.8 ± 0.5 mgdw L−1 d−1 (for C. vulgaris). Assunção et al. [26] obtained an average productivity of 140 mgdw L−1 d−1 with T. obliquus, using a light intensity of 74 µmol m−2 s−1. These values are significantly higher than those obtained in the present study, possibly due to the higher light intensity used in their study. According to Table 2, white LED promotes increased growth rates and productivities of C. vulgaris and N. oleoabundans, while the use of blue LED results in the lowest microalgal growth. These results might be related to the emission spectra of the studied light sources and the absorption spectra of the main pigments present in the studied microalgae. In the case of green microalgae, the main photosynthetic pigments are chlorophylls, which are the most important players in light-harvesting. Considering that these pigments absorb light at approximately 600–700 nm, the light sources that promote improved light-harvesting and, hence, improved photosynthetic efficiency, are those emitting in this range of wavelengths, namely white and red LEDs [27,28]. T. obliquus achieved the highest values for all kinetic growth parameters with white LED and the lowest values with red LED. These results show that the effects of light quality on the growth of microalgae are different, depending on the studied microalgal species.
(a)
(b)
(c)
Figure 2. Growth curves obtained for (a) C. vulgaris, (b) T. obliquus and (c) N. oleoabundans under different light conditions (white, red and blue LEDs).
0
20
40
60
80
100
120
140
0 2 4 6 8 10 12
Biom
ass c
once
ntra
tion
(mg d
wL-1
)
Time (d)White LED Red LED Blue LED
0
20
40
60
80
100
120
140
0 2 4 6 8 10 12
Biom
ass c
once
ntra
tion
(mg d
wL-1
)
Time (d)White LED Red LED Blue LED
0
20
40
60
80
100
120
140
0 2 4 6 8 10 12
Biom
ass c
once
ntra
tion
(mg d
wL-1
)
Time (d)White LED Red LED Blue LED
Figure 2. Growth curves obtained for (a) C. vulgaris, (b) T. obliquus and (c) N. oleoabundans underdifferent light conditions (white, red and blue LEDs).

Energies 2020, 13, 333 8 of 14
Table 2. Kinetic growth parameters determined for the studied microalgae grown under differentlight wavelengths.
Parameters Light C. vulgaris T. obliquus N. oleoabundans
µ (d−1)White 0.084 ± 0.007 0.12 ± 0.02 0.264 ± 0.005Red 0.090 ± 0.007 0.08 ± 0.01 0.17 ± 0.03Blue 0.0657 ± 0.0008 0.106 ± 0.006 ND
Xmax (mgdw L−1)White 128 ± 5 79 ± 9 80 ± 4Red 116 ± 2 66 ± 2 73 ± 8Blue 111 ± 2 75 ± 1 34 ± 4
Pmax (mgdw L−1 d−1)White 14 ± 4 8.8 ± 0.9 10.6 ± 0.3Red 10.2 ± 0.4 8 ± 1 10 ± 1Blue 11 ± 3 5.9 ± 0.2 ND
P (mgdw L−1 d−1)White 6.8 ± 0.5 4 ± 1 5.5 ± 0.5Red 4.6 ± 0.5 3.0 ± 0.2 4.2 ± 0.3Blue 4.53 ± 0.07 3.70 ± 0.08 ND
µ—specific growth rate (d−1); ND—value not determined; Xmax—maximum biomass concentration (mgdw L−1);Pmax—maximum biomass productivity (mgdw L−1 d−1); P—average biomass productivity (mgdw L−1 d−1).
3.2. Carbon Dioxide Fixation Rates
Assuming that all CO2 captured is converted into biomass, CO2 fixation rates were determinedbased on the carbon content in biomass and the average productivities. Figure 3 presents the CO2
fixation rates obtained for C. vulgaris, T. obliquus and N. oleoabundans cultivated under differentlight conditions. The values of CO2 fixation rate ranged from 5.1 ± 0.2 (for T. obliquus with redLED) to 11.4 ± 0.5 mgCO2 L−1 d−1 (for C. vulgaris with white LED). As expected, the CO2 fixationrates were higher in the experiments with white LED, since high biomass productivities wereachieved. For C. vulgaris and N. oleoabundans, the highest CO2 fixation rates were obtained withwhite LED (11.4 ± 0.5 and 9.2 ± 0.5 mgCO2 L−1 d−1, respectively) and the lowest with blue LED(7.11 ± 0.07 mgCO2 L−1 d−1 for C. vulgaris). Similarly, for T. obliquus the highest value was obtainedwith white LED (7.4 ± 1.2 mgCO2 L−1 d−1). However, the lowest value was obtained with red LED(5.1 ± 0.2 mgCO2 L−1 d−1). When comparing the results obtained for the studied microalgal species, it ispossible to observe that T. obliquus presented the lowest values in all LED conditions. At the end of theexperiments, the highest values of CO2 fixed by all species were achieved with white LED: 126 mgCO2
for C. vulgaris, 81.4 mgCO2 for T. obliquus and 101 mgCO2 for N. oleoabundans. Ho, et al. [29] reportedCO2 fixation rates between 374 and 745 mgCO2 L−1 d−1 using different T. obliquus strains. These resultsare significantly higher than the ones obtained in the present study due to the higher light intensityused in the above-mentioned study (140 µmol m−2 s−1) and also to the aeration of microalgal cultureswith a CO2-enriched stream (2.5% v/v). Chaudhary, et al. [30] also reported a CO2 fixation rate of141 mgCO2 L−1 d−1 for C. vulgaris and 130 mgCO2 L−1 d−1 for T. obliquus, both species fed with a 5% (v/v)CO2 stream and grown under cool white fluorescent light. The values obtained by N. oleoabundans werealso below those reported by Razzak [31]: 80 mgCO2 L−1 d−1 with a light intensity of 65 µmol m−2 s−1.
Energies 2020, 13, 333 9 of 14Energies 2019, 12, x FOR PEER REVIEW 9 of 14
(a) (b)
(c)
Figure 3. CO2 fixation rates obtained for (a) C. vulgaris, (b) T. obliquus and (c) N. oleoabundans under different light conditions (white, red and blue LEDs). Error bars correspond to the standard deviation. * Value not determined because this species did not grow under blue light.
Besides the determination of carbon content in microalgal cells, the elemental analysis of the produced biomass allowed the evaluation of the effect of light wavelength on the chemical composition of microalgae and also the assessment of the different nutritional needs in each of the studied light conditions. Mass percentages of carbon (C), hydrogen (H), nitrogen (N) and sulphur (S) determined in the studied microalgae in the evaluated light conditions are presented in Table 3. Regarding C. vulgaris, determined C and H contents were higher in biomass produced with white LED (46 ± 2 wt.% and 6.8 ± 0.3 wt.%) and lower in biomass resulting from cultures grown under blue LED (43 ± 1 wt.% and 6.5 ± 0.2 wt.%). In the case of biomass produced with red LED, C and H mass fractions were not statistically different (p > 0.05) from those obtained with white LED. On the other hand, N and S contents present in microalgal biomass grown under blue LED (8.0 ± 0.3 wt.% and 0.6 ± 0.1 wt.%, respectively) were higher than those obtained under red LED conditions (7.5 ± 0.1 wt.% and 0.4 ± 0.1 wt.%, respectively), these values being statistically different (p < 0.05). The lower C content obtained by C. vulgaris with blue LED can be related to the fact that blue light releases high energy photons that induce endogenous respiration, which is responsible for the breakdown of carbohydrates reserves and their conversion into CO2 that is further released to the atmosphere. Accordingly, this phenomenon results in a great loss of carbohydrate reserves, which is reflected in the low carbon contents determined in biomass resulting from blue LED experiments [32]. At the same time, this microalga obtained the highest values of N content with the same light condition (blue light), due to a light stress caused by this light wavelength that triggers the accumulation of photo-protective pigments and induces an increase in protein content (which is closely linked with N content) [17,33]. Phukan, et al. [34] reported C, H and N contents in C. vulgaris sp. of 47.5, 7.1 and 6.7 wt.%, respectively, whose values are very similar to those obtained in the present study with
0
5
10
15R C
(mg C
O2
L-1d-1
)
White LED Red LED Blue LED0
5
10
15
R C(m
g CO
2L-1
d-1)
White LED Red LED Blue LED
*0
5
10
15
R C(m
g CO
2L-1
d-1)
White LED Red LED Blue LED
Figure 3. CO2 fixation rates obtained for (a) C. vulgaris, (b) T. obliquus and (c) N. oleoabundans underdifferent light conditions (white, red and blue LEDs). Error bars correspond to the standard deviation.* Value not determined because this species did not grow under blue light.
Besides the determination of carbon content in microalgal cells, the elemental analysis of theproduced biomass allowed the evaluation of the effect of light wavelength on the chemical compositionof microalgae and also the assessment of the different nutritional needs in each of the studied lightconditions. Mass percentages of carbon (C), hydrogen (H), nitrogen (N) and sulphur (S) determined inthe studied microalgae in the evaluated light conditions are presented in Table 3. Regarding C. vulgaris,determined C and H contents were higher in biomass produced with white LED (46 ± 2 wt.% and6.8 ± 0.3 wt.%) and lower in biomass resulting from cultures grown under blue LED (43 ± 1 wt.%and 6.5 ± 0.2 wt.%). In the case of biomass produced with red LED, C and H mass fractions were notstatistically different (p > 0.05) from those obtained with white LED. On the other hand, N and S contentspresent in microalgal biomass grown under blue LED (8.0 ± 0.3 wt.% and 0.6 ± 0.1 wt.%, respectively)were higher than those obtained under red LED conditions (7.5 ± 0.1 wt.% and 0.4 ± 0.1 wt.%,respectively), these values being statistically different (p < 0.05). The lower C content obtained byC. vulgaris with blue LED can be related to the fact that blue light releases high energy photons thatinduce endogenous respiration, which is responsible for the breakdown of carbohydrates reserves andtheir conversion into CO2 that is further released to the atmosphere. Accordingly, this phenomenonresults in a great loss of carbohydrate reserves, which is reflected in the low carbon contents determinedin biomass resulting from blue LED experiments [32]. At the same time, this microalga obtained thehighest values of N content with the same light condition (blue light), due to a light stress caused bythis light wavelength that triggers the accumulation of photo-protective pigments and induces anincrease in protein content (which is closely linked with N content) [17,33]. Phukan, et al. [34] reportedC, H and N contents in C. vulgaris sp. of 47.5, 7.1 and 6.7 wt.%, respectively, whose values are very

Energies 2020, 13, 333 10 of 14
similar to those obtained in the present study with white LED. C, H, N and S contents obtained byT. obliquus followed the trend: white LED > red LED > blue LED. In the case of N. oleoabundans, thehighest C, H and N contents were obtained in biomass grown with white LED (46.0 ± 0.6, 6.7 ± 0.1,7.9 ± 0.1 wt.%, respectively), being statistically higher (p < 0.05) than those obtained with red LEDconditions. Tibbetts, et al. [35] reported that the proximate nitrogen content of N. oleoabundans was6.3 wt.%, being this value lower than the one obtained in the present study.
Table 3. Elemental analysis of the algal biomass grown under different light wavelengths.
Parameters Light C. vulgaris T. obliquus N. oleoabundans
C (wt.%)White 46 ± 2 48 ± 2 46.0 ± 0.6Red 45.6 ± 0.9 45.8 ± 0.9 40 ± 1Blue 43 ± 1 43.6 ± 0.7 ND
H (wt.%)White 6.8 ± 0.3 7.0 ± 0.2 6.7 ± 0.1Red 6.7 ± 0.1 6.9 ± 0.2 6.0 ± 0.1Blue 6.5 ± 0.2 6.6 ± 0.2 ND
N (wt.%)White 7.9 ± 0.3 8.7 ± 0.1 7.9 ± 0.1Red 7.5 ± 0.1 8.6 ± 0.2 7.4 ± 0.2Blue 8.0 ± 0.3 8.4 ± 0.3 ND
S (wt.%)White 0.5 ± 0.1 0.6 ± 0.1 0.8 ± 0.1Red 0.4 ± 0.1 0.6 ± 0.1 0.8 ± 0.1Blue 0.6 ± 0.1 0.5 ± 0.1 ND
ND—value not determined.
Taking into account the mass fractions of each analysed element, the molecular formula(COaHbNcPdSe) of the biomass for each microalga was determined (a and d were not determined):(i) C. vulgaris (b = 1.74–1.81; c = 0.14–0.16; e = 0.004–0.005); (ii) T. obliquus (b = 1.75–1.79; c = 0.16;0.004–0.005); and (iii) N. oleoabundans (1.74–1.76; 0.15–0.16; e = 0.007).
3.3. Nutrient Removal
The European Union (EU) has set limits for the concentration of nutrients (nitrogen and phosphorus)in effluents, as well as minimum percentages of load reduction [36,37]. According to these Directives,the limits for effluent discharge are the following: (i) 10–15 mgN L−1 for nitrogen, with a minimumreduction percentage of 70%–80%; and (ii) 1–2 mgP L−1 for phosphorus, with a minimum reductionof 80%.
To evaluate the nutrient (nitrogen and phosphorus) removal capacity of the studied microalgaeunder the range of light wavelengths evaluated, nitrogen and phosphorus removal efficiencies andkinetics were determined. The results are presented in Table 4. Values of nitrogen removal efficiencyranged between 17 ± 1% (for N. oleoabundans grown with red LED) and 36 ± 1% (for C. vulgaris grown inthe same light conditions). On the other hand, phosphorus removal efficiency values ranged between7 ± 5% (for C. vulgaris grown with blue LED) and 20 ± 9% (for C. vulgaris grown with white LED).Regarding the potential of the studied microalgae for the uptake of these nutrients, it was observedthat C. vulgaris was the microalga presenting the highest nitrogen and phosphorus removal efficiencieswith values statistically higher (p < 0.05) than those obtained for the other studied microalgae. Onthe other hand, N. oleoabundans was the microalga achieving the lowest efficiency results. In termsof light wavelength, it was observed that the lowest values of nitrogen and phosphorus removalefficiency were obtained in cultures performed with blue LED. At the end of the experiments, thevalues of nitrogen concentration ranged from 23.0 to 36.4 mgN L−1 and the values of phosphorusconcentration ranged between 8.9 and 12.7 mgP L−1, values above the limits defined by EU legislation.The low biomass productivity and specific growth rates and, consequently, the low nutrients removalefficiencies obtained in this study can be attributed to light limitation, as the light intensity suppliedto the cultures did not exceed 8 ± 1 µmol m−2 s−1. Kim, et al. [38] cultivated T. obliquus under white,

Energies 2020, 13, 333 11 of 14
red and blue LEDs and the amount of nitrogen and phosphorus removed varied depending on thelight used for microalgal growth, wherein the highest amounts of nitrogen and phosphorus removedwere obtained with blue LED, followed by red LED and, finally, white LED. The same behaviour wasobtained in the present study for nitrogen removal. Microalgae consumed more nitrates with blue lightthan with red light, because when growing with blue light, microalgae are more dependent on the useof nutrients for their growth. At this wavelength, the activation of nitrate and phosphorus reductasesoccurs, leading to an increase in the absorption of these nutrients [16,38]. The modified Gompertzmodel was used to determine the lag time (λ) and the uptake rate (k) for nitrogen and phosphorus.Analysing the performance parameters R2 and RMSE, obtained coefficients of determination are closeto one (R2
≥ 0.934) and RMSE values are low, showing the suitability of the modified Gompertz modelto describe the experimental data. The highest values of nitrogen and phosphorus removal rate wereobtained by T. obliquus with blue (0.397 d−1) and white (0.517 d−1) LEDs, respectively. Based on theseresults, it can be concluded that T. obliquus was able to uptake nitrogen and phosphorus faster than theother studied microalgae. Regarding nitrogen kinetic parameters, the lag time was higher when thecultures grew under blue LED.
Table 4. Nitrogen and phosphorus removal efficiencies and kinetic parameters of nitrogen andphosphorus uptake (obtained through the modified Gompertz model) determined for the studiedmicroalgae grown under different light wavelengths.
Microalgae Light RE (%) λ (d) k (d−1) R2 RMSE (mg L−1) 2
N
C. vulgarisWhite 36 ± 1 0.804 0.316 0.993 0.786Red 23 ± 1 0 0.328 0.992 0.611Blue 20 ± 5 0.917 0.319 0.994 0.485
T. obliquusWhite 23 ± 3 0.164 0.355 0.974 0.846Red 20 ± 5 0.157 0.322 0.993 0.467Blue 20 ± 2 2.06 0.397 0.995 0.522
N. oleoabundansWhite 21 ± 2 0.368 0.318 0.992 0.450Red 17 ± 1 0.333 0.339 0.995 0.361Blue ND ND ND ND ND
P
C. vulgarisWhite 20 ± 9 1.79 0.394 0.990 0.168Red 9 ± 1 0 0.213 0.934 0.222Blue 7 ± 5 0 0.250 0.965 0.129
T. obliquusWhite 17 ± 4 0 0.517 0.968 0.188Red 18 ± 4 0 0.276 0.980 0.213Blue 13 ± 1 2.41 0.270 0.976 0.230
N. oleoabundansWhite 16 ± 2 0 0.269 0.970 0.209Red 14 ± 2 0 0.310 0.976 0.176Blue ND ND ND ND ND
RE—removal efficiency (%); λ—lag time (d); k—uptake rate (d−1); R2—coefficient of determination; RMSE—rootmean squared error; ND—value not determined.
3.4. Integrated Evaluation of the Effect of Light Wavelength on Microalgal Growth and Carbon andNutrient Uptake
The results obtained in this study showed that light wavelength influenced microalgal growth,CO2 and nutrient uptake and elemental composition of biomass in different ways. In addition, changesin the light wavelength resulted in different responses from the studied microalgae, which demonstratesa species-specific behaviour. Table 5 summarises how light wavelength influenced microalgal growthrates, biomass productivities, CO2 uptake rates, nitrogen and phosphorus uptake and C, H, N and Scontents of the studied microalgae. In terms of microalgal growth and CO2 uptake rates, in general,higher values were obtained in cultures performed with white LED, rather than with red and blueLEDs. Considering nitrogen and phosphorus uptake, higher efficiencies were also obtained for cultures
Energies 2020, 13, 333 12 of 14
grown with white LED, except in the case of phosphorus uptake by T. obliquus, which was higher inred LED conditions. Finally, C, H, N and S contents varied according to the light wavelength used,but also according to the microalgal species. These results are very important, as they give importantinformation on how to select the best operational conditions (in terms of light wavelength), dependingon the microalgal species in use and on the purpose of microalgal cultivation.
Table 5. Summary of the influence of light wavelengths on studied microalgae.
Microalgae Light Effects
C. vulgaris White
High biomass productivities;High C, H and N contents;
High CO2 uptake rates;High N and P uptake.
Red High specific growth rates;High C and H contents.
Blue High N and S contents.
T. obliquus White
High specific growth rates and biomass productivities;High C, H, N and S contents;
High CO2 uptake rates;High N uptake.
Red High P uptake.
N. oleoabundans White
High specific growth rates and biomass productivities;High C, H, N and S contents;
High CO2 uptake rates;High N and P uptake.
4. Conclusions
Microalgal kinetic growth parameters, such as the specific growth rate and biomass productivity,were evaluated using different light wavelengths. The results showed white LED to be the light sourcepromoting higher growth, except for C. vulgaris, which presented higher growth with red LED. Thisobservation may be a result of an acceleration of the cell cycle in these light conditions, which canlead to an increase in specific growth rates. Regarding CO2 fixation rate values, these were higherin the experiments performed under white LED, with values ranging from 7.4 ± 1.2 mgCO2 L−1 d−1
(for T. obliquus) to 11.4 ± 0.5 mgCO2 L−1 d−1 (for C. vulgaris). The removal of nutrients from theculture medium was evaluated in terms of removal efficiencies and uptake kinetics. Nitrogen removalefficiencies obtained under white LED were the highest for the three microalgae, ranging from 21 ± 2%to 36 ± 1%. At this light wavelength range, the highest value was obtained by C. vulgaris and the lowestby N. oleoabundans. In the case of phosphorus, the white LED assays showed the highest values ofremoval efficiency (up to 20%) and the blue LED assays presented the lowest values of this parameter(up to 13%). The results from this study present relevant insights on the influence of light wavelengthon biomass production, CO2 and nutrients uptake, and biochemical composition of biomass, pointingout some criteria for selection of the light wavelength to use depending on the intended application formicroalgae and on the microalgal species used. Regarding CO2 uptake rates determined in this study,although these values were lower than other values already reported in the literature, it is important tonote that higher light intensities could be used to improve photosynthetic efficiency and, hence, CO2
uptake rates.
Author Contributions: A.F.E. performed the experiments and data analysis and wrote the manuscript; O.S.G.P.S.performed the elemental analysis of biomass and helped in manuscript revision; V.J.P.V. participated in the designof the study and helped in manuscript revision; J.C.M.P. participated in the design of the study and helped inmanuscript revision; A.L.G. participated in the design of the study and helped in manuscript revision. All authorshave read and agreed to the published version of the manuscript.

Energies 2020, 13, 333 13 of 14
Funding: This work was financially supported by: (i) Project UID/EQU/00511/2019—Laboratory forProcess Engineering, Environment, Biotechnology and Energy (LEPABE) and Associate LaboratoryLSRE-LCM—UID/EQU/50020/2019—funded by national funds through FCT/MCTES (PIDDAC); (ii) ProjectPOCI-01-0145-FEDER-031736—PIV4 Algae—Process Intensification for microalgal production and Valorisation,funded by FEDER funds through COMPETE2020—Programa Operacional Competitividade e Internacionalização(POCI) and by national funds (PIDDAC) through FCT/MCTES; and (iii) V.J.P. Vilar acknowledges the FCTIndividual Call to Scientific Employment Stimulus 2017 (CEECIND/01317/2017) and J.C.M. Pires acknowledgesthe FCT Investigator 2015 Programme (IF/01341/2015).
Conflicts of Interest: The authors declare no conflict of interest.
References
1. De Morais, M.G.; de Morais, E.G.; Duarte, J.H.; Deamici, K.M.; Mitchell, B.G.; Costa, J.A.V. BiologicalCO2 mitigation by microalgae: Technological trends, future prospects and challenges. World J. Microbiol.Biotechnol. 2019, 35, 78. [CrossRef] [PubMed]
2. Tavoni, M.; Socolow, R. Modeling meets science and technology: An introduction to a special issue onnegative emissions. Clim. Chang. 2013, 118, 1–14. [CrossRef]
3. Solomon, S.; Plattner, G.-K.; Knutti, R.; Friedlingstein, P. Irreversible climate change due to carbon dioxideemissions. Proc. Natl. Acad. Sci. USA 2009, 106, 1704–1709. [CrossRef] [PubMed]
4. Esteves, A.F.; Santos, F.M.; Pires, J.C.M. Carbon dioxide as geothermal working fluid: An overview. Renew.Sustain. Energy Rev. 2019, 114, 109331. [CrossRef]
5. Lam, M.K.; Lee, K.T.; Mohamed, A.R. Current status and challenges on microalgae-based carbon capture.Int. J. Greenh. Gas Control 2012, 10, 456–469. [CrossRef]
6. Ahmed, R.; Liu, G.; Yousaf, B.; Abbas, Q.; Ullah, H.; Ali, M.U. Recent advances in carbon-based renewableadsorbent for selective carbon dioxide capture and separation—A review. J. Clean. Prod. 2019, 242, 118409.[CrossRef]
7. Pires, J.; Martins, F.; Alvim-Ferraz, M.; Simões, M. Recent developments on carbon capture and storage: Anoverview. Chem. Eng. Res. Des. 2011, 89, 1446–1460. [CrossRef]
8. Klinthong, W.; Yang, Y.-H.; Huang, C.-H.; Tan, C.-S. A review: Microalgae and their applications in CO2
capture and renewable energy. Aerosol Air Qual. Res. 2015, 15, 712–742. [CrossRef]9. Cheah, W.Y.; Show, P.L.; Chang, J.-S.; Ling, T.C.; Juan, J.C. Biosequestration of atmospheric CO2 and flue
gas-containing CO2 by microalgae. Bioresour. Technol. 2015, 184, 190–201. [CrossRef]10. Jiang, Y.; Zhang, W.; Wang, J.; Chen, Y.; Shen, S.; Liu, T. Utilization of simulated flue gas for cultivation of
Scenedesmus dimorphus. Bioresour. Technol. 2013, 128, 359–364. [CrossRef]11. Wijffels, R.H.; Barbosa, M.J. An outlook on microalgal biofuels. Science 2010, 329, 796–799. [CrossRef]12. Milano, J.; Ong, H.C.; Masjuki, H.; Chong, W.; Lam, M.K.; Loh, P.K.; Vellayan, V. Microalgae biofuels as an
alternative to fossil fuel for power generation. Renew. Sustain. Energy Rev. 2016, 58, 180–197. [CrossRef]13. Parmar, A.; Singh, N.K.; Pandey, A.; Gnansounou, E.; Madamwar, D. Cyanobacteria and microalgae: A
positive prospect for biofuels. Bioresour. Technol. 2011, 102, 10163–10172. [CrossRef]14. Saratale, R.G.; Kumar, G.; Banu, R.; Xia, A.; Periyasamy, S.; Saratale, G.D. A critical review on anaerobic
digestion of microalgae and macroalgae and co-digestion of biomass for enhanced methane generation.Bioresour. Technol. 2018, 262, 319–332. [CrossRef]
15. Lucas, B.F.; de Morais, M.G.; Santos, T.D.; Costa, J.A.V. Spirulina for snack enrichment: Nutritional, physicaland sensory evaluations. LWT 2018, 90, 270–276. [CrossRef]
16. Schulze, P.S.; Pereira, H.G.; Santos, T.F.; Schueler, L.; Guerra, R.; Barreira, L.A.; Perales, J.A.; Varela, J.C.Effect of light quality supplied by light emitting diodes (LEDs) on growth and biochemical profiles ofNannochloropsis oculata and Tetraselmis chuii. Algal Res. 2016, 16, 387–398. [CrossRef]
17. Schulze, P.S.C. Effects of Light Quality Supplied by Light Emitting Diodes (LEDs) on Microalgal Production.Master’s Thesis, Universidade do Algarve Faculdade de Ciências e Tecnologia, Algarve, Portugal, 2014.
18. Gonçalves, A.L.; Rodrigues, C.M.; Pires, J.C.; Simões, M. The effect of increasing CO2 concentrations on itscapture, biomass production and wastewater bioremediation by microalgae and cyanobacteria. Algal Res.2016, 14, 127–136. [CrossRef]

Energies 2020, 13, 333 14 of 14
19. Rocha, R.P.; Soares, O.S.G.; Gonçalves, A.G.; Órfão, J.J.; Pereira, M.F.R.; Figueiredo, J.L. Differentmethodologies for synthesis of nitrogen doped carbon nanotubes and their use in catalytic wet air oxidation.Appl. Catal. A Gen. 2017, 548, 62–70. [CrossRef]
20. Zwietering, M.H.; Jongenburger, I.; Rombouts, F.M.; Van’t Riet, K. Modeling of the bacterial growth curve.Appl. Environ. Microbiol. 1990, 56, 1875–1881. [CrossRef]
21. Mohsenpour, S.F.; Richards, B.; Willoughby, N. Spectral conversion of light for enhanced microalgae growthrates and photosynthetic pigment production. Bioresour. Technol. 2012, 125, 75–81. [CrossRef]
22. Li, D.; Yuan, Y.; Cheng, D.; Zhao, Q. Effect of light quality on growth rate, carbohydrate accumulation, fattyacid profile and lutein biosynthesis of Chlorella sp. AE10. Bioresour. Technol. 2019, 291, 121783. [CrossRef][PubMed]
23. Schulze, P.S.C.; Barreira, L.A.; Pereira, H.G.C.; Perales, J.A.; Varela, J.C.S. Light emitting diodes (LEDs)applied to microalgal production. Trends Biotechnol. 2014, 32, 422–430. [CrossRef] [PubMed]
24. Gonçalves, V.D.; Fagundes-Klen, M.R.; Trigueros, D.E.G.; Schuelter, A.R.; Kroumov, A.D.; Módenes, A.N.Combination of Light Emitting Diodes (LEDs) for photostimulation of carotenoids and chlorophylls synthesisin Tetradesmus sp. Algal Res. 2019, 43, 101649. [CrossRef]
25. Zhao, Y.; Sun, S.; Hu, C.; Zhang, H.; Xu, J.; Ping, L. Performance of three microalgal strains in biogasslurry purification and biogas upgrade in response to various mixed light-emitting diode light wavelengths.Bioresour. Technol. 2015, 187, 338–345. [CrossRef]
26. Assunção, J.; Batista, A.P.; Manoel, J.; da Silva, T.L.; Marques, P.; Reis, A.; Gouveia, L. CO2 utilization in theproduction of biomass and biocompounds by three different microalgae. Eng. Life Sci. 2017, 17, 1126–1135.[CrossRef]
27. Masojídek, J.; Torzillo, G.; Koblížek, M. Photosynthesis in Microalgae. In Handbook of Microalgal Culture:Applied Phycology and Biotechnology; Blackwell Science Ltd.: Oxford, UK, 2013; pp. 21–36.
28. Richmond, A.; Hu, Q. Biological principles of mass cultivation of photoautotrophic microalgae. In Handbook ofMicroalgal Culture: Applied Phycology and Biotechnology; Blackwell Science Ltd.: Oxford, UK, 2013; pp. 171–204.
29. Ho, S.-H.; Chen, C.-Y.; Chang, J.-S. Effect of light intensity and nitrogen starvation on CO2 fixation andlipid/carbohydrate production of an indigenous microalga Scenedesmus obliquus CNW-N. Bioresour. Technol.2012, 113, 244–252. [CrossRef]
30. Chaudhary, R.; Dikshit, A.K.; Tong, Y.W. Carbon-dioxide biofixation and phycoremediation of municipalwastewater using Chlorella vulgaris and Scenedesmus obliquus. Environ. Sci. Pollut. Res. 2018, 25, 20399–20406.[CrossRef]
31. Razzak, S. In situ biological CO2 fixation and wastewater nutrient removal with Neochloris oleoabundans inbatch photobioreactor. Bioprocess Biosyst. Eng. 2019, 42, 93–105. [CrossRef]
32. Kowallik, W. Blue light effects on respiration. Annu. Rev. Plant Physiol. 1982, 33, 51–72. [CrossRef]33. Kamiya, A.; Saitoh, T. Blue-light-control of the uptake of amino acids and of ammonia in Chlorella mutants.
Physiol. Plant. 2002, 116, 248–254. [CrossRef]34. Phukan, M.M.; Chutia, R.S.; Konwar, B.; Kataki, R. Microalgae Chlorella as a potential bio-energy feedstock.
Appl. Energy 2011, 88, 3307–3312. [CrossRef]35. Tibbetts, S.M.; Milley, J.E.; Lall, S.P. Chemical composition and nutritional properties of freshwater and
marine microalgal biomass cultured in photobioreactors. J. Appl. Phycol. 2015, 27, 1109–1119. [CrossRef]36. Directive 1991/271/EEC. Directive 1991/271/EEC. Directive of the European Council oh 21 May 1991 concerning
urban wastewater treatment. In 1991/271/EEC, Official Journal of the European Union L 0271; European Comission:Brussels, Belgium, 1991.
37. Directive 1998/15/EC. Directive 1998/15/EC. Directive of the European Commissin of 27 February 1998amending Council Directive 91/271/EEC with respect to certain requirements established in Annex I thereof.In 1998/15/CE, Official Journal of the European Union L67/29; European Comission: Brussels, Belgium, 1998.
38. Kim, T.-H.; Lee, Y.; Han, S.-H.; Hwang, S.-J. The effects of wavelength and wavelength mixing ratios onmicroalgae growth and nitrogen, phosphorus removal using Scenedesmus sp. for wastewater treatment.Bioresour. Technol. 2013, 130, 75–80. [CrossRef] [PubMed]
© 2020 by the authors. Licensee MDPI, Basel, Switzerland. This article is an open accessarticle distributed under the terms and conditions of the Creative Commons Attribution(CC BY) license (http://creativecommons.org/licenses/by/4.0/).