Embed Size (px)
Citation preview

Instructions for use
Title Micro-milling of spent granular activated carbon for its possible reuse as an adsorbent: Remaining capacity andcharacteristics
Author(s) Pan, Long; Takagi, Yuichi; Matsui, Yoshihiko; Matsushita, Taku; Shirasaki, Nobutaka
Citation Water research, 114, 50-58https://doi.org/10.1016/j.watres.2017.02.028
Issue Date 2017-05
Doc URL http://hdl.handle.net/2115/73814
Rights ©2017. This manuscript version is made available under the CC-BY-NC-ND 4.0 licensehttp://creativecommons.org/licenses/by-nc-nd/4.0/
Rights(URL) http://creativecommons.org/licenses/by-nc-nd/4.0/
Type article (author version)
File Information Micro-milling of spent granular activated carbon.pdf
Hokkaido University Collection of Scholarly and Academic Papers : HUSCAP

1
1
2
Micro-milling of Spent Granular Activated Carbon for its Possible Reuse 3
as an Adsorbent: Remaining Capacity and Characteristics 4
5
6
7
Long Pan a, Yuichi Takagi a, Yoshihiko Matsui b*, Taku Matsushita b, Nobutaka Shirasaki b 8
9
10
a Graduate School of Engineering, Hokkaido University, N13W8, Sapporo 060-8628, Japan 11
b Faculty of Engineering, Hokkaido University, N13W8, Sapporo 060-8628, Japan 12
13
14
* Corresponding author. Tel./fax: +81-11-706-7280 15
E-mail address: [email protected] 16
17
18
19

2
Abstract 20
We milled granular activated carbons (GACs) that had been used for 0–9 years in water 21
treatment plants and produced carbon particles with different sizes and ages: powdered 22
activated carbons (PAC, median diameter 12–42 µm), superfine PAC (SPAC, 0.9–3.5 µm), 23
and submicron-sized SPAC (SSPAC, 220–290 nm). The fact that SPAC produced from 1-24
year-old GAC and SSPAC from 2-year-old GAC removed 2-methylisoborneol (MIB) from 25
water with an efficiency similar to that of virgin PAC after a carbon contact time of 30 26
minutes suggests that spent GAC could be reused for water treatment after being milled. This 27
potential for reuse was created by increasing the equilibrium adsorption capacity via 28
reduction of the carbon particle size and improving the adsorption kinetics. During long-term 29
(>1 year) use in GAC beds, the volume of pores in the carbon, particularly pores with widths 30
of 0.6–0.9 nm, was greatly reduced. The equilibrium adsorption capacities of the carbon for 31
compounds with molecular sizes in this range could therefore decrease with increasing 32
carbon age. Among these compounds, the decreases of capacities were prominent for 33
hydrophobic compounds, including MIB. For hydrophobic compounds, however, the 34
equilibrium adsorption capacities could be increased with decreasing carbon particle size. 35
The iodine number, among other indices, was best correlated with the equilibrium adsorption 36
capacity of the MIB and would be a good index to assess the remaining MIB adsorption 37
capacity of spent carbon. Spent GAC can possibly be reused as SPAC or SSPAC if its iodine 38
number is ≥600 mg/g. 39
40
41

3
Keywords: 2-methylisoborneol, iodine number, SPAC, used carbon 42
43

4
1. Introduction 44
45
Adsorption by granular activated carbon (GAC) is widely used in drinking water treatment 46
to remove disinfection byproduct precursors (DBPPs), natural organic matter (NOM), and 47
organic micro-pollutants (OMPs); GAC adsorption also serves as a barrier, inter alia, to 48
occasional spikes of toxic substances in source waters (Corwin et al., 2012; Matsui et al., 49
2002b; Owen, 1998; Paune et al., 1998). Because of the limited adsorption capacity of GAC, 50
however, removal of these compounds requires that the GAC be replaced from time to time. 51
Otherwise, removal efficiencies deteriorate with time as the GAC filtration operation 52
progresses. Before the breakthrough of a target adsorbate, the GAC needs to be replaced if 53
the removal ability of the adsorbate is to be maintained. Normally, the spent GAC goes 54
through a regeneration process because it is more cost effective to regenerate spent GAC than 55
to purchase virgin GAC (Lambert et al., 2002; Sontheimer et al., 1988). Spent GAC is 56
sometimes replaced with virgin GAC, for example, when the cost of virgin GAC at the 57
market is similar to or somewhat higher than the cost of regeneration (Iwamoto et al., 2014). 58
In the regeneration process, adsorption sites on the GAC are refreshed by desorption, 59
decomposition, or degradation of the adsorbates loaded on the GAC. Although regeneration 60
restores the adsorption capacity of the GAC to an extent that depends on the regeneration 61
process employed, there are many disadvantages to regeneration. Those disadvantages 62
include 1) for thermal regeneration, high energy demand, loss of GAC itself, accumulation 63
of metals in the GAC, and the high pH of water initially treated by the regenerated GAC 64
(Lambert et al., 2002; San Miguel et al., 2001); 2) for chemical regeneration, the requirement 65

5
for additional treatment to deal with the regenerants, such as organic solvents, that remain in 66
the regenerated GAC, and the formation of by-products during regeneration (Alvarez et al., 67
2004; Lim et al., 2005; Martin et al., 1985); 3) for biological regeneration, the long reaction 68
time required for regeneration and the failure of adsorption sites loaded with non-69
biodegradable adsorbates to recover (Nakano et al., 2000; Scholz et al., 1998). There is hence 70
a need for an alternative option to use spent GAC without regeneration. 71
As mentioned above, the frequency of GAC replacement is determined by the 72
breakthrough behavior of target compounds. In water treatment plants, where multiple 73
adsorbates are targeted for removal, the frequency of GAC replacement is determined by the 74
earliest breakthrough of the multiple target adsorbates. Previous research has shown that 75
NOM and DBPPs break through GAC adsorbers earlier than OMPs when these compounds 76
coexist as mixtures in water (Kennedy et al., 2015; Summers et al., 2013). Thus, the 77
adsorption capacities may still remain for OMPs even when the GAC has been replaced as a 78
result of the breakthrough of NOMs and/or DBPPs. 79
The adsorption capacity that remains in spent GAC is likely to be low compared with the 80
capacity of virgin and regenerated GAC. However, the disadvantage of low capacity can be 81
compensated for if the adsorptive kinetics of the carbon is high. When spent GAC is milled 82
into small-size particles, the increase of the exterior specific surface area leads to high 83
adsorption kinetics that enhance the uptake rate of adsorbates. Extremely high adsorption 84
kinetics has been reported for superfine powdered activated carbon (SPAC) with a particle 85
diameter ≅1 µm; SPAC is produced by the micro-milling of virgin powdered activated carbon 86
(Bonvin et al., 2016; Matsui et al., 2004; Matsui et al., 2013a). 87

6
Particle size reduction, moreover, can be expected to enhance adsorption capacities as 88
well as adsorption kinetics (Bonvin et al., 2016; Hu et al., 2015; Knappe et al., 1999; Matsui 89
et al., 2010). Enhancement of adsorption capacity may be mandatory for reuse of spent GAC 90
because even very high kinetics cannot compensate for the disadvantage of inadequate 91
capacity. 92
The objective of this research was to investigate the production of PAC, SPAC, and 93
submicron-sized SPAC from spent GAC and the application of these as adsorbents to remove 94
OMPs, in particular, 2-methylisoborneol (MIB), which is a conventional target OMP due to 95
its association with an unpleasant earthy/musty taste and odor, which impair the palatability 96
of drinking water (Cook et al., 2001; Newcombe et al., 1997). Changes of equilibrium 97
adsorption capacities and adsorptive removal rates with carbon particle size and carbon age 98
are discussed in conjunction with the metrics of standard indicators of activated carbon 99
characteristics. 100
101
2. Materials and methods 102
103
2.1 Activated carbon 104
105
GACs were collected from GAC beds of drinking water treatment plants operated by the 106
Bureau of Waterworks of the Tokyo Metropolitan Government, the Public Enterprise Bureau 107
of Ibaraki Prefectural Government, and the Ishikari-Seibu Water Supply Authority (Table 1). 108
After being thoroughly mixed, each GAC was separated into several portions and kept under 109

7
a moist condition at 4 °C in a refrigerator. Some portions were sterilized by autoclaving or 110
gamma ray irradiation, which are described in detail in section S1 of the Supplementary 111
Information (SI). Unless specified, the sterilized samples discussed in this paper refer to the 112
samples autoclaved at 63 °C for 30 min. 113
The GACs were pulverized into fine particles of three particle-size categories according 114
to their median diameter (D50): powdered activated carbon (PAC, D50: 12–42 µm), 115
superfine PAC (SPAC, D50: 0.9–3.5 µm), and submicron-sized SPAC (SSPAC, D50: 0.22–116
0.29 µm). The GACs had D50s of 1.5–2.3 mm. The details of the pulverization process and 117
the particle size distributions of all carbon samples are described in the SI (section S2 and 118
Fig. S6). Tables S1–S3 of the SI list all activated carbon samples and related experimental 119
applications. These samples were given unique three-term designations as follows. The first 120
term indicates the name of the water treatment plant where the GAC was collected and the 121
number of years the GAC was used (note: zero “0” year indicates virgin carbon). The second 122
term indicates the method of pretreatment of the GAC. An “n” indicates “no pretreatment”, 123
“a” indicates “autoclave pretreatment”, and “g” indicates “gamma irradiation pretreatment”. 124
The final term indicates the particle size category of the carbon: GAC, PAC, SPAC, and 125
SSPAC. KM2-a-SPAC, for example, means SPAC produced by milling from autoclaved 126
GAC, which was sampled at the Kanamachi Water Treatment Plant after being used for 2 127
years. The carbons produced from the GACs given no pretreatment were used for adsorption 128
experiments with carbon-water contact times < one day. Those produced from the GACs 129
pretreated by autoclaving were used for adsorption experiments with carbon-water contact 130
times > one day to avoid any biodegradation effect. Autoclaving did not substantially 131

8
influence the equilibrium adsorption capacity (e.g. sections S1.2 and S1.3 of the SI). The 132
PAC, SPAC, and SSPAC samples were stored in ultrapure water in the form of slurries at 133
4 °C after vacuum conditioning for 20 min to remove any air from the activated carbon pores. 134
The pore size distributions of the activated carbons were obtained by using the nitrogen 135
gas adsorption-desorption method (Autosorb-iQ, Quantachrome Instruments, Kanagawa, 136
Japan). The isotherm data for nitrogen gas at 77.4 K was analyzed by (1) the Barrett-Joyner-137
Halenda (BJH) method for the mesopore region (pore width >2 nm) and (2) the quench solid 138
density functional theory (QSDFT) for the micropore region (pore width = 0.6–2 nm) 139
(ASiQwin, ver.3.01, Quantachrome Instruments). Iodine, phenol, methylene blue (MB), and 140
sodium liner-dodecylbenzene sulfonates (hereafter ABS) numbers were measured according 141
to the standard methods of the Japan Water Works Association (K 113:2005-2) (JWWA, 142
2005). The details of the measurement methods are described in section S3 of the SI. 143
144
2.2 Adsorbates 145
146
MIB was the main target compound in this study. Reagent MIB was dissolved in natural 147
water (the raw water entering the Kanamachi Water Purification Plant, the same plant where 148
the main target GACs were collected) or in organic-free ionic water that was made from 149
ultrapure water by adding ions at concentrations identical to their concentrations in the 150
natural water (details are provided in section S4 of the SI). The concentrations of MIB were 151
measured by using deuterium-labeled geosmin (geosmin-d3) as an internal standard in a 152
purge-and-trap concentrator (P&T) coupled to a gas chromatograph-mass spectrometer 153

9
(GC/MS); the m/z 95 peak was assumed to correspond to MIB and the m/z 115 peak to 154
geosmin-d3. Two P&T-GC/MS systems were used: (1) a Model 4660 Eclipse (Kinryo 155
Electric Co., LTD, Osaka, Japan) coupled with an Agilent 7890A/5975MSD (Agilent 156
Technologies, Inc., CA, USA); and (2) an Aqua PT 5000 J (GL Sciences, Inc., Tokyo, Japan) 157
coupled with a GCMS-QP2010 Plus (Shimadzu Co., Kyoto, Japan). 158
In addition to MIB, some compounds with environmental relevancy and compounds used 159
for adsorbability indices were tested as supplementary adsorbates: geosmin, iodine, phenol, 160
acetaminophen, MB, ABS, poly(styrenesulfonic acid) sodium salt with an average molecular 161
weight (MW) of 210 (PSS-210), and PSS-6400 with average MW 6400. These compounds 162
were selected to cover a variety of hydrophobicities and molecular sizes. Section S5 of the 163
SI provides details of the anaytical methods used to quantify these compounds. Except for 164
PSS-210 and PSS-6400, which were purchased from Sigma-Aldrich Co. LLC. (St. Louis, 165
Missouri, USA), all of these chemical reagents were purchased from Wako Pure Chemical 166
Industries, Ltd., (Osaka, Japan). 167
168
2.3 Batch adsorption tests 169
170
In all adsorption kinetics and equilibrium tests, specified amounts of carbon were added to 171
vials containing either 100 or 110 mL of a solution of the target compound, and the vials were 172
manually shaken and then agitated on a mechanical shaker for a pre-determined period of 173
time at a constant temperature of 20 °C in the dark. The carbon-solution contact time ranged 174
from 10 minutes to 24 hours for the MIB adsorption kinetics tests; it was set to 1–2 weeks 175

10
for the MIB adsorption equilibrium tests. After the pre-determined carbon-solution contact 176
time, the carbon-solution suspension were each filtered through a 0.2-µm membrane filter 177
(DISMIC-25HP; Toyo Roshi Kaisha, Ltd., Tokyo, Japan, SSPAC-solution suspension was 178
filtered twice) to separate carbon, and the concentrations of the adsorbate in the filtrates were 179
then measured. Solid-phase concentrations of adsorbates were calculated from mass balances. 180
Section S4 of the SI provides details of the experimental methods, including experiments 181
with other compounds. 182
183
3. Results and discussion 184
185
3.1 MIB adsorption kinetics 186
187
We tested KM0, KM1, KM2, and KM3 after having determined that four-year old carbons 188
including their PACs and SPACs had no adsorptive removal ability (section S1 of the SI). 189
Fig. 1 shows the time-course changes of normalized MIB concentrations in the adsorption 190
kinetic tests. Fig. 1a shows the results of KM0 (virgin GAC and the PAC and the SPAC 191
produced from it). There were clear increases of MIB removal rates with decreasing particle 192
size when the GAC was milled to PAC and SPAC. The MIB removal rate was higher for 193
SPAC than PAC, as reported elsewhere (Matsui et al., 2007; Matsui et al., 2013a; Pan et al., 194
2016). Improvements of MIB removal rates with decreasing carbon size were also observed 195
for 1-to-3-year-old spent carbons (Fig. 1b,c,d). 196

11
To further clarify the MIB removal efficiencies of spent carbons, we performed 197
adsorption experiments with varying dosages and a fixed carbon-water contact time of 30 198
min, a time that is often used in actual water purification treatments. Fig. 2 shows the results. 199
The SPAC and SSPAC produced from one-year-old carbons (KM1-n-SPAC) achieved the 200
same removal rate as virgin PAC (KM0-n-PAC), a removal rate that might be regarded as a 201
feasible goal from a practical standpoint. In the two-year-old carbon series, SPAC did not 202
achieve the same reduction rate as the virgin PAC, but SSPAC did. None of the three-year-203
old carbons, including its SSPAC, achieved the same removal rate as the virgin PAC (KM0-204
n-PAC). 205
206
3.2 MIB adsorption capacity 207
208
As described in section 3.1, the one-year-old and two-year-old carbons, when milled to 209
micron- and submicron-diameter particles, respectively, were similar to the virgin PAC in 210
terms of MIB removal ability. However, the uptake rate of MIB by carbon with ages ≥3 years 211
was less than that of virgin PAC, even if the particle sizes were decreased to enhance the 212
uptake rate of MIB. Because sufficient adsorbate uptake cannot be expected when the carbon 213
does not have a certain level of equilibrium adsorption capacity, we examined the equilibrium 214
adsorption capacities of the spent carbons. Fig. S7 in the SI shows the adsorption isotherms 215
of the 32 carbons. The equilibrium MIB adsorption capacities decreased with increasing 216
carbon age and increased as the particle size decreased. 217
To clarify these trends, the equilibrium adsorption capacities of carbon with different 218

12
ages were plotted against the carbon particle sizes. Equilibrium adsorption capacities were 219
quantified in terms of the Freundlich capacity parameter in the unit of (ng/mg)(L/100 ng)1/n, 220
which is equivalent to the solid-phase concentration in equilibrium with a liquid-phase 221
concentration of 100 ng/L after fitting the isotherm data to the Freundlich model. A reduction 222
of the MIB adsorption capacities with carbon age was clearly apparent (Fig. 3). The longer 223
the carbon aged, the lower the MIB adsorption capacity of the carbon. A similar phenomenon 224
has previously been observed for adsorption of a pesticide (atrazine) onto PAC, which was 225
used for a few months in an immersed microfiltration membrane system (Lebeau et al., 1999). 226
Equilibrium adsorption capacities in our study also increased with decreasing carbon particle 227
size. A similar phenomenon has been reported for virgin PAC and its SPAC (Matsui et al., 228
2010; Matsui et al., 2012) as well as for one-year-old used GAC and its PAC (Hu et al., 2015; 229
Knappe et al., 1999). 230
Among the spent carbons up to three years old, the oldest carbon (KM3-a series) showed 231
the most dramatic increase of adsorption capacity: the adsorption capacity increased 6.8-fold 232
when the carbon diameter decreased from 22 µm to 200 nm. Adsorption capacity increased 233
12-fold when the diameter of two-year-old carbon decreased from 1.9 mm to 250 nm. Finally, 234
the capacity of SSPAC produced from two-year-old GAC was similar to that of virgin GAC. 235
Adsorption capacities decreased with increasing age of carbons, but they increased as the 236
particle size decreased. As described in section 3.1, when spent GAC was milled to micron- 237
and submicron-size particles, its ability to remove MIB at a given contact time was enhanced, 238
and the adsorption capability of the carbon was similar to that of virgin PAC. This 239
enhancement can be explained by the faster adsorbate uptake rate due to the broadening of 240

13
the outer surface area (carbon-water contact area) and reduction of the intra-particle diffusion 241
path length. The results presented in this section clearly reveal that the enhancement of MIB 242
removal efficiency was due to both an increase of equilibrium adsorption capacity and an 243
increase of adsorbate uptake rate. 244
245
3.3 Pore size distributions 246
247
The pore size distribution of activated carbon particles is an important parameter related to 248
their equilibrium adsorption capacity. It has been reported previously that the change in 249
carbon particle size by micro-milling does not result in any substantial change in pore size 250
distribution (Ando et al., 2010; Matsui et al., 2015). The results of our study also confirmed 251
that the pore size distributions were similar for different-size particles (PAC, SPAC, and 252
SSPAC) with the same age, although experimental errors were apparent in the data for one-253
year-old carbon (Fig. S8 of the SI). We therefore considered the effect of carbon age on pore 254
size distribution after averaging data for carbons of the same age. 255
Between carbons of different ages, clear differences were apparent in the distribution of 256
small-size micropores (pores with widths 0.6–0.9 nm) (Fig. 4). In contrast, no large 257
difference was apparent in the distribution of pores with widths >0.9 nm, including 258
mesopores (Fig. 4 and Fig. S9 of the SI). The volume of the small-size micropores decreased 259
from 0 to 3 years, in particular during the first year, whereas the volume of the larger-size 260
pores did not decrease largely [the decreases were also seen for the BET (Brunauer-Emmett-261
Teller) surface areas as shown in Table S6 of the SI]. If loading of NOM on carbon is the 262

14
main cause of carbon fouling, this result is intriguing, because NOM is believed to adsorb 263
mainly onto mesopores rather than micropores (Li et al., 2002b; Li et al., 2003; Newcombe 264
et al., 2002a). A previous study of four-year-old used GAC (Kameya et al., 1997), however, 265
has revealed a similar phenomenon, namely that micropore volume decreases to a larger 266
extent than mesopore volume, and it decreases rapidly at the beginning of an operation of a 267
GAC bed. A change of the volume of micropores could be caused by accumulation of 268
synthetic organic micro-pollutants as well as low-MW NOM present in the raw waters 269
because the effluents from wastewater treatment plants are discharged into the upstream of 270
the river. 271
In our experiment, the rapid drop of micropore volume after one year was concomitant 272
with the decrease of MIB adsorption capacity: the adsorption capacity dropped relatively 273
rapidly during the first year and declined more slowly afterward (Fig. 3, note that the ordinate 274
is at log scale). The similarity between the trends of micropore volume and MIB adsorption 275
capacity is in accord with the common understanding that MIB is mainly adsorbed in 276
micropores (Greenwald et al., 2015; Newcombe et al., 1997; Quinlivan et al., 2005; Yu et al., 277
2007). 278
279
3.4 Iodine, phenol, MB, and ABS numbers 280
281
The amounts of iodine, phenol, MB, and ABS adsorbed under specified conditions are called 282
the iodine, phenol, MB, and ABS numbers, respectively. These numbers were used as metrics 283
of the adsorptive removal ability of activated carbons. Fig. 5 shows the changes of these 284

15
numbers for carbons of different ages against carbon particle size calculated from the data in 285
Fig. S10 of the SI. 286
For both the iodine number and phenol number (Figs. 5a and b, respectively), 287
dependencies on carbon age were clearly apparent: the older spent carbons adsorbed smaller 288
amounts of iodine and phenol. The dependencies on carbon age were small for the MB 289
number (Fig. 5c). For the ABS number (Fig. 5d), the dependence on carbon age was also 290
small at a carbon particle diameter of about 0.2 µm, but it was large at a carbon particle 291
diameter greater than a few microns. With respect to dependence on carbon particle size, 292
iodine numbers increased slightly with decreasing particle size. In the case of the phenol 293
number, no increase and even slight decreases were observed when the size of the carbon 294
particles was reduced. In the case of the MB and ABS numbers (Figs. 5c and d, respectively), 295
a dependency on carbon particle size was clearly apparent. Among the four index numbers 296
of the KM carbon series, the iodine number showed the highest correlation (R2 = 0.97) with 297
the MIB adsorption capacity (Fig. S11a of the SI). The MIB adsorption capacity increased 298
with increasing iodine number, even when the data came from carbons with the same age. 299
Such a trend was not apparent for phenol, for which the correlation was second highest 300
among the four indices (R2 = 0.83). The correlation for iodine was high (R2 = 0.88), even 301
when the data included carbons from different materials and carbons used in different 302
treatment plants that treated different waters (Fig. 6). However, deviations from the 303
regression line were somewhat large for some carbons that had been used in the other water 304
treatment plants (KS0.1 and IS4). The followings are considered as the reasons why iodine 305
showed the highest correlation: 1) its molecular size, which is not largely different from that 306

16
of MIB, 2) fast adsorption kinetics of iodine so that iodine number, which was obtained in 307
the contact time of 15 min, would nearly be iodine adsorption capacity at equilibrium (e.g. 308
on the other hand, phenol number was not equilibrium capacity), and 3) among the four 309
indices, iodine could be hydrophobic as is MIB (Figure 7). 310
Overall, the iodine number was a good index for roughly estimating the remaining MIB 311
adsorption capacity of the spent carbons. The MIB removal ability of SSPAC produced from 312
two-year-old GACs was similar to that of virgin PAC, as described in the section 3.1, and 313
the iodine numbers of the two-year-old carbons were about 600 mg/g (Fig. 6). Therefore, if 314
spent carbon still has an iodine number > 600 mg/g, it could be reused as SSPAC (or possibly 315
as SPAC), regardless of the raw material that was the source of the carbon and the history of 316
carbon use. 317
318
3.5 Influence of adsorbate properties on adsorption capacity 319
320
Among the four indices, the iodine number (Fig. 6) was most highly correlated with MIB 321
adsorption capacity (section 3.4). This correlation reflects the large degree of the adsorption 322
capacity dependence on carbon age and to a certain degree its dependence on carbon size 323
(Fig. 5a). To determine which properties of the adsorbates led to the adsorption capacity 324
dependencies on carbon particle size and carbon age, we measured the adsorption isotherms 325
of a variety of compounds on PAC, SPAC, and SSPAC that were produced from two-year-326
old used GAC (KM2-GAC) and virgin GAC (KM0-GAC). The adsorption capacity of each 327
carbon sample for each adsorbate was calculated from the corresponding adsorption isotherm 328

17
at equilibrium (Fig. S12 of the SI). The calculation was carried out using the same procedure 329
explained in section 3.2 for the MIB adsorption capacity. To avoid the effect of background 330
adsorptive substances (including NOMs) in natural water, especially for adsorption onto 331
virgin carbons, all the adsorption experiments were conducted in organic-free water, the ionic 332
composition of which was the same as that of the natural water. For MIB and geosmin, the 333
adsorption capacities were calculated at equilibrium with a liquid-phase concentration of 100 334
ng/L. For phenol, acetaminophen, PSS-210, iodine, MB, ABS, and PSS-6400, half of the 335
initial concentrations was used as an equilibrium liquid-phase concentration to calculate the 336
adsorption capacity (data for lower concentrations were not obtainable because of analytical 337
errors). The degree of the capacity dependence on carbon age was then quantified from the 338
ratio of the adsorption capacities of virgin SPAC and spent SPAC. This ratio is hereafter 339
called the age-dependency index. The degree of the capacity dependence on carbon particle 340
size was quantified in terms of the slopes of log-log plots of capacities vs. carbon particle 341
diameters (Matsui et al., 2012). This slope is hereafter called the size-dependency index. 342
Among the several properties of the adsorbates that could possibly have influenced the 343
adsorption capacities of the spent carbon, we first focused on molecular size, because changes 344
were observed in the volume of the small-size micropores as the carbon aged (section 3.3). 345
As a metric of molecular size, we used the minimal projection diameter (MPD) because it is 346
the property that decides which carbon pores are available for the adsorbate molecule 347
(Kasaoka et al., 1989; Li et al., 2002a; Pelekani et al., 2000; Sontheimer et al., 1988). MPDs 348
were calculated from the three-dimensional structures of molecules predicted by using 349
Marvin Sketch (v.16.5.16.0, ChemAxon Ltd, Hungary). 350
18
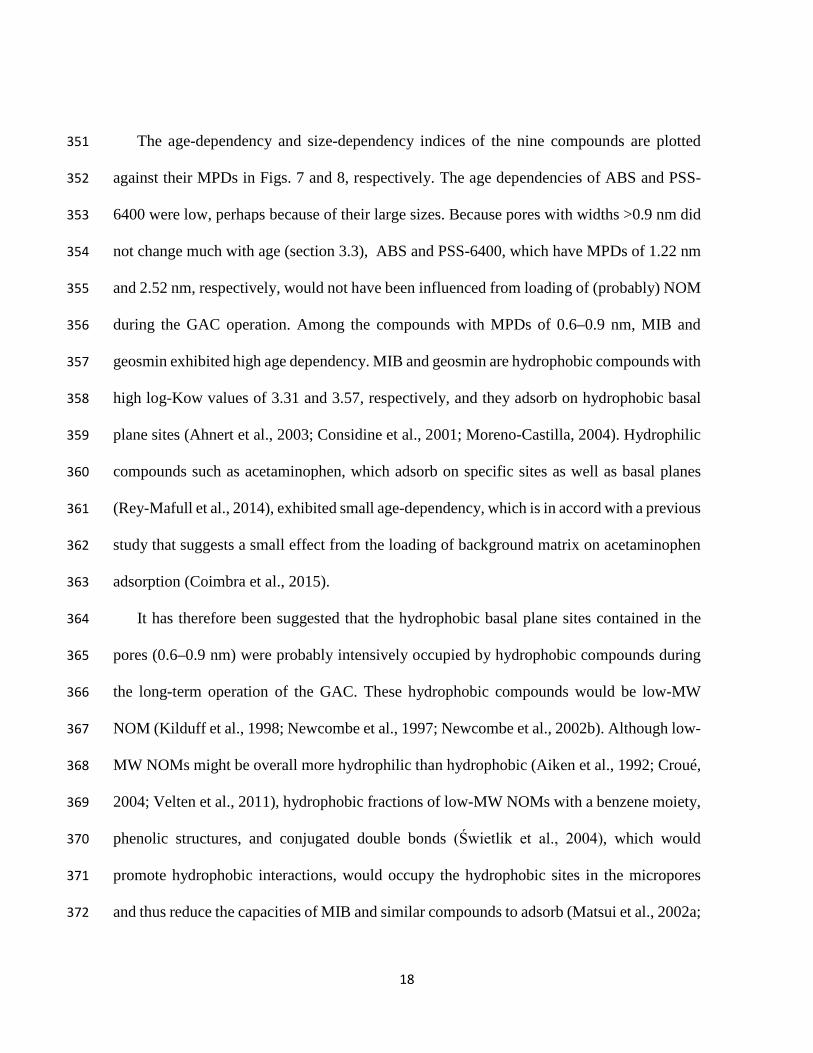
The age-dependency and size-dependency indices of the nine compounds are plotted 351
against their MPDs in Figs. 7 and 8, respectively. The age dependencies of ABS and PSS-352
6400 were low, perhaps because of their large sizes. Because pores with widths >0.9 nm did 353
not change much with age (section 3.3), ABS and PSS-6400, which have MPDs of 1.22 nm 354
and 2.52 nm, respectively, would not have been influenced from loading of (probably) NOM 355
during the GAC operation. Among the compounds with MPDs of 0.6–0.9 nm, MIB and 356
geosmin exhibited high age dependency. MIB and geosmin are hydrophobic compounds with 357
high log-Kow values of 3.31 and 3.57, respectively, and they adsorb on hydrophobic basal 358
plane sites (Ahnert et al., 2003; Considine et al., 2001; Moreno-Castilla, 2004). Hydrophilic 359
compounds such as acetaminophen, which adsorb on specific sites as well as basal planes 360
(Rey-Mafull et al., 2014), exhibited small age-dependency, which is in accord with a previous 361
study that suggests a small effect from the loading of background matrix on acetaminophen 362
adsorption (Coimbra et al., 2015). 363
It has therefore been suggested that the hydrophobic basal plane sites contained in the 364
pores (0.6–0.9 nm) were probably intensively occupied by hydrophobic compounds during 365
the long-term operation of the GAC. These hydrophobic compounds would be low-MW 366
NOM (Kilduff et al., 1998; Newcombe et al., 1997; Newcombe et al., 2002b). Although low-367
MW NOMs might be overall more hydrophilic than hydrophobic (Aiken et al., 1992; Croué, 368
2004; Velten et al., 2011), hydrophobic fractions of low-MW NOMs with a benzene moiety, 369
phenolic structures, and conjugated double bonds (Świetlik et al., 2004), which would 370
promote hydrophobic interactions, would occupy the hydrophobic sites in the micropores 371
and thus reduce the capacities of MIB and similar compounds to adsorb (Matsui et al., 2002a; 372

19
Schmit et al., 2002; Zietzschmann et al., 2016). Hydrophobic synthetic organic micro-373
pollutants, which would be present in waters treated by the GACs, would also occupy 374
hydrophobic adsorption sites in the micropores and thereby reduce the adsorption capacities 375
of MIB and similar compounds. Overall, this research suggests that age dependency results 376
from micropores and adsorbates with molecular diameters of 0.6–0.9 nm and high 377
hydrophobicity. 378
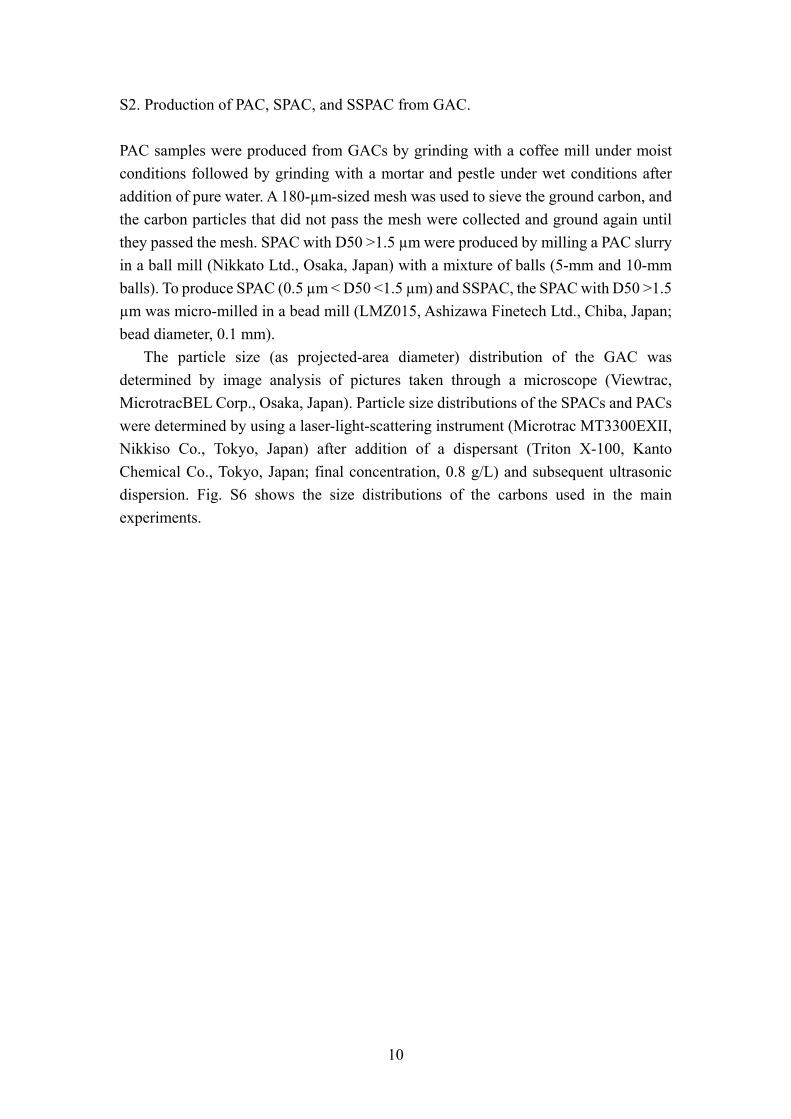
Of relevance to the carbon-size-dependency is the fact that early researchers discovered 379
that some hydrophobic organic micro-pollutants and high-MW compounds were adsorbed 380
mainly on the exterior of carbon particles due to their limited penetration distances (Matsui 381
et al., 2013a; Matsui et al., 2014). The capacity of MIB, geosmin, and humic substances to 382
adsorb onto GAC and PAC would thus increase when the GAC/PAC particle was milled to 383
a smaller size (Amaral et al., 2016; Ando et al., 2010; Bonvin et al., 2016; Knappe et al., 384
1999; Matsui et al., 2015; Matsui et al., 2013b). The high dependencies on carbon particle 385
size of the capacities of MIB, geosmin, PSS-6400, and ABS to adsorb onto spent carbons 386
(Fig. 8) are in line with this previous finding, which was reported for virgin carbons. 387
Similarly, for large molecular-size compounds and hydrophobic compounds with even small 388
molecular sizes, the equilibrium adsorption capacities on spent as well as virgin carbons 389
would increase when carbon particle size was decreased by milling. 390
391
4. Conclusions 392
393

20
(1) Equilibrium MIB adsorption capacities of GACs used in water treatment plants for 1–3 394
years increased when the GACs were milled to PAC, SPAC, and SSPAC, which are 395
characterized by progressively smaller particle sizes. 396
(2) By milling the GACs used in water purification plants for 1–2 years, it is possible to reuse 397
them as SPAC or SSPAC adsorbents to remove MIB. This reusability reflects the 398
increased adsorption capacity and higher adsorptive kinetics of smaller particles. 399
(3) The MIB adsorption capacity of spent carbons was well correlated with iodine numbers. 400
Therefore, iodine number could be a metric of remaining MIB adsorption capacity. 401
(4) During the three years of GAC use, the volume of the micropores with widths of 0.6–0.9 402
nm was greatly reduced compared with that of pores with larger widths. 403
(5) The adsorption capacity of spent carbon for hydrophobic compounds with MPDs of 0.6–404
0.9 nm, including MIB, depended on carbon age; the capacity decreased greatly with 405
carbon age. 406
(6) The adsorption capacity of spent carbon for compounds with large MPDs and/or high 407
hydrophobicities depended on the carbon particle size; the capacity increased with 408
decreasing particle size. 409
410
411
Acknowledgments 412
413
We thank the Bureau of Waterworks of the Tokyo Metropolitan Government, the Public 414
Enterprise Bureau of Ibaraki Prefectural Government, and the Ishikari-Seibu Water Supply 415

21
Authority for providing GAC samples. Thanks are also due to Mr. Koudai Sekiguchi and Ms. 416
Aki Yamamoto for their experimental helps. This study was supported by a Grant-in-Aid for 417
Scientific Research S (24226012 and 16H06362) from the Japan Society for the Promotion 418
of Science and was partly supported by a Health and Labour Sciences Research Grant 419
(Research on Health Security Control) from the Ministry of Health, Labour, and Welfare, 420
Japan. We acknowledge the financial support in the form of a scholarship (201306460006) 421
from the China Scholarship Council (CSC) to Long Pan for his doctoral research. 422
423
424
References 425
426
Ahnert, F., Arafat, H.A. and Pinto, N.G., 2003. A Study of the Influence of Hydrophobicity 427 of Activated Carbon on the Adsorption Equilibrium of Aromatics in Non-Aqueous Media. 428 Adsorption 9(4), 311-319. 429
Aiken, G.R., McKnight, D.M., Thorn, K.A. and Thurman, E.M., 1992. Isolation of 430 hydrophilic organic acids from water using nonionic macroporous resins. Organic 431 Geochemistry 18(4), 567-573. 432
Alvarez, P.M., Beltran, F.J., Gomez-Serrano, V., Jaramillo, J. and Rodriguez, E.M., 2004. 433 Comparison between thermal and ozone regenerations of spent activated carbon exhausted 434 with phenol. Water Res 38(8), 2155-2165. 435
Amaral, P., Partlan, E., Li, M., Lapolli, F., Mefford, O.T., Karanfil, T. and Ladner, D.A., 436 2016. Superfine powdered activated carbon (S-PAC) coatings on microfiltration 437 membranes: Effects of milling time on contaminant removal and flux. Water Research 100, 438 429-438. 439
Ando, N., Matsui, Y., Kurotobi, R., Nakano, Y., Matsushita, T. and Ohno, K., 2010. 440 Comparison of natural organic matter adsorption capacities of super-powdered activated 441 carbon and powdered activated Carbon. Water Research 44(14), 4127-4136. 442

22
Bonvin, F., Jost, L., Randin, L., Bonvin, E. and Kohn, T., 2016. Super-fine powdered 443 activated carbon (SPAC) for efficient removal of micropollutants from wastewater 444 treatment plant effluent. Water Research 90, 90-99. 445
Coimbra, R.N., Calisto, V., Ferreira, C.I.A., Esteves, V.I. and Otero, M., 2015. Removal of 446 pharmaceuticals from municipal wastewater by adsorption onto pyrolyzed pulp mill sludge. 447 Arabian Journal of Chemistry, In Press. 448
Considine, R., Denoyel, R., Pendleton, P., Schumann, R. and Wong, S.-H., 2001. The 449 influence of surface chemistry on activated carbon adsorption of 2-methylisoborneol from 450 aqueous solution. Colloids and Surfaces A: Physicochemical and Engineering Aspects 451 179(2–3), 271-280. 452
Cook, D., Newcombe, G. and Sztajnbok, P., 2001. The application of powdered activated 453 carbon for mib and geosmin removal: predicting pac doses in four raw waters. Water 454 Research 35(5), 1325-1333. 455
Corwin, C.J. and Summers, R.S., 2012. Controlling trace organic contaminants with GAC 456 adsorption. American Water Works Association. Journal 104(1), 43. 457
Croué, J.-P., 2004. Isolation of Humic and Non-Humic NOM Fractions: Structural 458 Characterization. Environmental Monitoring and Assessment 92(1), 193-207. 459
Greenwald, M.J., Redding, A.M. and Cannon, F.S., 2015. A rapid kinetic dye test to predict 460 the adsorption of 2-methylisoborneol onto granular activated carbons and to identify the 461 influence of pore volume distributions. Water Research 68, 784-792. 462
Hu, J., Shang, R., Heijman, B. and Rietveld, L., 2015. Reuse of spent granular activated 463 carbon for organic micro-pollutant removal from treated wastewater. Journal of 464 Environmental Management 160, 98-104. 465
Iwamoto, T., Tasaki, T. and Kanami, T., 2014. Renewal and Selection of Granular 466 Activated Carbon in Advanced Drinking Water Purification in Tokyo, Nagoya, Japan. 467
JWWA, 2005. Powdered activated carbon for water treatment (K 113:2005-2), Japan Water 468 Works Association, Tokyo, Japan. 469
Kameya, T., Hada, T. and Urano, K., 1997. Changes of adsorption capacity and pore 470 distribution of biological activated carbon on advanced water treatment. Water Science and 471 Technology 35(7), 155-162. 472
Kasaoka, S., Sakata, Y., Tanaka, E. and Naitoh, R., 1989. Design of molecular-sieve 473 carbon. Studies on the adsorption of various dyes in the liquid phase. International Journal 474 of Chemical Engineering 29(4), 734-742. 475

23
Kennedy, A.M., Reinert, A.M., Knappe, D.R.U., Ferrer, I. and Summers, R.S., 2015. Full- 476 and pilot-scale GAC adsorption of organic micropollutants. Water Research 68, 238-248. 477
Kilduff, J.E. and Karanfil, 1998. TCE adsorption by GAC preloaded with humic 478 substances. Journal - American Water Works Association 90(5), 76. 479
Knappe, D.R., Snoeyink, V.L., Roche, P., Prados, M.J. and Bourbigot, M.-M., 1999. 480 Atrazine removal by preloaded GAC. American Water Works Association. Journal 91(10), 481 97. 482
Lambert, S.D., San Miguel, G. and Graham, N.J.D., 2002. Deleterious effects of inorganic 483 compounds DURING THERMAL REGENERATION of GAC: A Review. Journal 484 (American Water Works Association) 94(12), 109-119. 485
Lebeau, T., Lelièvre, C., Wolbert, D., Laplanche, A., Prados, M. and Côté, P., 1999. Effect 486 of natural organic matter loading on the atrazine adsorption capacity of an aging powdered 487 activated carbon slurry. Water Research 33(7), 1695-1705. 488
Li, L., Quinlivan, P.A. and Knappe, D.R.U., 2002a. Effects of activated carbon surface 489 chemistry and pore structure on the adsorption of organic contaminants from aqueous 490 solution. Carbon 40(12), 2085-2100. 491
Li, Q., Snoeyink, V.L., Campos, C. and Mariñas, B.J., 2002b. Displacement Effect of NOM 492 on Atrazine Adsorption by PACs with Different Pore Size Distributions. Environmental 493 Science & Technology 36(7), 1510-1515. 494
Li, Q., Snoeyink, V.L., Mariñas, B.J. and Campos, C., 2003. Pore blockage effect of NOM 495 on atrazine adsorption kinetics of PAC: the roles of PAC pore size distribution and NOM 496 molecular weight. Water Research 37(20), 4863-4872. 497
Lim, J.-L. and Okada, M., 2005. Regeneration of granular activated carbon using 498 ultrasound. Ultrasonics Sonochemistry 12(4), 277-282. 499
Martin, R.J. and Ng, W.J., 1985. Chemical regeneration of exhausted activated carbon—II. 500 Water Research 19(12), 1527-1535. 501
Matsui, Y., Aizawa, T., Kanda, F., Nigorikawa, N., Mima, S. and Kawase, Y., 2007. 502 Adsorptive removal of geosmin by ceramic membrane filtration with super-powdered 503 activated carbon. Journal of Water Supply: Research & Technology-AQUA 56. 504
Matsui, Y., Knappe, D.R.U., Iwaki, K. and Ohira, H., 2002a. Pesticide Adsorption by 505 Granular Activated Carbon Adsorbers. 2. Effects of Pesticide and Natural Organic Matter 506 Characteristics on Pesticide Breakthrough Curves. Environmental Science & Technology 507 36(15), 3432-3438. 508

24
Matsui, Y., Knappe, D.R.U. and Takagi, R., 2002b. Pesticide Adsorption by Granular 509 Activated Carbon Adsorbers. 1. Effect of Natural Organic Matter Preloading on Removal 510 Rates and Model Simplification. Environmental Science & Technology 36(15), 3426-3431. 511
Matsui, Y., Murase, R., Sanogawa, T., Aoki, N., Mima, S., Inoue, T. and Matsushita, T., 512 2004. Micro-ground powdered activated carbon for effective removal of natural organic 513 matter during water treatment. Water Science & Technology: Water Supply 4(4). 514
Matsui, Y., Nakano, Y., Hiroshi, H., Ando, N., Matsushita, T. and Ohno, K., 2010. 515 Geosmin and 2-methylisoborneol adsorption on super-powdered activated carbon in the 516 presence of natural organic matter. Water Science & Technology 62(11). 517
Matsui, Y., Nakao, S., Sakamoto, A., Taniguchi, T., Pan, L., Matsushita, T. and Shirasaki, 518 N., 2015. Adsorption capacities of activated carbons for geosmin and 2-methylisoborneol 519 vary with activated carbon particle size: Effects of adsorbent and adsorbate characteristics. 520 Water Research 85, 95-102. 521
Matsui, Y., Nakao, S., Taniguchi, T. and Matsushita, T., 2013a. Geosmin and 2-522 methylisoborneol removal using superfine powdered activated carbon: Shell adsorption and 523 branched-pore kinetic model analysis and optimal particle size. Water research 47(8), 2873-524 2880. 525
Matsui, Y., Nakao, S., Yoshida, T., Taniguchi, T. and Matsushita, T., 2013b. Natural 526 organic matter that penetrates or does not penetrate activated carbon and competes or does 527 not compete with geosmin. Separation And Purification Technology 113, 75-82. 528
Matsui, Y., Sakamoto, A., Nakao, S., Taniguchi, T., Matsushita, T., Shirasaki, N., 529 Sakamoto, N. and Yurimoto, H., 2014. Isotope Microscopy Visualization of the Adsorption 530 Profile of 2-Methylisoborneol and Geosmin in Powdered Activated Carbon. Environmental 531 Science & Technology 48(18), 10897-10903. 532
Matsui, Y., Yoshida, T., Nakao, S., Knappe, D.R.U. and Matsushita, T., 2012. 533 Characteristics of competitive adsorption between 2-methylisoborneol and natural organic 534 matter on superfine and conventionally sized powdered activated carbons. Water Research 535 46(15), 4741-4749. 536
Moreno-Castilla, C., 2004. Adsorption of organic molecules from aqueous solutions on 537 carbon materials. Carbon 42(1), 83-94. 538
Nakano, Y., Hua, L.Q., Nishijima, W., Shoto, E. and Okada, M., 2000. Biodegradation of 539 trichloroethylene (TCE) adsorbed on granular activated carbon (GAC). Water Research 540 34(17), 4139-4142. 541

25
Newcombe, G., Drikas, M. and Hayes, R., 1997. Influence of characterised natural organic 542 material on activated carbon adsorption: II. Effect on pore volume distribution and 543 adsorption of 2-methylisoborneol. Water Research 31(5), 1065-1073. 544
Newcombe, G., Morrison, J. and Hepplewhite, C., 2002a. Simultaneous adsorption of MIB 545 and NOM onto activated carbon. I. Characterisation of the system and NOM adsorption. 546 Carbon 40(12), 2135-2146. 547
Newcombe, G., Morrison, J., Hepplewhite, C. and Knappe, D.R.U., 2002b. Simultaneous 548 adsorption of MIB and NOM onto activated carbon: II. Competitive effects. Carbon 40(12), 549 2147-2156. 550
Owen, D.M., 1998. Removal of DBP precursors by GAC adsorption, American Water 551 Works Association. 552
Pan, L., Matsui, Y., Matsushita, T. and Shirasaki, N., 2016. Superiority of wet-milled over 553 dry-milled superfine powdered activated carbon for adsorptive 2-methylisoborneol 554 removal. Water Research 102, 516-523. 555
Paune, F., Caixach, J., Espadaler, I., Om, J. and Rivera, J., 1998. Assessment on the 556 removal of organic chemicals from raw and drinking water at a Llobregat river water works 557 plant using GAC. Water Research 32(11), 3313-3324. 558
Pelekani, C. and Snoeyink, V.L., 2000. Competitive adsorption between atrazine and 559 methylene blue on activated carbon: the importance of pore size distribution. Carbon 560 38(10), 1423-1436. 561
Quinlivan, P.A., Li, L. and Knappe, D.R.U., 2005. Effects of activated carbon 562 characteristics on the simultaneous adsorption of aqueous organic micropollutants and 563 natural organic matter. Water Research 39(8), 1663-1673. 564
Rey-Mafull, C.A., Tacoronte, J.E., Garcia, R., Tobella, J., Llópiz, J.C., Iglesias, A. and 565 Hotza, D., 2014. Comparative study of the adsorption of acetaminophen on activated 566 carbons in simulated gastric fluid. SpringerPlus 3(1), 1. 567
San Miguel, G., Lambert, S.D. and Graham, N.J.D., 2001. The regeneration of field-spent 568 granular-activated carbons. Water Research 35(11), 2740-2748. 569
Schmit, K.H. and Wells, M.J.M., 2002. Preferential adsorption of fluorescing fulvic and 570 humic acid components on activated carbon using flow field-flow fractionation analysis. 571 Journal of Environmental Monitoring 4(1), 75-84. 572
Scholz, M. and Martin, R.J., 1998. Control of bio‐regenerated granular activated carbon by 573 spreadsheet modelling. Journal of Chemical Technology and Biotechnology 71(3), 253-574 261. 575

26
Sontheimer, H., Crittenden, J.C., Summers, R.S., Hubele, C., Roberts, C. and Snoeyink, 576 V.L., 1988. Activated carbon for water treatment, Universitaet Karlsruhe, Karlsruhe. 577
Summers, R.S., Kim, S.M., Shimabuku, K., Chae, S.-H. and Corwin, C.J., 2013. Granular 578 activated carbon adsorption of MIB in the presence of dissolved organic matter. Water 579 Research 47(10), 3507-3513. 580
Świetlik, J., Dąbrowska, A., Raczyk-Stanisławiak, U. and Nawrocki, J., 2004. Reactivity of 581 natural organic matter fractions with chlorine dioxide and ozone. Water Research 38(3), 582 547-558. 583
Velten, S., Knappe, D.R.U., Traber, J., Kaiser, H.-P., von Gunten, U., Boller, M. and 584 Meylan, S., 2011. Characterization of natural organic matter adsorption in granular 585 activated carbon adsorbers. Water Research 45(13), 3951-3959. 586
Yu, J., Yang, M., Lin, T.-F., Guo, Z., Zhang, Y., Gu, J. and Zhang, S., 2007. Effects of 587 surface characteristics of activated carbon on the adsorption of 2-methylisobornel (MIB) 588 and geosmin from natural water. Separation and Purification Technology 56(3), 363-370. 589
Zietzschmann, F., Stützer, C. and Jekel, M., 2016. Granular activated carbon adsorption of 590 organic micro-pollutants in drinking water and treated wastewater – Aligning breakthrough 591 curves and capacities. Water Research 92, 180-187. 592
593
594

1
Table 1 – Information about the used GACs that were collected.
Designation Water purification plant Years used Raw
material Producer Production area
KM0-GAC Kanamachi (Bureau of
Waterworks Tokyo
Metropolitan Government)
0 (virgin)
Bituminouscoal
Norit Japan Co.,Ltd. USA KM1-GAC 1 (2012–2013) KM2-GAC 2 (2012–2014) KM3-GAC 3 (2012–2015) KM4-GAC 4 (2007–2011) Shanxi Xinhua Chemical
Co., Ltd China KM6-GAC 6 (2006–2012) KM9-GAC 9 (2003–2012) Coal Calgon Carbon Japan KK. Japan AS1-GAC Asaka
(Bureau of Waterworks
Tokyo Metropolitan Government)
1 (2014–2015) Bituminouscoal Unknown Unknown AS2-GAC 2 (2013–2015)
AS7-GAC 7 (2006–2013) Unknown
Joint venture of Kuraray Chemical Co. ., Ltd and Osaka Gas Chemicals
Co., Ltd
Colombia
KS0-GAC Kasumigaura (Ibaraki
Prefectural Government)
0 (regenerated) Coconut
shell Serachem Co., Ltd Japan KS0.1-GAC 0.1 (2016.06–2016.07)
KS0.3-GAC 0.3 (2016.04–2016.07)
IS4-GAC
Ishikari (Ishikari-Seibu Water Supply Association)
4 (2012-2016) Bituminouscoal Dainen Co., Ltd Japan

2
(a) (b)
(c) (d)
Fig 1 – MIB removal rates against carbon-solution contact time (PAC/SPAC/SSPAC
dosage was 40 mg/L in natural water; GAC dosage was 210 ± 10 mg/L in
natural water).
0.0
0.2
0.4
0.6
0.8
1.0
1 10 100 1000
C/C
0of
MIB
(di
men
sion
less
)
Contact time (min)
KM0-n
KM0-n-GACKM0-n-PACKM0-n-SPAC
0.0
0.2
0.4
0.6
0.8
1.0
1 10 100 1000C
/C0
of M
IB (
dim
ensi
onle
ss)
Contact time (min)
KM1-n
KM1-n-GACKM1-n-PACKM1-n-SPACKM1-n-SSPAC
0.0
0.2
0.4
0.6
0.8
1.0
1 10 100 1000
C/C
0of
MIB
(di
men
sion
less
)
Contact time (min)
KM2-n
KM2-n-GACKM2-n-PACKM2-n-SPACKM2-n-SSPAC
0.0
0.2
0.4
0.6
0.8
1.0
1 10 100 1000
C/C
0of
MIB
(di
men
sion
less
)
Contact time (min)
KM3-n
KM3-n-PACKM3-n-SPACKM3-n-SSPAC

3
(a) (b)
(c) (d)
Fig. 2 – MIB removal rates against carbon dosages at a carbon-water contact time of
30 min (natural water).
0.0
0.2
0.4
0.6
0.8
1.0
0 20 40 60 80 100C/C
0of
MIB
(di
men
sion
less
)
Carbon dosage (mg/L)
KM0-n
KM0-n-GACKM0-n-PACKM0-n-SPACKM0-n-SSPAC
0.0
0.2
0.4
0.6
0.8
1.0
0 20 40 60 80 100C
/C0
of M
IB (
dim
ensi
onle
ss)
Carbon dosage (mg/L)
KM1-n
KM1-n-GACKM1-n-PACKM1-n-SPACKM1-n-SSPAC
0.0
0.2
0.4
0.6
0.8
1.0
0 20 40 60 80 100
C/C
0of
MIB
(di
men
sion
less
)
Carbon dosage (mg/L)
KM2-n
KM2-n-GACKM2-n-PACKM2-n-SPACKM2-n-SSPAC
0.0
0.2
0.4
0.6
0.8
1.0
0 20 40 60 80 100C/C
0of
MIB
(di
men
sion
less
)
Carbon dosage (mg/L)
KM3-n
KM3-n-PACKM3-n-SPACKM3-n-SSPAC

4
Fig. 3 – MIB adsorption equilibrium capacity versus carbon particle size. The metric
of the capacity was the solid-phase concentration in equilibrium with a liquid-
phase concentration of 100 ng/L in natural water.
1
10
100
1000
0.1 1 10 100 1000 10000
KF
[(ng
/mg)
(L/
100
ng)1
/n]
D50 (µm)
KM0-a
KM1-a
KM2-a
KM3-a

5
Fig. 4 – Micropore size distributions of KM series carbon.
0.0
0.2
0.4
0.6
0.8
1.0
0.0 0.5 1.0 1.5 2.0
Po
re v
olu
me
[cm
3 /(n
m g
)]
Pore width (nm)
KM0-aKM1-aKM2-aKM3-a

6
(a) (b)
(c) (d)
Fig. 5 – Adsorption indices versus carbon particle size.
100
1000
10000
0.1 1 10 100
KF
[(m
g/g)
(L/
2.5
g)1
/n]
D50 (µm)
Iodine number(15-min contact time)
KM0-n KM1-n
KM2-n KM3-n
1
10
100
0.1 1 10 100K
F[(
mg/
g) (
L/0.
5 m
g)1/
n]
D50 (µm)
Phenol number(60-min contact time)
KM0-n KM1-n
KM2-n KM3-n
10
100
1000
0.1 1 10 100
KF
[(m
g/g)
(L/
0.24
mg)
1/n
]
D50 (µm)
Methylene blue number(30-min contact time)
KM0-n KM1-n
KM2-n
10
100
1000
0.1 1 10 100
KF
[(m
g/g)
(L/
2.5
mg)
1/n ]
D50 (µm)
ABS number(90-min contact time)
KM0-n KM1-n
KM2-n

7
Fig. 6 – Correlation between MIB adsorption capacity and iodine number of carbons.
The squares are PACs, the triangles are SPACs, and the circles are SSPACs.
R² = 0.88
100
1000
10000
1 10 100 1000
Iod
ine
nu
mb
er
(mg/
g)
KF of MIB [(ng/mg) (L/100 ng)1/n]
Iodine numbervs.
MIB adsorption capacity
KM0 KM1 KM2KM3 AS1 AS2KS0 KS0.1 KS0.3IS4

8
Fig. 7 – Carbon age-dependency index of adsorbates, quantified in terms of the ratio of
the adsorption capacity between virgin and used SPAC (D50: 3 µm), against
the minimal projection diameter of the adsorbates. Each number in the figure
is the log-Kow value of the indicated adsorbate summarized by EPI Suite™
(U.S. Environmental Protection Agency v4.0). The log-Kow of iodine, PSS-210,
and PSS-6400 were not obtainable. Closed symbols correspond to data with low
initial concentrations (<10 g/L). Open symbols correspond to data with high
initial concentrations (>0.5 mg/L).
3.31
3.57
1.960.46
0.46
0.75
1.46
0.1
1
10
100
0.1 1
Car
bon
age-
depe
nden
cy in
dex
(KF
-vig
in S
PA
C/ K
F-u
sed
SP
AC)
(dim
ensi
onle
ss)
Minimal projection diameter (nm)
MIB
geosmin
ABS
acetaminophen
iodine
methylene blue
phenol
PSS-210
PSS-6400
0.2 0.5 2 5

9
Fig. 8 – Carbon size-dependency index of adsorbates, quantified by the absolute value
of the slopes of plots of adsorption capacities of used carbons vs. carbon size,
against the minimal projection diameter of the adsorbates. Each number in the
figure is the Log-Kow value of each adsorbate summarized by EPI Suite™ (U.S.
Environmental Protection Agency v4.0).
3.31
3.57
1.96
0.46
1.46 0.75
0.0001
0.001
0.01
0.1
1
0.1 1
Car
bon
size
-dep
ende
ncy
inde
x(s
lope
of
the
plot
of
KF
-use
d c
arb
onvs
. car
bon-
size
) (d
imen
sion
less
)
Minimal projection diameter (nm)
MIB
geosmin
ABS
acetaminophen
iodine
phenol
methylene blue
PSS-210
PSS-6400
0.2 0.5 2 5

1
Supplementary Information
Micro-milling of Spent Granular Activated Carbon for its Possible
Reuse as an Adsorbent: Remaining Capacity and Characteristics Long Pan a, Yuichi Takagi a, Yoshihiko Matsui b*, Taku Matsushita b, Nobutaka Shirasaki b a Graduate School of Engineering, Hokkaido University, N13W8, Sapporo 060-8628, Japan b Faculty of Engineering, Hokkaido University, N13W8, Sapporo 060-8628, Japan * Corresponding author. Tel./fax: +81-11-706-7280 E-mail address: [email protected]

2
S1. Preliminary Tests with Used Activated Carbons S1.1 Samples used in preliminary tests Preliminary experiments were conducted to briefly observe the removal of MIB by PAC and SPAC produced from GACs that had been used for 4 years at water purification plants in Tokyo. The selection of 4 years was based on the fact that GACs were replaced every 4–9 years at the water purification plants. SPACs and PACs were produced from GACs by a combination of pulverization with a food processor and a wet-milling bead mill. Table S1 provides relevant information about the carbons.

3
Table S1 – Carbons used in preliminary tests.
Designation Parent GAC Pretreatment of MIB adsorption equilibrium tests D50 (m)
KM4-n-GAC KM4-GAC None
2170 KM4-n-PAC 16.1
KM4-n-SPAC 0.651 KM6-n-GAC
KM6-GAC
None 2100
KM6-n-PAC 22.2 KM6-a-PAC (121 C) Autoclave at 121 C for 15 min
KM6-a-PAC (63 C) Autoclave at 63 C for 30 min
KM6-n-SPAC None 0.725 KM9-n-GAC
KM9-GAC None 1700
KM9-n-PAC 11.5 KM9-n-SPAC 0.558 AS7-n-GAC
AS7-GAC None 1290
AS7-n-PAC 10.5 AS7-n-SPAC 0.733
KM2-n-PAC-3 KM2-GAC
None 17.4 KM2-a-PAC Autoclave at 63 C for 30 min 42.3 KM2-g-PAC Gamma ray irradiation under 10.5 ± 0.2 kGy dosage 17.8

4
S1.2 Effect of biological degradation in isotherm experiments In the batch adsorption equilibrium tests using the spent GACs and the PAC/SPACs produced from the spent GACs, a two-week contact time was used to allow adsorption to reach equilibrium. This contact time was longer than the time (one week or less) used to obtain MIB adsorption isotherms of PAC/SPAC in previous studies (Graham et al., 2000; Matsui et al., 2015; Newcombe et al., 2002). The reason for choosing a longer contact time was that MIB adsorption by GAC was considered to require a longer contact time to reach adsorption equilibrium than PAC/SPAC due to the larger particle size of GAC and consequently the slow uptake rate. The results were that MIB was not removed by spent GACs and their SPACs, even under the high carbon dosage of 200 mg/L (KM4-n-GAC, KM4-n-SPAC, etc., Fig. S1). However, some of the used carbons with an intermediate size (KM-6-n-PAC, etc.) showed marked MIB removals. These results were obtained for old carbons with ages 6 years; more than 90% of the MIB could be removed with a carbon dose of 200 mg/L. Such a high removal was not attained with the 4-year-old carbons.

5
Fig. S1 – MIB removal rates versus carbon dosage at a carbon-water contact time
of 2 weeks (natural water).
0.0
0.2
0.4
0.6
0.8
1.0
0 50 100 150 200
C/C
0 of
MIB
(di
men
sion
less
)
Carbon dosage (mg/L)
KM4-n
KM4-n-GACKM4-n-PACKM4-n-SPAC
0.0
0.2
0.4
0.6
0.8
1.0
0 50 100 150 200
C/C
0 of
MIB
(di
men
sion
less
)
Carbon dosage (mg/L)
KM6-n
KM6-n-GACKM6-n-PAC-1KM6-n-SPAC
0.0
0.2
0.4
0.6
0.8
1.0
0 50 100 150 200
C/C
0 of
MIB
(di
men
sion
less
)
Carbon dosage (mg/L)
KM9-n
KM9-n-GACKM9-n-PACKM9-n-SPAC
0.0
0.2
0.4
0.6
0.8
1.0
0 50 100 150 200
C/C
0 of
MIB
(di
men
sion
less
)
Carbon dosage (mg/L)
AS7-n
AS7-n-GACAS7-n-PACAS7-n-SPAC

6
Among possible reasons why only PAC produced from used carbon 6 years old achieved high MIB removal, we hypothesized that biological degradation might be the reason, and tested this hypothesis. We observed a change of the liquid-phase MIB concentration with the carbon-solution contact time (Fig. S2). The concentration of MIB did not decline during the initial two days, but it started to decrease after the 3rd day, and for several days the removal rate accelerated. After the MIB concentration reached <5% of the initial concentration on the 14th day, the MIB stock solution was spiked into a carbon-solution system to raise the MIB concentration back to about 1 g/L, similar to the MIB concentration at the beginning of the experiment. The MIB concentration decreased immediately after the spike. This behavior is typical of biodegradation. We regard the delay of the onset of the decrease of the MIB concentration during the first two days as a reflection of the acclimation period of the bacteria.
Fig. S2 – Change of MIB concentration after the addition of KM6-n-PAC at a
dosage of 100 mg/L in natural water.
0
200
400
600
800
1000
1200
0 2 4 6 8 10 12 14 16 18 20
Liqu
id-p
hase
MIB
co
ncen
trat
ion
(ng/
L)
Contact time (day)
KM6-n-PAC-1MIB blank
MIB re-additionpoint

7
S1.3 Sterilization treatment of spent carbons. To test the biodegradation hypothesis, we sterilized carbons for 30 min and 15 min in an autoclave at 63 C and 121 C, respectively. Then we conducted the MIB removal experiments by using the sterilized PACs (KM6-a-PACs), and we carried out a control experiment using un-sterilized PACs (KM6-n-PAC). The MIB concentration did not decrease in the experiment with the sterilized PACs, but it decreased in the experiment with the un-sterilized PACs (Fig. S3). The MIB removals attained with the un-sterilized PACs during very long carbon-solution contact, which is typical of isotherm experiments, were a result of biodegradation. The reason for the lack of MIB removal with spent GACs (Fig. S1) was likely due to the small surface area exposed to the bulk solution. SPACs showed little or no MIB removal as well (Fig. S1), possibly because the bacteria attached to the carbon were physically destroyed in the milling process used to produce the SPAC. SPAC particles are smaller than bacteria. These results also indicated that the MIB adsorption capacity was exhausted after 4 years of service in the water purification plant. We therefore focused on used carbons younger than 4 years in this study.
Fig. S3 – Effect of autoclaving on subsequent MIB removal after two-week carbon-
water contact time (natural water).
0.0
0.2
0.4
0.6
0.8
1.0
0 50 100 150 200
C/C
0 of
MIB
(di
men
sion
less
)
Carbon dosage (mg/L)
KM6
KM6-a-PAC (121 °C)KM6-a-PAC (63 °C)KM6-n-PAC-2

8
To confirm that there was little effect from autoclaving on the equilibrium MIB adsorption capacity, bottle-point adsorption experiments were conducted with three PACs. KM2-n-PAC was produced by milling two-year-old GAC (KM2-GAC). KM2-a-PAC was produced by autoclaving KM2-n-PAC at 63 C for 30 min. KM2-g-PAC was produced by sterilizing KM2-n-PAC via gamma ray irradiation at 10.5 ± 0.2 kGy. The MIB removal rates by the three PACs were similar, the indication being that biological degradation of MIB did not occur in the KM2-n-PAC bottles. The lack of biological degradation with the KM2-n-PAC, in contrast to the biological degradation with the KM-6-n-PAC (Fig. S1), could be due to the younger age of the KM2-n-PAC. The similarity of the MIB adsorption isotherms of the three PACs (Fig. S4) suggests that autoclaving and gamma irradiation pretreatment did not modify the carbon characteristics with respect to adsorption capacity. Finally, we used autoclaved carbons in adsorption equilibrium isotherm tests, which require a long carbon-water contact time, in order to avoid any possible biodegradation effect.
Fig. S4. Effect of autoclaving and gamma irradiation treatments on the adsorption
isotherms of MIB in natural water.
1
10
100
10 100 1000
So
lid-p
ha
se M
IB c
on
cen
tra
tion
(ng
/mg
)
Liquid-phase MIB concentration (ng/L)
KM2
KM2-a-PAC KM2-g-PAC
KM2-n-PAC

9
S1.4 NOM The other issue regarding the adsorption experiments with spent carbons was the possibility of NOM desorption from the spent carbons. We monitored the total organic carbon (TOC) and UV absorbance at 260 nm (UV260) of the solution after adding spent carbons (KM9) in natural water supplemented with MIB. In all experiments, the TOC and UV260 did not increase, the indication being that NOM was removed rather than discharged (Fig. S5). Even in the experiment with KM2-n-PAC and organic-free ionic water, the increase of UV260 after a high carbon dosage (200 mg/L) was very small (<0.004 cm–1; no graph attached).
Fig. S5. Change of TOC versus carbon dosage in adsorption equilibrium in natural
water. The carbon-water contact time was two weeks. Initial TOC and
UV260 were 1.15 ± 0.35 mg/L and 0.045 ± 0.25 cm–1, respectively.
0.0
0.2
0.4
0.6
0.8
1.0
0 50 100 150 200
C/C
0 of
TO
C (
dim
ensi
onle
ss)
Carbon dosage (mg/L)
KM9-n
KM9-n-GACKM9-n-PACKM9-n-SPAC
0.0
0.2
0.4
0.6
0.8
1.0
0 50 100 150 200C/C
0 o
f UV
260
(dim
ensi
onle
ss)
Carbon dosage (mg/L)
KM9-n
KM9-n-GACKM9-n-PACKM9-n-SPAC
10
S2. Production of PAC, SPAC, and SSPAC from GAC. PAC samples were produced from GACs by grinding with a coffee mill under moist conditions followed by grinding with a mortar and pestle under wet conditions after addition of pure water. A 180-µm-sized mesh was used to sieve the ground carbon, and the carbon particles that did not pass the mesh were collected and ground again until they passed the mesh. SPAC with D50 >1.5 µm were produced by milling a PAC slurry in a ball mill (Nikkato Ltd., Osaka, Japan) with a mixture of balls (5-mm and 10-mm balls). To produce SPAC (0.5 µm < D50 <1.5 µm) and SSPAC, the SPAC with D50 >1.5 µm was micro-milled in a bead mill (LMZ015, Ashizawa Finetech Ltd., Chiba, Japan; bead diameter, 0.1 mm).
The particle size (as projected-area diameter) distribution of the GAC was determined by image analysis of pictures taken through a microscope (Viewtrac, MicrotracBEL Corp., Osaka, Japan). Particle size distributions of the SPACs and PACs were determined by using a laser-light-scattering instrument (Microtrac MT3300EXII, Nikkiso Co., Tokyo, Japan) after addition of a dispersant (Triton X-100, Kanto Chemical Co., Tokyo, Japan; final concentration, 0.8 g/L) and subsequent ultrasonic dispersion. Fig. S6 shows the size distributions of the carbons used in the main experiments.

11
(a)
0
20
40
60
80
100
0.01 0.1 1 10 100 1000 10000
Cum
ulat
ive
volu
me
perc
enta
ge u
nder
size
(%
)
Particle diameter (μm)
KM0-n
KM0-n-GACKM0-n-PAC-1KM0-n-PAC-2KM0-n-SPAC-1KM0-n-SPAC-2KM0-n-SSPAC
0
20
40
60
80
100
0.01 0.1 1 10 100 1000 10000
Cum
ulat
ive
volu
me
perc
enta
ge u
nder
size
(%
)
Particle diameter (μm)
KM1-n
KM1-n-GACKM1-n-PAC-1KM1-n-PAC-2KM1-n-SPAC-1KM1-n-SPAC-2KM1-n-SSPAC
0
20
40
60
80
100
0.01 0.1 1 10 100 1000 10000
Cum
ulat
ive
volu
me
perc
enta
ge u
nder
size
(%
)
Particle diameter (μm)
KM2-n
KM2-n-GACKM2-n-PAC-1KM2-n-PAC-2KM2-n-SPAC-1KM2-n-SPAC-2KM2-n-SSPAC-1KM2-n-SSPAC-2
0
20
40
60
80
100
0.01 0.1 1 10 100 1000 10000
Cum
ulat
ive
volu
me
perc
enta
ge u
nder
size
(%
)
Particle diameter (μm)
KM3-n
KM3-n-PAC-1KM3-n-PAC-2KM3-n-SPAC-1KM3-n-SPAC-2KM3-n-SSPAC
0
20
40
60
80
100
0.01 0.1 1 10 100 1000 10000
Cum
ulat
ive
volu
me
perc
enta
ge u
nder
size
(%
)
Particle diameter (μm)
AS1-n
AS1-n-PACAS1-n-SPACAS1-n-SSPAC
0
20
40
60
80
100
0.01 0.1 1 10 100 1000 10000
Cum
ulat
ive
volu
me
perc
enta
ge u
nder
size
(%
)
Particle diameter (μm)
AS2-n
AS2-n-PACAS2-n-SPACAS2-n-SSPAC
0
20
40
60
80
100
0.01 0.1 1 10 100 1000 10000C
umul
ativ
e vo
lum
e pe
rcen
tage
und
ersi
ze (
%)
Particle diameter (μm)
KS0-n
KS0-n-PACKS0-n-SPACKS0-n-SSPAC
0
20
40
60
80
100
0.01 1 100 10000
Cum
ulat
ive
volu
me
perc
enta
ge u
nder
size
(%
)
Particle diameter (μm)
KS0.1-n
KS0.1-n-PACKS0.1-n-SPACKS0.1-n-SSPAC

12
(b)
0
20
40
60
80
100
0.01 0.1 1 10 100 1000 10000
Cum
ulat
ive
volu
me
perc
enta
ge u
nder
size
(%
)
Particle diameter (μm)
KS0.3-n
KS0.3-n-PACKS0.3-n-SPACKS0.3-n-SSPAC
0
20
40
60
80
100
0.01 0.1 1 10 100 1000 10000
Cum
ulat
ive
volu
me
perc
enta
ge u
nder
size
(%
)
Particle diameter (μm)
IS4-n
IS4-n-PACIS4-n-SPACIS4-n-SSPAC
0
20
40
60
80
100
0.01 0.1 1 10 100 1000 10000
Cum
ulat
ive
volu
me
perc
enta
ge u
nder
size
(%
)
Particle diameter (μm)
KM0-a
KM0-a-GACKM0-a-PACKM0-a-SPACKM0-a-SSPAC
0
20
40
60
80
100
0.01 0.1 1 10 100 1000 10000
Cum
ulat
ive
volu
me
perc
enta
ge u
nder
size
(%
)
Particle diameter (μm)
KM1-a
KM1-a-PACKM1-a-SPACKM1-a-SSPAC
0
20
40
60
80
100
0.01 0.1 1 10 100 1000 10000
Cum
ulat
ive
volu
me
perc
enta
ge u
nder
size
(%
)Particle diameter (μm)
KM2-a
KM2-a-GACKM2-a-PACKM2-a-SPACKM2-n-SSPAC
0
20
40
60
80
100
0.01 0.1 1 10 100 1000 10000
Cum
ulat
ive
volu
me
perc
enta
ge u
nder
size
(%
)
Particle diameter (μm)
KM3-a
KM3-a-PACKM3-a-SPACKM3-a-SSPAC

13
Fig. S6 – Particle size distributions of GAC/PAC/SPAC/SSPAC used in main experiments.
0
20
40
60
80
100
0.01 0.1 1 10 100 1000 10000
Cum
ulat
ive
volu
me
perc
enta
ge u
nder
size
(%
)
Particle diameter (μm)
AS1-a
AS1-a-PACAS1-a-SPACAS1-a-SSPAC
0
20
40
60
80
100
0.01 0.1 1 10 100 1000 10000
Cum
ulat
ive
volu
me
perc
enta
ge u
nder
size
(%
)
Particle diameter (μm)
AS2-a
AS2-a-PACAS2-a-SPACAS2-a-SSPAC
0
20
40
60
80
100
0.01 0.1 1 10 100 1000 10000
Cum
ulat
ive
volu
me
perc
enta
ge u
nder
size
(%
)
Particle diameter (μm)
KS0-a
KS0-a-PACKS0-a-SPACKS0-a-SSPAC
0
20
40
60
80
100
0.01 0.1 1 10 100 1000 10000
Cum
ulat
ive
volu
me
perc
enta
ge u
nder
size
(%
)
Particle diameter (μm)
KS0.1-a
KS0.1-a-PACKS0.1-a-SPACKS0.1-a-SSPAC
0
20
40
60
80
100
0.01 0.1 1 10 100 1000 10000
Cum
ulat
ive
volu
me
perc
enta
ge u
nder
size
(%
)
Particle diameter (μm)
KS0.3-a
KS0.3-a-PACKS0.3-a-SPACKS0.3-a-SSPAC
0
20
40
60
80
100
0.01 0.1 1 10 100 1000 10000
Cum
ulat
ive
volu
me
perc
enta
ge u
nder
size
(%
)
Particle diameter (μm)
IS4-a
IS4-a-PACIS4-a-SPACIS4-a-SSPAC

14
Table S2 – No-autoclave pretreated carbons used for MIB kinetics and adsorption
index experiments.
Designation Parent GAC Applied experiments D50 (m)
KM0-n-GAC
KM0-n-GAC
MIB adsorption kinetics 2240 KM0-n-PAC-1 MIB adsorption kinetics; Methylene blue (MB) number 25.9
KM0-n-PAC-2 Iodine number; Phenol number; sodium liner-dodecylbenzene sulfonate (ABS) number 22.1
KM0-n-SPAC-2 MIB adsorption kinetics 0.917
KM0-n-SPAC-1 Iodine number; Phenol number; MB number; ABS number 3.49
KM0-n-SSPAC MIB adsorption kinetics; Iodine number; Phenol number; MB number; ABS number 0.238
KM1-n-GAC
KM1-n-GAC
MIB adsorption kinetics 2170 KM1-n-PAC-1 MIB adsorption kinetics; MB number 21.5 KM1-n-PAC-2 Iodine number; Phenol number; ABS number 25.1
KM1-n-SPAC-2 MIB adsorption kinetics 0.911
KM1-n-SPAC-1 Iodine number; Phenol number; MB number;
ABS number 2.84
KM1-n-SSPAC MIB adsorption kinetics; Iodine number;
Phenol number; MB number; ABS number 0.251
KM2-n-GAC
KM2-n-GAC
MIB adsorption kinetics 1910
KM2-n-PAC-1 15.3
KM2-n-PAC-2 Iodine number; Phenol number; MB number; ABS number 21.5
KM2-n-SPAC-2 MIB adsorption kinetics 0.860
KM2-n-SPAC-1 Iodine number; Phenol number; MB number; ABS number 2.57
KM2-n-SSPAC-1 MIB adsorption kinetics; MB number 0.234 KM2-n-SSPAC-2 Iodine number; Phenol number, ABS number 0.271
KM3-n-PAC-1
KM3-n-GAC
MIB adsorption kinetics 18.8 KM3-n-PAC-2 Iodine number; Phenol number 22.5
KM3-n-SPAC-2 MIB adsorption kinetics; 0.912 KM3-n-SPAC-1 Iodine number; Phenol number 1.56
KM3-n-SSPAC MIB adsorption kinetics; Iodine number; Phenol number 0.252
AS1-n-PAC AS1-n-GAC
Iodine number
26.6 AS1-n-SPAC 1.99
AS1-n-SSPAC 0.237 AS2-n-PAC
AS2-n-GAC 27.1
AS2-n-SPAC 2.53 AS2-n-SSPAC 0.294
KS0-n-PAC KS0-n-GAC
17.6 KS0-n-SPAC 3.34
KS0-n-SSPAC 0.253 KS0.1-n-PAC
KS0.1-n-GAC14.0
KS0.1-n-SPAC 2.65 KS0.1-n-SSPAC 0.268
KS0.3-n-PAC KS0.3-n-GAC
14.6 KS0.3-n-SPAC 3.24
KS0.3-n-SSPAC 0.251 IS4-n-PAC
IS4-n-GAC 27.8
IS4-n-SPAC 2.99 IS4-n-SSPAC 0.274

15
Table S3 – Autoclave-pretreated carbons used for adsorption equilibrium
experiments.
Designation Parent GAC Applied experiments D50 (m) KM0-a-GAC
KM0-a-GAC
Adsorption equilibrium of MIB in natural water 2240 KM0-a-PAC Adsorption equilibrium of MIB in natural water;
Adsorption equilibrium of MIB, geosmin, acetaminophen, phenol, poly(styrenesulfonic
acid) sodium salt MW210 (PSS-210), PSS-6400, MB, ABS in organic-free ionic water; N2 adsorption (Pore size distribution)
31.1 KM0-a-SPAC 3.13
KM0-a-SSPAC 0.293
KM1-a-PAC KM1-a-GAC
Adsorption equilibrium of MIB in natural water; N2 adsorption (Pore size distribution)
12.1 KM1-a-SPAC 2.63
KM1-a-SSPAC 0.273 KM2-a-GAC
KM2-a-GAC
Adsorption equilibrium of MIB in natural water 1910 KM2-a-PAC Adsorption equilibrium of MIB in natural water;
Adsorption equilibrium of MIB, geosmin, acetaminophen, phenol, PSS-210, PSS-6400, MB,
ABS in organic-free ionic water; N2 adsorption (Pore size distribution)
42.3 KM2-a-SPAC 3.28
KM2-a-SSPAC 0.246
KM3-a-PAC KM3-a-GAC
Adsorption equilibrium of MIB in natural water; N2 adsorption (Pore size distribution)
21.9 KM3-a-SPAC 1.59
KM3-a-SSPAC 0.218 AS1-a-PAC
AS1-a-GAC
Adsorption equilibrium of MIB in natural water
19.2 AS1-a-SPAC 2.13
AS1-a-SSPAC 0.284 AS2-a-PAC
AS2-a-GAC 14.8
AS2-a-SPAC 1.91 AS2-a-SSPAC 0.248
KS0-a-PAC KS0-a-GAC
22.3 KS0-a-SPAC 2.38
KS0-a-SSPAC 0.236 KS0.1-a-PAC
KS0.1-a-GAC 14.2
KS0.1-a-SPAC 2.51 KS0.1-a-SSPAC 0.241
KS0.3-a-PAC KS0.3-a-GAC
14.5 KS0.3-a-SPAC 3.10
KS0.3-a-SSPAC 0.252 IS4-a-PAC
IS4-a-GAC 23.1
IS4-a-SPAC 2.37 IS4-a-SSPAC 0.277

16
S3. Absorbability indices The amounts of iodine, phenol, MB, and ABS adsorbed onto the carbons at specified liquid-phase concentrations after specified adsorbate-adsorbent contact times were termed the iodine number, phenol number, MB number, and ABS number, respectively. The iodine number was equated to the solid-phase concentration at equilibrium with a liquid-phase concentration of 2.5 g/L after a 15-min contact time in working solution A (see section S5); the phenol number was equated to the solid-phase concentration measured after a 60-min contact time in working solution C with a liquid-phase concentration of 0.5 mg/L; the MB number was equated to the solid-phase concentration after a 30-min contact time in working solution D at a liquid-phase concentration of 0.24 mg/L; the ABS number was equated to the solid-phase concentration after a 90-min contact time in working solution A at a liquid-phase concentration of 2.5 mg/L. These values were measured according to the standard methods of the Japan Water Works Association (K 113:2005-2) (JWWA, 2005). Measurement methods for the iodine number and MB number: A carbon slurry was added to an Erlenmeyer flask that contained 25-mL of 6.35-g/L iodine in an iodine/KI solution or 24 mg/L of MB in a phosphate-buffer solution. After shaking for 15 min for iodine adsorption or 30 min for MB adsorption at 100 rpm at 20 °C, the mixed carbon-solution suspensions were each filtered through a 0.2-µm pore size membrane filter (DISMIC-25HP; Toyo Roshi Kaisha, Ltd., Tokyo, Japan, SSPAC-solution suspension was filtered twice). The concentrations of iodine or MB in the aqueous phase were then measured by titration or spectrophotometry, respectively. The solid-phase concentrations of iodine adsorbed onto the carbon samples at a liquid-phase concentration of 2.5 g/L were calculated based on the obtained adsorption isotherms and defined as iodine numbers. Similarly, the MB number was the carbon solid-phase concentration of MB at a liquid-phase concentration 0.24 mg/L. Measurement methods for phenol number and ABS number: Carbon slurries were added to 110-mL vials that contained 1-mg/L phenol in an organic-free ionic solution or 5 mg/L of ABS in pure water. After shaking for 90 min (ABS) or 60 min (phenol) at 100 rpm at 20 °C, the carbon-solution suspensions were each filtered through a 0.2-µm pore size membrane filter (the SSPAC-solution suspension was filtered twice), and then the concentrations of phenol or ABS in the aqueous phase were measured by spectrophotometry. The phenol number and ABS number were equated to the carbon solid-phase concentration of phenol and ABS at liquid-phase concentrations of 0.5 mg/L and 2.5 mg/L, respectively.

17
S4. Working Solutions and Batch Adsorption Tests Four working solutions were prepared and used in this research. Solution A was ultrapure water obtained from a Milli-Q Advantage (Millipore Co., Bedford, MA, USA). Solution B (natural water) was the raw water of the Kanamachi Water Purification Plant, the same plant where we collected the virgin and used carbons that were the main targets of this study. Table S4 provides information about the ion concentrations, dissolved organic carbon (DOC), and other related information about this water. Solution C (organic-free ionic water) was made from ultrapure water by adding ions at the same concentrations found in the natural water (working solution B). Working solutions B and C were each filtered through a 0.2-µm pore size membrane filter (Advantec H020A; Toyo Roshi Kaisha, Ltd., Tokyo, Japan), and the pH was adjusted to 7.0 ± 0.1 before the solutions were used in the adsorption experiments. Solution D (phosphate buffer water) was a mixture of potassium dihydrogen phosphate (KH2PO4) and potassium monohydrogen phosphate (K2HPO4) dissolved in ultrapure water; the pH was maintained at 7.0 ± 0.1.
Working solutions B and C were used for the MIB adsorption experiments after adjusting the concentrations of MIB to about 1 µg/L, because MIB usually occurs naturally at concentrations lower than 1 µg/L. The concentration of geosmin in working solution C was also set to about 1 µg/L for the adsorption experiments. In the adsorption tests with iodine, iodine was dissolved in working solution A together with potassium iodide at 6.35 g-I/L. Starch was used as an indicator. The adsorption experiments with MB were conducted in working solution D because of the pH-dependent characteristics of MB; the MB concentrations were 24 and 0.48 mg/L. Working solutions A and C were used for ABS experiments; the concentration of ABS was 5 mg/L. The other compounds were dissolved in working solution C at appropriate concentrations based on the range of concentrations within which individual compounds could be measured with a UV-VIS spectrophotometer: phenol: 1 mg/L; acetaminophen: 2 mg/L; PSS-210 and PSS-6400: 4 mg/L. An adsorption experiment with acetaminophen at 10 µg/L (low concentration) was also conducted.
In all adsorption kinetics and equilibrium tests, aliquots (100 or 110 mL) of the working solutions containing the target compounds were transferred to 110-mL vials. Specified amounts of carbon were immediately added, and the vials were manually shaken and then agitated on a mechanical shaker to keep shaking for a pre-determined period of time at a constant temperature of 20 °C in the dark. After the pre-determined carbon-solution contact time, the carbon-solution mixtures were each filtered through a 0.2-µm pore size membrane filter (SSPAC-solution mixture was filtered twice), and the concentrations of the adsorbate in the aqueous phase were measured. The carbon-solution contact time ranged from 10 minutes to 24 hours for MIB adsorption kinetics experiments, but it was set to two weeks for the MIB adsorption equilibrium

18
experiments with natural water (working solution B) because of the slow rate of adsorption onto GAC and used carbons in natural water. Adsorption experiments in organic-free ionic water (working solution C) were conducted with PAC, SPAC, and SSPAC to check the adsorption capacity of single target compounds when there was no adsorption competition. The carbon-solution contact time for adsorption equilibrium in organic-free ionic water was shortened to 7 days for all compounds except phenol (0.5 days), acetaminophen of low concentration (0.5 days), and iodine (15 min) while adsorption equilibria were confirmed. Table S4 – Information about the natural water (working solution B)
pH Turbidity Ammonia nitrogen Conductivity KMnO4 consumption
7.8 14 NTU 0.04 mg/L 27 µS/m 8.8 mg/L
Alkalinity DOC UV260 MIB Geosmin
48 mg/L 1.2 mg/L 0.04 cm–1 5 ng/L Undetectable
Ion Na+ K+ Mg2+ Ca2+ Cl– NO3– SO4
2–
Concentration (mg/L)
20 3.8 4.9 24 8.0 4.1 31

19
S5. Analytical Methods for the Supplementary Compounds Geosmin was detected with a method similar to the method used to detect MIB: the m/z 112 peak was assumed to correspond to geosmin. Iodine concentrations were measured by titration with sodium thiosulfate (Na2S2O3). The concentrations of other adsorbates were measured by spectrophotometry (UV-1800, Shimadzu Co., Kyoto, Japan): phenol at 269.5 nm; high concentrations of acetaminophen (~2 mg/L) at 244 nm; PSS-210 and PSS-6400 at 261 nm; and MB at 665 nm. Concentrations of ABS were measured by spectrophotometry at 223.5 nm or by TOC analyzer (Sievers 900, Ionics Instrument Business Grp., Boulder Co.). The choice of method was based on the working solutions in the experiments because of the effect of ions on spectrophotometry at wavelengths less than 240 nm. Low concentrations of acetaminophen (~10 µg/L) were quantified by using a hybrid quadrupole-orbitrap mass spectrometer (Q Exactive, Thermo Fisher Scientific Inc., Waltham, MA, USA) coupled with liquid chromatography (UltiMate3000 LC systems, Thermo Fischer Scientific Inc.).

20
S6. Other Supplementary Data
10
100
1000
10 100 1000
So
lid-p
hase
MIB
co
nce
ntr
atio
n (n
g/m
g)
Liquid-phase MIB concentration (ng/L)
KM0-a
KM0-a-GAC KM0-a-PAC
KM0-a-SPAC KM0-a-SSPAC
1
10
100
10 100 1000
So
lid-p
ha
se M
IB c
on
cen
trat
ion
(ng
/mg
)
Liquid-phase MIB concentration (ng/L)
KM1-a
KM1-a-PAC KM1-a-SPAC
KM1-a-SSPAC
1
10
100
10 100 1000
So
lid-p
ha
se M
IB c
on
cen
tra
tion
(ng
/mg
)
Liquid-phase MIB concentration (ng/L)
KM2-a
KM2-a-GAC KM2-a-PACKM2-a-SPAC KM2-a-SSPAC
1
10
100
10 100 1000
So
lid-p
ha
se M
IB c
on
cen
tra
tion
(ng
/mg
)
Liquid-phase MIB concentration (ng/L)
KM3-a
KM3-a-PAC KM3-a-SPACKM3-a-SSPAC
1
10
100
10 100 1000
So
lid-p
ha
se M
IB c
on
cen
tra
tion
(ng
/mg
)
Liquid-phase MIB concentration (ng/L)
AS1-a
AS1-a-PAC AS1-a-SPACAS1-a-SSPAC
1
10
100
10 100 1000
So
lid-p
ha
se M
IB c
onc
en
tra
tion
(ng
/mg
)
Liquid-phase MIB concentration (ng/L)
AS2-a
AS2-a-PAC AS2-a-SPACAS2-a-SSPAC
10
100
1000
10 100 1000
So
lid-p
ha
se M
IB c
on
cen
trat
ion
(ng
/mg
)
Liquid-phase MIB concentration (ng/L)
KS0-a
KS0-a-PAC KS0-a-SPAC
KS0-a-SSPAC
1
10
100
10 100 1000
So
lid-p
ha
se M
IB c
onc
en
tra
tion
(ng
/mg
)
Liquid-phase MIB concentration (ng/L)
KS0.1-a
KS0.1-a-PAC KS0.1-a-SPAC
KS0.1-a-SSPAC

21
Fig. S7 – MIB adsorption isotherms in natural water. (The parameter values of Freudlich model equations fitted by experimental data are list in Table S5)
10
100
1000
10 100 1000
So
lid-p
ha
se M
IB c
onc
en
tra
tion
(ng
/mg
)
Liquid-phase MIB concentration (ng/L)
KS0.3-a
KS0.3-a-PAC KS0.3-a-SPAC
KS0.3-a-SSPAC
1
10
100
10 100 1000
So
lid-p
ha
se M
IB c
onc
en
tra
tion
(ng
/mg
)
Liquid-phase MIB concentration (ng/L)
IS4-a
IS4-a-PAC IS4-a-SPAC
IS4-a-SSPAC

22
Table S5 –The parameter values of Freundlich model equation
/ , where q is solid-phase concentrations (ng/mg), c is liquid-phase concentration (ng/L), KF is the Freundlich capacity parameter [(ng/mg)/(L/ng)1/n], and n is Freundlich exponent (dimensionless).
KF [(ng/mg)/(L/ng)1/n]
KF [(ng/mg)/(L/100 ng)1/n]
1/n (dimensionless)
KM
KM0
KM0-a-GAC 1.69 17.6 0.508 KM0-a-PAC 13.7 93.6 0.418
KM0-a-SPAC 15.2 144 0.489 KM0-a-SSPAC 20.3 127 0.398
KM1 KM1-a-PAC 1.17 23.7 0.654
KM1-a-SPAC 2.10 28.8 0.569 KM1-a-SSPAC 2.30 33.8 0.583
KM2
KM2-a-GAC 0.117 1.85 0.600 KM2-a-PAC 0.164 7.62 0.833
KM2-a-SPAC 0.269 13.9 0.857 KM2-a-SSPAC 1.74 22.3 0.553
KM3 KM3-a-PAC 0.013 1.16 0.978
KM3-a-SPAC 0.091 2.44 0.714 KM3-a-SSPAC 0.285 7.88 0.721
AS
AS1 AS1-a-PAC 0.130 8.13 0.898
AS1-a-SPAC 0.453 12.5 0.721 AS1-a-SSPAC 1.25 17.5 0.574
AS2 AS2-a-PAC 0.013 1.12 0.974
AS2-a-SPAC 0.022 1.98 0.981 AS2-a-SSPAC 0.110 5.68 0.857
KS
KS0 KS0-a-PAC 19.3 139 0.429
KS0-a-SPAC 24.8 165 0.411 KS0-a-SSPAC 22.8 110 0.342
KS0.1 KS0.1-a-PAC 0.282 13.7 0.844
KS0.1-a-SPAC 0.389 14.6 0.788 KS0.1-a-SSPAC 0.273 15.0 0.871
KS0.3 KS0.3-a-PAC 3.71 63.6 0.617
KS0.3-a-SPAC 3.60 89.2 0.697 KS0.3-a-SSPAC 7.72 85.5 0.522
IS IS4 IS4-a-PAC 0.055 4.90 0.977
IS4-a-SPAC 0.094 5.89 0.899 IS4-a-SSPAC 0.122 7.38 0.892

23
Fig. S8 – Micropore size distributions of PAC, SPAC, and SSPAC.
Fig. S9 – Mesopore size distributions of KM-series carbon.
0.0
0.2
0.4
0.6
0.8
1.0
0.0 0.5 1.0 1.5 2.0
Por
e vo
lum
e [c
m3 /
(nm
g)]
Pore width (nm)
KM0-a
KM0-a-PACKM0-a-SPACKM0-a-SSPAC
0.0
0.2
0.4
0.6
0.8
1.0
0.0 0.5 1.0 1.5 2.0
Por
e vo
lum
e [c
m3 /
(nm
g)]
Pore width (nm)
KM1-a
KM1-a-PACKM1-a-SPACKM1-a-SSPAC
0.0
0.2
0.4
0.6
0.8
1.0
0.0 0.5 1.0 1.5 2.0
Por
e vo
lum
e [c
m3 /
(nm
g)]
Pore width (nm)
KM2-a
KM2-a-PACKM2-a-SPACKM2-a-SSPAC
0.0
0.2
0.4
0.6
0.8
1.0
0.0 0.5 1.0 1.5 2.0
Por
e vo
lum
e [c
m3 /
(nm
g)]
Pore width (nm)
KM3-a
KM3-a-PACKM3-a-SPACKM3-a-SSPAC
0.0
0.2
0.4
0.6
0.8
1.0
0 10 20 30
Por
e vo
lum
e [c
m3 /
(nm
g)]
Pore width (nm)
KM0-aKM1-aKM2-aKM3-a
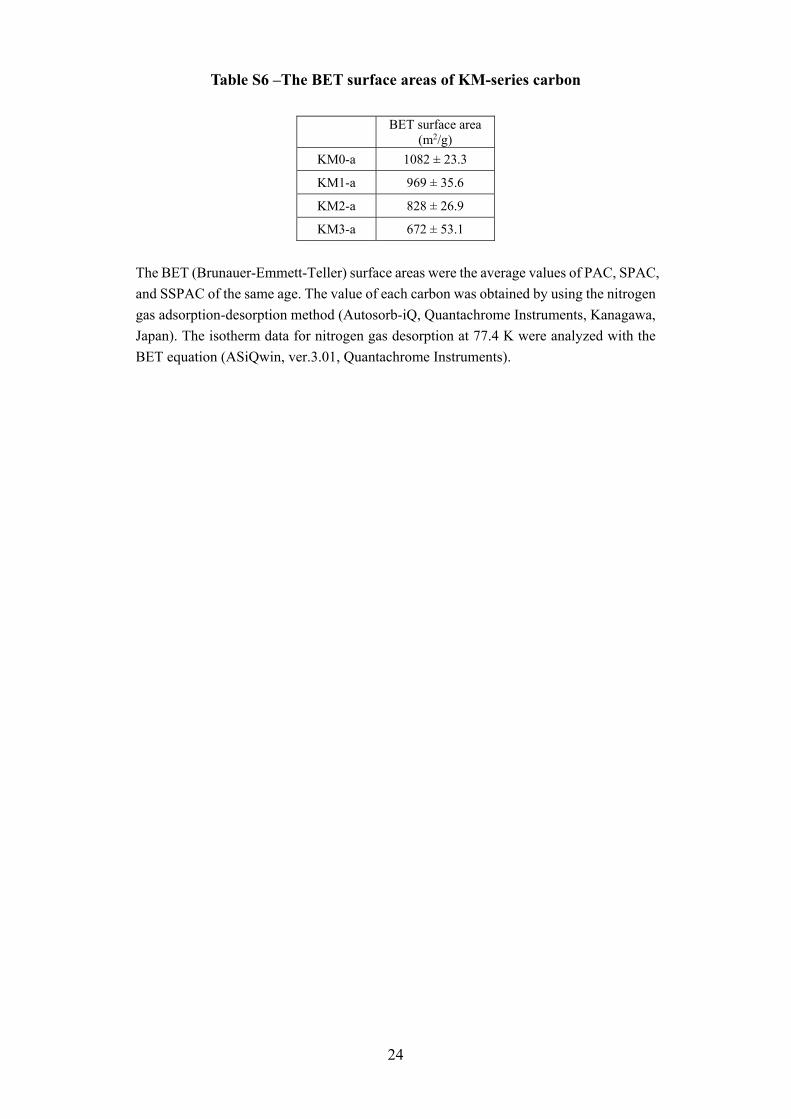
24
Table S6 –The BET surface areas of KM-series carbon
BET surface area (m2/g)
KM0-a 1082 ± 23.3
KM1-a 969 ± 35.6
KM2-a 828 ± 26.9
KM3-a 672 ± 53.1
The BET (Brunauer-Emmett-Teller) surface areas were the average values of PAC, SPAC, and SSPAC of the same age. The value of each carbon was obtained by using the nitrogen gas adsorption-desorption method (Autosorb-iQ, Quantachrome Instruments, Kanagawa, Japan). The isotherm data for nitrogen gas desorption at 77.4 K were analyzed with the BET equation (ASiQwin, ver.3.01, Quantachrome Instruments).

25
(a) (Iodine)
100
1000
10000
0.1 1 10
So
lid-p
ha
se io
din
e c
on
cen
tra
tion
(m
g/g
)
Liquid-phase iodine concentration (g/L)
KM0-n
KM0-n-PACKM0-n-SPACKM0-n-SSPAC
100
1000
10000
0.1 1 10
So
lid-p
ha
se io
din
e c
onc
en
tra
tion
(m
g/g
)
Liquid-phase iodine concentration (g/L)
KM1-n
KM1-n-PACKM1-n-SPACKM1-n-SSPAC
100
1000
10000
0.1 1 10
So
lid-p
ha
se io
din
e c
onc
en
tra
tion
(m
g/g
)
Liquid-phase iodine concentration (g/L)
KM2-n
KM2-n-PACKM2-n-SPACKM2-n-SSPAC
100
1000
10000
0.1 1 10
So
lid-p
ha
se io
din
e c
on
cen
tra
tion
(m
g/g
)
Liquid-phase iodine concentration (g/L)
KM3-n KM3-n-PACKM3-n-SPACKM3-n-SSPAC
100
1000
10000
0.1 1 10
So
lid-p
ha
se io
din
e c
on
cen
tra
tion
(m
g/g
)
Liquid-phase iodine concentration (g/L)
AS1-n
AS1-n-PACAS1-n-SPACAS1-n-SSPAC
100
1000
10000
0.1 1 10
So
lid-p
ha
se io
din
e c
on
cen
tra
tion
(m
g/g
)
Liquid-phase iodine concentration (g/L)
AS2-n
AS2-n-PACAS2-n-SPACAS2-n-SSPAC
100
1000
10000
0.1 1 10
So
lid-p
ha
se io
din
e c
on
cen
tra
tion
(m
g/g
)
Liquid-phase iodine concentration (g/L)
KS0-n
KS0-n-PACKS0-n-SPACKS0-n-SSPAC
100
1000
10000
0.1 1 10
So
lid-p
ha
se io
din
e c
on
cen
tra
tion
(m
g/g
)
Liquid-phase iodine concentration (g/L)
KS0.1-n
KS0.1-n-PACKS0.1-n-SPACKS0.1-n-SSPAC
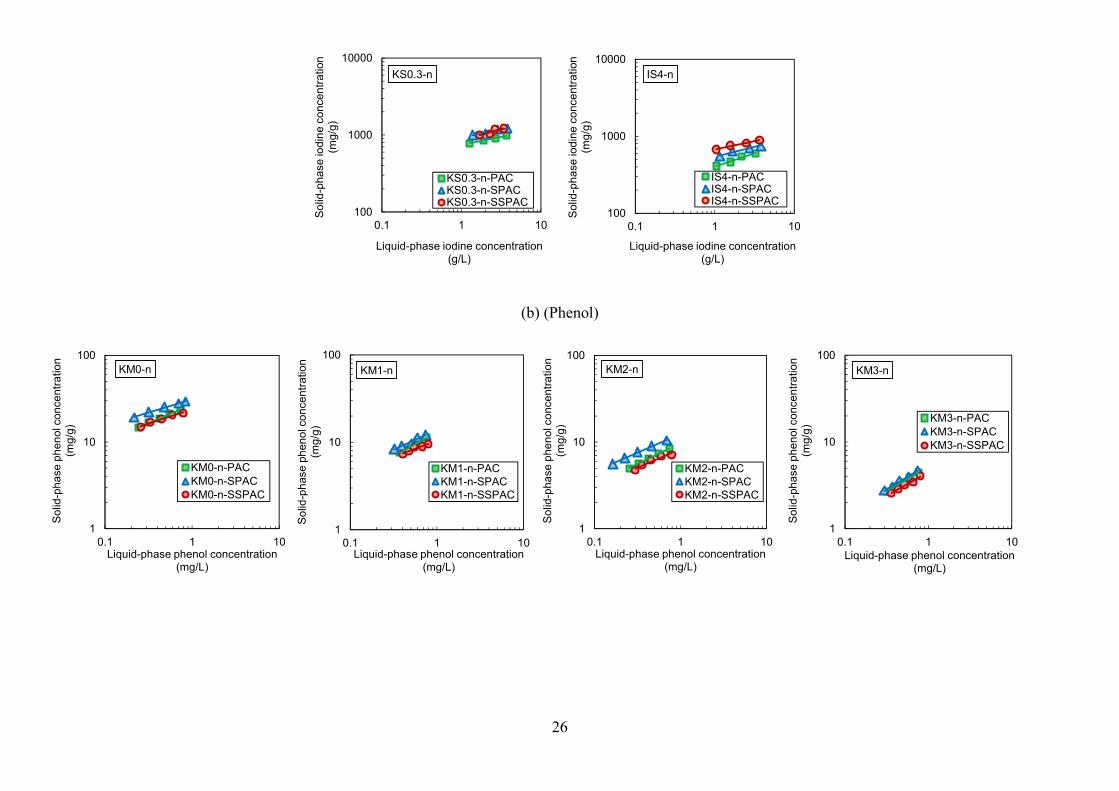
26
(b) (Phenol)
100
1000
10000
0.1 1 10
So
lid-p
ha
se io
din
e c
on
cen
tra
tion
(m
g/g
)
Liquid-phase iodine concentration (g/L)
KS0.3-n
KS0.3-n-PACKS0.3-n-SPACKS0.3-n-SSPAC
100
1000
10000
0.1 1 10
So
lid-p
ha
se io
din
e c
on
cen
tra
tion
(m
g/g
)
Liquid-phase iodine concentration (g/L)
IS4-n
IS4-n-PACIS4-n-SPACIS4-n-SSPAC
1
10
100
0.1 1 10
So
lid-p
ha
se p
he
nol
con
cent
ratio
n (m
g/g
)
Liquid-phase phenol concentration (mg/L)
KM0-n
KM0-n-PACKM0-n-SPACKM0-n-SSPAC
1
10
100
0.1 1 10
So
lid-p
ha
se p
he
no
l co
nce
ntr
atio
n (m
g/g
)
Liquid-phase phenol concentration (mg/L)
KM1-n
KM1-n-PACKM1-n-SPACKM1-n-SSPAC
1
10
100
0.1 1 10S
olid
-pha
se p
he
nol c
on
cen
tra
tion
(mg
/g)
Liquid-phase phenol concentration (mg/L)
KM2-n
KM2-n-PACKM2-n-SPACKM2-n-SSPAC
1
10
100
0.1 1 10
So
lid-p
ha
se p
he
nol
co
nce
ntr
atio
n (m
g/g
)
Liquid-phase phenol concentration (mg/L)
KM3-n
KM3-n-PACKM3-n-SPACKM3-n-SSPAC

27
(c) (MB)
(d) (ABS)
Fig. S10 – Solid-phase vs. liquid-phase concentrations used to determine iodine number, phenol number, MB number, and ABS number.
10
100
1000
0.01 0.1 1
So
lid-p
ha
se M
B c
on
cen
tra
tion
(mg
/g)
Liquid-phase MB concentration (mg/L)
KM0-n
KM0-n-PACKM0-n-SPACKM0-n-SSPAC
10
100
1000
0.01 0.1 1
So
lid-p
ha
se M
B c
onc
en
tra
tion
(mg
/g)
Liquid-phase MB concentration (mg/L)
KM1-n
KM1-n-PACKM1-n-SPACKM1-n-SSPAC
10
100
1000
0.01 0.1 1
So
lid-p
hase
MB
con
cen
trat
ion
(mg
/g)
Liquid-phase MB concentration (mg/L)
KM2-n
KM2-n-PACKM2-n-SPACKM2-n-SSPAC
10
100
1000
0.1 1 10
So
lid-p
ha
se A
BS
co
nce
ntr
atio
n
(mg
/g)
Liquid-phase ABS concentration (mg/L)
KM0-n
KM0-n-PACKM0-n-SPACKM0-n-SSPAC
10
100
1000
0.1 1 10
So
lid-p
ha
se A
BS
co
nce
ntr
atio
n
(mg
/g)
Liquid-phase ABS concentration (mg/L)
KM1-n
KM1-n-PACKM1-n-SPACKM1-n-SSPAC
10
100
1000
0.1 1 10
So
lid-p
ha
se A
BS
co
nce
ntr
atio
n
(mg
/g)
Liquid-phase ABS concentration (mg/L)
KM2-n
KM2-n-PACKM2-n-SPACKM2-n-SSPAC

28
(a) (b)
(c) (d) Fig. S11 – Correlation between MIB adsorption capacity and four indices of the KM-series carbon (the squares are PACs, the triangles are SPACs, and
the circles are SSPACs).
R² = 0.97
100
1000
10000
1 10 100 1000
Iod
ine
nu
mb
er
(mg/
g)
KF of MIB [(ng/mg) (L/100 ng)1/n]
Iodine numbervs.
MIB adsorption capacity
KM0KM1KM2KM3
R² = 0.83
1
10
100
1 10 100 1000
ph
en
ol n
um
be
r (m
g/g)
KF of MIB [(ng/mg) (L/100 ng)1/n]
Phenol numbervs.
MIB adsorption capacity
KM0KM1KM2KM3
R² = 0.18
10
100
1000
1 10 100 1000
MB
nu
mb
er
(mg/
g)
KF of MIB [(ng/mg) (L/100 ng)1/n]
MB numbervs.
MIB adsorption capacity
KM0KM1KM2 R² = 0.35
10
100
1000
1 10 100 1000A
BS
nu
mb
er
(mg/
g)KF of MIB [(ng/mg) (L/100 ng)1/n]
ABS numbervs.
MIB adsorption capacity
KM0KM1KM2

29
(a) (phenol with 1-mg/L initial concentration [0.5-day contact time], working solution C [organic-free ionic water])
(b) (acetaminophen with 2-mg/L initial concentration [7-day contact time], working solution C [organic-free ionic water])
1
10
100
0.01 0.1 1S
olid
-pa
hse
ph
en
ol c
on
cen
tra
tion
(mg
/g)
Liquid-phase phenol concentration (mg/L)
KM0-a
KM0-a-PACKM0-a-SPACKM0-a-SSPAC
1
10
100
0.01 0.1 1
So
lid-p
ah
se p
he
no
l co
nce
ntr
atio
n (m
g/g
)
Liquid-phase phenol concentration (mg/L)
KM2-a
KM2-a-PACKM2-a-SPACKM2-a-SSPAC
10
100
1000
0.1 1 10
So
lid-p
ha
se a
ceta
min
op
hen
co
nce
ntr
atio
n (m
g/g
)
Liquid-phase acetaminophen concentration (mg/L)
KM0-a
KM0-a-PACKM0-a-SPACKM0-a-SSPAC
10
100
1000
0.1 1 10
So
lid-p
ha
se a
ceta
min
op
hen
co
nce
ntr
atio
n (m
g/g
)
Liquid-phase acetaminophen concentration (mg/L)
KM2-a
KM2-a-PACKM2-a-SPACKM2-a-SSPAC

30
(c) (acetaminophen with 10-µg/L initial concentration [0.5-day contact time], working solution C [organic-free ionic water])
(d) (MIB with 1-µg/L initial concentration [7-day contact time], working solution C [organic-free ionic water])
1
10
100
0.1 1 10
Sol
id-p
hase
ace
tam
inop
hen
conc
entr
atio
n (m
g/g)
Liquid-phase acetaminophen concentration (µg/L)
KM0-a-SPACKM2-a-SPAC
10
100
1000
1 10 100 1000
So
lid-p
ha
se M
IB c
on
cen
tra
tion
(ng
/mg
)
Liquid-phase MIB concentration(ng/L)
KM0-a
KM0-a-PAC
KM0-a-SPAC
KM0-a-SSPAC
1
10
100
1000
1 10 100 1000
So
lid-p
ha
se M
IB c
on
cen
tra
tion
(ng
/mg
)
Liquid-phase MIB concentration (ng/L)
KM2-a
KM2-a-PACKM2-a-sPACKM2-a-SSPAC
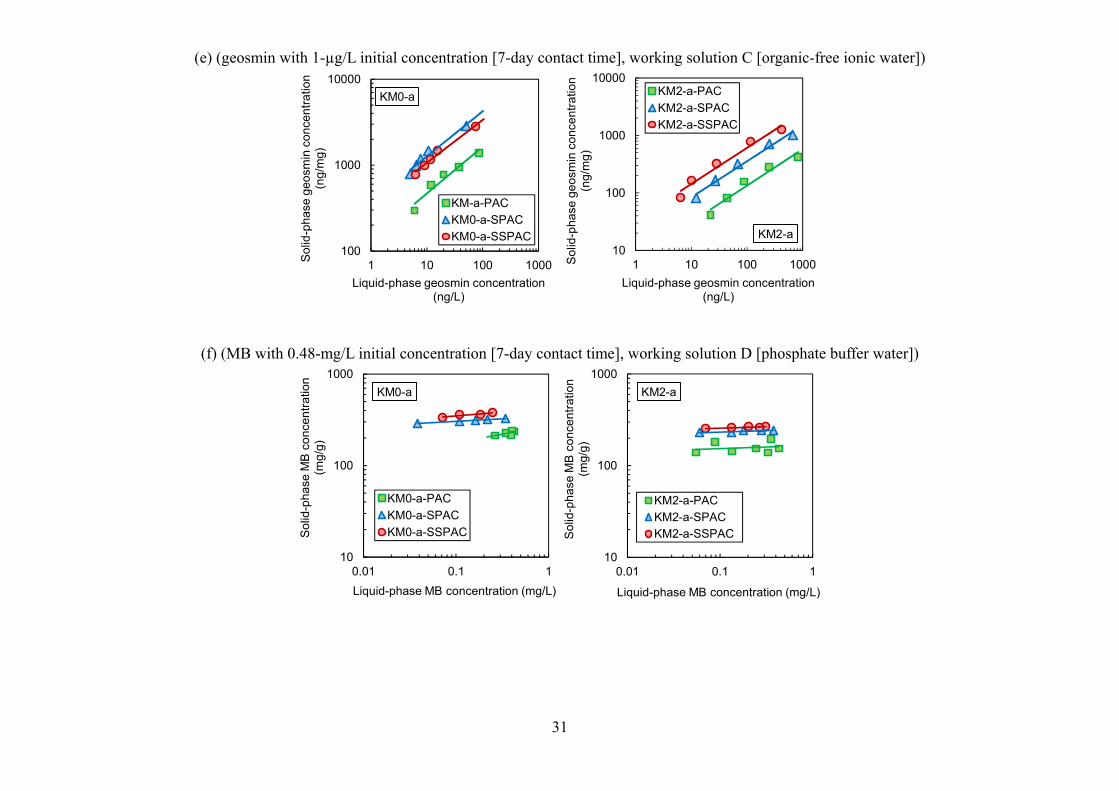
31
(e) (geosmin with 1-µg/L initial concentration [7-day contact time], working solution C [organic-free ionic water])
(f) (MB with 0.48-mg/L initial concentration [7-day contact time], working solution D [phosphate buffer water])
100
1000
10000
1 10 100 1000
So
lid-p
ha
se g
eosm
in c
on
cen
tra
tion
(ng
/mg
)
Liquid-phase geosmin concentration (ng/L)
KM0-a
KM-a-PAC
KM0-a-SPACKM0-a-SSPAC
10
100
1000
10000
1 10 100 1000So
lid-p
ha
se g
eo
smin
co
nce
ntr
atio
n (n
g/m
g)
Liquid-phase geosmin concentration (ng/L)
KM2-a
KM2-a-PAC
KM2-a-SPAC
KM2-a-SSPAC
10
100
1000
0.01 0.1 1
So
lid-p
ha
se M
B c
on
cen
tra
tion
(mg
/g)
Liquid-phase MB concentration (mg/L)
KM0-a
KM0-a-PAC
KM0-a-SPAC
KM0-a-SSPAC
10
100
1000
0.01 0.1 1S
olid
-ph
ase
MB
co
nce
ntr
atio
n (m
g/g
)Liquid-phase MB concentration (mg/L)
KM2-a
KM2-a-PACKM2-a-SPACKM2-a-SSPAC

32
(g) (ABS with 5-mg/L initial concentration [7-day contact time], working solution C [ultrapure water])
(h) (PSS-210 with 4-mg/L initial concentration [7-day contact time], working solution C [organic-free ionic water])
100
1000
10000
0.1 1 10
So
lid-p
ha
se A
BS
co
nce
ntr
atio
n
(mg
/g)
Liquid-phase ABS concentration (mg/L)
KM0-a
KM0-a-PACKM0-a-SPACKM0-a-SSPAC
100
1000
10000
0.1 1 10
Sol
id-p
hase
AB
S c
once
ntra
tion
(m
g/g
)
Liquid-phase ABS concentration (mg/L)
KM2-a
KM2-a-PACKM2-a-SPACKM2-a-SSPAC
1
10
100
0.1 1 10
So
lid-p
ha
se P
SS
-21
0
con
cen
tra
tion
(mg
/g)
Liquid-phase PSS-210 concentration (mg/L)
KM0-a
KM0-a-PACKM0-a-SPACKM0-a-SSPAC
1
10
100
0.1 1 10S
olid
-ph
ase
PS
S-2
10
co
nce
ntr
atio
n (m
g/g
)Liquid-phase PSS-210 concentration
(mg/L)
KM2-a
KM2-a-PACKM2-a-SPACKM2-a-SSPAC

33
(i) (PSS-6400 with 4-mg/L initial concentration [7-day contact time], working solution C [organic-free ionic water])
Fig. S12 – Adsorption isotherms of the eight adsorbates.
References Graham, M.R., Summers, R.S., Simpson, M.R. and MacLeod, B.W., 2000. Modeling equilibrium adsorption of 2-methylisoborneol and geosmin in natural waters. Water Research 34(8), 2291-2300. JWWA, 2005. Powdered activated carbon for water treatment (K 113:2005-2), Japan Water Works Association, Tokyo, Japan. Matsui, Y., Nakao, S., Sakamoto, A., Taniguchi, T., Pan, L., Matsushita, T. and Shirasaki, N., 2015. Adsorption capacities of activated carbons for geosmin and 2-methylisoborneol vary with activated carbon particle size: Effects of adsorbent and adsorbate characteristics. Water Research 85, 95-102. Newcombe, G., Morrison, J. and Hepplewhite, C., 2002. Simultaneous adsorption of MIB and NOM onto activated carbon. I. Characterisation of the system and NOM adsorption. Carbon 40(12), 2135-2146.
1
10
100
1000
0.1 1 10
So
lid-p
ha
se P
SS
-64
00
co
nce
ntr
atio
n (m
g/g
)
Liquid-phase PSS-6400 concentration (mg/L)
KM0-a
KM0-a-PACKM0-a-SPACKM0-a-SSPAC
1
10
100
1000
0.1 1 10
So
lid-p
ha
se P
SS
-64
00
co
nce
ntr
atio
n (m
g/g
)
Liquid-phase PSS-6400 concentration (mg/L)
KM2-a
KM2-a-PACKM2-a-SPACKM2-a-SSPAC