Embed Size (px)
Citation preview
University of Mississippi University of Mississippi
eGrove eGrove
Electronic Theses and Dissertations Graduate School
2013
Micro-Mechanics Based Representative Volume Element Micro-Mechanics Based Representative Volume Element
Modeling Of Heterogeneous Cementitious Materials Modeling Of Heterogeneous Cementitious Materials
Mohammadmehdi Shahzamanian Sichani University of Mississippi
Follow this and additional works at: https://egrove.olemiss.edu/etd
Part of the Mechanical Engineering Commons
Recommended Citation Recommended Citation Shahzamanian Sichani, Mohammadmehdi, "Micro-Mechanics Based Representative Volume Element Modeling Of Heterogeneous Cementitious Materials" (2013). Electronic Theses and Dissertations. 686. https://egrove.olemiss.edu/etd/686
This Thesis is brought to you for free and open access by the Graduate School at eGrove. It has been accepted for inclusion in Electronic Theses and Dissertations by an authorized administrator of eGrove. For more information, please contact [email protected].
MICRO-MECHANICS BASED REPRESENTATIVE VOLUME ELEMENT MODELING OF
HETEROGENEOUS CEMENTITIOUS MATERIALS
A Thesis
presented in partial fulfillment of requirements for the degree of Master of Sceince
in the Department of Mechanical Engineering The University of Mississippi
by
MOHAMMADMEHDI SHAHZAMANIAN SICHANI
December 2013

Copyright Mohammadmehdi Shahzamanian Sichani 2013 ALL RIGHTS RESERVED
ii
ABSTRACT
The current work focuses on evaluation of the effective elastic properties of cementitious
materials through a voxel based FEA approach. Voxels are generated for a heterogeneous
cementitious material (Type-I cement) consisting of typical volume fractions of various
constituent phases from digital microstructures. The microstructure is modeled as a micro-
scale representative volume element (RVE) in ABAQUS to generate cubes several tens of
microns in dimension and subjected to various prescribed deformation modes to generate the
effective elastic tensor of the material. The RVE-calculated elastic properties such as moduli
and Poisson’s ratio are validated through an asymptotic expansion homogenization (AEH)
and compared with rule of mixtures. Both Periodic (PBC) and Kinematic boundary
conditions (KBC) are investigated to determine if the elastic properties are invariant due to
boundary conditions. In addition the method of “Windowing” was used to assess the
randomness of the constituents and to validate how the isotropic elastic properties were
determined. The average elastic properties obtained from the displacement based FEA of
various locally anisotropic micro-size cubes extracted from an RVE of size 100x100x100
microns showed that the overall RVE response was fully isotropic. The effects of domain size,
degree of hydration, kinematic and periodic boundary conditions, domain sampling
techniques, local anisotropy, particle size distribution (PSD), and random microstructure on
elastic properties are studied.

iii
DEDICATION
This thesis is simply dedicated to my parents.
iv
LIST OF ABERAVIATIONS ANS SYMBOLS
FEA Finite Element Analysis
FEM Finite Element Method
RVE Representative Volume Element
AEH Asymptotic Expansion Homogenization
KBC Kinematic Boundary Condition
PBC Periodic Boundary Condition
PSD Particle Size Distribution
C-S-H Calcium Oxide- Silicate Oxide- Hydroxide
ITZ Interfacial Transition Zone
HD High Density
LD Low Density
w/c Water Cement
2D Two Dimensional
3D Three Dimensional

v
DOH, α Degree of Hydration
PMD Periodic Microstructure Domain
STDEV Standard Deviation
RUS Resonant Ultrasound Spectroscopy
MM Multiscale Modeling
F,E,V Face, Edge and Vertex Respectively Related to PBC formulations
V Voight
R Reuss
X Gel Space Ratio
M Million
K Kilo
m Meter
mm Millimeter
μm Micrometer
nm Nanometer
vi
GPa Giga Pascal
E Young Modulus
G Shear Modulus
K Bulk Modulus
λ Lame’s First Parameter
υ Poisson’s Ratio
U Displacement
θ Angle
L Length of RVE
ε Strain
γ Shear Strain
σ Stress
D Elastic Stiffness
C Individual Components of Stiffness Tensor
a Anisotropy
vii
V Volume
U Total Strain Energy of the RVE
δ Kronecker Delta
c Volume Concentration of Inclusion
Subscripts
Unless State Otherwise, the subscripts connote the following meaning when applied with
these variables i,j,k,1,2,3,x,y,z,o,c
i,j,k Related to Directions
1,2,3 Related to Directions
x,y,z Related to Directions
RVE Related to Representative Volume Element
o Related to Initial Values
All other notations and symbols used in formulas are described clearly in the body of
thesis.
viii
ACKNOWLEDGEMENTS
First and foremost, I would like to express my deepest gratitude and appreciation to my
advisor Dr. Arunachalam Rajendran, chair of the department of mechanical engineering. During
these two years he never deprived me from his help and support.
Also, I would like to convey my gratitude to Dr. Tezeswi Tadepalli for his help and
collaboration in this thesis.
I would like to acknowledge Mr. Dale Bentz, MCR Division, NIST, for providing guidance
on the usage of CEMHYD3D. This study was funded by a grant from the DoD-HBCUs PIRT
program and Dr. Joseph Myers serves as the program manager for the US Army Research Office,
RTP, NC, USA. The AEH simulations were performed at the DoD Supercomputer Center at
Aberdeen Proving Ground, MD. Authors are grateful for the assistance provided by Dr. Brian
Hopkins and Mr. Benjamin Pharr at MCSR.
At last, I would like to take this opportunity to express my gratitude to my parents.
ix
TABLE OF CONTENTS
ABSTRACT………………………………………………………………………………………ii DEDICATION…………………………………………………………………………...……….iii LIST OF ABBREVIATION AND SYMBOLS……………………………………………….…iv ACKNOWLEDGMENTS………………………………………………………………………viii LIST OF TABLES…………………………………………………………………………...……x LIST OF FIGURES…………………………………………………………………………..…..xi 1. INTRODUCTION……………………………………………………………………………...1 2. BACKGROUND……………………………………………………………………………….3 3. METHODOLOGY……………………………………………………………………………..8 3.1. Representative Volume Elements…………………………………………………………….8 3.2. Generation of Cementitious RVE…………………………………………………………...10 3.3. FEA Based Microstructure Modeling……………………………………………………….18 3.4. Boundary Conditions………………………………………………………………………..20 3.5. Windows…………….............................................................................................................24 3.6. Homogenization……………………………………………………………………….…….25 4. RESULTS………………………………………………………………………………..……29 4.1. RVE Deformation in ABAQUS Simulation…………………………………………….…..29 4.2. Microstructure Based Homogenization……………………………………………………..32 4.2.1. Periodic Microstructure Domain (PMD)………………………………………………….32 4.2.2. Windows…………………………………………………………………………………..41 4.3. Rule of Mixtures Based Homogenization………………………………………………...…45 4.4. Compressive strength of Hardened Cement Paste…………………………………………..48 4.5. Computational Resources…………………………………………………………………...50 5. CONCLUSION AND FUTURE WORK……………………………………………………..52 LIST OF REFERENCES……………………………………………………………………...…53 APPENDIX……………………………………………………………………………..………..59 VITA……………………………………………………………………………………………..64
x
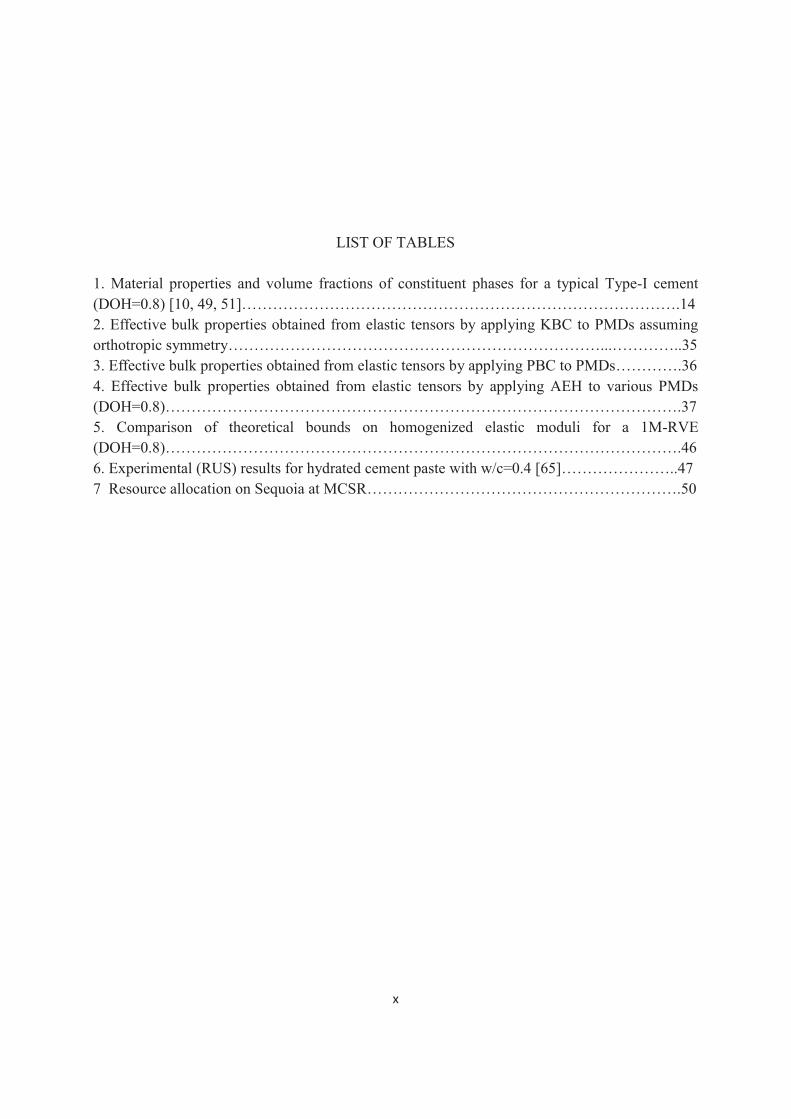
LIST OF TABLES
1. Material properties and volume fractions of constituent phases for a typical Type-I cement (DOH=0.8) [10, 49, 51]………………………………………………………………………….14 2. Effective bulk properties obtained from elastic tensors by applying KBC to PMDs assuming
orthotropic symmetry………………………………………………………………...…………..35 3. Effective bulk properties obtained from elastic tensors by applying PBC to PMDs………….36 4. Effective bulk properties obtained from elastic tensors by applying AEH to various PMDs (DOH=0.8)……………………………………………………………………………………….37 5. Comparison of theoretical bounds on homogenized elastic moduli for a 1M-RVE (DOH=0.8)……………………………………………………………………………………….46 6. Experimental (RUS) results for hydrated cement paste with w/c=0.4 [65]…………………..47 7 Resource allocation on Sequoia at MCSR…………………………………………………….50
xi
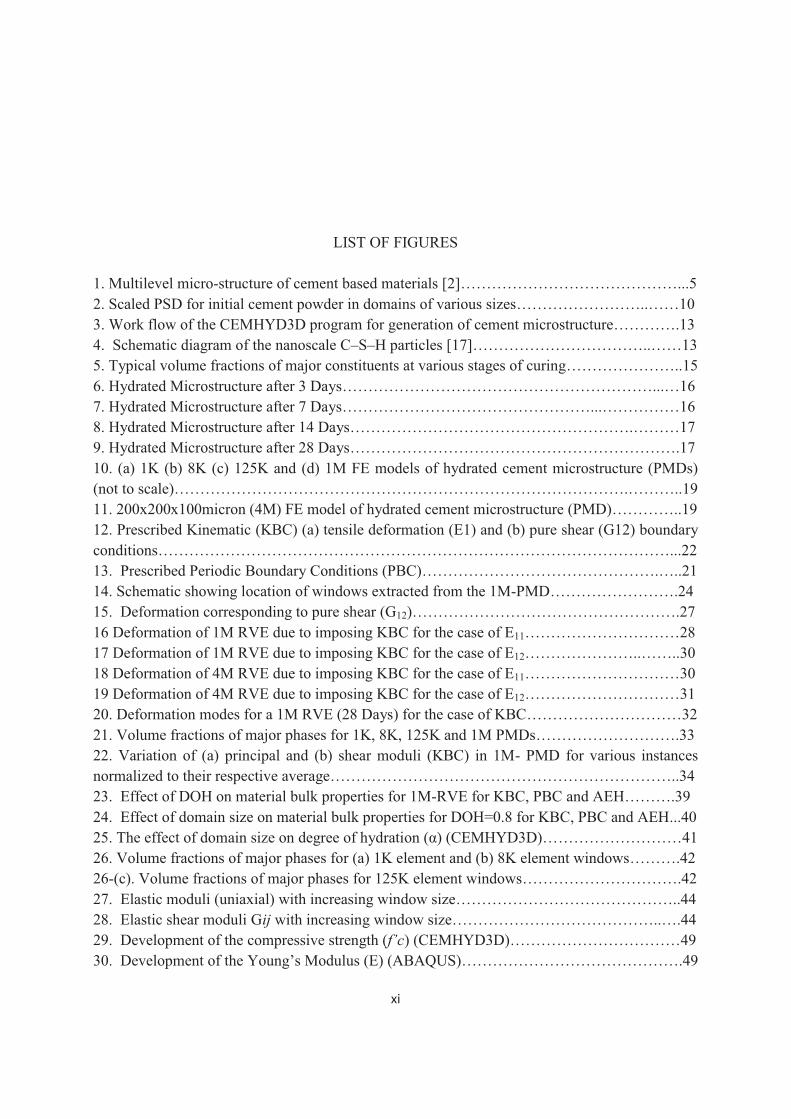
LIST OF FIGURES
1. Multilevel micro-structure of cement based materials [2]……………………………………...5 2. Scaled PSD for initial cement powder in domains of various sizes……………………..……10 3. Work flow of the CEMHYD3D program for generation of cement microstructure………….13 4. Schematic diagram of the nanoscale C–S–H particles [17]……………………………..……13 5. Typical volume fractions of major constituents at various stages of curing…………………..15 6. Hydrated Microstructure after 3 Days……………………………………………………...…16 7. Hydrated Microstructure after 7 Days…………………………………………...……………16 8. Hydrated Microstructure after 14 Days……………………………………………….………17 9. Hydrated Microstructure after 28 Days……………………………………………………….17 10. (a) 1K (b) 8K (c) 125K and (d) 1M FE models of hydrated cement microstructure (PMDs) (not to scale)…………………………………………………………………………….………..19 11. 200x200x100micron (4M) FE model of hydrated cement microstructure (PMD)…………..19 12. Prescribed Kinematic (KBC) (a) tensile deformation (E1) and (b) pure shear (G12) boundary conditions………………………………………………………………………………………...22 13. Prescribed Periodic Boundary Conditions (PBC)……………………………………….…..21 14. Schematic showing location of windows extracted from the 1M-PMD…………………….24 15. Deformation corresponding to pure shear (G12)…………………………………………….27 16 Deformation of 1M RVE due to imposing KBC for the case of E11…………………………28 17 Deformation of 1M RVE due to imposing KBC for the case of E12…………………..……..30 18 Deformation of 4M RVE due to imposing KBC for the case of E11…………………………30 19 Deformation of 4M RVE due to imposing KBC for the case of E12…………………………31 20. Deformation modes for a 1M RVE (28 Days) for the case of KBC…………………………32 21. Volume fractions of major phases for 1K, 8K, 125K and 1M PMDs……………………….33 22. Variation of (a) principal and (b) shear moduli (KBC) in 1M- PMD for various instances normalized to their respective average…………………………………………………………..34 23. Effect of DOH on material bulk properties for 1M-RVE for KBC, PBC and AEH……….39 24. Effect of domain size on material bulk properties for DOH=0.8 for KBC, PBC and AEH...40 25. The effect of domain size on degree of hydration (α) (CEMHYD3D)………………………41 26. Volume fractions of major phases for (a) 1K element and (b) 8K element windows……….42 26-(c). Volume fractions of major phases for 125K element windows………………………….42 27. Elastic moduli (uniaxial) with increasing window size……………………………………..44 28. Elastic shear moduli Gij with increasing window size…………………………………..….44 29. Development of the compressive strength (f’c) (CEMHYD3D)……………………………49 30. Development of the Young’s Modulus (E) (ABAQUS)…………………………………….49

xii
31. Wall clock time (hr) vs RVE size……………………………………………….......………51

1
CHAPTER 1
INTRODUCTION
Cementitious materials are composite materials mixed with aggregate and water to form
concrete. The cement paste plays the role of a matrix in concrete. Cementitious materials are very
complex with properties at several length scales which affect the overall behavior. Cement contains
particles such as clinkers and aggregate. When these particles are mixed with water, they undergo
hydration, resulting in the formation of new materials. The age of cementitious material is an
important parameter in defining its properties, as the properties change when new materials are
generated.
Young’s modulus and shear modulus are two important mechanical properties in cementitous
materials that change over time. Calcium silicate hydrate (CSH) gel is one of the main products of
hydration. As the percentage of CSH increases over time, the percentage of water decreases. The C-
S-H gel formation between the particles creates a percolation network that can increasingly support
the mechanical stresses in the microstructure as hydration proceeds. This phenomenon translates
into a corresponding increase in the moduli over time.
The CEMHYD3D suite of programs simulate the evolution of the micro-structure of the
cement paste during hydration.. MATLAB software can be used to export the CEMHYD3D output
to ABAQUS, resulting in the simulation of microscaled cement paste representative volume element
(RVE). This RVE accurately captures the details of all the consistent materials, their size and particle
distribution.
2
The objective of this study is to understand and estimate the effects of heterogeneity on
cement strength through microscopic modeling of its deformation behavior.
In order to obtain the young’s and shear modulus, boundary conditions need to be imposed on
the RVE while applying elementary deformations. Two boundary conditions considered in this study
are kinematic boundary condition (KBC) and periodic boundary condition (PBC).
Overall, this study shows that young’s and shear modulus increase over time in a cement
paste RVE, and there is a negligible difference between the results obtained from imposing KBC and
PBC. Moreover, the results obtained from KBC and PBC are compared with another method,
asymptotic expansion homogenization (AEH), and KBC and PBC results are in good agreement with
the results of AEH. The results show that the heterogeneous cement behaves effectively like an
isotropic solid due to the random distribution of the various cement constituents.
In chapter 2, the background of cement will be discussed. Generation of RVE with
cemhyd3d and ABAQUS with appropriate and complex boundary conditions will be discussed in
chapter 3. Different results of windows and periodic domain size are shown in chapter 5. Finally,
conclusion and future work will be presented in chapter 6.

3
CHAPTER 2
BACKGROUND
Multiscale modeling of materials is an emerging research area to tailor material properties.
With the advent of scalable computing capabilities, it is now possible to model a large molecular and
representative volume element (RVE) based material systems. The individual elastic properties and
density for clinkers, unhydrated and hydrated products are usually estimated through molecular
dynamics simulations. These properties are then utilized in the microscopic level RVE simulations.
In this paper, we are reporting a methodology for computing the elastic properties of heterogeneous
C-S-H (calcium oxide- silicate oxide- hydroxide) based multi-phase cementitious materials. The
primary focus of this paper is to predict homogenized properties at macro-levels using micro
mechanics based models. This paper focuses on the determination of elastic properties for hydrated
cement paste from un-hydrated constituents when small strain quasi-static loading conditions are
applied to micro-scale domains.
Typically, Portland cement is often used, in structural concrete along with, sand (fine
aggregate), coarse aggregate and solidifies over time because of the addition of water. The tailoring
of macroscopic properties (mainly strength) is dependent on its structural applications. The tailored
mechanical proprieties for cement-based material are traditionally evaluated at the engineering
scale/macroscopic level. However, the strength measured at the macro-level is affected by the
chemical phase transformations due to hydration, at the molecular/nano level and the evolution of the
microstructure.
4
Cement is comprised of several constituents that chemically react with the addition of water
and uses its covalent bonding mechanisms to bind materials together. When limestone and clay are
fused together at 1450 0C, clinker nodules are formed. The clinker is typically comprised of
tricalcium silicate (C3S), dicalcium silicates (C2S), tricalcium aluminates (C3A), calcium
ferroaluminates (C4AF), magnesium oxide (C4A3S), calcium silicate hydrate (C3S2H3), and, gypsum
(CSH2)3, shown in Table 1. The tricalcium silicates are responsible for the strength development
from 0 to 28 days. The dicalcium silicates are responsible for the strength development after 28 days.
The tricalcium aluminates can cause to rapid setting of the cement if not controlled, leading to
excessive heating and microcracking. The calcium ferroaluminate is the source of grey color of
cement and contributes very slightly to strength gain. The magnesium oxides if not properly
minimized can lead to unstable/unsound cements. The fused clinker is then mixed with a small
percentage of gypsum (calcium sulfate) and ground down to a fine granular powder that forms
cement. The addition of the gypsum to the clinker is used to control the rate of setting and influences
the rate of strength development. The C-S-H is the reaction product formed during hydration of
cement and is the most important constituent which binds together all constituent material particles.
At least four different length scales (Fig.1) of the constituent material microstructure that affects the
properties and loading behavior of concrete have been cited in the literature for the purpose of
mechanical analysis [1, 2, 3, and 4].

5
Figure 1. Multilevel micro-structure of cement based materials [2]
These four different configurations for the purposes of mechanical analysis are defined to be:
Level 1 (C-S-H level): At this level, C-S-H exists in two different forms. High density (HD) or low
density (LD) C-S-H are present with two distinctive elastic properties [5, 6, 7, 8] due to different
packing densities of the same fundamental nanometer scale particles of C-S-H [9].The morphology
and volume fraction varies depending on water-cement (w/c) ratio. This level of a characteristic
length scale of 10-8 – 10-6 m is the smallest material length scale that is at present accessible by
mechanical testing, i.e., nano-indentation. Research shows that fifty to sixty percent of the hydrated
product that is observed in the cement paste is the C-S-H gel [10]. The C-S-H gel is amorphous and
its atomic structure is not clearly understood. It is believed that C-S-H gel nanostructure is
responsible for controlling the engineering properties such as cohesion and strength of cement paste.
In the last twenty years progress has been made towards characterizing the behavior of C-S-H gel
[11-17], but substantial work is still needed in the characterization of its complex structure.
FEA and lattice based
RVE modeling
MD simulation
Homogenization and
FEA Modeling
6
Level 2 (Cement paste level): Homogeneous C-S-H with large CH crystals, aluminates, cement clinker
inclusions, water. Some capillary porosity may be present depending on the water/cement ratio.
Percolation threshold is defined at this scale. The characteristic length scale at this level is 10-6 – 10-4
m. This scale is the focus of micromechanical modeling in the current study.
Level 3(Mortar level): Sand particles embedded in a homogenous cement matrix paste. Interfacial
Transition Zone (ITZ) must be considered as a separate phase [6]. The characteristic length scale at
this level is 10-3 – 10-2 m.
Level 4 (Concrete level): Concrete is a composite material at the structural level and consists of
aggregates with ITZ embedded in a homogeneous mortar matrix. The characteristic length scale at
this level is 10-2 – 10-1 m. The homogenization modeling approaches at this scale characterize this
level as a three-phase material compound of aggregates embedded in a continuous homogenous
mortar matrix and an ITZ.
Starting with the C-S-H colloids, each higher level configuration is built upon an agglomerated
configuration of several units of the immediate lower level configurations. This is also known as the
hierarchical approach. The mechanical behavior at each level is thus impacted by the clustered
configuration of lower length scale constituents. In addition to the traditional material systems, new
cementitious/concrete material systems consisting of nano fibers, nano particles, nano foams, etc,
have also been considered and have demonstrated to have improved performance for ballistic and
shock loading conditions. The presence of these nanomaterial configurations further influences the
macro material properties and their behavior under loading conditions [5-9, 17-24]. Since C-S-H
colloids are the building blocks of various cementitious materials that can consist of nano fibers,
nano particles, nano foams, etc, the present work focuses on determining the fundamental elastic
properties of cement using a voxel based FEM approach at the microscale. This approach can
provide a basis for the analysis and comparison between the effects of nano-components on material

7
properties. The ultimate goal is to utilize this approach for designing high strength cement with
various additives for infrastructure protection.
8
CHAPTER 3
METHODOLOGY
3.1. Representative Volume Elements
In order to quantify the role of hydration kinetics on material constituents and the effect of
the microstructure in relation to the macro-scale mechanical behavior of cementitious materials; the
properties need to be determined at the micro length scales. In recent years there has been an
intensive research activity devoted to describing the cementitious materials by computational means
[10, 25-40]. At the micro-level the representative volume approach is widely used due to the
flexibility and applicability of this method to various physical processes at the micro-scale, such as
chemical kinetics, electrical and thermal conductivity, as well as linear and nonlinear elastic
properties.
The representative volume element (RVE) is defined as the smallest volume of material that
captures the global characteristics of the material. Random results for the overall properties of the
material will be obtained if the tested volumes are smaller than this statistically representative
subdomain of the microscopic geometry. Such a volume must be sufficiently large to allow a
meaningful sampling of the micro-scale stress and strain fields and be sufficiently small for the
influence of macroscopic gradients to be negligible and for an analysis of these micro fields to be
possible. One of the major objectives of micromechanics is to express in a rigorous form the
9
continuum quantities associated with an infinitesimal material element as a function of the
parameters that characterize its microstructure [41-43]. In general most concrete structures are
macroscopic with least dimensions in the order of tens of centimeters or more. The largest aggregates
have sizes in the order of a few centimeters. Concrete members are typically designed such that the
macroscopic gradients are not significant over dimensions below the centimeter scale. Steep
gradients are not generally acceptable in design practice. The 1M and 4M RVEs considered in this
study are of the order of hundreds of microns (0.1-0.2 mm) which is small enough for them to be
considered infinitesimal.
Alternatively an RVE may be defined as a volume that shows the same overall material
properties irrespective of the boundary conditions applied [44, 45]. This definition of an RVE, gives
rise to a dependence of the size of the RVE on the physical property considered and on the relative
phase contrast. This means that the size of the RVE depends on the mechanical, physical or electrical
property being analyzed. As noted by Nemat-Nasser [46], it is the dimension relative to the
microstructure essential for a given problem that is important for the size of an RVE. For example,
the RVE for thermal conductivity may be different from the RVE for elastic properties [47]. For
elastic materials, the RVE exists and one can determine the size of the RVE. However, for other
applications, such as the case of softening materials, the RVE may not exist [48].
10
3.2. Generation of Cementitious RVE
The software package, CEMHYD3D V.3, developed by NIST researchers, was used to
simulate the hydration process and formation of the digitally generated micro-structure for a typical
Type-I general purpose cement [49]. The software allows creation of a starting 3D microstructure
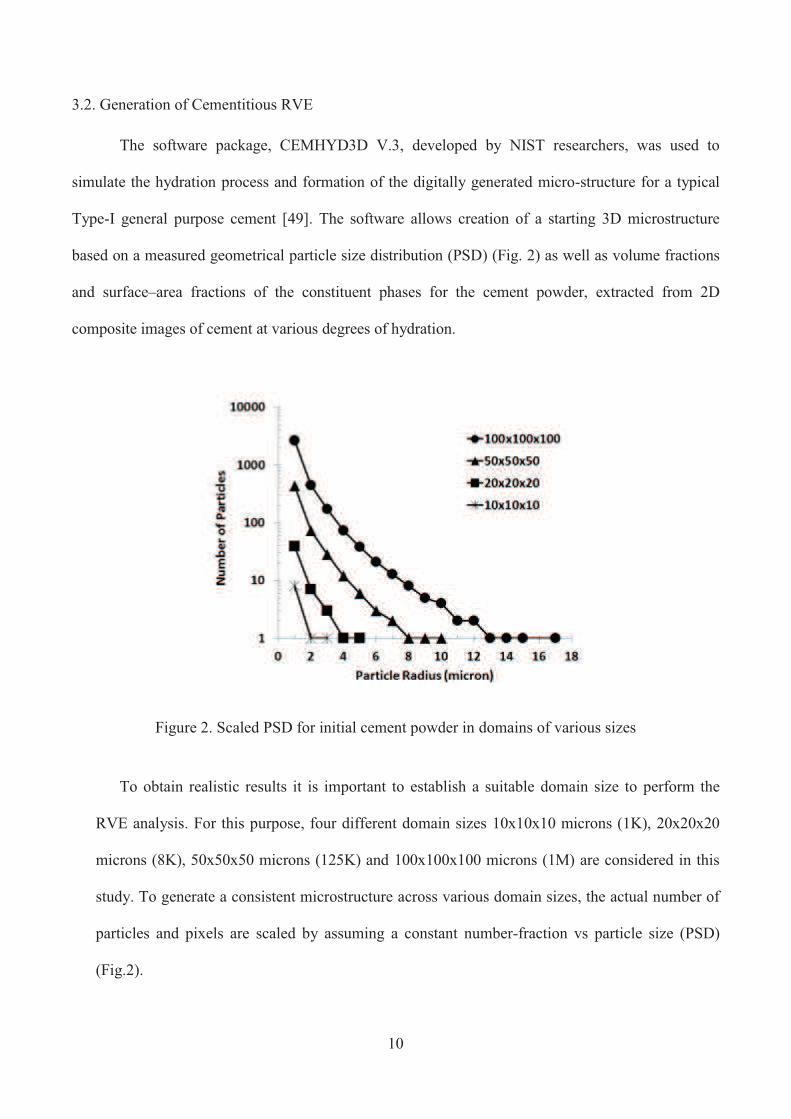
based on a measured geometrical particle size distribution (PSD) (Fig. 2) as well as volume fractions
and surface–area fractions of the constituent phases for the cement powder, extracted from 2D
composite images of cement at various degrees of hydration.
Figure 2. Scaled PSD for initial cement powder in domains of various sizes
To obtain realistic results it is important to establish a suitable domain size to perform the
RVE analysis. For this purpose, four different domain sizes 10x10x10 microns (1K), 20x20x20
microns (8K), 50x50x50 microns (125K) and 100x100x100 microns (1M) are considered in this
study. To generate a consistent microstructure across various domain sizes, the actual number of
particles and pixels are scaled by assuming a constant number-fraction vs particle size (PSD)
(Fig.2).

11
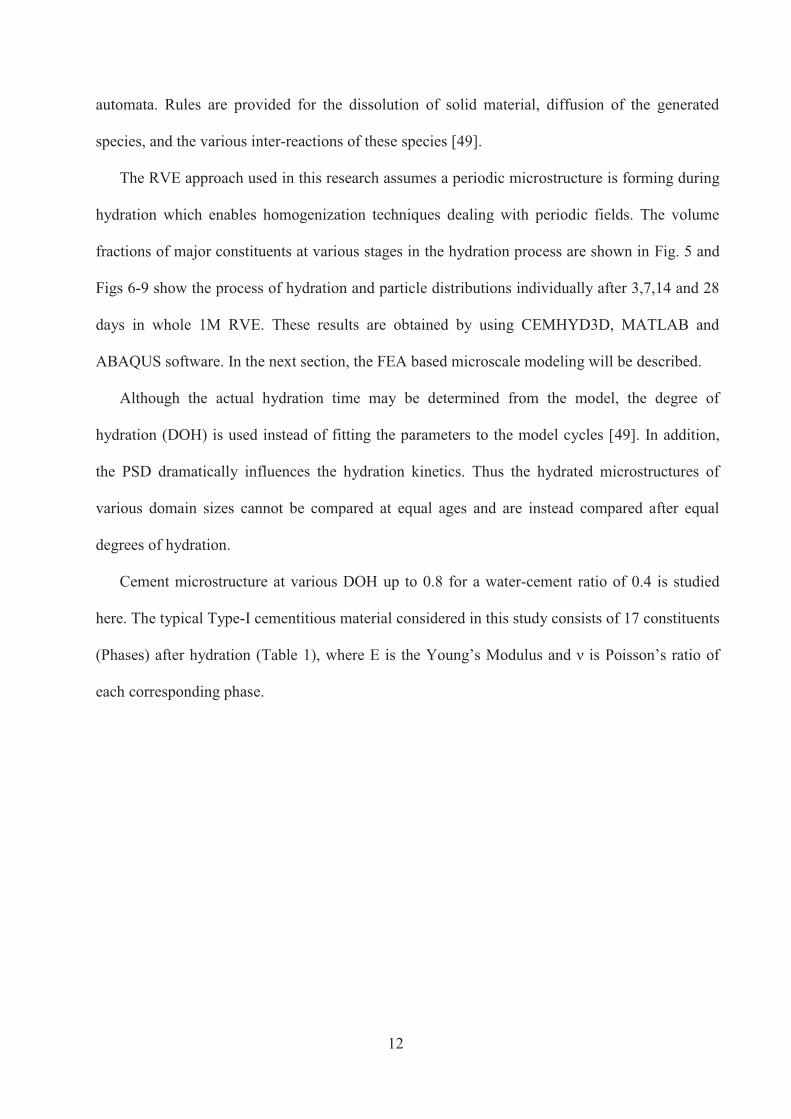
The overall work flow for generating the cement microstructure using CEMHYD3D is shown
in Fig. 3. An initial random 3D periodic microstructure is reconstructed with the help of
autocorrelation functions and contains typically four cement clinker minerals and forms of
calcium sulfate, all as digital spherical particles [49]. Digitized spherical particles of a user-
specified PSD are placed into a 3-D computational volume, typically 100 voxels on a side. Each
voxel is 1 micron on a side implying that features smaller than this cannot be resolved. However,
in the models considered in this study, typical particle sizes range from 1 to 35 microns in
diameter, so that most of the factors governing the interphase phenomena can be represented
accurately.
Periodic boundaries are employed such that a particle that extends outward through one or
more faces of the 3-D microstructure is completed extending inward through the opposite face(s).
Such domains will be hence forth referred to as periodic microstructure domains (PMD) in this
work to distinguish them from periodic boundary conditions (PBC) that are applied to both PMD
and windows (Section 4). Digitized spherical particles are used to approximate the complex 3-D
shapes of actual cement particles. Previous studies [50] have indicated that this approximation is
adequate if the actual cement PSD and phase volume and surface fractions are maintained in the
3-D spherical particle image.
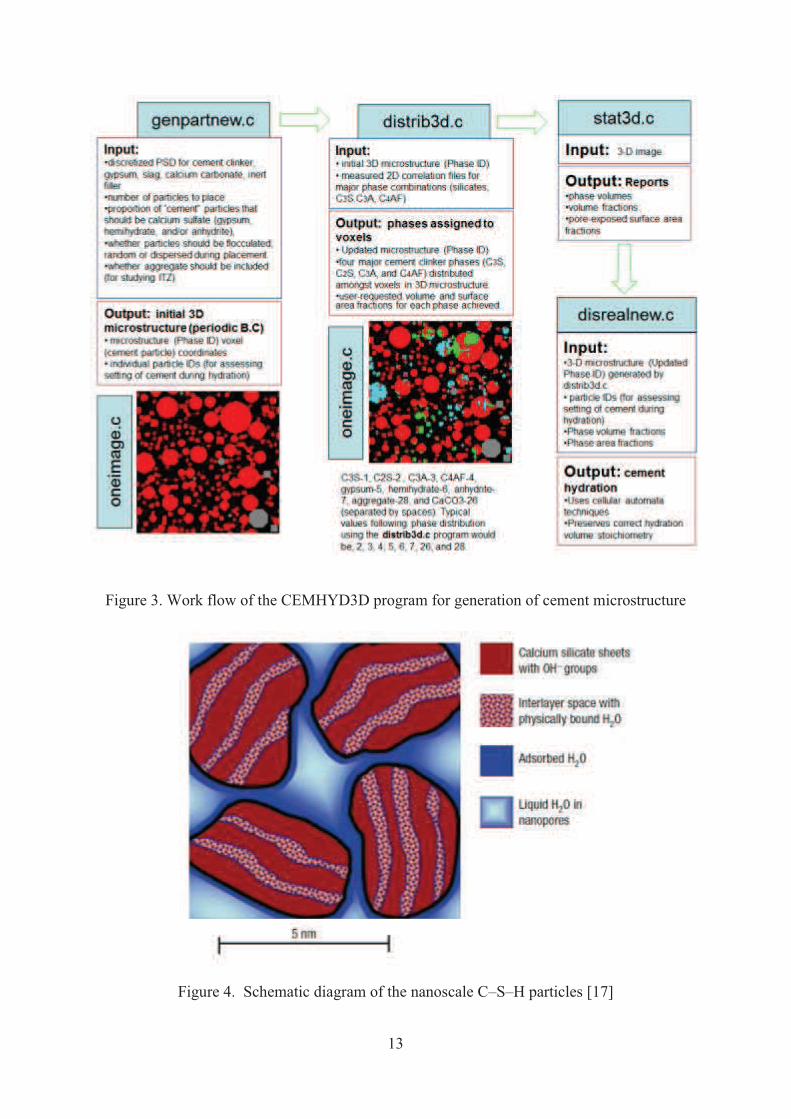
Cement hydration products are formed on the grains exposed to water contact and they
nucleate in the available volumetric space along with the bound water, and free pore space. In
CEMHYD3D, the capillary porosity is composed of the water-filled porosity and the empty
porosity. The empty porosity is created due to the ongoing chemical shrinkage that accompanies
cement hydration. A schematic of the nano-scale C-S-H phase that forms between the cement
clinker grains and binds them together is shown in Fig. 4. The cement products formed from the
hydration kinetic reactions are implemented in a rule-based framework similar to cellular
12
automata. Rules are provided for the dissolution of solid material, diffusion of the generated
species, and the various inter-reactions of these species [49].
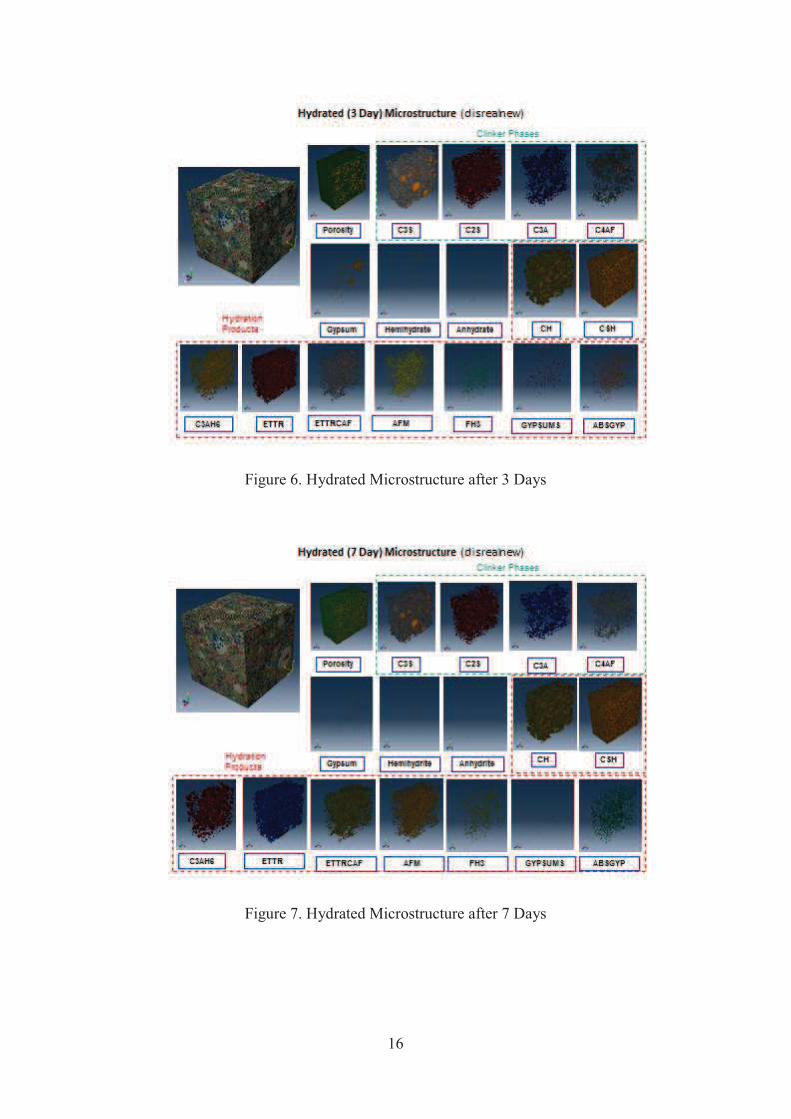
The RVE approach used in this research assumes a periodic microstructure is forming during
hydration which enables homogenization techniques dealing with periodic fields. The volume
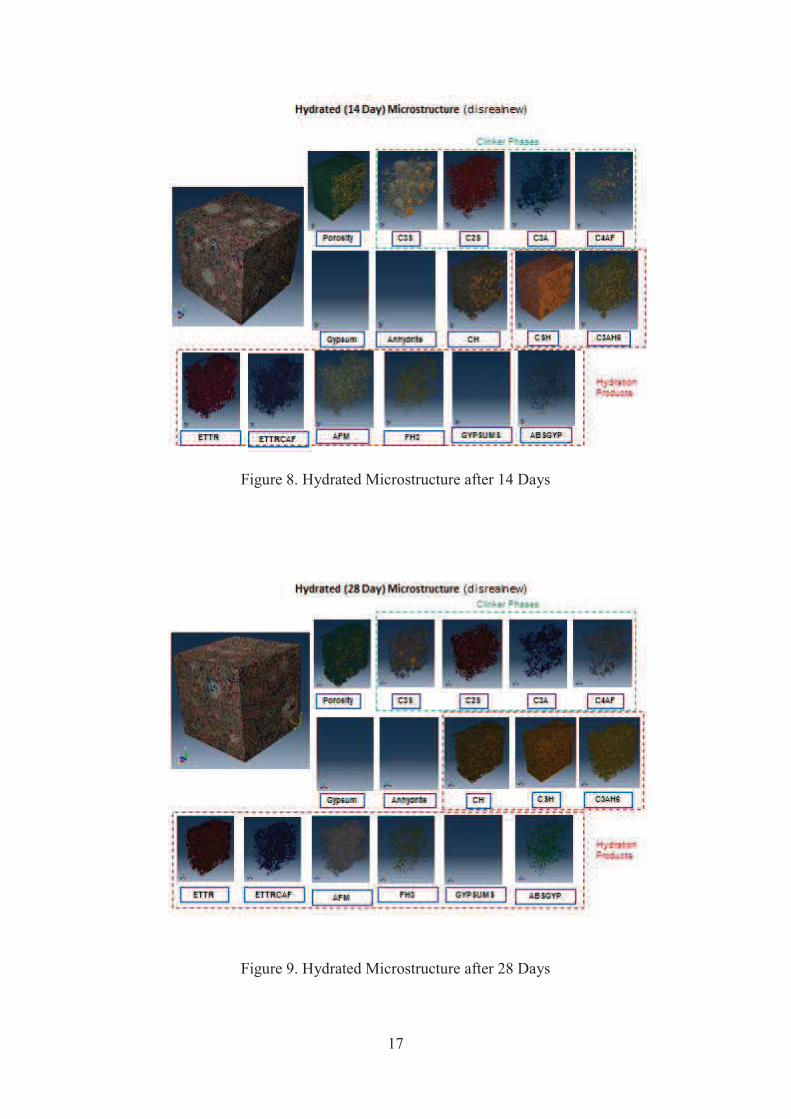
fractions of major constituents at various stages in the hydration process are shown in Fig. 5 and
Figs 6-9 show the process of hydration and particle distributions individually after 3,7,14 and 28
days in whole 1M RVE. These results are obtained by using CEMHYD3D, MATLAB and
ABAQUS software. In the next section, the FEA based microscale modeling will be described.
Although the actual hydration time may be determined from the model, the degree of
hydration (DOH) is used instead of fitting the parameters to the model cycles [49]. In addition,
the PSD dramatically influences the hydration kinetics. Thus the hydrated microstructures of
various domain sizes cannot be compared at equal ages and are instead compared after equal
degrees of hydration.
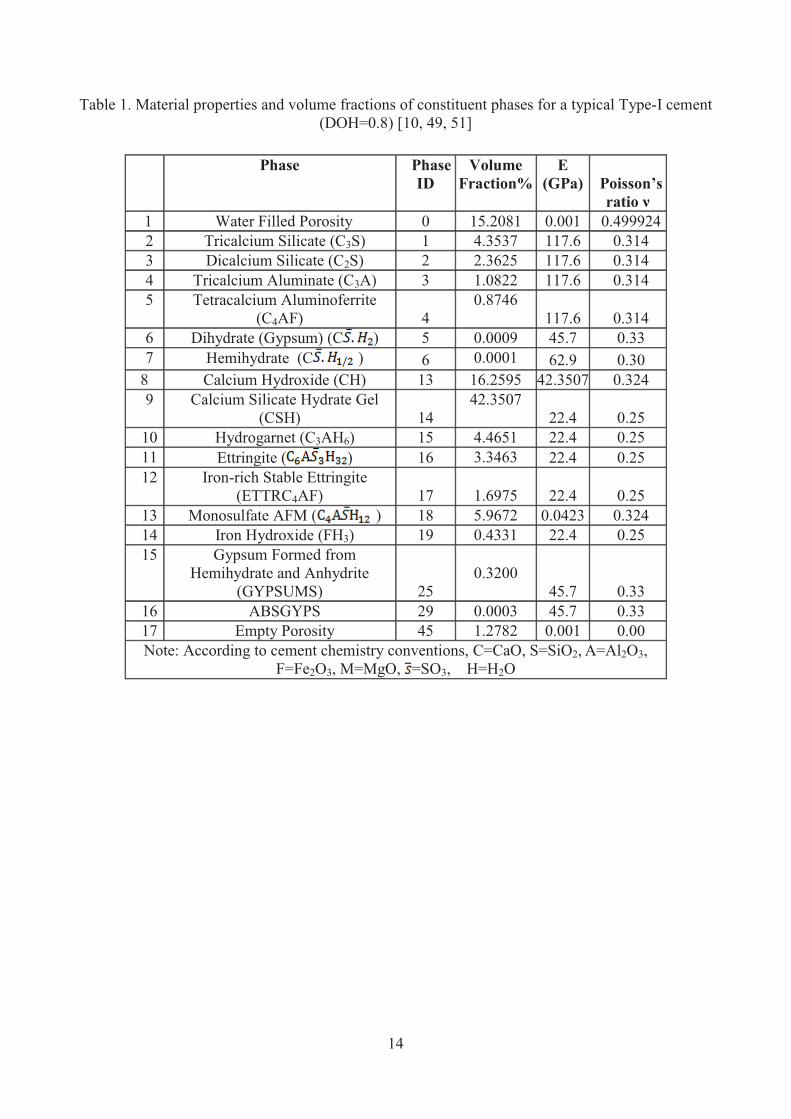
Cement microstructure at various DOH up to 0.8 for a water-cement ratio of 0.4 is studied
here. The typical Type-I cementitious material considered in this study consists of 17 constituents
(Phases) after hydration (Table 1), where E is the Young’s Modulus and ν is Poisson’s ratio of
each corresponding phase.
13
Figure 3. Work flow of the CEMHYD3D program for generation of cement microstructure
Figure 4. Schematic diagram of the nanoscale C–S–H particles [17]
14
Table 1. Material properties and volume fractions of constituent phases for a typical Type-I cement (DOH=0.8) [10, 49, 51]
Phase
Phase
ID
Volume
Fraction%
E
(GPa)
Poisson’s
ratio ν
1 Water Filled Porosity 0 15.2081 0.001 0.499924 2 Tricalcium Silicate (C3S) 1 4.3537 117.6 0.314 3 Dicalcium Silicate (C2S) 2 2.3625 117.6 0.314 4 Tricalcium Aluminate (C3A) 3 1.0822 117.6 0.314 5 Tetracalcium Aluminoferrite
(C4AF) 4 0.8746
117.6 0.314 6 Dihydrate (Gypsum) (C ) 5 0.0009 45.7 0.33 7 Hemihydrate (C ) 6 0.0001 62.9 0.30
8 Calcium Hydroxide (CH) 13 16.2595 42.3507 0.324 9 Calcium Silicate Hydrate Gel
(CSH) 14 42.3507
22.4 0.25 10 Hydrogarnet (C3AH6) 15 4.4651 22.4 0.25 11 Ettringite ( ) 16 3.3463 22.4 0.25 12 Iron-rich Stable Ettringite
(ETTRC4AF) 17
1.6975 22.4 0.25 13 Monosulfate AFM ( ) 18 5.9672 0.0423 0.324 14 Iron Hydroxide (FH3) 19 0.4331 22.4 0.25 15 Gypsum Formed from
Hemihydrate and Anhydrite (GYPSUMS) 25
0.3200
45.7 0.33 16 ABSGYPS 29 0.0003 45.7 0.33 17 Empty Porosity 45 1.2782 0.001 0.00 Note: According to cement chemistry conventions, C=CaO, S=SiO2, A=Al2O3,
F=Fe2O3, M=MgO, =SO3, H=H2O

15
Figure 5. Typical volume fractions of major constituents at various stages of curing
16
Figure 6. Hydrated Microstructure after 3 Days
Figure 7. Hydrated Microstructure after 7 Days
17
Figure 8. Hydrated Microstructure after 14 Days
Figure 9. Hydrated Microstructure after 28 Days

18
3.3. FEA Based Microstructure Modeling
Charmrova [52] focused on the prediction of effective elastic properties using FEA based on a
vector microstructural model, specifically applied to early age microstructure. The FEA intense work
was mainly to capture the hydration processes accurately, as well as to determine properties of cement
at an early age (upto DOH=0.45). In addition the effects of flocculation, water/cement ratio, PSD and
number of hydrate clusters, on elastic properties were studied. However, in the present work, the
focus is mainly to capture the effects of domain size, degree of hydration, kinematic and periodic
boundary conditions, domain sampling techniques, local anisotropy, particle size distribution, and
random microstructure on elastic properties are studied. The micro-structure voxel information
generated by CEMHYD3D (Fig. 3) is imported into the general purpose ABAQUS® finite element
code using an in-house developed Matlab® code and modeled using continuum hexahedral (C3D8)
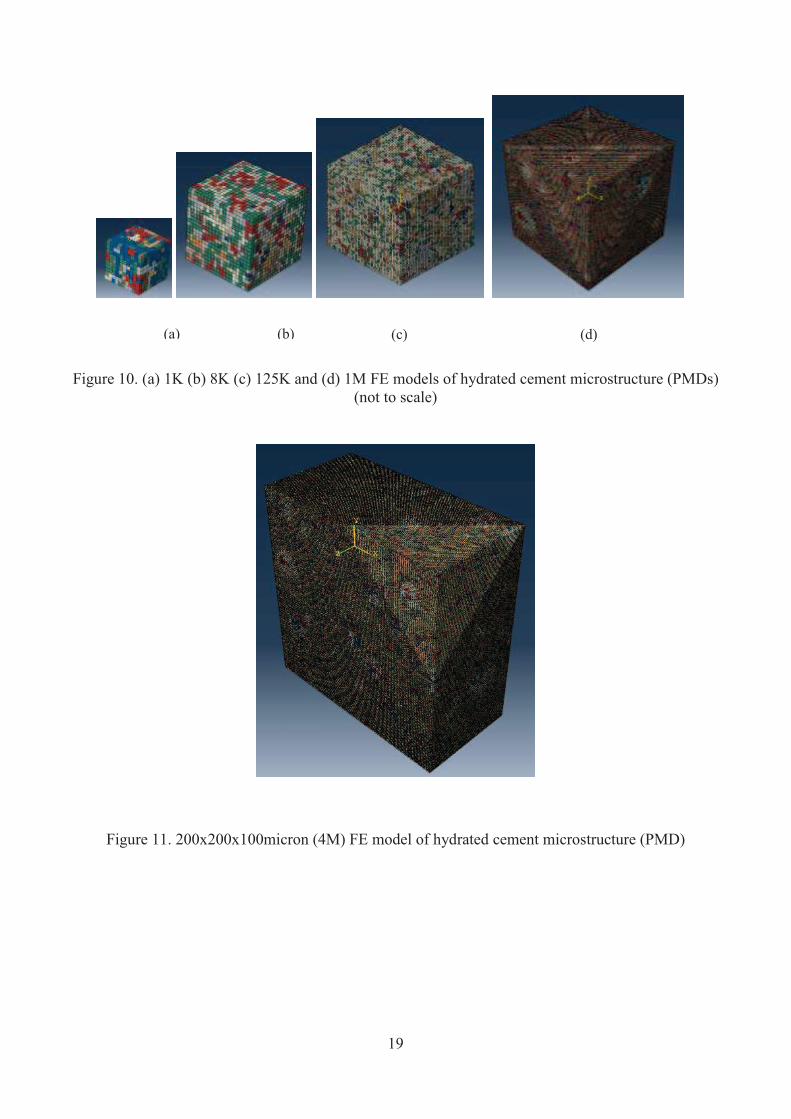
elements to generate domains of various dimensions (Figs.10-11).
19
Figure 10. (a) 1K (b) 8K (c) 125K and (d) 1M FE models of hydrated cement microstructure (PMDs) (not to scale)
Figure 11. 200x200x100micron (4M) FE model of hydrated cement microstructure (PMD)
(a) (b) (c) (d)

20
3.4. Boundary Conditions
The operational details of applying the appropriate boundary conditions to the microstructure
domains are briefly reported in published literature [10, 49, 51-55]. In this section boundary
conditions and the issues encountered during modeling are described in sufficient detail to be
reproducible using ABAQUS®. The windows and PMDs are subjected to various prescribed tension
and shear deformation modes in order to generate the effective elastic tensor of the cementitious
material at various scales. Applying the traction/force boundary conditions was found to be non-
trivial for the heterogeneous domains since the surface of the cementitious domain also contains
porosity which has a modulus of zero. Unfortunately, when a surface traction is applied to a face
containing pores on the surface; it results in very large artificial local deformations on the surface of
the heterogeneous domain. Previous studies [56] have recommended using a surface layer of
elements with a modulus and Poisson’s ratio which is the average of all constituent phases. However,
this approach may significantly change the relative volume fractions of the various phases, which
needs to be preserved for a highly heterogeneous cementitious material. Alternative approaches for
applying force boundary conditions are being considered, however, only prescribed displacement
(KBC) and periodic boundary conditions (PBC) are described here.
Initially, cubic homogeneous domains of size 1K, 8K, 125K and 1M were subjected to
various boundary conditions and the deformations were compared against theoretical values to
confirm the absence of any meshing artifacts. Suitable boundary conditions were tested in
ABAQUS® for each mode of deformation and the ones that provided an exact match with the
theoretical values were used for further study of the heterogeneous periodic domain. In order to
generate the elastic tensor of the heterogeneous cementitious material, the periodic domain is
subjected to applied displacement boundary conditions as represented in Fig. 12(a) for axial (U1) and
in Fig. 12(b) for pure shear (U12).
21
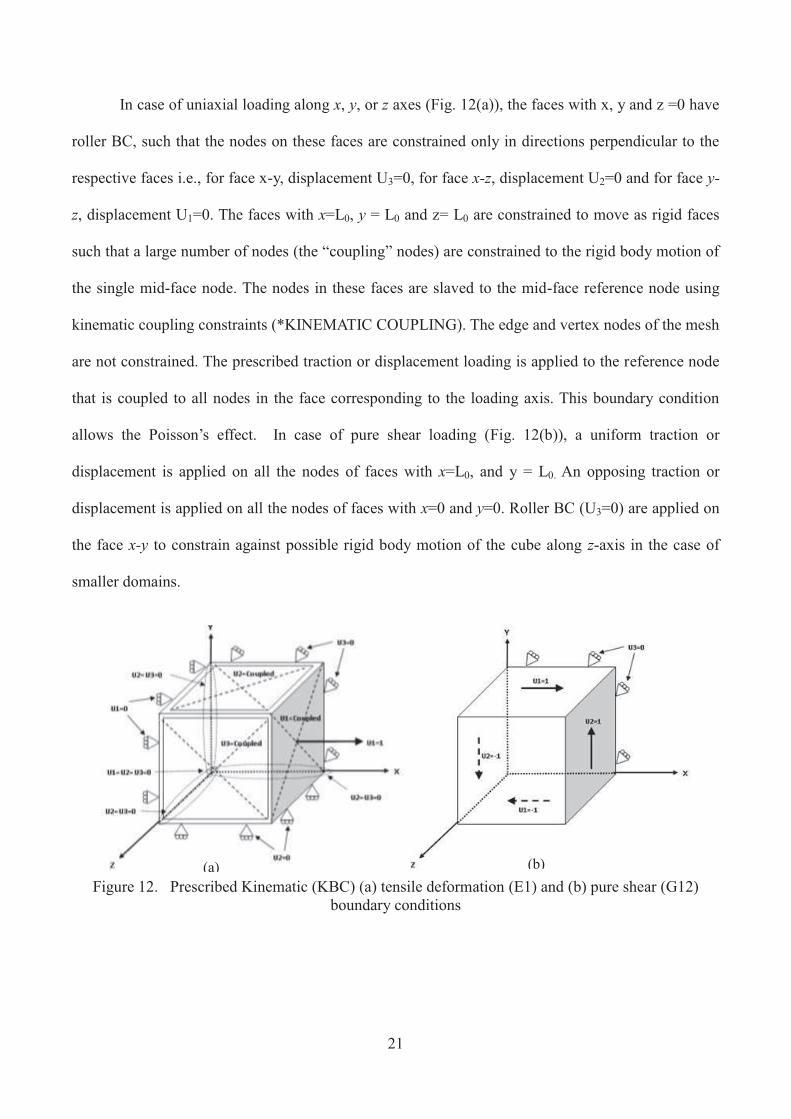
In case of uniaxial loading along x, y, or z axes (Fig. 12(a)), the faces with x, y and z =0 have
roller BC, such that the nodes on these faces are constrained only in directions perpendicular to the
respective faces i.e., for face x-y, displacement U3=0, for face x-z, displacement U2=0 and for face y-
z, displacement U1=0. The faces with x=L0, y = L0 and z= L0 are constrained to move as rigid faces
such that a large number of nodes (the “coupling” nodes) are constrained to the rigid body motion of
the single mid-face node. The nodes in these faces are slaved to the mid-face reference node using
kinematic coupling constraints (*KINEMATIC COUPLING). The edge and vertex nodes of the mesh
are not constrained. The prescribed traction or displacement loading is applied to the reference node
that is coupled to all nodes in the face corresponding to the loading axis. This boundary condition
allows the Poisson’s effect. In case of pure shear loading (Fig. 12(b)), a uniform traction or
displacement is applied on all the nodes of faces with x=L0, and y = L0. An opposing traction or
displacement is applied on all the nodes of faces with x=0 and y=0. Roller BC (U3=0) are applied on
the face x-y to constrain against possible rigid body motion of the cube along z-axis in the case of
smaller domains.
Figure 12. Prescribed Kinematic (KBC) (a) tensile deformation (E1) and (b) pure shear (G12)
boundary conditions
(a) (b)
22
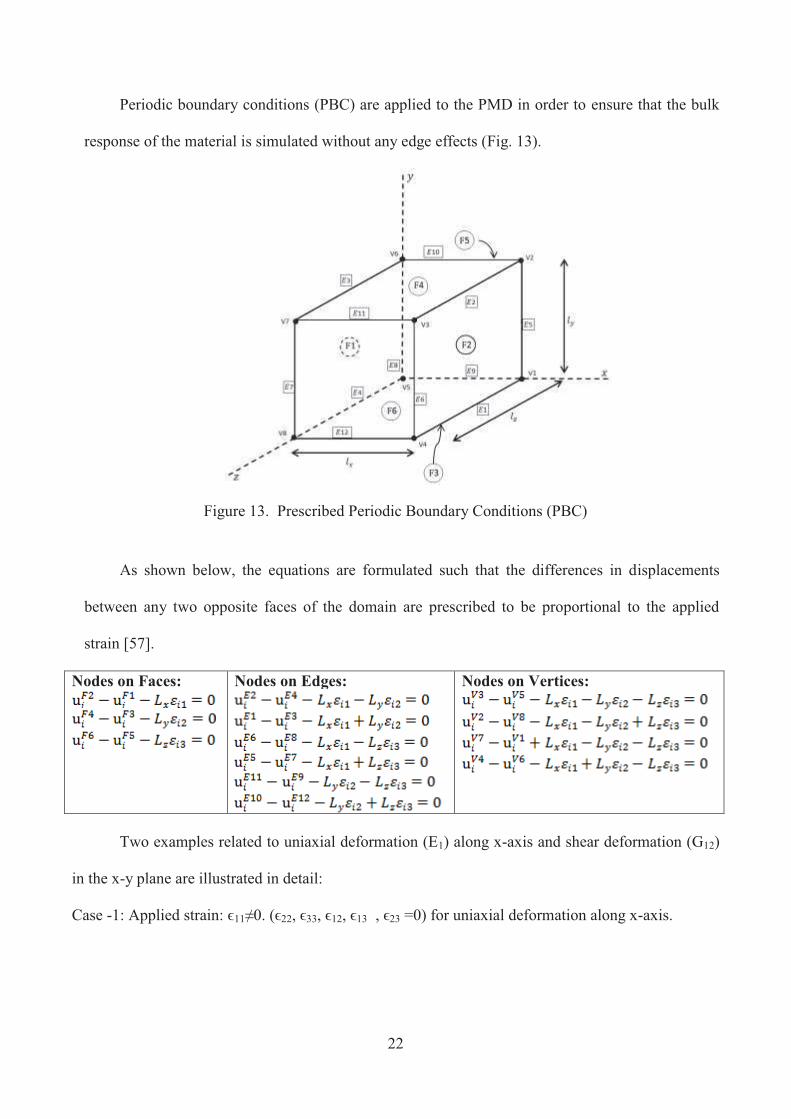
Periodic boundary conditions (PBC) are applied to the PMD in order to ensure that the bulk
response of the material is simulated without any edge effects (Fig. 13).
Figure 13. Prescribed Periodic Boundary Conditions (PBC)
As shown below, the equations are formulated such that the differences in displacements
between any two opposite faces of the domain are prescribed to be proportional to the applied
strain [57].
Nodes on Faces:
Nodes on Edges:
Nodes on Vertices:
Two examples related to uniaxial deformation (E1) along x-axis and shear deformation (G12)
in the x-y plane are illustrated in detail:
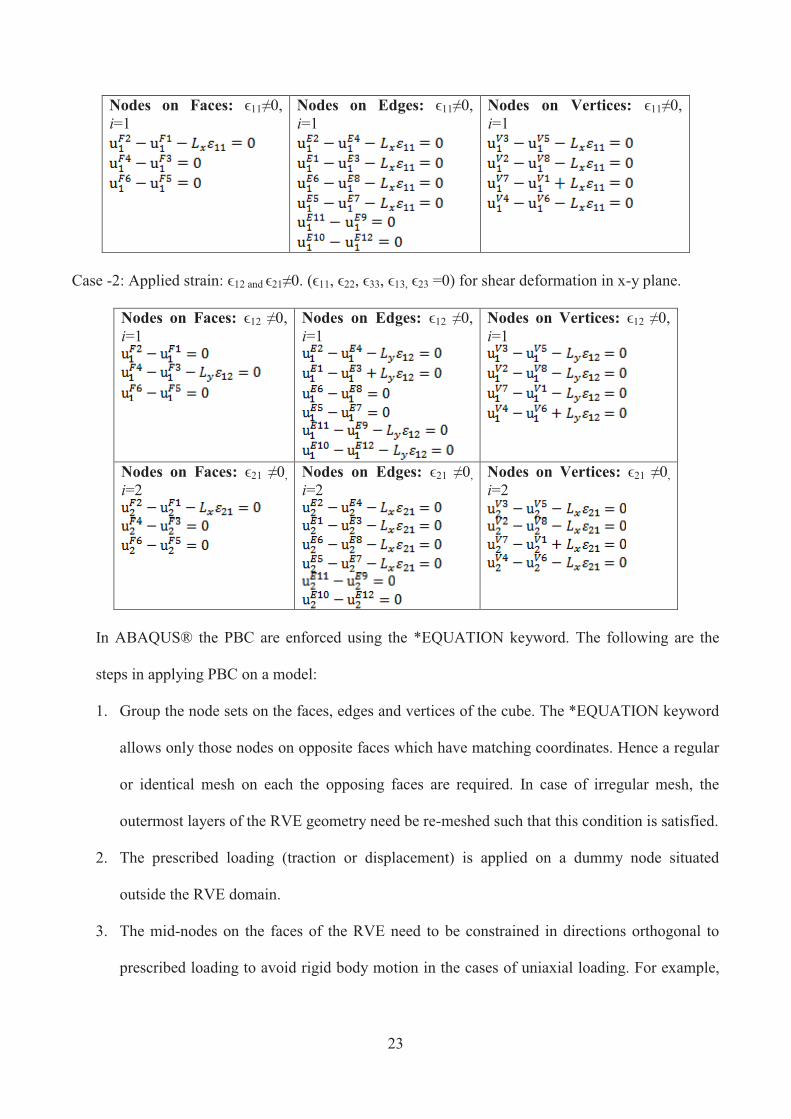
Case -1: Applied strain: ϵ11≠0. (ϵ22, ϵ33, ϵ12, ϵ13 , ϵ23 =0) for uniaxial deformation along x-axis.
23
Nodes on Faces: ϵ11≠0,
i=1
Nodes on Edges: ϵ11≠0,
i=1
Nodes on Vertices: ϵ11≠0,
i=1
Case -2: Applied strain: ϵ12 and ϵ21≠0. (ϵ11, ϵ22, ϵ33, ϵ13, ϵ23 =0) for shear deformation in x-y plane.
Nodes on Faces: ϵ12 ≠0, i=1
Nodes on Edges: ϵ12 ≠0,
i=1
Nodes on Vertices: ϵ12 ≠0, i=1
Nodes on Faces: ϵ21 ≠0,
i=2
Nodes on Edges: ϵ21 ≠0,
i=2
Nodes on Vertices: ϵ21 ≠0,
i=2
In ABAQUS® the PBC are enforced using the *EQUATION keyword. The following are the
steps in applying PBC on a model:
1. Group the node sets on the faces, edges and vertices of the cube. The *EQUATION keyword
allows only those nodes on opposite faces which have matching coordinates. Hence a regular
or identical mesh on each the opposing faces are required. In case of irregular mesh, the
outermost layers of the RVE geometry need be re-meshed such that this condition is satisfied.
2. The prescribed loading (traction or displacement) is applied on a dummy node situated
outside the RVE domain.
3. The mid-nodes on the faces of the RVE need to be constrained in directions orthogonal to
prescribed loading to avoid rigid body motion in the cases of uniaxial loading. For example,

24
in Case-1 described previously, the mid-nodes of faces F3& F4 are assigned boundary
condition U3=0 and mid-nodes of faces F5& F6 are assigned boundary condition U2=0.
3.5. Windows
To investigate how the anisotropy due to local microstructure leads to overall isotropic behavior
of the agglomerate, the method of windowing is employed. Cubes of size 1K, 8K and 125 K are
extracted from 8 locations within the 1M domain which coincide with the gauss quadrature points of a
hypothetical C3D8 master element of 1M size. These extracted sub-domains will be referred to as
windows in subsequent discussions in this study (Fig.14). These are analogous to physical core
samples prepared by extraction from a hydrated bulk specimen and are used to sample the 1M
domain.
Figure 14. Schematic showing location of windows extracted from the 1M-PMD.

25
3.6. Homogenization
Homogenization procedures aim at finding a volume element's responses to prescribed
mechanical loads (typically far field stresses or far field strains) and to deduce the corresponding
overall properties. The most straightforward application of such studies is materials characterization,
i.e. simulating the overall material response under simple loading conditions such as uniaxial tensile
tests [53]. Modern approaches based on computational homogenization define a microstructural
representative volume element that is modeled in full detail. Subsequently, the constitutive equations
for the whole object are computed from the representative cell. Several studies have been conducted
on obtaining the homogenized or equivalent properties by applying traction or displacement
boundary conditions on a periodic domain and the applied boundary conditions are discussed briefly
[51,54,55].
The ABAQUS® models consisting of 1 million or more continuum (C3D8) elements are not
amenable to being queried for individual element stresses and strains which can then be averaged.
Instead the strain energy corresponding to a known applied displacement of the periodic domain is
used to determine the corresponding homogenized modulus. Including only non-zero strain terms,
the relation for the total strain energy due to deformation (Voigt notation) is given by:
(1)
Where,
U = total strain energy of the RVE (ABAQUS output)
= average strain (computed from applied displacement), q=1 to 6
= volume of periodic domain (computed from dimensions of cube)
average strain (computed from equation 1), p=1 to 6
The homogenized moduli tensor elements are computed by assigning the elastic properties
and subjecting the periodic domain to a prescribed pure deformation mode such that only one of the

26
six independent stresses is non–zero (Figs 10-13). The tensor elements are the ratio of the average
stress and strain corresponding to a deformation mode:
and (2)
Where, = homogeneous modulus corresponding to applied deformation mode (i, j = 1, 2, 3
are not summed indices).
In the case of pure shear deformation (Fig.15), ABAQUS® data output is in terms of
engineering shear strain ( )xyg such that:
( ) ( ) ( ) ÷ø
öçè
æDD
+DD
=+»+=X
y
Y
xxy 2121 tan tan qqqqg (3)
The tensorial shear strain can be computed as:
(4)
From (2) the corresponding element of the elastic modulus is computed as:
and (5)
with no sum on i.
For further verification, the present RVE method is compared with asymptotic expansion
homogenization (AEH). The AEH method provides an alternate means of estimating the effective
elastic properties of general three dimensional microstructures from an RVE [58, 59].
( ) ÷ø
öçè
æDD
+DD
=+=X
y
Y
xxy 2
1
2
121 qqe
27
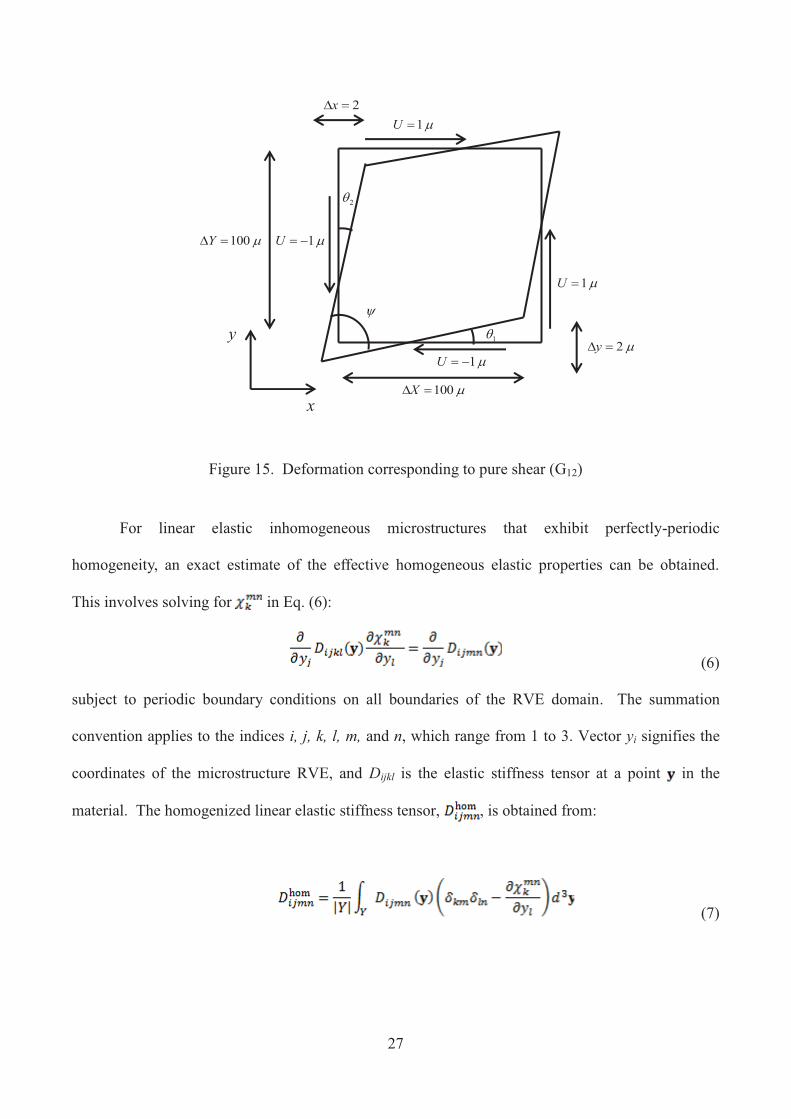
Figure 15. Deformation corresponding to pure shear (G12)
For linear elastic inhomogeneous microstructures that exhibit perfectly-periodic
homogeneity, an exact estimate of the effective homogeneous elastic properties can be obtained.
This involves solving for in Eq. (6):
(6)
subject to periodic boundary conditions on all boundaries of the RVE domain. The summation
convention applies to the indices i, j, k, l, m, and n, which range from 1 to 3. Vector yi signifies the
coordinates of the microstructure RVE, and Dijkl is the elastic stiffness tensor at a point in the
material. The homogenized linear elastic stiffness tensor, , is obtained from:
(7)
y
1q
2q
x
y
m 1=U
m 1=U
m 1-=U
m 1-=U
m 100=DX
m 100=DY
m 2=Dy
2=Dx
28
which produces a general estimate of all 81 terms of the anisotropic elastic stiffness tensor. Under
symmetries imposed by the geometry of the microstructure, will possess all appropriate
symmetries as well. Thus, the number of terms in can be reduced in the standard way
through symmetry arguments associated with, for instance, orthotropic linear elasticity.

29
CHAPTER 4
RESULTS
4.1. RVE Deformation in ABAQUS Simulation
This subsection shows RVE deformation due to imposing KBC by ABAQUS simulation. As
it was mentioned in section 3.4, KBC is one of the imposed boundary conditions to determine the
effective young’s and shear modulus. Imposing of KBC has been described in details previously in
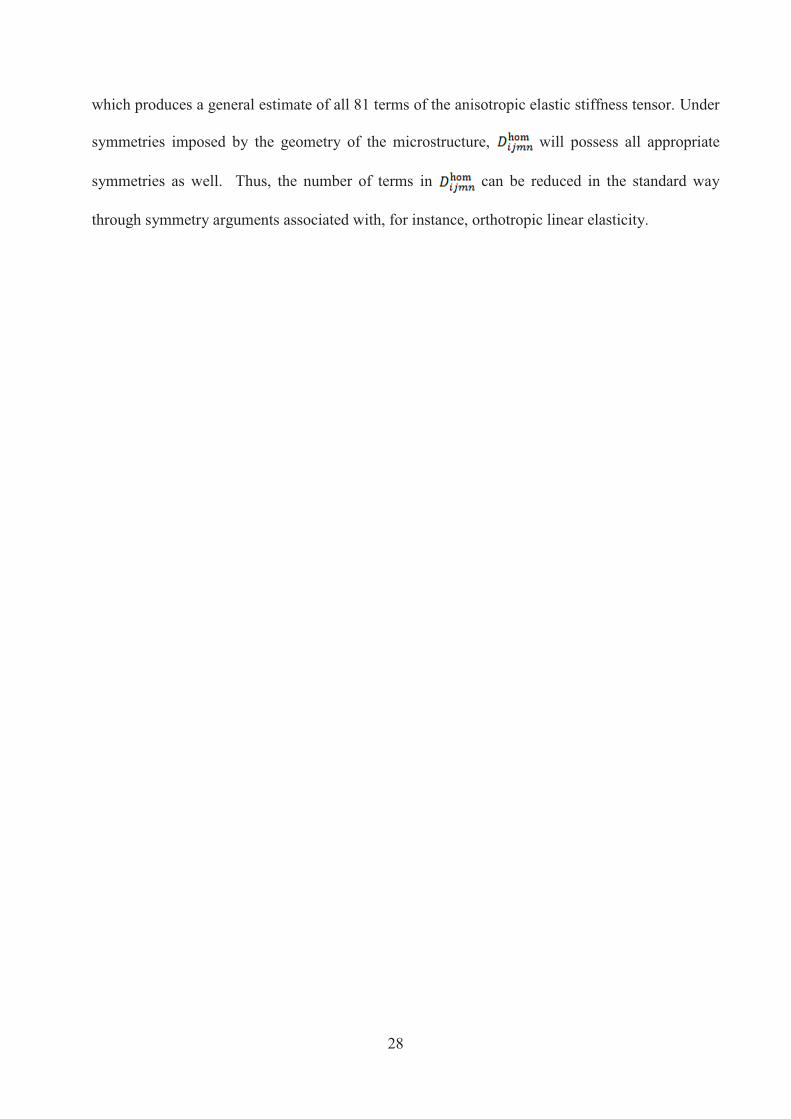
this thesis. Figs 16 and 17 show the deformation of 1M RVE after imposing KBC for the cases of E11
and E12, respectively.
Figure 16 Deformation of 1M RVE due to imposing KBC for the case of E11
30
Figure 17 Deformation of 1M RVE due to imposing KBC for the case of E12
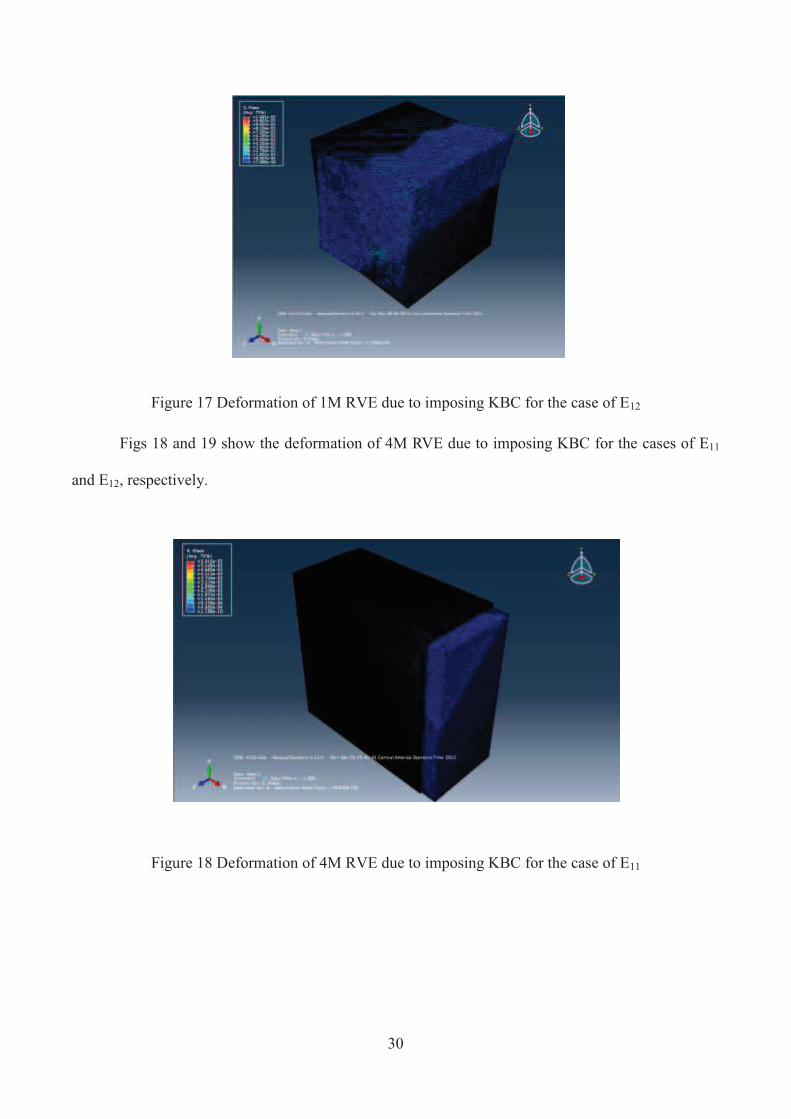
Figs 18 and 19 show the deformation of 4M RVE due to imposing KBC for the cases of E11
and E12, respectively.
Figure 18 Deformation of 4M RVE due to imposing KBC for the case of E11
31
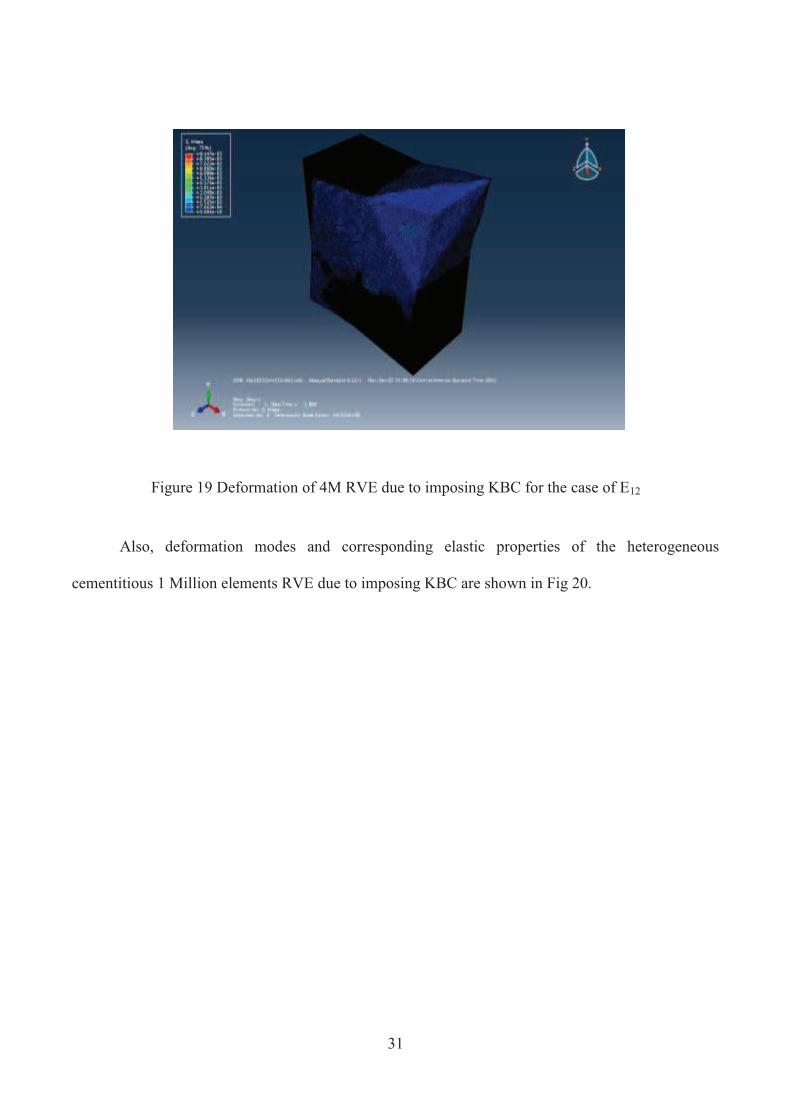
Figure 19 Deformation of 4M RVE due to imposing KBC for the case of E12
Also, deformation modes and corresponding elastic properties of the heterogeneous
cementitious 1 Million elements RVE due to imposing KBC are shown in Fig 20.
32
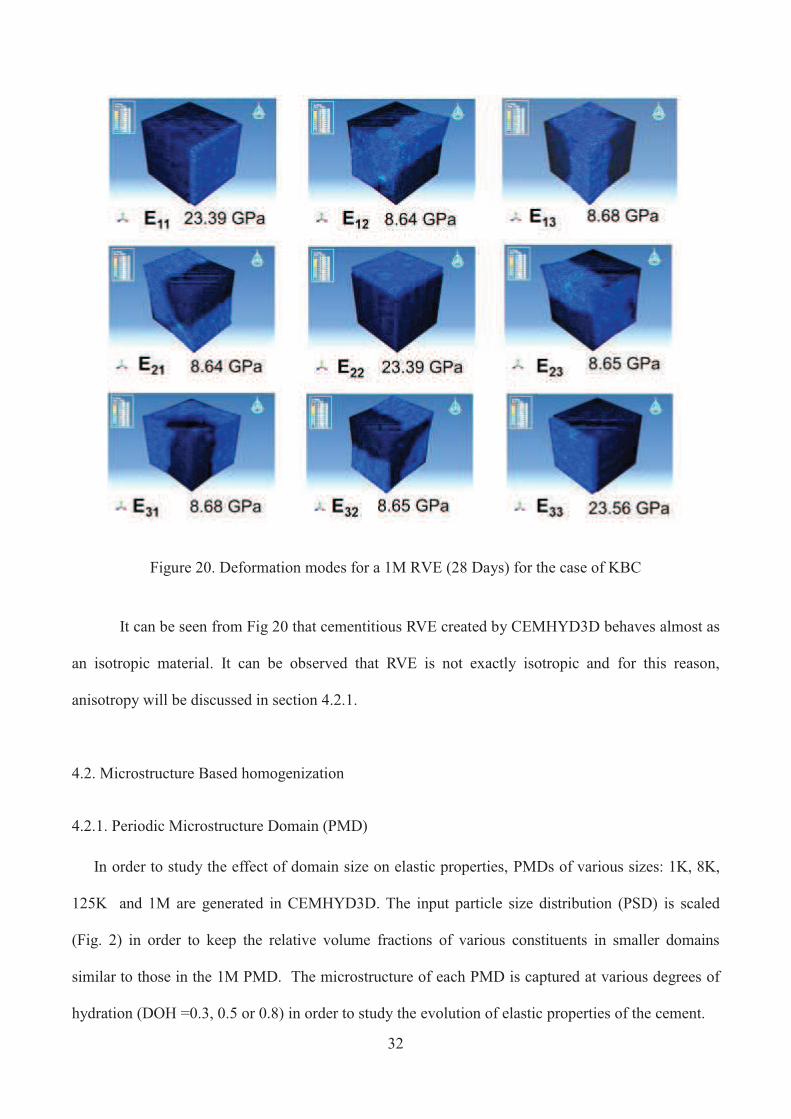
Figure 20. Deformation modes for a 1M RVE (28 Days) for the case of KBC
It can be seen from Fig 20 that cementitious RVE created by CEMHYD3D behaves almost as
an isotropic material. It can be observed that RVE is not exactly isotropic and for this reason,
anisotropy will be discussed in section 4.2.1.
4.2. Microstructure Based homogenization
4.2.1. Periodic Microstructure Domain (PMD)
In order to study the effect of domain size on elastic properties, PMDs of various sizes: 1K, 8K,
125K and 1M are generated in CEMHYD3D. The input particle size distribution (PSD) is scaled
(Fig. 2) in order to keep the relative volume fractions of various constituents in smaller domains
similar to those in the 1M PMD. The microstructure of each PMD is captured at various degrees of
hydration (DOH =0.3, 0.5 or 0.8) in order to study the evolution of elastic properties of the cement.

33
As expected, the volume fractions (DOH=0.8) of constituents in PMDs of sizes 8K, 125K and 1M are
found to be consistent within domains of the same size and vary only slightly with size as shown in
Fig. 21. In domains smaller than 8K, the volume fractions of various constituent phases cannot be
maintained due to the low number of particles. In case of the 1K domain the volume fractions of
individual constituents become unrealistic. A significant increase is observed in the volume fraction of
C-S-H as the domain size increases from 1 K to 8K. This may be due to the fact that C-S-H forms on
the active surfaces. Since there are only a few particles, the corresponding ratio of active surfaces to
domain volume is relatively less compared to PMDs of size 8K and larger, which have a smoother
PSD (Fig. 2). This shows that the hydration kinetics is highly sensitive to PSD. However, beyond 8K,
the volume fractions become independent of the domain size.
Figure 21. Volume fractions of major phases for 1K, 8K, 125K and 1M PMDs
The effect of spatial distribution of constituents on the elastic properties is studied by
generating several instances of the 1M PMD with random spatial distribution of particles within
the volume of each domain, while keeping the volume fractions and PSD constant. These
instances are subjected to various axial and shear deformation modes in order to determine

34
corresponding elements of the elastic tensor. Figs. 22(a)-(b) show the cumulative average values
of principal and shear moduli of the 1M-PMD for various instances normalized to their
respective average. It is seen that spatial distribution of constituent phases has little effect on
global elastic properties of the domain.
Figure 22. Variation of (a) principal and (b) shear moduli (KBC) in 1M- PMD for various instances normalized to their respective average
The elastic tensor (Voigt notation) for an isotropic material is given by:
(8)
Where the individual components of the stiffness tensor are given by:
(9)
Stdev E1=0.00326 E2=0.00345 E3=0.00400
Stdev G12=0.00513 G13=0.00256 G23=0.00156
(b) (a)
35
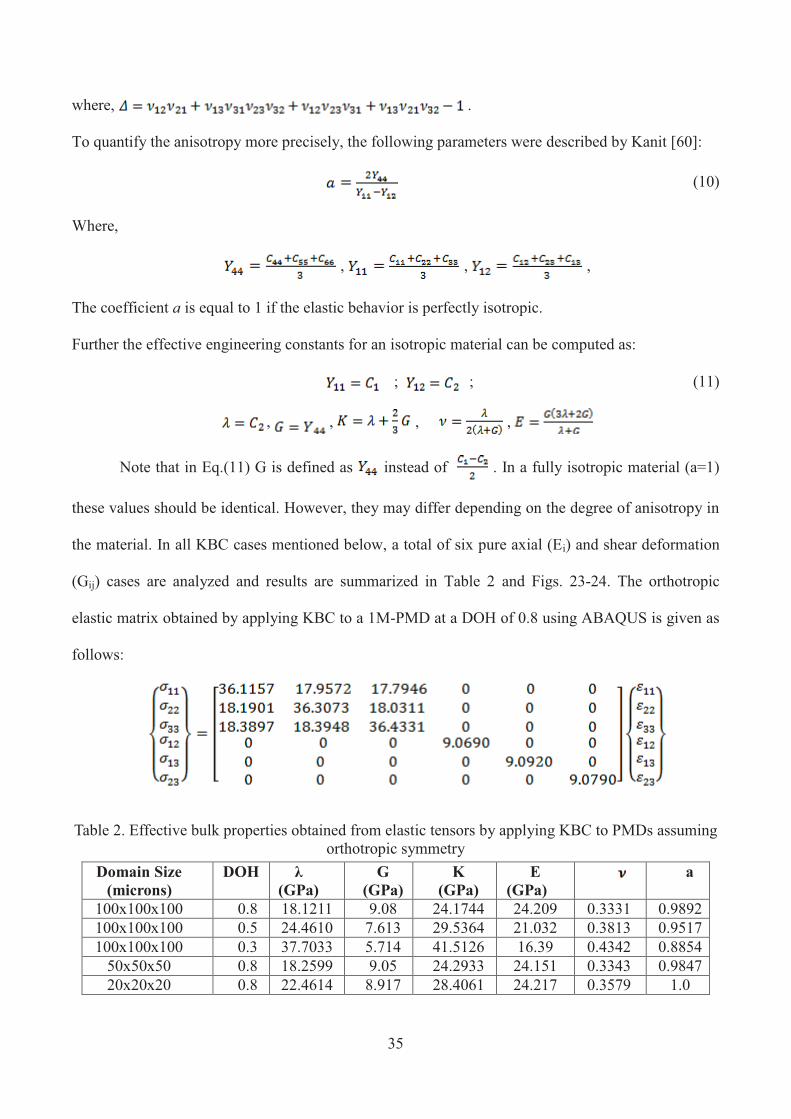
where, .
To quantify the anisotropy more precisely, the following parameters were described by Kanit [60]:
(10)
Where,
, , ,
The coefficient a is equal to 1 if the elastic behavior is perfectly isotropic.
Further the effective engineering constants for an isotropic material can be computed as:
; ; (11)
, , , ,
Note that in Eq.(11) G is defined as instead of . In a fully isotropic material (a=1)
these values should be identical. However, they may differ depending on the degree of anisotropy in
the material. In all KBC cases mentioned below, a total of six pure axial (Ei) and shear deformation
(Gij) cases are analyzed and results are summarized in Table 2 and Figs. 23-24. The orthotropic
elastic matrix obtained by applying KBC to a 1M-PMD at a DOH of 0.8 using ABAQUS is given as
follows:
Table 2. Effective bulk properties obtained from elastic tensors by applying KBC to PMDs assuming orthotropic symmetry
Domain Size
(microns)
DOH λ
(GPa)
G
(GPa)
K
(GPa)
E
(GPa) a
100x100x100 0.8 18.1211 9.08 24.1744 24.209 0.3331 0.9892 100x100x100 0.5 24.4610 7.613 29.5364 21.032 0.3813 0.9517 100x100x100 0.3 37.7033 5.714 41.5126 16.39 0.4342 0.8854
50x50x50 0.8 18.2599 9.05 24.2933 24.151 0.3343 0.9847 20x20x20 0.8 22.4614 8.917 28.4061 24.217 0.3579 1.0

36
In the above cases where KBC was applied, the elastic tensor was found to be effectively
isotropic. This isotropic behavior is assumed to hold in cases when PBC is applied as well. Hence
only two deformation cases corresponding to pure extension (E1) and pure shear (G12) are required to
populate the elastic tensor and obtain the overall effective bulk properties. Since the microstructure
and domain size are identical, effective Poisson’s ratios obtained from the corresponding KBC cases
(Table 2) are used to generate the elastic tensor in this study. This enables efficient computation of
the elastic tensor since the PBC cases require significantly larger computational resources. The
various trends observed in this analysis are summarized in Table 3 and Figs. 23-24.
Table 3. Effective bulk properties obtained from elastic tensors by applying PBC to PMDs
Domain Size
(microns)
DOH λ
(GPa)
G
(GPa)
K
(GPa)
E
(GPa) a
100x100x100 0.8 15.5048 9.1520 21.6061 24.0590 0.3144 0.9979 100x100x100 0.5 15.2035 7.763 20.3789 20.6650 0.3310 0.9942 100x100x100 0.3 12.7297 5.8840 16.6524 15.7920 0.3419 0.9949
50x50x50 0.8 15.3334 9.1540 21.4360 24.0400 0.3131 0.9976 20x20x20 0.8 17.1366 9.1030 23.2053 24.1510 0.3265 1.0
The full anisotropic stiffness matrix for typical cement 1M- PMD (DOH= 0.8) obtained using
AEH [58] is:
37
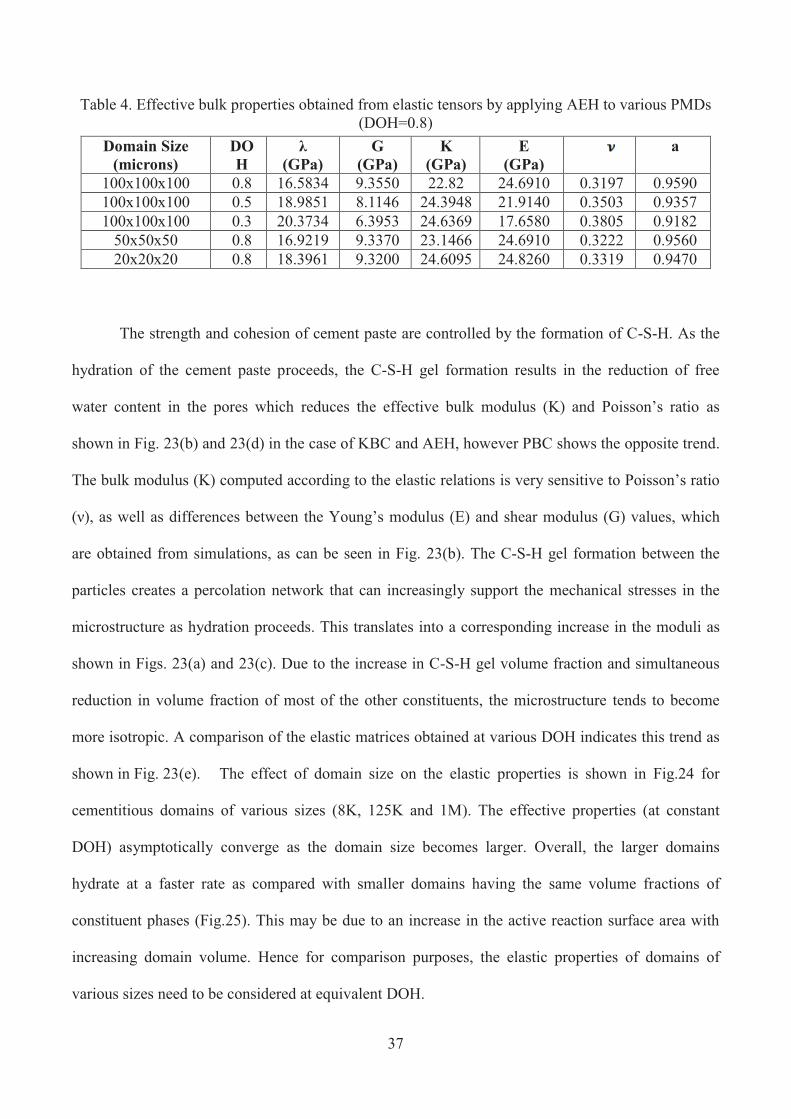
Table 4. Effective bulk properties obtained from elastic tensors by applying AEH to various PMDs (DOH=0.8)
Domain Size
(microns)
DO
H
λ
(GPa)
G
(GPa)
K
(GPa)
E
(GPa) a
100x100x100 0.8 16.5834 9.3550 22.82 24.6910 0.3197 0.9590 100x100x100 0.5 18.9851 8.1146 24.3948 21.9140 0.3503 0.9357 100x100x100 0.3 20.3734 6.3953 24.6369 17.6580 0.3805 0.9182
50x50x50 0.8 16.9219 9.3370 23.1466 24.6910 0.3222 0.9560 20x20x20 0.8 18.3961 9.3200 24.6095 24.8260 0.3319 0.9470
The strength and cohesion of cement paste are controlled by the formation of C-S-H. As the
hydration of the cement paste proceeds, the C-S-H gel formation results in the reduction of free
water content in the pores which reduces the effective bulk modulus (K) and Poisson’s ratio as
shown in Fig. 23(b) and 23(d) in the case of KBC and AEH, however PBC shows the opposite trend.
The bulk modulus (K) computed according to the elastic relations is very sensitive to Poisson’s ratio
(ν), as well as differences between the Young’s modulus (E) and shear modulus (G) values, which
are obtained from simulations, as can be seen in Fig. 23(b). The C-S-H gel formation between the
particles creates a percolation network that can increasingly support the mechanical stresses in the
microstructure as hydration proceeds. This translates into a corresponding increase in the moduli as
shown in Figs. 23(a) and 23(c). Due to the increase in C-S-H gel volume fraction and simultaneous
reduction in volume fraction of most of the other constituents, the microstructure tends to become
more isotropic. A comparison of the elastic matrices obtained at various DOH indicates this trend as
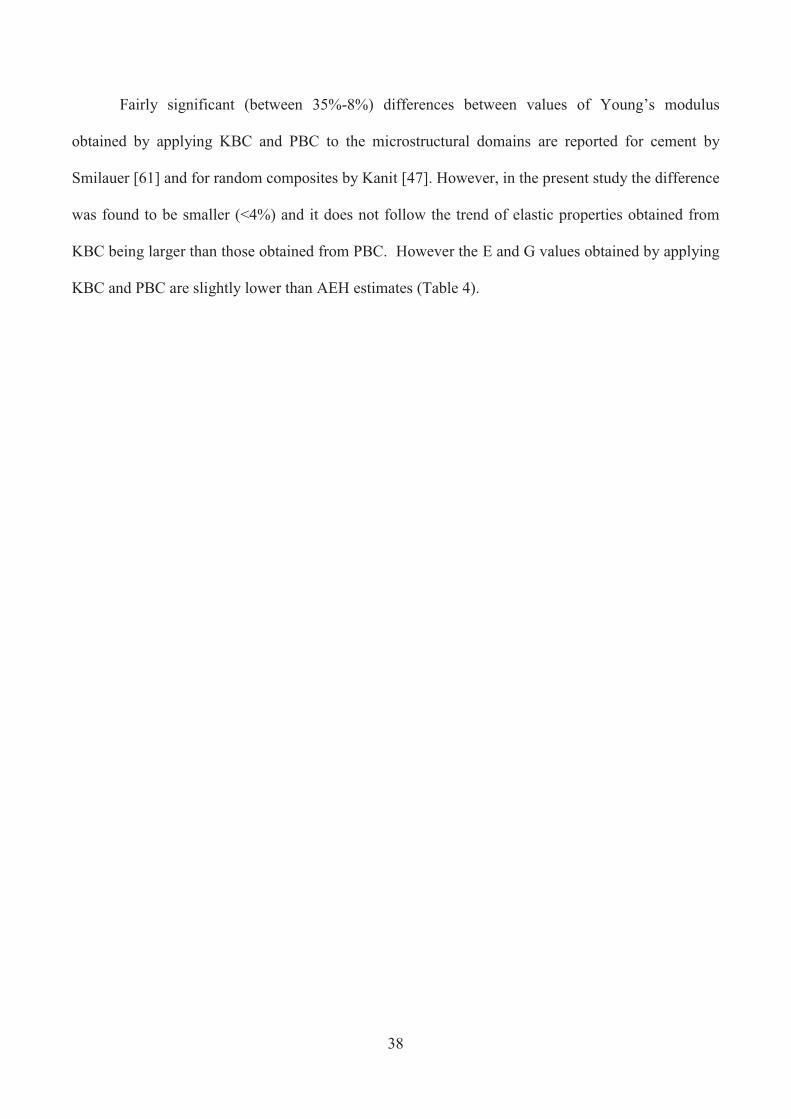
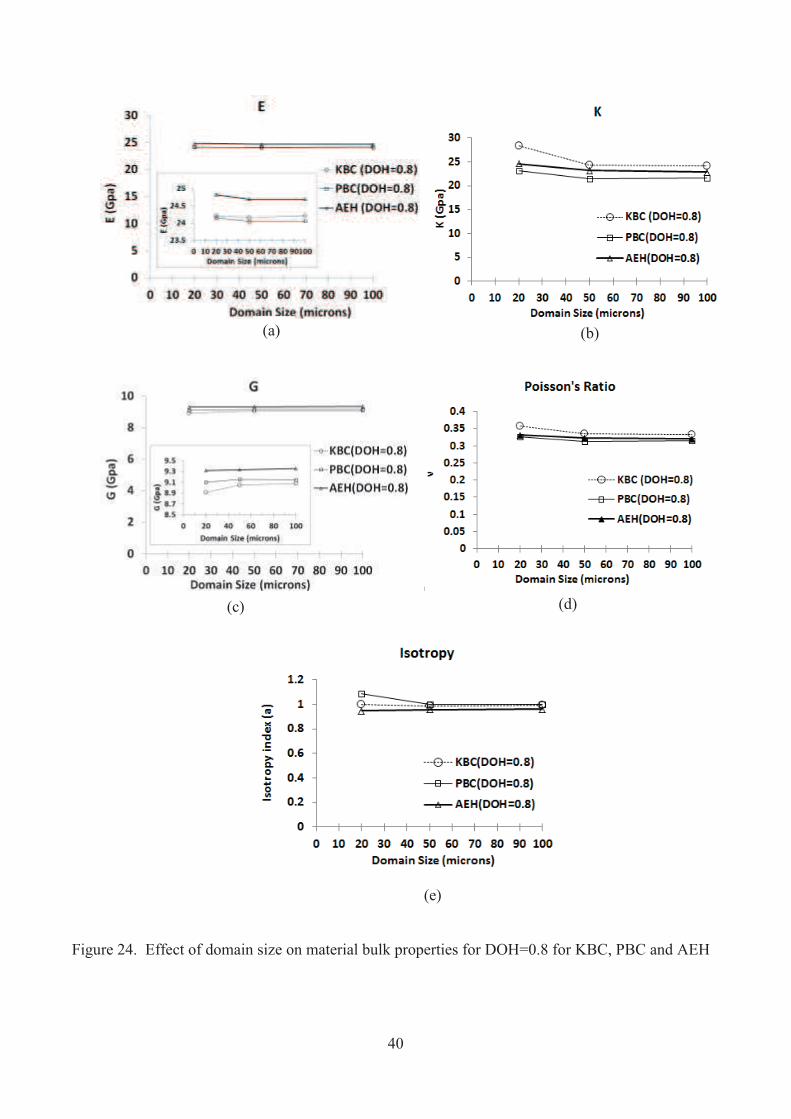
shown in Fig. 23(e). The effect of domain size on the elastic properties is shown in Fig.24 for
cementitious domains of various sizes (8K, 125K and 1M). The effective properties (at constant
DOH) asymptotically converge as the domain size becomes larger. Overall, the larger domains
hydrate at a faster rate as compared with smaller domains having the same volume fractions of
constituent phases (Fig.25). This may be due to an increase in the active reaction surface area with
increasing domain volume. Hence for comparison purposes, the elastic properties of domains of
various sizes need to be considered at equivalent DOH.
38
Fairly significant (between 35%-8%) differences between values of Young’s modulus
obtained by applying KBC and PBC to the microstructural domains are reported for cement by
Smilauer [61] and for random composites by Kanit [47]. However, in the present study the difference
was found to be smaller (<4%) and it does not follow the trend of elastic properties obtained from
KBC being larger than those obtained from PBC. However the E and G values obtained by applying
KBC and PBC are slightly lower than AEH estimates (Table 4).

39
Figure 23. Effect of DOH on material bulk properties for 1M-RVE for KBC, PBC and AEH
(a) (b)
(c) (d)
(e)
40
Figure 24. Effect of domain size on material bulk properties for DOH=0.8 for KBC, PBC and AEH
(a) (b)
(c) (d)
(e)
41
Figure 25. The effect of domain size on degree of hydration (α) (CEMHYD3D)
4.2.2. Windows
Windows ranging in size from 1K to 125K are extracted from a 1M-PMD (DOH=0.8) to
qualitatively evaluate the local anisotropy within the larger domain. It is important to note that the
particle distribution and volume fraction of each window is not consistent with that of the larger
domain from which the window is extracted. The volume fractions of some of the major constituent
phases that are contained within both the 1K and 8K windows are found to vary significantly (Fig.
26). Larger variation is observed in smaller windows. This variation is indicative of the local
anisotropy in the volume of material contained within the larger 1M domain.

42
Figure 26. Volume fractions of major phases for (a) 1K element and (b) 8K element windows
Figure 26-(c). Volume fractions of major phases for 125K element windows
Intuitively, as the window sizes become larger their average properties are expected to
approach that of the bulk material. To evaluate the effects of domain size and random
microstructure on the elastic properties, four 1M PMDs, each with different microstructure, are
generated while maintaining the same PSD and volume fractions of the constituents. The resultant
domain size is 200x200x100 (4M) finite elements.
(a) (b)

43
Convergence studies are conducted on windows of various sizes (1K, 8K, 125K, 1M and 4M
elements). For each case the average values obtained from 8 instances in the case of 1K, 8K and
125K windows; 5 instances of 1M and 1 instance of 4 M domains are reported. The convergence
behavior of the elastic modulus (uniaxial deformation) normalized with respect to E1 and G12
obtained from PBC applied to 4M- PMD is shown Figs. 27-28. Based on these numerical
exercises, a 1M domain size seems to be the minimum required size such that computed
properties are no longer sensitive to variations between random instances. This indicates that the
1M domain size is sufficient for an RVE to realistically represent the microstructure and effective
bulk properties of the Type-I cement considered here. Though this exercise does not directly
address the statistical aspects based on 2-way ANOVA or a t-Test, the results clearly show that
both domain size and random microstructure do not significantly affect the elastic properties
obtained from the domains of size equal to or larger than 1M elements.

44
Figure 27. Elastic moduli (uniaxial) with increasing window size
Figure 28. Elastic shear moduli Gij with increasing window size
1.0E+03 8.0E+03 1.3E+05
E1 0.00294 0.00792 0.00605E2 0.00291 0.00775 0.00598E3 0.00284 0.00828 0.00618
Stdev- KBC
Stdev- PBC 1.0E+03 8.0E+03 1.3E+05
E1 0.00356 0.00446 0.0015E2 0.00319 0.00316 0.00141E3 0.00372 0.00459 0.00155
1.0E+03 8.0E+03 1.3E+05
G12 0.00112 0.00084 0.01791G13 0.00113 0.00116 0.01768G23 0.00103 0.00104 0.01779
Stdev- KBC
Stdev- PBC
1.0E+03 8.0E+03 1.3E+05
G12 0.00104 0.00097 0.00053G13 0.00113 0.00124 0.00056G23 0.00107 0.00113 0.00049
45
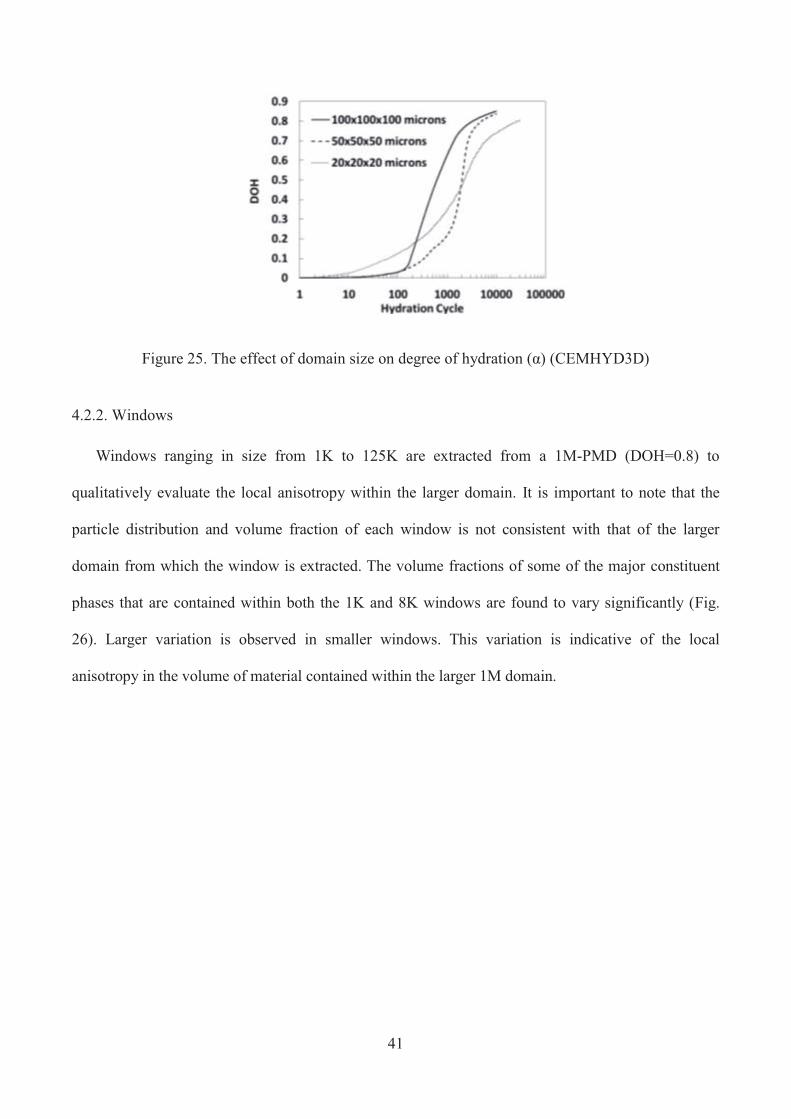
4.3. Rule of Mixtures Based Homogenization
A rule of mixtures approach independent of the microstructure of the material is used to
compute the effective bulk properties of the cementitious material. The theoretical extreme upper and
lower bounds on effective material properties of multi-phase materials are the Voigt [62] and Reuss
[63] bounds. The rule of mixtures based Voigt upper bound on the effective bulk (K*) and shear
moduli (G*) of a mixture of n material phases is given by:
and (12)
The inverse rule of mixtures based Reuss lower bound on effective bulk (K*) and shear
moduli (G*), is given by:
and (13)
Hashin (1962) [64] presented the composite (or coated) spheres model for determining the
effective material properties for multi-phase materials, based on the dilute suspension model. Here a
large number of uniformly distributed coated spherical inclusions that fill all space in a matrix are
considered. The effective bulk modulus (K*) is given by:
(14)
Where,
=Bulk modulus of ith kind of inclusion,
=Bulk modulus of matrix
=Effective bulk modulus of heterogeneous material
=Poisson’s ratio of matrix
=volume concentration of ith kind of inclusion
=volume concentration of inclusions
And the simplified formula for effective shear modulus (G*) is given by [64]:
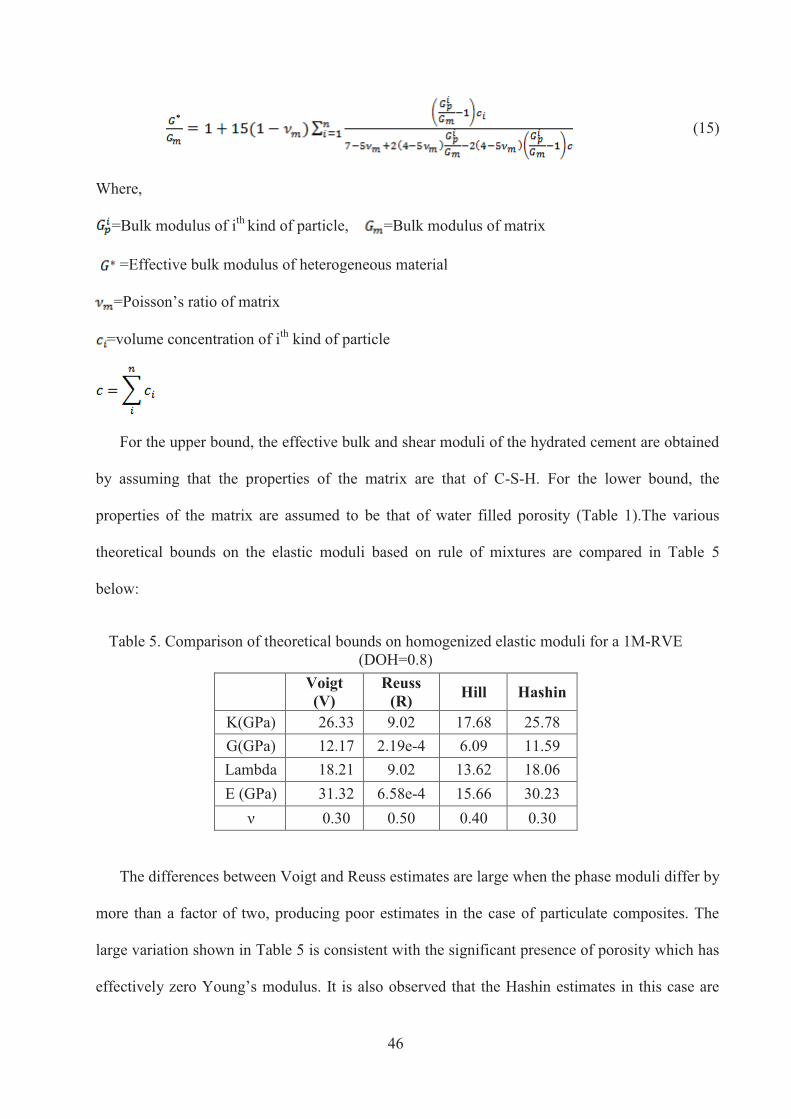
46
(15)
Where,
=Bulk modulus of ith kind of particle, =Bulk modulus of matrix
=Effective bulk modulus of heterogeneous material
=Poisson’s ratio of matrix
=volume concentration of ith kind of particle
For the upper bound, the effective bulk and shear moduli of the hydrated cement are obtained
by assuming that the properties of the matrix are that of C-S-H. For the lower bound, the
properties of the matrix are assumed to be that of water filled porosity (Table 1).The various
theoretical bounds on the elastic moduli based on rule of mixtures are compared in Table 5
below:
Table 5. Comparison of theoretical bounds on homogenized elastic moduli for a 1M-RVE (DOH=0.8)
Voigt
(V)
Reuss
(R) Hill Hashin
K(GPa) 26.33 9.02 17.68 25.78
G(GPa) 12.17 2.19e-4 6.09 11.59
Lambda 18.21 9.02 13.62 18.06
E (GPa) 31.32 6.58e-4 15.66 30.23
ν 0.30 0.50 0.40 0.30
The differences between Voigt and Reuss estimates are large when the phase moduli differ by
more than a factor of two, producing poor estimates in the case of particulate composites. The
large variation shown in Table 5 is consistent with the significant presence of porosity which has
effectively zero Young’s modulus. It is also observed that the Hashin estimates in this case are

47
close to the Voigt upper bound. In both these estimates the elastic properties are higher than
those estimated by microstructure based homogenization (KBC, PBC and AEH).
The material properties predicted by the microstructure based methods for a 1M domain at
DOH=0.8 are comparable to resonant ultrasound spectroscopy (RUS) based experimental data
(Table 6) reported for a typical Type –I Portland cement with a w/c ratio of 0.40 [65]. In the
current study, the Young’s modulus (E) of the cement RVE is computed to be around 24.0 GPa,
the Shear modulus (G) is around 9.0 GPa and effective Poisson’s ratio (ν) is about 0.32 for a w/c
ratio of 0.40. Similar but slightly different range of values for Young’s modulus (20-25 GPa),
Shear modulus (8-10 GPa) and Poisson’s ratio (0.24-0.25) have been reported by several authors
for Type-I cements with w/c ratio ranging from 0.4 to 0.5 [61, 66-68]. The authors believe that
the reason for this difference is the variation in experimentally determined micro-scale material
properties, different PSD, volume fractions of constituent phases and w/c ratios in cements
studied at various research facilities.
Table 6. Experimental (RUS) results for hydrated cement paste with w/c=0.4 [65]
C11 C33 C12 C13 C44 ν E G
(GPa) 24.23 -- 6.69 -- 8.77 0.216 21.55 8.8

48
4.4. Compressive strength of Hardened Cement Paste
Powers (1958) considered strength to be related to the concentration of solid hydration products
in the paste and expressed this as a gel space ratio (X) defined by Eq.(17) below in which the gel
pores are included in the gel volume [69]:
(17)
Where,
α = degree of hydration
w/c= water-cement ratio =0.40
The compressive strength ( ) is related to X by the equation:
(18)
where n=2.6 to 3.0 for typical cements.
In the case of the PMDs, the total porosity is taken as being equal to water porosity and
volume of C-S-H is taken as total gel volume. Theoretical maximum strength is achieved when X=1,
i.e., 100% hydration takes place. In literature several models are used to fit either degree of hydration
or strength development vs time. A parabolic model developed by Knudsen and implemented in
CEMHYD3D [70] provides a good fit to experimental data:
(19)
Where, Au = ultimate achievable value of the property = (compressive strength)
t0 = induction time which accounts for accelerated rate of hydration during the very early stage,

49
k = rate constant that is fitted to experimental data
The development of compressive strength for cementitious periodic domains of various sizes (8K,
125K and 1M) is plotted in Fig. 29. The trend in compressive strength development is similar to that
of the degree of hydration. The development of the Young’s modulus in the 1M-RVE, normalized to
the modulus obtained from the 4-M PMD as a function of time (days) is shown in Fig. 30.
Figure 29. Development of the compressive strength (f’c) (CEMHYD3D)
Figure 30. Development of the Young’s Modulus (E) (ABAQUS)

50
4.5. Computational Resources
The computational resources of the Sequoia cluster at Mississippi Supercomputing Center
(MCSR was leveraged. Sequoia is a 124 node cluster with 22 Altix XE 310, 24 Altix XE 320, and 78
Rackable computing nodes. Each Altix node consists of Dual Intel Xeon Quad-core E5420
Harpertown processors, a 1333 MHz Front Side Bus, a 12 MB L2 Cache, and a 250 GB Disk Drive.
Each Harpertown processor consists of 4 2.5 GHz cores (or, effectively, CPUs) and 8 GB memory.
42 Altix nodes are configured with 16 GB memory each (2GB per core), but 4 Altix fat nodes are
configured with 32 GB memory each (4GB per core). Each Rackable node has two six-core Intel
Xeon X5650 (Westmere) processors, 36 GB of DDR3 RAM, a 2 TB internal SATA hard drive, and a
QDR Infiniband network card. Overall, Sequoia has 3.44TB memory.
Table 7 Resource allocation on Sequoia at MCSR
RVE size
(no. of elements)
No. of Nodes No. of
CPUs/Node
RAM
Allocation
(Gb)
1000 1 1 28 8000 1 1 28
1 Million 1 2 28 4 Million 4 1 140

51
Figure 31. Wall clock time (hr) vs RVE size

52
CHAPTER 5
CONCLUSION AND FUTURE WORK
The results presented under this work clearly show how meso-scale effective properties can
be determined using voxel based FEA approach. Analysis is conducted to obtain the elastic moduli
and compressive strength of a Type-I cement paste. In this effort both KBC and PBC were
investigated to determine if the elastic properties are invariant due to boundary conditions and results
are compared with an alternate AEH methodology. In addition the method of “windowing” was used
to access the randomness of the constituents and to validate how the isotropic elastic properties were
determined. A comparison between the two domain sampling methods shows that windowing
produces effective material properties with a larger variation than the PMD due to a higher variation
in local phase volume fractions. Macroscopic properties obtained for various DOH and domain sizes,
determined by applying KBC, PBC, AEH and rule of mixtures based homogenization are found to be
comparable. It is shown that even though cement is a heterogeneous anisotropic material at the
micro-level, the bulk properties are effectively isotropic.
Multiscale modeling (MM) is a computationally intensive approach that enables computation of
elatic properties of heterogeneous cement with a wide variety of additives. Under a hierarchical MM
approach, the individual properties of each constituent and additive material can be computationally
determined using molecular dynamics (MD) simulations and this information can be passed on to the
next level RVE based microstructural model. In future, this microscopic RVE based methodology
will be further extended to investigate the effects of nano-scale additives on mechanical properties.

53
LIST OF REFERENCES
54
[1] Garboczi, E., and Bentz, D.P., 1996, Multi-scale Picture of Concrete and its Transport Properties: Introduction for Non-Cement Researchers, NISTR 5900, BFRL, NIST, Githesburg Maryland.
[2] Bernard, O., Ulm, F.J., and Lemarchand, E., 2003, “A multiscale micromechanics-hydration model for the early-age elastic properties of cement-based materials,” Cem. Concr. Res., 33(9), pp. 1923-1309.
[3] Lee, J., Xi, Y., William, K., and Jung, C., 2009, “A multiscale model for modulus of elasticity of concrete at high temperatures,” Cem. Concr. Res., 39(9), pp. 754-762.
[4] Wu, W., Al-Ostaz A., Cheng, A., and Chung S., 2010, “Concrete as a Hierarchal Structural Composite Material,” Int. J. Multiscale Comput. Eng., 6(5), pp. 585-595.
[5] Tennis, P.D. and Jennings, H.M., 2000,“A model for two types of calcium silicate hydrate in the microstructure of Portland cement pastes,” Cem. Concr. Res., 30(6), pp. 855-863.
[6] Mondal,P., Shah,S.P.and Marks,L.D, ,2008, “Nanoscale characterization of cementitious materials,” ACI J. Mater., 105(2), pp. 174-179.
[7] Thomas, J.J. , Jennings, H.M. and Allen, A.J. , 1998 , “The surface area of cement paste as measured by neutron scattering: evidence for two c-s-h morphologies,” Cem. Concr. Res., 28(6), pp. 897–905.
[8] Constantinides, G., Ulm, F.J. and Van Vliet, K., 2003,“On the use of nanoindentation for cementitious materials,” Mater. Struct., 36, pp. 191-196.
[9] Jennings, H.M., Thomas,J.J., Gevrenov,J.S., Constantinides, G., Ulm, F.,J, 2005, “Relating the nanostructure of concrete to engineering properties,” 2nd Int. Symp. Nanotech. Constr., Bilbao, Spain.
[10] Haecker, C.J., Garboczi, E.J., Bullard, J.W., Bohn, R.B., Sun, Z., Shah, S.P., and Voigt, T., 2005, “Modeling the linear elastic properties of Portland cement paste,” Cem. Concr. Res., 35(10), pp.1948–1960.
[11] Richardson, I. G., 2008, “The calcium silicate hydrates,” Cem. Concr. Res., 38(2), pp. 137 – 158.
[12] Pellenq, R.J.-M. Lequeux, N., Vandamme, H.,2008, “Engineering the bonding scheme in C-S-H: the iono-covalent framework,” Cem. Concr. Res., 38(2), pp. 159 -174.
[13] Richardson, I.G., 2000, “The nature of the hydration products in hardened cement pastes,” Cem.
Concr. Compos., 22, pp. 97–113.
[14] Murray, S. J., 2009, “Determination of Strength and Stiffness of Calcium Silicate Hydrate using Molecular Dynamics,” M.S Thesis, University of Arkansas.
[15] Lin, F., 2006, “Modeling of hydration kinetics and shrinkage of Portland cement paste,” PhD. Dissertation, Columbia University.

55
[16] Smilauer V., 2005, “Elastic Properties of Hydrating Cement Paste Determined From Hydration Models,” Thesis. Czech Technical University in Prague.
[17] Allen, A.J., Thomas, J. J. and Jennings, H. M., 2007, “Composition and density of nanoscale calcium–silicate–hydrate in cement,” Nature Mater., 6(4), pp. 311-316.
[18] Bentz, D.P. , Jensenb, O.M. Coats, A.M. Glasser, F.P. , 2000, “Influence of silica fume on diffusivity in cement-based materials I. Experimental and computer modeling studies on cement pastes,” Cem. Concr. Res., 30(6), pp. 953-962.
[19] Mei Qiang Chandler, J. F. Peters, and D. Pelessone, 2012, Modeling Nanoindentation of Calcium Silicate Hydrate, J. Transp. Res. Board, No. 2142, Transportation Research Board of the National Academies, Washington, D.C., 2010, pp. 67–74.
[20] J.J. Beaudoin,1 P. Gu, and R.E. Myers, “The Fracture Of C-S-H And C-S-H/Ch Mixtures,” Cem. Concr. Res., 28(3), pp. 341–347,1998.
[21] Jennings,H.M., Bullard,J.W., Thomas,J.J., Andrade, J.E., Chen, J.J. and Scherer,G.W., 2008, “Characterization and modeling of pores ans surfaces in cement paste: correlations to processing and properties,” J. Adv. Conc. Tech., 6(1), pp. 5-29.
[22] Chandler, M.Q, Peters, J. F. and Pelessone, D., Modeling Nanomechanical Behavior of Calcium-Silicate-Hydrate, Final Report, ERDC/GSL TR-12-30, U.S. Army ERDC, Vicksburg, MS 39180.
[23] Moser, R.D., Allison, P.G., Chandler, M.Q., Investigation of High-Strain Rate Damage in Reactive Powder Concretes Using Instrumented Indentation Techniques, NICOM 4: 4th International Symposium on Nanotechnology in Construction.
[24] Sorelli,L., Constantinides, G., Ulm,F.J., Toutlemonde, F., 2008, “The nano-mechanical signature of Ultra High Performance Concrete by statistical nanoindentation techniques,” Cem.
Concr. Res., 38(12), pp. 1447–1456.
[25] Dolado, J.S., and Breugel, K.V., 2011, “Recent advances in modeling for cementitious materials,” Cem. Concr. Res., 41(7), pp. 711–726.
[26] S. Kamali-Bernard,S., F. Bernard,F., Prince,W. , 2009, “Computer modelling of tritiated water diffusion test for cement based materials,” J. Com. Mat. Sci., 45(2), pp. 528–535.
[27] H. A. Meier, E. Kuhl and P. Steinmann, 2008, “A note on the generation of periodic granular microstructures based on grain size distributions,” Int. J. Numer. Anal. Meth. Geomech. , 32(5), pp.509–522.
[28] Šmilauer,V. Hlaváček,P., Škvára, F., Šulc, R., Kopecký, L., Němeček, J., 2011, “Micromechanical multiscale model for alkali activation of fly ash and metakaolin,” J. Mater. Sci.,46 (20), pp 6545-6555.
[29] Andrade J. E., Fonseca and P. C., Jennings H. M.,2011, “A nanoscale numerical model of calcium silicate hydrate,” Mech.Mater., 43(8), pp. 408-419.
56
[30] Shahsavari R., Pellenq R. J.-M., Ulm F. J., 2011, “Empirical force fields for complex hydrated Calcio Silicate layered Materials,” Phys. Chem. Chem. Phys., 13(3), pp. 1002-1011.
[31] Ulm F. J., Pellenq R. J.-M., Vandamme M., 2009, “Concrete: from atoms to concrete structures,” Comp. Mod. Conc. Struct., Bicanic et al eds., Taylor and Francis Pub., pp. 69, 2010.
[32] Pellenq R. J.M., Kushima A., Shahsavari R. et al., 2009, “A realistic molecular model of cement hydrates,” Proc Natl Acad Sci U S A., 106(38), pp. 16102-16107.
[33] Smilauer,V., Krejci, T., 2009,“Multiscale Model for Temperature Distribution in Hydrating Concrete Multiscale Model for Temperature Distribution in Hydrating Concrete,” Int.J.Mult.Comp.
Eng., 7(2), pp. 135-151.
[34] Maekawa,K., Ishida, T., and Kishi, T., 2003, “Multi-scale Modeling of Concrete Performance: Integrated Material and Structural Mechanics,” J. of Adv. Conc. Tech., 1(2), 91-126.
[35] Ye, G., van Breugel, K. and Fraaij, A.L.A., 2002, “Three-dimensional microstructure analysis of numerically simulated cementitious materials,” Cem. Concr. Res., 33 (3), pp. 215-222.
[36] Princigallo, A., Lura, P., Levita, G. and van Breugel, K., 2003, “Early development of properties in a cement paste: A numerical and experimental study,” Cem. Concr. Res., 33 (7), pp. 1013-1020.
[37] Grondin, F., Dumontet, H., Ben Hamida, A., Mounajed, G. , Boussa, H., 2007, “Multi-scales modelling for the behaviour of damaged concrete,” Cem. Concr. Res., 37(10), pp. 1453–1462.
[38] Yeong, C. L. Y., and Torquato, S., 1998, “Reconstructing random media. II. Three-dimensional media from two-dimensional cuts,” Physical Review E, 58(1), pp. 224-233.
[39] Bishnoi,S., 2008, “Vector Modelling of Hydrating Cement Microstructure and Kinetics,” Doctoral Thesis No. 4606, École Polytechnique Fédérale De Lausanne, Suisse.
[40] Wu, W., Al-Ostaz,A., M., Cheng, A. H.-D.and Song, C. R. ,2011, “Computation of Elastic Properties of Portland Cement Using Molecular Dynamics,” J.Nanomech. Micromech., 1(2), pp. 84-90.
[41] Hill, R., 1963, ‘‘Elastic Properties of Reinforced Solids: Some Theoretical Principles,’’ J. Mech. Phys. Solids., 11, pp. 357–372.
[42] Hashin, Z., and Shtrikman, S., 1963, “A variational approach to the theory of elastic behavior of multiphase materials,” J. Mech. Phys. Solids., 11, pp. 127–140.
[43] Willis, J., 1981, “Variational and related methods for the overall properties of composites,” Adv.
Appl. Mech., 21, pp.1–78.
[44] Nemat-Nasser, S., and Hori, M., 1999, “Micromechanics: Overall Properties of Heterogeneous Materials,” 2nd ed. (Elsevier, Amsterdam).
[45]Sab, K., 1992, “On the homogenization and the simulation of random materials,” Eur. J. Mech.
Solids., 11, pp. 585–607.
57
[46] Huet, C., 1999, “Coupled size and boundary-condition effects in viscoelastic heterogeneous and composite Bodies,” Mech. Mater., 31 (12), pp.787–829.
[47] Kanit, T., Forest, S., Galliet, I., Mounoury, V., and Jeulin, D., 2003, “Determination of the size of the representative volume element for random composites: statistical and numerical approach,” Int. J. Solids Struct., 40(13-14), pp. 3647-3679.
[48] Gitman, I.M., Askes, H., and Sluys, L.J., 2007, “Representative volume: Existence and size determination,” Eng. Frac. Mech.,74(16), pp. 2518-2534.
[49] Bentz, D.P., 2005, “CEMHYD3D: A three dimensional cement hydration and microstructure development package,” Version 3.0, NISTIR7232, US Dept. of Commerce.
[50] Bonen, D., and Diamond, S., 1991, "Application of Image Analysis to a Comparison of Ball Mill and High Pressure Roller Mill Ground Cement," in Proc. 13
th Int.Conf. Cem.Microscopy , pp.
101.
[51] Bernard, F., Kamali-Bernard, S., and Prince,W., 2008, “3D multi-scale modeling of mechanical behaviour of sound and leached mortar,” Cem. Concr. Res., 38(4) pp. 449-458.
[52] Charmrova,R., 2010, “ Modelling and Measurement of Elastic Properties Of Hydrating Cement Paste”, Doctoral Thesis No. 4606, École Polytechnique Fédérale De Lausanne, Suisse.
[53] Kurkuri, S., 2005, “Homogenization of Damaged Concrete Meso-structures using Representative Volume Elements – Implementation and Application to Slang,” Masters Thesis, Inst. of Struct. Mech., Bauhaus–University Weimar, Germany.
[54] Ren, Z.Y., and Zheng, Q.S., 2002, “A Quantitative study of minimum sizes of representative volume elements of cubic polycrystals—numerical experiments,” J. Mech. Phys. Solids., 50 (4), pp. 881-893.
[55] Šmilauer,V. and Bittnar, Z., 2004, “Effects of representative cube size on the simulation of Portland cement hydration in CEMHYD3D model, in: J.Walraven, J. Blaauwendraad, T. Scarpas, B. Snijder (Eds.),” 5th Int.PhD Symp. Civil Eng., A. A. Balkema Pub., pp. 581–587.
[56] Hain,M., and Wrigers, P., 2005,“Simulating the Microstructure of cement based construction materials” Proc. of App. Math. Mech.,5, pp-401-402.
[57] Barbero,E.J., 2008, Finite Element Analysis of Composite Materials. CRC Press, 1st edition. [58]Chung,P.W, Tamma,K.K, Namburu,.R.R., 2001, “Asymptotic expansion homogenization for heterogeneous media: computational issues and applications, Composites Part A, 32(9), pp-1291-1301.
[59] Ramsey,J.J., Chung,P.W., Unpublished article, Army Research Lab, Aberdeen Proving Ground, MD.
[60] Kanit,T., N’Guyen,F., Forest,S., Jeulin, D., Reed,M., Singleton,S., 2006, “Apparent and effective physical properties of heterogeneous materials: Representativity of samples of two materials from food industry,” Comput. Methods Appl. Mech. Engrg., 195, pp.3960–3982.
58
[61] Šmilauer,V. and Bittnar, Z., 2006, “Microstructure-based micromechanical prediction of elastic properties in hydrating cement paste,” Cem. Concr. Res., 36, pp. 1708–1718.
[62] Voigt, W., B.G. Teubner,1928, Lehrbuch der kristallphysik.
[63] Reuss,A., Angew,Z., 1929, “Berchung der fiessgrenze von mischkristallen auf grund der plastizit atsbedingung f¨ur einkristalle,” Math. Mech., 9, pp. 49–58.
[64] Hashin,Z., Elastic Moduli of Heterogeneous Materials, Technical Report No.9, Submitted to ONR, Contract No. 1866(02), Sept. 1960.
[65] W.Wu, A.Al-Ostaz, J.Gladden, A.H.-D.Cheng and G.Li, 2010, “Measurement of Mechanical Properties of Hydrated Cement Paste Using Resonant Ultrasound Spectroscopy,” Jnl. ASTM Int., 7(5).
[66] S. Kamali, M. Moranville, E.G. Garboczi, S. Pren, B. Grard, 2004, “Hydrate dissolution influence on the Young's modulus of cement paste,” Proc. Frac. Mech. of Conc. Strs., Li, et al., (Eds.), Vail.
[67] C.-J. Haeckerd, E.J. Garboczia, J.W. Bullarda, R.B. Bohnb, Z. Sunc, S.P. Shahc, T. Voigt, 2005, “Modeling the linear elastic properties of Portland cement paste,” Cem. Concr. Res., 35, pp. 1948 – 1960
[68] L. Lam, Y.L. Wong, C.S. Poon, 2000, “Degree of hydration and gel/space ratio of high-volume flyash/cement systems,” Cem. Concr. Res., 30, pp.747-756
[69] Bentz, D.P., 1997, “Three-Dimensional Computer Simulation of Portland Cement Hydration and Microstructure Development,” J. Am. Ceram. Soc., 80(1), pp. 3-21.

59
APPENDIX

60
Instruction of ABAQUS job submission in supercomputers at The University of Mississippi
(MCSR)
First, we need to open the "SSH Sequia File Transfer Client Software" which can be
downloaded from the following webpage:
https://shareware.unc.edu/
Then, we need to click on “quick connect”. In the “Connect to Remote Host pop-up
window”, we need to enter:
Hostname: hpcwoods.olemiss.edu
User Name: *********
Password: **********
ABAQUS inp file should be copied and pasted in the place which is shown in the above
picture. Now, we need to open the “SSH Secure Shell”
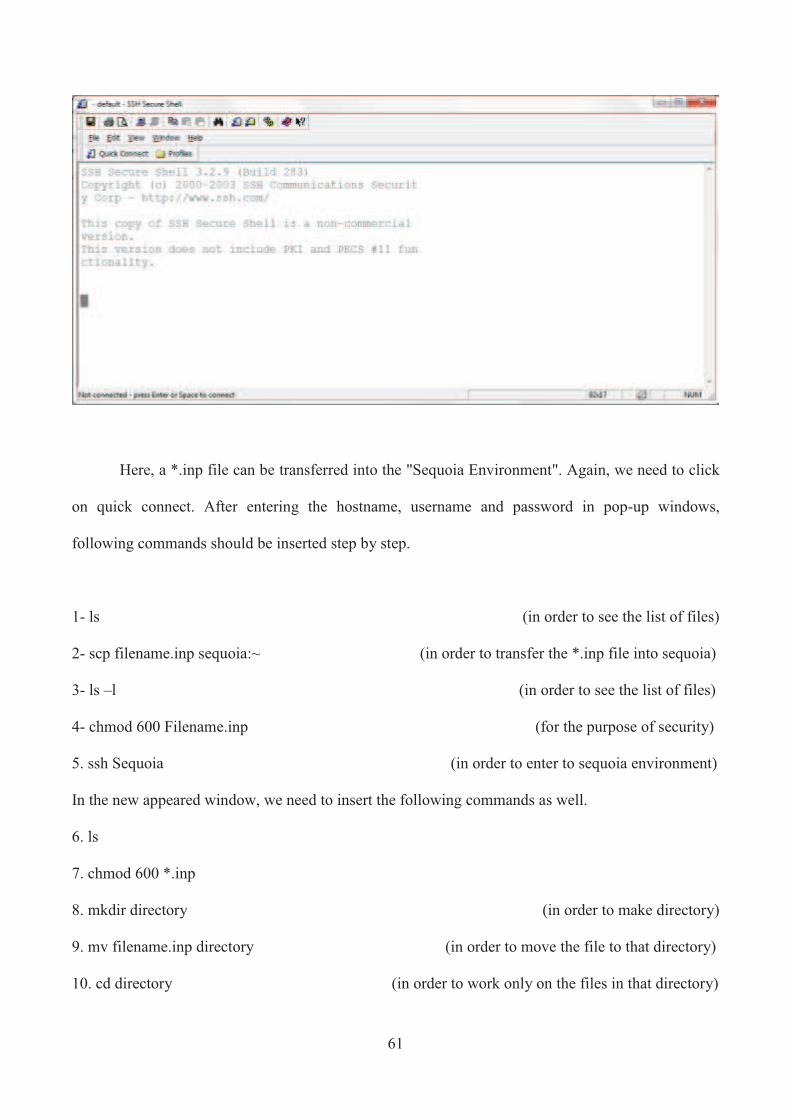
61
Here, a *.inp file can be transferred into the "Sequoia Environment". Again, we need to click
on quick connect. After entering the hostname, username and password in pop-up windows,
following commands should be inserted step by step.
1- ls (in order to see the list of files)
2- scp filename.inp sequoia:~ (in order to transfer the *.inp file into sequoia)
3- ls –l (in order to see the list of files)
4- chmod 600 Filename.inp (for the purpose of security)
5. ssh Sequoia (in order to enter to sequoia environment)
In the new appeared window, we need to insert the following commands as well.
6. ls
7. chmod 600 *.inp
8. mkdir directory (in order to make directory)
9. mv filename.inp directory (in order to move the file to that directory)
10. cd directory (in order to work only on the files in that directory)
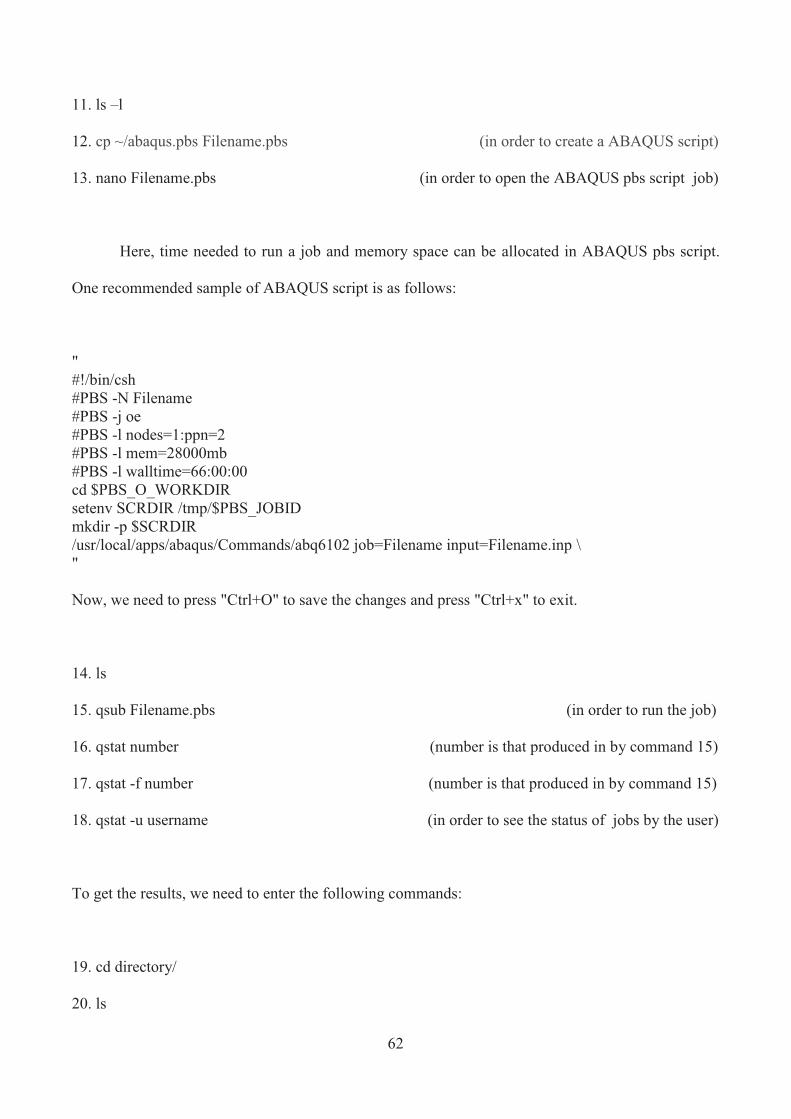
62
11. ls –l
12. cp ~/abaqus.pbs Filename.pbs (in order to create a ABAQUS script)
13. nano Filename.pbs (in order to open the ABAQUS pbs script job)
Here, time needed to run a job and memory space can be allocated in ABAQUS pbs script.
One recommended sample of ABAQUS script is as follows:
" #!/bin/csh #PBS -N Filename #PBS -j oe #PBS -l nodes=1:ppn=2 #PBS -l mem=28000mb #PBS -l walltime=66:00:00 cd $PBS_O_WORKDIR setenv SCRDIR /tmp/$PBS_JOBID mkdir -p $SCRDIR /usr/local/apps/abaqus/Commands/abq6102 job=Filename input=Filename.inp \ " Now, we need to press "Ctrl+O" to save the changes and press "Ctrl+x" to exit.
14. ls
15. qsub Filename.pbs (in order to run the job)
16. qstat number (number is that produced in by command 15)
17. qstat -f number (number is that produced in by command 15)
18. qstat -u username (in order to see the status of jobs by the user)
To get the results, we need to enter the following commands:
19. cd directory/
20. ls

63
21. scp Filename.odb hpcwoods:~
At this moment the Filename.odb is in hpcwoods environment and it can be transferred to the
system of the user.
64
VITA
Mohammadmehdi Shahzamanian Sichani (Medi) was born on 26 of April in 1984 in one of the
historical city of Iran by the name of Isfahan.
He got started studying mechanical engineering in September of 2002 in the field of solid
mechanics at Shahid Bahonar University of Kerman,Iran. Also, he has been student exchange in
Isfahan University of Technology (IUT) for three semesters during his BS study.
From June of 2008 to 2010 he was MSc student of Mechanical and Manufacturing Engineering
Department in Universiti Putra Malaysia (UPM) emphasized on mechanical structures. He has
worked on functionally graded materials (FGMs) and their applications in brake disk. Medi is now
the author of some journal and conference papers related to the functionally graded (FG) brake disk.
In August of 2011, he continues his study as a graduate student in the Department of Mechanical
Engineering at The University of Mississippi in the field of material mechanical behavior especially
brittle materials under advisory of Dr. Arunachalam Rajendran. This MS thesis is a part of his Ph.D.
program. Furthermore, two conference papers and one journal papers related to this thesis has been
published.