Embed Size (px)
Citation preview

Chapter 7 Copyright ©2010 by South-Western, a division of Cengage Learning. All rights reserved 1
ECON
Designed by
Amy McGuire, B-books, Ltd.
McEachern 2010-2011
7CHAPTERProduction and Cost in the Firm
Micro
Chapter 7 Copyright ©2010 by South-Western, a division of Cengage Learning. All rights reserved 2
LO1
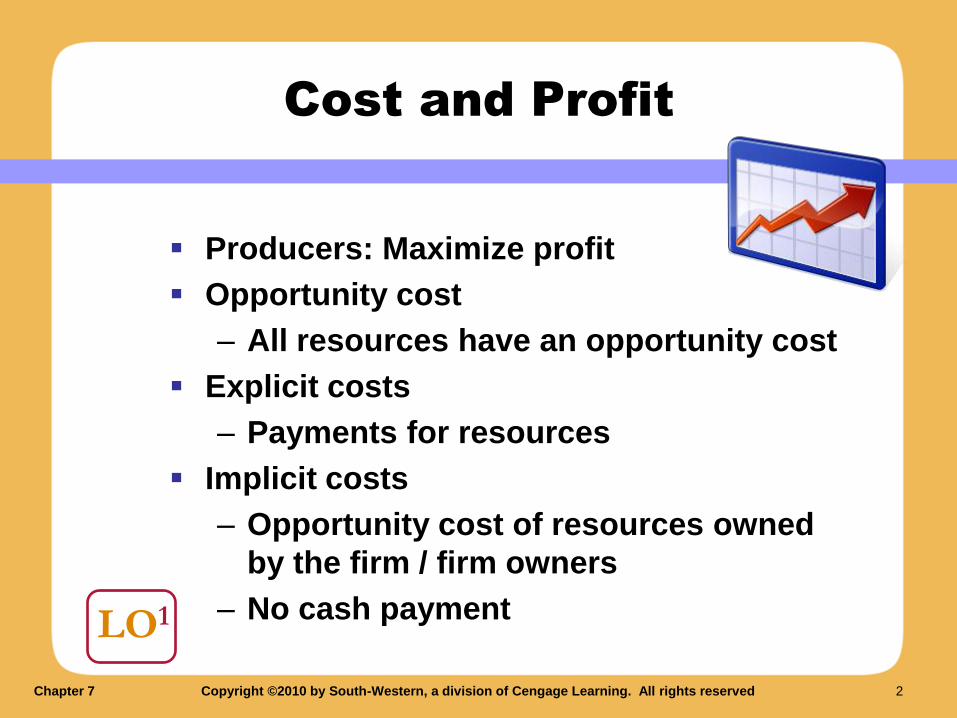
Cost and Profit
Producers: Maximize profit
Opportunity cost
– All resources have an opportunity cost
Explicit costs
– Payments for resources
Implicit costs
– Opportunity cost of resources owned
by the firm / firm owners
– No cash payment
Chapter 7 Copyright ©2010 by South-Western, a division of Cengage Learning. All rights reserved 3
LO1
Alternative Measures of Profit
Accounting profit
– Total revenue minus explicit costs
Economic profit
– Total revenue minus all costs (implicit and
explicit)
• Opportunity cost of all resources
Normal profit
– “Accounting profit in excess of normal profit”
• Accounting profit = Economic + Normal profit
Chapter 7 Copyright ©2010 by South-Western, a division of Cengage Learning. All rights reserved 4
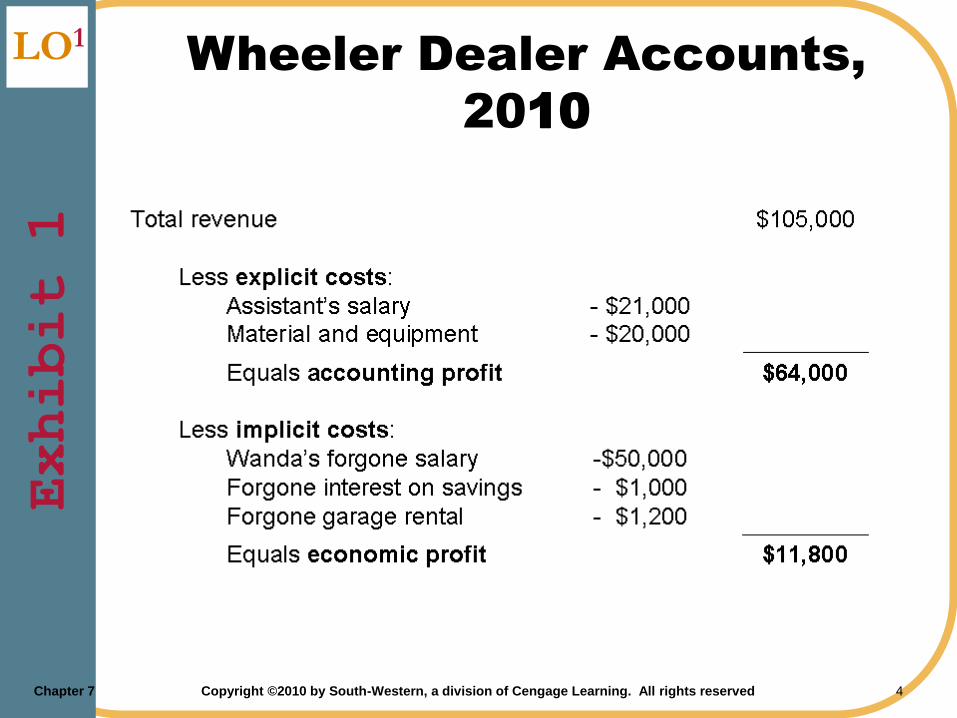
LO1 Wheeler Dealer Accounts,
2010
Exhibit 1
Chapter 7 Copyright ©2010 by South-Western, a division of Cengage Learning. All rights reserved 5
LO2
Production in the Short Run
Variable resources
– Can be varied quickly
Fixed resources
– Cannot be altered easily
Short run
– At least one resource is fixed
Long run
– No resource is fixed
Chapter 7 Copyright ©2010 by South-Western, a division of Cengage Learning. All rights reserved 6
LO2
Law of Diminishing
Marginal Returns
Total product
Production function
– Relationship between amount of
resources employed and total
product
Marginal product
– Change in total product from an
additional unit of resource
Chapter 7 Copyright ©2010 by South-Western, a division of Cengage Learning. All rights reserved 7
LO2
Law of Diminishing
Marginal Returns
Increasing marginal returns
– Marginal product
increases
Diminishing marginal
returns
– Marginal product
decreases
Law of diminishing
marginal returns
Chapter 7 Copyright ©2010 by South-Western, a division of Cengage Learning. All rights reserved 8
LO2
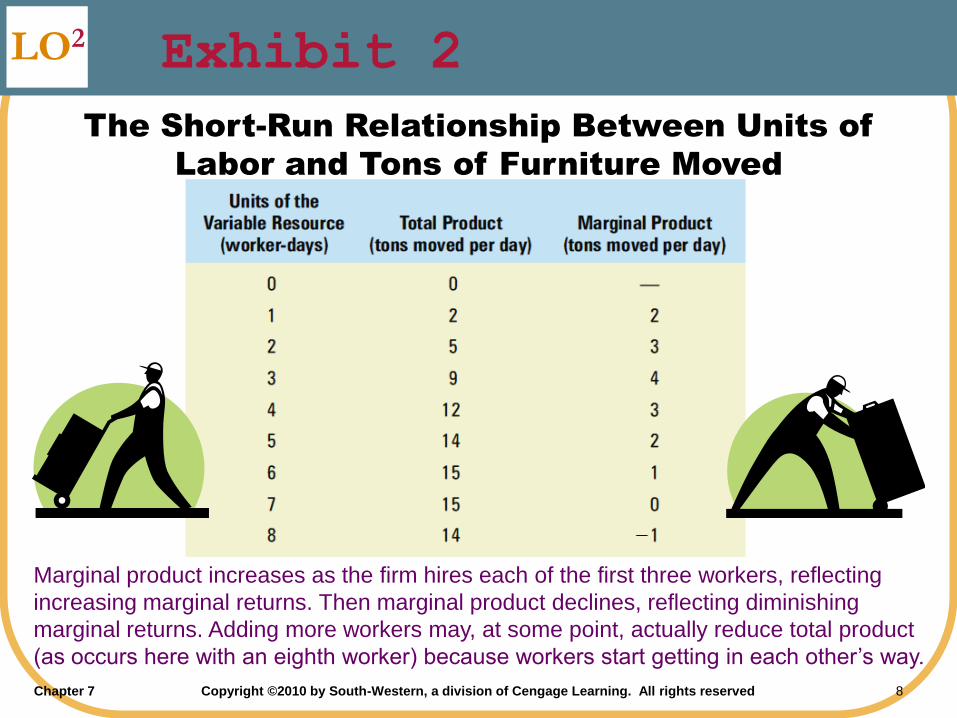
The Short-Run Relationship Between Units of
Labor and Tons of Furniture Moved
Marginal product increases as the firm hires each of the first three workers, reflecting
increasing marginal returns. Then marginal product declines, reflecting diminishing
marginal returns. Adding more workers may, at some point, actually reduce total product
(as occurs here with an eighth worker) because workers start getting in each other’s way.
Exhibit 2
Chapter 7 Copyright ©2010 by South-Western, a division of Cengage Learning. All rights reserved 9
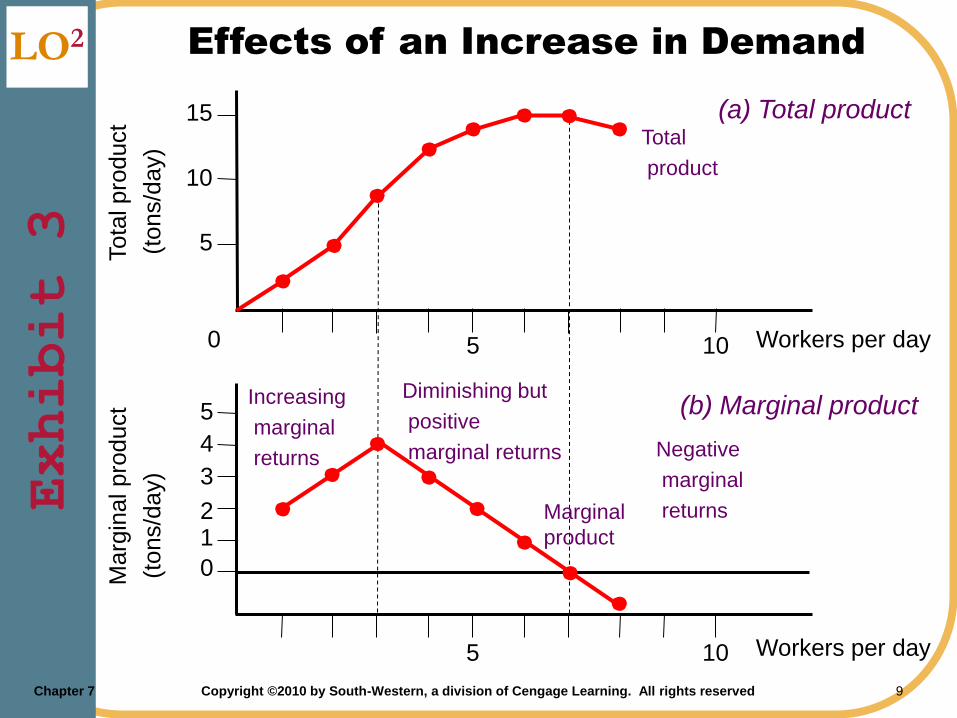
LO2 Effects of an Increase in Demand Exhibit 3 5
10
15Tota
l pro
duct
(tons/d
ay)
5 10 Workers per day0
5 10 Workers per day
1
3
5
Marg
inal pro
duct
(tons/d
ay)
0
2
4
Total
product
Marginal
product
Negative
marginal
returns
Diminishing but
positive
marginal returns
Increasing
marginal
returns
(a) Total product
(b) Marginal product
Chapter 7 Copyright ©2010 by South-Western, a division of Cengage Learning. All rights reserved 10
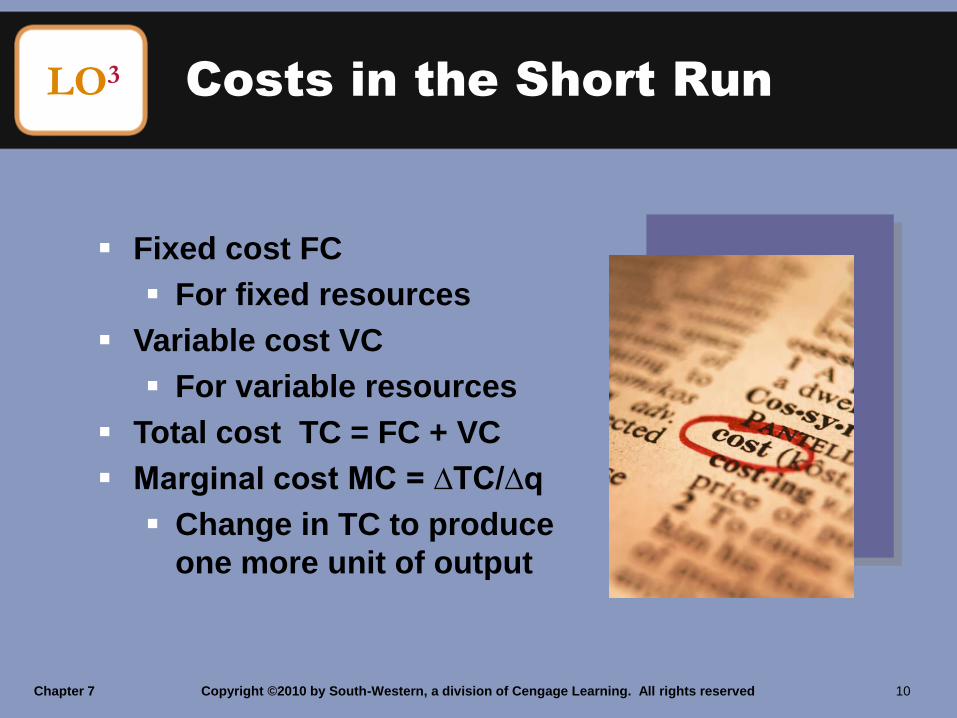
Costs in the Short Run
Fixed cost FC
For fixed resources
Variable cost VC
For variable resources
Total cost TC = FC + VC
Marginal cost MC = ∆TC/∆q
Change in TC to produce
one more unit of output
LO3
Chapter 7 Copyright ©2010 by South-Western, a division of Cengage Learning. All rights reserved 11
Costs in the Short Run
Changes in MC
Reflect changes in
marginal productivity
Increasing marginal returns
MC falls
Diminishing marginal
returns
MC increases
LO3
Chapter 7 Copyright ©2010 by South-Western, a division of Cengage Learning. All rights reserved 12
LO3
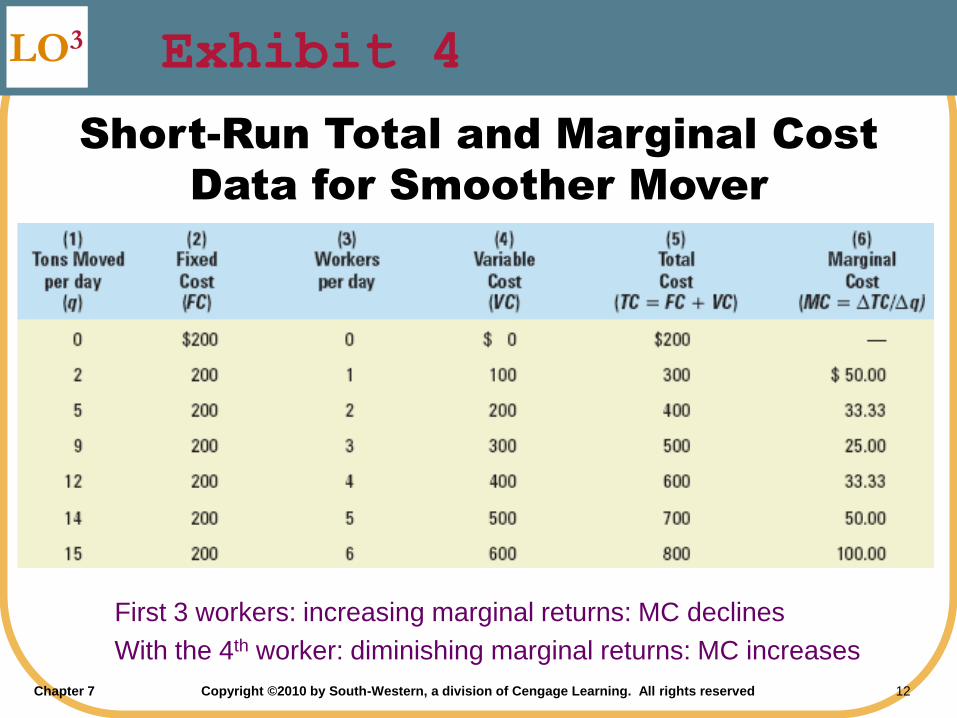
Short-Run Total and Marginal Cost
Data for Smoother Mover
First 3 workers: increasing marginal returns: MC declines
With the 4th worker: diminishing marginal returns: MC increases
Exhibit 4
Chapter 7 Copyright ©2010 by South-Western, a division of Cengage Learning. All rights reserved 13
LO3
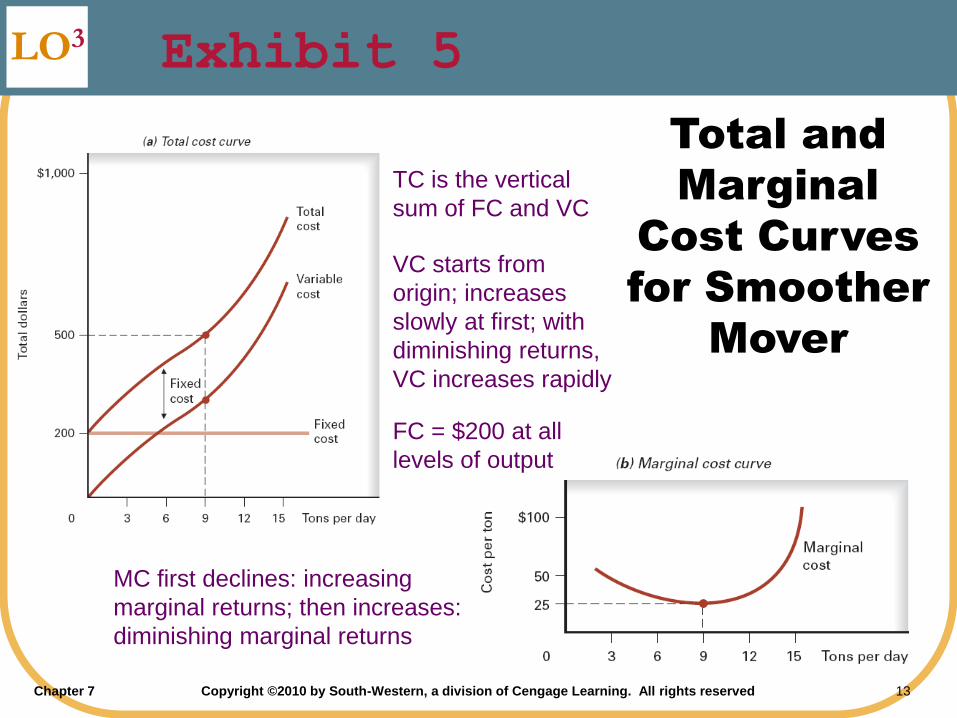
Total and
Marginal
Cost Curves
for Smoother
Mover
FC = $200 at all
levels of output
VC starts from
origin; increases
slowly at first; with
diminishing returns,
VC increases rapidly
TC is the vertical
sum of FC and VC
MC first declines: increasing
marginal returns; then increases:
diminishing marginal returns
Exhibit 5
Chapter 7 Copyright ©2010 by South-Western, a division of Cengage Learning. All rights reserved 14
Average Cost in the
Short Run
Average variable cost AVC = VC/q
Average total cost ATC = TC/q
When MC < average cost
The marginal pulls down the average
When MC > average cost
The marginal pulls up the average
U-shape of average cost curves
Law of diminishing marginal returns
LO3
Chapter 7 Copyright ©2010 by South-Western, a division of Cengage Learning. All rights reserved 15
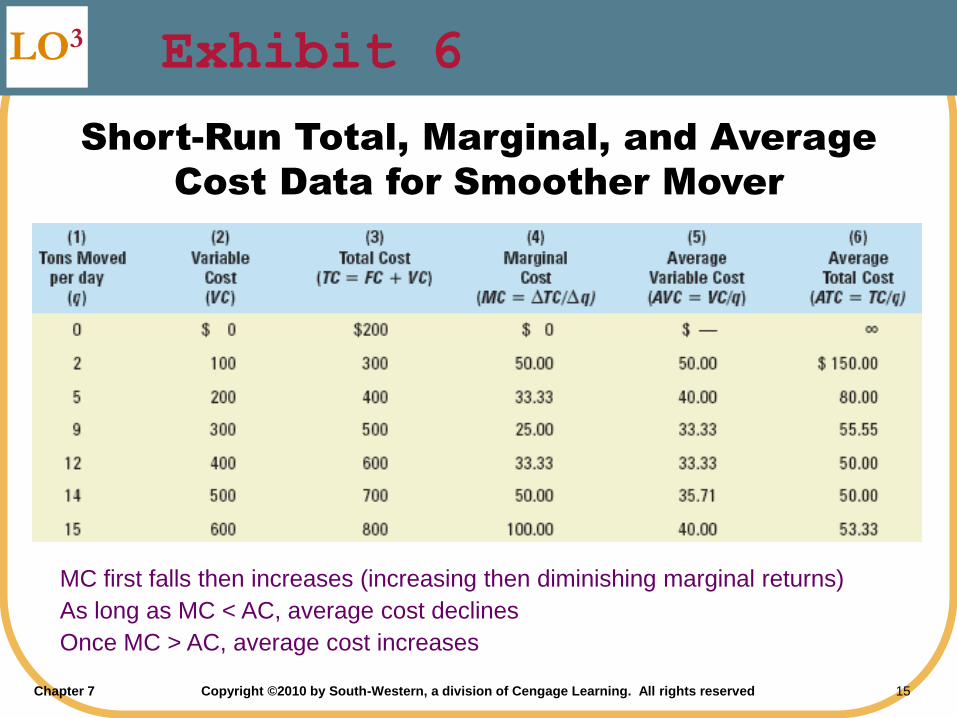
LO3
Short-Run Total, Marginal, and Average
Cost Data for Smoother Mover
MC first falls then increases (increasing then diminishing marginal returns)
As long as MC < AC, average cost declines
Once MC > AC, average cost increases
Exhibit 6
Chapter 7 Copyright ©2010 by South-Western, a division of Cengage Learning. All rights reserved 16
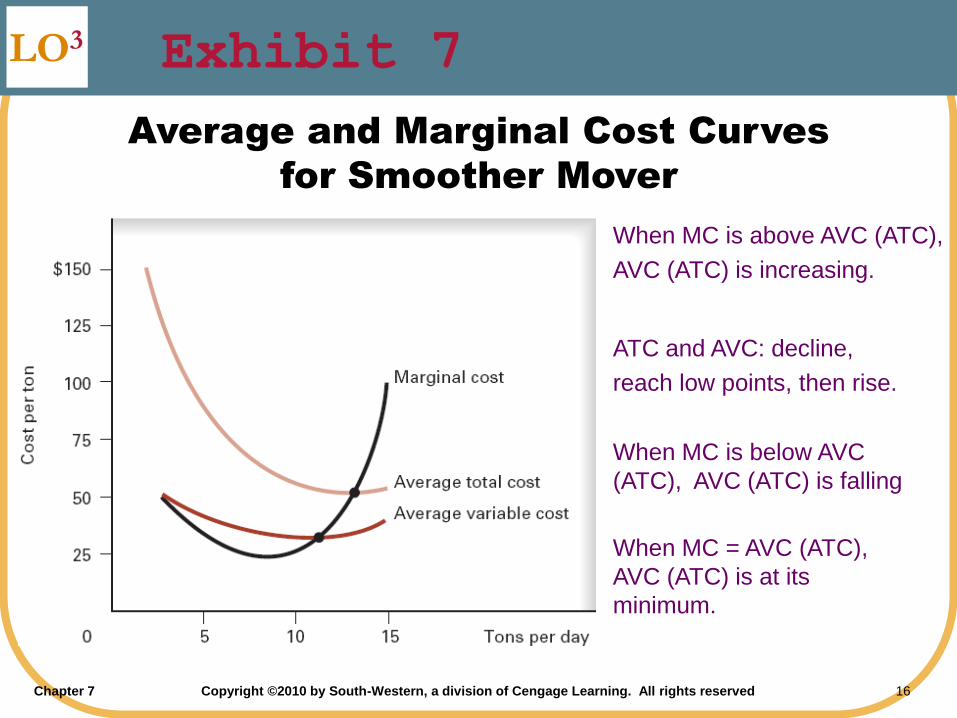
LO3
Average and Marginal Cost Curves
for Smoother Mover
ATC and AVC: decline,
reach low points, then rise.
When MC is below AVC
(ATC), AVC (ATC) is falling
When MC = AVC (ATC),
AVC (ATC) is at its
minimum.
When MC is above AVC (ATC),
AVC (ATC) is increasing.
Exhibit 7
Chapter 7 Copyright ©2010 by South-Western, a division of Cengage Learning. All rights reserved 17
Costs in the Long Run
LO4
All resources can be varied
Planning horizon
Firms plan in the long run
Firms produce in short run
Chapter 7 Copyright ©2010 by South-Western, a division of Cengage Learning. All rights reserved 18
Costs in the Long Run
LO4
U-shaped long-run average cost curve
Economies of scale
– LRAC falls as output expands
Diseconomies of scale
– LRAC increases as output expands
Constant lung-run average cost
Chapter 7 Copyright ©2010 by South-Western, a division of Cengage Learning. All rights reserved 19
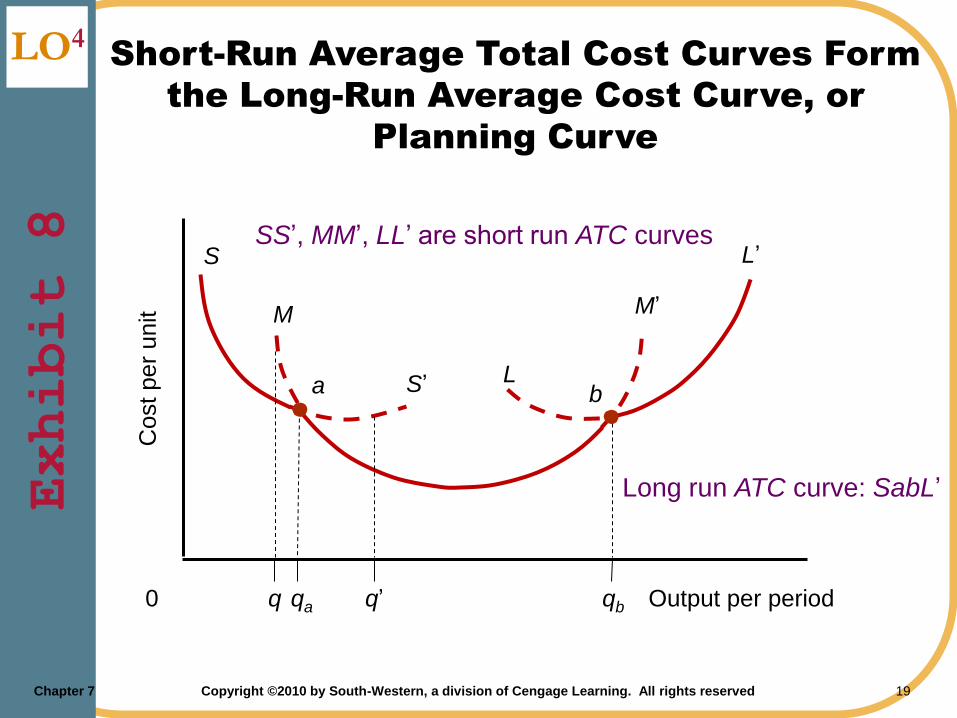
LO4 Short-Run Average Total Cost Curves Form
the Long-Run Average Cost Curve, or
Planning Curve
Exhibit 8
Cost per
unit
0 q qa q’ Output per periodqb
S
S’
M M’
L
L’SS’, MM’, LL’ are short run ATC curves
Long run ATC curve: SabL’
a b
Chapter 7 Copyright ©2010 by South-Western, a division of Cengage Learning. All rights reserved 20
LO4
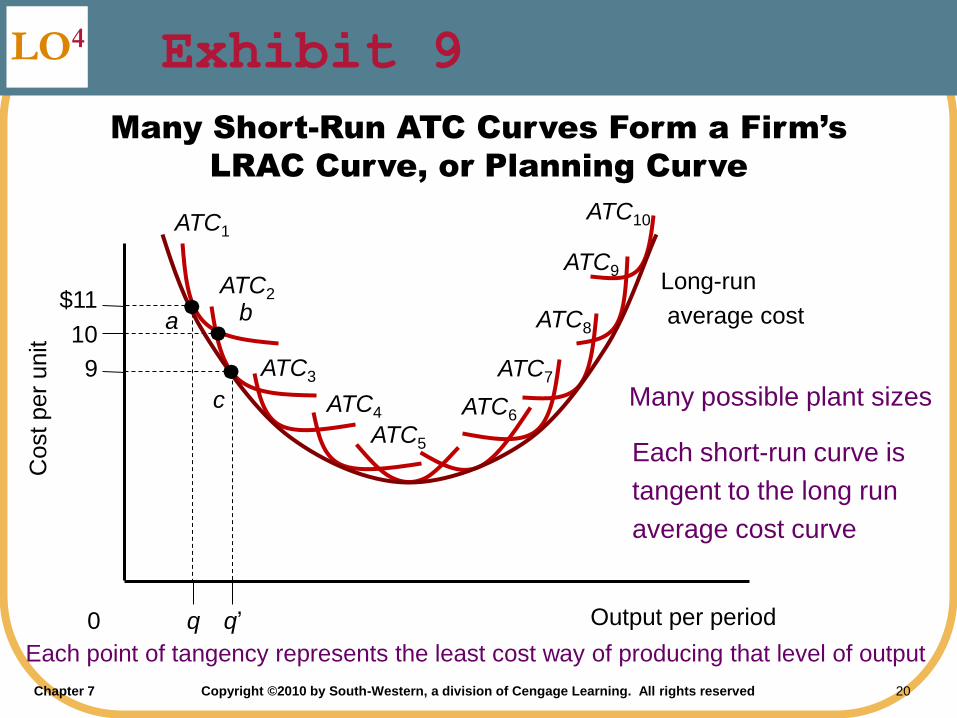
Many Short-Run ATC Curves Form a Firm’s
LRAC Curve, or Planning Curve
ATC1
ATC2
0 q q’ Output per period
Many possible plant sizes
Cost per
unit
$11
10
9
b
ATC3
ATC4
ATC5
ATC6
ATC7
ATC8
ATC9
ATC10
Long-run
average cost
c
a
Each short-run curve is
tangent to the long run
average cost curve
Each point of tangency represents the least cost way of producing that level of output
Exhibit 9
Chapter 7 Copyright ©2010 by South-Western, a division of Cengage Learning. All rights reserved 21
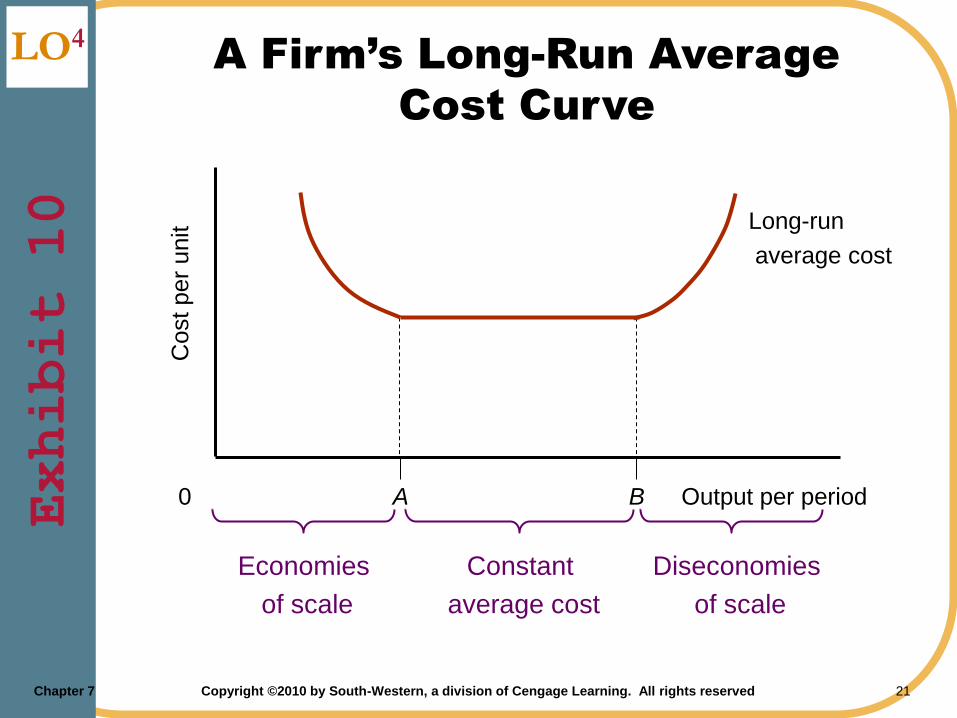
LO4 A Firm’s Long-Run Average
Cost Curve
Cost per
unit
0 A Output per periodB
Economies
of scale
Long-run
average cost
Diseconomies
of scale
Constant
average cost
Exhibit 10
Chapter 7 Copyright ©2010 by South-Western, a division of Cengage Learning. All rights reserved 22
LO4Cas
e Stu
dyScale Economies and Diseconomies at the Movies
Movie theaters
Economies of scale
Decrease in LRAC as the number
of screens initially increases
Diseconomies of scale
Adding even more screens
Problems arise
LRAC starts to increase
Chapter 7 Copyright ©2010 by South-Western, a division of Cengage Learning. All rights reserved 23
Economies and
Diseconomies of Scale
LO4
Plant level
– Particular location
Firm level
– Collection of plants
Chapter 7 Copyright ©2010 by South-Western, a division of Cengage Learning. All rights reserved 24
LO4Cas
e Stu
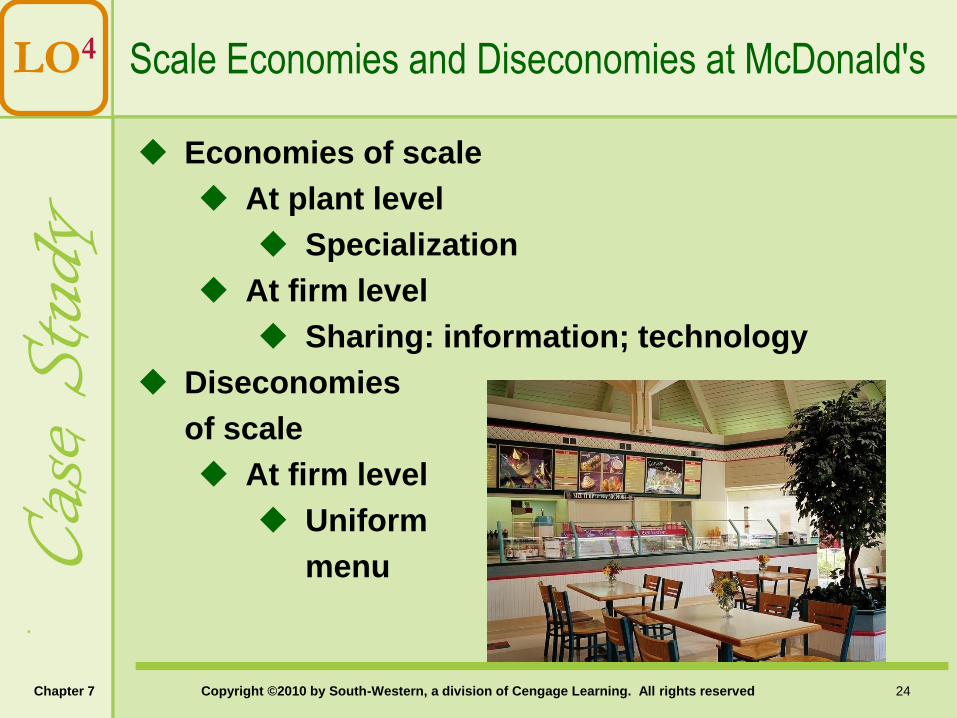
dyScale Economies and Diseconomies at McDonald's
Economies of scale
At plant level
Specialization
At firm level
Sharing: information; technology
Diseconomies
of scale
At firm level
Uniform
menu
Chapter 7 Copyright ©2010 by South-Western, a division of Cengage Learning. All rights reserved 25
A Closer Look at
Production and Cost
Appendix
Production function
Technologically efficient production
Isoquant
– All technologically efficient combinations
of 2 resources
Chapter 7 Copyright ©2010 by South-Western, a division of Cengage Learning. All rights reserved 26
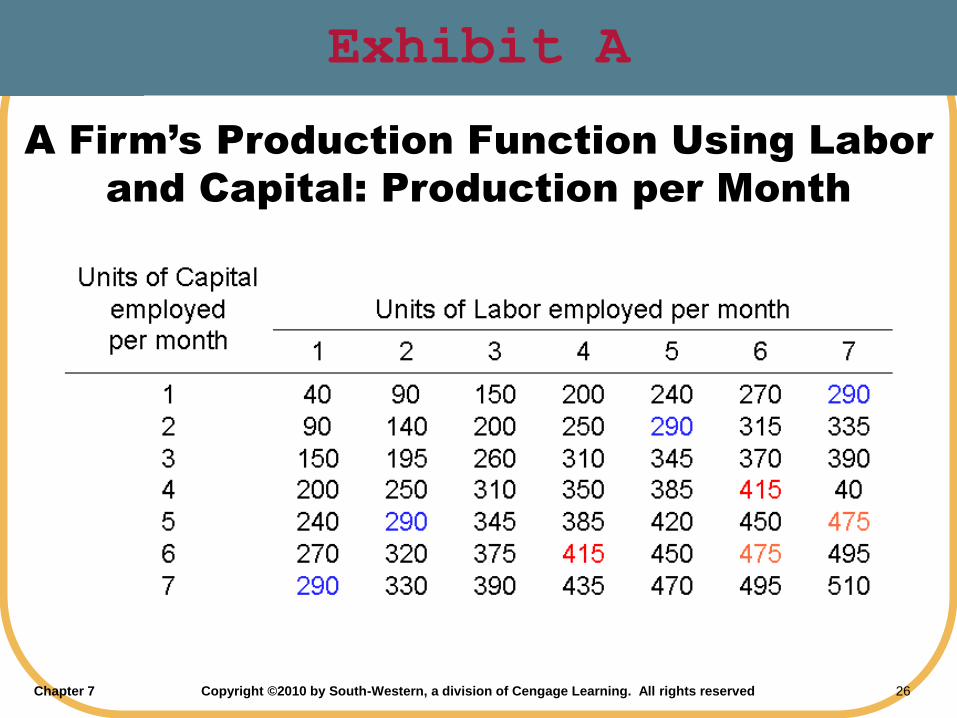
A Firm’s Production Function Using Labor
and Capital: Production per Month
Exhibit A
Chapter 7 Copyright ©2010 by South-Western, a division of Cengage Learning. All rights reserved 27
A Closer Look at
Production and Cost
Appendix
Isoquants
– Farther from origin: greater output rates
– Negative slope
– Don’t intersect
– Convex to the origin
Chapter 7 Copyright ©2010 by South-Western, a division of Cengage Learning. All rights reserved 28
A Closer Look at
Production and Cost
Appendix
Marginal rate of technical substitution
– MRTS
– Slope of isoquant
– MRTS = MPL/MPC
Chapter 7 Copyright ©2010 by South-Western, a division of Cengage Learning. All rights reserved 29
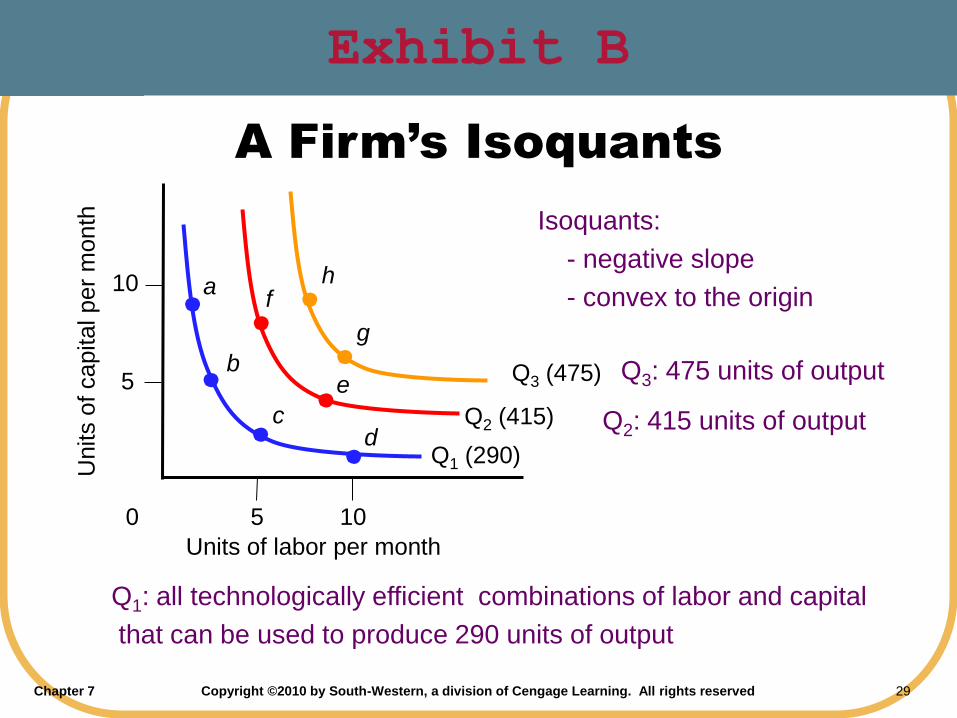
A Firm’s Isoquants
Exhibit B
0 5
Units of labor per month
10
Units o
f capital per
month
5
10
Q1 (290)
Q2 (415)
Q3 (475)
a
b
cd
e
hf
g
Q1: all technologically efficient combinations of labor and capital
that can be used to produce 290 units of output
Q2: 415 units of output
Q3: 475 units of output
Isoquants:
- negative slope
- convex to the origin
Chapter 7 Copyright ©2010 by South-Western, a division of Cengage Learning. All rights reserved 30
A Closer Look at
Production and Cost
Appendix
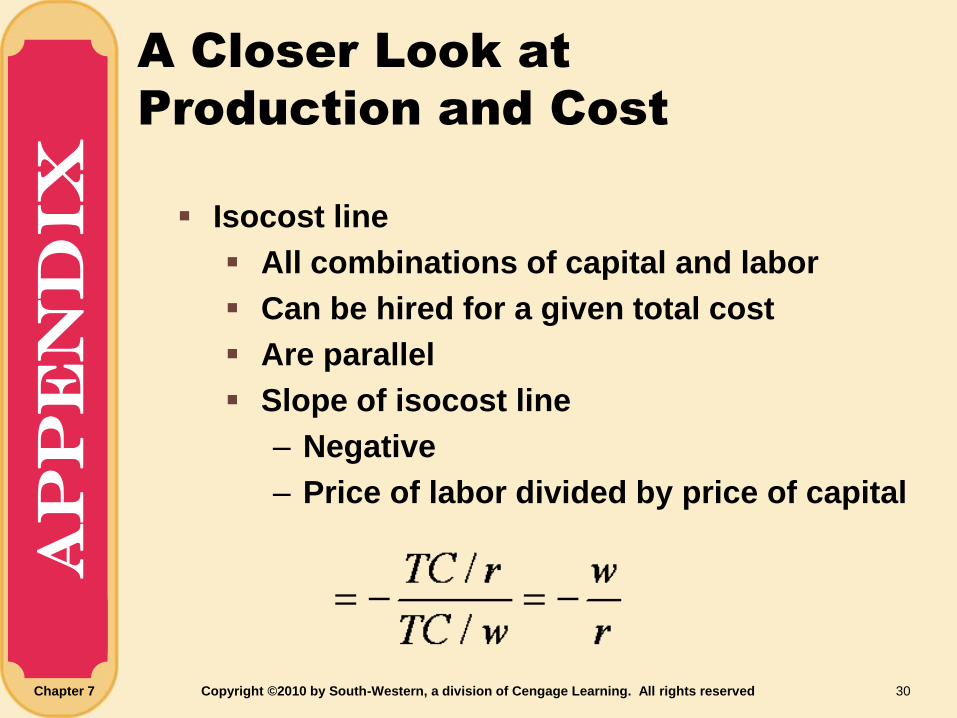
Isocost line
All combinations of capital and labor
Can be hired for a given total cost
Are parallel
Slope of isocost line
– Negative
– Price of labor divided by price of capital
Chapter 7 Copyright ©2010 by South-Western, a division of Cengage Learning. All rights reserved 31
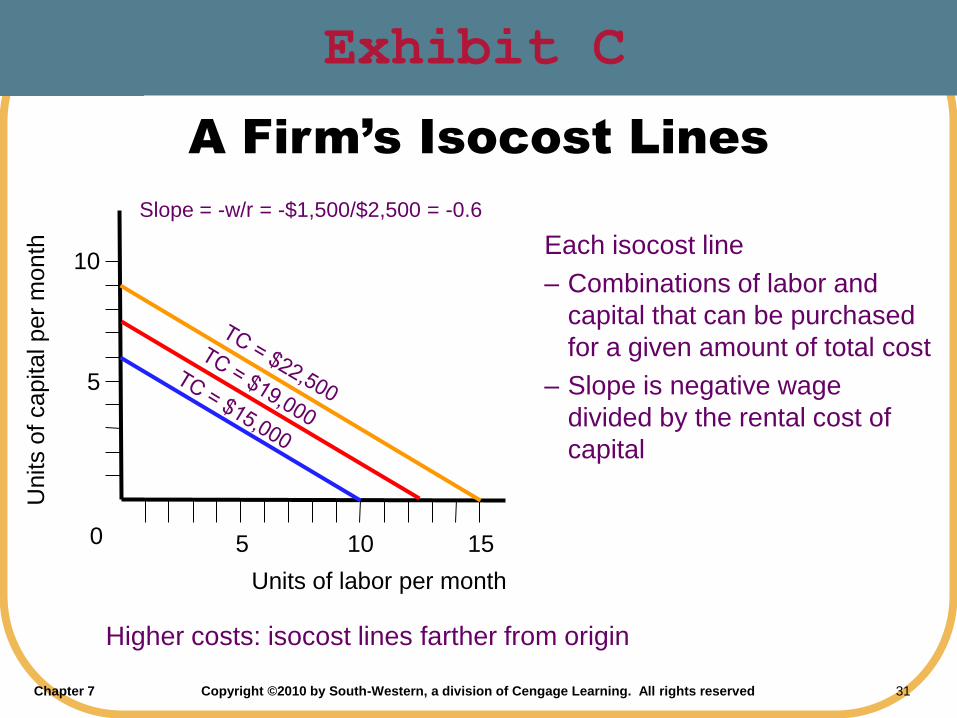
A Firm’s Isocost Lines
Exhibit C
5 10 150
Units of labor per month
5
10
Units o
f capital per
month
Slope = -w/r = -$1,500/$2,500 = -0.6
Each isocost line
– Combinations of labor and
capital that can be purchased
for a given amount of total cost
– Slope is negative wage
divided by the rental cost of
capital
Higher costs: isocost lines farther from origin
Chapter 7 Copyright ©2010 by South-Western, a division of Cengage Learning. All rights reserved 32
A Closer Look at
Production and Cost
Appendix
Profit maximization
Cost minimization
Minimum cost to produce a given output
– Tangency between isocost line and
isoquant
• Slope = MRTS = w/r
Expansion path
Chapter 7 Copyright ©2010 by South-Western, a division of Cengage Learning. All rights reserved 33
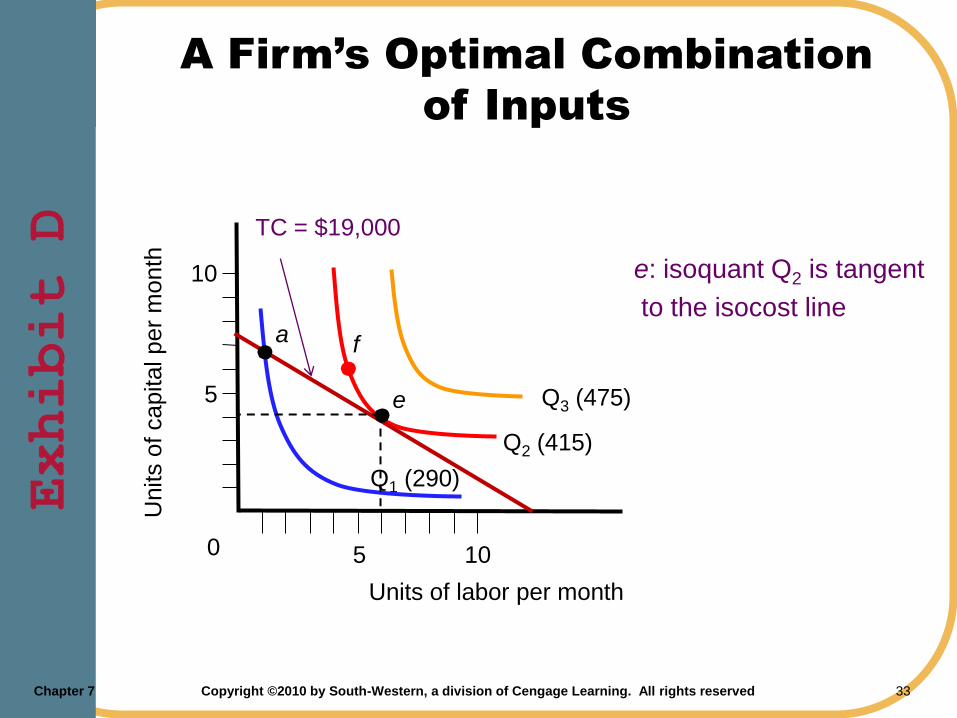
A Firm’s Optimal Combination
of Inputs
Exhibit D
Q1 (290)
Q2 (415)
Q3 (475)
f
5 100
Units of labor per month
5
10
Units o
f capital per
month
TC = $19,000
a
e
e: isoquant Q2 is tangent
to the isocost line
Chapter 7 Copyright ©2010 by South-Western, a division of Cengage Learning. All rights reserved 34
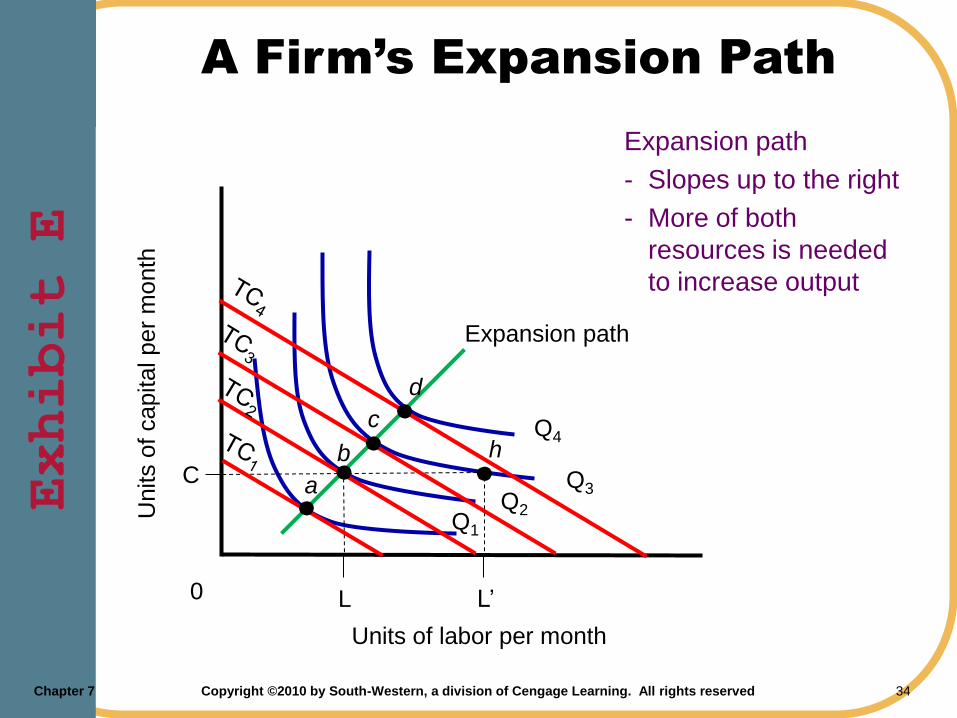
A Firm’s Expansion PathExhibit E
Expansion path
Q2
L L’0
Units of labor per month
C
Units o
f capital per
mo
nth
Q4
Q3
Q1
d
h
a
b
c
Expansion path
- Slopes up to the right
- More of both
resources is needed
to increase output