Embed Size (px)
Citation preview
I
THESIS FOR THE DEGREE OF LICENTIATE OF ENGINEERING
Micro-grinding of titanium
Mohammadali Kadivar
Department of Industrial and Materials Science
CHALMERS UNIVERSITY OF TECHNOLOGY
Gothenburg, Sweden 2018

II
Micro-grinding of titanium
Mohammadali Kadivar
© Mohammadali Kadivar, 2018.
Technical report no IMS-2018-17
Department of Industrial and Materials Science
Chalmers University of Technology
SE-412 96 Gothenburg
Sweden
Telephone + 46 (0)31-772 1000
Printed by Chalmers Reproservice
Gothenburg, Sweden 2018

III
To my beloved mother Tooran and nieces Sara and Saina

IV
Micro-grinding of titanium
Mohammadali Kadivar
Department of Industrial and Materials Science
Chalmers University of Technology
Abstract
Titanium and its alloys are difficult-to-cut materials, commonly used in several application fields,
such as: medicine, aerospace, automotive and turbine manufacturing due to their biocompatibility,
corrosion resistance, excellent mechanical and thermal properties, and light weight. However, its
machining is associated with several difficulties, such as high tool wear, low surface quality, high cutting
forces and high costs. To overcome these problems, using a proper and efficient manufacturing process
seems essential. Micro-grinding provides a competitive edge in the fabrication of small-sized features
and parts with superior surface quality compared with other processes. The quality aspects such as
surface integrity of the parts produced by micro-grinding is influenced by various factors related to the
induced mechanical and thermal loads during the process. Therefore, the machining parameters must be
carefully chosen and controlled. Hence, developing an advanced, highly effective and efficient method,
which can produce high quality micro-parts without inducing sub-surface damage, seems essential.
In this study, experimental and analytical investigations on 2D micro-grinding of titanium are
presented. The run-out of micro-tools can be affected by the relatively high forces induces by mechanical
dressing, meaning that the dressing and tool-conditioning possibilities are limited. Therefore, a proper
set of dressing parameters is obtained for dressing of micro-grinding tools. An analytical model, which
considers grits interaction, heat transfer and actual micro-grinding tool topography is developed which
is able to predict the surface roughness and cutting forces for a given set of dressing and grinding
parameters. It is shown that the topography of the tool varies with changing the dressing parameter
which affects the grinding forces and surface roughness. In the analytical model the actual topography
of the tool is considered in the simulation for the first time. Additionally, the model is able to determine
grinding parameters that generate minimum surface roughness with minimizing the grinding forces. To
determine the correct chip thickness with the maximum material removal rate, an appropriate grinding
tool and optimum process parameters to generate highly accurate contours in a micron scale will be
further analyzed.
Using the analytical model, the effects of process parameters and tool surface topography are
mapped to the process outputs, i.e. surface roughness and grinding forces. The results show that the
analytical model enables the prediction of micro-grinding forces with a total error of 13.5% and surface
roughness with the total error of 16%. The simulation results match with the experimental results to a
greater degree in the low cutting speed range, rather than at higher cutting speeds. The results also
indicate that the dressing parameters, such as the dressing overlap ratio and the speed ratio are influential
factors, affecting surface roughness and grinding forces. Using higher values of dressing overlap ratio
(Ud up to 1830) reduced the surface roughness, however, leads to approximately 70% higher cutting
forces. The observed 40% reduction in the grinding forces is achieved by increasing the cutting speed
from 6 to 14 m/s, but this increases the surface roughness. Higher values of the dressing overlap ratio
reduce the chip cold-welding on the abrasive grains and causes less loading of the tool in form of chip
nests. Welded clogging of the grinding pin at lower Ud values deteriorates the surface quality resulting
in increased surface roughness. Using the up-dressing method leads to lower chip loading over the
surface of the grinding tool, which improves the ground surface. Moreover, the down-dressing of micro-
grinding pins results in higher value of surface roughness and lower grinding forces compared with up-
dressing.
Keywords: Micro machining, dressing, modelling, grinding, tool topography.
V
Preface
This licentiate thesis is based on the work performed at the Institute for Precision Machining
(KSF) at Hochschule Furtwangen University (Germany) between April 2016 and October 2018.
The research has been carried out under the main supervision of Professor Dr.-Ing. Bahman
Azarhoushang from KSF and co-supervision by Professor Peter Krajnik and Professor Uta
Klement, both at the Department of Industrial and Materials Science at Chalmers University of
Technology.
This Thesis consists of an introductory part followed by the appended technical papers:
Paper I: The effect of dressing parameters on micro-grinding of titanium alloy
Mohammadali Kadivar, Bahman Azarhoushang, Sergey Shamray, Peter Krajnik
Precision Engineering 51 (2018): 176-185.
§ Paper 1: The author participated in the planning of experiments with the co-
authors, performed the experiments, all characterization work, measurments, and
data analysis, as wel as writting the paper in cooperation with the co-authors.
Paper II: Modelling of the micro-grinding process considering the grinding tool
topography
Mohammadali Kadivar, Ali Zahedi, Bahman Azarhoushang, Peter Krajnik
International Journal of Abrasive Technology 8.2 (2017): 157-170.
§ Paper 2: The author planed the design of experiments with the co-authors,
performed the experiments, and participated in the simulation study with co-authors,
and validated the results. The author also wrote the paper in cooperation with the
co-authors.
Paper III: The effect of dressing parameters on the chip loading and ground surface
quality by using grinding pins and grinding wheels with very fine grits
Mohammadali Kadivar, Heike Kitzig-Frank, Bahman Azarhoushang
Fourth European Seminar on Precision Optics Manufacturing. Vol. 10326.
International Society for Optics and Photonics, 2017.
§ Paper 3: The author disigend the experiments regadring micro-grinding tests with
the co-authors, performed the experiments, measurments, and data analysis
regadring micro-grinding tests. The author also wrote the paper in cooperation with
the co-authors.
VI
Contents
Abstract ............................................................................................................................... IV
Preface ................................................................................................................................. V
1. Introduction and State-of-the-art ...................................................................................... 1
1.1. Titanium ..................................................................................................................... 2
1.2. Micro-cutting .............................................................................................................. 3
1.3. Micro-grinding ........................................................................................................... 5
1.4. Modeling..................................................................................................................... 8
2. Research objectives......................................................................................................... 10
3. Analytical/theoretical work............................................................................................. 11
3.1. Single-grain scratch .................................................................................................. 11
3.2. Grinding tool modeling ............................................................................................ 12
3.3. Kinematics of the peripheral flank-surface grinding ................................................ 14
4. Experimental work .......................................................................................................... 15
4.1. Micro-grinding experiment: ..................................................................................... 15
4.2. Micro-grinding forces ............................................................................................... 16
4.3. The surface roughness .............................................................................................. 16
4.4. Chip loading ............................................................................................................. 16
4.5. Dressing .................................................................................................................... 17
5. Results and discussions ................................................................................................... 19
5.1. Micro-grinding forces ............................................................................................... 19
5.1.1. The effect of cutting speed ................................................................................. 19
5.1.2. The effect of depth of cut ................................................................................... 20
5.1.3. The effect of dressing overlap ratio ................................................................... 21
5.1.4. The effect of dressing speed ratio ...................................................................... 22
5.2. Surface roughness ..................................................................................................... 24
5.2.1. The effect of depth of cut ................................................................................... 24
5.2.2. The effect of feed rate ........................................................................................ 25
5.2.3. The effect of cutting speed ................................................................................. 25
5.2.4. The effect of dressing overlap ratio ................................................................... 27
5.2.5. The effect of dressing speed ratio ...................................................................... 27
6. Conclusions ..................................................................................................................... 29
6.1. Paper I ...................................................................................................................... 29
6.2. Paper II ..................................................................................................................... 30

VII
6.3. Paper III .................................................................................................................... 31
7. Future Work .................................................................................................................... 32
7.1. Modeling................................................................................................................... 32
7.2. Material characterization .......................................................................................... 32
8. Acknowledgment ............................................................................................................ 33
9. References ....................................................................................................................... 34
1
1. Introduction and State-of-the-art
The society demands are forcing the companies to introduce new micro-parts and new
manufacturing process. Consequently, new manufacturing-application fields are opened which
are becoming more and more interesting for the researchers and industries [1]. There are several
methods to manufacture parts in micro-size which are categorized into two groups: (1) non-
mechanical and (2) mechanical micro-manufacturing. Non-mechanical micro-manufacturing
methods such as lithography, Electro Discharge Machining (EDM), and chemical machining
are expensive, the process time is always long and are normally not suitable specially in the
case of small-batches [2]. Another problem is the dependency of such processes to the type of
the machined material and are in some cases only suitable for some specific materials. For
instant, only conductive materials can be machined using EDM. Hence, using mechanical
manufacturing methods seem highly important.
Mechanical micro-cutting is one of the key technologies to enable the realization of high
accuracy complex micro-products made from a variety of engineering materials including
titanium and its alloy, with high accuracy and capability of producing complex micro-parts 3D
geometry. Micro-cutting raises a great number of issues, mainly due to the size or scale
associated with the process. The size effects can change the whole aspect of the machining
process. Since the ratio of size of part/size or the micro-structure to the cutting tool
dimension/cutting parameters becomes smaller as the results of size effect. Furthermore,
scientific understanding of fundamentals and applications in micro-machining is essential and
much needed to address the underlying necessities for predictability, producibility, repeatability
and productivity of manufacturing at micro-scales [1].
In principle the micro-cutting processes are kinematically similar to conventional cutting
processes. However, they are fundamentally different in several aspects which are listed below
[1]:
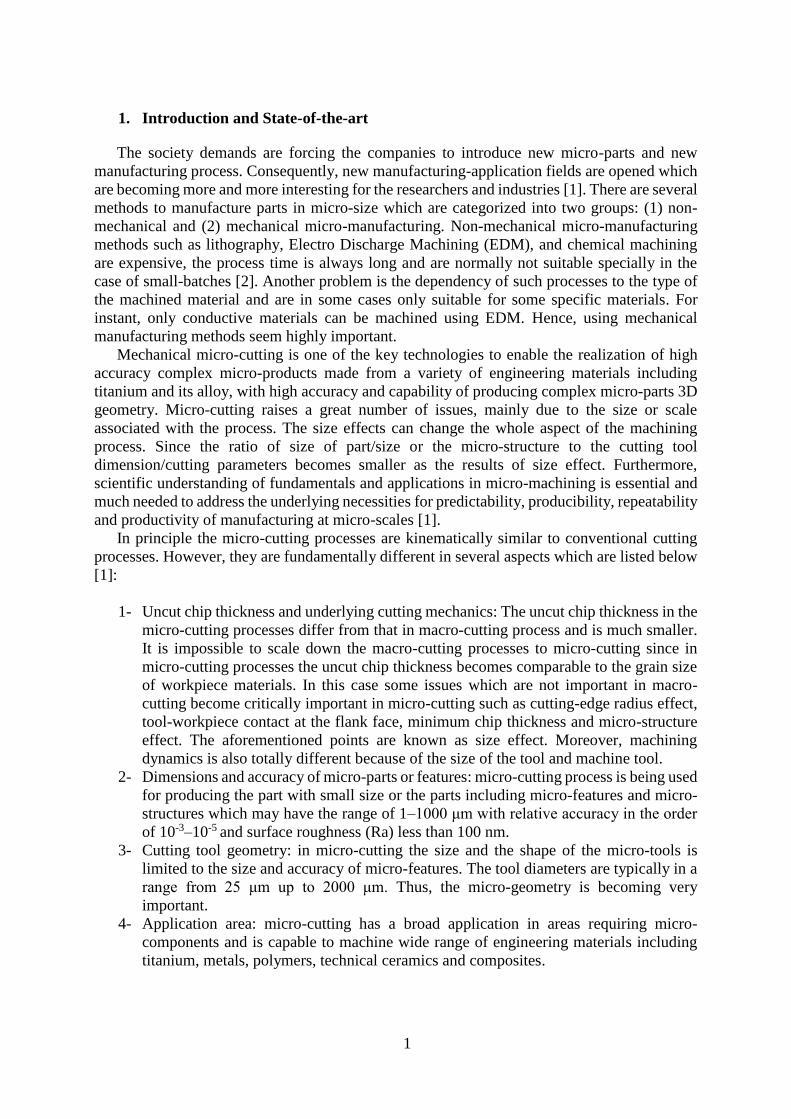
1- Uncut chip thickness and underlying cutting mechanics: The uncut chip thickness in the
micro-cutting processes differ from that in macro-cutting process and is much smaller.
It is impossible to scale down the macro-cutting processes to micro-cutting since in
micro-cutting processes the uncut chip thickness becomes comparable to the grain size
of workpiece materials. In this case some issues which are not important in macro-
cutting become critically important in micro-cutting such as cutting-edge radius effect,
tool-workpiece contact at the flank face, minimum chip thickness and micro-structure
effect. The aforementioned points are known as size effect. Moreover, machining
dynamics is also totally different because of the size of the tool and machine tool.
2- Dimensions and accuracy of micro-parts or features: micro-cutting process is being used
for producing the part with small size or the parts including micro-features and micro-
structures which may have the range of 1–1000 μm with relative accuracy in the order
of 10-3–10-5 and surface roughness (Ra) less than 100 nm.
3- Cutting tool geometry: in micro-cutting the size and the shape of the micro-tools is
limited to the size and accuracy of micro-features. The tool diameters are typically in a
range from 25 μm up to 2000 μm. Thus, the micro-geometry is becoming very
important.
4- Application area: micro-cutting has a broad application in areas requiring micro-
components and is capable to machine wide range of engineering materials including
titanium, metals, polymers, technical ceramics and composites.
2
But choosing a proper micro-machining process is an important issue. Among the micro-
mechanical machining processes, grinding has gained a lot of attention as the final finishing
process. Micro-grinding is an effective process to achieve dimensionally high accurate parts
with superior finished surface.
1.1. Titanium
Difficult-to-cut materials such as titanium and its alloys are commonly used several
application fields. Titanium has superior properties such as great strength property, high
strength-to-weight ratio, corrosion resistance, biocompatibility, good mechanical properties,
and lightweight [3]. The aforementioned advantages make this material suitable for the
fabrication of parts and devices for biomedical applications such as implantable drug-delivery
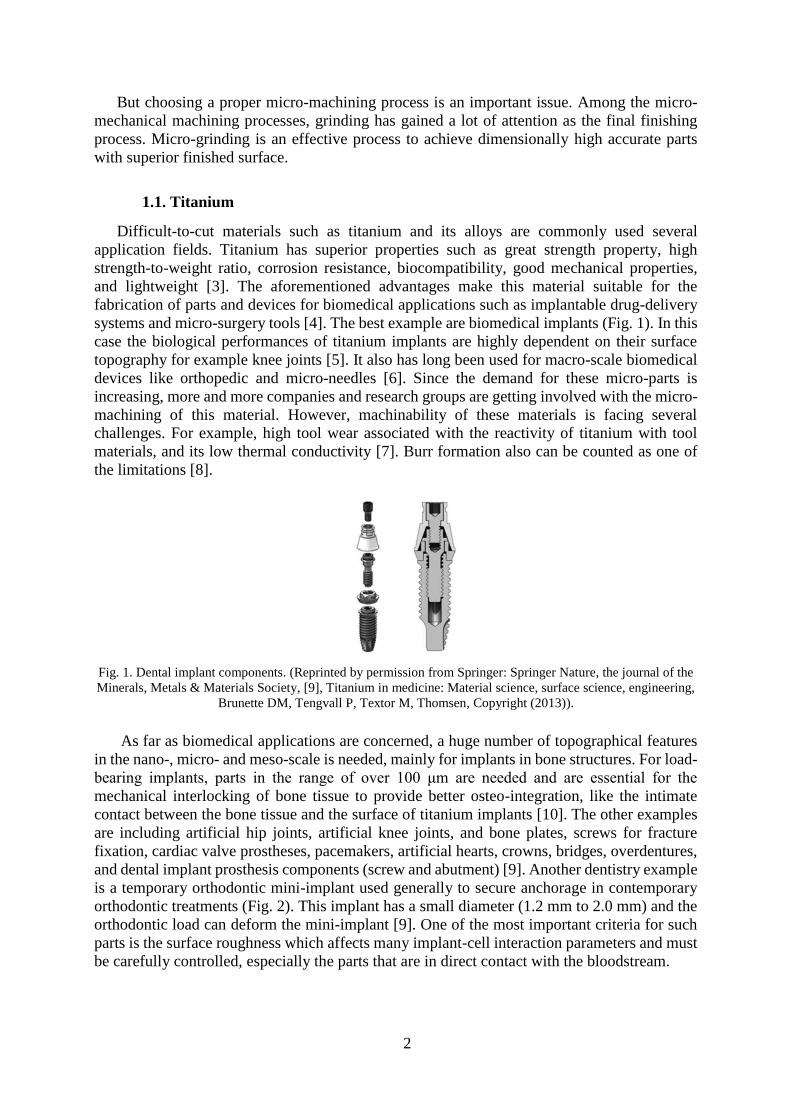
systems and micro-surgery tools [4]. The best example are biomedical implants (Fig. 1). In this
case the biological performances of titanium implants are highly dependent on their surface
topography for example knee joints [5]. It also has long been used for macro-scale biomedical
devices like orthopedic and micro-needles [6]. Since the demand for these micro-parts is
increasing, more and more companies and research groups are getting involved with the micro-
machining of this material. However, machinability of these materials is facing several
challenges. For example, high tool wear associated with the reactivity of titanium with tool
materials, and its low thermal conductivity [7]. Burr formation also can be counted as one of
the limitations [8].
Fig. 1. Dental implant components. (Reprinted by permission from Springer: Springer Nature, the journal of the
Minerals, Metals & Materials Society, [9], Titanium in medicine: Material science, surface science, engineering,
Brunette DM, Tengvall P, Textor M, Thomsen, Copyright (2013)).
As far as biomedical applications are concerned, a huge number of topographical features
in the nano-, micro- and meso-scale is needed, mainly for implants in bone structures. For load-
bearing implants, parts in the range of over 100 μm are needed and are essential for the
mechanical interlocking of bone tissue to provide better osteo-integration, like the intimate
contact between the bone tissue and the surface of titanium implants [10]. The other examples
are including artificial hip joints, artificial knee joints, and bone plates, screws for fracture
fixation, cardiac valve prostheses, pacemakers, artificial hearts, crowns, bridges, overdentures,
and dental implant prosthesis components (screw and abutment) [9]. Another dentistry example
is a temporary orthodontic mini-implant used generally to secure anchorage in contemporary
orthodontic treatments (Fig. 2). This implant has a small diameter (1.2 mm to 2.0 mm) and the
orthodontic load can deform the mini-implant [9]. One of the most important criteria for such
parts is the surface roughness which affects many implant-cell interaction parameters and must
be carefully controlled, especially the parts that are in direct contact with the bloodstream.

3
Fig. 2. An example of an orthodontic mini-implant for anchorage application. (Reprinted by permission from
Springer: Springer Nature, the journal of the Minerals, Metals & Materials Society, [9], Titanium in medicine:
Material science, surface science, engineering, Brunette DM, Tengvall P, Textor M, Thomsen, Copyright
(2013)).
Titanium and its alloy can be also used as a good replacement in Micro-Electro Mechanical
Systems (MEMS) and micro-needles [6,11–13]. Recent process developments have permitted
to use titanium to produce and fabricate of MEMS (Fig. 3). The material has several advantages
that make it more attractive than single-crystal silicon in the field of MEMS [11,13,14]. First,
as a metal it has inherently higher fracture toughness than silicon and other semiconductor
materials [15,16]. Second, it has a greater biocompatibility, makes it suitable for many
applications in vivo.
Fig. 3. Left: Scanning electron micrograph of a titanium-based MEMS comb drive structure, right: Scanning
electron micrograph illustrating sub-micrometer minimum feature size capability. (Republished with permission
of Journal of the Electrochemical Society, from Inductively Coupled Plasma Etching of Bulk Titanium for
MEMS Applications, Parker ER, Thibeault BJ, Aimi MF, Rao MP, MacDonald NC, 152, 10, 2005).
Titanium is also used as a common material in aerospace industries [7]. Furthermore, this
material has a high temperature retention strength, good creep- and oxidation-resistance
properties. These devices are continuously growing with emerging trend in miniaturization of
turbines (Fig. 4), valves, seal supports, cases of fire resistant micro-systems, power generation,
oil and gas extraction, titanium-based micro-aerial vehicle wings, and other major industries
[11,17–21].
1.2. Micro-cutting
The possibility for manufacturing the miniaturized parts is clearly beyond the capability of
current machine tools. Producing the micro-parts requires the use of a specific, and carefully
controlled machining procedure to achieve, easily fabricated, less expensive, high performance
and high-quality micro-parts with complex geometry and high dimensional accuracy. The
4
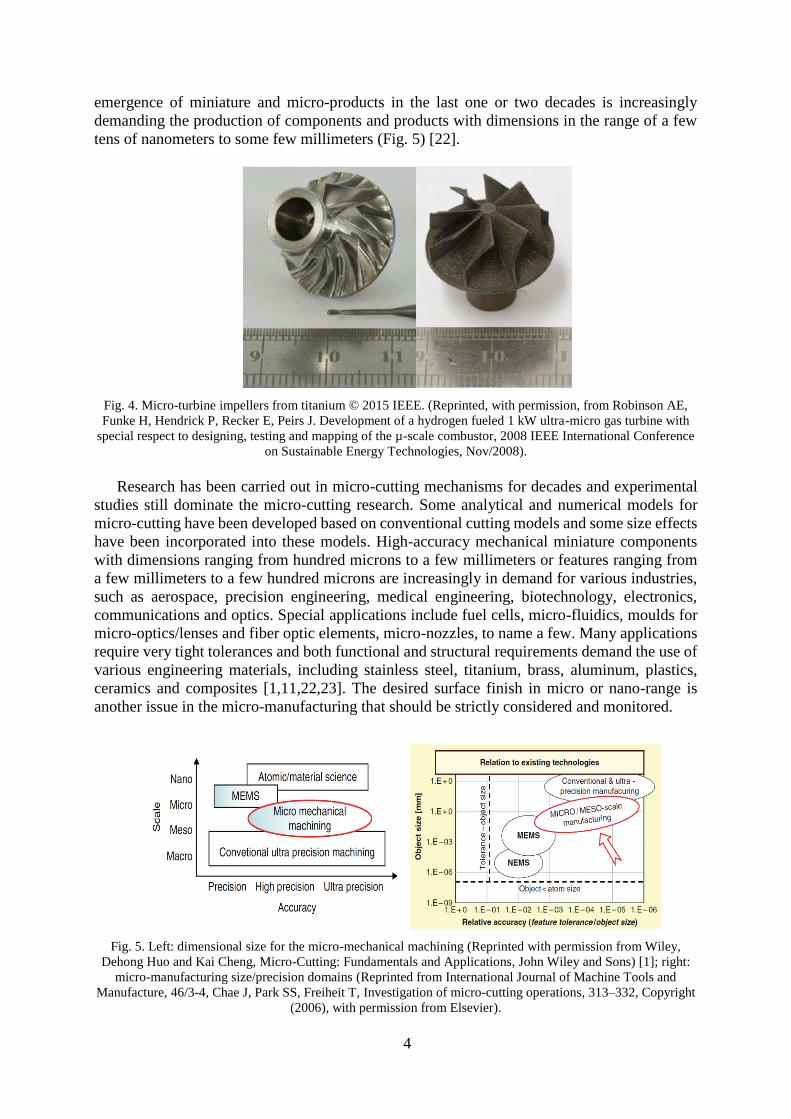
emergence of miniature and micro-products in the last one or two decades is increasingly
demanding the production of components and products with dimensions in the range of a few
tens of nanometers to some few millimeters (Fig. 5) [22].
Fig. 4. Micro-turbine impellers from titanium © 2015 IEEE. (Reprinted, with permission, from Robinson AE,
Funke H, Hendrick P, Recker E, Peirs J. Development of a hydrogen fueled 1 kW ultra-micro gas turbine with
special respect to designing, testing and mapping of the µ-scale combustor, 2008 IEEE International Conference
on Sustainable Energy Technologies, Nov/2008).
Research has been carried out in micro-cutting mechanisms for decades and experimental
studies still dominate the micro-cutting research. Some analytical and numerical models for
micro-cutting have been developed based on conventional cutting models and some size effects
have been incorporated into these models. High-accuracy mechanical miniature components
with dimensions ranging from hundred microns to a few millimeters or features ranging from
a few millimeters to a few hundred microns are increasingly in demand for various industries,
such as aerospace, precision engineering, medical engineering, biotechnology, electronics,
communications and optics. Special applications include fuel cells, micro-fluidics, moulds for
micro-optics/lenses and fiber optic elements, micro-nozzles, to name a few. Many applications
require very tight tolerances and both functional and structural requirements demand the use of
various engineering materials, including stainless steel, titanium, brass, aluminum, plastics,
ceramics and composites [1,11,22,23]. The desired surface finish in micro or nano-range is
another issue in the micro-manufacturing that should be strictly considered and monitored.
Fig. 5. Left: dimensional size for the micro-mechanical machining (Reprinted with permission from Wiley,
Dehong Huo and Kai Cheng, Micro-Cutting: Fundamentals and Applications, John Wiley and Sons) [1]; right:
micro-manufacturing size/precision domains (Reprinted from International Journal of Machine Tools and
Manufacture, 46/3-4, Chae J, Park SS, Freiheit T, Investigation of micro-cutting operations, 313–332, Copyright
(2006), with permission from Elsevier).

5
It has long been known that traditional micro-manufacturing processes, such as chemical
etching and lithography, cannot match future demand of the industry for micro-parts, since
these micro-manufacturing methods are generally planar processes and applicable just for
semiconductor materials. The relative accuracies of micro-manufacturing processes are of the
order of 10-1 to 10-2, whereas the needs of many mechanical miniaturized parts need relatively
more accuracies such as in the order of 10-3 to 10-5 [22] . On the other hand, many applications
of the micro-parts also need high surface quality such as the surface roughness of the machined
surface. Micro-cutting can overcome these problems and achieve aforementioned requirements
of the machining 3D high accurate micro-parts in a wide range of engineering materials. Fig.
5 (left) compares dimensional size and accuracy with other manufacturing methods.
Fig. 6. Simple and compound shaped micro-pin by micro-turning (Reprinted with permission from Wiley,
Dehong Huo and Kai Cheng, Micro-Cutting: Fundamentals and Applications, John Wiley and Sons).
Fig. 5 (right) illustrates micro-manufacturing size/precision domains. Micro-cutting is
normally used to produce part or features with sizes ranging from tens or hundreds of microns
(Fig. 6). Although micro-machining may not be capable of producing the smallest feature size
as would be the case using MEMS and NEMS (Nano Electric Mechanical Systems) processes,
it is a critical technology in bridging the gap between macro and nano-domain [23]
1.3. Micro-grinding
Micro-grinding is an effective process to achieve high dimensionally accurate parts in
machining process with superior surface finish. Due to its capability to generate superior surface
integrity, micro-grinding is normally used as the final production procedure. Unlike other
micro-cutting processes (turning and milling) where ductile or less hard materials are usually
machined, micro-grinding is capable to machine also brittle and hard to cut materials. In the
case of high accuracy, when the micro-features do not require micro-grinding tools, the
relatively large grinding wheels can be used. However, the size and geometry of micro-grinding
tools determine the limit of the size and geometry of micro-parts and micro-features [24]. Fig.
7 shows two different micro-grinding tools with very small sizes.
Fig. 7. Micro-CVD diamond-coated grinding tools (Reprinted from International Journal of Machine Tools and
Manufacture, 50/4, Jan Gäbler, Sven Pleger, Precision and micro CVD diamond-coated grinding tools, 420–424,
Copyright (2010), with permission from Elsevier).
6
The micro-grinding process offers certain advantages over other mechanical micro-
machining technologies and has been researched in several studies. Producing the micro-feature
and micro-parts with the highest quality is a mean goal of micro-grinding which in this case it
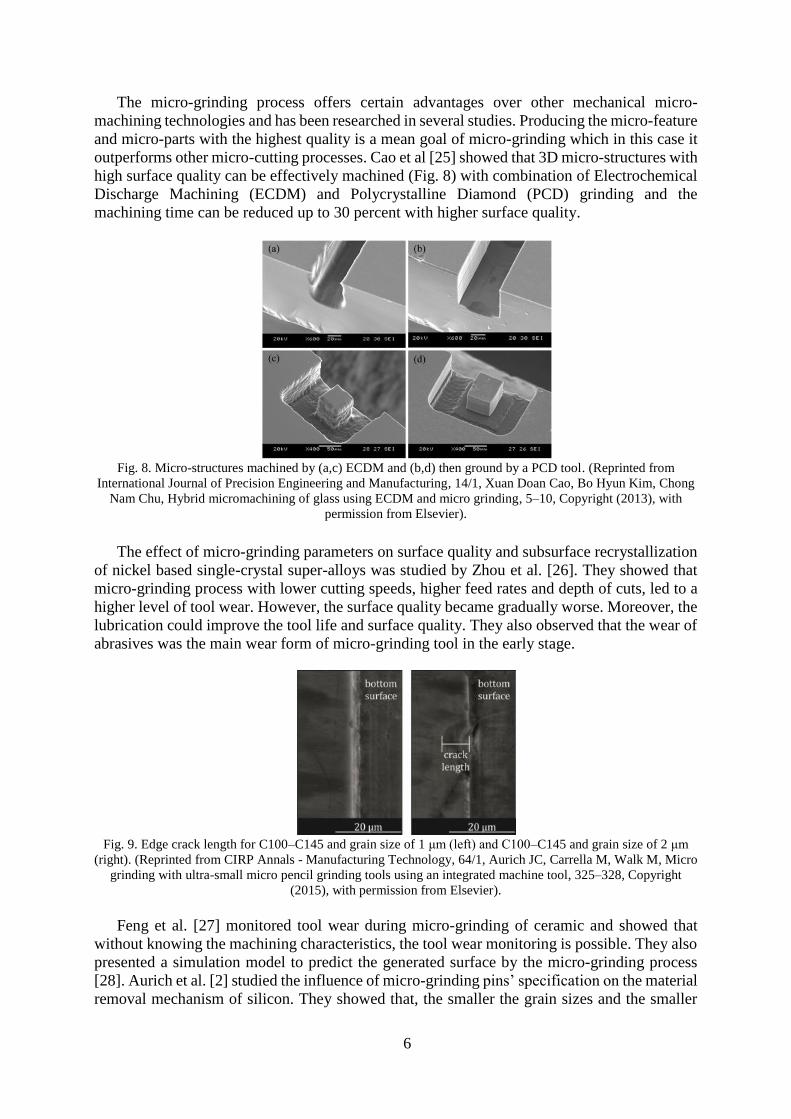
outperforms other micro-cutting processes. Cao et al [25] showed that 3D micro-structures with
high surface quality can be effectively machined (Fig. 8) with combination of Electrochemical
Discharge Machining (ECDM) and Polycrystalline Diamond (PCD) grinding and the
machining time can be reduced up to 30 percent with higher surface quality.
Fig. 8. Micro-structures machined by (a,c) ECDM and (b,d) then ground by a PCD tool. (Reprinted from
International Journal of Precision Engineering and Manufacturing, 14/1, Xuan Doan Cao, Bo Hyun Kim, Chong
Nam Chu, Hybrid micromachining of glass using ECDM and micro grinding, 5–10, Copyright (2013), with
permission from Elsevier).
The effect of micro-grinding parameters on surface quality and subsurface recrystallization
of nickel based single-crystal super-alloys was studied by Zhou et al. [26]. They showed that
micro-grinding process with lower cutting speeds, higher feed rates and depth of cuts, led to a
higher level of tool wear. However, the surface quality became gradually worse. Moreover, the
lubrication could improve the tool life and surface quality. They also observed that the wear of
abrasives was the main wear form of micro-grinding tool in the early stage.
Fig. 9. Edge crack length for C100–C145 and grain size of 1 μm (left) and C100–C145 and grain size of 2 μm
(right). (Reprinted from CIRP Annals - Manufacturing Technology, 64/1, Aurich JC, Carrella M, Walk M, Micro
grinding with ultra-small micro pencil grinding tools using an integrated machine tool, 325–328, Copyright
(2015), with permission from Elsevier).
Feng et al. [27] monitored tool wear during micro-grinding of ceramic and showed that
without knowing the machining characteristics, the tool wear monitoring is possible. They also
presented a simulation model to predict the generated surface by the micro-grinding process
[28]. Aurich et al. [2] studied the influence of micro-grinding pins’ specification on the material
removal mechanism of silicon. They showed that, the smaller the grain sizes and the smaller

7
the grain concentrations, the better the structure quality and the higher the tool wear. Decreasing
the feed rate and increasing the cutting speed improved the surface quality. They also showed
that using smaller tool diameters caused large edge cracks at the edge of the machined area
(Fig. 9).
Butler-Smith et al. [29] presented a new laser-generated diamond micro-grinding tool (Fig.
10) for titanium micro-machining. The new tool was conceited of highly uniform cutting
elements with an optimized layout. This ensures an even distribution of load during the micro-
grinding process. Moreover, the material removal is ideally shared, and an efficient chip flow
occurs during the process. Therefore, the new tool outperformed conventional electroplated
diamond micro-grinding tools for precise applications. A superior finished surface (three times
better than the one induced by a conventional tool) could be achieved with the newly developed
tool and better durability was accomplished.
Fig. 10. Unused laser ablated solid diamond micro-grinding tool (Reprinted from International Journal of
Machine Tools and Manufacture, 59/August, Butler-Smith PW, Axinte DA, Daine M, Solid diamond micro-
grinding tools: From innovative design and fabrication to preliminary performance evaluation in Ti–6Al–4V,
55–64, Copyright (2012), with permission from Elsevier).
Feasibility of Minimum Quantity Lubrication (MQL) in micro-grinding has been
investigated by Lee et al [30]. They proved that using nanofluid MQL can reduce the grinding
forces and improve surface roughness significantly. In the case of grinding forces, the nano-
diamond particles used in MQL as well as higher volumetric concentration of the diamond
particles and smaller size are more effective than nano-Al2O3 particles. However, the Nano-
Al2O3 particles performed more effective than nano-diamond particles in the case of surface
roughness. This cooling-lubrication method can also improve the tribological properties [31].
Fig. 11. a) Circular tool, b) triangular tool, c) square tool, d) D-shaped tool, e) conical tool of 60°, and f) conical
tool of 90°. (Reprinted by permission from Springer: Springer Nature, The International Journal of Advanced
Manufacturing Technology, [32], Fabrication of different geometry cutting tools and their effect on the vertical
micro-grinding of BK7 glass, Asma Perveen, Wong Yoke San, Mustafizur Rahman, Copyright (2013)).
8
In contrast with macro-grinding, the micro-grinding tool can have irregular shapes. Perveen
et al. [32] investigated the performance of the PCD tools with different geometries produced
by EDM process for glass micro-grinding (see Fig. 11). The results indicated that the lowest
grinding force in tangential and normal directions were induced using D-shaped tool, whereas
triangular tool experienced lower force along z-axes (parallel to the tool axis), and the highest
grinding force was induced by the circular tool. The surface roughens was much finer when the
circular tool was used. The tool wear was higher in the case of square and triangular tools
compared to circular and D-shaped tools. Overall, the D-shaped tool performed better compared
to the other geometries.
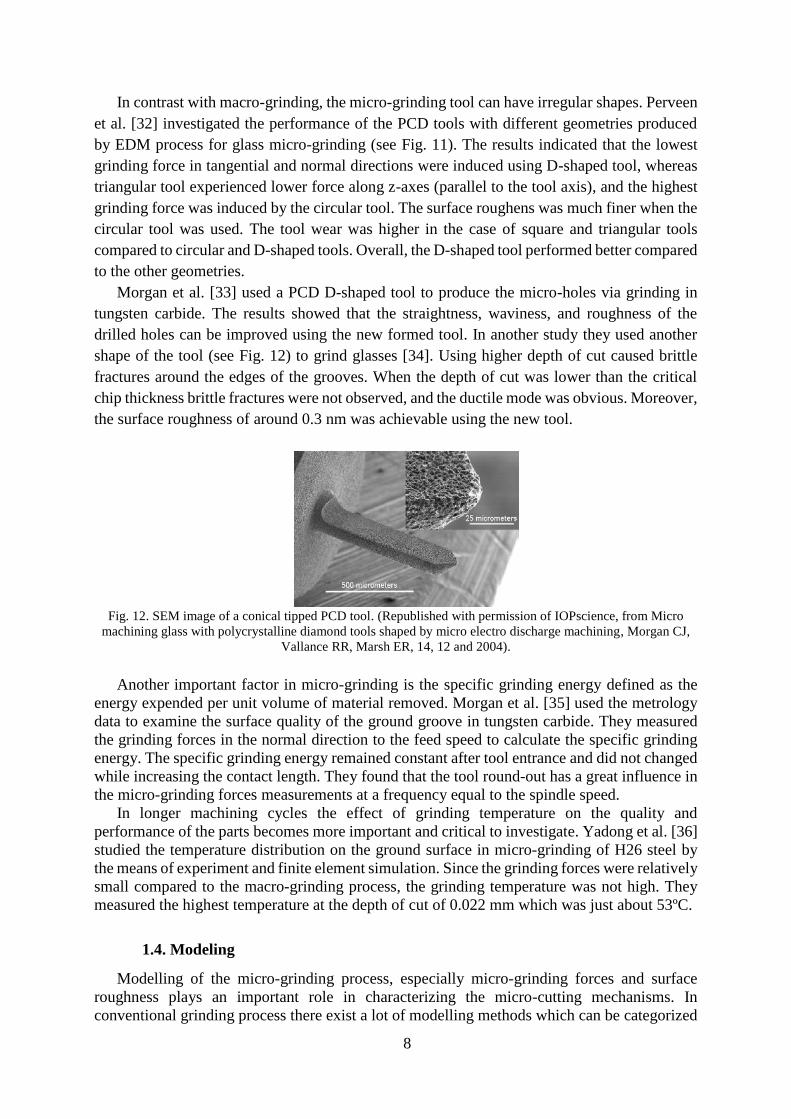
Morgan et al. [33] used a PCD D-shaped tool to produce the micro-holes via grinding in
tungsten carbide. The results showed that the straightness, waviness, and roughness of the
drilled holes can be improved using the new formed tool. In another study they used another
shape of the tool (see Fig. 12) to grind glasses [34]. Using higher depth of cut caused brittle
fractures around the edges of the grooves. When the depth of cut was lower than the critical
chip thickness brittle fractures were not observed, and the ductile mode was obvious. Moreover,
the surface roughness of around 0.3 nm was achievable using the new tool.
Fig. 12. SEM image of a conical tipped PCD tool. (Republished with permission of IOPscience, from Micro
machining glass with polycrystalline diamond tools shaped by micro electro discharge machining, Morgan CJ,
Vallance RR, Marsh ER, 14, 12 and 2004).
Another important factor in micro-grinding is the specific grinding energy defined as the
energy expended per unit volume of material removed. Morgan et al. [35] used the metrology
data to examine the surface quality of the ground groove in tungsten carbide. They measured
the grinding forces in the normal direction to the feed speed to calculate the specific grinding
energy. The specific grinding energy remained constant after tool entrance and did not changed
while increasing the contact length. They found that the tool round-out has a great influence in
the micro-grinding forces measurements at a frequency equal to the spindle speed.
In longer machining cycles the effect of grinding temperature on the quality and
performance of the parts becomes more important and critical to investigate. Yadong et al. [36]
studied the temperature distribution on the ground surface in micro-grinding of H26 steel by
the means of experiment and finite element simulation. Since the grinding forces were relatively
small compared to the macro-grinding process, the grinding temperature was not high. They
measured the highest temperature at the depth of cut of 0.022 mm which was just about 53ºC.
1.4. Modeling
Modelling of the micro-grinding process, especially micro-grinding forces and surface
roughness plays an important role in characterizing the micro-cutting mechanisms. In
conventional grinding process there exist a lot of modelling methods which can be categorized
9
into three groups according to: analytical methods, experimental methods and numerical
methods [37–39]. Analytical modelling of the micro-cutting process is still at its early stage.
There are only a few effective models to predict the micro-grinding process. There are two
approaches to analytically model the grinding forces [1]. The first approach calculates cutting
forces using the instantaneous uncut chip cross section, and the second one is based on a slip
line field model which calculates cutting forces using the shear plane area [1]. Most of the
models are adapted from the two conventional approaches, but taking one or more size effects
into consideration. The size effects which have been modelled to predict micro-cutting forces
include ratio of feed rate to tool radius; cutter edge radius [40]; minimum chip thickness [41];
and micro-structure effect.
The chip thickness in micro-grinding is relatively small compared to macro-grinding. Thus,
mechanical and thermal interactions between a single grit and the material which is removed
are linked to the size effect phenomena. Here the generated surface is not only related to the
process parameters and micro-grinding wheel properties, but also the microstructure of
removed material, accordingly the crystallographic effect should be also considered in micro-
machining. On the other hand, the diameter of the tool in micro-machining is much smaller than
those in macro-machining. Thus, the ploughing and friction forces which are normally
neglected in macro-machining become more significant. Moreover, in micro-grinding the
grinding tool deformation and deflection become more critical. These phenomena are not only
related to the size of the tool, but also to the physical mechanisms of the material removal
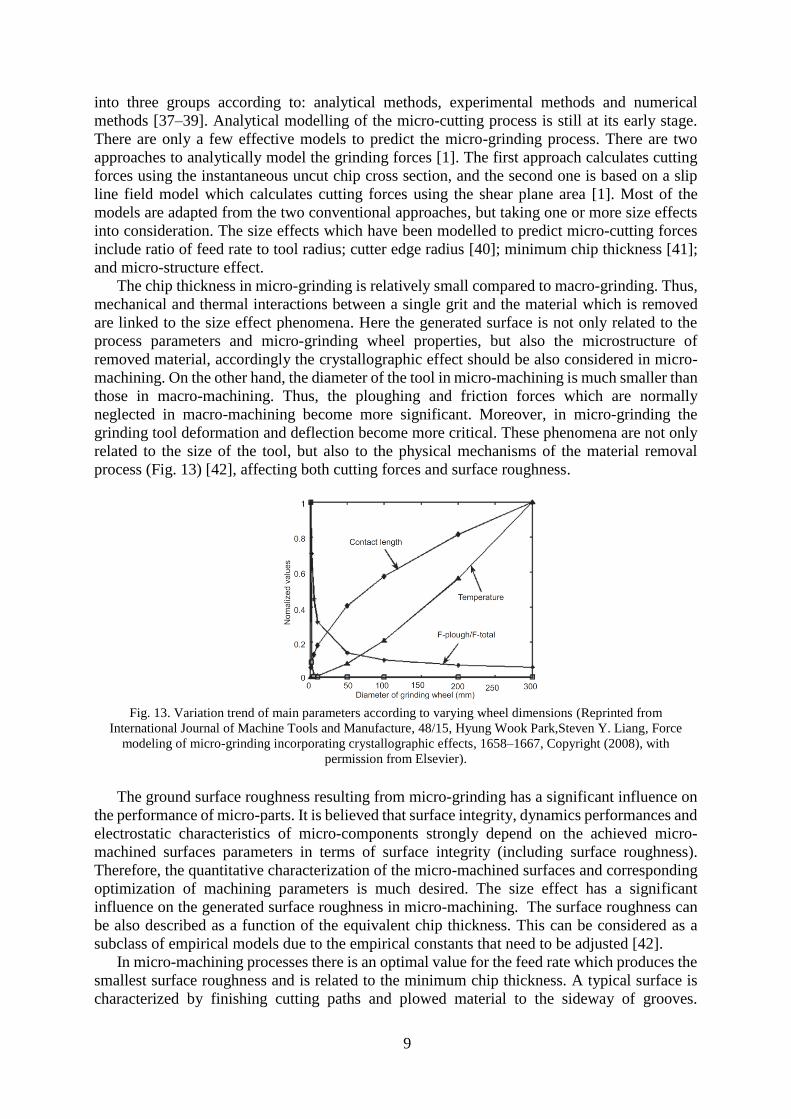
process (Fig. 13) [42], affecting both cutting forces and surface roughness.
Fig. 13. Variation trend of main parameters according to varying wheel dimensions (Reprinted from
International Journal of Machine Tools and Manufacture, 48/15, Hyung Wook Park,Steven Y. Liang, Force
modeling of micro-grinding incorporating crystallographic effects, 1658–1667, Copyright (2008), with
permission from Elsevier).
The ground surface roughness resulting from micro-grinding has a significant influence on
the performance of micro-parts. It is believed that surface integrity, dynamics performances and
electrostatic characteristics of micro-components strongly depend on the achieved micro-
machined surfaces parameters in terms of surface integrity (including surface roughness).
Therefore, the quantitative characterization of the micro-machined surfaces and corresponding
optimization of machining parameters is much desired. The size effect has a significant
influence on the generated surface roughness in micro-machining. The surface roughness can
be also described as a function of the equivalent chip thickness. This can be considered as a
subclass of empirical models due to the empirical constants that need to be adjusted [42].
In micro-machining processes there is an optimal value for the feed rate which produces the
smallest surface roughness and is related to the minimum chip thickness. A typical surface is
characterized by finishing cutting paths and plowed material to the sideway of grooves.
10
However, many other marks can be found such as cracks produced by thermal impact, back
transferred material, and craters produced by grain fracture [43]. Other factors that characterize
a ground surface are the traverse and longitudinal waviness produced by the random nature of
the grinding process and by machining vibration. When considering all these factors, a complete
prediction of the surface topography is a complicated problem.
Analytical models for surface roughness are based on the micro-structure of the micro-
grinding tool in both one and two dimensions [1]. The tool topography is described using
simplification factors such as constant distance between cutting edges and uniform height of
the cutting edges. Similar assumptions are used to describe the surface roughness based on chip-
thickness models. The number of cutting edges over the surface of the micro-tool are limited
and the wheel topography has a significant effect on the generated surface roughness [1].
Moreover, the parameters such as grit protrusion heights, inter-grit spacing, and grit locations
play a very crucial role in the modeling as well. The first step in these modeling approaches is
the prediction of micro-tool topography. Like in macro-grinding the abrasive grains are
stochastically distributed over the surface of the grinding tool in micro-grinding, and it is
difficult to model the exact topography of the micro-grinding tool. Anandita et al. [44] studied
the kinematic effects of tool topography and process parameters on the generated surface in
micro-grinding process. They generated the micro-grinding tool considering all the realistic
randomness from an electroplated micro-grinding tool. They also proposed an algorithm to
minimize the clustering of grits in order to guarantee an appropriate homogeneous grit
distribution over the micro-grinding tool surface. Kunz and Mayor [45] used the machine vision
analysis to measure the static grit density of the abrasive grains in micro-grinding and provided
probability distributions for the static grit density.
The micro-grinding temperature is another important factor which has been model by
Gorodkova et al [46]. Their proposed thermo-physical model allowed to calculate the cutting
zone temperature and the temperature distribution over the ground surface as a function of
process parameters such as the cutting speed, the feed rate, the cutting depth, and the material
properties.
2. Research objectives
This work will present experimental and modeling studies on micro-grinding of titanium.
Up to now, the understanding of the effects of micro-grinding parameters on workpiece surface
quality is still vague. Moreover, the research addressing the micro-precise contour production
on hard-to-cut materials by micro-grinding is limited. Additionally, the micro-grinding of
titanium has not been fully investigated, yet. Dressing and tool conditioning, which directly
influence the surface quality and grinding forces, have been neglected by researchers and there
is no analytical study or dedicated modeling available considering the effects of dressing
parameters on the grinding process outputs.
In this thesis a methodology for predicting the micro-grinding forces and surface roughness
has been introduced – based on analytical analysis of the process. For the first time, the effects
of the dressing parameters on micro-grinding forces and surface roughness are investigated.
The analysis considers the single-grit interaction and micro-grinding tool topography. The
results have been validated with experimental tests. In experimental work, diamond grinding
tools have been used to generate accurate contours, to achieve the above-mentioned objectives.
An appropriate grinding tool to generate and desired surface quality, along with optimal
grinding and dressing parameters have been determined. Moreover, a chip-thickness threshold
has been proposed for achieving maximum material removal. Mechanical dressing technique
using a diamond roller has been used for dressing the grinding tool, and its effect on surface
quality and forces has been studied.
11
The goal of this project is to investigate the effect of grinding and conditioning parameters
on the chip formation mechanism, micro-grinding forces, and surface quality, chip loading and
present a mathematical and analytical model for the process.
3. Analytical/theoretical work
The number of research papers in the field of micro-grinding process are mainly limited to
study of the grindability of various materials, and there is a lack of modelling studies in this
field. In this thesis, the single-grain scratch test results for titanium have been adopted from the
work of Feng and Cai [47]. Based on these experimental data, a regression model has been
extracted for the normal grain force and pile-up characteristics as functions of grain size, cutting
speed, and depth of cut. The results for single-grain scratch, i.e., the force values and the
chipping mechanism have been further extended to the aggregate action of the cutting grains in
the grinding process through the kinematics of the process. The simulated forces and surface
roughness have also been validated by the experimental results in micro-grinding of Ti6Al-4V.
3.1. Single-grain scratch
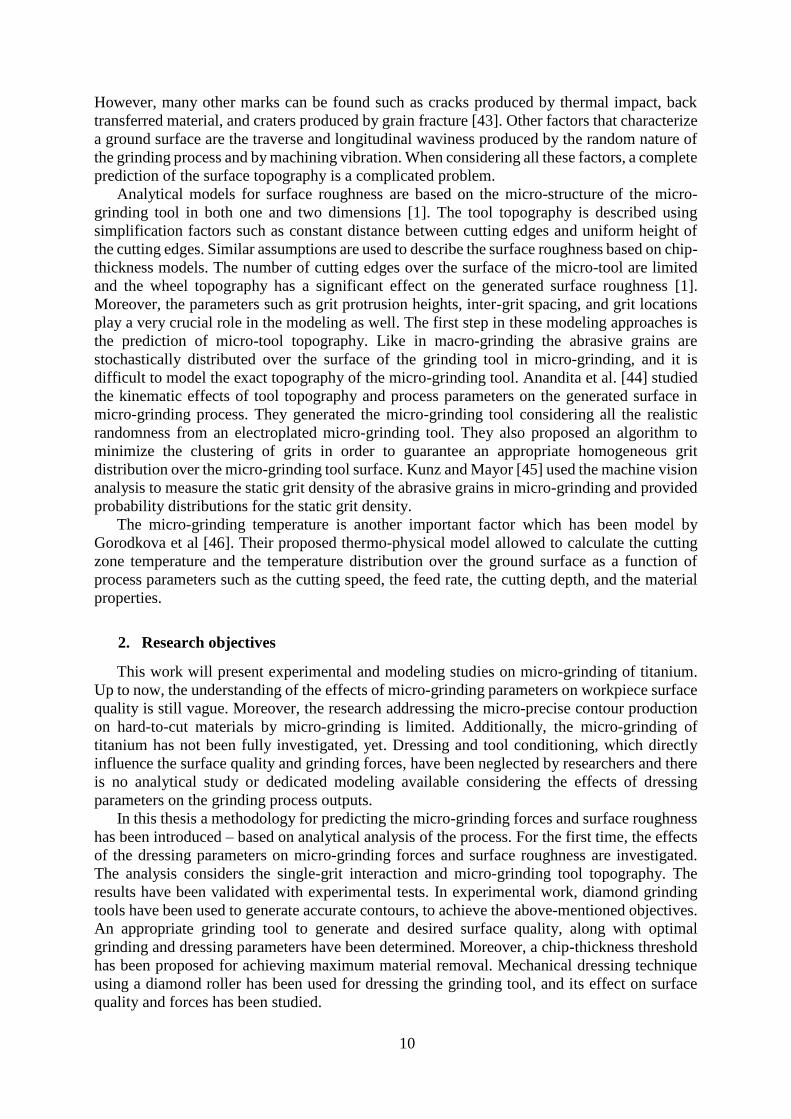
The experimental results for single grain scratch test of the Ti6Al-4V were extracted from
Feng and Cai [47] work, where experiments were performed at different cutting speeds and
depth of cuts. The results for grinding normal and tangential forces (Fng and Ftg), which
correspond to different grain cross-section areas (Ag) are shown in Fig. 14. The cross section
was measured after single grain test considering the plastic deformation and piled up. The cross-
section area of grain and workpiece engagement could be directly related to the depth of cut
and the average grain size (assuming that the tip of the abrasive grain has a spherical form).
Fig. 14. Single-grit grinding forces: a) normal grinding force, b) tangential grinding force [47]
Higher cutting speeds led to lower forces which constantly increased with the increase of
the Ag. Increasing the cutting speed reduces the plowing and sliding in the process. The grinding
forces consist of cutting, plowing, and sliding components [48]. The proportional relation
between the forces and flat wear area implies a constant average contact pressure �̅� and friction
coefficient µ between the wear flat and work material, where these relationships can be
expressed as follows:
𝐹𝑛𝑔 = kAg+ δ�̅� (1)
𝐹𝑡𝑔 = ∅k Ag + µδ�̅� (2)
where, Fng and Ftg are normal and tangential forces in single grain test, k is the specific
grinding force acting upon a unit grinding section area, ∅ the coefficient relating to half cone

12
angle of the grain, δ is the actual area of contact between the wear flats and the workpiece. The
ratio of Ftg/Fng can be derived from Eqs. 2 and 3 as:
𝜀 =∅kA+ µδ�̅�
kA+ δ�̅�= µ + mC𝑒 (3)
where coefficient m=k(∅-µ), and Ce = Ag/Fng can be associated with the cutting ability of
the single grain. When Ag becomes bigger, more material will be removed, Ce is a coefficient
of removal ability. Eq. 3 can be used for studying the friction coefficient, which reveals a linear
relation between ε and Ce. It theoretically shows that the value of ε at Ce=0 is the friction
coefficient µ where no cutting occurs and just the plastic deformation associated with plowing
happens.
The theoretical model of the single grain test is not accurate since many parameters such as
material pile-up and external sources such as vibration and machine stiffness are not considered
in the model. Thus, a regression model was fit as a function of the average grain size, the cutting
speed, and the depth of cut from the results of single-grain test. The unknown coefficients in
the model are determined by minimizing the mean square error of the experimental results (least
square method) [49]. The regression equation for the normal grain force can be accordingly
expressed as:
𝐹𝑛𝑔 = 4.65 × 10⁻⁵𝑑𝑔1.36
𝑎𝑔0.513𝑣𝑐
−0.082 (4)
where dg is the average grain size (µm), ag is the grain depth of cut in µm, and vc is the
cutting velocity in m/s. Eq. 4 implies that the cutting force increases when utilizing larger grains
and depths of cut; and reduces with increasing the cutting velocity. It is valid for the boundary
conditions set by the conducted scratch tests of titanium for the range of performed
experimental parameters listed in Table 1. The regression latter reflects the dependency of the
material properties on the strain-rate. According to this regression equation, the cutting
conditions of each cutting grain can be expressed in the term of a normal cutting force. Through
integration of the normal grain force components of individual grains in tool-workpiece contact
zone of the actual grinding process, the total normal grinding force can be estimated. The
tangential force component can be further obtained by applying the grinding force ratio (ratio
of the tangential to the normal grinding force; assumed value of 0.65 for the titanium) [50].
Table 1. Process parameters for single-grain test [47]
Parameters Values
Low cutting speed, vc (m/min) 1.71
High cutting speed, vc (m/s) 67, 90 and 120
Feed speed, vft (m/min) 1.71
3.2. Grinding tool modeling
The distribution of cutting grains over the surface of the grinding wheel is stochastic.
Therefore, in case of a macro-grinding process, featuring a large grinding wheel, modeling the
exact topography of the tool is impossible. One of the methods to model the grinding wheel
topography is using the Probability Density Function (PDF). In this function, the shape
parameters K and the scale parameter 𝜆𝑔 of the PDF can be defined according to the actual
topography of the grinding wheel obtained from the confocal microscopy image as explained
by Zahedi and Azarhoushang [51]. These parameters can be easily obtained via the Abbott
curve from the software.
13
𝑓Ґ(𝑥) = {𝜆𝑔
𝐾𝑥(𝐾−1)𝑒−𝜆𝑔𝑥
Ґ(𝐾) 𝑥 ≥ 0
0 𝑥 < 0 (5)
where Ґ is the Gama function.
In micro-grinding process, however, the diameter of the tool is small (in our case 2 mm),
and the abrasive grains of the grinding tool can be modeled as distributed according to their real
position on the actual grinding pin. For this purpose, the surface of the grinding pin was
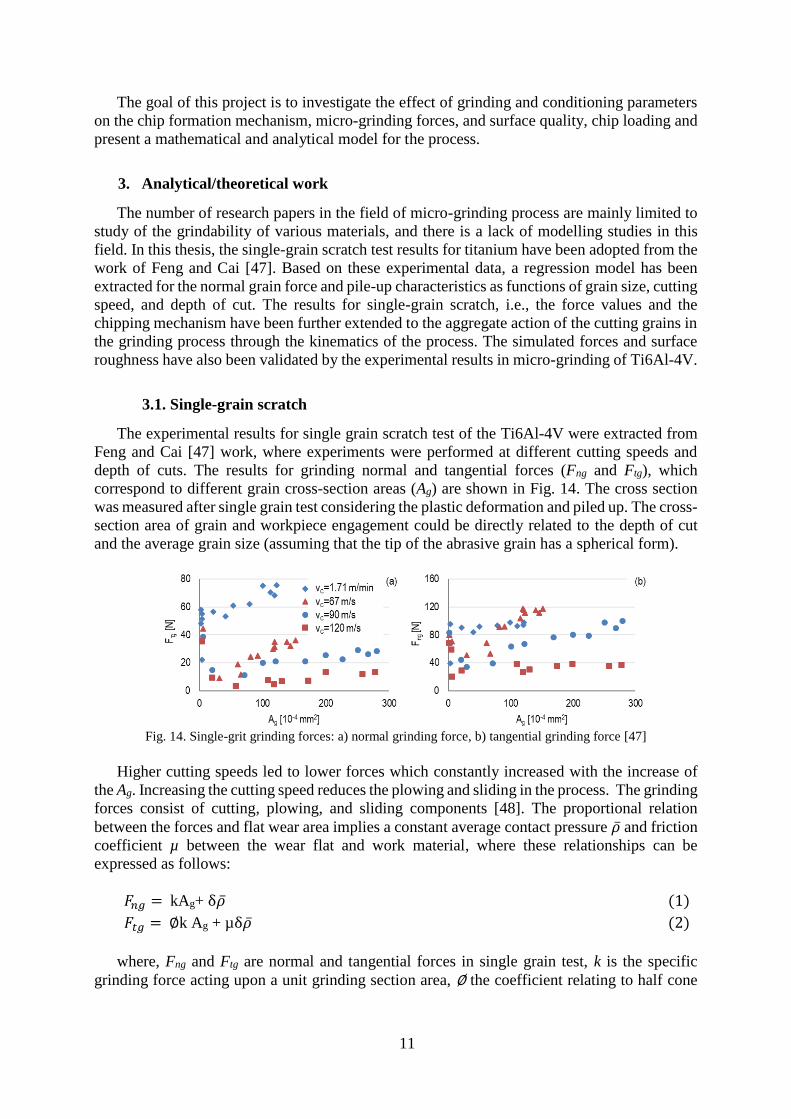
captured by a confocal microscope. Fig. 15 shows the confocal image of the actual topography
of a vitrified-bonded diamond grinding tool (D46-C150).
Fig. 15. a) Confocal picture from the grinding tool, b) Height profile of the Section 1, c) Profile of the Section 2
After taking the pictures, several sections were extracted, and the position and protrusion
height distribution of each single grain were extracted and used to model the grinding tool (as
illustrated in Fig. 15). The y direction defines the position of the grain in peripheral direction
which can be defined from the position of section in Fig. 15-a. The position of the grain in the
longitudinal direction along the tool axis can be obtained from the horizontal axes of Fig. 15-b.
In order to ensure that the chosen grain (profile in Fig. 15-b) represents the real grain, the width
of the profile has been measured. The grains are bonded over the surface of the grinding wheel
and the measured area can be also the bound, which, in this case is vitrified. If the width of the
profile (marked in Fig. 15-b and c) is around the grain size, the chosen profile is an actual
abrasive grain. Finally, the protrusion height of each single grain can be measured from the
vertical axes in Fig. 15-b and c.
14
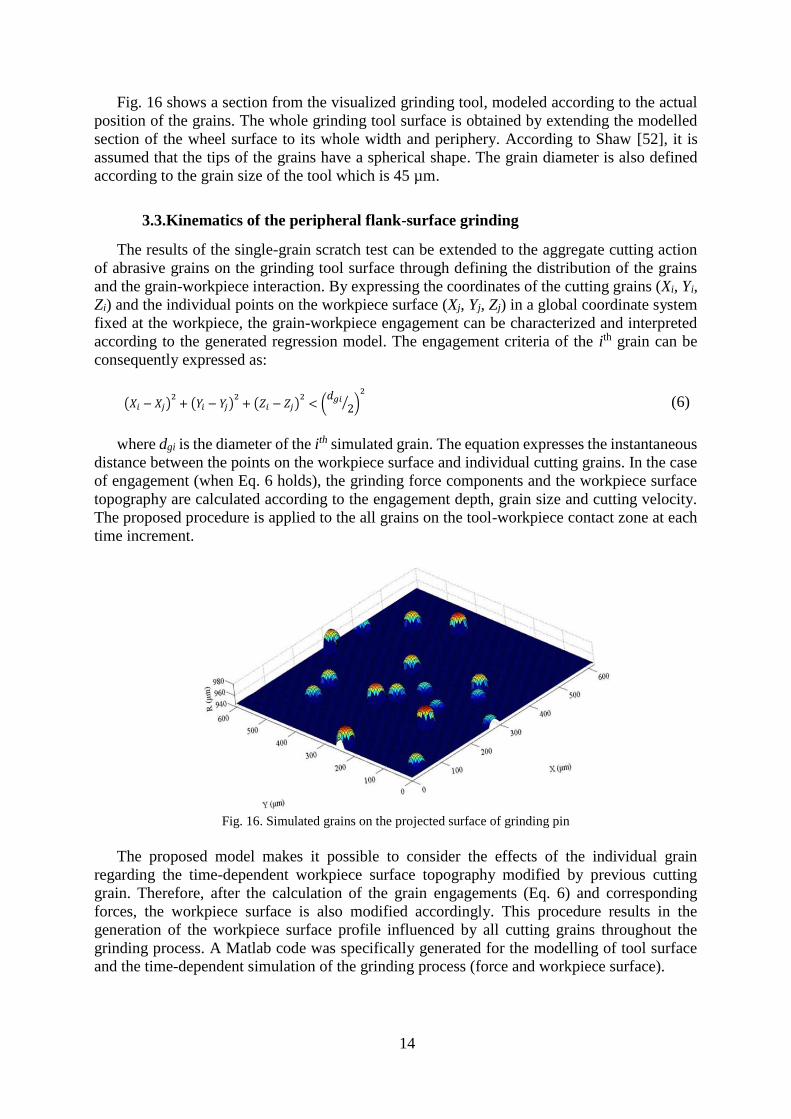
Fig. 16 shows a section from the visualized grinding tool, modeled according to the actual
position of the grains. The whole grinding tool surface is obtained by extending the modelled
section of the wheel surface to its whole width and periphery. According to Shaw [52], it is
assumed that the tips of the grains have a spherical shape. The grain diameter is also defined
according to the grain size of the tool which is 45 µm.
3.3.Kinematics of the peripheral flank-surface grinding
The results of the single-grain scratch test can be extended to the aggregate cutting action
of abrasive grains on the grinding tool surface through defining the distribution of the grains
and the grain-workpiece interaction. By expressing the coordinates of the cutting grains (Xi, Yi,
Zi) and the individual points on the workpiece surface (Xj, Yj, Zj) in a global coordinate system
fixed at the workpiece, the grain-workpiece engagement can be characterized and interpreted
according to the generated regression model. The engagement criteria of the ith grain can be
consequently expressed as:
(𝑋𝑖 − 𝑋𝑗)2
+ (𝑌𝑖 − 𝑌𝑗)2
+ (𝑍𝑖 − 𝑍𝑗)2
< (𝑑𝑔𝑖
2⁄ )
2
(6)
where dgi is the diameter of the ith simulated grain. The equation expresses the instantaneous
distance between the points on the workpiece surface and individual cutting grains. In the case
of engagement (when Eq. 6 holds), the grinding force components and the workpiece surface
topography are calculated according to the engagement depth, grain size and cutting velocity.
The proposed procedure is applied to the all grains on the tool-workpiece contact zone at each
time increment.
Fig. 16. Simulated grains on the projected surface of grinding pin
The proposed model makes it possible to consider the effects of the individual grain
regarding the time-dependent workpiece surface topography modified by previous cutting
grain. Therefore, after the calculation of the grain engagements (Eq. 6) and corresponding
forces, the workpiece surface is also modified accordingly. This procedure results in the
generation of the workpiece surface profile influenced by all cutting grains throughout the
grinding process. A Matlab code was specifically generated for the modelling of tool surface
and the time-dependent simulation of the grinding process (force and workpiece surface).

15
4. Experimental work
To validate the simulate results a set of experimental tests were performed, and simulation
was modified based on the experimental results.in this section, a detail description of the
experimental procedure and measurement is provided.
4.1. Micro-grinding experiment:
One of the main difficulties in performing micro-machining experiments is the availability
of appropriate machine tool that can be used for implementing micro-machining processes and
specially to utilize a tool-based micro-machining for fabrication of components at the required
scale. Some requirements that high/ultra-precision machines over a range of applications shall
have is listed as following [1]:
• High dimensional precision better than a few microns.
• Accurate geometrical form better than 100 nm departure from flatness or roundness.
• Good surface finish, in the range of 10 – 100 nm Ra.
• High static stiffness.
• Low thermal distortion.
• Low motion errors.
• High damping or dynamic stiffness.
• Facilitate measurement of fabricated products on-machine.
• Avoidance of chatter vibration.
• Good tooling and clamping to achieve minimum tool run-out and minimum errors from
re-clamping.
• Specialized precision motion control system.
Fig. 17. a) Experimental setup, b) schematic of the grinding process
In this study a high precision CNC machining center (Kern Pyramid-Nano) was used in
order to perform the micro-grinding tests with high rotational speed and accuracy. Thanks to
its hydrostatic drives and guides, the machine suffers virtually no wear of its linear axes. This
means the quality and precision of all axes remain constant over extremely long-time period.
In conjunction with KERN's proprietary thermal management system, it is possible to have a
precise tool position at any time. The machine consists of two spindles one with hydrostatic
bearing and the other with mechanical bearing. The hydrostatic bearing enables to achieve a
high rotational speed; up to 160000 1/min (Fig. 17-a). A peripheral flank-grinding operation
has been chosen to perform the micro-grinding experiments. In this method the peripheral
16
surface of the grinding wheel removes the material from the surface of the titanium material
which is shown in Fig. 17-b. Ti4V6Al titanium alloy in the form of a block with the dimensions
of 30x20x10 mm was used as the test material.
4.2. Micro-grinding forces
The tools in micro-cutting operation are mostly rotating with high rotational speeds (more
than 100000 rpm), resulting in high excitation frequency. Therefore, it is nearly impossible to
measure the cutting forces within a wide frequency range because of the interference of the
excitation frequency with the natural frequency of the used dynamometers. Finding a
dynamometer which its lowest eigenfrequency exceeds the excitation frequency by more than
a factor 3 is difficult. This factor enables the dynamometer to accurately measure the process
forces in micro-machining operations [53]. Transchel et al. [53] showed that the commercial
Kistler type 9256 dynamometer is suitable to measure the micro-cutting forces, Therefore, the
micro-grinding forces presented in this study were measured using a Kistler type 9256C2 three-
component dynamometer shown in Fig. 17. The dynamometer was connected to the amplifier
type 5015 and the forces were recorded via a LabView software.
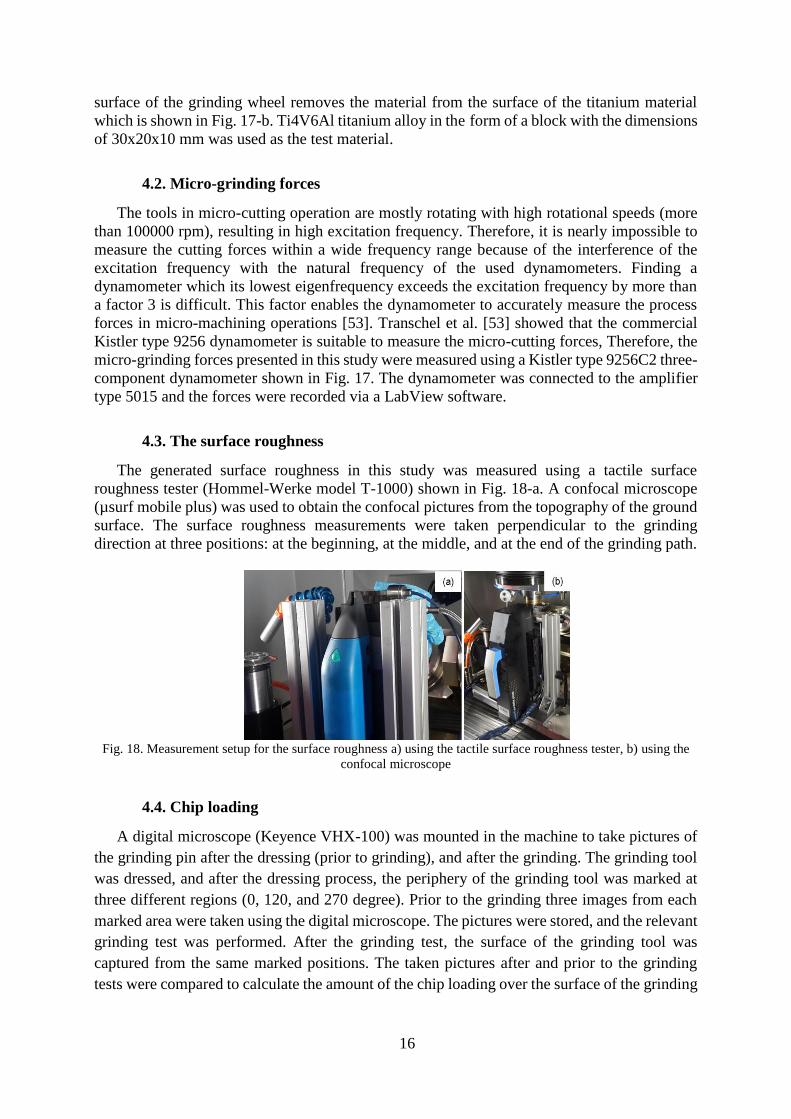
4.3. The surface roughness
The generated surface roughness in this study was measured using a tactile surface
roughness tester (Hommel-Werke model T-1000) shown in Fig. 18-a. A confocal microscope
(µsurf mobile plus) was used to obtain the confocal pictures from the topography of the ground
surface. The surface roughness measurements were taken perpendicular to the grinding
direction at three positions: at the beginning, at the middle, and at the end of the grinding path.
Fig. 18. Measurement setup for the surface roughness a) using the tactile surface roughness tester, b) using the
confocal microscope
4.4. Chip loading
A digital microscope (Keyence VHX-100) was mounted in the machine to take pictures of
the grinding pin after the dressing (prior to grinding), and after the grinding. The grinding tool
was dressed, and after the dressing process, the periphery of the grinding tool was marked at
three different regions (0, 120, and 270 degree). Prior to the grinding three images from each
marked area were taken using the digital microscope. The pictures were stored, and the relevant
grinding test was performed. After the grinding test, the surface of the grinding tool was
captured from the same marked positions. The taken pictures after and prior to the grinding
tests were compared to calculate the amount of the chip loading over the surface of the grinding

17
tool. This procedure was repeated for all the trials. Accordingly, the chip loading as the results
of different grinding and dressing parameters was determined and compared in relative terms.
4.5. Dressing
The micro-topography of grinding tools, which is greatly affected by the dressing process,
plays a key role in the performance of the grinding process. It can influence not only the
grinding forces and temperature, but also the surface finish and integrity [54]. The grinding tool
micro-topography undergoes several changes during the grinding process due to the tool wear
– causing variation in grinding forces and surface roughness [55]. Hence, a periodic dressing
of the grinding tool is needed to maintain (or reproduce) the initial micro-topography of the tool
and remove or reduce the level of tool run-out. Accordingly, the dressing process can be
considered as an integral part of the grinding process.
Fig. 19. The setup for the digital microscope
Several researchers investigated the effects of the dressing parameters on the macro-
grinding process. Rasifard [56] studied the effect of the ultrasonic-assisted dressing (UAD) of
vitrified-bonded cBN grinding wheels with diamond form rollers and showed that the wear of
the grinding wheel can be reduced up to 50 % when using the UAD. Daneshi et al [57] studied
the effect of dressing parameters on internal cylindrical grinding and suggested that after the
dressing and prior to grinding, the wheel should be sharpened or relatively low feed rates should
be utilized when grinding the first part. Malkin and Murray [58,59] studied the mechanics of
the dressing process and showed that rougher grinding tool surface induces lower grinding
forces and rougher surface finished. Linke [60] presented a model for predicting the grinding
wheel topography after dressing with different parameters. She also used this model to predict
the dressing forces [61]. Linke and Klocke [62] measured the dressing temperature generated
in the contact zone between the grinding tool and the dresser. They observed significant wear
of the diamond dressing tools after the dressing. Saad et al [63] investigated the effect of
dressing parameters on the ground surface roughness. Azarhoushang and Rasifard [54]
presented the most important variants of the dressing process for different types of grinding
tool bonds such as synthetic resin, metal and vitrified. All the mentioned studies utilized
relatively low dressing overlap ratios, Ud, (generally Ud is smaller than 8) and showed that
higher Ud normally induce very high grinding forces and temperatures, and hence, lead to a
poor surface integrity of the workpiece. The very recent research on the fundamentals of
diamond-wheel conditioning postulates hitherto unknown diamond removal mechanisms and
postulates new parameters to analytically model the process [54,64].

18
Fig. 20. Dressing setup
In this study, the grinding pin was dressed using a diamond dressing roller with the diameter
of 100 mm. Oil was utilized as the grinding fluid. The dressing tests were carried out at different
dressing-speed ratios (qd), and dressing-overlap ratios (Ud). The dressing-speed ratio is the ratio
of the peripheral speed of the roller dresser to the peripheral speed of the micro-grinding pin
following by a sign. The speed directions of the dresser and the tool in the contact zone can be
defined using this sign. If the speed directions are the same, the dressing is called down dressing
designated as positive. If the speed directions are opposite to each other, the dressing speed
ratio is negative, which is called up dressing. The dressing overlap ratio is the ratio of the
engagement width of the dresser and the axial dressing feed of the dresser per grinding tool
revolution. In practice, this ratio is often extracted from the active width of the dresser [65].
The dressing overlap ratio is calculated as:
𝑈𝑑 = √(8𝑟𝑝𝑑𝑎𝑒𝑑)
𝑓𝑎𝑑 (7)
where aed is the dressing depth of cut, rpd is the radius of the dressing tool and fad is the
axial feed (fad = vfad/ns; where ns is the rotational speed of the grinding pin). Here, we are
assuming that the width of cut equals the active width of the dressing tool [66]. In macro-
dressing, the overlap ratio typically ranges between 2 and 8. In micro-dressing since the
diameter of the tool is very small (i.e. 2 mm); the rotational speed of the tool should be very
high to achieve required cutting speed vc values (e.g. almost 100000 1/min for the cutting speed
of 10 m/s). Consequently, since extremely high vfad is needed to achieve Ud values smaller than
10, the low values of Ud are not applicable in micro-grinding. As a result, much higher values
of dressing overlap ratios Ud were used in this study, and the effects of these very high Ud values
on grinding performance are studied for the first time.
Table 2. Process Parameters
Grinding Parameters Values
Cutting Speed, vc (m/s) 6, 10, 12 and 14
Feed Rate, vft (mm/min) 200, 500 and 1000
Depth of Cut, ae (µm) 4, 7 and 10
Width of Cut (mm) 2.5
Dressing Parameters Values
Dressing Depth, aed (µm) 2
Dressing Speed Ratio, qd -0.4, +0.4 and +0.8
Dressing Overlap Ratio, Ud 45, 90, 270, 305, 910, 1830
The process parameters including the dressing parameters are listed in Table 2. the
corresponding dressing feed rates for overlap ratios of 45, 90, 270, 305, 910, and 1830 at the
cutting speed of 10 m/s are 2000, 1000, 350, 300, 100, and 50 mm/min, respectively.

19
5. Results and discussions
5.1. Micro-grinding forces
5.1.1. The effect of cutting speed
This section presents the results of micro-grinding forces and surface roughness obtained
from the simulation and experiments. The effects of the process parameters as well as dressing
parameters are presented and discussed. The experimental and simulated normal and tangential
grinding forces versus different cutting speeds are presented in Fig. 21. Both simulated and
experimental forces follow the same trend and are matched qualitatively. Increasing the cutting
speed decreased the grinding forces, as expected. This could be because of the changes in the
kinematic energy and the impact force of each single abrasive grain with increasing the cutting
speed. Increasing the cutting speed reduces the number of kinematic cutting edges and the mean
uncut chip thickness of each active grain [67].
Fig. 21. Grinding forces versus cutting speed.
The number of kinematic cutting edges can be defined by Eq. 8, where Ln is the spacing
along the tool surface from the prospective cutting point to the proceeding active one, δn is the
protrusion deference between the cutting points of n and n-1, vw is the workpiece velocity, and
de is the equivalent diameter of the grinding tool [68]. Decreasing the vw/vc ratio decreases the
number of kinematic cutting edges owing to the reduction of the number abrasive grains which
do not come into the contact with the workpiece surface. The uncut chip thickness (hm) can be
defined according to Eq. 9 [68]. However, increasing the L increases the uncut chip thickness,
its effect is smaller than the vw/vc ratio [68]. Therefore, increasing the cutting speed decreases
both the uncut chip thickness and the number of kinematic cutting edges. Hence, the grinding
forces, which are acting on each active grain, are decreased – resulting to lower grinding forces.
In Fig. 21, the simulation results for tangential and normal forces were accurate within the total
error of 11.5 and 10.5 percent, respectively.
𝛿𝑛
𝐿𝑛> 2 (
𝑣𝑤
𝑣𝑐) (
𝑎𝑒
𝑑𝑒)
1/2
(8)
ℎ𝑚 = 2𝐿 (𝑣𝑤
𝑣𝑐) (
𝑎𝑒
𝑑𝑒)
1/2
(9)

20
5.1.2. The effect of depth of cut
Fig. 22 shows the tangential and normal grinding forces versus the depth of cut. Both
tangential and normal forces increased with increasing the depth of cut. The same trend can be
seen for simulated forces. Higher depth of cut causes higher material removal rate and thicker
uncut chip thickness — resulting in higher normal and tangential forces. Additionally,
increasing the depth of cut increases the contact length of the grinding tool with the workpiece
and the number of the momentarily engaged cutting edges — inducing higher grinding forces
[69]. According to the experimental results, the grinding force ratio lies within 10% of the
assumed value in the modelling. Therefore, the assumption of a constant force ratio could be
acceptable for a specific material and defined range of the grinding conditions.
Fig. 22. Grinding forces versus depth of cut: a) tangential force; b) normal force
Although, the prediction of the tangential force is qualitatively matched with those in the
experimental study by increasing the depth of cut, the predictions are more accurate at the
smaller depths of cut. The variation in the predicted grinding forces can be associated with the
following causes:
• During the grinding process, the number of active cutting edges changes due to the
grain breakage and pull-out. Hence, different active grains are available at different
height levels – inducing different force values.
• The actual grains are normally sharper than the assumed spheres.
• In modeling process, it was assumed that the grains are ideally spherical. However,
in the real grinding tool they have different shapes.
• The wear of active grains in the real grinding process increases at higher depths of
cut. Hence the grit protrusion will be reduced and become smaller than the simulated
grit protrusion.

21
5.1.3. The effect of dressing overlap ratio
According to Fig. 23, high dressing overlap ratios (achieved by reducing the dressing feed)
increased the cutting forces. The micro-topography of the grinding tool is affected by changing
the dressing overlap ratio (Eq. 2), which gives the relationship between the theoretical grinding
tool surface roughness, Rts, and the dressing overlap ratio (Eq. 10) [70].
𝑅𝑡𝑠 =𝑎𝑒𝑑
𝑈𝑑2 (10)
Fig. 23. Grinding forces Fn and Ft versus the dressing overlap ratio, Ud
Here, the higher Ud values lead to a finer micro-topography of the grinding tool – resulting
in an increased number of static and kinematic cutting edges, rising the amount of rubbing and
plowing in grinding, which explains the observed rise in the grinding forces. On the other hand,
higher dressing overlap ratios reduce the proportion of the grit break-out by dressing [61]. This
phenomenon can be explained with reduced dressing forces when increasing the dressing
overlap ratio [71]. High dressing forces (which occur at lower dressing overlap ratios), lead to
an aggressive dressing of the grinding pin. Hence, the grain tips may be broadly fractured and
coarse. In contrast, it has been shown that the grain tips are much more flattened when the
dressing feed rate is low (i.e. at high Ud values) [58]. Therefore, the surface of the grinding tool
is rougher (and the grains become sharper) when using higher dressing feed rates; hence the
sharper the grains, the lower the cutting forces. Both normal and tangential forces Fn and Ft
increase with bigger wear-flat area on the grains, as estimated by Eqs. 11 and 12 below.
𝐹𝑡 = 𝐹𝑡,𝑐 + µ�̅�𝑏(𝑑𝑒𝑎𝑒)1 2⁄ 𝐴 (11)
𝐹𝑛 = 𝐹𝑛,𝑐 + �̅�𝐴𝑎(𝑑𝑒𝑎𝑒)1 2⁄ 𝐴 (12)
𝐴𝑎 = 𝑏(𝑑𝑒𝑎𝑒)1/2𝐴 (13)
Here, Ft,c and Fn,c are the tangential and normal forces for cutting, �̅� is a constant average of
contact stress, µ is the friction coefficient, A is the fraction of the tool surface which consists
the wear flat, Aa is the actual contact area between the wear flat and the workpiece (calculated
by Eq. 13), b is the grinding width, de is the equivalent diameter (in surface grinding de is equal
to pin diameter) and ae is the depth of cut. The lower the value of Rts, the higher the flat area, A.
22
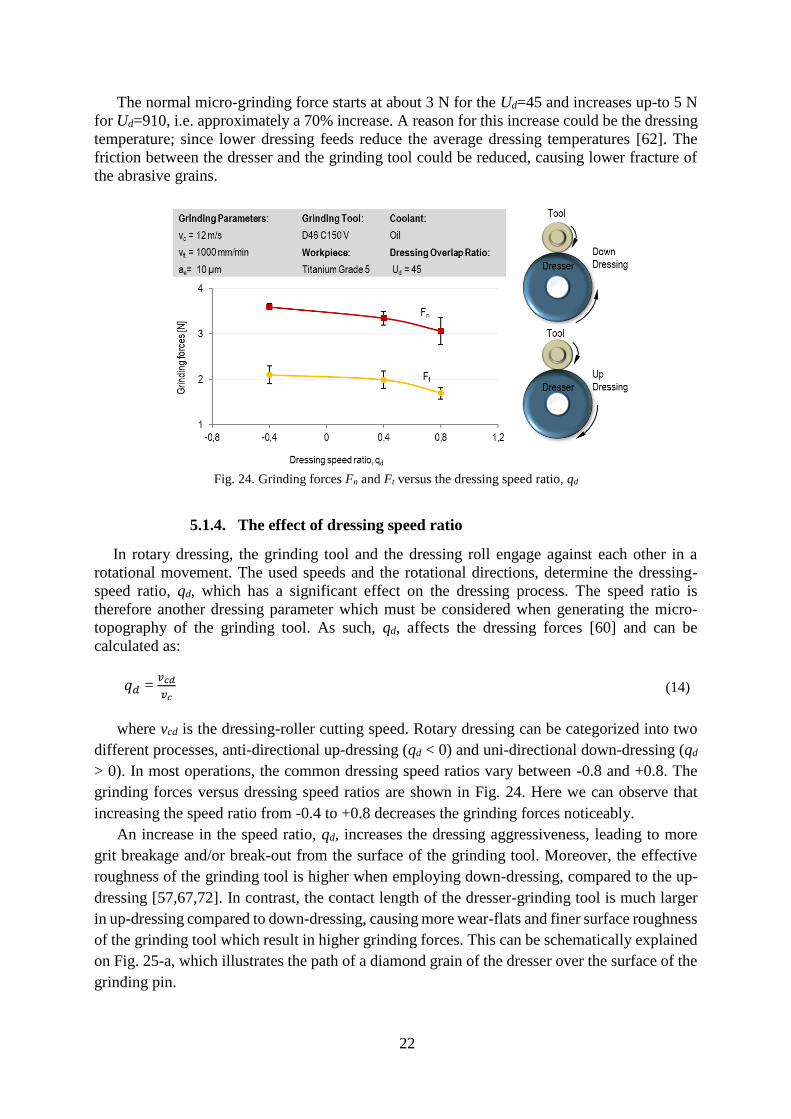
The normal micro-grinding force starts at about 3 N for the Ud=45 and increases up-to 5 N
for Ud=910, i.e. approximately a 70% increase. A reason for this increase could be the dressing
temperature; since lower dressing feeds reduce the average dressing temperatures [62]. The
friction between the dresser and the grinding tool could be reduced, causing lower fracture of
the abrasive grains.
Fig. 24. Grinding forces Fn and Ft versus the dressing speed ratio, qd
5.1.4. The effect of dressing speed ratio
In rotary dressing, the grinding tool and the dressing roll engage against each other in a
rotational movement. The used speeds and the rotational directions, determine the dressing-
speed ratio, qd, which has a significant effect on the dressing process. The speed ratio is
therefore another dressing parameter which must be considered when generating the micro-
topography of the grinding tool. As such, qd, affects the dressing forces [60] and can be
calculated as:
𝑞𝑑 = 𝑣𝑐𝑑
𝑣𝑐 (14)
where vcd is the dressing-roller cutting speed. Rotary dressing can be categorized into two
different processes, anti-directional up-dressing (qd < 0) and uni-directional down-dressing (qd
> 0). In most operations, the common dressing speed ratios vary between -0.8 and +0.8. The
grinding forces versus dressing speed ratios are shown in Fig. 24. Here we can observe that
increasing the speed ratio from -0.4 to +0.8 decreases the grinding forces noticeably.
An increase in the speed ratio, qd, increases the dressing aggressiveness, leading to more
grit breakage and/or break-out from the surface of the grinding tool. Moreover, the effective
roughness of the grinding tool is higher when employing down-dressing, compared to the up-
dressing [57,67,72]. In contrast, the contact length of the dresser-grinding tool is much larger
in up-dressing compared to down-dressing, causing more wear-flats and finer surface roughness
of the grinding tool which result in higher grinding forces. This can be schematically explained
on Fig. 25-a, which illustrates the path of a diamond grain of the dresser over the surface of the
grinding pin.

23
Fig. 25. a) Illustration of the dressing path, b) generated path on the grinding tool surface with up-dressing
method, and c) generated path on the grinding tool surface with down-dressing method
The dressing process starts at the point A (P.1) and ends at the point B (P.3), generating the
dressing path Ld. The diamond grain reaches the maximum engagement depth of aed with the
grinding tool at the point P.2. For up-dressing, the duration of the grain moving from P.1 to P.3
can be calculated as [73]:
𝑑𝑡 = (𝑡3 − 𝑡1) = 𝑑𝑙(𝑃.1 𝑡𝑜 𝑃.3)
𝑣𝑐𝑑
(15)
𝑡3 − 𝑡1 = 𝐿𝑑
𝑣𝑐𝑑
(16)
where t3 is the time instant at which the diamond grain exits the grinding wheel (at position
P.3) and Ld is the length of the dressing-grain path from P.1 to P.3. For both up- and down-
dressing, the dressing path generated on the surface of the grinding tool (Ls) can be calculated
using:
𝐿𝑠(𝑃.1 𝑡𝑜 𝑃.3) = (𝑡3 − 𝑡1). (𝑣𝑐 − 𝑣𝑐𝑑) (17)
Combining Eqs. 14-17, while neglecting the size of the diamond grain the Ls can be
expressed as: [73]:
(−1 ≤ 𝑞𝑑 ≤ +1): 𝐿𝑠 = |(1
𝑞𝑑
− 1) ∙ 𝐿𝑑| (18)
24
According to Eq. 18, the contact length of the dresser with the micro-grinding pin increases
when changing the dressing method from down- to up-dressing. As shown in Fig. 25-b and c,
changing the contact length and contact geometry both affect the theoretical roughness of the
grinding pin. The obtained topography, shown as red patterns in Fig. 25-b and c, reveals the
generated profile on the grinding pin by two different dressing kinematics. In the up-dressing,
the generated paths on the grinding pin overlap with each other since the contact length is larger
(i.e. the radius is bigger). Therefore, the peak-to-valley height is reduced here, leading to a
smoother micro-topography of the grinding tool.
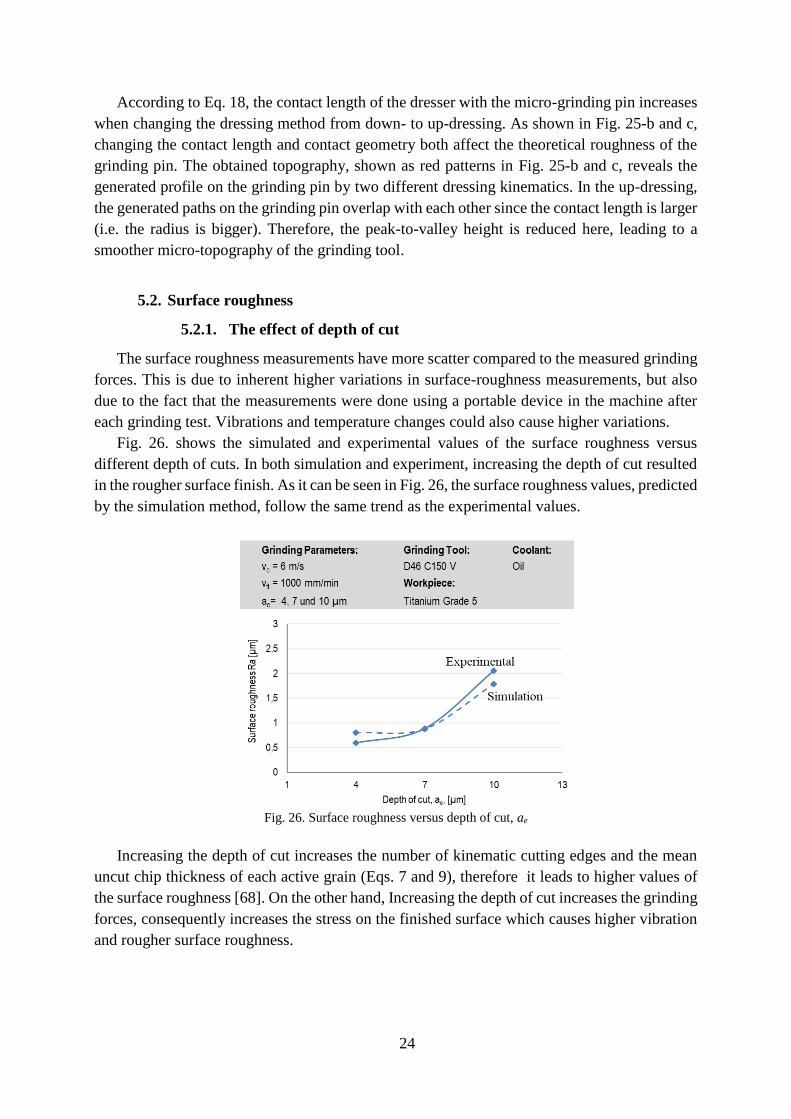
5.2. Surface roughness
5.2.1. The effect of depth of cut
The surface roughness measurements have more scatter compared to the measured grinding
forces. This is due to inherent higher variations in surface-roughness measurements, but also
due to the fact that the measurements were done using a portable device in the machine after
each grinding test. Vibrations and temperature changes could also cause higher variations.
Fig. 26. shows the simulated and experimental values of the surface roughness versus
different depth of cuts. In both simulation and experiment, increasing the depth of cut resulted
in the rougher surface finish. As it can be seen in Fig. 26, the surface roughness values, predicted
by the simulation method, follow the same trend as the experimental values.
Fig. 26. Surface roughness versus depth of cut, ae
Increasing the depth of cut increases the number of kinematic cutting edges and the mean
uncut chip thickness of each active grain (Eqs. 7 and 9), therefore it leads to higher values of
the surface roughness [68]. On the other hand, Increasing the depth of cut increases the grinding
forces, consequently increases the stress on the finished surface which causes higher vibration
and rougher surface roughness.

25
5.2.2. The effect of feed rate
The influence of the grinding feed rate on the surface roughness at the cutting speed of
14m/s has been shown in Fig. 27. The grinding feed rate has a negligible effect on the surface
roughness. Although the surface roughness predicted by the simulation are finer than those
obtained from the experimental study at the cutting speed of 14m/s, the trend of the roughness
changes with varying the feed rate. The differences between the simulated and real surface
roughness, seen in Fig. 27, can be due to the unavoidable vibration in the grinding process by
using the cutting speed of 14m/s. The tool vibration is one of the influential factors which may
significantly influence the surface quality. The very small diameter of the tool along with its
high rotational speed causes the tool vibration which has been neglected in the simulation [74].
Fig. 27. Surface roughness versus feed rate, vft
The simulation results were matched with the experimental results in greater degree at the
cutting speed of 6m/s (Fig. 26), rather than the higher cutting speed (14 m/s) as seen in Fig. 27.
For instant, the predicted surface roughness at the cutting speed of 6 m/s, feed rate 100 mm/min,
and depth of cut of 7 µm was similar to the real surface roughness (Fig. 26). However, changing
the cutting speed from 6 to 14, not only changed the real surface roughness from Ra=0.89 to
Ra=2.2, but also the simulated surface roughness was considerably different from that in the
real situation at the cutting speed of 14 m/s. As known in the macro-grinding operations,
increasing the cutting speed causes finer surface roughness because of the smaller chip
thickness. With comparing Fig. 26 and 27, the simulation model predicted a finer surface
roughness with increasing the cutting speed from 6 to 14m/s due to the smaller chip thickness.
This does not agree with the experimental results in these figures since the tool diameter is very
small and tool vibration occurs at the high rotational speeds which is neglected in the simulation
process.
5.2.3. The effect of cutting speed
The surface roughness increased with rising the cutting speed in micro-grinding (Fig. 28).
The same behavior was also reported by Li et al [75]. The surface roughness parameter, Rz is
constantly rising with increasing the grinding cutting speed. In case of Ra, there is no significant

26
change in the roughness when increasing the cutting speed from 6 to 10 m/s. Nevertheless, the
Ra increased slightly at the cutting speed of 14 m/s.
Fig. 28. Surface roughness Ra and Rz versus the cutting speed, vc
These observations are important to consider since in conventional macro-grinding an
increase in the cutting speed improves the surface roughness [76]. This well-known trend in
macro-grinding can be explained by the basic of uncut chip thickness [67] model, which is
explained in section 5.1 In micro-grinding, the diameter of the tool is very small – resulting in
a high tool-length to diameter ratio. Hence, the grinding tool acts as a flexible cantilever beam,
and the tangential grinding force Ft (acting radially on the tool) causes the tool deflection
parallel to the uncut chip thickness [77]. While the grinding tool is rotating with a high rotational
frequency during the process, the deflection of the tool causes undesirable lateral vibrations
[78]. These vibrations at higher cutting speeds deteriorate the surface roughness. This
phenomenon is not in accordance with the conventional understanding of the effect of the
cutting speed in the grinding process. Normally, higher cutting speed improves the surface
roughness in grinding process. However, the existed vibrations at higher cutting speeds in
micro-grinding process can be predominated to the desired effect of the cutting speed and
deteriorate the surface roughness.
Fig. 29. Surface roughness Ra and Rz versus dressing overlap ratio Ud
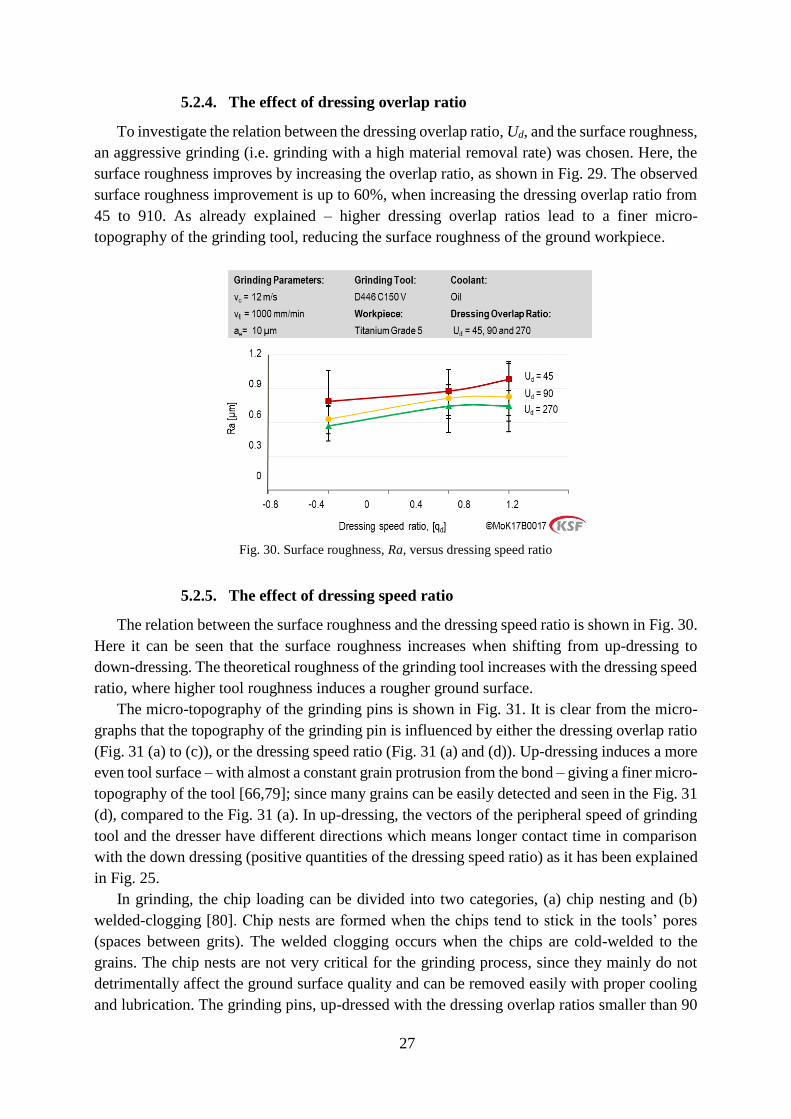
27
5.2.4. The effect of dressing overlap ratio
To investigate the relation between the dressing overlap ratio, Ud, and the surface roughness,
an aggressive grinding (i.e. grinding with a high material removal rate) was chosen. Here, the
surface roughness improves by increasing the overlap ratio, as shown in Fig. 29. The observed
surface roughness improvement is up to 60%, when increasing the dressing overlap ratio from
45 to 910. As already explained – higher dressing overlap ratios lead to a finer micro-
topography of the grinding tool, reducing the surface roughness of the ground workpiece.
Fig. 30. Surface roughness, Ra, versus dressing speed ratio
5.2.5. The effect of dressing speed ratio
The relation between the surface roughness and the dressing speed ratio is shown in Fig. 30.
Here it can be seen that the surface roughness increases when shifting from up-dressing to
down-dressing. The theoretical roughness of the grinding tool increases with the dressing speed
ratio, where higher tool roughness induces a rougher ground surface.
The micro-topography of the grinding pins is shown in Fig. 31. It is clear from the micro-
graphs that the topography of the grinding pin is influenced by either the dressing overlap ratio
(Fig. 31 (a) to (c)), or the dressing speed ratio (Fig. 31 (a) and (d)). Up-dressing induces a more
even tool surface – with almost a constant grain protrusion from the bond – giving a finer micro-
topography of the tool [66,79]; since many grains can be easily detected and seen in the Fig. 31
(d), compared to the Fig. 31 (a). In up-dressing, the vectors of the peripheral speed of grinding
tool and the dresser have different directions which means longer contact time in comparison
with the down dressing (positive quantities of the dressing speed ratio) as it has been explained
in Fig. 25.
In grinding, the chip loading can be divided into two categories, (a) chip nesting and (b)
welded-clogging [80]. Chip nests are formed when the chips tend to stick in the tools’ pores
(spaces between grits). The welded clogging occurs when the chips are cold-welded to the
grains. The chip nests are not very critical for the grinding process, since they mainly do not
detrimentally affect the ground surface quality and can be removed easily with proper cooling
and lubrication. The grinding pins, up-dressed with the dressing overlap ratios smaller than 90
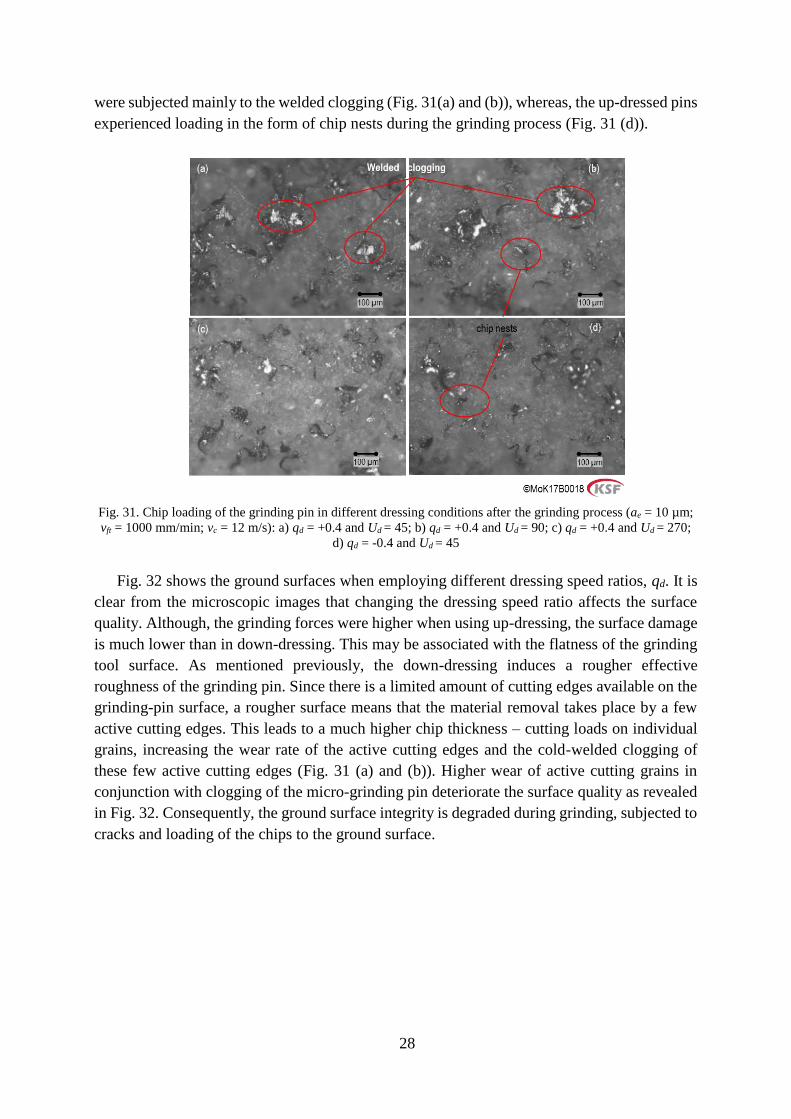
28
were subjected mainly to the welded clogging (Fig. 31(a) and (b)), whereas, the up-dressed pins
experienced loading in the form of chip nests during the grinding process (Fig. 31 (d)).
Fig. 31. Chip loading of the grinding pin in different dressing conditions after the grinding process (ae = 10 µm;
vft = 1000 mm/min; vc = 12 m/s): a) qd = +0.4 and Ud = 45; b) qd = +0.4 and Ud = 90; c) qd = +0.4 and Ud = 270;
d) qd = -0.4 and Ud = 45
Fig. 32 shows the ground surfaces when employing different dressing speed ratios, qd. It is
clear from the microscopic images that changing the dressing speed ratio affects the surface
quality. Although, the grinding forces were higher when using up-dressing, the surface damage
is much lower than in down-dressing. This may be associated with the flatness of the grinding
tool surface. As mentioned previously, the down-dressing induces a rougher effective
roughness of the grinding pin. Since there is a limited amount of cutting edges available on the
grinding-pin surface, a rougher surface means that the material removal takes place by a few
active cutting edges. This leads to a much higher chip thickness – cutting loads on individual
grains, increasing the wear rate of the active cutting edges and the cold-welded clogging of
these few active cutting edges (Fig. 31 (a) and (b)). Higher wear of active cutting grains in
conjunction with clogging of the micro-grinding pin deteriorate the surface quality as revealed
in Fig. 32. Consequently, the ground surface integrity is degraded during grinding, subjected to
cracks and loading of the chips to the ground surface.

29
Fig. 32. The quality of the ground surfaces at different dressing parameters (ae = 10 µm; vft = 1000 mm/min; vc =
12 m/s; Ud = 270): a) qd = +0.8, b) qd = +0.4, and c) qd = -0.4
Based on the analysis of the research results, the best grinding result, validated
experimentally, generated a surface roughness of Ra = 0.25 µm. The following grinding and
dressing parameters were utilized for achieving this surface finish: vc = 10 m/s, ae = 4 µm, qd =
0.8, vft = 200 mm/min, and Ud = 910. The related confocal picture of the ground surface is
shown in Fig. 33. Here, we can observe an almost uniform surface, obtained when using
appropriate grinding and dressing parameters.
Fig. 33. a) Pattern of the ground surface obtained from the simulation model, b) confocal picture of a ground
surface
6. Conclusions
6.1. Paper I
• The dressing overlap ratio and the speed ratio are influential factors, affecting surface
roughness and grinding forces in micro-grinding of titanium Ti-6Al-4V.
• Increasing the dressing overlap ratios (Ud up to 1830) reduced the surface roughness
but led to approximately 70% higher cutting forces because of finer surface of the
grinding-pin.

30
• The employment of extremely high dressing overlap ratios in an up-dressing method,
improved the surface finish. This is explained by less chip loading. As in
conventional dressing, the down-dressing of micro-grinding pins caused rougher
surface finish and lower grinding forces compared to up-dressing.
• The grinding forces could be reduced up-to 40% by increasing the cutting speed from
6 to 14 m/s, however, led to an increase in the surface roughness. In the term of
accuracy, it can be an important result for the industry.
• Higher values of the dressing overlap ratio reduced the chip cold-welding on the
abrasive grains and led to less loading of the tool in form of chip nests. Welded
clogging of the grinding pin at lower values of Ud deteriorated the surface quality
and increased the surface roughness of the ground surface.
• A uniform surface with almost no cold-welded clogging was observed when
employing up-dressing. The up-dressing was improved via increasing the dressing
overlap ratio from 45 to 917, resulting a significant reduction in surface roughness
of Rz from 6.19 to 2.88 µm and Ra from 0.98 to 0.4 µm.
• The results showed that the surface quality, grinding forces, and chip loading of the
grinding tool are highly affected by the dressing parameters and can be optimized by
changing Ud and qd. Hence the new insights regarding the influence of extremely
high values of Ud (which are not used in conventional dressing of (large) grinding
wheels) in micro-grinding have an important industrial relevance. Achieving a
desired surface roughness is one the biggest challenges in the industry and the
outcomes of the research are highly useful not only in the term of surface quality, but
also accuracy for workshop practice. Future research necessitates the use of
additional dressing parameters.
6.2. Paper II
• The developed model enabled the prediction of the micro-grinding forces and surface
roughness. The simulated forces and surface roughness were compared with the
experimental results. Both the simulated forces and surface roughness followed the
same trends as the empirical results.
• Increasing the cutting speed decreased the grinding forces in both simulation and
experimental results. A similar influence was seen for varying depth of cut. The
higher depth of cut increased the grinding forces and surface roughness values in
both simulation and experimental results. However; both empirical and simulation
results showed that the feed rate does not influence the surface roughness
significantly.
• The model predicted the mean tangential and normal grinding forces with a total error
of 13.5 %. In the case of prediction of the ground surface roughness, although, the
simulation results were matched with the experimental results in greater degree in
the low cutting speed of 6 m/s, rather in the higher cutting speed (14 m/s) because
the tool vibration which occurs at the higher cutting speeds was not considered in the
model. The surface roughness was predicted at the cutting speed of 6 m/sec with the
total error of 16% among the mean values.
31
• The model shows that the effects of process parameters and wheel surface conditions
could be acceptably mapped to the process outputs, of course with a degree of
accuracy and simplification. The modeling process can be applied, if the tool
conditions (initially or after being worn) could be described as a function of the grain
size, concentration, height and distribution. Further robustness tests of the model for
different conditions and material are currently being performed.
6.3. Paper III
• The dressing overlap ratio and speed ratio are influential factors in the term of surface
quality.
• Increasing the dressing overlap ratio improved the surface roughness in both micro
and macro-grinding processes and led to lower chip loading on the surface of the
grinding pin in micro-grinding process.
• Changing the dressing mode from down to up dressing could improve the surface
roughness as well as reducing the welded clogging on the surface of the grinding pin
in the micro-grinding process. A more even surface and almost no cold-welded
clogging could be observed when up-dressing the grinding pins.
• Using lower quantities of the grinding speed ratios along with higher overlap ratio
improved the surface roughness more compared to the combination of higher
grinding speed ratio and higher overlap ratio in macro-grinding process, however,
the effect of grinding speed ratio is neglectable.
• Decreasing the grinding feed rate decreased the value of the surface roughness.
• The superior fine surface roughness of Ra = 0.035 obtained by using relatively high
dressing overlap ratio Ud = 60 in macro-grinding process.
32
7. Future Work
As mentioned in the introduction, modeling of the micro-grinding process is in its early
stage. And the micro-grinding process is still not a well-understood process, especially in terms
of surface integrity. The future work consists of two analytical and experimental investigations.
7.1. Modeling
Prediction of grinding forces and surface roughness based on the dressing parameters and
tool topography has not been in the focus of analytical modeling. According to the experiments
carried out during the licentiate, both the surface roughness and grinding forces are highly
influenced by the dressing parameters. Varying the dressing overlap ratio and speed ratio
changes the topography of the tool. Hence, dressing parameters must be considered as important
factors in modeling of the grinding process. In the future, an experimental model, based on the
dressing parameters and the active grains will be extracted and included in the analytical
modeling. To this end, the micro-tool will be dressed using the dressing parameters mentioned
in the study. After the dressing, a confocal picture from the whole grinding pin will be taken.
Using the pictures, it will be possible to quantify the number of active grains that come into the
contact with the workpiece during the grinding. Changing the dressing parameters influences
the number of active grains. It enables to extract an equation based on the dressing parameters
(including the dressing speed ratio and overlap ratio) and the number of active grains. This can
be used and included in the analytical model to calculate the grinding forces.
7.2. Material characterization
The surface integrity plays a key role in part performance and its fatigue life. Therefore, the
micro-grinding and dressing parameters must be carefully chosen and controlled to achieve a
desired surface integrity. So far, the effect of these parameters on the surface integrity are still
not fully investigated. In the next stage, the surface integrity of the parts will be examined under
different conditions. The investigation of materials characterization – including, residual
stresses, phase transformation, micro-hardness, grain size and phase fractions, in micro-
grinding Ti6Al4V titanium alloys will be carried out. The chip thickness in micro-machining is
in the same order of magnitude as the material grain size. Therefore, changing the micro-
grinding process parameters as well as dressing parameters give rise to the anisotropic behavior
of the multiphase materials and their deformation characteristics. Thus, their influences are the
subjects of future study. For this purpose, two kinds of Ti6Al4V materials, Additive
Manufactured (AM) titanium and conventional titanium, will be chosen. The phase
transformation mechanism of the materials will be studied to find the fundamentals of the
methodological and mechanical phenomena during micro-grinding operation. The information
regarding the grain structure (size, shape, and distribution), grain boundary characteristics,
crystal graphic texture, and phase distribution will be obtained.

33
8. Acknowledgment
The author would like to thank Professor Bahman Azarhoushang, director of the Institute
of Precision Machining (KSF), Professor Peter Krajnik, director of the Centre for Metal Cutting
Research (MCR) at Chalmers Univerity, and Professor Uta Klement, Head of Division
Materials and Manufacture, Department of Industrial and Materials Science at Chalmers
Univerity for their kind spervision, advices and supports, they have provided throughout the
licentiate. The author would also like to thank all KSF members specially Mr. Daneshi and
Mr. Zahedi for their kind guidance during this period. In particular the author would like to
thank the Meister Abrasive company for providing the micro-grinding tools.
34
9. References
[1] Cheng K, Huo D. Micro-cutting: Fundamentals and applications / editors: Kai Cheng,
Brunel University, UK, Dehong Huo, Newcastle University, UK.
[2] Aurich JC, Carrella M, Walk M. Micro grinding with ultra small micro pencil grinding
tools using an integrated machine tool. CIRP Annals - Manufacturing Technology
2015;64(1):325–8.
[3] Park JB, Lakes RS. Biomaterials: An introduction / Joon Park, R.S. Lakes. 3rd ed. New
York, N.Y.: Springer; 2007.
[4] Ferri Y, Piotrowski O, Chauvy P, Madore C, Landolt D. Two-level electrochemical
micromachining of titanium for device fabrication. J. Micromech. Microeng.
2001;11(5):522–7.
[5] C Madore, D Landolt. Electrochemical micromachining of controlled topographies on
titanium for biological applications. Journal of Micromechanics and Microengineering
1997;7(4):270.
[6] Parker ER, Rao MP, Turner KL, MacDonald NC. Bulk Titanium Microneedles with
Embedded Microfluidic Networks for Transdermal Drug Delivery. In: 19th IEEE
International Conference on Micro Electro Mechanical Systems, p. 498–501.
[7] Thepsonthi T, Özel T. Experimental and finite element simulation based investigations on
micro-milling Ti-6Al-4V titanium alloy: Effects of cBN coating on tool wear. Journal of
Materials Processing Technology 2013;213(4):532–42.
[8] Özel T, Thepsonthi T, Ulutan D, Kaftanoğlu B. Experiments and finite element simulations
on micro-milling of Ti–6Al–4V alloy with uncoated and cBN coated micro-tools. CIRP
Annals 2011;60(1):85–8.
[9] Elias CN, Lima JHC, Valiev R, Meyers MA. Biomedical applications of titanium and its
alloys. JOM 2008;60(3):46–9.
[10] Brunette DM, Tengvall P, Textor M, Thomsen P (eds.). Titanium in medicine: Material
science, surface science, engineering. [Place of publication not identified]: Springer; 2013.
[11] Aimi MF, Rao MP, MacDonald NC, Zuruzi AS, Bothman DP. High-aspect-ratio bulk
micromachining of titanium. Nature materials 2004;3(2):103.
[12] O’Mahony C, Hill M, Hughes PJ, Lane WA. Titanium as a micromechanical material.
Journal of Micromechanics and Microengineering 2002;12(4):438.
[13] Parker ER, Thibeault BJ, Aimi MF, Rao MP, MacDonald NC. Inductively Coupled Plasma
Etching of Bulk Titanium for MEMS Applications. J. Electrochem. Soc.
2005;152(10):C675.
[14] Parker ER, Thibeault BJ, Aimi MF, Rao MP, MacDonald NC. Inductively coupled plasma
etching of bulk titanium for MEMS applications. Journal of the Electrochemical Society
2005;152(10):C675‐C683.
[15] Anstis GR, Chantikul P, Lawn BR, Marshall DB. A critical evaluation of indentation
techniques for measuring fracture toughness: I, direct crack measurements. Journal of the
American Ceramic Society 1981;64(9):533–8.
[16] Donachie MJ. Titanium: A technical guide. 2nd ed. Materials Park, OH: ASM
International; 2000.
35
[17] Jahan MP, Kakavand P, Kwang ELM, Rahman M, Wong YS. An experimental
investigation into the micro-electro-discharge machining behaviour of aluminium alloy
(AA 2024). Int J Adv Manuf Technol 2015;78(5-8):1127–39.
[18] Pradhan BB, Masanta M, Sarkar BR, Bhattacharyya B. Investigation of electro-discharge
micro-machining of titanium super alloy. Int J Adv Manuf Technol 2009;41(11-12):1094–
106.
[19] Pradhan BB, Masanta M, Sarkar BR, Bhattacharyya B. Investigation of electro-discharge
micro-machining of titanium super alloy. The International Journal of Advanced
Manufacturing Technology 2009;41(11-12):1094.
[20] Schomburg WK, Scherrer B. 3.5 mu m thin valves in titanium membranes. Journal of
Micromechanics and Microengineering 1992;2(3):184.
[21] Yang L. The micro-air-vehicle Golden Snitch and its figure-of-8 flapping. 淡江理工學刊
2012;15(3):197–212.
[22] Ehmann KF, Bourell D, Culpepper ML, Hodgson TJ, Kurfess TR, Madou M et al.
Micromanufacturing: International research and development. Springer Science &
Business Media; 2007.
[23] Chae J, Park SS, Freiheit T. Investigation of micro-cutting operations. International Journal
of Machine Tools and Manufacture 2006;46(3-4):313–32.
[24] Gäbler J, Pleger S. Precision and micro CVD diamond-coated grinding tools. International
Journal of Machine Tools and Manufacture 2010;50(4):420–4.
[25] Cao XD, Kim BH, Chu CN. Hybrid micromachining of glass using ECDM and micro
grinding. Int. J. Precis. Eng. Manuf. 2013;14(1):5–10.
[26] Zhou Y, Gong Y, Cai M, Zhu Z, Gao Q, Wen X. Study on surface quality and subsurface
recrystallization of nickel-based single-crystal superalloy in micro-grinding. Int J Adv
Manuf Technol 2017;90(5-8):1749–68.
[27] Feng J, Kim BS, Shih A, Ni J. Tool wear monitoring for micro-end grinding of ceramic
materials. Journal of Materials Processing Technology 2009;209(11):5110–6.
[28] Feng J, Chen P, Ni J. Prediction of surface generation in microgrinding of ceramic
materials by coupled trajectory and finite element analysis. Finite Elements in Analysis
and Design 2012;57:67–80.
[29] Butler-Smith PW, Axinte DA, Daine M. Solid diamond micro-grinding tools: From
innovative design and fabrication to preliminary performance evaluation in Ti–6Al–4V.
International Journal of Machine Tools and Manufacture 2012;59:55–64.
[30] Lee P, Nam JS, Li C, Lee SW. An experimental study on micro-grinding process with
nanofluid minimum quantity lubrication (MQL). Int. J. Precis. Eng. Manuf.
2012;13(3):331–8.
[31] Krajnik P, Rashid A, Pušavec F, Remškar M, Yui A, Nikkam N et al. Transitioning to
sustainable production – part III: Developments and possibilities for integration of
nanotechnology into material processing technologies. Journal of Cleaner Production
2016;112:1156–64.
[32] Perveen A, San WY, Rahman M. Fabrication of different geometry cutting tools and their
effect on the vertical micro-grinding of BK7 glass. Int J Adv Manuf Technol 2012;61(1-
4):101–15.

36
[33] Morgan C, Vallance RR, Marsh ER. Micro Grinding Blind Holes in Hard Tungsten
Carbide with Polycrystalline Diamond Micro Tools.
[34] Morgan CJ, Vallance RR, Marsh ER. Micro machining glass with polycrystalline diamond
tools shaped by micro electro discharge machining. J. Micromech. Microeng.
2004;14(12):1687–92.
[35] Morgan CJ, Vallance RR, Marsh ER. Specific grinding energy while microgrinding
tungsten carbide with polycrystalline diamond micro tools. In: ICOMM-2007 2nd
International Conference on Micro-Manufacturing; 2007, p. 180–187.
[36] Gong YD, Wen XL, Yin GQ, Wang C, Cheng J, Li BP. Experiment Research on Grinding
Temperature of Micro-Grinding H62. AMR 2013;797:615–21.
[37] Ehmann KF, Kapoor SG, DeVor RE, Lazoglu I. Machining Process Modeling: A Review.
J. Manuf. Sci. Eng. 1997;119(4B):655.
[38] Brinksmeier E, Aurich JC, Govekar E, Heinzel C, Hoffmeister H, Klocke F et al. Advances
in Modeling and Simulation of Grinding Processes. CIRP Annals 2006;55(2):667–96.
[39] Tönshoff HK, Peters J, Inasaki I, Paul T. Modelling and Simulation of Grinding Processes.
CIRP Annals 1992;41(2):677–88.
[40] Bissacco G, Hansen HN, Slunsky J. Modelling the cutting edge radius size effect for force
prediction in micro milling. CIRP Annals 2008;57(1):113–6.
[41] Vogler MP, DeVor RE, Kapoor SG. On the Modeling and Analysis of Machining
Performance in Micro-Endmilling, Part I: Surface Generation. J. Manuf. Sci. Eng.
2004;126(4):685.
[42] Park HW, Liang SY. Force modeling of micro-grinding incorporating crystallographic
effects. International Journal of Machine Tools and Manufacture 2008;48(15):1658–67.
[43] Bhateja C. Grinding, theory, techniques, and troubleshooting. Society of Manufacturing
Engineers; 1982.
[44] Anandita S, Mote RG, Singh R. Stochastic analysis of microgrinding tool topography and
its role in surface generation. Journal of Manufacturing Science and Engineering
2017;139(12):121013.
[45] Kunz JA, Mayor JR. Stochastic Characteristics in Microgrinding Wheel Static
Topography. Journal of Micro and Nano-Manufacturing 2014;2(2):21001.
[46] Gorodkova AE, Dyakonov AA, Herreinstein AV. Thermophysical modeling of
microgrinding. Russ. Engin. Res. 2017;37(7):647–50.
[47] Feng BF, Cai GQ. Experimental Study on the Single-Grit Grinding Titanium Alloy TC4
and Superalloy GH4169. KEM 2001;202-203:115–20.
[48] Malkin S, Guo C. Grinding technology: theory and application of machining with
abrasives. Industrial Press Inc; 2008.
[49] Zahedi A. Improving the Cylindrical Grinding of Engineering Ceramics by Applying
Ultrasonic Vibrations and Laser Dressing,. Dissertation, Sharif University of Technology,
Tehran, Iran. 2015.
[50] Yang CY, Xu JH, Ding WF. Grinding Force in Creep Feed Grinding of Titanium Alloy
with Monolayer Brazed CBN Wheels. AMR 2012;565:94–9.
[51] Zahedi A, Azarhoushang B. FEM Based Modeling of Cylindrical Grinding Process
Incorporating Wheel Topography Measurement. Procedia CIRP 2016;46:201–4.
[52] Shaw MC. Principles of abrasive processing. Oxford: Clarendon; 1996.

37
[53] Transchel R, Stirnimann J, Blattner M, Bill B, Thiel R, Kuster F et al. Effective
Dynamometer for Measuring High Dynamic Process Force Signals in Micro Machining
Operations. Procedia CIRP 2012;1:558–62.
[54] Azarhoushang B. Das Abrichten als integraler Bestandteil des Schleifprozesses:
Unkonventionelle Abrichtprozesse. diamond business 2014;Heft 50(ISSN 1619 -
5558):82–9.
[55] Srivastava UM. Review of dressing and truing operations for grinding wheels.
International Journal of Engineering Science and Technology;1(5):8–19.
[56] Rasifard A. Ultraschallunterstütztes Abrichten von keramisch gebundenen CBN-
Schleifscheiben mit Formrollen. Shaker; 2011.
[57] Daneshi A, Jandaghi N, Tawakoli T. Effect of Dressing on Internal Cylindrical Grinding.
Procedia CIRP 2014;14:37–41.
[58] Malkin S, Murray T. Mechanics of Rotary Dressing of Grinding Wheels. J. Eng. for
Industry 1978;100(1):95.
[59] Murray T, Malkin S. Effects of Rotary Dressing on Grinding Wheel Performance. J. Eng.
for Industry 1978;100(3):297.
[60] Linke B. Dressing process model for vitrified bonded grinding wheels. CIRP Annals -
Manufacturing Technology 2008;57(1):345–8.
[61] Klocke F, Linke B. Mechanisms in the generation of grinding wheel topography by
dressing. Prod. Eng. Res. Devel. 2008;2(2):157–63.
[62] Linke B, Klocke F. Temperatures and wear mechanisms in dressing of vitrified bonded
grinding wheels. International Journal of Machine Tools and Manufacture
2010;50(6):552–8.
[63] Saad A, Bauer R, Warkentin A. Investigation of single-point dressing overlap ratio and
diamond-roll dressing interference angle on surface roughness in grinding. Transactions of
the Canadian Society for Mechanical Engineering 2010;34(2):295–308.
[64] Dražumerič R, Badger J, Klement U, Krajnik P. Truing of diamond wheels – Geometry,
kinematics and removal mechanisms. CIRP Annals 2018;67(1):345–8.
[65] Tawakoli T, Rasifard A. Dressing of grinding wheels. In: Machining with Abrasives.
Springer; 2011, p. 181–244.
[66] Wegener K, Hoffmeister H, Karpuschewski B, Kuster F, Hahmann W, Rabiey M.
Conditioning and monitoring of grinding wheels. CIRP Annals - Manufacturing
Technology 2011;60(2):757–77.
[67] Azarhoushang B. Intermittent Grinding of Ceramic Matrix Composites: Unterbrochenes
Schleifen Von Keramischen Faserverbundwerkstoffen. Shaker; 2011.
[68] Malkin S. Grinding technology: Theory and applications of machining with abrasives.
Dearborn, Michigan: Society of Manufacturing Engineers; 1989.
[69] Azarhoushang B, Tawakoli T. Development of a novel ultrasonic unit for grinding of
ceramic matrix composites. Int J Adv Manuf Technol 2011;57(9-12):945–55.
[70] Malkin S. Grinding technology: Theory and applications of machining with abrasives.
Dearborn, Michigan: Society of Manufacturing Engineers; 1989.
[71] Zhou Y, Gong Y, Cai M, Zhu Z, Gao Q, Wen X. Study on surface quality and subsurface
recrystallization of nickel-based single-crystal superalloy in micro-grinding. Int J Adv
Manuf Technol 2016;55(2):745.
38
[72] Wimmer J. Konditionieren hochharter Schleifscheiben zum Schleifen von
Hochleistungskeramik. Lehrst. für Fertigungstechnik und Betriebsorganisation der Univ;
1995.
[73] Tawakoli, T., Daneshi, A (ed.). Innovative Abrichtrolle mit Punktkontakt optimiert die
Abrichtprozesse, T-Dress,: Neue Entwicklungen und Trends aus Forschung und Praxis ;
9. Seminar "Moderne Schleiftechnologie und Feinstbearbeitung" am 15.05.2012 in
Stuttgart. Villingen-Schwenningen: Hochsch. Furtwangen Abt. Villingen-Schwenningen;
2012.
[74] Wang W, Kweon SH, Yang SH. A study on roughness of the micro-end-milled surface
produced by a miniatured machine tool. Journal of Materials Processing Technology
2005;162-163:702–8.
[75] Li B, Ding Z, Xiao J, Liang SY. Maraging steel 3J33 phase transformation during micro-
grinding. Materials Letters 2016;164:217–20.
[76] Shamray S, Daneshi A, Azarhoushang B. High Efficiency, High Speed Grinding of a
Composite Material Consisting of Polymer Concrete and Steel Structures. Procedia CIRP
2016;46:607–10.
[77] Arif M, Rahman M, Yoke San W. Analytical model to determine the critical feed per edge
for ductile–brittle transition in milling process of brittle materials. International Journal of
Machine Tools and Manufacture 2011;51(3):170–81.
[78] Kadivar MA, Akbari J, Yousefi R, Rahi A, Nick M. Investigating the effects of vibration
method on ultrasonic-assisted drilling of Al/SiCp metal matrix composites. Robotics and
Computer-Integrated Manufacturing 2014;30(3):344–50.
[79] Fujimoto M, Ichida Y. Micro fracture behavior of cutting edges in grinding using single
crystal cBN grains. Diamond and Related Materials 2008;17(7-10):1759–63.
[80] Heinzel C, Antsupov G. Prevention of wheel clogging in creep feed grinding by efficient
tool cleaning. CIRP Annals - Manufacturing Technology 2012;61(1):323–6.