Embed Size (px)
Citation preview

Lund University
Master of International Development and Management
May, 2010
MICRO AND SMALL ENTERPRISE DEVELOPMENT IN BOLIVIA
SEEKING OPPORTUNITIES
Author: Cintia S. Vega
Supervisor: Anders Uhlin

Micro and Small Enterprise Development in Bolivia, Seeking Opportunities
By Cintia S. Vega
2
ABSTRACT
During the last three decades, there has been a growing interest in the role of Micro and
Small Enterprises (MSEs) as engines of economic development and pro-poor growth. In
Bolivia, MSEs are the main source of employment but have alarmingly low levels of
productivity. Therefore, the purpose of this study was to seek for an explanation of the
relevance of MSEs´ growth in the Bolivian context as well as to understand the different
factors affecting its performance. In order to conduct the analysis, a mixed methods
approach primarily based on quantitative data analysis was used.
On the basis of the analysis, it was concluded that MSEs´ growth has a direct impact on
employment levels in Bolivia and MSEs are thus an important tool in the fight against
unemployment. Results also showed that Bolivian MSEs are characterized by a relatively
low use of external financing, poor levels of expenditure on fixed assets, technology and
quality, and an intensive use of unqualified labour as their main resource to achieve results,
all of which negatively affects their productivity. Additionally, it was found that the
environment is not conductive for business development and it constrains MSE´s
performance and growth.

Micro and Small Enterprise Development in Bolivia, Seeking Opportunities
By Cintia S. Vega
3
TABLE OF CONTENTS
ABREVIATIONS AND ACRONYMS ................................................................................. 5
1. INTRODUCTION .......................................................................................................... 6
1.1. Research Purpose and Research Questions.............................................................. 6
1.2. Disposition ............................................................................................................... 7
2. ANALYTICAL FRAMEWORK ................................................................................... 9
2.1. Literature Review: MSEs´ Relevance ...................................................................... 9
2.2. Empirical Background: The Bolivian Scenario ..................................................... 12
2.3. Analytical Model ................................................................................................... 16
2.4. Hypotheses ............................................................................................................. 17
2.5. Conceptualization .................................................................................................. 18
3. METHODOLOGY ....................................................................................................... 23
3.1. Research Design .................................................................................................... 23
3.2. Ontology and Epistemology .................................................................................. 24
3.3. Choice of Research Methods ................................................................................. 25
3.4. Data analysis technique ......................................................................................... 28
3.5. Reliability and validity ........................................................................................... 29
3.6. Limitations ............................................................................................................. 30
3.7. Ethical considerations ............................................................................................ 32
4. DATA ANALYSIS AND FINDINGS ......................................................................... 33
4.1. First Question: Why does MSEs´ growth matter? ................................................. 33
4.2. Second Question: What determines or affects MSEs´ growth in Bolivia? ............ 35
4.2.1. How do endogenous factors of productivity affect MSEs´ performance in
Bolivia?. ........................................................................................................................ 35
Micro and Small Enterprise Development in Bolivia, Seeking Opportunities
By Cintia S. Vega
4
4.2.2. Is there any correlation between an enabling environment and a better
performance of MSEs? ................................................................................................. 44
4.3. Results Summary ................................................................................................... 46
5. DISCUSSION ............................................................................................................... 48
6. CONCLUSIONS .......................................................................................................... 56
7. REFERENCES ............................................................................................................. 58
Annex 1 – Questions and variables used .............................................................................. 63
Annex 2 – Analysis of MSEs´ growth relevance ................................................................. 66
Annex 3 - Financial Capital Analysis ................................................................................... 66
Annex 4 – Physical Capital Analysis ................................................................................... 69
Annex 5 – Human Capital Analysis ..................................................................................... 70
Annex 6 – Technology and Quality Analysis ....................................................................... 73
Annex 7 – Raw Materials and Supply Chain Analysis ........................................................ 74
Annex 8 – Enabling Environment Analysis ......................................................................... 75
Micro and Small Enterprise Development in Bolivia, Seeking Opportunities
By Cintia S. Vega
5
ABREVIATIONS AND ACRONYMS
BEE Business Enabling Environment
BPRS Bolivian Poverty Reduction Strategy
EE Enabling Environment
ES Enterprise Survey
IC Investment Climate
IFC International Finance Corporation
ILO International Labour Organization
MSEs Micro and Small Enterprises
MSMEs Micro, Small and Medium Enterprises
R&D Research and Development
SMEs Small and Medium Enterprises
WB The World Bank

Micro and Small Enterprise Development in Bolivia, Seeking Opportunities
By Cintia S. Vega
6
1. INTRODUCTION
During the last three decades, there has been a growing interest in the role of Micro and
Small Enterprises (MSEs) as engines of economic development and pro-poor growth.
MSEs have been recognized as a major source of employment and income in many
developing countries (Mead & Liedholm, 1998). Thus, their role in poverty reduction and
equitable development through income generation seems to be certain. However, the same
cannot be said regarding their contribution to economic development. Jeppesen (2005)
explains that most MSEs are only survival enterprises, which make a relatively low
contribution to the total production output.
In Bolivia, MSEs constituted by up to twenty workers account for the vast majority of
enterprises and provide approximately eighty-eight percent of all jobs (Delgadillo, 2001),
which turns this segment into the main source of employment in a context of high poverty
rates and unemployment. However, MSEs have very low productivity levels when
compared to bigger companies: while micro enterprises produce 26% of the GDP, large
companies are accountable for more than 65% of it (Fretes-Cibils et al., 2006).
The alarming positive relation between size of enterprise and productivity levels has raised
the question of whether Bolivia’s efforts should be placed in promotion of MSEs at all.
Considering the limited resources the country has, some authors suggested that Bolivia´s
strategy should be focused on development of Small and Medium Enterprises (SMEs)
instead, since they have higher chances of contributing to private sector competitiveness
(Nisttahusz, 2002; Zevallos & Velazco, 2003).
Given that productivity growth is thought to be a necessary pre-condition that a country
must meet in order to achieve economic growth and poverty alleviation (Bastos & Nasir,
2004; The World Bank, 2007), it seems crucial to analyze what the current role and
importance of MSEs in Bolivia are and which factors are affecting their productivity.
1.1. Research Purpose and Research Questions
Based on the existing controversies about the role of MSEs and on the alarming statistics
showing their low productivity levels, the intention of this study is to seek for a

Micro and Small Enterprise Development in Bolivia, Seeking Opportunities
By Cintia S. Vega
7
theoretically sound and empirically validated explanation of the relevance of MSEs´ growth
in the Bolivian context as well as to understand the different factors affecting its
performance.
The main questions in this study are therefore as follows:
Why does MSEs´ growth matter?
What determines or affects MSEs´ growth in Bolivia?
How do endogenous factors of productivity affect MSEs´ performance in
Bolivia?
Is there any correlation between an enabling environment and a better
performance of MSEs?
Understanding the first question is necessary to contribute to the ongoing international and
local policy debate about MSEs, as it provides elements to better judge whether this sector
should be encouraged or not. If, as suspected, this sector should indeed be promoted, the
second question will allow identifying the issues that need to be addressed. It is expected
that the study results will add to an increased understanding of the main constrains facing
MSEs and serve to formulate policy recommendations regarding where reform efforts
should be targeted to have the greatest impact on MSEs´ productivity and performance.
1.2. Disposition
This Chapter is followed by a presentation of the Analytical Framework (Chapter 2),
including a literature overview on MSEs´ relevance, empirical background information
about the Bolivian case, the analytical model that guides the data analysis, the hypotheses
that will be tested and the description of the main concepts that will be used throughout the
study. The third chapter refers to the used Methodology, comprising the research design
and strategy, the epistemological and ontological position, the methods used for data
collection and data analysis, the limitations encountered by the study and some ethical
considerations. This will be followed by the presentation of the Data Analysis and Findings
related to the proposed research questions (Chapter 4), after which a Discussion comparing

Micro and Small Enterprise Development in Bolivia, Seeking Opportunities
By Cintia S. Vega
8
the study results with previous studies will be included (Chapter 5). Finally, Chapter 6
provides the main Conclusions derived from the analysis.

Micro and Small Enterprise Development in Bolivia, Seeking Opportunities
By Cintia S. Vega
9
2. ANALYTICAL FRAMEWORK
The current section will present an overview of the research topic and the frame that will be
used to conduct the analysis. Firstly, theories and existing studies regarding MSEs´
development will be presented. This will be followed by empirical background information
about MSEs in the Bolivian context. A third part will present the analytical model that will
be applied to address the research problem. Consequently, based on the previous
information, hypotheses will be introduced. Finally, an explanation of the main concepts
that will be used throughout the study will be included.
2.1. Literature Review: MSEs´ Relevance
Since the 1970s, there is a growing trend to investigate the potential of MSEs as an engine
for growth coming from academia, policy-makers, and members of the development field
(McPherson, 1996). As Vandenberg (2009) points out, MSEs contribute in a substantial
way to employment in both developed and developing countries, accounting, together with
medium size enterprises, for over 90% of enterprises in all countries.
When it comes to developing countries, MSEs are considered a major source of
employment and income, with empirical data and official statistics showing that workers
formally employed in the MSE sector range from one quarter to one third, respectively, of
the entire employed population (Mead & Liedholm, 1998; Vandenberg, 2009).
Additionally, it was found that in many countries one out of three of the new economically
active population enters the labour force by working in micro and small enterprises (Mead
& Liedholm, 1998). Besides, it must be considered that low income countries have very
large informal economies mainly comprised of micro-business, so the actual employment
provided by MSEs is in fact much higher, turning MSEs into a dominating feature of the
developing world (Vandenberg, 2009).
Some authors also claim that in developing countries, most of which are characterized by
unemployment and inequality, small enterprises have the potential to alleviate poverty
through employment generation and are considered as engines of economic growth (Özar et
al., 2008). However, even though these firms constitute the largest group in the private
Micro and Small Enterprise Development in Bolivia, Seeking Opportunities
By Cintia S. Vega
10
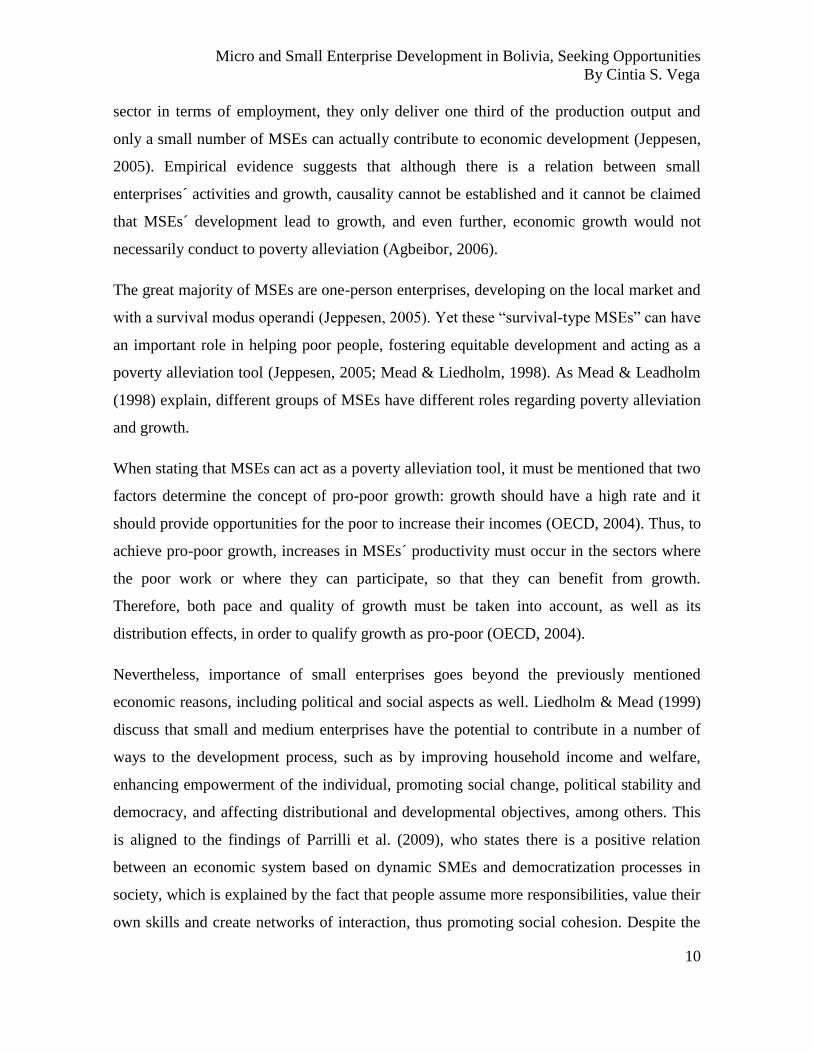
sector in terms of employment, they only deliver one third of the production output and
only a small number of MSEs can actually contribute to economic development (Jeppesen,
2005). Empirical evidence suggests that although there is a relation between small
enterprises´ activities and growth, causality cannot be established and it cannot be claimed
that MSEs´ development lead to growth, and even further, economic growth would not
necessarily conduct to poverty alleviation (Agbeibor, 2006).
The great majority of MSEs are one-person enterprises, developing on the local market and
with a survival modus operandi (Jeppesen, 2005). Yet these “survival-type MSEs” can have
an important role in helping poor people, fostering equitable development and acting as a
poverty alleviation tool (Jeppesen, 2005; Mead & Liedholm, 1998). As Mead & Leadholm
(1998) explain, different groups of MSEs have different roles regarding poverty alleviation
and growth.
When stating that MSEs can act as a poverty alleviation tool, it must be mentioned that two
factors determine the concept of pro-poor growth: growth should have a high rate and it
should provide opportunities for the poor to increase their incomes (OECD, 2004). Thus, to
achieve pro-poor growth, increases in MSEs´ productivity must occur in the sectors where
the poor work or where they can participate, so that they can benefit from growth.
Therefore, both pace and quality of growth must be taken into account, as well as its
distribution effects, in order to qualify growth as pro-poor (OECD, 2004).
Nevertheless, importance of small enterprises goes beyond the previously mentioned
economic reasons, including political and social aspects as well. Liedholm & Mead (1999)
discuss that small and medium enterprises have the potential to contribute in a number of
ways to the development process, such as by improving household income and welfare,
enhancing empowerment of the individual, promoting social change, political stability and
democracy, and affecting distributional and developmental objectives, among others. This
is aligned to the findings of Parrilli et al. (2009), who states there is a positive relation
between an economic system based on dynamic SMEs and democratization processes in
society, which is explained by the fact that people assume more responsibilities, value their
own skills and create networks of interaction, thus promoting social cohesion. Despite the

Micro and Small Enterprise Development in Bolivia, Seeking Opportunities
By Cintia S. Vega
11
fact that both authors´ findings were based in the SMEs context, it is logical to believe that
this would also apply to MSEs, considering empowerment and social change as
consequences of higher employment rates and a more active participation in society
through the development of productive activities.
As it can be observed, there is a multiple and complex set of reasons that explain why
supporting MSEs matters. However, it can also be simplified and narrowed down to the
basics: they account for the largest share of employment by far (ILO, 2007). Taking into
account developing countries have critical issues of unemployment, the single fact that
MSEs are the largest employment providers is enough to focus attention on MSEs´
dynamics of functioning.
Empirical studies prove that though the ratio of small firm creation is higher than that of
bigger companies, they also have a shorter life since they are more vulnerable (Audretsch et
al., 2009). Mead and Liedholm (1998) studied the dynamics of MSEs´ life cycle and found
some studies suggesting that closure rates in some countries can be higher than 20% per
year. Therefore, this sector is particularly instable. Several authors agree that MSEs´
development seems to be hindered by exogenous and endogenous constrains (Harvie &
Lee, 2002; Kirby & Watson, 2003; Brown et al., 2005; Fogel et al., 2006), which affect
their ability to compete in the markets and to grow or even survive.
Consequently, countries should do their best to limit MSEs´ closures and layoffs
(Vandenberg, 2009). This could be done by promoting new business start, countering the
forces that cause existing enterprises to fail or improving performance of existing ones
(Mead & Liedholm, 1998). However, in spite of the drastic importance informal MSEs
have in most developing countries, there is limited direct help for them (Vandenberg,
2009). Özar et al. (2008) explain that policies to enhance enterprise performance are
usually focused on SMEs and, especially in emerging countries, forget to consider the
specificities of MSEs, which are less institutionalized and have different needs. Thus, the
specific needs of the sector call for specific policies (Jeppesen, 2005).
Micro and Small Enterprise Development in Bolivia, Seeking Opportunities
By Cintia S. Vega
12
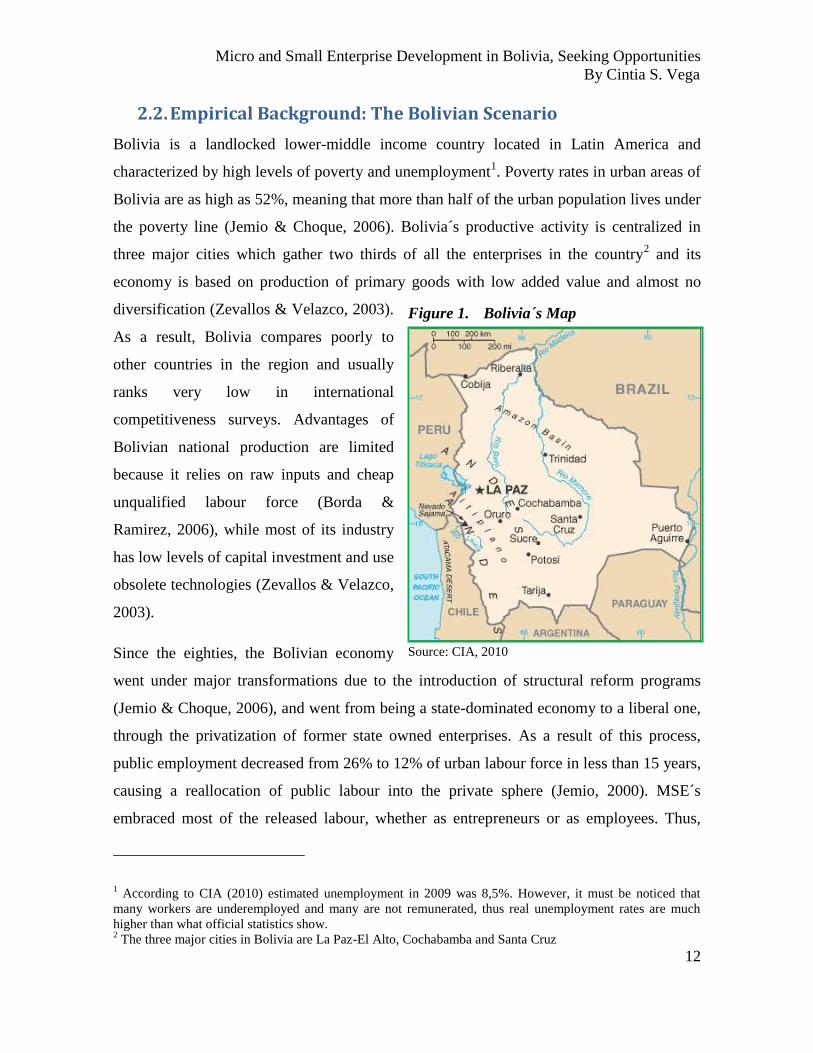
2.2. Empirical Background: The Bolivian Scenario
Bolivia is a landlocked lower-middle income country located in Latin America and
characterized by high levels of poverty and unemployment1. Poverty rates in urban areas of
Bolivia are as high as 52%, meaning that more than half of the urban population lives under
the poverty line (Jemio & Choque, 2006). Bolivia´s productive activity is centralized in
three major cities which gather two thirds of all the enterprises in the country2 and its
economy is based on production of primary goods with low added value and almost no
diversification (Zevallos & Velazco, 2003).
As a result, Bolivia compares poorly to
other countries in the region and usually
ranks very low in international
competitiveness surveys. Advantages of
Bolivian national production are limited
because it relies on raw inputs and cheap
unqualified labour force (Borda &
Ramirez, 2006), while most of its industry
has low levels of capital investment and use
obsolete technologies (Zevallos & Velazco,
2003).
Since the eighties, the Bolivian economy
went under major transformations due to the introduction of structural reform programs
(Jemio & Choque, 2006), and went from being a state-dominated economy to a liberal one,
through the privatization of former state owned enterprises. As a result of this process,
public employment decreased from 26% to 12% of urban labour force in less than 15 years,
causing a reallocation of public labour into the private sphere (Jemio, 2000). MSE´s
embraced most of the released labour, whether as entrepreneurs or as employees. Thus,
1 According to CIA (2010) estimated unemployment in 2009 was 8,5%. However, it must be noticed that
many workers are underemployed and many are not remunerated, thus real unemployment rates are much
higher than what official statistics show. 2 The three major cities in Bolivia are La Paz-El Alto, Cochabamba and Santa Cruz
Figure 1. Bolivia´s Map
Source: CIA, 2010

Micro and Small Enterprise Development in Bolivia, Seeking Opportunities
By Cintia S. Vega
13
nowadays MSEs employing up to 20 workers constitute the vast majority of all enterprises
in Bolivia, as Figure 2 shows.
Figure 2. Number of Enterprises per Size of Enterprise
Source: Own Elaboration, based on INE (1992)
It can be seen by looking at the pyramid that microenterprises constituted by up to nine
workers provide eighty-tree percent of the jobs, which turns this segment, together with
small enterprises, into the main sources of employment in the country. However, as it can
be seen in Table 1 and Figure 3, their labour productivity is very low when compared to big
companies: while micro enterprises account for 26% of the GDP, large companies produce
more than 65% of it (Fretes-Cibils et al., 2006). Besides, there is an alarming positive
relation between size of enterprise and productivity levels, which makes it imperative to
investigate productivity levels of MSEs (Nisttahusz, 2002) and even question if they should
be promoted at all. Moreover, sectors where the major part of employment is gathered and
the poor are employed, such as MSEs, were “those with the lowest growth rates of GDP,
labour productivity and real incomes” (Jemio & Choque, 2006:3).
Table 1. GDP, Employment and Productivity by Size of Enterprise Size of Ent. GDP in Bs GDP % Employment Employment % Labour Productivity
1-9 E. 12.404.498 26,32 2.983.503 83,1 4,16
10-19 E. 1.330.717 2,82 170.291 4,7 7,81
20-49 E. 1.630.215 3,46 122.976 3,4 13,26
50-more E. 31.759.937 67,39 312.450 8,7 101,65
Totals 47.125.367 100,00 3.589221 100,00 13,13
Source: Own Elaboration, based on Delgadillo (2001)
Figure 3. Contributions to Employment, GDP and Productivity by Size of Enterprise

Micro and Small Enterprise Development in Bolivia, Seeking Opportunities
By Cintia S. Vega
14
Source: Own Elaboration, based on Delgadillo (2001)
According to Borda & Ramirez (2006) productivity of big enterprises is 24 times higher
than that of MSEs, which they attribute to qualified human labour, increased use of
technology and better market access opportunities, including access to external markets.
Several authors strongly suggest that instead of supporting MSEs, national efforts should be
placed on the Small and Medium Enterprises´ sector (SMEs). This position has originated
in the idea that SMEs have bigger chances of achieving a more equitable income
distribution, promoting productive investment and ultimately supporting a development
strategy based on private sector competitiveness (Nisttahusz, 2002). Zevallos & Velazco
(2003) clearly state that MSEs are not a sustainable strategy for development and they only
recognize the role of MSEs as employment generators and survival options for many
citizens. Moreover, Andersen & Muriel (2007) reflect that it might not be the best strategy
to build the national economy upon micro and small businesses characterized by
informality and low productivity.
Within the MSEs´ sector, a difference must be made between productive enterprises with
growth potential and subsistence enterprises. The bulk of MSEs in Bolivia are comprised of
the second type, which are labour intensive establishments (Jemio & Choque, 2006), and
thus become an important tool in the fight against unemployment. Therefore, Borda &
Ramirez (2006) propose to consider MSEs as part of the poverty reduction strategy instead
0
20
40
60
80
100
1 - 9 10 -19 20 - 49 50-more Totals
Percentage of Employment
% GDP
Labour Productivity
Micro and Small Enterprise Development in Bolivia, Seeking Opportunities
By Cintia S. Vega
15
of expecting them to become originators of productive development and economic growth
engines. In fact, since most urban informal workers are employed in low productivity
MSEs and are usually poor (Ibid.), productive development of Micro, Small and Medium-
Sized Enterprises (MSMEs) is one of the priorities of the Bolivian Poverty Reduction
Strategy (BPRS).
Different studies have been developed to address the low levels of productivity of Bolivian
MSEs. The World Bank (2009) focused its analysis on the high informality rates observed
in MSEs and its effects, concluding that since informal MSEs operate outside the law, they
cannot get favourable credit terms or take advantage of institutions that support and
facilitate enterprise development, thus limiting their productivity and profitability. Zevallos
& Velazco (2003) go one step further, and attribute the high levels of informality to the
Bolivian institutional instability, explaining that shifting policies ranging from left to right
create ever-changing institutional restrictions which affect investment decisions and
planning. Similar findings were presented by Andersen & Muriel (2007) in their study
about gender effects on productivity, explaining that the current institutional setup in
Bolivia does not provide incentives for a firm to grow, and this is partly attributed to the
tax-system, which becomes extremely demanding as soon as an enterprise reaches a certain
size. Finally, Jemio & Choque (2006) provide a different perspective and attribute low
levels of productivity to the small size of firms, which prevents division of labour and
specialization, and to low levels of available capital, suggesting that MSEs can only
achieve output growth through an increase in workforce inputs. Considering that MSEs are
labour intensive, they also state that lack of training and a poor educational system are
greatly constraining productivity increases both at enterprise level and at a national scale.
However, none of these studies provides a comprehensive and holistic analysis of the role
of both internal and external factors on productivity, and the different factors are only
partially analyzed under the light of their specific topic, be it gender, formality or any other.
Considering there is a multiplicity of different factors influencing productivity levels of
MSEs and acting as constrains for their development, it is interesting to evaluate them and
find out which the most crucial ones are and how the relations among them are.

Micro and Small Enterprise Development in Bolivia, Seeking Opportunities
By Cintia S. Vega
16
Thus, an analysis of these factors will be conducted based on an inclusive analytical
framework that takes into consideration the role of each of the factors on MSEs´
productivity and growth.
2.3. Analytical Model
In order to study the research topic and to address the selected research questions, a suitable
analytical tool will be built based on a model developed by ILO about what determines or
affects productivity in enterprises. During 2007, ILO published a report aimed at analyzing
how the contribution of enterprises to productive and equitable economic and employment
growth could be strengthened. It analyzed several concepts related to what makes an
enterprise sustainable and it concluded that competitiveness relies on productivity, and that
sustainable enterprises are those which are competitive (thus productive) and function in a
competitive environment.
ILO (2007) explains that the concept of competitiveness is too broad and complex, which
makes it difficult to measure. Competitiveness is usually approached by referencing a wide
range of factors and they can be categorized as either endogenous factors or exogenous
factors. The first ones are those that are internal to the enterprise and are under its control,
such as labour or capital productivity; the second ones are those that are external to the
enterprise and that are outside the enterprise´s area of influence, such as the Business
Enabling Environment (BEE) and macroeconomic, political, legal and social circumstances
(Ibid.). The Systemic Competitiveness model can be found in Figure 4, which is presented
below:

Micro and Small Enterprise Development in Bolivia, Seeking Opportunities
By Cintia S. Vega
17
Figure 4. Determinants of Productivity and Competitiveness
Source: ILO, 2007
2.4. Hypotheses
Based on the research questions, the previously discussed literature and the analytical
model that will be used, the study will test the following hypotheses against empirical
quantitative data:
Table 2. Research Question and Hypotheses
Research Question Hypothesis
Why does MSEs´ growth matter?
H1: Bolivian MSEs´ growth is positively correlated to a
higher demand for labour.
What determines or affects MSEs growth
in Bolivia? - How do endogenous factors
of productivity affect MSEs´
performance?
Financial Capital - H2: Bolivian MSEs use alternative
sources of external financing instead of commercial banks.
Physical Capital - H3: Higher investments in physical capital
are positively correlated to higher labour productivity.
Human Capital - H4a: Education levels of workforce are
positively correlated to labour productivity.
Human Capital – H4b: Manager´s experience is positively
correlated to labour productivity.
Technology and Quality - H5: Most Bolivian MSEs have low
levels of investment in research & development, technology

Micro and Small Enterprise Development in Bolivia, Seeking Opportunities
By Cintia S. Vega
18
and quality.
Raw Materials and Supply Chain - H6: There is a positive
correlation between an MSE´s amount of sales and the size of
its suppliers (smaller MSEs buy materials from small
companies or intermediaries).
What determines or affects MSEs growth
in Bolivia? - Is there any correlation
between an enabling environment and a
better performance of MSEs?
H7: There is a positive correlation between MSEs exposed to
an enabling environment and their performance.
2.5. Conceptualization
Since words can have different meanings, it is important to unify the connotation of the
concepts that will be used along the study. These concepts have been influenced by both
literature review and the analytical framework previously explained.
MSEs: As it is shown in table 3, the Bolivian legislation states that an MSEs is any
enterprise that employs less than 20 workers, sells less than 4,500 minimum legal salaries
annually, and has productive assets for less than 1,800 minimum legal salaries. However, as
far as the purposes of this study go, only the parameters referring to number of employees
will be considered when categorizing enterprises into micro and small.
Table 3. MSE Legal Categorization Criteria Microenterprise Small Enterprise
Number of Employees 1 to 10 11 to 20
Annual sales expressed as Minimum Legal Salaries Smaller or equal to 1,350 Smaller or equal to 4,500
Productive assets expressed as Minimum Legal Salaries Smaller or equal to 350 Smaller or equal to 1,800
Source: Own Elaboration, based on Resolución Ministerial No. 325/01
MSEs´ Growth: This is defined as the phases of development through which an
enterprise may pass during its life-cycle (McMahon, 1995). Traditional theories originating
in the field of economics believed these phases are sequential, while more recent theories
state that enterprises do not necessary pass through all the stages in a certain order
(McMahon, 1998). Growth of MSEs can be measured in different ways, such as growth in
sales, increase in number of workers or increments in profits. According to McPherson
(1996:261) “growth in terms of sales or profits might be preferable to a labour-based
measure from an accuracy standpoint”, given that measurement is not an obstacle and data

Micro and Small Enterprise Development in Bolivia, Seeking Opportunities
By Cintia S. Vega
19
is available. Hence, this study will use amounts of sales per year to measure a firm´s growth
rates.
MSEs´ Productivity: Productivity can be defined as the relation between outputs (or
what is produced) and inputs (or what resources are needed to produce). Thus, productivity
gains are the increase in production exceeding the increase in the utilized production
factors, which could be labour hours worked or capital units spent (The World Bank, 2009).
Additionally, two types of Productivity were identified by Aguilar & Elizondo (2009): the
first one is based on low production costs achieved by minor investments in technology and
use of unskilled personnel. The second one relies on highly qualified labour and
investments in technology, based on specialization. The difference between the two groups
is its effects (or lack of them) on employment and on productive efficiency.
Labour Productivity: This is typically measured as a ratio of output per labour-hour, an
input. This study will use the concept of Revenue per Employee instead of Labour
Productivity, since it will not measure ratio of production per labour-hour, but the ratio of
sales per employee. Yet when analysis and discussions take place, the terms labour
productivity and revenue per employee will be used indistinctly.
MSEs´ Competitiveness: According to ILO (2007:58), “virtually everything matters for
competitiveness”. Porter (1991) argues that competitiveness is measured through
productivity and thus, productivity determines competitiveness, which is aligned to the
selected analytical model developed by ILO (2007). More recent studies state that
productivity is just one of the components of competitiveness (Feuvrier & Götzfried, 2001)
and others discuss that competitiveness may be based on low cost or on high specialization
and productivity (Aguilar and Elizondo, 2009). This study does not intend to analyze
enterprise competitiveness, thus based on ILO´s analytical framework (see Figure 4),
competitiveness will be considered as a direct result of productivity.
MSEs´ Performance: Performance indicates how well an enterprise is doing and it
embodies a combination of different factors such as growth, productivity and
competitiveness. Throughout the study, the concept of MSEs´ performance will be used to
assess the effects of endogenous and exogenous factors.

Micro and Small Enterprise Development in Bolivia, Seeking Opportunities
By Cintia S. Vega
20
Endogenous and Exogenous Factors of Productivity: This concept was previously
explained when the Analytical Model was introduced. Complementary, it should be added
that other authors refer to internal and external factors or conditions instead of endogenous
and exogenous factors of productivity. Nonetheless, the idea holding the model is the same
one: both types of factors or conditions are affecting a firm´s performance and should be
equally considered (Subramanian et al., 2005).
Endogenous Factors are categorized in physical capital, human capital, financial
capital, technology and quality, and raw materials and supply chain.
Exogenous Factors will be grouped into different categories in order to facilitate the
analysis, though the study will focus on the role of the enabling environment as a whole
element instead of analyzing its individual components.
Enabling environment: According to ILO, “the business-enabling environment is a
broad concept which covers a range of factors, external to the enterprise, that affect
enterprise formation and growth” (2007:x). Other authors refer to the investment climate
instead of the external environment (Subramanian, 2005), which is defined as “the many
location-specific factors that shape the opportunities and incentives for firms to invest
productively, create jobs and expand” (ILO, 2007:26). For the purposes of this study,
enabling environment and investment climate will be considered as synonyms and the
enabling environment shall encompass the following:
Laws and regulations: “Government laws and regulations define property rights and
the rules for exchanging them; they also set the rules for market entry and exit and in
support of competition” (Smallbone & Welter, 2001:259). Put in different words, laws
and regulations set the formal field play in which enterprises develop, involving aspects
related to property, licensing, registration, contracts, taxes, etc. ILO (2007) elucidates
that enterprises rely on adequate regulatory frameworks for different purposes, such as
ensuring fair competition, improving the way markets work through contract
enforcement and protection of intellectual property rights, and last but not least, ensuring
market sustainability through efficient fuel and energy use regulations, among others.
Policies: Policies define how enabling an environment is for enterprise growth
because they usually affect demand conditions (ILO, 2007). Some of the key policy

Micro and Small Enterprise Development in Bolivia, Seeking Opportunities
By Cintia S. Vega
21
areas are macroeconomic policies regarding fiscal and monetary issues, educational
policies that affect labour qualifications, sector level policies concerning investment and
industrial promotion, geographical or regional policies for enterprise development, trade
and regional integration policies and market access policies.
Institutional Framework: Institutions provide the structure in which enterprises act,
offering incentives and setting constraints that could enhance or hinder firms´ strategy
regarding proactive behaviour, risk-taking and innovation (Roxas et al., 2008; North,
1992). To the ends of the study, the concept of institutions will have a narrow meaning
and it will refer to government agencies and other official entities with which enterprises
must interact in order to conduct operations.
Macroeconomic and Political Conditions: The political and economic context in
which MSEs operate influences their results. When the economy is going through
recession or stagnant cycles, it might be unrealistic to expect MSEs to expand and when
the economy is thriving, it is likely that MSEs will benefit from that general prosperity
(Mead & Liedholm, 1998). Likewise, in a context characterized by political instability,
conducting business is more challenging than it would be in a context of certainty and
predictability.
Markets and Competition: MSEs develop in a given market and under specific
competition practices, thus practices of competitors and the market´s dynamics are
affecting the business environment and need to be taken into account.
Infrastructure: This factor has a determinant role in the opportunities and costs that all
firms have by allowing firms to connect with markets (ILO, 2007). Infrastructure
encompasses the physical existence of roads, power lines, water systems, etc., as well as
the quality and efficiency of the provision and maintenance of public services (WB-IFC,
2006).
Based on the concepts previously explained, the adapted analytical framework that will be
used in the study is presented below (See Figure 5).

Micro and Small Enterprise Development in Bolivia, Seeking Opportunities
By Cintia S. Vega
22
Figure 5. Analytical Tool
Source: Own Elaboration
Exogenous Factors:
1- Laws and Regulations2- Policies
3- Institutional Framework4- Macroeconomic and
political conditions5- Markets and
Competition Practices6- Infraestructure
Endogenous Factors: 1- Financial Capital2- Physical Capital3- Human Capital4- Technology and
Quality5- Raw Material snd
Supply Chain
MSEs´Performance:
Productivity
Competitivity
Growth
Enabling
Environment
Micro and Small Enterprise Development in Bolivia, Seeking Opportunities
By Cintia S. Vega
23
3. METHODOLOGY
This section will explain the chosen research design for the study, followed by a brief
description of the ontological and epistemological position that was taken. Subsequently,
the selected research methods will be presented and discussed in detail, as well as the
techniques used to analyze the data. Afterwards, the used methodology and methods will be
critically assessed regarding reliability and validity, and the encountered limitations will be
presented. Finally, ethical considerations that were taken into account throughout the study
will be explained.
3.1. Research Design
The study can be categorized as applied research, since it seeks to understand the nature
and sources of a social problem -MSEs growth in Bolivia- in order to contribute to theories
that could be used to design problem solving programs and interventions in a future
(Mikkelsen, 2005).
In view of the nature of my research purpose, I will utilize a deductive approach. Based on
what is currently known about Micro and Small Enterprise Growth, several hypotheses
were built under the frame of the “productivity and competitiveness” analytical model
developed by ILO (2007). These hypotheses will be subjected to empirical scrutiny
(Bryman, 2004) through the statistical analysis of a quantitative dataset on Bolivian MSEs.
Subsequently, the empirical findings will be analyzed and discussed under the light of
qualitative data obtained from previous research and studies. This is supported by the belief
that ideas must be tested rigorously before they can be considered knowledge (Ibid.).
The research strategy employed in the present study is primarily quantitative, which is used
when the goal is to identify general patterns and relationships through the testing of
correlations between variables (Ragin, 1994). Likewise, Mikkelsen (2005) elucidates that
quantitative analysis is characterized by measurement of objective facts with a focus on
variables. She also explains that quantitative analysis considers many cases and subjects of
study and uses statistical analysis. Besides, the researcher does not have a close relation
with the objects of study and must be detached in order to provide value-free findings

Micro and Small Enterprise Development in Bolivia, Seeking Opportunities
By Cintia S. Vega
24
(Mikkelsen, 2005). All these features apply to the current study so it could be categorized
as quantitative. However, since some qualitative analysis is done to complement the
quantitative core of the study, it could be argued that a mixed methods approach with a
strong quantitative focus is applicable to the current study. As Bryman (2008:588) explains
“quantitative and qualitative research are employed in relation to each other so that
qualitative research is used to analyze quantitative research and vice versa”. Therefore, it
will be considered that the research strategy is a mix methods approach that heavily relies
on quantitative analysis.
The research design is based on a survey research, which is defined by Bryman (2004:41)
as follows:
“Survey research comprises a cross-sectional design in relation to which data are
collected predominantly by questionnaire or by structured interview on more than one
case (usually quite a lot more than one) and at a single point in time in order to collect a
body of quantitative or quantifiable data in connection with two or more variables
(usually many more than two), which are then examined to detect patterns of
association”
A case study was also considered as a research design due to the nature of the research
problem; a case study focuses on few cases in depth and uses qualitative methods such as
interviews and focus groups in order to explain that particular problem (Gomm, 2000;
Bryman, 2004). On the other side, cross-sectional survey investigates a large number of
cases to understand patterns of association between variables. Many cases need to be
studied in order to achieve empirical generalization of results, which is one of the concerns
of cross-sectional survey (Bryman, 2004). Considering that the current study investigates
correlation between different variables within a large number of enterprises and
quantitative methods will be mainly used to assess these relations, a survey research design
is therefore considered more suitable than a case study design.
3.2. Ontology and Epistemology
The study uses a postpositive approach, which claims that causes might influence the
outcomes. Besides, the postpositive approach relies on the scientific method, which
requires proving theories by specifying narrow hypotheses in order to support or refute the

Micro and Small Enterprise Development in Bolivia, Seeking Opportunities
By Cintia S. Vega
25
theory (Creswell, 2003). The current study is concerned with facts, thus it will search for
visible objects and the analysis does not include normative or moral questions. This
position is aligned to the empirical-analytical epistemological position, which is based on
scientifically measurable facts (Scheyvens & Storey, 2003). Since the aim of the study is to
understand MSEs growth and to identify the constrains that MSEs face, empirical objects
such as use of physical capital and access to financial markets will be studied, which fits
empiricism.
3.3. Choice of Research Methods
The Methods that are to be used during the different stages of the study depend upon the
purpose and content of the research (Kvale, 1996). So in line with the research purpose,
strategy and design, three research methods have been used: Field Observations, Document
Review and the Entrepreneurship Survey (ES). The main research method has been the
quantitative analysis of the ES, which has been complemented by field observations and
documentation reviews.
Field Observations
Field observations took place in Bolivia from September 2009 until January 2010.
Observations were limited to commercial and service MSEs located in La Paz and El Alto
and there was no systematized procedure to carry out this task. The main purpose was to
pre-assess the issues related to Bolivian MSEs in order to choose the focus of the study.
During observations, the author was in the customer “role”, so the gathered information
was basically an outsider´s perception that served to frame the study´s problem and
purpose. Field observations were not consciously used during data analysis phase, though it
must be recognized that on a subconscious level, field observations might have influenced
the interpretation of the research´s findings.
Documentation review
Documentation review is essential to understand the context of the research problem and to
identify the existing theories about MSEs´ growth in Bolivia. Considering the study is
deductive and hypothesis needed to be built, it was crucial to be fully aware of the existing

Micro and Small Enterprise Development in Bolivia, Seeking Opportunities
By Cintia S. Vega
26
studies as to avoid duplicating a previous research. Additionally, documentation review is
useful to ensure that the findings will fit into the current preoccupations regarding the
chosen topic and will hopefully be useful in policy making.
Among documentation review, several studies developed about MSEs in Bolivia were
consulted; most of them focused on informality issues and fewer had other areas of focus,
such as gender issues. However, none of them held a multifocal approach. Local
regulations regarding MSEs were also reviewed, such as the “Resolución Ministerial
325/01”, which establishes MSEs´ characteristics, as well as policies designed to promote
MSEs´ development, such as the “Integral Policy Framework for MSE´s development”,
which is a joint work of different public, private and international cooperation institutions.
Enterprise Survey (ES)
Information regarding enterprises in Bolivia was collected during 2006, when 613 firms
based in La Paz, Cochabamba and Santa Cruz (the three main cities in Bolivia) from the
manufacture, service and commercial sectors were surveyed by an independent agency on
request of the World Bank. The survey includes 356 variables, both qualitative and
quantitative, which guarantees a broad coverage of the different aspects related to MSEs´
growth. A brief overview of the main characteristics of the ES´s methodology is presented,
which is based on information provided by the World Bank (2006, 2007, 2009):
Sampling procedure: In order to determine which enterprises would be surveyed, the
stratified random sample technique was used. This method divides population into levels
of stratification; in the considered survey these were industry, establishment size, and
region. The advantage of this particular method is that it ensures all sub-groups are equally
represented in the sample (Nichols, 1991).
Sample Size: Even though there is no clear consensus about the amount of enterprises in
Bolivia, it is estimated that approximately 117.857 enterprises exist (INE, 1992). In order to
determine the size that the simple should have to be representative of the target population,
four factors need to be considered: the population size, the estimated response distribution,

Micro and Small Enterprise Development in Bolivia, Seeking Opportunities
By Cintia S. Vega
27
the desired confidence level and the accepted margin of error. Considering that: the
response distribution would be 50%, meaning that for each question there are the same
possibilities for a yes or a no, the confidence level is 95% and the risk of error is 5%,
meaning that there is a 95% certainty that the statistical results are true, and that the target
population is 117.857, the recommended sample size is 383 enterprises3. Thus, considering
the survey included 613 enterprises, the results derived from it can be considered as
representative of the target population and can be generalized to it.
Questionnaire Implementation: The surveys were implemented following a two stage
procedure. First a screener questionnaire was done over the phone to determine eligibility
and to arrange appointments; secondly a face-to-face interview was conducted with the
person in charge of the establishment.
Questionnaire Quality Assurance: In order to ensure correct application of the
questionnaire, an explanation of each question was developed and strict instructions were
provided as to how the interviewer should proceed. Additionally, the questionnaire was
screened to find out if questions were properly worded and understood and the necessary
adjustments were introduced. Besides, all interviewers were properly trained and a complex
control system based on four different levels of quality checks was utilized.
Discussion on choice of research methods
The decision to primarily rely on secondary data, which is the ES, was taken after carefully
evaluating the pros and cons of doing so. Even though it must be acknowledged that when
using secondary data sources no control over the data collection process is held, benefits
from using an existing data based include the possibility to access a comprehensive and
representative sample, high-quality data which went through many control phases and
mechanisms and cost and time efficiency, among others (Bryman, 2004).
In order to overcome potential bias in information, triangulation methods have been
applied. The weaknesses of one method can be compensated by compiling the same
3 http://www.raosoft.com/samplesize.html
Micro and Small Enterprise Development in Bolivia, Seeking Opportunities
By Cintia S. Vega
28
information with another method or series of methods, so triangulation of qualitative and
quantitative methods is key to obtain reliability and neutralize biases (Mikkelsen, 2005).
Thus, multiple sources of evidence are considered across the different sections of the study,
in a back and forward process.
3.4. Data analysis technique
How the data is analyzed varies according to the study purpose and the character of the
data. Since the study aims at understanding patterns of correlation between different
variables, statistical analysis will be the core of the research. Thus, in this section some
statistical concepts that will be applied throughout the analysis are presented.
Data Delimitation: The ES includes micro, small, medium and big enterprises but for the
purposes of the present study, only Micro and Small Enterprises with a maximum of twenty
full time employees will be taken into account. Additionally, respondents who provided
information that did not seem truthful to the interviewers were also removed. Finally,
MSEs who claimed to be part of a larger establishment were extracted from the database
because their characteristics might have been different than those of independent MSEs.
Variables: In order to test the hypotheses, the concepts used have to be turned into
measurable variables (Bryman 2008). Therefore, concepts have been operationalized in
different variables, which are presented in Annex 1.
Dependent and Independent Variables: Independent variables, also called predictors, are
those that (probably) influence or affect the outcomes of other variables, while dependent
variables are those that are considered as outcomes or results of the independent variables.
Whether a variable is dependent or independent depends on the specific relation that is
being studied. When results from the statistical analysis are presented, the status of each
variable will be clearly indicated.
Types of variables: Variables can be categorical and numerical. Numerical or
quantitative variables have a ratio scale where distances between values are identical across
the range. Categorical variables can be ordinal or nominal, depending on whether their
Micro and Small Enterprise Development in Bolivia, Seeking Opportunities
By Cintia S. Vega
29
categories can be ranked or not, respectively. Different types of variables determine the
statistical tools that can be used for their analysis. In order to find details about the types of
variables used, see Annex 1.
Types of analysis: Several methods will be used to conduct the analysis, such as
descriptive statistics for univariate analysis and comparison of means, crosstabs and
ordinary least squares regression regressions for bivariate analysis. For each of these
methods, different measures of association and tests of significance will be applied to
ensure data quality. The most relevant results will be presented in the Data Analysis and
Findings section, while the rest of the results will be presented in Annexes.
Index: In order to analyze the “enabling environment” as an exogenous factor affecting
MSEs, an Index will be built. Indexes are useful when there are several categorical
variables measuring the same thing and the researcher needs to perform a regression (which
requires variables on interval scale). Thus, the different categorical variables can be
combined to create a new interval variable as long as they fulfil certain requirements, such
as being coded the same way, in the same direction and with missing values defined.
Statistical significance: This concept allows the researcher to estimate how confident
one can be that the observed relation between two or more variables is true and is not due to
chance. In order to assess the statistical significance of a relation, tests of significance will
be used. The P-value is the value that indicates the level of significance and it is a common
convention among social researchers to consider a relation significant if the P-value is of
less than 5%. This means that there is less than 5 percent risk that the relationship is due to
chance.
3.5. Reliability and validity
Reliability and validity are the criteria employed for assessing the quality of social research
(Bryman, 2004). Reliability refers to how data is measured and to the degree of consistency
and stability of data. Validity, on the other side, is concerned with what is measured, and
assesses the level of correlation between what is intended to be investigated and what is
actually investigated. Put in other words, validity evaluates the level of correspondence

Micro and Small Enterprise Development in Bolivia, Seeking Opportunities
By Cintia S. Vega
30
between the theoretical definition of a certain concept and the translation of it into
something empirically measurable.
The study will consider correlations between variables very carefully in order to ensure
reliability. It can be said that low correlation between variables means that the measure is
unstable and the results must be carefully interpreted (Bryman, 2004). Thus, the study seeks
to find high levels of correlation between variables in order to ensure that its findings are
reliable.
Cross-sectional research is usually characterized by weak internal validity and strong
external validity. Internal validity measures how confident one can be that certain
independent variables are responsible for effects in the dependent variables. Since cross-
sectional survey only produces associations rather than findings from which causal
inferences can be made, establishing causal relations is difficult. However, since the study
uses other qualitative information such as literature review and theories, internal validity
can be strengthened.
On the other side, external validity is concerned with whether the results of the study could
be generalized, which is generally the case when random methods of sampling are used.
The current study uses stratified random sampling and its external validity is thus strong,
meaning that the results obtained from the sample can be generalized to the entire target
population. Finally, the study is also replicable, since all the procedures used across the
study will be clearly shown.
3.6. Limitations
Many different limitations were found when carrying out the quantitative part of the study
and actions were taken to mitigate these weaknesses, which are presented below:
Table 4. Limitations: Risks and Mitigating factors and actions Concept Risk Mitigating factors and actions
Data source The analysis is mostly based on
secondary data and the author had no
control over the database survey
process.
There was a very strict methodology design for
the survey and quality controls were carried out
at different stages of the process.
Strong attention was paid to the comparison of
findings from data analysis with previous

Micro and Small Enterprise Development in Bolivia, Seeking Opportunities
By Cintia S. Vega
31
studies in order to find important discrepancies
or incoherencies, which will be presented in the
Discussion Section. As a general rule, in case of
doubt further research is advised.
Operationalizati
on4 of variables
In spite of the fact that the used
dataset gives a complete view of the
MSEs scenario, there were
limitations regarding the use of
variables that did not entirely adjust
to the defined concepts.
When there were cases in which variables did
not entirely represent the concept, clear notes
were made about this. Additionally, when it was
suitable, different variables were measured to
fully represent a concept.
Missing data No responses were present in almost
all the answers and might have
affected overall results.
This is a common feature of all surveys and
those cases with responses such as missing data,
not known or not applicable were left outside
the analysis.
In cases were important effects were observed,
this was clearly pointed out and results were
analyzed considering this restriction.
Causality When performing bi-variate analysis,
it is possible to say something about
the significance of the correlation and
the direction. However, nothing can
be said about causality (which
variable causes the variation,
independent vs. dependent variable).
In order to overcome causality limitations,
theories explaining the proposed causal relations
and common sense have been equally used.
Timing Some of the variables are measured
for the last fiscal year while others
are for the last 3 fiscal years. This is
an issue when the independent
variable is for a single year and the
dependent refers to the 3 previous
years.
In such cases, it was assumed that the values
assigned to the last fiscal year have been
constant over the last three fiscal years, and that
both types of variables can be related. However,
in such cases, a deep critical assessment was
applied to the causality between variables and
this was openly commented.
Subjective
Perceptions
An issue that might be perceived as a
major problem by one respondent
may be a smaller problem that it is
for another respondent who rated it as
a minor problem.
Whenever possible, questions that were
measured in a quantitative way were chosen
over questions measured based on perceptions.
However, considering data availability,
questions based on perceptions were sometimes
used. In order to assess their objective weight,
comparison with other quantitative variables
was done and later on, results were assessed
framed in existing literature and studies.
4 Operationalization is the process of defining ambiguous or fuzzy concepts so as to turn it measurable in
form of variables.

Micro and Small Enterprise Development in Bolivia, Seeking Opportunities
By Cintia S. Vega
32
3.7. Ethical considerations
Since the study is exclusively based on secondary data, left aside the random observations
that took place in the field for “context” purposes, there was no direct relation with the
objects being studied. However, ethical considerations go beyond the obvious aspects a
researcher should deal with, such as informed consent. Therefore the effects and side-
effects of the research are assessed from a 3 angled ethical dimension considering the
research´s objects, other researchers and society in general.
As it was stated at the beginning of the study, the research seeks to contribute to the
current discussion about MSEs´ dynamics and how to improve their performance. Hence,
both Bolivian MSEs and Society can benefit from an increased knowledge of the situation
and no negative effects can be foreseen at this point. Additionally, the study was developed
using the highest ethical standards and all existing research that was consulted has been
adequately acknowledged.
A distinct feature of mixed methods research is the use of diverse types of data at different
stages of the study. The present study has substantial amount of qualitative data prior and
after the quantitative analysis is done, in order to frame the research questions and
hypothesis and to compare and discus the results of the study with existing findings in the
literature, respectively. Hence, it is important to be clear regarding what was found by the
present study, what other studies have said before, and what the authors´ opinions are.
Special consideration was given to the presentation of data and findings, clearly separating
the analysis and presentation of empirical findings, narration of previous research and
studies, and personal judgments.
Finally, it is important to recognize that statistical analysis can be very easily managed to
orient results in a convenient way. Thus, data was treated in a very cautious way when
recoding variables or re-grouping them. Besides, all results are presented in annexes,
including non-significant correlations, thus there is a full disclosure of the procedures that
were carried out during the study.
Micro and Small Enterprise Development in Bolivia, Seeking Opportunities
By Cintia S. Vega
33
4. DATA ANALYSIS AND FINDINGS
This section includes the analysis that was conducted with the quantitative empirical data
and presents its main findings. The section is divided into the two research questions
proposed by the study, one addressing the importance of MSEs´ growth and development
and the other one related to the obstacles MSEs face to achieve growth in Bolivia. Due to
space constrains, only the most relevant results will be included here, yet a detailed
presentation of the analysis can be found in Annexes.
4.1. First Question: Why does MSEs´ growth matter?
According to literature review, MSEs in Bolivia account for roughly 29% of the PBI and
85% of the employment (Delgadillo, 2001), being the major source of employment in the
country. Hence, many authors agree their development is important as a tool to reduce
unemployment and poverty rates in a country where 52% of the urban population lives
under poverty lines (Jemio & Choque, 2006).
Thus, it is necessary to analyze if growth in MSEs is actually correlated to an increase in
the demand for labour, because as enterprises grow they might choose to invest more in
physical capital and technology, thus it may be the case that MSEs´ growth would not have
such a strong impact on employment.
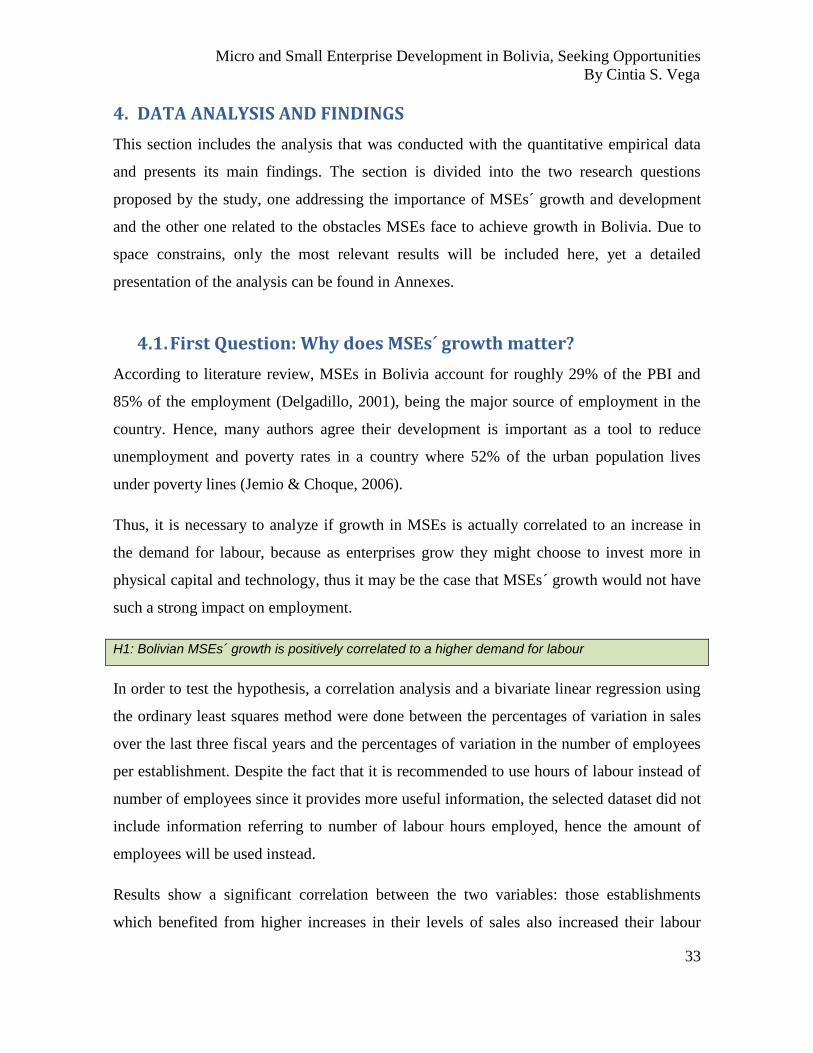
H1: Bolivian MSEs´ growth is positively correlated to a higher demand for labour
In order to test the hypothesis, a correlation analysis and a bivariate linear regression using
the ordinary least squares method were done between the percentages of variation in sales
over the last three fiscal years and the percentages of variation in the number of employees
per establishment. Despite the fact that it is recommended to use hours of labour instead of
number of employees since it provides more useful information, the selected dataset did not
include information referring to number of labour hours employed, hence the amount of
employees will be used instead.
Results show a significant correlation between the two variables: those establishments
which benefited from higher increases in their levels of sales also increased their labour

Micro and Small Enterprise Development in Bolivia, Seeking Opportunities
By Cintia S. Vega
34
force or number of employees in a bigger percentage than those who had lower levels of
increase in their annual sales (see Figure 6).
Figure 6. Correlation between Variation in Sales and Variation in Employees
As it can be observed, the R2 value is 12,6%, which means that 12% of the changes in the
percentage of increase or decrease in the amount of employees can be attributed to changes
in the percentage of increase or decrease in the amount of sales5. This means that 88% of
the variations in the number of employees cannot be explained by variations in sales, and
thus other variables are influencing the dependent variable. However, as far as our purpose
goes, it is enough to confirm that MSEs´ growth is correlated to employment levels in a
significant and positive way.
The equation representing the relation is presented in Figure 7, and put in other words, if
sales had grown 100% over the last 3 fiscal years, the increase in the percentage of total
amount of employees would have been 14,99 (constant) plus 12,1. In total, the amount of
employees would have increased by 17%:
5 Correlation is significant with a P-value of 0,000 (details in Annex 2). Even though bivariate correlations do
not say anything about causality, it is logical to assume that the amount of employees an enterprise will hire
will depend, among other things, on their sales.

Micro and Small Enterprise Development in Bolivia, Seeking Opportunities
By Cintia S. Vega
35
Figure 7. Formula of correlation between Sales and Employment:
A second part of the analysis involved testing whether variations in sales are also correlated
to variations in investment on physical capital. The same method was applied, but
unfortunately no significant correlations were found between the two variables (results
presented in Annex 2).
Some thoughts about MSEs´ Growth
Empirical findings show the hypothesis is true and there is indeed a positive correlation
between increases in sales and number of employees. Additionally, analysis also shows a
lack of correlation between increases in sales and investment in physical capital. Therefore,
it can be concluded that as MSEs grow and need more resources, they will favour
expenditures in human capital instead of investments in physical capital. This feature
enables to characterize MSEs in Bolivia as labour intensive.
4.2. Second Question: What determines or affects MSEs´ growth in
Bolivia?
It was previously shown that MSEs´ growth affects employment, thus it is relevant to
understand the dynamics of factors affecting MSEs´ growth. In the present sub-section, an
assessment will be conducted to understand how the different variables are related to
MSEs´ performance. The analysis will be split into two sub-questions, one regarding the
endogenous factors and a second one related to the exogenous ones.
4.2.1. How do endogenous factors of productivity affect MSEs´
performance in Bolivia?
Percentage of Increase or
Decrease in Total Ammount of
Employees over the Last 3 FY
a constant value
of 14,997
0,121 per
Percentage of Increase or Decrease in
Total Ammount of Sales over the
Last 3 FY

Micro and Small Enterprise Development in Bolivia, Seeking Opportunities
By Cintia S. Vega
36
Financial Capital
Bolivian MSEs seem to be well integrated into the financial system, according to the survey
most of the establishments have a savings or checking account (87%) and almost half of
them have a line of credit or loan from a financial institution at the moment (49%).
Moreover, when enterprises which did not apply for a credit during the previous fiscal year
were asked about the reason for this, the main answer was that they did not need a loan
(more than 55%), while the rest of the answers were distributed among high interest rates,
difficult procedures and tight collateral requirements, among others. It is worth mentioning
that there was significant correlation between perceptions about “access to finance as an
obstacle to the current operations of the establishment” and the given reasons for not
applying for a loan or credit (Results shown in Annex 3), pointing out that those who saw
access to finance as an obstacle did not applied for external funding, while those who did
not perceive this as a constrain were the ones who had applied for a loan during the last
fiscal year. Considering the current scenario, it is interesting to analyze the sources of
external financing for MSEs.
H2: Bolivian MSEs use alternative sources of external financing instead of commercial banks
Surprisingly, results based on descriptive statistics show that the vast majority of the
companies that had a line of credit or loan had obtained it from a commercial bank, while
less than 1% were funded by State or Governmental Banks and 11% was financed by non
commercial financial institutions (see Figure 8). Therefore, the proposed hypothesis is
false.
It would have been interesting to develop further research regarding the reasons for having
such a high percentage of funding from commercial banks and not the rest of the options,
especially considering that incredibly extremely high collaterals had been required by
banks in order to provide a credit or loan (mean value of 182%6 in relation to the loan value
or line of credit). However, limitations in the database prevented further analysis regarding
these issues so this will be addressed according to literature review.
6 Median and Mode were both 200% of the total value of loan or credit (See Annex 3).

Micro and Small Enterprise Development in Bolivia, Seeking Opportunities
By Cintia S. Vega
37
To sum up, it must be kept in mind that even though access to finance was mainly
identified as a “moderate” constrain by the respondents, 1 out of 2 MSEs are not accessing
any funding from a financial institution.
Figure 8. Source of external Funding
Physical Capital
In order to assess the levels of Physical Capital of MSEs, respondents were asked if they
had purchased any fixed assets during the last fiscal year, to which half replied
affirmatively. However, when they were asked to tell the amount they had spent on
acquisitions of machinery, equipment or vehicles during that period more than 60% of the
respondents claimed that there were no acquisitions7 and 15% of the establishments had
invested less than 5% of their total annual sales. Figures are even more drastic if purchases
of land and buildings are analyzed: 95% of the respondents stated they had not invested
anything on those assets.
7 Please note that missing values explain the apparent contradiction among the percentages in investment.
50% invested in fixed asset, 60% did not invest in Machinery, Equipment or Vehicles and 95% did not invest
in land or Building (a potential maximum of 45% could have invested in fixed assets during that period).
Detailed information in Annex 4.

Micro and Small Enterprise Development in Bolivia, Seeking Opportunities
By Cintia S. Vega
38
Nevertheless, a second option must be considered: leasing or renting physical capital. Since
MSEs operate at a low scale and have small demand levels (The World Bank, 2009),
buying machines and equipment might be too costly and renting may be more suitable.
Interestingly, almost half of the respondents spent money on renting machinery, land and
equipment. Considering the current scenario, the following hypothesis will be tested:
H3: Higher investments in physical capital are positively correlated to higher labour productivity
Several regression analyses were made and although no correlations were found for
purchases of fixed assets and higher labour productivity, a significant relation was
confirmed when considering rental of physical capital, with results showing that those
enterprises that had larger expenditures on rental of land/buildings, equipment and
machinery benefited from higher levels of revenue per employee (see Figure 8). Put in
other words, renting physical capital explains 5% of improvements in workers
performance. This percentage is weak and shows that there are other variables influencing
revenues per employee, however, it must be acknowledged that access to physical capital is
one of them (more information in Annex 4). Thus, the hypothesis is considered as true
(though the correlation is very weak).
Figure 9. Correlation between expenditures on Physical Capital and Revenue per
Employee

Micro and Small Enterprise Development in Bolivia, Seeking Opportunities
By Cintia S. Vega
39
Human Capital
Labour costs represented an average of 21% of the total annual sales according to the
respondents8. Hence, access to human capital is perhaps the most critical aspect to be
considered. More than half of the establishments identified inadequately educated labour
force as an obstacle for their current operations, out of which a bit less than half claimed it
was an important or a very important obstacle. Interestingly, a correlation was found
between the level of obstacle of inadequately educated labour that was perceived by the
respondents and the formal training programs provided by the establishments. Put in other
words, those who did not perceive lack of education of labour force as an obstacle offered
less training opportunities, while those who saw this as a critical factor developed formal
training programs during the last fiscal year9. Figure 10 presents the findings in a clear way.
Figure 10. Relation between obstacle of inadequately educated labour force and formal
training programs provided
Based on what was previously discussed, it is interesting to find out how educational levels
of labour force are correlated to an increased labour productivity. Thus, the following
hypothesis will be tested:
8 See Annex 5
9 P-value less than 5% and Cramer´s V 0,23. More information in Annex 5.

Micro and Small Enterprise Development in Bolivia, Seeking Opportunities
By Cintia S. Vega
40
H4a: Education levels of workforce are positively correlated to labour productivity
Since the levels of education is an ordinal variable and labour productivity is an interval
variable, comparison of means was done using the appropriate tools. Results showed no
significant correlations and are presented in Annex 5. Hence, the hypothesis is not true. It
would be necessary to consider informal education levels and previous work experience as
well. Since these variables were not available, a second hypothesis related to the manager´s
experience will be tested:
H4b: Manager´s experience is positively correlated to labour productivity
Analysis have shown that top managers tend to have several years of working experience in
their sector10
, however, no correlations were found between experience of managers and
MSEs´ performance and thus the hypothesis is also considered false (See Annex 5).
Technology and Quality
It is common to read that MSEs have a very low use of techonologies and that the quality of
its products is not aligned to any standards, which affects both their productivity and access
to markets. However, it was still interesting to test if this was also true for Bolivian MSEs:
H5: Most Bolivian MSEs have very low levels of investment in R&D, technology and quality
When assessing technology and quality levels, there are two main areas that need to be
looked at, one is how much is the company investing in technology and the second one is
whether the establishment has any international-recognized quality certification. Regarding
the first topic, approximately one third of the establishments confirmed to have made
investements in Research and Development (R&D) during the previous year, but only 6%
of the respondants invested more than 4% of the annual sales on Information Technology.
Besides, almost none of the interveweed establishments is using technology licensed form a
foreign-owned company, which would be an indicator of broad access to high-tech. The
second topic shows a similar picture: Only 10% of the establishments claimed to have a
10 Mean experience is 19 years (standard deviation is 11 years), Mode is 20 years and Median is 18 years (see
Annex 5)

Micro and Small Enterprise Development in Bolivia, Seeking Opportunities
By Cintia S. Vega
41
internationally recognized quality certification, which is nowadays a basic requirement for
any MSEs wishing to improve its access to markets, be it by exporting its products or by
increasing their participation in supply chains (See figure 11).
As it could be expected, correlations of significance were found between establishments
who use technology licensed from a foreign-owned company and those who have an
internationally recognised quality certification. Likewise, used of licensed technology was
also associated to investment in R&D (Annex 6) . To sum up, even though there is a very
small amout of MSEs that present a high-tech and quality profile, the great majority of
MSEs are still making little use of top technologies and are characterized by a lack of
adhesion to quality standards. Thus, the hypothesis is deemed true.
Figure 11. Quality Certification, R&D and foreign technologies
10,38%
89,62%
93,06%
6,94%
33,53%
66,47%
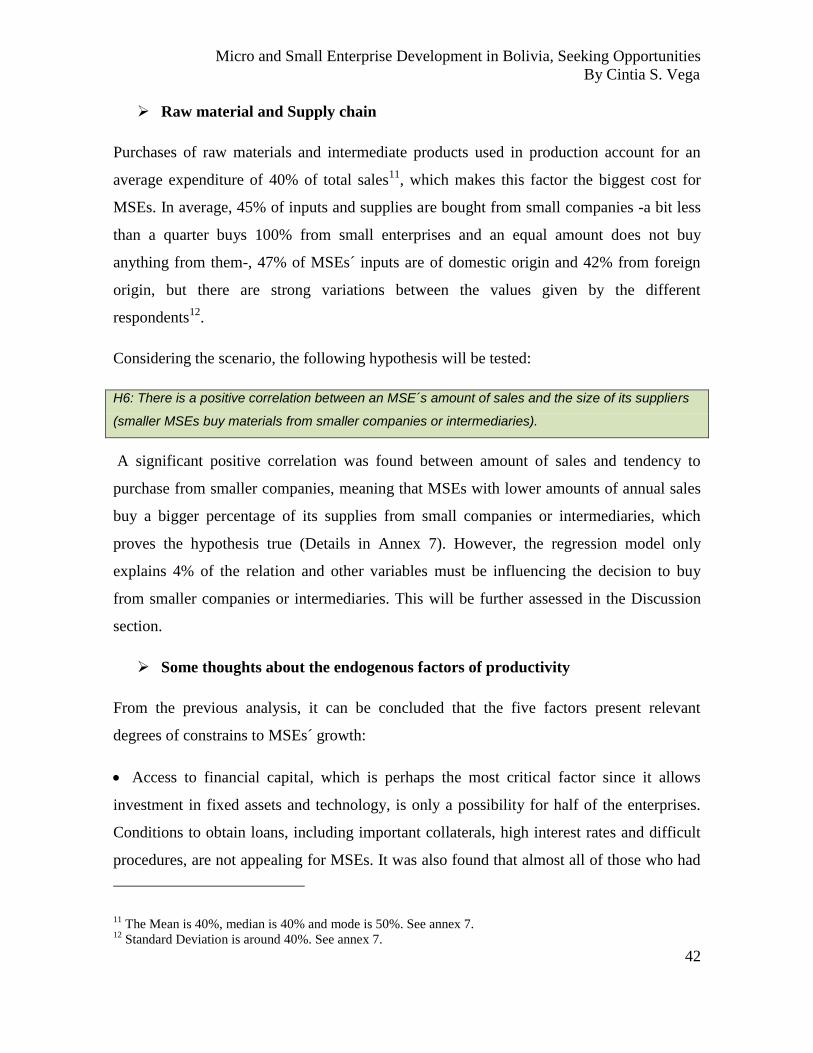
Micro and Small Enterprise Development in Bolivia, Seeking Opportunities
By Cintia S. Vega
42
Raw material and Supply chain
Purchases of raw materials and intermediate products used in production account for an
average expenditure of 40% of total sales11
, which makes this factor the biggest cost for
MSEs. In average, 45% of inputs and supplies are bought from small companies -a bit less
than a quarter buys 100% from small enterprises and an equal amount does not buy
anything from them-, 47% of MSEs´ inputs are of domestic origin and 42% from foreign
origin, but there are strong variations between the values given by the different
respondents12
.
Considering the scenario, the following hypothesis will be tested:
H6: There is a positive correlation between an MSE´s amount of sales and the size of its suppliers
(smaller MSEs buy materials from smaller companies or intermediaries).
A significant positive correlation was found between amount of sales and tendency to
purchase from smaller companies, meaning that MSEs with lower amounts of annual sales
buy a bigger percentage of its supplies from small companies or intermediaries, which
proves the hypothesis true (Details in Annex 7). However, the regression model only
explains 4% of the relation and other variables must be influencing the decision to buy
from smaller companies or intermediaries. This will be further assessed in the Discussion
section.
Some thoughts about the endogenous factors of productivity
From the previous analysis, it can be concluded that the five factors present relevant
degrees of constrains to MSEs´ growth:
Access to financial capital, which is perhaps the most critical factor since it allows
investment in fixed assets and technology, is only a possibility for half of the enterprises.
Conditions to obtain loans, including important collaterals, high interest rates and difficult
procedures, are not appealing for MSEs. It was also found that almost all of those who had
11 The Mean is 40%, median is 40% and mode is 50%. See annex 7.
12 Standard Deviation is around 40%. See annex 7.

Micro and Small Enterprise Development in Bolivia, Seeking Opportunities
By Cintia S. Vega
43
credits or loans had obtained them from commercial banks, which indicates that alternative
sources of financing have a low impact on MSEs in Bolivia.
Considering Bolivian MSEs are labour intensive, it is relevant to notice that more than
half of the establishments identified that inadequately educated labour force was an
obstacle for their current operations. A positive finding was that there was a significant
correlation between those who perceived that workers´ education needed to be improved
with the formal training programs that were offered during the past fiscal year. In spite of
this, results showed no correlation between labour productivity and formal education of
workers or experience of manager.
Surveyed MSEs were characterized by a low level of expenditure on fixed assets,
technology and quality. Investments in physical capital were very poor over the last fiscal
year, with more than half of the population not having invested anything at all on fixed
assets. However, those MSEs which had larger expenditures on rental of land/buildings,
equipment and machinery benefited from higher levels of revenues per employee. Though
the correlation is rather weak, it shows the benefits associated with investment in physical
capital.
Almost none of the surveyed MSEs has a recognized quality certification or uses foreign
licensed technology. Even further, only one third of the respondents had invested in
Research and Development. On the other side, it was observed that there were a small
percentage of MSEs which presented a high tech-high quality profile. Nonetheless, the vast
majority of MSEs have low levels of investment in research & development, technology
and quality.
Lastly, interesting patterns were observed between the size of the enterprise and its
propensity to buy inputs and raw material from small companies. Assuming that small
suppliers are intermediates on the supply chain, it could be deducted that smaller MSEs
need to rely upon intermediaries to get their supplies while bigger MSEs can more easily
obtain their inputs from direct suppliers.

Micro and Small Enterprise Development in Bolivia, Seeking Opportunities
By Cintia S. Vega
44
4.2.2. Is there any correlation between an enabling environment
and a better performance of MSEs?
So far we have analyzed the endogenous factors affecting MSEs´ performance, however in
order to see the entire picture it is necessary to consider the external and structural
conditions affecting productivity, in other words, those exogenous factors over which
MSEs have no control but which still affect impact on their daily operations. Thus, the
following hypothesis will be tested:
H7: There is a positive correlation between MSEs exposed to an enabling environment and their
performance
During the survey, respondents were asked to identify the main obstacles to their current
operations. More than half of the respondents found practices of informal competitors and
political instability as the main constrain (see Figure 12), while other commonly identified
obstacles were access to financing, macroeconomic instability and corruption.
Figure 12. Exogenous Factors affecting MSEs Operations
In order to test the hypothesis, an index was created to analyze how the enabling
environment as a whole affects MSEs´ performance and potential for growth. Fifteen
variables measured in the exact same way, with values ranging from 0 to 4 according to the

Micro and Small Enterprise Development in Bolivia, Seeking Opportunities
By Cintia S. Vega
45
obstacle level, were added up. Thus, the best enabling environment would have a value of
60 and the worst business conductive environment would have a value of 0. If the
respondents did not provide an answer, the interviewers would assign this variable a -9
(missing data) or -7 (does not apply). If the respondent did not rank all of the fifteen
variables, that case was left outside the index. As a result of this limitation, only 22 cases
were considered in the regression and the index cannot be generalized to MSEs in Bolivia.
A strong correlation was found between establishments who perceived the external and
structural conditions as an obstacle for their operations and the variation of the levels of
sales that the MSE had experienced during the last three years. Unsurprisingly,
establishments exposed to a more enabling environment were those who experienced
higher levels of increase in their sales, while those exposed to a less enabling environment
had a worst performance (see Figure 13)13
. Thus, the hypothesis is true but it must be
noticed that results cannot be generalized to the rest of the population.
Figure 13. Correlation between obstacles in the environment and MSEs´ growth over the
last three years
13 Detailed results of the correlation are presented in Annex 8
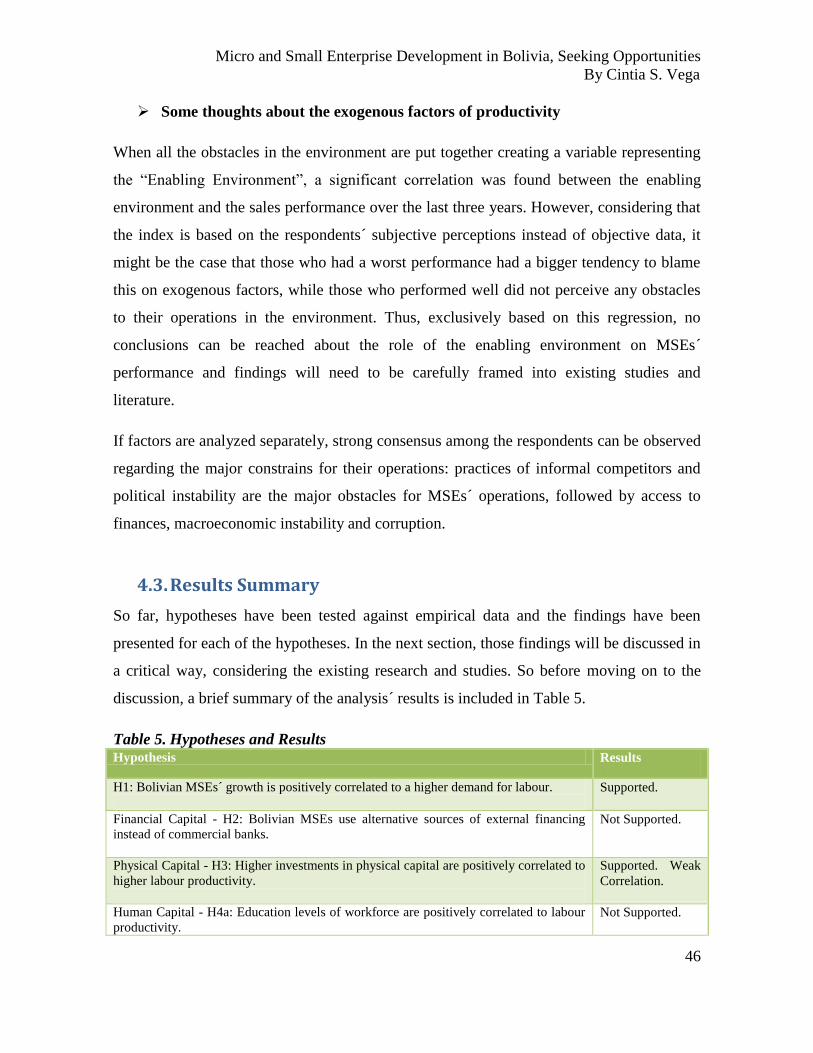
Micro and Small Enterprise Development in Bolivia, Seeking Opportunities
By Cintia S. Vega
46
Some thoughts about the exogenous factors of productivity
When all the obstacles in the environment are put together creating a variable representing
the “Enabling Environment”, a significant correlation was found between the enabling
environment and the sales performance over the last three years. However, considering that
the index is based on the respondents´ subjective perceptions instead of objective data, it
might be the case that those who had a worst performance had a bigger tendency to blame
this on exogenous factors, while those who performed well did not perceive any obstacles
to their operations in the environment. Thus, exclusively based on this regression, no
conclusions can be reached about the role of the enabling environment on MSEs´
performance and findings will need to be carefully framed into existing studies and
literature.
If factors are analyzed separately, strong consensus among the respondents can be observed
regarding the major constrains for their operations: practices of informal competitors and
political instability are the major obstacles for MSEs´ operations, followed by access to
finances, macroeconomic instability and corruption.
4.3. Results Summary
So far, hypotheses have been tested against empirical data and the findings have been
presented for each of the hypotheses. In the next section, those findings will be discussed in
a critical way, considering the existing research and studies. So before moving on to the
discussion, a brief summary of the analysis´ results is included in Table 5.
Table 5. Hypotheses and Results Hypothesis Results
H1: Bolivian MSEs´ growth is positively correlated to a higher demand for labour.
Supported.
Financial Capital - H2: Bolivian MSEs use alternative sources of external financing
instead of commercial banks.
Not Supported.
Physical Capital - H3: Higher investments in physical capital are positively correlated to
higher labour productivity.
Supported. Weak
Correlation.
Human Capital - H4a: Education levels of workforce are positively correlated to labour
productivity.
Not Supported.

Micro and Small Enterprise Development in Bolivia, Seeking Opportunities
By Cintia S. Vega
47
Human Capital – H4b: Manager´s experience is positively correlated to labour
productivity.
Not Supported.
Technology and Quality - H5: Most Bolivian MSEs have low levels of investment in
research & development, technology and quality.
Supported.
Raw Materials and Supply Chain - H6: There is a positive correlation between an
MSE´s amount of sales and the size of its suppliers (smaller MSEs buy materials from
small companies or intermediaries).
Supported. Weak
Correlation.
H7: There is a positive correlation between MSEs exposed to an enabling environment
and their performance.
Limitedly
supported.
Micro and Small Enterprise Development in Bolivia, Seeking Opportunities
By Cintia S. Vega
48
5. DISCUSSION
In this section, the findings obtained from the data analysis will be critically discussed
under the light of existing literature and previous studies. First it will discuss the
importance of MSEs in the Bolivian context and then it will address the factors affecting
MSEs´ growth.
Why does MSEs´ growth matter?
When assessing the existing literature on MSEs´ development, major controversies were
found both in the international and national arena regarding the role of MSEs for economic
growth and poverty reduction. While some claimed that MSEs brought little benefits for the
overall development of a country and suggested that efforts should be placed in SMEs
instead (Zevallos & Velazco, 2003; Nisttahusz, 2002), others sustained that MSEs were
important tools for poverty reduction and equitable development (Jeppesen, 2005; Borda &
Ramirez, 2006; Mead & Liedholm, 1998).
Framed on those critics, this study has analyzed empirical data collected from two hundred
and sixty one Micro and Small Enterprises in Bolivia in order to find out if there was
indeed any correlation between the growth of MSEs and the amounts of labour they used.
In order to do this, a linear bivariate regression was done and results showed that when an
MSE had experienced growth in the last three fiscal years (expressed as percentage of
increase of annual sales over the last three years), this had been correlated by an increase in
the total number of employees over the same period. Even though this relation was
significant, its strength was only moderate. Therefore, other variables are related to
variations in employment besides the amount of sales, which is logical considering the
effects that factors such as labour legislation, production capacity and many other factors
have regarding the decision to hire or fire any employee.
Considering that the sample is representative of the entire population, results can be
extended to the national MSE´s sector. Therefore, it is possible to claim that MSEs´ growth
has a direct impact on employment levels. Since MSEs are one of the sectors were the poor
are employed (Jemio & Choque, 2006), it could also be suggested that MSEs are indeed a

Micro and Small Enterprise Development in Bolivia, Seeking Opportunities
By Cintia S. Vega
49
tool for pro-poor growth, following ILOs reflections. However, based on the study
findings, nothing can be said about the quality of labour provided by MSEs. Jemio &
Choque (2006) suggest that most workers employed in MSEs are actually not remunerated.
Consequently, it would be hasty to make conclusions about the role of MSEs in equitable
pro-poor growth since the study findings are limited to having proved the effects of MSEs´
growth in employment levels.
Nonetheless, considering that MSEs account for most of the enterprises in Bolivia (INE,
1992) and they provide most of the employment (Delgadillo, 2001), it is particularly
important to understand the dynamics of MSEs and the factors that are affecting its growth
and performance. Consequently, a discussion on the determinants of MSEs´ growth in
Bolivia, according to the study findings and the existing literature, will follow.
What determines or affects MSEs´ growth in Bolivia?
Taking into account the major relevance of Bolivian MSEs as sources of employment and
income, the different factors affecting their performance were analyzed. In order to carry
out this task, an analytical framework was built on the bases of ILO´s model of systemic
competitiveness (2007). Some of the variables included in the model were regrouped in
order to facilitate the data analysis and to align it with the available information in the
database. According to the model, two sets of variables affect MSEs´ productivity and
competitiveness, endogenous and exogenous factors. The classification of a factor as
internal or external depended on whether the establishment has or could have some degree
of control over them. Thus, the analysis was conducted assessing the two types of factors.
In order to contextualize the findings and answer the main research question, discussions
will follow regarding the analysis´ findings for each type of factor.
How do endogenous factors of productivity affect MSEs´ performance in
Bolivia?
Based on the findings, it can be stated that Bolivian MSEs are characterized by a relatively
low use of external financing, low levels of expenditure on fixed assets, technology and

Micro and Small Enterprise Development in Bolivia, Seeking Opportunities
By Cintia S. Vega
50
quality, and an intensive use of unqualified labour as their main resource to achieve results,
all of which explains their low levels of productivity.
Access to financial capital, which is perhaps the most critical factor since it allows
investment in fixed assets and technology, is only a possibility for half of the enterprises.
Although the surveyed establishments which had not applied for a credit during the
previous year stated that they did not need one, this should be understood in a context of
discouraging extremely high collaterals, high interest rates and bureaucracy procedures
(Nisttahusz, 2007). Andersen & Muriel (2007) support this by saying that access to
finances by itself is not the problem, since there is a very active micro-credit industry in
Bolivia, yet its terms are so unattractive that enterprises avoid them. They also explain that
Bolivian banks offer better terms, but micro-entrepreneurs have difficulties complying with
the requirements, especially regarding proof of steady income and collaterals. These
findings are aligned to Vandenberg (2009), who explains that tight credit is one of the
major pressures faced by MSEs.
Data analysis also showed that the vast majority of MSEs who had a line of credit or loan
had obtained it from commercial banks. Unfortunately, limitations in the dataset did not
allow conducting further research on the reasons for using commercial banks instead of
alternative sources of financing. Lending NGOs are an alternative to commercial banks,
which provide loans to establishments which would not be able to access the financing
market due to lack of collaterals and credit history (Al-Madhoun & Analoui, 2003).
Considering that half of the surveyed establishment are not using any loans or credits from
financial institutions, it would be interesting to investigate and maybe promote alternative
sources of financing, such as non commercial banks and state-owned banks specialized in
MSEs, which might offer enterprises better conditions for accessing a loan or credit, such
as decreasing the required collaterals and interest rates.
However, although existing research on the direct constrains that MSEs in developing
countries face repeatedly highlights financial issues as a high priority, it is clear that finance
cannot be taken as the only factor hindering development of MSEs (ILO, 2007). In Bolivian
case, human labour could be considered as the most critical endogenous factor, since MSEs
Micro and Small Enterprise Development in Bolivia, Seeking Opportunities
By Cintia S. Vega
51
are labour intensive and findings from data analysis show that a high percentage of
establishments identified unqualified labour as an obstacle for their current operations.
According to ILO, “Human talent is the single most important productive factor in today’s
economy” (ILO, 2007:4), specially taking into account that labour inputs account for more
than 65% of the total inputs in enterprises from developing countries (McKinsey, 2002).
The good news are that in Bolivia there is plenty of labour, though it is poorly qualified and
unspecialized (Nisttahusz, 2007). Based upon these statements, a hypothesis correlating
formal educational levels of workforce to labour productivity was tested with no significant
results. However, other variables should be considered when assessing labour force quality,
such as the years of previous experience and non-formal educational programs. Limitations
in the dataset prevented this analysis, so document review was taken into account.
Previous studies developed in Bolivia claim that low educational levels observed in labour
force have hindered increases in productivity and income, and attribute this issue to the lack
of complementary educational programs focusing on adult education and technical training
(Jemio & Choque, 2006). Since it is proved that that a higher level of labor productivity
(output per employee) results in increased wages (OECD, 2004), it is worth to place more
efforts in training workforce.
On the other side, enterprise management skills are also a relevant factor to be considered.
MSEs in Bolivia are conducted based on intuition and experience, lacking use of
professional techniques and management tools (Nisttahusz, 2007). Analysis was made to
test the relation between the experience managers had running similar business and the
performance of MSEs, yet no significant correlations were found. In spite of this, relevant
previous studies provide evidence that managers´ experience does significantly affect
MSEs´ growth: (i) Parker (1995) reported that Kenyan entrepreneurs who had previous
experience of at least seven years had higher probabilities of growing their establishment
faster than those without experience; (ii) Bates (1990) found that educational level of the
establishment owner is positively related to small firm longevity (McPherson, 1996); (iii)
McPherson (1992) showed that entrepreneurs who had received some vocational training
expanded their MSEs faster than those without such training. On the other side, studies
Micro and Small Enterprise Development in Bolivia, Seeking Opportunities
By Cintia S. Vega
52
conducted by Mean & Liedholm (1998) found no correlation between entrepreneurs who
had completed primary school and MSE´s expansion. Considering the findings of the
current study and previous studies, it seems like managers´ formal education, training and
experience must be related in some way to MSEs´ performance, and thus it seems
necessary to carry out further study on the characteristics of Bolivian MSEs´ managers and
their effects on MSEs´ growth.
So labour is indeed a critical factor affecting MSEs´ performance and growth, but other
factors still need to be addressed. Nisttahusz (2007) states that obsolete technology of
machines and equipment are other factors negatively affecting Bolivian MSEs productivity.
Additionally, a study developed in Bangladesh also found that “firms with R&D activities
and quality certifications have higher levels of total factor productivity” (Fernandez,
2006:1). Moreover, OECD (2004) claims that productivity can be raised by innovation and
the introduction of new technology. In fact, multiple authors suggest that improvements in
technology are the cause of growth in enterprises (Abraão, 2001; Meyer-Stamer and
Waltring, 2002; Yong, 2003; Aguilar & Elizondo, 2009).
Findings of the study show that despite the fact that a positive significant correlation was
found between establishments which had rented machines, equipment or other types of
physical capital and levels in labour productivity (expressed as revenues per employee),
Bolivian MSEs´ expenditures in fixed assets, research and development, high-tech and
quality were all extremely low among the respondents.
A last endogenous factor that needs to be analyzed is purchases of raw materials and
intermediate products used in production, which account for an average expenditure of 40%
of total sales, being by far the biggest operative cost for MSEs. According to Nisttahusz
Antequera (2002), provision of raw materials and supplies to Bolivian MSEs is not done at
convenient prices and with adequate quality.
Access to raw material and supply chain tends to be difficult for MSEs due to their low
scale of operations and atomization (The World Bank, 2009). MSEs must use
intermediaries to obtain the supplies and raw material they need, which increases their
production costs and thus affects their levels of competitiveness. The present study found
Micro and Small Enterprise Development in Bolivia, Seeking Opportunities
By Cintia S. Vega
53
interesting patterns between the size of the enterprise and its propensity to buy inputs and
raw material from small companies, which indicates that bigger sized MSEs might have
better access to the supply chain, avoiding intermediaries when buying supplies.
To sum up, it is difficult to establish an order of importance in which factors should be
prioritized when analyzing MSEs´ growth, since they all impact their performance in a
different way. It could be said that qualified and trained labour is the key component in any
productive enterprise, but it must be accompanied by adequate financial resources that will
enable enterprises to access technologies that will improve their productivity levels.
Besides, access to affordable, timely and good quality raw materials will also impact MSEs
performance. Aguilar & Elizondo (2009) sustain that public policy should focus on three
factors to increase SMEs productivity, which are training programs, credit access and
technological updating. Hence, constrains related to endogenous factors of productivity
need to be addressed in a joint and complementary manner together with exogenous factors,
which leads us to the second question.
Is there any correlation between an enabling environment and a better
performance of MSEs?
“All enterprises are part of society; they shape and are shaped by the communities in which
they operate” (ILO, 2007:v). Consequently, exogenous factors affect MSEs´ performance
and it is important to study the relation.
According to the present study, there was a strong correlation between the perceptions of
respondents about the environment as an obstacle for their operations and the performance
of the enterprise measured as increase or decrease in levels of sales over the previous three
fiscal years. However, important limitations were found when performing the data analysis
and results must hence be carefully framed in existing literature and previous studies.
Literature explains that a good business enabling environment, which is characterized by
open and predictable markets, non-corrupt governments, stable political institutions and a
trusted legal system, among many others, will enable entrepreneurs to grow their business
(ILO, 2007). Additionally, OECD (2004) suggests that environments where institutions and

Micro and Small Enterprise Development in Bolivia, Seeking Opportunities
By Cintia S. Vega
54
policies reduce the cost of doing business are those that provide incentives for investment
and lead pro-poor growth.
Nonetheless, when the enabling environment is analyzed, it is necessary to keep in mind
that the MSME sector is highly varied; small enterprises have unequal resources and
capacities, thus policies and interventions will have different effects according to their
heterogeneity (Audretsch et al., 2009; ILO, 2007). Formal establishments working within
the legal frameworks can more easily benefit from changes in the policy environment
regarding access to formal credit institutions, special tax regulations and social security
programs, while informal are more likely to benefit from policies aimed at improving
infrastructure (Vandenberg, 2009).
Regardless of the different characteristics among MSEs, previous studies have
demonstrated that the institutional framework including political, social and economic
conditions affects chances of success of MSMEs (Amin & Thrift, 1995; Nkya, 2003; Aidis,
2005). Other studies developed on different economies of Eastern Europe and Central Asia
found that productivity differences among countries could be explained by differences in
the investment climate, which encompasses the policy, institutional and regulatory
environment in which businesses must operate. Basically, a positive investment climate
decreases the cost of doing business and provides more certainty regarding investments
(Bastos & Nasir, 2004). Moreover, Roxas et al. (2008) explain that environmental
conditions shape the strategic choices enterprises take, influencing the scale of operation,
allocation of resources and overall operational performance.
According to the present study, the major constrains or obstacles perceived in the
environment by MSEs were Competition Practices and Political Instability.
Bolivia is known for its fragile economy and its political and social instability.
Governments have unclear rules and are conditioned by social and political pressures that
hinder good governance (Borda & Ramirez, 2006). Moreover, political and economic
instability in developing countries characterized by shifting policies and strategies hinders
investment planning and generates recurrent crises (Zevallos & Velazco, 2003).

Micro and Small Enterprise Development in Bolivia, Seeking Opportunities
By Cintia S. Vega
55
Zevallos & Velazco (2003) also attribute disloyal competition practices to the weak
institutions, at least partly. Competitive pressure is defined by Bastos & Nasir (2004) as
“the most critical factor in the investment climate”, since it accounts for more variations in
productivity levels than other constrains such as infrastructure. The World Bank provides a
very detailed explanation on why competition practices are such a fierce obstacle:
“There are no formal barriers to entry or formal regulations for many sectors, meaning
almost anybody can set up shop and compete. In addition, the lack of property rights
allows the competition to copy products at no risk. Hence, competition is on price,
quality, innovation, location, and services. As a consequence, profits are driven to a
minimum, and those who cannot compete quickly go out of business.” (The World Bank,
2009:59).
Nisttsahusz (2002) has a similar view, adding that workers tend to become the competence
after having learnt how the business works while they were employees, since entry barriers
are poor in some sectors. This affects competition negatively, because it is not the sort of
healthy competition that encourages innovation but the sort that pushes enterprises to
bankruptcy.
So could we say that the exogenous factors of productivity, meaning the enabling
environment, are more critical for MSEs development than the endogenous factors? ILO
plays with this notion during its study, stating that “it appears that, irrespective of levels of
development, business environment factors as a group are a greater determinant of
differences in competitiveness across countries than are enterprise-level factors.” (ILO,
2007:67). However, later on the study clarifies that a good enabling environment by itself is
not sufficient to create wealth, since it only provides the opportunity to do so. And claims
that the power to create wealth remains with enterprises and the people who “who own,
manage and work in them.” (ILO, 2007:56). So based on the data analysis that was
previously conducted and document review, it is concluded that both endogenous and
exogenous factors are determinants of MSEs´ growth in Bolivia.

Micro and Small Enterprise Development in Bolivia, Seeking Opportunities
By Cintia S. Vega
56
6. CONCLUSIONS
The aim of the study was to seek for a theoretically sound and empirically validated
explanation of the relevance of MSEs´ growth in the Bolivian context as well as to
understand the different factors affecting their performance. Based on existing literature
and studies, and framed under the Systemic Competitiveness model, several hypotheses
were developed and tested. In order to do so, a mixed methods approach with a primarily
quantitative element was used. The results of the statistical analysis were then combined
with document review in order to contextualize and complement the findings.
The study concludes that MSE´s growth has a direct impact on employment levels in
Bolivia, indicating that as MSE´s increase their sales, they need more workforce. Bolivian
MSEs are labour intensive as opposed to capital intensive, which makes them an important
tool in the fight against unemployment. However, based on the study findings, nothing
could be said about the quality of labour provided by MSEs and it would be hasty to make
conclusions about the role of MSEs in equitable pro-poor growth.
Results also showed that Bolivian MSEs are characterized by a relatively low use of
external financing, low levels of expenditure on fixed assets, technology and quality, and an
intensive use of unqualified labour as their main resource to achieve results, all of which
negatively affects their productivity. Additionally, the environment is not conductive for
business development. Political Instability, Competition Practices and Access to Finances
were identified as the main obstacles for MSEs´ operations and a correlation was found
between the enabling environment and MSEs´ performance. However, these results could
not be generalized due to limitations in the amount of valid responses.
Considering that some analysis could not be performed due to lack of information in the
dataset, it would be interesting to complement this study with further research based on
qualitative methods such as focus groups, in order to obtain deeper explanations regarding
MSEs´ financial choices, better understand the relation between informal education and
labour productivity and gather more information about the enabling environment´s impact
on MSE´s performance in order to generalize the results.
Micro and Small Enterprise Development in Bolivia, Seeking Opportunities
By Cintia S. Vega
57
However, despite the encountered limitations, it was possible to answer both research
questions. To sum up, MSE´s growth does matter because it generates employment and
thus, it should be adequately promoted. In order to do so, both internal and external factors
constraining MSE´s development must be equally and jointly addressed with appropriate
policies and strategies.
Word Count: 14.845

Micro and Small Enterprise Development in Bolivia, Seeking Opportunities
By Cintia S. Vega
58
7. REFERENCES
Abraão, L. (2001) Chamberlain on Product Differentiation, Market Structure and
Competition: an Essay. Working paper No. 105. Facultade de Economia, Unversidade do
Porto, May 2001
Agbeibor, M. (2006) Pro-poor economic growth: Role of small and medium sized
enterprises. Journal of Asian Economics 17, 2006, 35–40
Aguilar, J. and Elizondo, M. (2009) “Competitiveness Based on Low Production Costs or
on High Specialization and Productivity: The Case of SMEs in Costa Rica”. In High
Technology, Productivity and Networks: A Systemic Approach to SME Development.
Parrilli, M., Bianchi, P. and Sugden, R. (2009), Palgrave Macmillan, 270 p.
Aidis, R. (2005) "Institutional Barriers to Small-and Medium-Sized Enterprise Operations
in Transition Countries", Small Business Economics, Vol 25, 305-318
Al-Madhoun, M. and Analoui, F. (2003) Management and Development: The Training
Programmes for Small and Micro Enterprises in Palestinian Territories. Management
Research News, 26 (6), 2003, 39-67
Amin, A. and Thrift, N. (1995) Institutional Issues for the European Regions: From
Markets and Plans to Socioeconomics and Powers of Association. Economy and Society,
Vol 24 No l, 41-66
Andersen, L. and Muriel, B. (2007) Informality and Productivity in Bolivia: A Gender
Differentiated Empirical Analysis. Institute for Advanced Development Studies.
Development Research Working Paper Series No. 7/2007
Audretsch, D., Callejon, M. and Aranguren, M.J. (2009) “Entrepreneurship, Small Firms
and Self-employment”. In High Technology, Productivity and Networks: A Systemic
Approach to SME Development. Parrilli, M., Bianchi, P. and Sugden, R. (2009), Palgrave
Macmillan, 270 p.
Bastos, F. and Nasir, J. (2004) Productivity and the Investment Climate: What Matters
Most? World Bank Policy Research Working Paper 3335, June 2004
Borda, D. and Ramirez, J. (2006) Bolivia, Situación y Persepctivas de las MPyPEs y su
contribución a la economía. Serie de Notas de Referencia RE1-RN-06-001. Banco
Interamericano de Desarrollo. La Paz, Bolivia. 76 p.
Brown, D.J., Earle and Lup, D. (2005) What Makes Small Firms Grow? Finance, Human
Capital, Technical Assistance, and the Business Environment in Romania. Economic
Development and Cultural Change. Chicago, University of Chicago.
Bryman, A. (2004) Social Research Methods, Oxford, Oxford University Press, 545 p.
Bryman, A. (2008) Social Research Methods. Third Edition, Oxford, Oxford University
Press.
Creswell, J.W. (2007) Qualitative Inquiry and Research Design: Choosing Among Five
Approaches. Thousand Oaks, Sage, 353 p.

Micro and Small Enterprise Development in Bolivia, Seeking Opportunities
By Cintia S. Vega
59
Delgadillo, H. (2001) Estimación del Aporte de la Micro y Pequeña Empresa a la
Economía Nacional. Ministerio de Trabajo y Microempresa. La Paz, Bolivia.
Fernandez, A. (1996) Firm Productivity in Bangladesh Manufacturing Industries. World
Bank Policy Research Working Paper 3988, August 2006, The World Bank.
Feuvrier & Götzfried (2001) Medir la competitividad de las empresas no es tarea fácil.
Revista Fuentes Estadísticas N 53, Abril 2001.
Fogel, K., Hawk, A., Morck, R. and Yeung, B. (2006) “Institutional Obstacles to
Entrepreneurship”. In Oxford Handbook of Entrepreneurship, Casson, M., Yeung, B.,
Basu, A. and Wadeson, N. (eds), 540-579. Oxford, Oxford University Press.
Fretes-Cibils, V., Giugale, M. and Luff, C. (2006) Bolivia, Public Policy options for the
well-being of all. The World Bank, Washington DC. 538 p.
Gomm, R., Hammersley, M. and Peter F. (2000) Case Study Method. Sage Publications,
London, 250 p.
Harvie, C. and Lee, B.C. (2002) “The Study of Small and Medium Size Enterprises in East
Asia”, in Globalisation and SMEs in East Asia: Studies of Small and Medium Sized
enterprises in East Asia, Harvie, C. and Lee, B.C. (eds). Vol 1, 1-9. Cheltenham, Edward
Elgar.
ILO (2007-a) The Promotion of Sustainable Enterprises, sixth item on the agenda.
International Labour Conference, 96th Session, 2007, Geneva, 189 p.
ILO (2007-b) Conclusions concerning the promotion of sustainable enterprises.
International Labour Conference, June 2007, Geneva.
Jemio, L. and Choque, M. (2006) Towards a More Employment-Intensive and Pro-Poor
Economic Growth in Bolivia. Institute for Advanced Development Studies. Development
Research Working Paper Series No. 18/2006
Jemio, L.C. (2000) “Reformas, Crecimiento, Progreso Técnico y Empleo en Bolivia”. In
Jemio, L.C. & E. Antelo (2000) Quince Años de Reformas Estructurales en Bolivia: Sus
Impactos sobre Inversión, Crecimiento y Equidad. La Paz: UCB and CEPAL. Chapter 7,
355-396
Jeppesen, S. (2005) Enhancing competitiveness and securing equitable development: can
small, micro, and medium-sized enterprises (SMEs) do the trick? Development in Practice,
Volume 15, Numbers 3 & 4, June 2005.
Kirby, D. and Watson, A (2003) Small Firms and Economic Development in Developed
and Transition Economies: A Reader Aldershot, Ashgate.
Kvale, S. (1996) Interviews: An Introduction to Qualitative Research Interviewing. USA,
Sage Publications, 300 p.
Liedholm, C. and Mead, D. (1999). Small Enterprise and Economic Development, The
Dynamics of Micro and Small Enterprise. London and New York, Routledge.
McKinsey (2002) Findings, methodology and lessons learned from the work of the
McKinsey Global Institute. Report MGI.

Micro and Small Enterprise Development in Bolivia, Seeking Opportunities
By Cintia S. Vega
60
McMahon, R. (1998) Stage models of SME growth reconsidered. Research Paper Series,
98-5, School of Commerce, Flinders University of South Australia.
McPherson, M. (1996) Growth of micro and small enterprises in southern Africa. Journal
of Development Economics, Vol. 48 (1996) 253-277
McPherson, M. A. (1992) Growth and survival of small Southern African Firms. PhD
Dissertation, Michigan State University, East Lansing, Michigan.
Mead, D. and Liedholm, C (1998) The Dynamics of Micro and Small Enterprises in
Developing Countries. World Development, Vol. 26, No. 1, 61-74
Meyer-Stamer, J. and Waltring, F. (2002) Innovación Tecnológica y Perfeccionamiento de
las Pequeñas y Medianas Empresas en la República Federal de Alemania: Incentivos y
financiamiento. CEPAL, Serie Desarrollo Productivo no.120, January 2002, Santiago.
Mikkelsen, B. (2005) Methods for Development Work and Research: A new guide for
practitioners. New Delhi, Sage Publications, 350 p.
Nichols, P. (1991) Social survey methods: a fieldguide to development workers. Oxford,
Oxfam Publications.
Nistahusz Antequera, S. (2002) “Micro, Pequeña y Mediana Empresa”. In Estado de
Situación de la Competitividad en Bolivia. Sistema Boliviano de Productividad y
Competitividad. La Paz, Bolivia.
Nkya, E. (2003) Institutional Barriers to Small-Scale Business Development: A Need for
Flexibility in Tanzanian Tax and Regulatory Systems. Journal of Entrepreneurship, Vol. 12,
43-3.
North, D.C. (1992) Institutions and Economic Theory. American Economist, Vol. 36 No 1.
Organization for Economic Co-operation and Development (OECD) (2004) Accelerating
pro-poor growth through support for private sector development. OECD.
Özar, Ş, Özertan, G., and İrfanoğlu, Z. B. (2008) Micro and Small Enterprise Growth in
Turkey: Under the Shadow of Financial Crisis. The Developing Economies, Vol. 46, Issue
4, 331-362
Parker, J. (1995) Patterns of business growth: Micro and small Enterprises in Kenya. PhD
Dissertation, Michigan State University, East Lansing, Michigan.
Parrilli, M., Bianchi, P. and Sugden, R. (2009) High Technology, Productivity and
Networks: A Systemic Approach to SME Development. Palgrave Macmillan, 270 p.
Porter, M. (1991) La ventaja competitiva de las naciones. Javier Vergara Editor S.A.,
Buenos Aires, Argentina.
Ragin, C. (1994) Constructing Social Research: the Unity and Diversity of Method.
Thousand Oaks, Pine Forge Press, 200 p.
Resolución Ministerial No. 325/01, Ministerio de Trabajo y Microempresa, a través del
Viceministerio de Microempresa.
Micro and Small Enterprise Development in Bolivia, Seeking Opportunities
By Cintia S. Vega
61
Roxas, H., Lindsay, V., Ashill, N. and Victorio, A (2008) Institutional Analysis of Strategic
Choice of Micro, Small, and Medium Enterprises: Development of a Conceptual
Framework. Singapore Management Review, Vol. 30, No 2.
Scheyvens, R. and Storey, D. (eds) (2003) Development Fieldwork: A Practical Guide,
London, Sage, 200 p.
Smallbone, D and Welter, F. (2001) The Distinctiveness of Entrepreneurship in Transition
Economies. Small Business Economics 16, 249–262. Kluwer Academic Publishers.
Subramanian, U., Anderson, W. and Lee, K. (2005) Measuring the Impact of the Investment
Climate on Total Factor Productivity: The Cases of China and Brazil. World Bank Policy
Research Working Paper 3792, December 2005.
The World Bank (2007) Hacia empresas más productivas y formales, Políticas contra la
informalidad. The World Bank, Washington DC, 152 p.
The World Bank (2009) Increasing Formality and Productivity of Bolivian Firms, a World
Bank Country Study. The World Bank, Washington DC, 138 p.
Vandenberg, P. (2009) Micro, small and Medium-sized Enterprises and the Global
Economic Crisis. ILO, Geneva, 49 p.
WB-IFC (2006) Bolivia: Country Profile 2006, Enterprise Surveys. Financial and Private
Sector Development. The World Bank and the International Finance Corporation,
Washington D.C., USA.
Yong, M. (2003) Pequeñas y medianas empresas exportadoras de Costa Rica: hacia la
superación de obstáculos en el camino de las oportunidades, FUNDES, San Jose.
Zevallos, E. and Velazco, E. (2003) Construyendo el Desarrollo a través de las PyMes, La
Experiencia Bolviana. Fundes, La Paz, Bolivia. 208 p.
Internet Sources
Dataset:
The World Bank (2006) World Bank Enterprise Survey (WBES), available at
http://www.enterprisesurveys.org/ [accessed on March 6, 2010]
The World Bank (2006) Enterprise Survey Questionnaire Core, available at
http://www.enterprisesurveys.org/ [accessed on March 6, 2010]
The World Bank (2007) World Bank Enterprise Survey (WBES), Undertaking the
Questionnaire, available at http://www.enterprisesurveys.org/ [accessed on March 6, 2010]
The World Bank (2006) World Bank´s Enterprise Survey, How to Implement the Survey,
available at http://www.enterprisesurveys.org/ [accessed on March 6, 2010]
The World Bank (2007) Latin America Enterprise Surveys Data Set, available at
http://www.enterprisesurveys.org/ [accessed on March 6, 2010]

Micro and Small Enterprise Development in Bolivia, Seeking Opportunities
By Cintia S. Vega
62
The World Bank (2009) Enterprise Survey and Indicator Surveys, Sampling Methodology,
available at http://www.enterprisesurveys.org/ [accessed on March 6, 2010]
Other Internet sources:
CIA (2010) The World Factbook. Available at
https://www.cia.gov/library/publications/the-world-factbook/geos/bl.html [accessed on
May 9, 2010]
Idepro (2010) Breve caracterización de la PyME. Available at:
http://www.idepro.org/contenido/archivos/Copia%20de%20Informacion%20Pagina%20We
b.xls [accessed on February 12, 2010]
INE (1992) Encuesta Integrada de Hogares y en la Encuesta de Establecimientos
Económicos 1992. Available at: http://www.ine.gov.bo/default.aspx [accessed on Feburary
14, 2010]
Other Readings
Bolsa Boliviana de Valores SA (2007) Financiamiento de PyMEs a través del Mercado de
Valores. BBV, FundaPro, Profin, Fomem, Aqarapi and Swiss Contact. Enero 2007. La Paz,
Bolivia. 199 p.
Jorgenson, D.W. and Griliches, Z. (1967) The Explanation of Productivity Change. Review
of Economic Studies 34 (99), 249–283
Safavian, M. and Wimpey, J. (2007) Why do enterprises prefer informal credit?. Policy
Research Working Paper 4435, The World Bank.
Sierraalta, N. (2004) Competitividad y comportamiento estratégico en las Micro y
Pequeñas Empresas de Cochabamba. CEPLAG, Documento en proceso, Febrero 2004.
The World Bank (2005-a), Bolivia Poverty Assesment: Establishing the Basis for Pro-Poor
Growth, Report No.28068-BO.
The World Bank (2005-b), Bolivia Country Economic Memorandum: Policies to Improve
Growth and Employment, Report No. 32233-BO.
WB-IFC (2010) Doing Business 2010 Bolivia. Comparing Regulation in 183 Economies.
The World Bank and the International Finance Corporation, Washington D.C., USA.
Yin, R. (2003) Case Study Research: Design and Methods. Thousands Oaks, Sage, 166 p.

Annex 1 – Questions and variables used14
Table 6. Questions used and type of variables Code Question Answer Type of Variable
d2 In fiscal year [insert last complete fiscal year ¿what were the total annual sales of this establishment? Number Numerical
l1 How many permanent, full-time employees did this establishment employ fiscal year [insert last complete fiscal
year]?
Number Numerical
n3 In fiscal year [insert from last complete fiscal year three years back], three complete fiscal year’s ago, what was
total annual sales for this establishment?
Number Numerical
l2 How many permanent, full-time employees did this establishment employ three fiscal years ago year [insert
complete fiscal year 3 ago]?
Number Numerical
k30 Is access to financing, which includes availability and cost (interest rates, fees and collateral requirements), No
Obstacle, a Minor Obstacle, a Major Obstacle, or a Very Severe Obstacle to the current operations of this
establishment?
0 (No obstacle) to 4 (Very severe obstacle) Ordinal
k6 Now let’s talk about the establishment’s current position. At this time, does this establishment have a checking
and/or saving account?
Yes-No Nominal
k8 At this time, does this establishment have a line of credit or loan from a financial institution? Yes-No Nominal
k9 Referring to this a line of credit or loan what type of financial institution granted this loan? 1- Private commercial Banks
2- State-owned banks and/or government agency
3- Non-bank financial institutions
4- Others
Nominal
k13 Referring only to this most recent line of credit or loan, did the financing require collateral? Yes-No Nominal
k15 Referring only to this most recent line of credit or loan, what was the approximate value of the collateral
required as a percentage of the loan value or the value of the line of credit?
Number Numerical
k17 If in fiscal year [insert last complete fiscal year], this establishment did not apply for line of credit or loan, what
was the main reason?
1- No need for a loan
2- Complex application procedures
3- Interest rates are not favourable
4- Collateral requirements are unattainable
5- Size of loan and maturity are insufficient
6- Did not think it would be approved
7- Other
Nominal
K4 In fiscal year [insert last complete fiscal year], did this establishment purchase fixed assets, such as machinery,
vehicles, equipment, land or buildings?
Yes -No Nominal
n5a In fiscal year [insert last complete fiscal year], what was the total annual expenditure for purchases of
Machinery, vehicles and equipment (new and/or used)
Number Numerical
n5b In fiscal year [insert last complete fiscal year], what was the total annual expenditure for purchases of Land and
buildings
Number Numerical
n2d For fiscal year [insert last complete fiscal year], please provide the following information about this Number Numerical
14 All variables had missing values defined, whcih were -9 for no answer, -8 for not known and -7 for not applicable.

Micro and Small Enterprise Development in Bolivia, Seeking Opportunities
By Cintia S. Vega
64
establishment:
Total annual cost of rental of land/buildings, equipment, furniture.
b7 How many years of experience working in this sector does the top manager have? Number Numerical
l9 What is the average educational attainment of a typical production worker employed in this establishment? 1- 0 to 3 years
2- 4 to 6 years
3- 7 to 12 years
4- 13 years and more
Ordinal
l10 Over fiscal year [insert last complete fiscal year], did this establishment run formal training programs for its
permanent, full-time employees?
Yes-No Nominal
l30b Are labour regulations No Obstacle, a Minor Obstacle, a Major Obstacle, or a Very Severe Obstacle to the
current operations of this establishment? Inadequately educated workforce
0 (No obstacle) to 4 (Very severe obstacle) Ordinal
n2a For fiscal year [insert last complete fiscal year], please provide the following information about this
establishment: Total annual cost of labour (including wages, salaries, bonuses, social payments)
Number Numerical
b8 Does this establishment have an internationally-recognized quality certification? Yes-No Nominal
le8a In fiscal year [insert last complete fiscal year], did this establishment spend on research and development
activities, within the establishment or other companies contracted?
Yes-No Nominal
n5c In fiscal year [insert last complete fiscal year], what was the total annual expenditure for purchases of:
Information technology (computers, telecommunications, software)
Number Numerical
e6 Does this establishment at present use technology licensed from a foreign-owned company? Yes-No Nominal
ld11 In fiscal year [insert last complete fiscal year], what percent of this establishment’s material inputs and supplies
was purchased from small firms (less than 50 workers)?
Number Numerical
d12a In fiscal year [insert last complete fiscal year], as a proportion of all of the material inputs and/or supplies
purchased that year, what percent of this establishment’s material inputs and/or supplies were of domestic origin
Number Numerical
d12b In fiscal year [insert last complete fiscal year], as a proportion of all of the material inputs and/or supplies
purchased that year, what percent of this establishment’s material inputs and/or supplies were of domestic origin
Number Numerical
n2e For fiscal year [insert last complete fiscal year], please provide the following information about this
establishment: total annual cost of raw materials and intermediate goods used in production
Number Numerical
m1a You have indicated that several obstacles affect the operation of this establishment. Here is a card with the
obstacles I mentioned throughout the interview. Please tell me the three that you think are currently the biggest
problem, beginning with the worst of all three. Most serious obstacle
Several Obstacles Nominal
g30a Please tell me if you think that access to land is No Obstacle, a Minor Obstacle, a Major Obstacle, or a Very
Severe Obstacle to the current operations of this establishment. Access to land
0 (No obstacle) to 4 (Very severe obstacle) Ordinal
j30c What is the level of obstacle of the next items to the functioning of this establishment? Business licensing and
permits
0 (No obstacle) to 4 (Very severe obstacle) Ordinal
i30 Please tell me if you think that crime, theft and disorder is No Obstacle, a Minor Obstacle, a Major Obstacle, or
a Very Severe Obstacle to the current operations of this establishment.
0 (No obstacle) to 4 (Very severe obstacle) Ordinal
j30a What is the level of obstacle of the next items to the functioning of this establishment? Tax rates 0 (No obstacle) to 4 (Very severe obstacle) Ordinal
l30a Are labour regulations No Obstacle, a Minor Obstacle, a Major Obstacle, or a Very Severe Obstacle to the
current operations of this establishment? Labour regulations
0 (No obstacle) to 4 (Very severe obstacle) Ordinal
d30b The customs and trade regulations are No Obstacle, a Minor Obstacle, a Major Obstacle, or a Very Severe
Obstacle to the current operations of this establishment?
0 (No obstacle) to 4 (Very severe obstacle) Ordinal

Micro and Small Enterprise Development in Bolivia, Seeking Opportunities
By Cintia S. Vega
65
j30b What is the level of obstacle of the next items to the functioning of this establishment? Tax administration 0 (No obstacle) to 4 (Very severe obstacle) Ordinal
d30a Is transportation, of goods, supplies, inputs and workers, No Obstacle, a Minor Obstacle, a Major Obstacle, or a
Very Severe Obstacle to the current operations of this establishment?
0 (No obstacle) to 4 (Very severe obstacle) Ordinal
j30e What is the level of obstacle of the next items to the functioning of this establishment? Political instability 0 (No obstacle) to 4 (Very severe obstacle) Ordinal
j30d What is the level of obstacle of the next items to the functioning of this establishment? Macroeconomic
instability
0 (No obstacle) to 4 (Very severe obstacle) Ordinal
j30f What is the level of obstacle of the next items to the functioning of this establishment? Corruption 0 (No obstacle) to 4 (Very severe obstacle) Ordinal
e30 Do you think that the practices of competitors in the informal sector are No Obstacle, a Minor Obstacle, a Major
Obstacle, or a Very Severe Obstacle to the current operations of this establishment?
0 (No obstacle) to 4 (Very severe obstacle) Ordinal
c30a Is electricity No Obstacle, a Minor Obstacle, a Major Obstacle, or a Very Severe Obstacle to the
current operations of this establishment?.
0 (No obstacle) to 4 (Very severe obstacle) Ordinal
Table 7. New variables Code Variable How? Type of Variable
ISP Percentage of Increase or Decrease in Sales (d2 – n3) *100 / n3 Numerical
IEP Percentage of Increase or Decrease in Employees (l1 – l2) *100 / l2 Numerical
EMSP Expenditures in machines as percentage of sales n5a / d2 *100 Numerical ELSP Expenditures in land as percentage of sales n5b /d2 *100 Numerical ERMLSP Expenditure in rental as percentage of sales N2d /d2 *100 Numerical PLPLFY Labour Productivity l1 /d2 *100 Numerical LAN Labour cost as percentage of annual sales n2a / d2 *100 Numerical ITPS Expenditure on information as percentage of annual sales n5c / d2 *100 Numerical
ITPSDummy Expenditure on information as percentage of annual sales
dummy ITPS recoded. 0%, <4% and >4% Numerical
RMPS Total annual cost of raw materials and intermediate goods
used in production as % sales n2e / d2*100 Numerical
EO Index 15 variables k30+l30b+g30a+j30c+i30+j30a+l30a+d30b+j
30b+d30a+j30e+j30d+j30f+e30+c30a Numerical
IST Total Increase or Decrease in Sales d2 – n3 Numerical

Annex 2 – Analysis of MSEs´ growth relevance
1- Correlation between Sales and Labour
Model Summary
Model R R Square Adjusted R Square Std. Error of the Estimate
dimension0 1 ,356a ,126 ,121 64,86638
a. Predictors: (Constant), Percentage Increase or Decrease in Sales over the last 3 years
ANOVAb
Model Sum of Squares Df Mean Square F Sig.
1 Regression 101127,510 1 101127,510 24,034 ,000a
Residual 698469,368 166 4207,647
Total 799596,877 167
a. Predictors: (Constant), Percentage Increase or Decrease in Sales over the last 3 years
b. Dependent Variable: Percentage of Increase or Decrease in Employees
Coefficientsa
Model
Unstandardized Coefficients
Standardized
Coefficients
B Std. Error Beta
1 (Constant) 14,997 5,595
Percentage Increase or Decrease in
Sales over the last 3 years
,121 ,025 ,356
a. Dependent Variable: Percentage of Increase or Decrease in Employees
2- Correlation between Sales and Investment in Physical Capital
Annual expenditure
on purchases of:
Machinery, vehicles
and equipment
Percentage Increase
or Decrease in Sales
over the last 3 years
Annual expenditure on purchases
of: Machinery, vehicles and
equipment
Pearson Correlation 1 -,082
Sig. (2-tailed) ,291
N 246 166
Percentage Increase or Decrease in
Sales over the last 3 years
Pearson Correlation -,082 1
Sig. (2-tailed) ,291
N 166 168
Annex 3 - Financial Capital Analysis Does this establishment have a checking and/or saving account?
Frequency Percent Valid Percent Cumulative Percent
Valid Yes 228 87,4 87,4 87,4
No 33 12,6 12,6 100,0
Total 261 100,0 100,0

Micro and Small Enterprise Development in Bolivia, Seeking Opportunities
By Cintia S. Vega
67
Have a line of credit or loan from a financial institution?
Frequency Percent Valid Percent Cumulative Percent
Valid Yes 129 49,4 49,6 49,6
No 131 50,2 50,4 100,0
Total 260 99,6 100,0
Missing No sabe 1 ,4
Total 261 100,0
Fin.institution granted most recent outstanding loan or line of credit?
Frequency Percent Valid Percent Cumulative Percent
Valid Commercial Private Banks 112 42,9 86,8 86,8
State Banks or Government
Agencies
1 ,4 ,8 87,6
Alternative Financial Institutions 14 5,4 10,9 98,4
Others 2 ,8 1,6 100,0
Total 129 49,4 100,0
Missing System 132 50,6
Total 261 100,0
Statistics
Value of collateral as % of most recent outstanding loan?
N Valid 124
Missing 137
Mean 182,68
Median 200,00
Mode 200
Std. Deviation 138,849
Variance 19279,066
Skewness 1,726
Std. Error of Skewness ,217
Kurtosis 5,586
Std. Error of Kurtosis ,431

Micro and Small Enterprise Development in Bolivia, Seeking Opportunities
By Cintia S. Vega
68
Main reasons for not applying for loan or linea of credit * Degree of obstacles for current operation:access to finance
Crosstabulation
Total
Main reasons for not applying for
loan or linea of credit
No need for a loan Count 85
% within Degree of obstacles for
current operation:access to finance
54,1%
Difficult procedures Count 17
% within Degree of obstacles for
current operation:access to finance
10,8%
High interest rates Count 26
% within Degree of obstacles for
current operation:access to finance
16,6%
Strict collateral requirements Count 13
% within Degree of obstacles for
current operation:access to finance
8,3%
Inadequate amounts and timelines Count 2
% within Degree of obstacles for
current operation:access to finance
1,3%
Thought it would not be approved Count 2
% within Degree of obstacles for
current operation:access to finance
1,3%
Other reasons Count 12
% within Degree of obstacles for
current operation:access to finance
7,6%
Total Count 157
% within Degree of obstacles for
current operation:access to finance
100,0%
Chi-Square Tests
Value df
Asymp. Sig. (2-
sided)
Pearson Chi-Square 55,937a 24 ,000
Likelihood Ratio 57,008 24 ,000
Linear-by-Linear Association 14,365 1 ,000
N of Valid Cases 157
a. 27 cells (77,1%) have expected count less than 5. The minimum expected count is ,14.
Symmetric Measures
Value Approx. Sig.
Nominal by Nominal Phi ,597 ,000
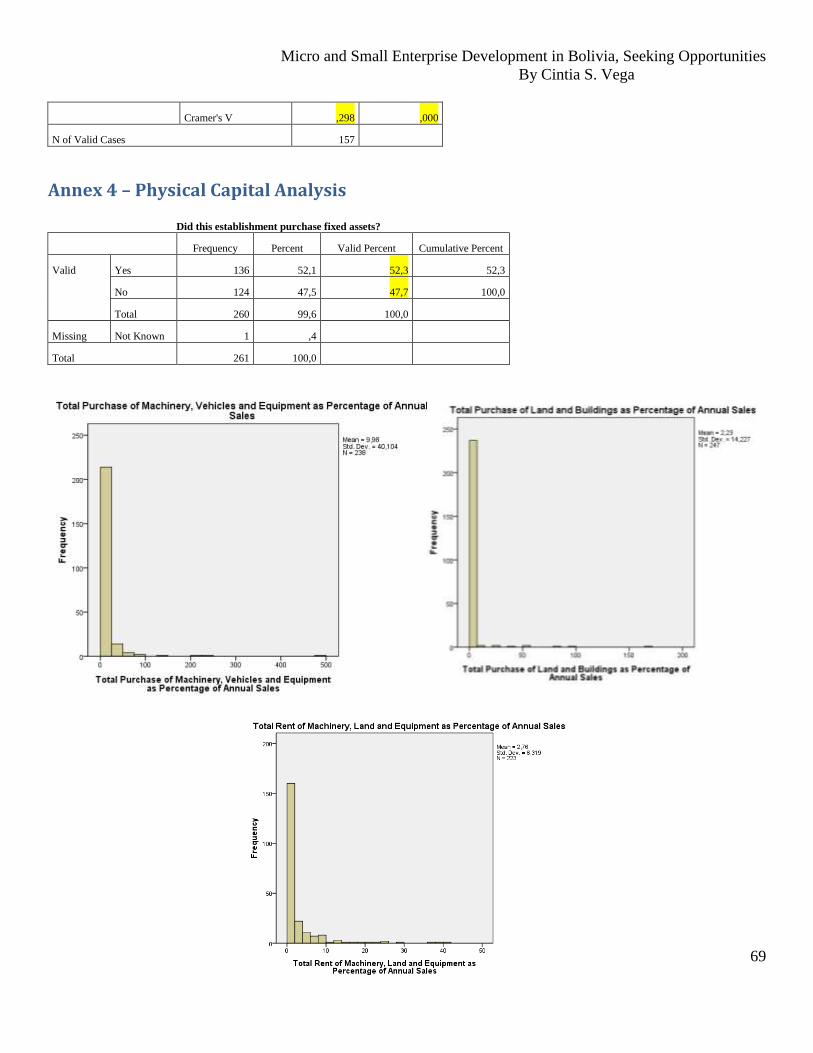
Micro and Small Enterprise Development in Bolivia, Seeking Opportunities
By Cintia S. Vega
69
Cramer's V ,298 ,000
N of Valid Cases 157
Annex 4 – Physical Capital Analysis
Did this establishment purchase fixed assets?
Frequency Percent Valid Percent Cumulative Percent
Valid Yes 136 52,1 52,3 52,3
No 124 47,5 47,7 100,0
Total 260 99,6 100,0
Missing Not Known 1 ,4
Total 261 100,0
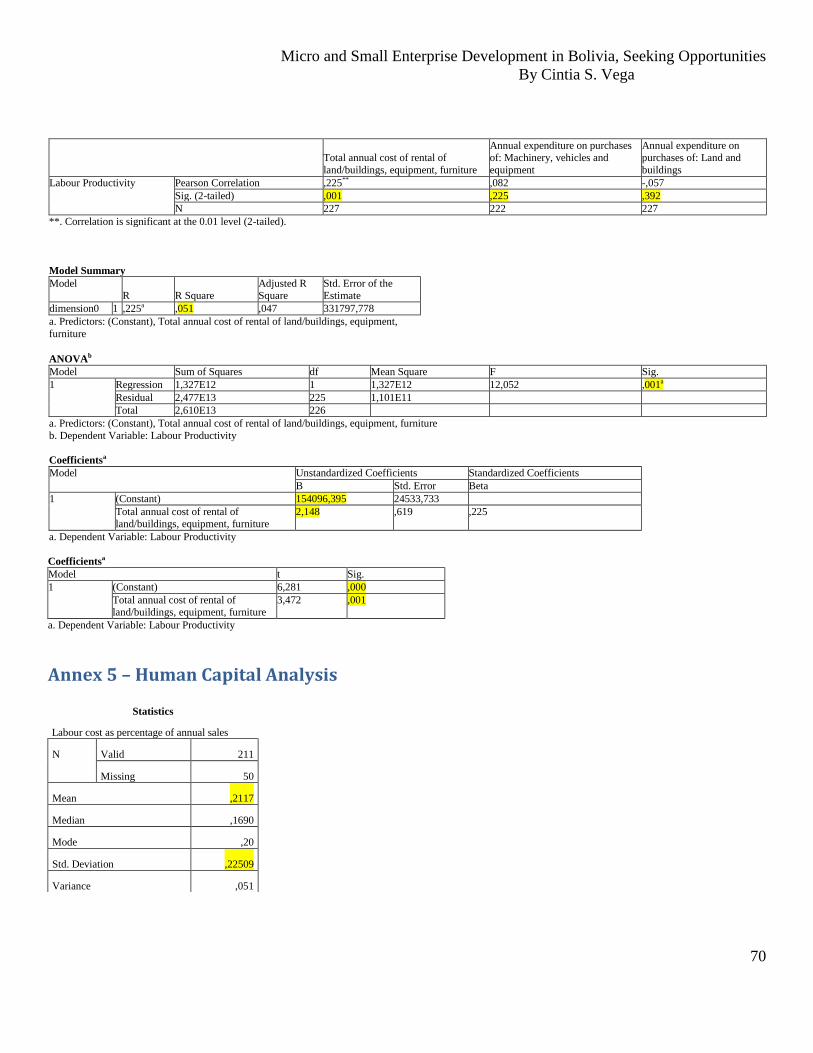
Micro and Small Enterprise Development in Bolivia, Seeking Opportunities
By Cintia S. Vega
70
Total annual cost of rental of
land/buildings, equipment, furniture
Annual expenditure on purchases of: Machinery, vehicles and
equipment
Annual expenditure on purchases of: Land and
buildings
Labour Productivity Pearson Correlation ,225** ,082 -,057
Sig. (2-tailed) ,001 ,225 ,392
N 227 222 227
**. Correlation is significant at the 0.01 level (2-tailed).
Model Summary
Model R R Square
Adjusted R Square
Std. Error of the Estimate
dimension0 1 ,225a ,051 ,047 331797,778
a. Predictors: (Constant), Total annual cost of rental of land/buildings, equipment,
furniture
ANOVAb
Model Sum of Squares df Mean Square F Sig.
1 Regression 1,327E12 1 1,327E12 12,052 ,001a
Residual 2,477E13 225 1,101E11
Total 2,610E13 226
a. Predictors: (Constant), Total annual cost of rental of land/buildings, equipment, furniture
b. Dependent Variable: Labour Productivity
Coefficientsa
Model Unstandardized Coefficients Standardized Coefficients
B Std. Error Beta
1 (Constant) 154096,395 24533,733
Total annual cost of rental of
land/buildings, equipment, furniture
2,148 ,619 ,225
a. Dependent Variable: Labour Productivity
Coefficientsa
Model t Sig.
1 (Constant) 6,281 ,000
Total annual cost of rental of land/buildings, equipment, furniture
3,472 ,001
a. Dependent Variable: Labour Productivity
Annex 5 – Human Capital Analysis
Statistics
Labour cost as percentage of annual sales
N Valid 211
Missing 50
Mean ,2117
Median ,1690
Mode ,20
Std. Deviation ,22509
Variance ,051

Micro and Small Enterprise Development in Bolivia, Seeking Opportunities
By Cintia S. Vega
71
Did this establishment have formal training programs? * Degree of obstacle for current operations: inadequately educated labour
force Crosstabulation
Degree of obstacle for current operations: inadequately educated
labour force
Total
No
Obstacle
Minor
Obstacle
Moderate
Obstacle
Important
Obstacle
Critical
Obstacle
Did this
establishment
have formal
training
programs?
Yes Count 21 11 17 17 10 76
% within Degree of obstacle
for current operations:
inadequately educated labour
force
36,2% 44,0% 37,8% 54,8% 76,9% 44,2%
No Count 37 14 28 14 3 96
% within Degree of obstacle
for current operations:
inadequately educated labour
force
63,8% 56,0% 62,2% 45,2% 23,1% 55,8%
Total Count 58 25 45 31 13 172
% within Degree of obstacle
for current operations:
inadequately educated labour
force
100,0% 100,0% 100,0% 100,0% 100,0% 100,0%
Chi-Square Tests
Value df Asymp. Sig. (2-sided)
Pearson Chi-Square 9,323a 4 ,054
Likelihood Ratio 9,485 4 ,050
Linear-by-Linear Association 6,012 1 ,014
N of Valid Cases 172
a. 0 cells (,0%) have expected count less than 5. The minimum expected count is 5,74.
Symmetric Measures
Value Approx. Sig.
Nominal by Nominal Phi ,233 ,054
Cramer's V ,233 ,054
Correlation between Labour Productivity and Education of Employees
Test of Homogeneity of Variances
Levene Statistic df1 df2 Sig.
% of Increas/Decrease in Labour
Productivity
1,832 3 105 ,146

Micro and Small Enterprise Development in Bolivia, Seeking Opportunities
By Cintia S. Vega
72
Labour Productivity 3,493 3 142 ,017
ANOVA
Sum of Squares df Mean Square
% of Increas/Decrease in Labour
Productivity
Between Groups 37681,863 3 12560,621
Within Groups 3604553,103 105 34329,077
Total 3642234,966 108
Labour Productivity Between Groups 1,610E11 3 5,366E10
Within Groups 4,878E12 142 3,435E10
Total 5,038E12 145
ANOVA
F Sig.
% of Increas/Decrease in Labour
Productivity
Between Groups ,366 ,778
Within Groups
Total
Labour Productivity Between Groups 1,562 ,201
Within Groups
Total
Robust Tests of Equality of Means
Statistica df1 df2
% of Increas/Decrease in Labour
Productivity
Brown-Forsythe ,330 3 36,640
Labour Productivity Brown-Forsythe 1,266 3 31,212
a. Asymptotically F distributed.
Lack of correlation between manager experience and
labour productivity
How many
years of
experience
working in this
sector does the
top manager
have?
% of Increas/Decrease in
Labour Productivity
Pearson Correlation ,142
Sig. (2-tailed) ,066
N 168
Labour Productivity Pearson Correlation -,013
Sig. (2-tailed) ,850
N 226
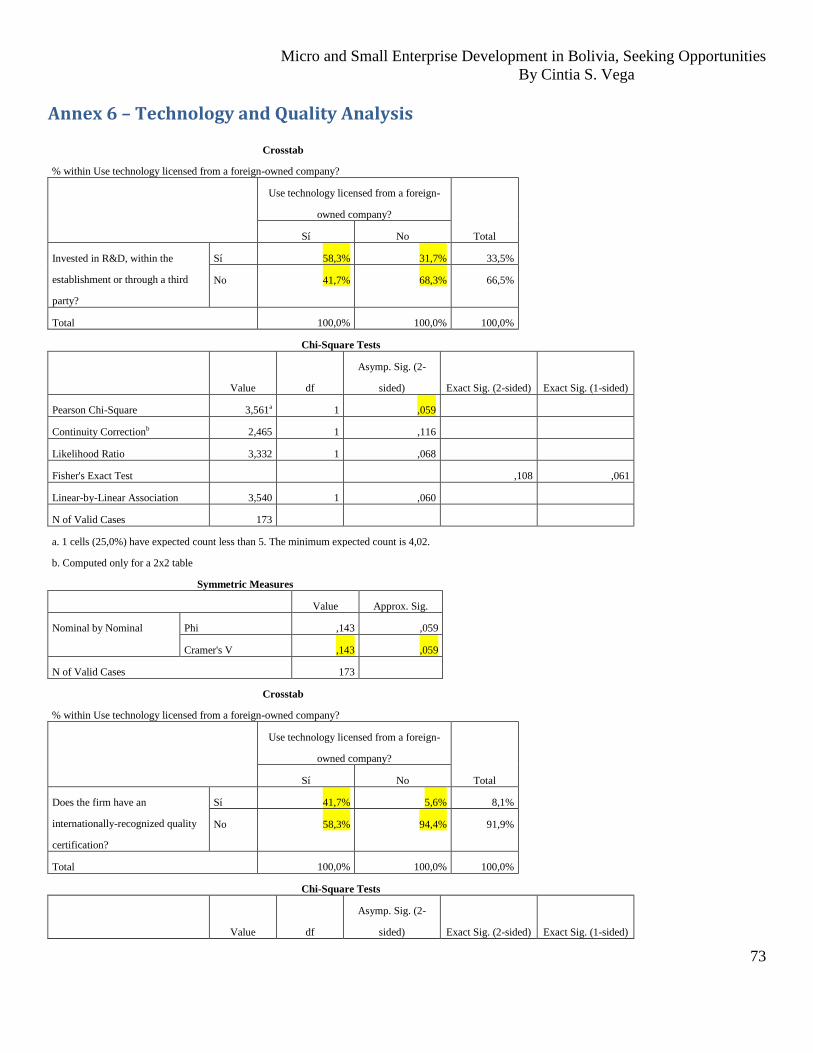
Micro and Small Enterprise Development in Bolivia, Seeking Opportunities
By Cintia S. Vega
73
Annex 6 – Technology and Quality Analysis
Crosstab
% within Use technology licensed from a foreign-owned company?
Use technology licensed from a foreign-
owned company?
Total Sí No
Invested in R&D, within the
establishment or through a third
party?
Sí 58,3% 31,7% 33,5%
No 41,7% 68,3% 66,5%
Total 100,0% 100,0% 100,0%
Chi-Square Tests
Value df
Asymp. Sig. (2-
sided) Exact Sig. (2-sided) Exact Sig. (1-sided)
Pearson Chi-Square 3,561a 1 ,059
Continuity Correctionb 2,465 1 ,116
Likelihood Ratio 3,332 1 ,068
Fisher's Exact Test ,108 ,061
Linear-by-Linear Association 3,540 1 ,060
N of Valid Cases 173
a. 1 cells (25,0%) have expected count less than 5. The minimum expected count is 4,02.
b. Computed only for a 2x2 table
Symmetric Measures
Value Approx. Sig.
Nominal by Nominal Phi ,143 ,059
Cramer's V ,143 ,059
N of Valid Cases 173
Crosstab
% within Use technology licensed from a foreign-owned company?
Use technology licensed from a foreign-
owned company?
Total Sí No
Does the firm have an
internationally-recognized quality
certification?
Sí 41,7% 5,6% 8,1%
No 58,3% 94,4% 91,9%
Total 100,0% 100,0% 100,0%
Chi-Square Tests
Value df
Asymp. Sig. (2-
sided) Exact Sig. (2-sided) Exact Sig. (1-sided)

Micro and Small Enterprise Development in Bolivia, Seeking Opportunities
By Cintia S. Vega
74
Pearson Chi-Square 19,393a 1 ,000
Continuity Correctionb 14,873 1 ,000
Likelihood Ratio 11,477 1 ,001
Fisher's Exact Test ,001 ,001
Linear-by-Linear Association 19,281 1 ,000
N of Valid Cases 172
a. 1 cells (25,0%) have expected count less than 5. The minimum expected count is ,98.
b. Computed only for a 2x2 table
Symmetric Measures
Value Approx. Sig.
Nominal by Nominal Phi ,336 ,000
Cramer's V ,336 ,000
N of Valid Cases 172
Annex 7 – Raw Materials and Supply Chain Analysis
Percent of material
inputs and/or supplies
purchased to small
companies
Percentage of
inputs/or supplies of
domestic origin
Percentage of
inputs/supplies of
foreign origin
Total Annual cost of
raw material and
intermidiate products
as percentage of
annual sales
N Valid 170 171 171 128
Missing 91 90 90 133
Mean 45,38 47,60 52,40 ,4651
Median 35,00 40,00 60,00 ,4080
Mode 0 100 0 ,50
Std. Deviation 39,472 40,203 40,203 ,54522
Variance 1558,060 1616,313 1616,313 ,297
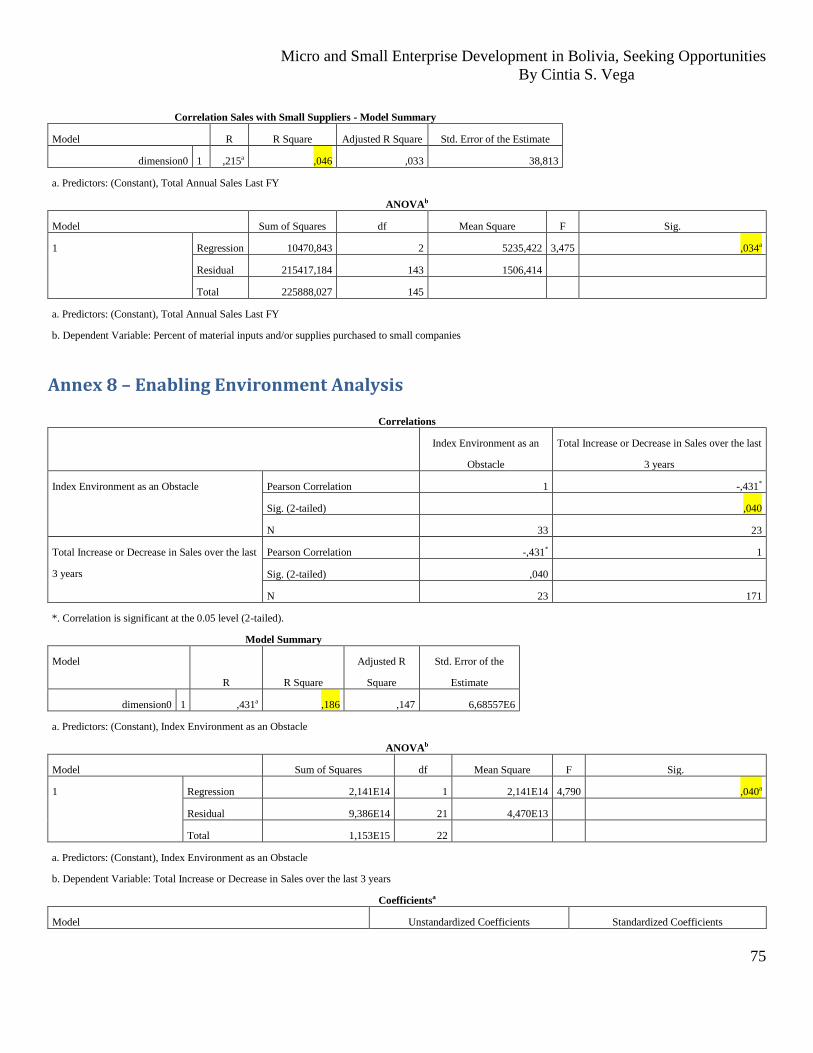
Micro and Small Enterprise Development in Bolivia, Seeking Opportunities
By Cintia S. Vega
75
Correlation Sales with Small Suppliers - Model Summary
Model R R Square Adjusted R Square Std. Error of the Estimate
dimension0 1 ,215a ,046 ,033 38,813
a. Predictors: (Constant), Total Annual Sales Last FY
ANOVAb
Model Sum of Squares df Mean Square F Sig.
1 Regression 10470,843 2 5235,422 3,475 ,034a
Residual 215417,184 143 1506,414
Total 225888,027 145
a. Predictors: (Constant), Total Annual Sales Last FY
b. Dependent Variable: Percent of material inputs and/or supplies purchased to small companies
Annex 8 – Enabling Environment Analysis
Correlations
Index Environment as an
Obstacle
Total Increase or Decrease in Sales over the last
3 years
Index Environment as an Obstacle Pearson Correlation 1 -,431*
Sig. (2-tailed) ,040
N 33 23
Total Increase or Decrease in Sales over the last
3 years
Pearson Correlation -,431* 1
Sig. (2-tailed) ,040
N 23 171
*. Correlation is significant at the 0.05 level (2-tailed).
Model Summary
Model
R R Square
Adjusted R
Square
Std. Error of the
Estimate
dimension0 1 ,431a ,186 ,147 6,68557E6
a. Predictors: (Constant), Index Environment as an Obstacle
ANOVAb
Model Sum of Squares df Mean Square F Sig.
1 Regression 2,141E14 1 2,141E14 4,790 ,040a
Residual 9,386E14 21 4,470E13
Total 1,153E15 22
a. Predictors: (Constant), Index Environment as an Obstacle
b. Dependent Variable: Total Increase or Decrease in Sales over the last 3 years
Coefficientsa
Model Unstandardized Coefficients Standardized Coefficients

Micro and Small Enterprise Development in Bolivia, Seeking Opportunities
By Cintia S. Vega
76
B Std. Error Beta
1 (Constant) 7940954,419 4125993,602
Index Environment as an Obstacle -271889,788 124224,300 -,431
a. Dependent Variable: Total Increase or Decrease in Sales over the last 3 years
Coefficientsa
Model t Sig.
1 (Constant) 1,925 ,068
Index Environment as an Obstacle -2,189 ,040
a. Dependent Variable: Total Increase or Decrease in Sales over the last 3
years


![Seeking Micro-influencers for Brand Promotion Micro-influencers for Brand... · ty influencers [6, 17, 24]. For the reasons above, micro-influencers are treated as the best fit for](https://img.pdfslide.us/doc/110x75/5ed795b767b53e06555d2ec8/seeking-micro-influencers-for-brand-promotion-micro-influencers-for-brand-ty.jpg)