Embed Size (px)
Citation preview

Micro- and macro economic analysis
[Deliverable 4.2, 7.1 – 7.3 and 9.1 – 9.2]
LIFE05 ENV/D/000182
Annex 39-UK Final Report December 2008

MICRO-MACRO ECONOMIC ANALYSIS
Report Ref. No. 08/WR/26/4
Water Resources Management in
Cooperation with Agriculture
ANNEX 39 - UK


Programme Area & Reference 08/WR/26/4
Report Title Water Resources Management in
Cooperation with Agriculture (WAgriCo) -
Micro-Macro Economic Analysis
Project Management RGT Freelance Ltd – R Trengove
Collaborators ADAS UK Ltd
Environment Agency
National Farmers’ Union
Wessex Water Services Ltd
UK Water Industry Research Ltd
Contractor CJC Consulting Ltd
Sub-Contractor Ben Wightman, Symonds and Sampson
John Morgan, Creedy Associates
Author of Report Crabtree, J.R.
Wightman, B.
Morgan J.
Report Type Final
Period Covered 2007/2008
Funding This report is prepared as part of the EU
LIFE Programme, Project Number
LIFE 05-D-182 and is funded with a
contribution from the European
Commission and co-funded in the UK by
the Department of Environment, Food and
Rural Affairs.
UK Water Industry Research Limited provides a framework for a common research programme to
undertake projects, which are considered to be fundamental to water operators on ‘one voice’ issues. Its
contributors are the water and sewerage companies and the water supply companies of England and
Wales, Scottish Water and Northern Ireland’s Water Service.

All statements contained in this document are made without responsibility on the part of UK
Water Industry Research Limited, and are not to be relied upon as statements
or representations of facts; and UK Water Industry Research Limited does not make or give,
nor has any person authority on its behalf to make or give, any representation
or warranty whatever in relation to the contents of this document or any associated software.
Published by UK Water Industry Research Limited
1 Queen Anne’s Gate, London SW1H 9BT
First published 2008
ISBN UKWIR USE ONLY
UK Water Industry Research Limited 2008
No part of this publication may be reproduced, stored
in a retrieval system or transmitted in any form or by
any means electronic, mechanical, photocopying,
recording or otherwise, without the prior written
consent of UK Water Industry Research Limited.
Printed by Webree.com Ltd.

UK WATER INDUSTRY RESEARCH LIMITED
WATER RESOURCES MANAGEMENT IN COOPERATION WITH
AGRICULTURE (WAgriCo)
MICRO-MACRO ECONOMIC ANALYSIS
Executive Summary
WAgriCo is an EU - LIFE co-funded project that aims to develop best practices for
approaches to control diffuse water pollution from agriculture. The UK component focuses
on several ‘pilot areas’ within the catchments of the Frome, Piddle and Wey in Dorset. There
are 665 farms in the three Dorset catchments and WAgriCo is collaborating with 58 farmers to
introduce a number of measures aimed at mitigating the deleterious effects of farming on
water quality.
This economic project had as principal objectives, to:
• Critically appraise the costs in the IGER/ ADAS diffuse pollution user manual.
• Identify for farms typical of the agriculture within the pilot areas
o The likely real costs of implementing 10 mitigation methods with range and
caveats.
o Potential methods of meeting these costs (e.g. agri-environment schemes, farm
assurance, etc).
• Calculate the cost of adopting a ‘supportive approach’ across the pilot areas.
• Scale up farm costs, support costs, plus any other additional costs to provide estimates of
the likely total costs of implementing these measures across the pilot.
Detailed review of the IGER/ADAS User Manual concluded that, with few exceptions, the
manual provided a reliable guide to the 2006 costs of implementing mitigation methods
within a number of model farm systems. The farm management appraisal methods were
appropriate as a basis for costing but the manual had a number of deficiencies. Details of the
calculations were not generally given, and updating to 2008 prices was not possible. The
facility to update is important because of significant changes in commodity prices that have
changed the relative costs of different measures and the shape of the marginal abatement cost
curve.
It is not clear that the manual can provide a reliable basis for scaling up of costs to specific
catchments or national level. That is because the farm systems cannot be readily mapped onto
real farms or farm types. The use of robust farm types would provide a better approach but
may complicate the technical and cost analysis. In addition, scaled up costs may be over-
estimated because, in order to estimate mitigation costs, model farms were assumed not to be
adopting the measure under assessment (e.g. cover crops). In practice some farms would be
using the management practice.

Measures were generally assessed on a whole farm basis whereas additional partial (per ha,
per head) costing would have been helpful particularly for policy purposes. The usefulness of
the manual would have been increased if more information on the variation in cost between
farms were given. However, this would be a demanding addition to the work.
Nineteen Dorset farms within the pilot areas were randomly selected from those cooperating
in WAgriCo and surveyed by face-to-face interview to assess the costs to the farms of
implementing 10 mitigation measures (Table E1). The total area of the sample farms was
5,799 ha, and this included 1,081 ha of extensive grass. The mean total area of sample farms
was 305 ha. All of the sample farms grew crops but only five were specialist arable farms
with no livestock. There were eight dairy farms, eleven with beef cattle (suckler cows or
young stock) and six had a sheep enterprise.
Table E1 Measures Costed on the Sample Farms
Type of measure Description
Fertiliser recommendations. Apply recommended fertiliser levels based on soil sampling,
analysis and advice.
Manure management plan. Prepare and apply a manure management plan within the scope of
existing investment in plant.
Cover crops for spring sown crops. Introduce cover crops for spring sown crops – maintain until
February 15th
.
Fertiliser spreader calibration Calibrate spreaders
Moving from autumn to spring application
for slurries and poultry manure. No spreading between October 15
th and January 31
st.
N efficiency calculation. Calculate a nitrogen balance for the farm.
Convert land in arable or intensive grass to
extensive grass.
Area in extensive grass to be a minimum of 20% of the farmed
area..
Adopt minimum tillage for all crops except
roots and grass reseeds. Minimum tillage to be used in 3 out of 4 years.
Cultivate land in spring (after Christmas)
rather than autumn (spring crops). No pre-Christmas cultivation of spring crops.
Use fertiliser rate 10% below the
recommended rate (arable only).
Reduce fertiliser rates to 10% below recommended for arable
crops.
For each measure the farmers were asked to estimate the additional costs and benefits of
adopting the measure (without any support input from WAgriCo). Three of the measures
produced, on average, a net benefit because benefits outweighed costs (Table E2). It was not
possible to estimate the cost of moving from autumn to spring application of slurry because
farms were already spreading in spring or did not produce slurry. Costs were estimated for the
remaining six measures. These ranged from £2.0 per ha for the nitrogen efficiency calculation
to £769 per ha of land converted to extensive grazing.
In order to scale up costs we assumed that the sample farms were representative of the total
population of 665 farms in the pilot areas. Costs were scaled up from the sample of farms as
indicated in Table E2 using the mean cost per farm or per ha as appropriate. Where there was
a net benefit on average to farmers of introducing a measure the mean cost was taken to be

zero. The total cost of implementing all measures was £5.61m (£100.2 per ha on average),
without attributing any cost to measures that gave farmers a net benefit (e.g. adopting
recommended fertiliser levels). This sum was dominated by the high costs of conversion to
extensive grassland and reducing fertiliser levels on arable land to 10% below requirements.
Table E2 Mean costs for the ten measures (per year)
Type of measure Net Cost No of farms
relevant Scaled up by
Cost for the
pilot area
catchments
(£m)
Fertiliser recommendations. -£3.72 per ha
(benefit) 19 0
Manure management plan. -£9.3 per ha
(benefit) 17 0
Cover crops for spring sown
crops. £68.8 per ha
1 18 Area of spring
crops (6,602 ha) 0.45
Fertiliser spreader calibration -£14.2 per ha
(benefit) 17 0
Moving from autumn to
spring application for slurries
and poultry manure.
0.0 0 Not known
N efficiency calculation. £600 per farm
(£2.0 per ha) 19 Number of farms
(665) 0.40
Convert land in arable or
intensive grass to extensive
grass.
£769 per ha
converted 13
Relevant area
(7.7% of 55988
ha)
3.32
Adopt minimum tillage for
all crops except roots and
grass reseeds.
£15.9 per ha 13 Area of all
relevant crops
(19,001 ha)
0.30
Cultivate land in spring (after
Christmas) rather than
autumn (spring crops).
£115 per ha 2 Relevant area
(7.4% of 6602
ha)
0.056
Use fertiliser rate 10% below
the recommended rate (arable
only).
£48.8 per ha 17 Arable area
(22,051 ha) 1.08
All measures 5.61 (£100.2
per ha)
All farmers in the sample were members of at least one assurance scheme. These schemes
made a small contribution to the implementation of mitigation methods. The assurance
schemes typically required soil sampling and fertiliser management (and possibly manure
management planning). Stewardship offered some scope for mitigation through
overwintering stubbles and headland conservation. No schemes apart from set-aside directly
pay farmers to reduce fertiliser levels or extensify production on a significant scale.
1 The benefits from cover crops were not quantified and therefore this is a cost figure not a net benefit figure.

Two types of ‘supportive approach’ were costed. In the first (facilitator only) an adviser is
employed to provide environmental awareness through meetings, newsletters etc, and indicate
sources of specific services. To offer this service to 2,000 farmers would cost around £30 per
year (£20,500 for the Dorset catchments). In practice not all farms would participate if the
initiative were voluntary. If only 25% engaged with the facilitator the cost per participating
farm would rise to around £120 per farm. A more specialised approach (facilitator plus)
offering more extensive services to a smaller number of farmers was costed at £670 per farm,
mainly because services are provided to a much smaller number of farms.
ADAS derived costs at national level based on the farm level costs estimated in the farm
survey. With all measures applied, the net cost was around £240m per year. This figure took
into account the benefits which farmers derived from implementing the measures. Reducing
fertiliser by 10% was found to be very expensive to implement. If this was excluded the
aggregate cost fell to between £36 and £92m per year.
Whilst it is not possible to assess the cost-effectiveness of different measures without
information on the extent to which they reduce pollution, it is clear that
• Farmers should be strongly encouraged to adopt mitigation methods which can be
introduced at no net cost;
• A facilitation approach is a relatively low-cost way of informing farmers about methods
that could reduce diffuse pollution; and
• Measures based on reducing fertiliser usage below recommendations or converting arable
land to extensive grass are expensive to implement when grain prices are high.

Contents Page Number
1 Research project 1
2 Objective of Research Work 1
3 Review of the IGER/ ADAS User Manual 2
4 Costs of mitigation measures to farm businesses in the pilot area catchments 13
5 Cost of adopting a supportive approach 24
6 Scaling up costs to the pilot areas 30
7 Scaling up costs to the national level for England 31
8 Conclusions 36
9 References 38
Appendix 1 - List of Methods to Control DWPA 39


1
1 Research project
WAgriCo (Water Resources in Co-operation with Agriculture) is an EC co-funded project that
aims to develop best practices for approaches to control diffuse water pollution from
agriculture. The UK component focuses on several ‘pilot areas’ within the catchments of the
Frome, Piddle and Wey in Dorset.
There are 665 farms in the three Dorset catchments. WAgriCo is collaborating with 58
farmers in a number of sub-catchments within the major catchments. These farmers are
provided with incentive payments to engage in a range of measures to reduce nitrate losses. It
also provides a support framework of catchment advisers and information provision through a
range of activities including providing specific information to farmers (e.g. on fertilizer
requirements, manure management planning, N balance).
However, a detailed understanding of the economic implications of these actions is required at
a range of levels: individual farm businesses, the pilot areas (i.e. catchment-scale) and national
(UK). This will inform the WAgriCo project and will feed into the final interpretation of the
project and the final report. The micro-macro economic analysis project aims to provide
additional information mainly on the cost to farmers of implementing measures to control
nitrate losses and improve the efficient use of manures and fertilizers.
2 Objective of Research Work
The following objectives were set out in the project specification:
• Critically appraise the costs in the diffuse pollution user manual (Cuttle et al., 2007) and
provide revisions (with justification), where necessary.
• Identify for farms typical of the agriculture within the pilot areas (guideline maximum of
20 farm businesses):
o The likely real costs of implementing 10 mitigation methods with range and
caveats.
o Potential methods of meeting these costs (e.g. agri-environment schemes, farm
assurance, etc).
• Based on information provided by the project partners, calculate the cost of adopting a
‘supportive approach’ across the pilot areas, e.g. costs of catchment officers,
soil/crop/water sampling, provision of technical advice, etc.
• Scale up farm costs, support costs, plus any other additional costs to provide estimates of
the likely total costs of implementing these measures across the pilot areas.
• Provide comment and feedback on the national costs calculated from the ADAS
spreadsheet model.
2
3 Review of the IGER/ ADAS User Manual
3.1 Introduction
As part of Defra funded project ES0203 ADAS and IGER produced ‘An Inventory of
Measures to Control Diffuse Water Pollution from Agriculture. User Manual‘ (Cuttle et al.,
2007). This listed 44 measures (see Appendix 1) that could be introduced on farms to reduce
diffuse water pollution from agriculture (DWPA). The measures were classified into six
categories:
• Land use;
• Soil management;
• Livestock management;
• Fertiliser management;
• Manure management; and
• Farm infrastructure.
The effectiveness of each of the 44 measures in reducing nitrate (N), phosphorus (P) and
faecal indicator organisms (FIO) was assessed. The cost to farmers of introducing the
measures was also estimated. Using this process the aim was to assess the cost-effectiveness
of each measure as a guide for policy implementation to reduce DWPA.
3.2 Aims
The aim of this section is to critically appraise the costs in the diffuse pollution user manual
concentrating on the approach and methodology used. The appraisal is focussed on whether
the methods used for the costing provide a reliable guide for policy. As part of this review
discussions were held with ADAS UK Ltd. who originally produced the cost data in the user
manual (Harris, 2008). No attempt has been made to update the costs which were based on
2005-2006 prices.
3.3 Approach used in the manual
The user manual began as a technical document in which scientists identified a set of
measures that appeared to have potential to reduce DWPA. In order to estimate the effect of
each measure a series of model farm systems was established with each measure being
assessed in the context of each of the systems in which it could be applied (Table 3.1). We
understand from ADAS that the model systems originated from a nutrient based approach
rather than one directed at measuring cost-effectiveness. The technical approach required
simple structures to avoid the confusion of mixtures of enterprises.
The model systems were defined by scientific staff in terms of the characteristics of major
types of farms which were known to be important sources of nutrient leaching and FIOs. The
technical aim was to specify the systems and measures in sufficient detail to allow calculations
of the N, P and FIO losses. They were therefore defined in terms of those factors that
determined DWPA. The location, structural and financial characteristics of the model systems
were not defined in detail. Each system or ‘farm type’ was stated to be located in a medium
rainfall region (850mm) and either have a sandy loam or a clay loan soil. With the exception

3
of the suckler beef system, which was located in Durham/Cumbria, the basic systems
(Table 3.1) have no precise location
Table 3.1 Model Farm Systems
Farm system Animal
Count
Excreta
(t/year)
Managed as
Manure (%)
Field Area
(ha)
Average N
(kg/ha)
Average
P2O5 (kg/ha)
Arable 0 0 N/a 300 165 60
Arable plus
manure 0 2,700 100 300 140 58
Dairy 270 5,040 60 150 190 35
Suckler Beef 220 1,850 50 100 80 30
Broilers 150,000 2,550 100 437 145 48
Breeding Pigs
(Indoor) 1,330 2,125 100 71 145 48
Breeding Pigs
(Outdoor) 2,536 3,568 0 24 0 0
The systems are defined further in broad farm management terms in the manual’s Appendix 1.
There, each system is defined in terms of herd sizes, stocking rates, slurry handling
arrangements etc. However, the price and cost baseline for each system is not explicitly
defined nor are the cost calculations for the measures given in detail. This has two effects.
First, it makes the manual fairly impenetrable in terms of understanding how the cost figures
were derived, and second, it is not possible for an external user to revise the cost estimates in
the light of changed commodity prices or costs. We understand that the detail was restricted
in order to avoid the manual becoming too large. Nevertheless, this lack of transparency
limits the use of the cost information especially in relation to significant changes in
commodity prices and enterprise gross margins that have occurred since the user manual was
produced.
The manual is in fact dealing with a set of abstract, simplified systems and it is not clear how
they are related to real farms. There is a case for linking the analysis to Defra’s robust farm
types so that there would be a stronger link to real farming. This aspect is discussed later.
The intention in the costings is to indicate the costs of implementing the measures in practice.
But actual costs may be influenced to a major degree by the specific farm context and its
financial performance. This limitation is appreciated in the manual which gives a warning
against extrapolating from the models and applying them to the whole of the farming sector.
Similarly the estimates of cost and effectiveness, it states, should not be applied to specific
farms except where they closely resemble one of the model systems.
3.4 Analysis of specific measures
In Table 3.2 each measure is taken in turn and assessed in terms of whether the context and
methodology can be expected to result in a satisfactory cost estimate. It was not always
possible to determine how the results presented in the manual were derived. In a number of
cases ADAS UK Ltd provided further details at our request.


5
Table 3.2 Detailed Analysis of Measures
Measure Context Comment on costing method Comments on costs Cost implications
1 Convert arable
land to extensive
grassland
Costed as a complete conversion of the
whole farm. It would also have been useful
to cost a marginal change of say 10% of the
arable land (as a type of set-aside).
The cost of conversion depends
crucially on the existing baseline
income and the income from the
extensive grassland. Both are highly
variable in practice and a range, rather
than a ‘mean’ cost would have been
useful. Much would depend on
individual circumstances and how the
grassland was utilised (if at all).
No income was attributed to the
livestock when livestock are
introduced but farmers may discount
this.
Extremely difficult to produce
meaningful costs without a clearer
farm baseline and context. Loss of
£90 net farm income will
underestimate the loss on many
specialist arable farms (mean £153
per ha on general cropping farms,
2005-06, SAC, 2007).
Highly variable in practice.
Some indication of this
variation would have been
useful.
2 Establish cover
crops in the autumn
The assumption is that cover crops are
relevant for the whole 300 ha. This is
slightly confusing since only 25% is in
spring crops. Total costs are hence
overestimated but per ha costs are not
affected. It is assumed that volunteer
plants/weeds would provide cover on a %
of the area. A better approach would be to
cost the formal establishment of all cover
crops since this would be required in any
policy implementation.
We suggest that a range of costs from
farm labour to full costs for
establishing cover crops by
undersowing or direct seeding would
be preferable. Costs at £67.50 per ha
of cover crops are reasonable.
Costs at an average of £17 per ha are
low because of assumptions about
using farm labour and allowing weed
growth to count as a cover crop on
part of the area.
Costs are appropriate.
3 Cultivate land for
crop establishment
in spring rather than
autumn
This is slightly ambiguous but is taken to
refer only to spring corps. The costs refer
to 10% of the arable farm in spring crops
whereas the system description states that
25% of the area is in spring crops.
Whether there is yield loss depends
critically on sowing date. There are
risk aspects from delayed sowing that
are difficult to incorporate into the
cost-effectiveness calculations.
The expected yield loss of 25%
seems high but if this is accepted
then the loss in output should be
around £100 per ha at 2005 prices.
Cost may be underestimated but
much depends on the extent of
the expected yield loss. A range
of possible costs would be
useful.

6
Measure Context Comment on costing method Comments on costs Cost implications
4 Adopt minimal
cultivation systems
This is not a clearly defined measure
because it is not clear how much flexibility
is permitted in the use of minimal
cultivation. In practice it would be more
realistic to plough periodically.
In practice some farmers would kit up
with minimal cultivation equipment
whereas others would use a contractor.
The savings would be greatest where
labour could be reduced. There may
be little saving in equipment costs.
The costs or savings would vary
considerably with context and a
range would be helpful. Where
equipment for a plough system was
retained there would be additional
costs unless labour could be reduced.
There will be a wide range of
costs/ savings from the
introduction of minimal
cultivation and this range is
greater than indicated.
5-8 These all introduce relatively small changes
in soil management. In some cases costs in
practice would depend on the precise
context and configuration of a farm..
Appropriate Because costs will vary with context
they will vary in practice. A range of
costs would have been helpful,
Ranges preferred to allow for
individual farm variation in soil
conditions and field
configurations.
9 Establish in-field
grass buffer strips
It is assumed that 10% of the farm area is
put into grass buffer strips. This does not
apply to farms already in grass.
It is assumed that the strips can be
achieved from natural regeneration
and light cultivation. No details of the
cost calculation are given in the text
but all relevant costs are included.
The cost of £31.6 is per farm ha. The
cost per strip would have been a
more useful figure for wider
application. This is based on a gross
margin loss of £302 per ha plus
establishment and maintenance costs.
The assumed gross margin is high in
situations where the buffer strips
requires little management. A gross
margin of £210 per ha (2005) would
be more appropriate.
The cost may be rather high.
10 Loosen
compacted soil
layers in grassland
systems
This is a single operation, readily
costed.
Appropriate The cost is £43 per ha treated.
This is an annual cost if grass is
subsoiled once every four
years.
11 Maintain or
enhance soil
organic matter
levels
In practice costs would depend on whether
organic manures were available on the farm
as part of a mixed system or whether
transport was required (assuming a local
source). The costings are done for an
‘arable with manure‘ system - a variant on
the arable system.
Appropriate in the context of the
assumptions about availability and
travel distance.
No details of the cost elements are
given – in particular what savings in
fertiliser costs are included.
A difficult measure to cost
given the variation in context.
More information on the range
of costs likely to be
experienced would be helpful
12 Allow field
drainage systems to
deteriorate
This is extremely difficult to cost because
impacts will vary hugely with
circumstances and increase over time. In
some cases arable farming would become
untenable.
Costs are based on a loss of output of
£491 per ha.
Costs are reasonable for the
loss of outputs assumed.

7
Measure Context Comment on costing method Comments on costs Cost implications
13 Reduce overall
stocking rates on
livestock farms
This measure is not adequately defined to
cost with any precision. A 50% reduction in
animal numbers on the same area of land is
assumed.
In the absence of a detailed context a
broad-brush approach is used in which
typical gross margins are reduced by
50%. Some reduction in fixed costs
would also occur in many cases as
labour and machinery costs would be
reduced.
Costs are based on a 50% loss of
gross margin net of nitrogen fertiliser
costs. The dairy gross margins are
low as compared with average
figures (around £720, Nix, 2006) and
this would give a cost of £360 per ha.
Beef cattle costs are reasonable.
Costs are very difficult to
specify and there would be
considerable variation in
practice depending on financial
performance and
circumstances. Costs may be in
practice be higher than
estimated for dairy cows unless
fixed cost savings can be made.
A range of costs would be
helpful.
14 (15) Reduce the
length of the
grazing day or
grazing season
This measure is not well specified. It
requires some adjustment in land use and
feed managements in order to provide the
additional conserved or zero grazed feed
that the stock require when not grazing.
Cost are based on the additional costs
of silage making and slurry spreading
In practice stocking rates may have to
be reduced to provide the additional
silage. Amy loss of output would
increase costs substantially.
The costs are appropriate in a context
where minimal adjustment is
assumed.
These costs are probably
underestimated because stock
numbers may have to be
reduced to provide land for
additional silage.
16 Move feed and
water troughs at
regular intervals
Feed troughs can be moved almost without
cost. Water troughs movement is allowed
for by fixing one additional trough per field
The method is based on farm labour.
A contractor cost for increased water
supply would be useful as farmers are
likely to use this option in practice.
No details of the calculation are
provided.
Costs will be higher if contract
labour is used.
17 Reduce dietary
N and P intakes
The baseline N and P intakes are not
defined for the model systems nor the
extent of reduction required under the
measure. This makes the measure virtually
impossible to cost.
Ideally this needs yield response
curves to N and P so that the effect of
reduction from baseline could be
measured. Without this any costing is
very problematic.
Very difficult to estimate and
reliability uncertain.
Uncertain but probably in the
right order of magnitude.
18 Adopt phase
feeding of livestock
Costs could vary considerably depending
on current equipment.
Appropriate Costs seem reasonable.
19 Use a fertiliser
recommendation
system
Based on soil sampling and analysis
costs which is appropriate. Advice is
usually available free
Soil sampling is costed at £2 per ha.
In practice cost would vary with
average field size.
Costs are low where advice also
has to be purchased..
20 Integrate
fertiliser and
manure nutrient
supply
Appropriate. Slurry substitutes for
fertiliser.
Saving is reasonable.

8
Measure Context Comment on costing method Comments on costs Cost implications
21 Reduce fertiliser
application rates
Three reductions are analysed – 10%, 20%
and 50%.
The impacts are based on nutrient
response curves but no details are
given. The approach seems to assume
the same % yield reduction regardless
of crop or grass. With livestock
enterprises a reduction in N would
require an adjustment in stock
numbers and it is not clear if this is
accounted for.
It would require detailed research to
re-estimate the costs.
22-24 These are all small adjustment to fertiliser
practice. Costs per farm would vary
substantially with situation depending on
the area than was relevant to the measure.
Appropriate, although details of the
calculations not given.
Better to state the cost per relevant ha
rather than over the whole farm.
Costs per relevant ha are small
and reasonable.
25 Increase the
capacity of manure
stores
This relates to an additional 90 days storage
for the dairy and pig systems
Limited detail on the calculations. No allowance seems to be made for
spreading equipment but we
understand that maintenance costs
are included.
Cost may be slightly
underestimated and would best
be presented per day of
additional storage.
26-32 Other manure
management
measures than
involve capital
investment
These all refer to changes in manure
handling. They use varying baseline
storage and handling systems such that the
measures can be implemented.
The calculations are based on an
annual charge relating to the capital
investment.
Allowance does not seem to have
been made in all cases but costs
would be small and vary with farm.
Cost may be slightly
underestimated.
33-36 Manure
handling measures
These measures relate to restrictions on
spreading in high risk situations, and
manure incorporation. Costs would depend
critically on the farm context.
Appropriate, although details of the
calculations not given
Better to state the cost per relevant ha
rather than over the whole farm
Costs per relevant ha are small
and reasonable.
37 Transport
manure to
neighbouring farms
Costs depend on % of manure transported
and distance travelled. These will vary
widely with circumstances
Appropriate Appropriate.
38 Incinerate
poultry manure
Only feasible where a plant exists. Zero cost Zero cost.
39-44 These are
infrastructure
investments
Scope for application of the measures and
their cost) will depend critically on the
baseline situation.
The calculations are based on an
annual charge relating to the capital
investment plus a labour cost.
Details of the assumptions are not
given.
Costs best presented per unit of
the new investment rather than
pre ha or per farm.

9
3.5 Summary of the costing analysis
3.5.1 Method and detail of calculations
The actual methods used are those typical of farm management practice based on standard
costs from reference manuals such as Nix (2006) and SAC (2007). However, in most cases
the basic data and calculations are not shown in the manual. This lack of detailed content
makes it impossible to identify exactly how figures are derived. The manual would be more
useful and more easily applied to alternative circumstance if more content had been given.
3.5.2 Baseline characterisation
It would have been useful if the model systems had been defined in greater detail with
baseline commodity prices, enterprise gross margins and net farm incomes. This information
could then have been linked to the costing of measures that involved changes in the size or
management of enterprises (e.g. 1, 13). This would clarify the basis on which costs were
estimated and allow re-estimation with changed assumptions about costs or prices (see below).
An alternative approach using robust farm types has much to recommend it. These are
derived from Census data and provide a better basis for applying costs to catchment and
national scales. We consider that in further research on mitigation costs this approach should
be investigated. It would complicate the technical estimates of loss reduction because the
farms would be more complex. It would also ideally require more detailed information on the
baseline status of the farms (especially management practices). Some of the information
could be provided by Defra’s Farm Practice survey.
3.5.3 Capital investment
A considerable number of measures require new investment, for example, in slurry storage,
hedges and cultivation equipment. Although the methods of converting capital costs to annual
costs are not described in the text, Harris (2008) has indicated the amortisation procedures
used. A 7% interest rate was used and asset life varied according to the type of investment.
These follow normal practice. One aspect that is less clear is the extent to which a
maintenance charge was included in cases where equipment maintenance would be required.
With much fixed equipment this would be very low but with mobile equipment some
allowance for repairs would be appropriate. Some costs may be set slightly too low because
of this (see Table 3.2).
3.5.4 Ranges in cost
Most costs are calculated as single numbers. This is perfectly reasonable when there is little
variation in the cost of implementing a measure. However, costs will typically vary with
circumstances, and in some cases this variation will be considerable. For example some
farmers may use farm labour to implement a measure, others with less flexibility or skills may
choose a contractor, at a higher cost. Also, differences in baseline conditions between farms
(current financial performance) would feed through to the costs involved in taking land or
stock out of production (e.g. with extensification, buffer strips, reduced stocking rates). In
these cases some indication of the range of costs likely to be encountered would have been
useful. For most of the measures, and especially those central to income generation, the costs
of implementation will vary substantially depending on the farm in question. Presenting cost
ranges in the manual would have added a useful dimension to the output.

10
3.5.5 Partial versus total implementation of measures
In many instances measures could be implemented on part of a farm (partial) or across the
whole of the farm. In the manual, measures are usually costed on the basis of implementation
across the whole farm. Thus, under measure 1 (convert arable land to extensive grassland),
the whole farm is converted. Under Measure 42 (establish new hedges) all field boundaries
are assumed to have new hedges under the measure. The Land Use and Farm Infrastructure
measures are all interpreted as measures applied across the farm.
In practice, policy is likely to offer some partial options (e.g. part conversion to extensive
grassland). Here the cost per ha of conversion may be quite different from a whole-farm
adoption of the measures. Changes to the farm operations would be less profound and
variation in land characteristics would mean that in some cases partial adoption of a measure
could be achieved at a lower cost per hectare. For example, less productive land would be
offered first for extensification.
The value of the manual would be enhanced and made more easily used for policy purposes if
such measures were costed on a partial basis (per ha, per head or per km).
3.6 Updating to 2007/08
The calculations in the user manual were based on 2005/06 prices. Since then, there have
been substantial increases in cereal and soyabean prices. Expected arable gross margins and
livestock feed costs for 2007/08 are higher than those two years previously. Dairy margins are
also expected to increase but by a lower percentage. This will impact on the relative cost of
different measures. Those measures that involve a loss of output on arable farms (e.g.
extensification, reduced fertiliser levels) will become relatively more costly to implement than
those requiring changes that leave output unchanged.
It is beyond the remit of the study to analyse these effects of commodity prices in detail. This
would in any case be difficult given the lack of detailed content in the user manual. However,
it demonstrates that the cost-effectiveness of measures is not static and needs periodic
revision. A more transparent user manual or a supporting spreadsheet would assist this.
3.7 Scaling up
Using the manual to scale up to specific catchments or the nation level is problematic. First,
the baseline systems were not selected with scaling up in mind. A more classification-based
set of farm types would be preferable. Second, most of the mitigation method costs are
estimated assuming that the system does not already implement the method (i.e. no cover
crops, no soil sampling etc.). Scaling up without adjustment for current practice will lead to
an over-estimation of costs.
3.8 Specific cost estimates
Within Table 3.2 comments are made on each of the costings in so far as the level of detail
provided allows the costs to be analysed. Most calculations follow conventional procedures
as indicated above and provide a guide to the costs of implementation. However, the cost
estimates have to be interpreted in relation to the specific assumptions made for the baseline
context and the way the measure is applied. In a number of cases our analysis suggests a
degree of under- or over-estimation of cost.

11
3.9 Conclusions
The analysis of the cost data in the user manual concentrated on methods and approach rather
than the fine detail of the estimates. The method adopted for costing the measures was an
appropriate one, given that the prime objective was to deliver a broad assessment of cost-
effectiveness. But the manual could have been more transparent, flexible and informative for
policy. The following are specific comments:
• The baseline systems were not financially transparent and not specified in sufficient detail
to provide a clear baseline for the costing calculations. However, we understand that this
was deliberate policy in order to reduce the size of the manual.
• The costing calculations were generally not given in detail and there was a lack of detailed
content throughout the analysis.
• In only a few cases were cost ranges given whereas the variation in cost in practice can be
substantial. The cost would have been more informative if an indication the extent of the
variation could have been included. However, we appreciate that providing a sound basis
for the ranges would be challenging and the workload would be much increased.
• Measures were generally assessed on a whole farm basis whereas additional partial (per
ha, per head) costing would have been helpful particularly for policy purposes.
• In some cases we suggest that costs are over- or under-estimated but the extent of under-or
over-estimation is generally thought to be small.
• With recent significant increased in commodity prices the manual needs to be updated
because the relative costs of introducing different measures will have changed.
Two broad questions can be posed in relation to the reliability of the cost data in the user
manual:
• First, is the method sufficiently reliable to give a broad indication of the cost-effectiveness
of different measures in practice?
• Second, can the costs be applied to groups of farms in catchments or at the national scale?
With the proviso that recent changes in commodity prices will change the relative cost-
effectiveness of the measures, the conclusion on the first question is broadly positive. Table
3.2 suggests that the great majority of costs are reliable. However, small modifications to the
estimated costs (following from the analysis in Table 3.2) are unlikely to radically alter
relative cost-effectiveness because the range is cost-effectiveness across the measures is
expected to be very large. The manual does not give this range but Figure 3.1 below shows
the cost-effectiveness results from another study on nitrate pollution that used similar methods
(IGER, 2004). Here, several measures achieved reductions in nitrate loss at minimal cost,
whereas other measures could only be introduced at a much higher cost.

12
Figure 3.1 Cost curve for Nitrogen
Cost curve
Sandy soil rotation, with manure
(wet and dry climates)
0
100
200
300
400
500
600
0 20 40 60 80 100 120 140 160 180 200
Cumulative N savings (kg/ha)
Cum
ula
tive c
osts
(£/h
a)
Fa5Fa2Fa5 Fa1 Fa2
P3
M2M6
M1M5
M1
M2
P4
Hence, with the caveats above about content and transparency, the manual should provide
provides a broadly sound basis as a first cut system of selecting those measures which produce
greatest benefit per unit cost. It should also identify which farm systems offer the greatest
scope for cost-effective reduction in pollution.
As regards the second question the answer is broadly negative especially where the
implementation costs vary substantially with farm context. This in part reflects the fact that
there is no clear link between the model farms and real farms such that the cost of a measure
can be interpreted as some sort of ‘average’ cost for a set of actual farms.
However, where the costs of a measure do not vary to any degree between farms, the model
costings can be applied with more confidence. This only applies to simple, well-defined
measures (e.g. small changes to infrastructure or farm management). Where major changes to
a farm system are implied (e.g. reducing stocking rates) cost are likely to vary widely because
of the variation in existing farm performance. The manual’s authors appreciate this limitation
and a caveat to this effect is given in the text.
To achieve costs that could be used for aggregation to catchment or higher levels would
require a much more detailed piece of research. Ideally, this would involve a classification of
farms according to their pollution and technical/financial characteristics, and the costs of
implementing pollution-reduction measures (related to their farm management
characteristics). The robust farm types are probably the best starting point for this.
It would also be important to include information on current farm practice in order to estimate
the potential for implementing a measure. Direct use of the manual will overestimate
catchment costs because the costs are derived on the assumption that measures are not
currently being adopted at all (e.g. minimum tillage, cover crops). This will in many cases by
incorrect.

13
4 Costs of mitigation measures to farm businesses in the pilot area catchments
4.1 Measures to be costed
Ten measures were defined by the steering group for costing (Table 4.1). The aim was to
calculate the private cost to farmers of adopting each measure. Six of the measures were
closely related to the existing WAgriCo measures and four were additional. In each case the
measures were defined such that all costs were to be met by the farmer. This differs from the
WAgriCo project where many of the services are provided under the project at no cost to the
farmer.
Table 4.1 Measures Costed on the Sample Farms
Code Type of measure Description
WAgriCo
related
measure ?
WAgriCo payment
GAP1 Fertiliser recommendations.
Apply recommended
fertiliser levels based on
soil sampling, analysis and
advice.
Yes
£5 per ha (but
sampling and advice
provided free)
GAP2 Manure management plan.
Prepare and apply a manure
management plan within the
scope of existing
investment in plant.
Yes £250
EGAP1 Cover crops for spring sown
crops.
Introduce cover crops for
spring sown crops –
maintain until February
15th
.
Yes
No cultivation until
February 15th
- £60
per ha. No
cultivation until
December 31st- £30
per ha.
EGAP2 Fertiliser spreader calibration. Calibrate spreaders. Yes Contractor cost
EGAP3
Moving from autumn to
spring application for slurries
and poultry manure.
No spreading between
October 15th
and January
31st.
Yes £1000
EGAP4 N efficiency calculation. Calculate a nitrogen
balance for the farm. Yes Payment based on
improved efficiency
ADD1
Convert land in arable or
intensive grass to extensive
grass.
Area in extensive grass to
be a minimum of 20% of
the farmed area.
No N/A
ADD2
Adopt minimum tillage for all
crops except roots and grass
reseeds.
Minimum tillage to be used
in 3 out of 4 years. No N/A
ADD3
Cultivate land in spring (after
Christmas) rather than autumn
(spring crops).
No pre Christmas
cultivation of spring crops. No N/A
ADD4
Use fertiliser rate 10% below
the recommended rate (arable
only).
Reduce fertiliser rates to
10% below recommended
for arable crops.
No N/A
14
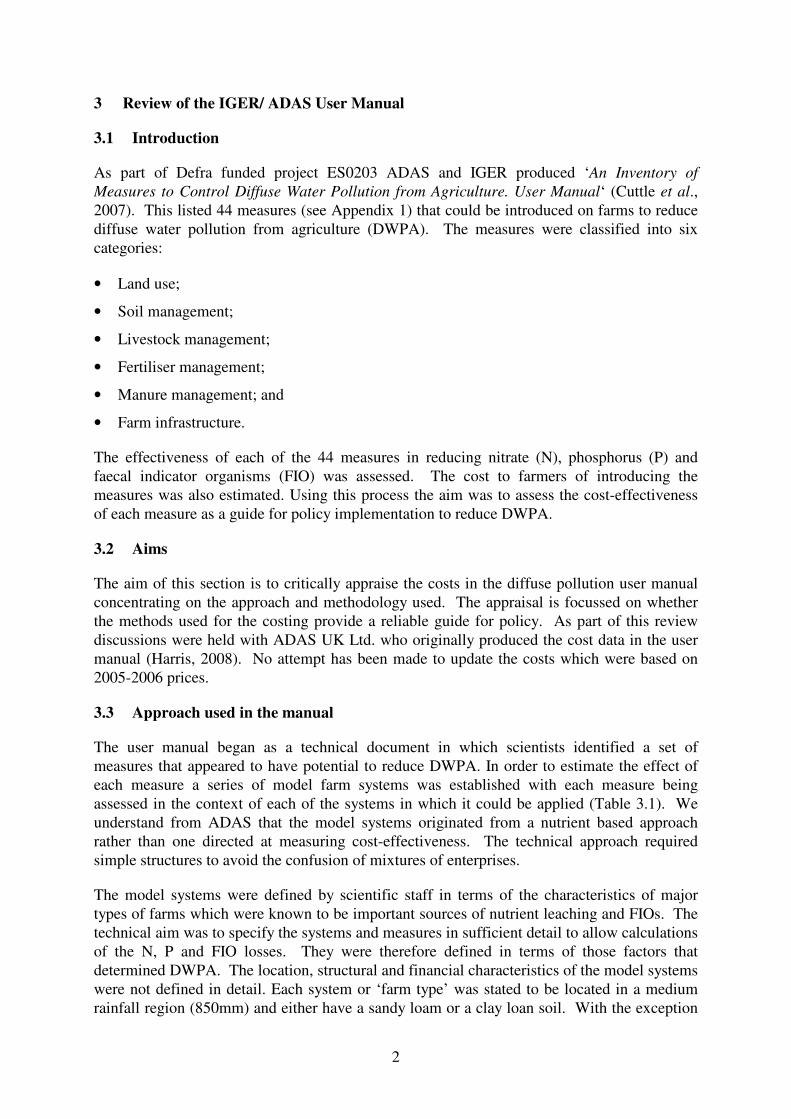
4.2 Sample of farms and interviews
The aim was to select a sample of 20 farms already collaborating in the WAgriCo study for
detailed cost investigation. The steering group provided information on the principal 38 farms
that were participating in the project. From this population a sample of 20 was selected on a
proportionate random basis by farm area. This was done so that every ha in the population of
38 farms had an equal probability of being included in the sample. One farmer dropped out at
a late stage which left a sample of 19.
Each of the 19 farmers was interviewed using a standard questionnaire. The aim was to obtain
basic information on farm size and enterprises, membership of assurance and related schemes
and the cost to the farm business of implementing each of the ten measures. In some cases
measures were inapplicable (e.g. manure measures on specialist arable farms). Where there
was a benefit from introducing a measure this was included in the calculation of cost to give a
net cost to the farmer. In some cases there was a net benefit because the benefit from
introducing the measure exceeded the cost.
The baseline for the calculation of cost was the situation without the measure. This was
straightforward where a measure was not currently being applied or where it had not been
applied prior to involvement in WAgriCo. But in many cases farmers had already adopted a
measure either voluntarily or because it was a requirement of a farm assurance scheme. In
these cases they were asked to envisage a situation without the measure and calculate the cost
of applying it. Some farmers found this difficult because they could not identify any realistic
baseline from which to estimate costs. In some other cases farmers refused to contemplate the
introduction of a measure, even in a theoretical sense, because of adverse effects on their
farming system. This often occurred with the extensification measure. Many farmers were
unwilling to contemplate reducing their productive area regardless of any compensation that
might be paid. In such cases it was not possible to obtain an implementation cost for that
farm.
The estimated costs are those based on the useable responses received.
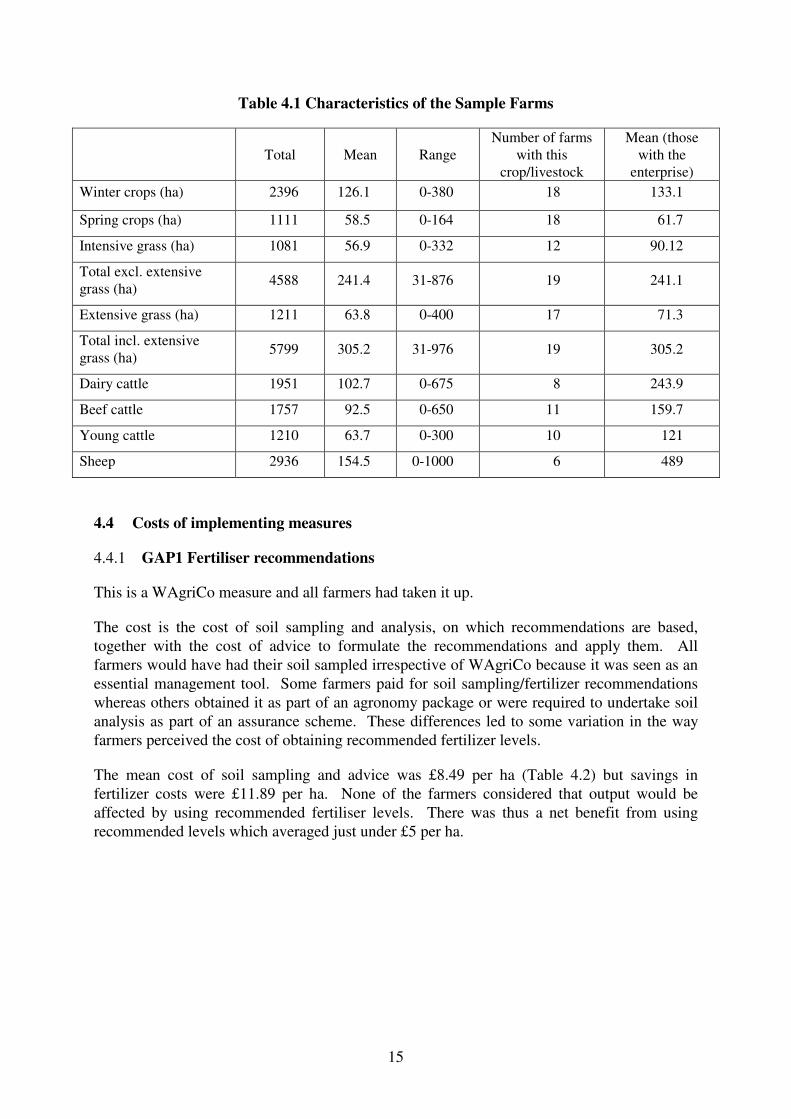
4.3 Characteristics of the sample farms
Table 4.1 summaries the characteristics of the sample as recorded in the interviews. The total
area of the sample farms was 5,799 ha, and this included 1,081 ha of extensive grass. The
area of extensive grass was sizeable (18% of the total) and much of this would be steep land
that could not be cultivated.
The farms varied considerably in their mix of enterprises. All grew crops but only five were
specialist arable farms with no livestock. There were eight dairy farms, eleven farms with
beef cattle (suckler cows or young stock) and six had a sheep enterprise. Seventeen of the
farms had some extensive grass.
15
Table 4.1 Characteristics of the Sample Farms
Total Mean Range
Number of farms
with this
crop/livestock
Mean (those
with the
enterprise)
Winter crops (ha) 2396 126.1 0-380 18 133.1
Spring crops (ha) 1111 58.5 0-164 18 61.7
Intensive grass (ha) 1081 56.9 0-332 12 90.12
Total excl. extensive
grass (ha) 4588 241.4 31-876 19 241.1
Extensive grass (ha) 1211 63.8 0-400 17 71.3
Total incl. extensive
grass (ha) 5799 305.2 31-976 19 305.2
Dairy cattle 1951 102.7 0-675 8 243.9
Beef cattle 1757 92.5 0-650 11 159.7
Young cattle 1210 63.7 0-300 10 121
Sheep 2936 154.5 0-1000 6 489
4.4 Costs of implementing measures
4.4.1 GAP1 Fertiliser recommendations
This is a WAgriCo measure and all farmers had taken it up.
The cost is the cost of soil sampling and analysis, on which recommendations are based,
together with the cost of advice to formulate the recommendations and apply them. All
farmers would have had their soil sampled irrespective of WAgriCo because it was seen as an
essential management tool. Some farmers paid for soil sampling/fertilizer recommendations
whereas others obtained it as part of an agronomy package or were required to undertake soil
analysis as part of an assurance scheme. These differences led to some variation in the way
farmers perceived the cost of obtaining recommended fertilizer levels.
The mean cost of soil sampling and advice was £8.49 per ha (Table 4.2) but savings in
fertilizer costs were £11.89 per ha. None of the farmers considered that output would be
affected by using recommended fertiliser levels. There was thus a net benefit from using
recommended levels which averaged just under £5 per ha.

16
Table 2.2 Cost of fertiliser recommendations
Number
responding
Mean
(£ per ha)
Standard deviation
(£ per ha)
Range
(£ per ha)
Sampling and advice
cost 19 8.49 5.60
0.7-21.0
Saving in fertiliser
cost (ha) 18 11.89 5.83
0.0-23.0
Net benefit 18 4.97 5.64 -3.4-18.6
Note: the standard deviation is a measure of the variation about the mean. Approximately 95% of observations
lie within the mean ±2 standard deviations. The mean net benefit (£4.97 per ha) cannot be derived from the
component elements in the rows above because of differences in the number of responses.
4.4.2 GAP2 Manure management plan:
This measure assumes that a farmer is already applying GAP1 (fertiliser recommendations).
Costs are additional to those incurred under GAP1. It deals with the cost of preparing a
manure management plan and putting it into practice with existing facilities (no new storage
or equipment). It is only applicable to those farms which apply manure either from livestock
or from the purchase of manure (mainly poultry manure). Sixteen farmers said that they were
applying this measure under WAgriCo.
The cost of preparing a plan was quite variable. The average was £228 but the range was £0-
£1,050. In the case where the cost was zero this reflected the fact that the manure management
plan was prepared by CMi (a food safety and assurance company) as part of an assurance
package. Per hectare, the average cost was £1.37 (Table 4.3). Much depended on the type and
complexity of the livestock enterprises, with higher costs on dairy farms. On some farms
manure was unimportant and the cost of producing a plan was minimal. Some farmers
prepared manure management plans themselves or through advisory packages which reduced
costs. Most farmers identified a saving in fertiliser costs though better use of manures but
spreading costs were often increased. Only one farmer considered that output would increase
with a manure plan. This was a farm that had some particularly poor fields that had responded
well to large quantities of manure as result of the plan.
Table 4.3 Cost of a manure management plan
Number
responding
Mean
(£ per ha)
Standard deviation
(£ per ha) Range (£ per ha)
Plan preparation 15 1.37 2.03 0.0-7.50
Change in output 16 +10.0 40.0 0.0-160.0
Saving in fertiliser cost 16 22.2 25.9 0.0-112.6
Additional spreading
cost 16 11.9 10.89 0.0-42.7
Net benefit (excluding
output change) 15 +9.3 17.8 -6.7-69.4
Net benefit (including
output change) 15 +19.9 47.6 -6.7-179.9

17
Table 4.3 gives statistics on the various costs and benefits associated with the preparation of a
manure management plan. Since the cost of a plan is a one-off investment which lasts until
there is a change in farm system it is strictly a capital cost. However, given the low per
hectare cost of plan preparation it is included in the table as an annual cost along with the
other items. On average, the benefit from a manure management plan is £9.3 per ha
(excluding any effects on output), mainly due to savings in fertiliser use which outweigh any
additional spreading costs. If the one farmer reporting an output increase is included, the
mean benefit increases to £19.9 per ha.
The largest benefits were on dairy farms where substantial savings in fertiliser costs could be
made. Also some farms importing poultry manure had been able to effect considerable
savings with better manure planning. Some farmers indicated small or negative benefits. This
was where manure management was an insignificant part of the farming or where adherence
to the plan imposed very long and costly spreading distances.
4.4.3 EGAP1 Cover crops for spring sown crops:
Twelve farmers took up this measure under WAgriCo. Those not taking up the measure gave
a variety of reasons. Some had no spring cropping or stockless systems with no means of
utilizing the cover crop. Others said that they would put too much pressure on spring
cultivation or create problems burying the trash. One farmer said that his pasture land was not
suitable because it was very difficult to plough and best not ploughed at all. If it was planted
it would very difficult to utilize. Livestock farmers were generally more positive about cover
crops seeing them as a good source of feed and a way of improving soil quality.
Thirteen farmers indicated the costs they had experienced or would experience in using cover
crops (Table 4.4). The average area was 38 ha at a cost of £68.8 per ha. Costs varied
considerably (from £20 to £150 per ha). The lower costs occurred where farmers used their
own labour and machinery and did not include the full costs of cultivation. High costs were
explained by the use of contractors (rather than own staff) or perceived problems with burying
trash and the need for additional sprays.
Table 4.4 Cost of cover crops
Number
responding
Mean
(£ per ha)
Standard deviation
(£ per ha)
Range
(£ per ha)
Area (ha) 13 38.0 25.4 5.0-180.0
Cost of establishment and
management (£ per ha) 13 68.8 36.1 20.0-150.0
Farmers found it difficult to quantify the benefits in monetary terms but many (especially
livestock farmers) were very happy to grow cover crops. Some commented on their value as
feed and the provision of residual N – which could save on fertiliser costs. However, on many
farms cover crops were seen as problematic because of difficulty in dealing with the trash.
4.4.4 EGAP2 Fertiliser spreader calibration
All farmers owning spreaders (17) had signed up to this WAgriCo measure. The two not
participating either used a contractor or a neighbour’s spreader. For those without spreaders

18
calibration was not relevant. Most farmers were unaware of the costs of calibration because
WAgriCo paid a contractor to undertake this. Where this was the case we used a standard cost
of £180 per spreader which was provided by ADAS.
The mean cost was £179 per spreader (Table 4.5). Benefits were difficult to estimate because
it depended on the performance of the spreader without calibration which was often unknown.
Many respondents had their spreaders calibrated as a matter of course or because a crop
assurance scheme required it. Generally, benefits were significant, averaging £15.4 per ha up
to a maximum of £49.0 per ha for one large farm. The net benefit averaged out at
£14.2 per ha.
Table 4.5 Cost of fertiliser spreader calibration
Number
responding Mean Standard deviation Range
Cost per spreader (£) 17 179 13.4 185.1-320.7
Cost per ha (£) 17 1.44 1.32 0.2-5.29
Benefits (£ per ha) 12 15.4 12.5 1.5-49.0
Net benefit (£ per ha) 12 14.2 13.6 -0.02-48.8
4.4.5 EGAP3 Moving from autumn to spring application for slurries and poultry
manure
Only four farmers said that they were signed up to this under WAgriCo, although not all of
these were clear on whether they were participating. Those not participating gave as reasons
that they did not produce slurry on the farm either because there were no livestock or because
the livestock system did not produce slurry, or that slurry was already spread in the spring.
Those using poultry manure already spreading it in the spring.
In the cases where farmers were signed up it appeared that there were no costs involved either
because they were already spreading in spring or because the change had not increased storage
and spreading costs. We were therefore unable to locate examples in the sample of farms that
were spreading in the autumn and where they would incur costs if spreading was moved to the
spring. This is not to say that on some other livestock farms (not in the sample) moving to
spring spreading could incur large costs because of additional storage costs and the logistical
difficulty of spreading manure over a shorter time period.
4.4.6 EGAP4 N efficiency calculation
This is listed as a WAgriCo measure with payments based on estimated improvements in
efficiency of N use. However, none of the respondents were aware that this had been
implemented on their farm. This appears to be an ‘in progress’ measure.
Since the supporting calculation is to be provided under WAgriCo and no farmer had
independently sought to obtain a N balance for his farm it was not possible to cost this
measure from the farm survey. Advice to us from ADAS was that the preparation of a
nitrogen balance would take a day’s work at a consultant cost of, say, £450. There would be

19
some additional cost to the farmer for providing the information for the calculation and this
would vary with farm type and complexity. The total cost on average might be around £600.
4.4.7 ADD1 Convert land in arable or intensive grass to extensive grass
This is an additional measure not offered under WAgriCo. Farmers were asked to cost the
conversion of land to extensive grassland to bring the total extensive grassland on the farm to
20%. Extensive grass was defined as grassland with a low or zero fertiliser application.
Some farms (6) already had 20% of the farmed area in extensive grass and in these cases the
measure was not applicable. This usually reflected the type of holding where steep land or
water meadows made up a significant part of the farm. In one case, part of the farm had been
extensified under the organic conversion scheme. On another, land was being extensified
under ELS. In total there were 450 ha (from a total land area of 5,878 ha) that were
appropriate for this measure).
In calculating the costs of conversion we did not impute any cost to the creation of the
grassland on the assumption that this could be done easily for intensive grassland by reducing
fertilizer levels. On arable land it was assumed that ground cover would grow although some
farmers indicated a preference for establishing grassland on previous arable land. There was
also a question of how the grassland was to be managed especially if livestock did not utilize
it. In practice much would depend on whether the land was temporarily or permanently in
extensive grass. It was assumed that this would be a long-term change.
Of the 13 respondents, the gross margin foregone from extensification averaged £1,058 per ha
(Table 4.6). On dairy farms the loss was much larger (maximum £2,740 per ha) because of
the high gross margins per hectare under dairying. The potential for utilizing the extensive
grass was critical in determining the income from the grassland. Many livestock farmers were
able to utilize the grass but all-arable farms had more limited possibilities. The average gross
margin from the extensive grass was £289 per ha, giving a total net cost, on average, of £769
per ha. Net costs were very variable (from £231 to £2,340 per ha) depending on the farm
situation. Highly stocked dairy farms had the highest net costs. Most farmers expressed very
strong antipathy to extensification because of the loss of income that it entailed and the
disruption to the farm system. Some said that they would require massive incentives to
convert.

20
Table 4.6 Cost of conversion to extensive grass
Number
responding Mean Standard deviation Range
Area to be converted
(ha) 13 34.7 29.2 3.6-96.0
Gross margin lost from
extensification (£ per
ha)
13 1,058 660.6 581-2,740
Gross margin from
extensive grass (£ per
ha)
13 289.6 136.6 26-425
Total cost (£ per ha) 13 769.0 671.6 231-2,340
4.4.8 ADD2 Adopt minimum tillage for all crops except roots and grass reseeds.
Estimating the cost of this measures proved quite problematic. A number of farmers already
used minimum tillage on at least 75% of their arable area and found it difficult to calculate the
benefits since the counterfactual plough system was rather abstract. Others did not use the
system because of perceived disadvantages in introducing it (e.g. small scale, weed problems,
high conversion costs etc.). They were in some cases unable to estimate costs. Only eight
farmers were able to estimate costs and this may not give a reliable indication of the cost of
conversion because of the small numbers and the limited information on machinery costs that
some farmers had available.
If minimum tillage equipment is purchased the capital costs are substantial. Eight farmers
estimated a mean of £54,000 for the purchase of equipment and £5,000 per year for
maintenance. The estimates of capital cost varied substantially depending on the number of
pieces of kit required, whether a new tractor was needed and whether farmers bought new or
second-hand.
Where costs were calculated these were based on the additional contractor charges over and
above any current contractor costs. Additional costs and costs saved are given in Table 4.7.
None of the respondents expected any change in output from the change to minimum tillage.
Overall the average cost was £15.9 per ha. Overall, it appears that minimum tillage has a
small cost. But there was quite a range in costs and views on minimum tillage. Some farmers
were adamant that minimum tillage had advantages in timeliness, speed of operations and
improved soil structure. Others said that their land was unsuitable or that additional chemical
costs outweighed other cost advantages. Some farmers had gone to minimum tillage because
contractors were offering the service. Others clearly saw a benefit to their specific
circumstances and land type. They said that there was definitely an advantage in using a
contractor because they were able to get over the ground much quicker.

21
Table 4.7 Cost of conversion to minimum tillage
Number
responding Mean Standard deviation Range
Additional costs (£ per ha) 8 32.6 27.1 0.0-69.0
Cost saved (£ per ha) 8 16.7 24.7 0.0-76.0
Net cost (£ per ha) 8 15.9 28.1 -15.0-53.0
4.4.9 ADD3 Cultivate land in spring (after Christmas) rather than autumn (spring
crops)
This measure was hardly relevant in the catchments either because the farms had no spring
crops (2) or because they already cultivated the spring sown land in spring. The measure was
only applicable on two farms – those that had spring crops and cultivated before Christmas.
These had 82.6 ha of spring crops out of a total of 1,111 ha in the sample. In both cases they
envisaged additional spraying costs and some loss in output (net cost, mean £115 per ha).
4.4.10 ADD4 Use fertiliser rate 10% below the recommended rate (arable only)
Fifteen farmers provided cost information for this measure. Those not responding either had
no arable land or were already operating at levels below recommended, or would not
contemplate any reduction in fertilizer levels.
The average loss in gross margin was £64 per ha (Table 4.8), with costs saved at £15.2 per ha,
giving a net cost of £48.8 per ha. Most farmers said that they would be extremely reluctant to
reduce fertiliser levels with the current cereal to fertilizer price ratio. At the current high
cereal prices there was a strong disincentive to reduce yields by cutting fertilizer inputs. Some
said that if fertiliser prices increased substantially they might have to review their fertilizer
policy.
Table 4.8 Cost of using fertiliser 10% below the recommended rate
Number
responding Mean Standard deviation Range
Lost gross margin (£ per ha) 15 64.0 34.0 0.0-160.0
Cost saved (£ per ha) 15 15.2 3.94 10.0-23.0
Net cost (£ per ha) 15 48.8 33.6 -10.0-147.0
4.5 Potential methods for meeting the costs of implementing mitigation measures
All the farmers in the sample were members of one or more farm assurance schemes and 16
were in the Entry Level Scheme. Membership was as follows:
• Assured Combinable Crops: 12
• National Dairy Farm Assurance Scheme: 6

22
• SAI Global/ FABBL: 6
• Other assurance schemes: 4
• Organic or organic conversion: 2
• Entry level stewardship (ELS): 16
• Higher level stewardship (HLS): 1
• Countryside Stewardship (CSS): 4
There are two principal ways in which membership of an assurance or environmental scheme
might ‘meet the cost’ of mitigation measures. The first is as a requirement of a scheme, where
the benefits of membership exceed the costs of implementing measures to meet requirements.
In this case there is no contribution to costs but farmers cover costs by benefiting from assured
quality outputs that can give higher or more secure market returns than would otherwise be the
case.
The second method is one of incentives for changing farm activities that directly or indirectly
lead to a mitigation of nutrient losses to water. Apart from organic conversion the main
examples are the ELS, HLS and CSS. In the ELS, farmers adopting relevant measures earn
points towards a successful application. ELS measures may also contribute to an HLS
application. The CSS is now closed to new applicants and therefore no longer relevant.
Table 4.9 summarises the main requirements and option available under assurance and
environmental schemes. The arable assurance schemes impose several requirements on
fertiliser use including soil sampling but fall short of requiring the adoption of fertilizer
requirements. Arable schemes also require spreader calibration. The dairy assurance schemes
have a requirement to produce a manure management plan. ELS/HLS incorporate nutrient
and manure management plans and pay for over-wintered stubbles and uncropped headlands.
With regard to the other measures, the stewardship schemes offer a potential source of funding
for limited extensification and overwintering stubbles but not for conversion of arable land or
intensive grassland on a large scale. Other measures are not ‘supported’ under any assurance
or environmental scheme.
Table 4.9 Contribution of Assurance and Environmental Schemes to Mitigation
Type of measure Arable assurance schemes Dairy assurance schemes Environmental and
stewardship schemes
Fertiliser
recommendations.
No requirement to adopt
recommended fertiliser
levels but members are
typically required to record
the date, type and rate of all
fertiliser and organic
manures applied to each
field. Members must also
undertake regular soil
analysis for major nutrients
to help optimise fertiliser
applications and maximise
soil potential.
No requirement ELS: Points awarded for
nutrient management
plan (No longer
applicable)

23
Type of measure Arable assurance schemes Dairy assurance schemes Environmental and
stewardship schemes
Cover crops for
spring sown crops.
No No No
Manure management
plan.
No requirement to produce
or adopt a manure
management plan but
contributing elements are a
requirement. Members are
required to record the date,
type and rate of all fertiliser
and organic manures
applied to each field.
Fertiliser applications,
including organic should be
avoided wherever possible
to continuously frozen
ground or in waterlogged
conditions, to minimise
leaching and pollution of
watercourses.
The farm must have a
waste management plan.
This plan identifies
areas where manures
can be spread and the
manure output of the
farm. It restricts total N
to 250kg N per ha on the
spreadable areas.
Manures and fertilisers
must be spread in
accordance with
legislation and good
practice. The
requirement is similar to
that in the arable
assurance schemes.
ELS: Points awarded for
manure management
plan (No longer
applicable)
Fertiliser spreader
calibration
Fertiliser spreaders must be
adequately maintained and
calibrated annually or when
changing from one product
to another. Full records of
both maintenance and
calibration will be inspected
by the assessor.
No requirement No
Moving from autumn
to spring application
for slurries and
poultry manure.
No specific requirement
apart from good practice.
No specific requirement
apart from good
practice.
No
N efficiency
calculation.
No No No
Convert land in
arable or intensive
grass to extensive
grass.
No No ELS: Points awarded for
conservation headlands
and uncropped margins
HLS: Conservation
headlands
Adopt minimum
tillage for all crops
except roots and
grass reseeds.
No No No
Cultivate land in
spring (after
Christmas) rather
than autumn (spring
crops).
No No ELS: Points awarded for
over-wintered stubbles.
HLS: Over-wintered
stubbles
Use fertiliser rate
10% below the
recommended rate
(arable only).
No No No

24
4.6 Conclusion
Three of the ten measures resulted in cost savings or increased yields such that farmers, on
average, derived a net benefit from their introduction. The measures in question were: (i)
establishing recommended fertilizer levels, (ii) manure management planning and (iii)
calibrating fertilizer distributors. We would therefore expect most farmers to implement these
measures voluntarily and there was evidence that this was the case. Many were in any case
required to do so as part of an assurance scheme. Since the N efficiency calculation had not
been implemented as yet it was not possible to say indicate whether benefits in fertilizer or
feed saving might cover the costs involved. Further experience on this aspect is needed.
The remaining measures all involved net costs for the majority of farmers and in some cases
the costs were very high. This was especially true of extensification where the costs of lost
output was a prime consideration – particularly so on arable farms in an era of high cereal
prices. The current high returns from cereals was also an element which led to the high cost
of reducing fertiliser rates on arable crops. Conversion to minimum tillage was expensive on
farms using conventional cultivation and many farmers were reluctant to consider minimum
tillage because of unsuitable soils, high costs or problems with trash.
Farm assurance schemes provide an important route for supporting basic good practice as
regards fertiliser and manure management, and the calibration of spreaders. The ELS used to
support fertiliser and manure planning through points allocation but this is no longer the case.
Stewardship now only offers support for limited extensification and overwintering of stubbles.
In the Dorset catchments farm assurance schemes appeared to be more important than
Stewardship in facilitating good environmental practice. However, there are no incentives
currently available to support the more major measures to reduce N losses such as were
offered under the Nitrate Sensitive Areas scheme.
5 Cost of adopting a supportive approach
5.1 Introduction
The WAgriCo project provides a supportive approach to farmers in the specified Dorset
catchments. Farmers are provided with information, advice and defined services (soil
sampling, manure management planning, spreader calibration, N balance calculation etc). at
no direct cost to the farmer. In fact they are given incentives to participate. This is one model
of a supportive approach where the aim is to encourage farmers to adopt methods that reduce
diffuse water pollution, especially from nitrate loss.
However, it is clear that there is no unique set of components that constitute a supportive
approach. Whilst the focus is the catchment, a catchment officer can provide a variety of
different services. Much will depend on the budget available and the extent to which farmers
are required or encouraged to finance activities themselves.
Here we investigate two possible forms of supportive approach. The first is where there is a
facilitator only (catchment officer) who will facilitate the provision of both generic advice
and farm specific advice or services. The second is a facilitator plus approach which extends
to provide a set of farm-specific services. Here these are treated as free services but in
practice they could be provided under an arrangement where farmers pay on an at-cost basis.

25
5.2 Facilitator only
In this the catchment officer has responsibility for providing general pollution-reduction
advice to farmers. The key objective is to provide a central information point and stimulate
awareness much in the same ways to English Catchment Sensitive Farming Delivery Initiative
officers. The facilitator would (i) provide information through training courses and follow up
workshops; and (ii) facilitate provision of subcontractors and monitor their services.
In practice the output of a facilitator is not limited by the area farmed but by the number of
farming businesses, i.e. the number if individuals that provide the client base. It should be
possible for one facilitator to cover around 2,000 farms. Farm size is unlikely to have a
significant impact on facilitator output.
The facilitator would match farmer requirements in the catchments with the skills of sub-
contracted specialists. The facilitator would attend, in a passive role, most workshop/training
events. Working on 220 annual working days with 1 day a week spent on administration, the
facilitator has 180 days of direct work time available.
We assume that the officer is part of a larger scheme that provides backup to individual
officers. This allows the employment of relatively low cost staff. Were the situation more
stand-alone then labour costs would be higher. The ‘overhead’ costs for a catchment officer
are as follows:
• Salary £18,000
• Transport (8,000 miles @ 40 pence per mile) £3,200
• National Insurance and employer expenses £3,000
• Allowance for office overheads including telephone, computer, stationery £3,500
• Total cost £27,700 per year
The total cost does not include office rental, supervisory, indemnity insurance or pension
costs.
The main roles are described in more detail below.
5.2.1 Training courses (workshop delivery)
These provide information on DWPA and measures for reducing it. It is assumed here that
they are run mainly by sub-contracted experts with the facilitator present. Preparation time
should be considerable and 2/3 of a day per day of workshop delivery is suggested. Very little
additional preparation time is needed if more than 5 identical training events or workshops are
to be run in same catchment.
A pre-training or workshop host farm visit will typically be required – a minimum of half a
day per pre-training/workshop day is required to visit and plan the event.

26
Additional costs are as follows:
• Hire of expert, labour cost £1,000 plus £50/day travel and subsistence.
• Invitations – at return rate of 5% 400 invitations should be sent per event. At estimated
cost of 60 pence per invitation giving a total cost per event of £240.
• Handouts of workshop papers based on 20 pages, £1.20/copy. (20 copies x £1.20 = £24).
• Refreshments – 20 @ £8.5/hd (to include one course hot lunch plus morning coffee) =
£170. No cost is imputed for a venue which is normally obtainable free of charge.
The total direct cost per training day is £1,484. Based on 15 training courses per year the
annual cost is £22,260.
5.2.2 Follow up group meetings
These are evening meetings post training/workshop events run by the catchment officer and
aimed at re-emphasising points and providing participants with an opportunity to question
trainers based on personal experiences from their own farm activity. Costs, based on 30
invited, 20 attending are:
• 1.5 advisor day allocated per event to allow for venue location, preparation and delivery.
• Refreshments based on £8.5/head rate to include hot buffet (£170).
• Invitation cost 60p/invitation (£18).
The total direct cost per follow up meeting is £188. The total annual cost based on 20 follow
up meetings per year is 3,760.
5.2.3 Provide newsletters
Preparation of 1 sheet, two sides, newsletter to support and follow up either individual or
workshop/training day activity. 1.5 days of advisor time writing and formatting content.
Printing and postage to recipient at rate of 60 pence/one sheet newsletter (£1,200 for 2,000
farmers). We assume four letters per year.
The total direct cost per year of providing a newsletter is £4,800 per year.
5.2.4 Provide a telephone helpline
This would offer technical phone support for farmers who have engaged in either one to one
or workshop/training day. These would include a brief summary of the query (50 words) and
advice given (50 words). There would be no additional costs over and above those included
above for the office.
5.2.5 Establish a website
This would require setting up and regularly updating. The cost would vary depending on the
level of sophistication but we estimate £3,000.

27
5.2.6 Provide advice and reports to individual farmers
The facilitator would advise farmers on sources of specialism including soil sampling,
preparation of manure management plans etc. The reports of the specialists would be
monitored so that the facilitator was keep abreast of the information farmers received.
Individual farm visits require at least half a day and the minimum for report writing is half a
day. These costs are met from the overhead costs of providing an officer apart from postage
and printing at £2 per report. We assume 100 reports per year at £2 giving £200. This does
not allow for the cost of the specialist in producing the report.
5.2.7 Provide reports to funding sources
Report writing by delivery team to funders would take 5 days. There is no additional cost for
this activity.
5.3 Total costs of facilitator only
Table 5.1 adds up the various costs in providing a catchment officer. The total is £61,720 for
2,000 farmers. This is £31 per farm. Applying this to the Dorset catchments (665 farmers,
assuming all participate) on a pro rata basis gives £20,548. This assumes that the officer also
covered other catchments in a larger scheme. There would be severe under-employment if
this were not the case and a part-time catchment officer would be appropriate.
It should also be noted that the costs of providing a facilitator depend heavily on salary and
office costs, and the number of farms that are served by the faciltator. We have taken a low
salary level and assumed that there are no office rental costs (home working). In practice such
a facilitator is likely to be part of a larger organisation with its own supervisory staff and
overheads. We should thus treat the £31 per farm as a minimum cost.
Table 5.1 Costs of Facilitator only
Unit cost per farm
(£ per year) £ per year
Catchment officer, office, travel and overhead costs 13.85 27,700
Training courses 11.13 22,260
Follow up group meetings 1.88 3,760
Newsletters 2.4 4,800
Telephone hot line 0 0
Website 1.5 3,000
Advice and reports to individual farmers 0.1 200
Reports to funding sources 0 0
Total per year 30.9 61,720
Note: based on 2000 farms

28
5.4 Facilitator plus
In this role the facilitator would deliver all the services of the ‘facilitator only’ together with a
package of additional services. The adviser would be more highly skilled (agriculturally and
environmentally trained) and cater for fewer clients. In practice it may be difficult to aattract
suitable staff if contracts are short-term contract with little job security. The extra services
included would be soil sampling and preparation of nutrient and manure management plans
together with advice and reports based on the above.
Again, farm size is unlikely to have a significant impact on facilitator output. However, the
number of fields on a farm and the variety of enterprises will significantly impact on the time
required to produce management plans. Farm type will also have an impact. Specialist arable
farms will have less manure related issues making production of manure and nutrient plans
much simpler and quicker.
As before there would be 180 days per year of direct time available. We assume 3 days per
farmer are required to deliver a mix of training, workshops and individual services. The costs
are based on servicing 60 farmers.
The ‘overhead’ costs for a catchment officer are as follows:
• Salary £25,000
• Transport (12,000 miles @ 40 pence per mile) £4,800
• National Insurance and employer expenses £3,000
• Allowance for office overheads including telephone, computer, stationery £3,500
• Total cost £36,300 per year
The main additional roles would be as given below.
5.4.1 Soil and manure sampling and analysis
This is commonly done as part of an assurance scheme or agronomy contract. We therefore
leave the farmer to meet any cost.
5.4.2 Preparation of a nutrient plan (fertilizer use)
This takes 1.5 days (half a day on farm and one day report writing and sorting out queries).
The nutrient plan will need updating each year, requiring one day. Since the facilitator
undertakes these activities no additional cost is incurred.
5.4.3 Preparation of a manure management plan
This is a one-off preparation of a risk-based farm map showing manure spreading restrictions
across all land farmed. Calculations are made setting out the N loading and manure storage
situation. The plan would be produced to Defra specifications as set out in the Water Code.
1.5 days of time are required to prepare the plan (half on farm and 1 report writing and sorting
out queries). The plan will only need updating if the area farmed or stock numbers change
significantly. Since the facilitator undertakes these activities no additional cost is incurred.

29
We assume that all the above services would be provided free to participating farmers. The
only additional direct costs are those for soil and manure sampling.
5.4.4 Spreader calibration
This is typically a requirement of assurance schemes and will incur no additional cost.
5.5 Total costs of facilitator plus
Table 5.2 adds up the various cost of providing this supportive service. The total is £36,725
for 60 farmers. This is £670 per farm. Applying this to the Dorset catchments (665 farms) on
a pro rata basis gives £446,000.
Table 5.2 Costs of Facilitator plus
Unit cost per farm
(£ per year) £ per year
Catchment officer, office, travel and overhead costs 605.0 36,300
Training courses 11.1 668
Follow up group meetings 1.9 113
Newsletters 2.4 144
Telephone hot line 0.0 0
Website 50.0 3,000
Reports to funding sources 0.0 0
Total per year 670.4 40,225
Note: based on 60 farms
5.6 Conclusions
These two approaches to the supportive approach reveal that very sizeable differences in cost
can occur depending on what services are provided. The facilitator only costs £31 per farm
to offer services on 2000 farms per year (£20,500 for the Dorset catchments on a pro rata
basis). In practice not all farms would participate if the initiative were voluntary. If only 25%
engaged with the facilitator the cost per participating farm would rise to around £120 per farm.
The faciltator plus is much more costly per farm (over £600 per farm) because relatively few
farms can be serviced. Even then, the package did not incorporate a number of elements that
may be valuable in controlling N losses (e.g. N balance for the farm).
These are not the only alternatives. There exist a range of intermediate supportive
mechanisms in which advisers do offer more specific services but on a paid basis. In practice
the role of a support approach will be defined by a wider assurance, environmental or
regulatory scheme which uses a facilitator to inform, encourage and possibly regulate
activities under a scheme. The specific costs of a supportive approach will thus depend on the
context. All that can be concluded here is that, because of its high cost per farm, the
faciltator plus approach is unlikely to be financed on a national basis from public funding.
This leaves the facilitator only as the most likely route for informing and stimulating action
by farmers. It is the cost of the facilitator only that we use in the scaling up of costs below.
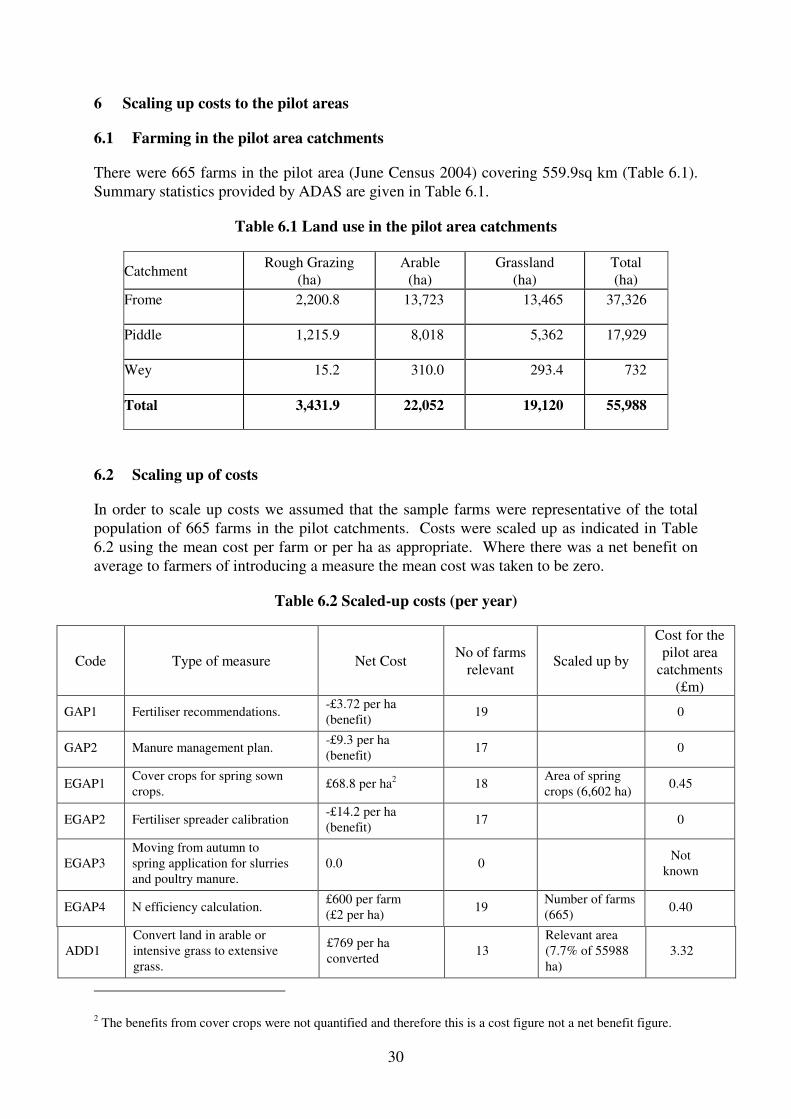
30
6 Scaling up costs to the pilot areas
6.1 Farming in the pilot area catchments
There were 665 farms in the pilot area (June Census 2004) covering 559.9sq km (Table 6.1).
Summary statistics provided by ADAS are given in Table 6.1.
Table 6.1 Land use in the pilot area catchments
Catchment Rough Grazing
(ha)
Arable
(ha)
Grassland
(ha)
Total
(ha)
Frome 2,200.8 13,723 13,465 37,326
Piddle 1,215.9 8,018 5,362 17,929
Wey 15.2 310.0 293.4 732
Total 3,431.9 22,052 19,120 55,988
6.2 Scaling up of costs
In order to scale up costs we assumed that the sample farms were representative of the total
population of 665 farms in the pilot catchments. Costs were scaled up as indicated in Table
6.2 using the mean cost per farm or per ha as appropriate. Where there was a net benefit on
average to farmers of introducing a measure the mean cost was taken to be zero.
Table 6.2 Scaled-up costs (per year)
Code Type of measure Net Cost No of farms
relevant Scaled up by
Cost for the
pilot area
catchments
(£m)
GAP1 Fertiliser recommendations. -£3.72 per ha
(benefit) 19 0
GAP2 Manure management plan. -£9.3 per ha
(benefit) 17 0
EGAP1 Cover crops for spring sown
crops. £68.8 per ha
2 18
Area of spring
crops (6,602 ha) 0.45
EGAP2 Fertiliser spreader calibration -£14.2 per ha
(benefit) 17 0
EGAP3
Moving from autumn to
spring application for slurries
and poultry manure.
0.0 0 Not
known
EGAP4 N efficiency calculation. £600 per farm
(£2 per ha) 19
Number of farms
(665) 0.40
ADD1
Convert land in arable or
intensive grass to extensive
grass.
£769 per ha
converted 13
Relevant area
(7.7% of 55988
ha)
3.32
2 The benefits from cover crops were not quantified and therefore this is a cost figure not a net benefit figure.

31
Code Type of measure Net Cost No of farms
relevant Scaled up by
Cost for the
pilot area
catchments
(£m)
ADD2
Adopt minimum tillage for all
crops except roots and grass
reseeds.
£15.9 per ha 13
Area of all
relevant crops
(19,001 ha)
0.30
ADD3
Cultivate land in spring (after
Christmas) rather than
autumn (spring crops).
£115 per ha 2
Relevant area
(7.4% of 6602
ha)
0.056
ADD4
Use fertiliser rate 10% below
the recommended rate (arable
only).
£48.8 per ha 17 Arable area
(22,051 ha) 1.08
All
measures
5.61
(£100.2
per ha)
The total cost of implementing all measures in the pilot catchments was £5.61m. Across the
total area (55,988 ha) this averaged out at £100.2 per ha. Some measures provide benefits and
have no net cost whereas others are extremely costly to implement – especially the
extensification measure. Because of the small sample and the fact that it was not a randomized
sample of all land in the catchments the total cost should be treated with some caution. It is
also heavily influenced by the cost associated with two of the measures (conversion to
extensive grass and reduced fertiliser use). It is not possible to compare the cost effectiveness
of the different measures without information on the extent to which they reduce water
pollution.
The total cost is not increased much by the inclusion of a supportive approach in which all
farmers have access to a catchment adviser. With the facilitator only approach the cost is an
additional £20,500. Again it is difficult to comment on the cost effectiveness of the
supportive approach as compared with direct measures without information on how the
approach might change farm management. However, given the relatively low cost of the
facilitator only (£30 per farm3) it would not be surprising if this did not prove effective as a
way of encouraging farmers to adopt management systems that reduced nutrient losses.
7 Scaling up costs to the national level for England
7.1 Introduction
ADAS UK Ltd raised the cost estimates given in Chapter 4 to the national level. The aim was
to give a broad indication of the aggregate cost of implementing the measures across England.
The text below was contributed by ADAS UK Ltd. The final paragraph of the Chapter gives
comments on the method and results.
3 Not all farms would participate, so the cost per participating farm would be higher.

32
7.2 Method
Anthony (2006) developed a modelling approach for scaling the costs of combinations of
mitigation methods to generate a total estimate of cost and effectiveness. The method is based
on spatial distribution of land management. Several other pieces of information are required:
• Estimates of effectiveness of individual mitigation methods
• Estimates of effectiveness of mitigation methods when combined
• Likely uptake of mitigation methods by land managers
• Efficiency of implementation of measures by the land managers
This model was used as a policy support tool to determine the likely effects of policy
measures for encouraging uptake of mitigation methods. Shepherd et al. (2007) similarly
adapted the approach to take account of the effect on diffuse pollution of possible land use
changes to 2015 and beyond, as affected by EU agricultural policy reforms.
Costs were dealt with in a similar way to that described in this report, i.e. expressed as a unit
of land or per head of animal numbers and multiplied up, based on farming statistics. When
combining mitigation methods and calculating effectiveness, effects are not additive because
methods may be working on the same pool of pollutant; it is therefore necessary to adopt a
multiplicative model (Shepherd et al., 2006). However, this is not necessary when
considering costs alone.
The report here allows another calculation using independently derived set of costs from those
used in previous work (previous projects used costs that were based upon the User Manual –
Cuttle et al., 2006 – described in this report). These were applied to general farming statistics
to determine an estimate of the likely total cost of applying a suite of mitigation methods
across England.
The ADAS database MAGPIE (Lord & Anthony, 2000) provides these statistics, split between
2004 designated NVZ and non-NVZ areas for England. About 55% of England was
designated as an NVZ in 2004, though this is under review in 2008 and could extend to about
70% of England. For the purpose of this calculation, we excluded areas of England where the
selected measures would not apply, predominantly rough grazing and forestry land. The areas
of land that were used for calculations are shown in Table 7.1.
Table 7.1 Areas of crops in England (‘000 ha), separated into NVZ and non-NVZ
designations. ‘Grass’ means managed grassland and excludes rough grazing
Arable Grass Total Spring crops
2004 NVZ 3,800 2,705 6,505 491
2004 non-NVZ 342 988 1,330 66
As some of the measures only apply to spring crops, it was necessary to separately determine
the area of tillage crops sown in spring. It was also necessary to quantify the area of land that
received manure. The British Survey of Fertiliser Practice provides an estimate of this by

33
individual crop and also as a total of tillage and non-tillage crops. These data were
summarised by Goodlass et al. (2004) and are reproduced in Table 7.2. This allowed an
estimate of total area receiving manure.
Table 7.2 Proportion of area (%) of individual crops receiving manure (from Goodlass
et al., 2004), excluding excreta directly deposited by grazing animals
Crop % area Crop % area
Spring Wheat 10 Leafy forage crops 69
Winter Wheat 14 Arable silage/other fodder crop 39
Spring Barley 25 Peas - human consumption 4
Winter Barley 17 Peas - animal consumption 18
Oats 15 Beans - animal consumption 10
Rye/Triticale 38 Vegetables (brassicae) 21
Seed potatoes 40 Vegetables (other) 8
Early potatoes 21 Soft Fruit 0
2nd Early/Maincrop potatoes 28 Top Fruit 2
Sugar Beet 27 Other tillage 16
Spring oilseed rape 22 All tillage 18
Winter oilseed rape 7 Grass under 5 years 46
Linseed 2 Grass 5 years and over 41
Forage maize 88 All grass 42
Rootcrops for stockfeed 63 All crops and grass 31
Combining these statistics with the unit cost of the application of mitigation measures then
allowed an estimate of the total cost of the measures scaled to the national level (Table 7.3).

34
Table 7.3 Costs of uptake of measures assuming (a) total compliance, (b) most likely compliance and (c) baseline level of uptake (£’000)
Assumes best uptake Expert estimates of uptake (WQ0106) Baseline
Mitigation method £/ha Uptake NVZ non NVZ Total Uptake NVZ non NVZ Total Uptake NVZ non NVZ Total
Fertiliser
recommendations -3.72 100% -£24,198 -£4,947 -£29,145 80% -£19,358 -£3,958 -£23,316 70% -£16,938 -£3,463 -£20,402
Manure management
plan -9.3 100% -£17,682 -£4,708 -£22,390 70% -£12,377 -£3,296 -£15,673 25% -£4,420 -£1,177 -£5,597
Cover crop 68.8 100% £33,760 £4,515 £38,275 80% £27,008 £3,612 £30,620 2% £675 £90 £765
Fertiliser spreader
calibration -14.2 100% -£92,368 -£18,885 -£111,253 80% -£73,894 -£15,108 -£89,003 10% -£9,237 -£1,889 -£11,125
N efficiency 2 100% £13,010 £2,660 £15,669 50% £6,505 £1,330 £7,835 0% £0 £0 £0
Extensive grass 769 2% £58,438 £5,254 £63,692 1% £29,219 £2,627 £31,846 0.5% £29,219 £2,627 £31,846
Minimum tillage 15.9 80% £48,331 £4,345 £52,676 70% £42,290 £3,802 £46,092 30% £18,124 £1,630 £19,754
Spring tillage 115 100% £56,430 £7,547 £63,977 80% £45,144 £6,038 £51,182 30% £16,929 £2,264 £19,193
Below recommended
rate 48.8 100% £185,420 £16,671 £202,092 90% £166,878 £15,004 £181,882 0% £0 £0 £0
Total £261,141 £12,452 £273,593 £211,414 £10,051 £221,465 £34,352 £82 £34,434

35
7.3 Assumptions and estimates
The assumptions were:
• Fertiliser recommendations, manure management plan and fertiliser calibration would all
bring a net benefit to the farm.
• Manure management plan only applicable to the area receiving manure (from Table 7.2).
• Cover crops only applicable to area of spring crops (Table 7.1).
• Similarly, spring tillage only applicable to area of spring crops.
• Minimal tillage; not applicable to all soils because of soil texture constraints; assumed that
only 60% of the area would be suitable for minimal tillage.
Table 7.3 presents three sets of costs:
• The cost of all appropriate land adopting the measures: note that for extensive grassland
conversion, the maximum was set at 2% of the arable area. This was because this would
be impracticable to adopt on a large area.
• The cost of likely maximum uptake, based on expert judgement of farm practices (reported
in Defra report WQ0106: Anthony et al., 2006).
• The ‘baseline’ costs of uptake, based on assumptions about the level of uptake of each
measure now.
Table 7.3 shows that the total cost of compliance is £274 million. Clearly, simply using ‘total
costs’ is an overestimate of additional costs of take up of measures, since a proportion of
farms are already using some of them (‘total costs’ assumes a move from zero uptake to
complete uptake). Thus, adjusting total costs for a baseline position (third set of columns in
Table 7.3) is a more realistic measure of costs. The cost of baseline uptake is relatively small
at £34 million and provides a total cost of compliance of £239 million.
Table 7.3, however, shows that the major cost of compliance would be the use of a 10% below
recommended N cap on fertiliser rates; a cost of £202 million for total compliance, zero at the
baseline.
If we consider that this measure is particularly stringent and least likely to be implemented in
practice, then the total annual costs decline considerably; a net cost of c. £71 million for the
remaining measures, or an additional £36 million after deducting the baseline.
Fertiliser calibration appears to offer a large net gain at the national level; £111 million
benefit. If we assume that this is the best possible outcome, and halve the benefit to avoid
providing too optimistic a view, this gives a benefit of c. £55 million after adjusting for the
baseline, i.e. increases the costs of compliance by c. £55 million (total £126 million - £34
million baseline = £92 million).
Thus, a broad estimate would be that the annual costs of implementing measures (excepting
the 10% N fertiliser reduction) would be of the order of £36 million - £92 million. A worst
case scenario would be a total cost of c. £240 million, however.

36
We have not included a cost of spring slurry application (shifting from autumn) because a cost
was not provided.
It is interesting to note that expert view from Defra project WQ0106 is that under the current
policy landscape, uptake of some of the measures would fall below 100%.
In terms of effectiveness, various projects have assessed the likely decrease in nitrate leaching
at the national level for England. Implementation of NVZ measures, for example, gave a
national effect of 2-7% reduction in nitrate loss (Defra, 2007). Shepherd et al. (2007)
suggested the effect of a suite of measures (i.e. beyond those included in this project) was a
decrease for England of 5%; however, this did not assume 100% uptake of measures (similar
levels were used to those estimated in project WQ0106 – ‘expert view’ in Table 7.3), and also
factored in a reduction in livestock numbers due to CAP reform.
Thus, the conclusion is that the overall effect on nitrate leaching would be a reduction of
<10% against the current baseline. Modelling within WAgriCo is suggesting a similar result.
7.4 Commentary
The national level costs of implementing the measures investigated in this report must be
interpreted as indicative only since they are based on a small sample of estimates from one
region of the country. In some cases there were too few farms where measures were relevant
to allow reliable cost estimates at micro level.
Nevertheless the procedure used by ADAS provides a route for raising local cost estimates
that is clear and consistent. The main problem is to estimate the number of farms (or area) on
which particular measures can be applied. ADAS calculate alternative assumptions about
uptake using the current baseline to get the net uptake. Greatest reliance can be placed on
expert judgment from previous studies. Given the caveats indicated above the method gives
order of magnitude costs that are in line with other estimates.
8 Conclusions
1. With a few exceptions the IGER/ADAS User Manual provides a reliable guide to the
2006 costs of implementing mitigation methods within a number of model farm
systems. It is less certain that it provides a sound basis for scaling up to catchment or
national levels. There is no mechanism for relating the systems to the real structure of
farming and the mitigation methods are costs with a ‘method-off’ baseline that leads to
potential overestimate of costs. Use of robust farm types for cost-effectiveness
analysis is recommended.
2. The manual gives little detail on the calculations and this does not facilitate either
comprehension or updating - an important consideration given recent changes in
commodity prices that would alter the relative cost-effectiveness of different measures
substantially.
3. Measures were generally assessed on a whole farm basis whereas additional partial
(per ha, per head) costing would have been helpful particularly for policy purposes.
The usefulness of the manual for policy purposes would have been increased if more
information on the variation in cost between farms were given. However, this would
be a demanding addition to the work.

37
4. The survey of farms provided information on the net costs farmers of implementing
mitigation methods. The mean costs of the different measures varied from zero (when
there was a net benefit from implementation) to £769 per ha of arable land converted
to extensive grassland. Three measures provided net benefits to farmers because
savings in fertiliser use exceeded the cost involved. These were: establishing
recommended fertilizer levels, manure management planning and calibrating fertilizer
distributors. The costs to farmers of implementing the other measures varied from
£2.0 per ha (N efficiency) to £15.9 per ha (minimum tillage) and £769 per ha
(conversion to extensive grass).
5. Assurance and environmental schemes made a small contribution to the
implementation of mitigation methods. All farmers in the sample were members of at
least one assurance scheme. These typically included soil sampling and fertiliser
management (and possibly manure management). Stewardship offered some scope for
mitigation through overwintering stubbles and headland conservation. No schemes
apart from set-aside directly pay farmers to reduce fertiliser levels or extensify
production on a significant scale.
6. Two types of supportive approach were costed. In the first (facilitator only) an adviser
is employed to provide environmental awareness through meetings, newsletters etc,
and indicate sources of specific services. To offer this service to 2000 farmers would
cost around £30 per farm. A more specialised approach offering services to a smaller
number of farmers was costed at £670 per farm.
7. Costs from the sample farms were scaled up to the pilot area catchments (665 farms).
The total cost of implementing all measures was £5.61m, without attributing any cost
to measures that gave farmers a net benefit (e.g. producing fertiliser
recommendations). This sum was dominated by the high costs of conversion to
extensive grassland and reducing fertiliser levels on arable land to 10% below
requirements. Including the supportive approach (facilitator only) increased costs by
£20,500.
8. ADAS derived costs at national level based on the farm level costs estimated in the
farm survey. With all measures applied, the net cost was around £240m per year. This
figure took into account the benefits which farmers derived from implementing the
measures. Reducing fertiliser by 10% was found to be very expensive to implement.
If this was excluded the aggregate cost fell to between £36 and £92m per year.

38
9 References
ADAS (2007). Impact of proposed NVZ Action Programme measures. ADAS report to
Defra – supporting paper D5 for the consultation on implementation of the Nitrates Directive
in England (July 2007).
Anthony, S.G. (2006). Cost and effectiveness of policy instruments for reducing diffuse
agricultural pollution. Defra Report, projects WQ0106 and ES0205, 119pp.
Cuttle, P. M., P. M. Haygarth, D.R. Chadwick P. Newell-Price, D. Harris, M.A. Shepherd,
B.J. Chambers and R. Humphrey (2007). An Inventory of Measures to Control Diffuse Water
Pollution from Agriculture. User Manual. Project ESO203. Report for Defra.
Goodlass, G. et al. (2004). To describe and review nitrogen and phosphorus inputs into
farming systems. Report for Defra.
Harris, D. (2008) private communication.
Lord, E.I. and Anthony, S.G. (2000). MAGPIE: A modelling framework for evaluating nitrate
losses at national and catchment scales. Soil Use and Management 16, 167-174.
IGER (2004). Cost curve of nitrate migration options. Report on Project NT2511 to Defra.
Nix, J. (2006). Farm Management Pocketbook. 36th
edition.
SAC (2007). The Farm Management Handbook 2007-2008. SAC Edinburgh.
Shepherd, M.A. et al. (2007). Baseline projections for agriculture and implications for
emissions to air and water. Report for Defra SFF 0601.
Shepherd, M., Haygarth, P., Harris, D., Newell-Price, P., Cuttle, S., Anthony, S., Chambers,
B. & Chadwick, D. (2006). Assessing the cost-effectiveness of integrated measures to
decrease loss of nitrate, phosphorus and faecal indicator organisms. In: Gairns, L., Crighton,
K. & Jeffrey, B. [eds] Proceedings of the SAC/SEPA Biennial Conference Agriculture and the
Environment, Managing Rural Diffuse Pollution, Edinburgh, April 2006, pp. 77-83.

39
Appendix 1
List of Methods to Control DWPA
Land use
1 Convert arable land to extensive grassland
Soil management
2 Establish cover crops in the autumn
3 Cultivate land for crop establishment in spring rather than autumn
4 Adopt minimal cultivation systems
5 Cultivate compacted tillage soils
6 Cultivate and drill across the slope
7 Leave autumn seedbeds rough
8 Avoid tramlines over winter
9 Establish in-field grass buffer strips
10 Loosen compacted soil layers in grassland fields
11 Maintain and enhance soil organic matter levels
12 Allow field drainage systems to deteriorate
Livestock management
13 Reduce overall stocking rates on livestock farms
14 Reduce the length of the grazing day or grazing season
15 Reduce field stocking rates when soils are wet
16 Move feed and water troughs at regular intervals
17 Reduce dietary N and P intakes
18 Adopt phase feeding of livestock
Fertiliser management
19 Use a fertiliser recommendation system
20 Integrate fertiliser and manure nutrient supply
21 Reduce fertiliser application rates

40
22 Do not apply P fertilisers to high P index soils
23 Do not apply fertiliser to high-risk areas
24 Avoid spreading fertiliser to fields at high-risk times
Manure management
25 Increase the capacity of farm manure (slurry) stores
26 Minimise the volume of dirty water produced
27 Adopt batch storage of slurry
28 Adopt batch storage of solid manure
29 Compost solid manure
30 Change from slurry to a solid manure handling system
31 Site solid manure heaps away from watercourses and field drains
32 Site solid manure heaps on concrete and collect the effluent
33 Do not apply manure to high-risk areas
34 Do not spread farmyard manure to fields at high-risk times
35 Do not spread slurry or poultry manure to fields at high-risk times
36 Incorporate manure into the soil
37 Transport manure to neighbouring farms
38 Incinerate poultry litter
Farm infrastructure
39 Fence off rivers and streams from livestock
40 Construct bridges for livestock crossing rivers and streams
41 Re-site gateways away from high-risk areas
42 Establish new hedges
43 Establish riparian buffer strips
44 Establish and maintain artificial (constructed) wetlands
from Cuttle et al. (2007).