Embed Size (px)
Citation preview
2 0 1 5 - 1 6 S C H O O L Y E A R
Michigan School Scorecards
Scorecard Overview
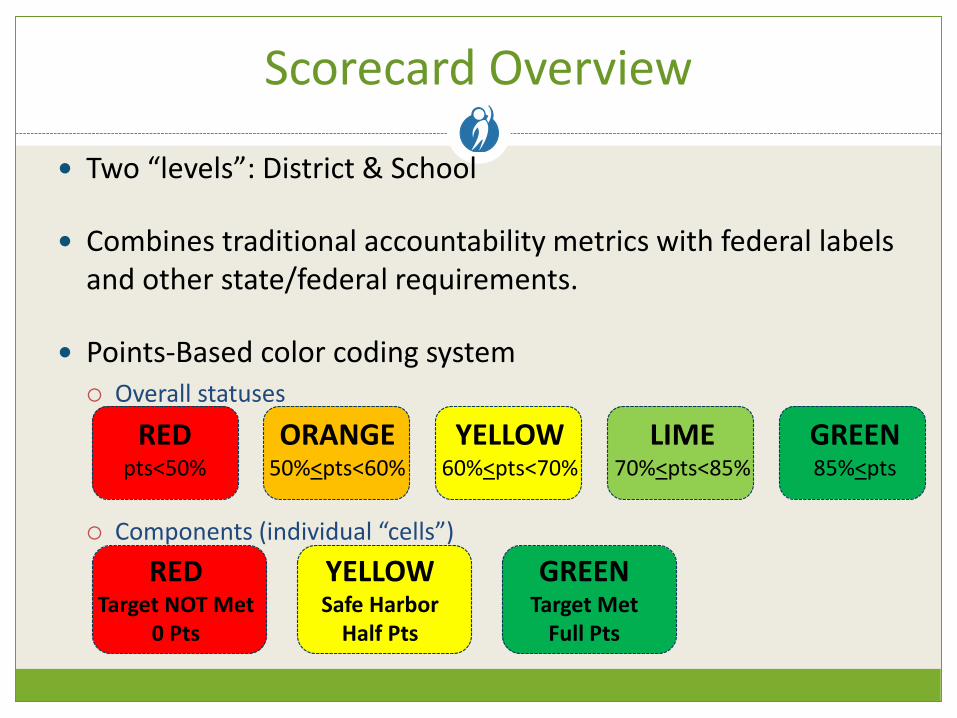
Two “levels”: District & School
Combines traditional accountability metrics with federal labels and other state/federal requirements.
Points-Based color coding system Overall statuses
Components (individual “cells”)
YELLOW GREENREDTarget NOT Met
0 PtsSafe Harbor
Half PtsTarget Met
Full Pts
REDpts<50%
ORANGE50%<pts<60%
YELLOW60%<pts<70%
LIME70%<pts<85%
GREEN85%<pts
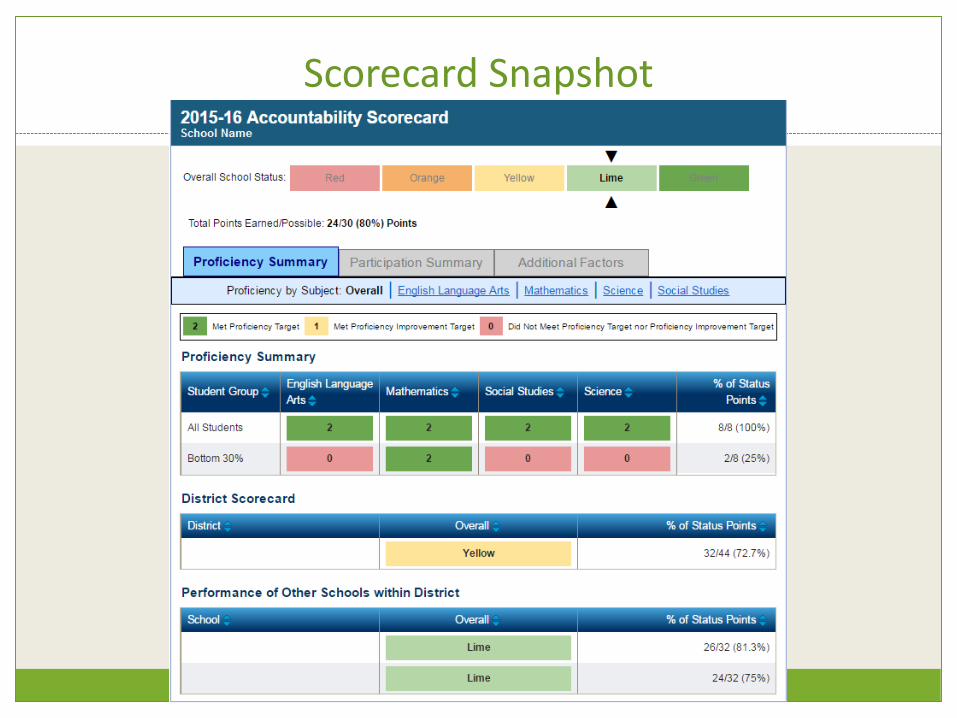
Scorecard Snapshot
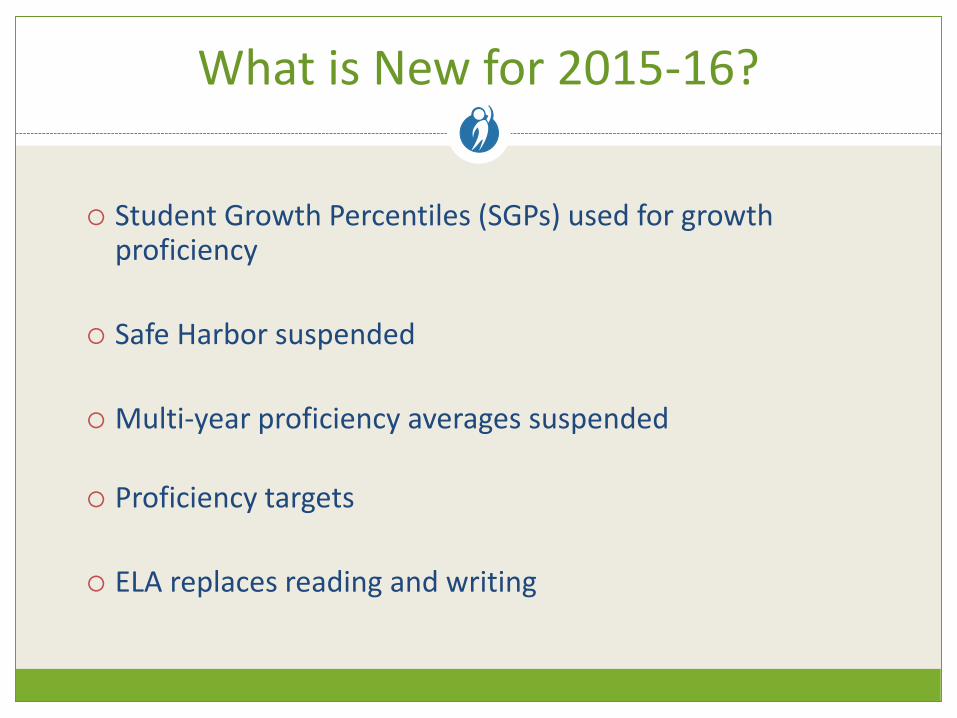
What is New for 2015-16?
Student Growth Percentiles (SGPs) used for growth proficiency
Safe Harbor suspended
Multi-year proficiency averages suspended
Proficiency targets
ELA replaces reading and writing
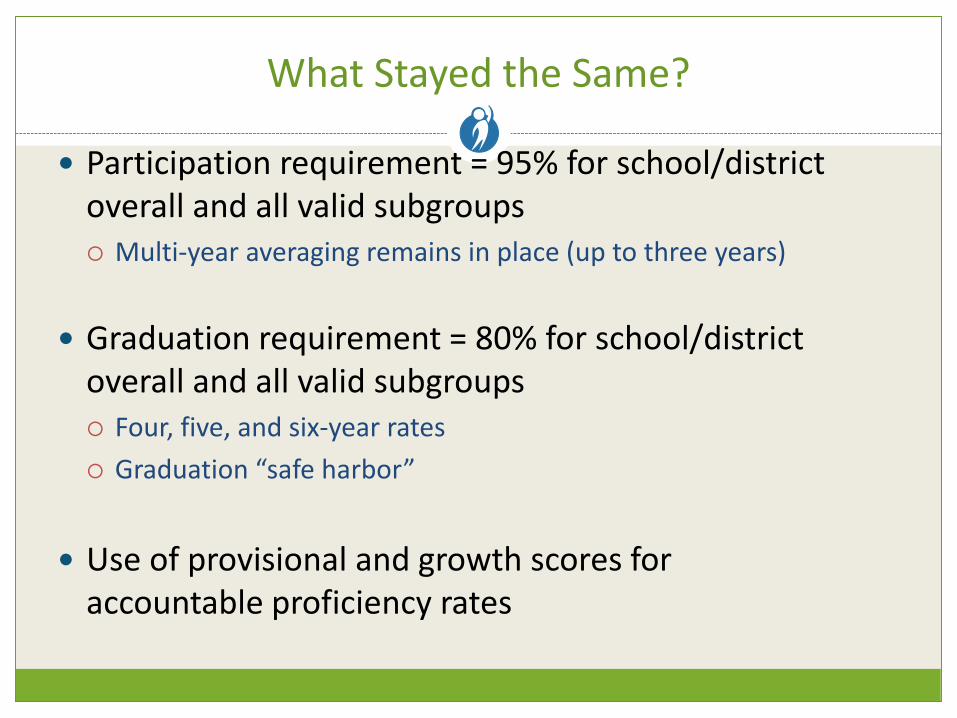
What Stayed the Same?
Participation requirement = 95% for school/district overall and all valid subgroups Multi-year averaging remains in place (up to three years)
Graduation requirement = 80% for school/district overall and all valid subgroups Four, five, and six-year rates
Graduation “safe harbor”
Use of provisional and growth scores for accountable proficiency rates
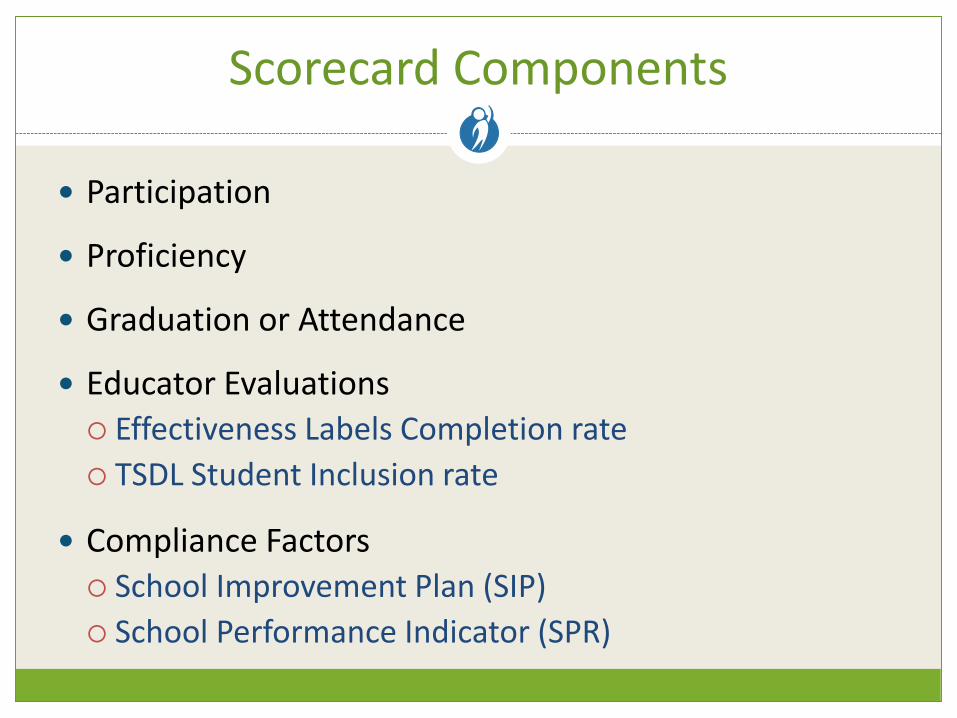
Scorecard Components
Participation
Proficiency
Graduation or Attendance
Educator Evaluations
Effectiveness Labels Completion rate
TSDL Student Inclusion rate
Compliance Factors
School Improvement Plan (SIP)
School Performance Indicator (SPR)
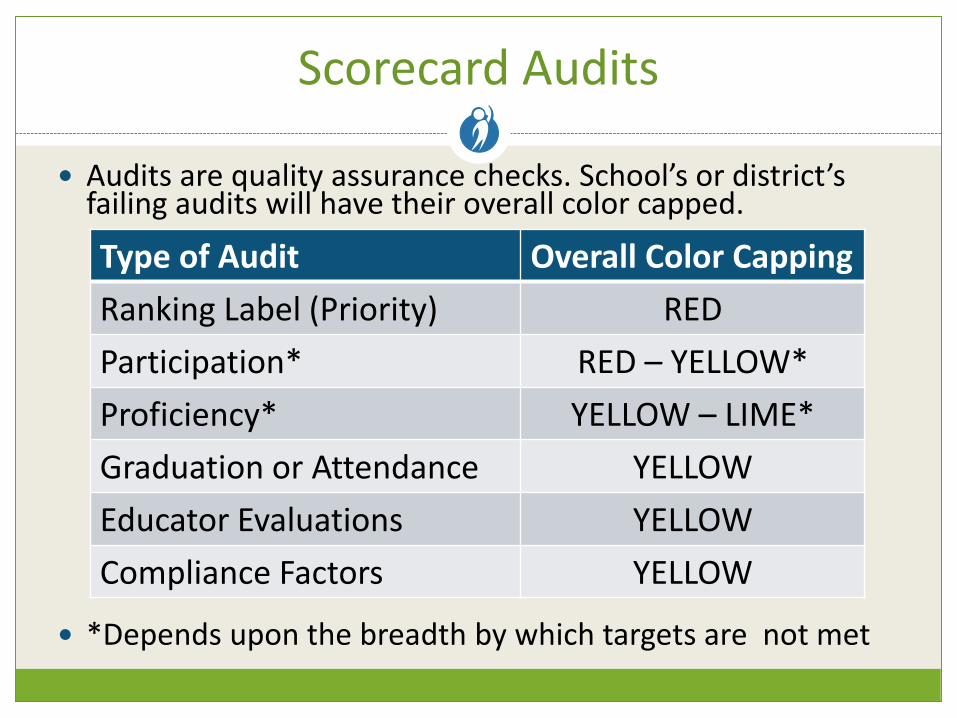
Scorecard Audits
Audits are quality assurance checks. School’s or district’s failing audits will have their overall color capped.
*Depends upon the breadth by which targets are not met
Type of Audit Overall Color Capping
Ranking Label (Priority) RED
Participation* RED – YELLOW*
Proficiency* YELLOW – LIME*
Graduation or Attendance YELLOW
Educator Evaluations YELLOW
Compliance Factors YELLOW
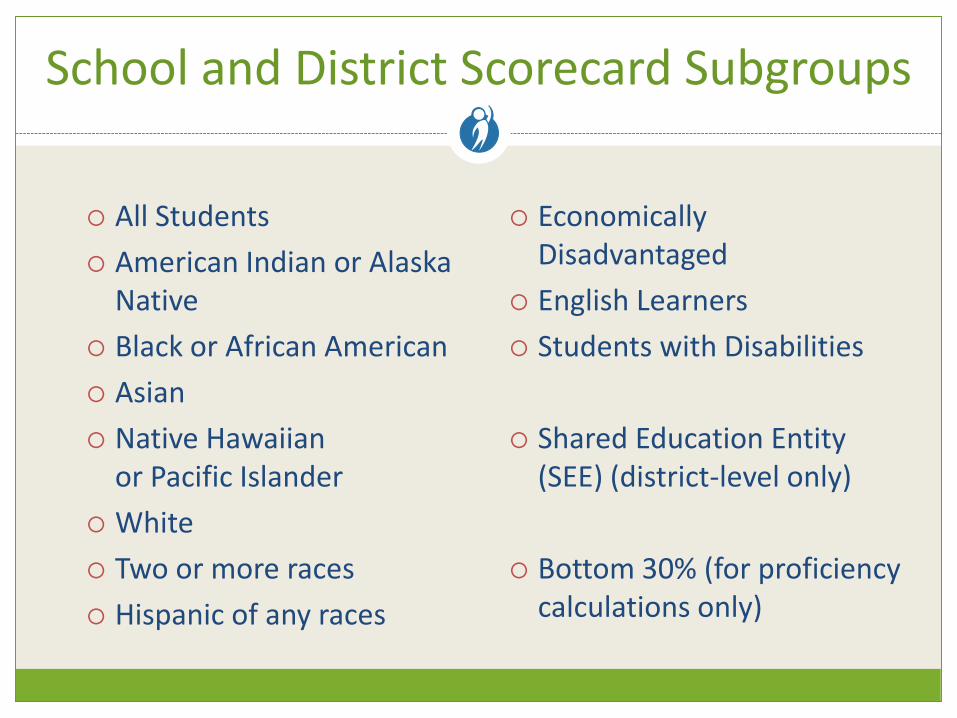
School and District Scorecard Subgroups
All Students
American Indian or Alaska Native
Black or African American
Asian
Native Hawaiian or Pacific Islander
White
Two or more races
Hispanic of any races
Economically Disadvantaged
English Learners
Students with Disabilities
Shared Education Entity (SEE) (district-level only)
Bottom 30% (for proficiency calculations only)
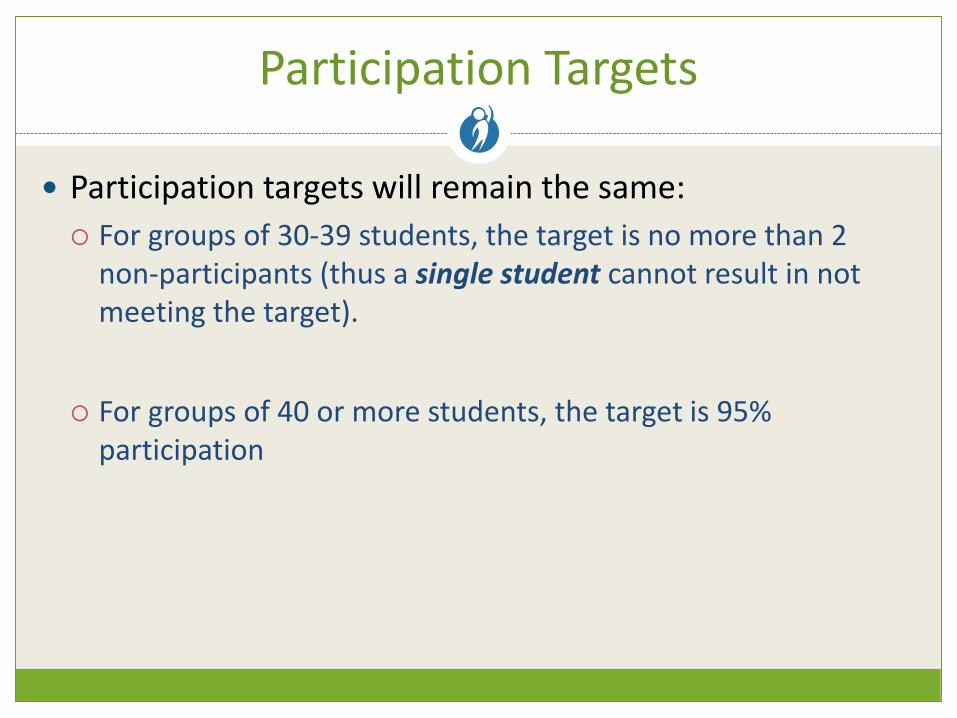
Participation Targets
Participation targets will remain the same:
For groups of 30-39 students, the target is no more than 2 non-participants (thus a single student cannot result in not meeting the target).
For groups of 40 or more students, the target is 95% participation
Participation
Participation targets are still a component of scorecard
Rounded to nearest hundredth (e.g., 95.24%)
Multi-year averaging to help meet targets
2 Possible color values: Green cell when target is met. Red cell when target is not met.
No points possible but can change overall color by audits: *Schools/Districts not meeting participation targets will have
their overall color capped at yellow, orange, or red depending on the breadth by which the targets were not met.
Proficiency Targets
Targets are based on 2015-16 proficiency rates: 2015-16 target is the greater of your school’s/district’s
2015-16 proficiency rate or 15%
Proficiency targets are set using top two performance levels (not Provisional or Growth Proficient)
Provisional and/or Growth Proficient will help you meet targets
Future targets will be determined by the system replacing scorecards and compliant with ESSA and aligned to the Top 10 in 10
Proficiency “Cell” Basics
Schools and districts will always have an “All Students” group, even with only one FAY student
All assessed content areas will have cells (ELA, Mathematics, Science, and Social Studies) WorkKeys is NOT part of the 2015-16 Scorecards
MI-Access Accessing Print and Expressing Ideas count towards ELA
All valid subgroups will have a proficiency cell with possible points
Districts will potentially have a SEE subgroup if they are a SEE member district with at least 30 FAY SEE students
Proficiency Cell Colors and Points
Green cell (2 points) if target is met
Red cell (0 points) if target is not met
Audit:
*Overall color capped at Lime if there are red proficiency cells in only the Bottom 30% and Yellow if in any other subgroup.
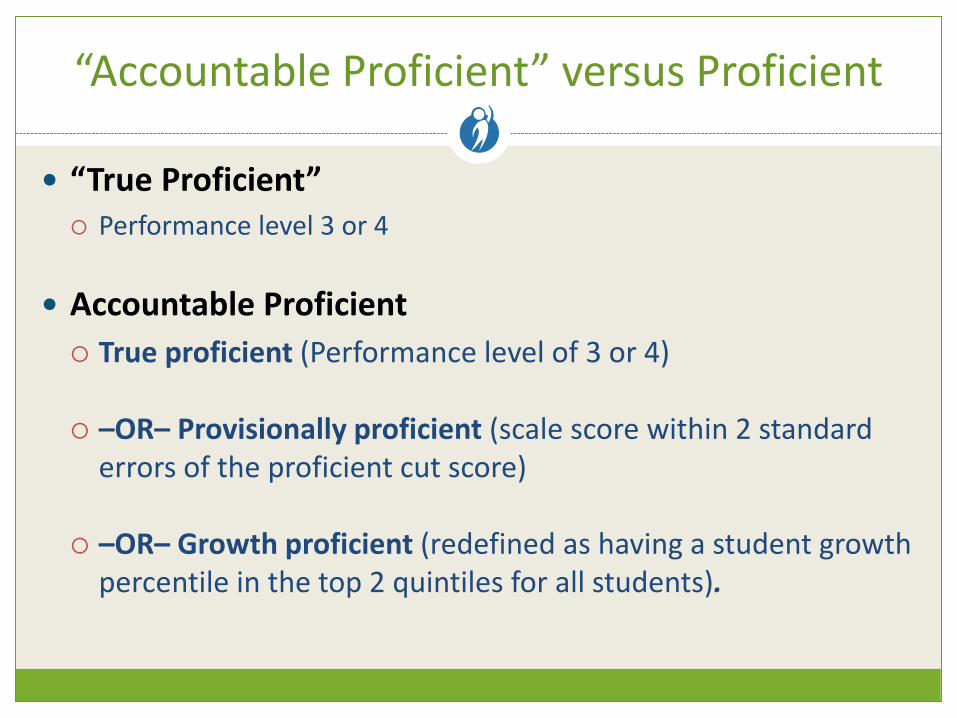
“Accountable Proficient” versus Proficient
“True Proficient” Performance level 3 or 4
Accountable Proficient
True proficient (Performance level of 3 or 4)
–OR– Provisionally proficient (scale score within 2 standard errors of the proficient cut score)
–OR– Growth proficient (redefined as having a student growth percentile in the top 2 quintiles for all students).
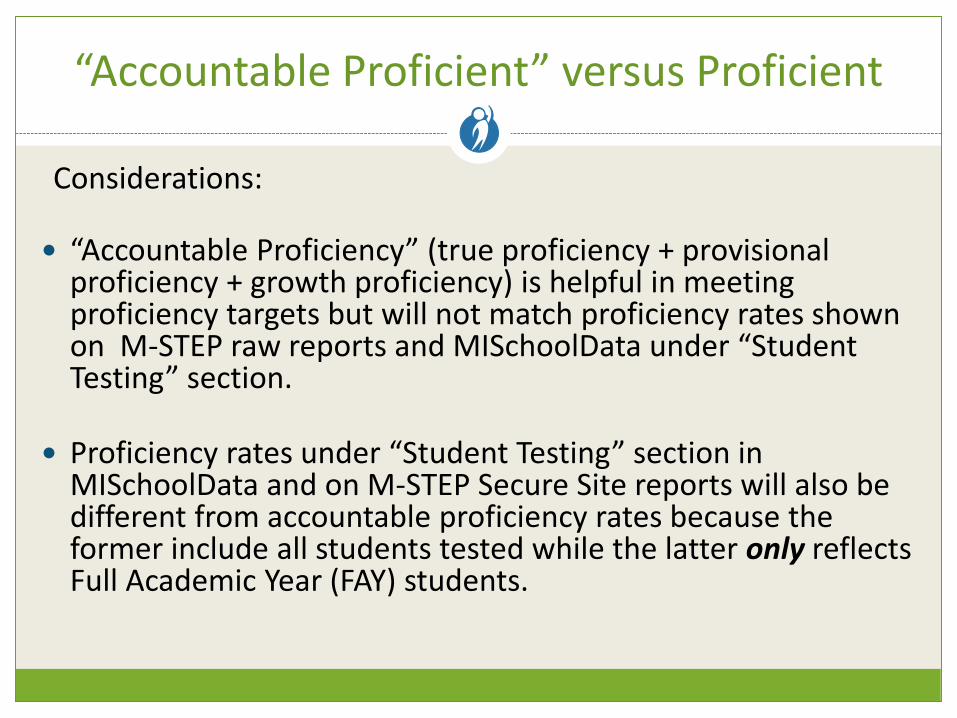
“Accountable Proficient” versus Proficient
Considerations:
“Accountable Proficiency” (true proficiency + provisional proficiency + growth proficiency) is helpful in meeting proficiency targets but will not match proficiency rates shown on M-STEP raw reports and MISchoolData under “Student Testing” section.
Proficiency rates under “Student Testing” section in MISchoolData and on M-STEP Secure Site reports will also be different from accountable proficiency rates because the former include all students tested while the latter only reflects Full Academic Year (FAY) students.
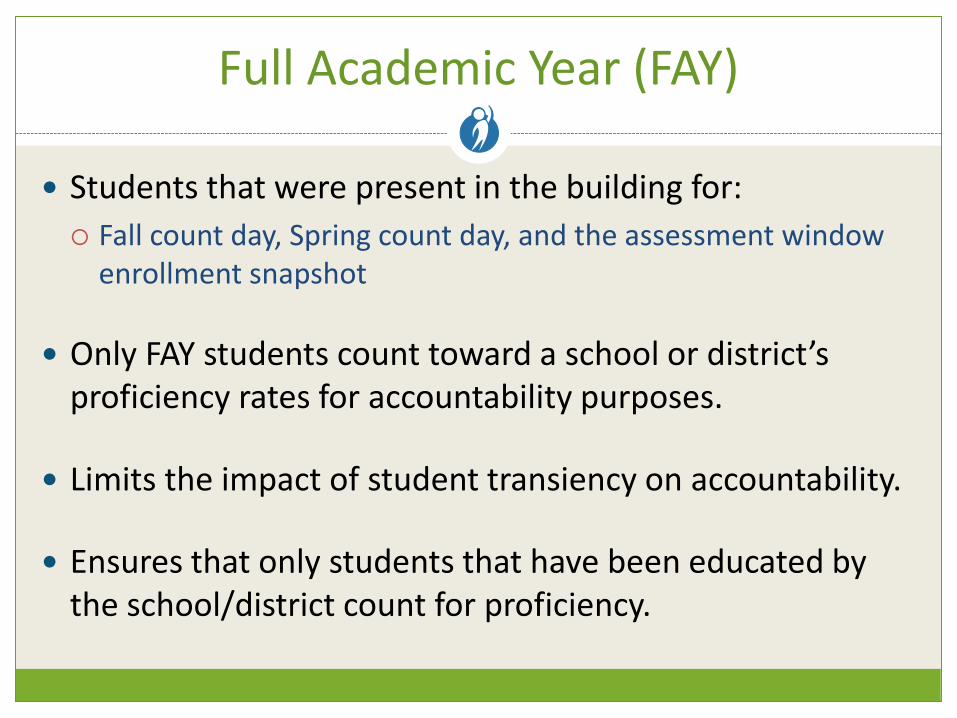
Full Academic Year (FAY)
Students that were present in the building for:
Fall count day, Spring count day, and the assessment window enrollment snapshot
Only FAY students count toward a school or district’s proficiency rates for accountability purposes.
Limits the impact of student transiency on accountability.
Ensures that only students that have been educated by the school/district count for proficiency.
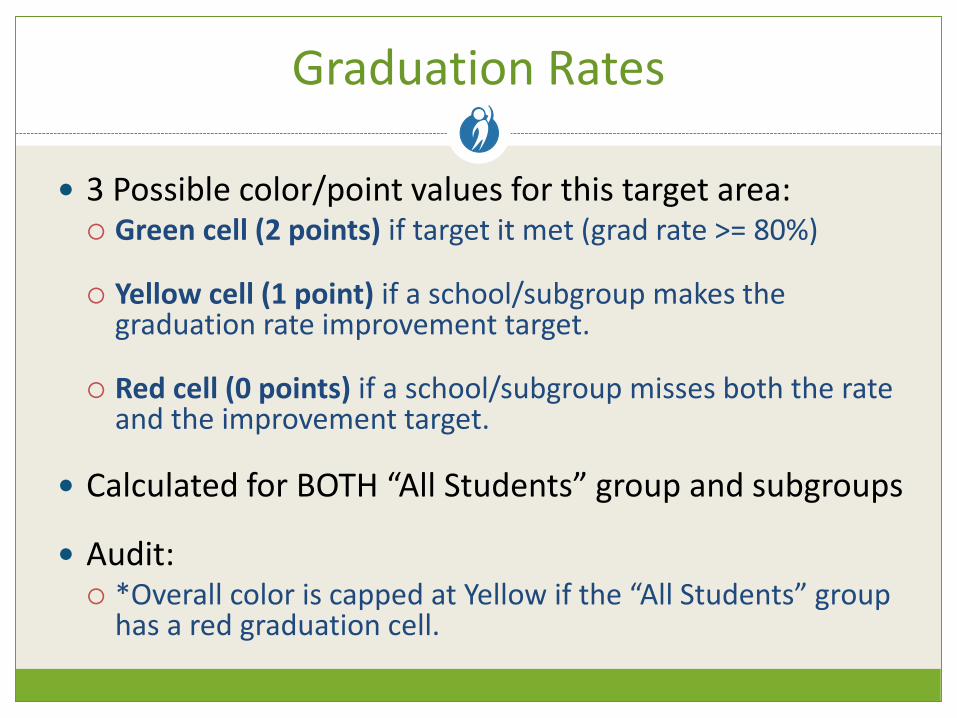
Graduation Rates
3 Possible color/point values for this target area: Green cell (2 points) if target it met (grad rate >= 80%)
Yellow cell (1 point) if a school/subgroup makes the graduation rate improvement target.
Red cell (0 points) if a school/subgroup misses both the rate and the improvement target.
Calculated for BOTH “All Students” group and subgroups
Audit: *Overall color is capped at Yellow if the “All Students” group
has a red graduation cell.
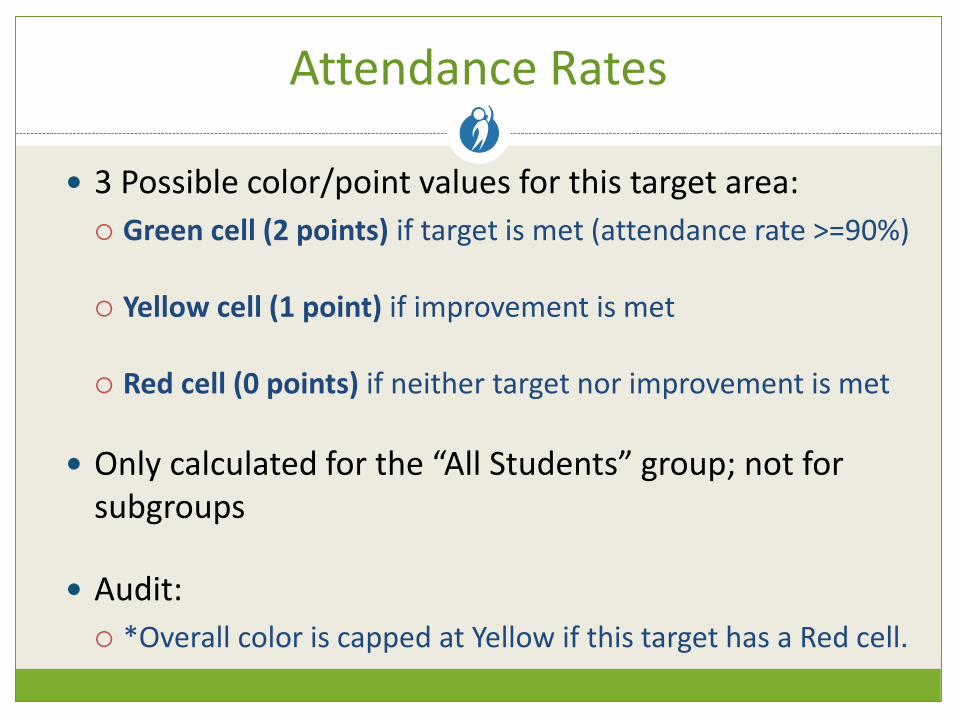
Attendance Rates
3 Possible color/point values for this target area:
Green cell (2 points) if target is met (attendance rate >=90%)
Yellow cell (1 point) if improvement is met
Red cell (0 points) if neither target nor improvement is met
Only calculated for the “All Students” group; not for subgroups
Audit:
*Overall color is capped at Yellow if this target has a Red cell.
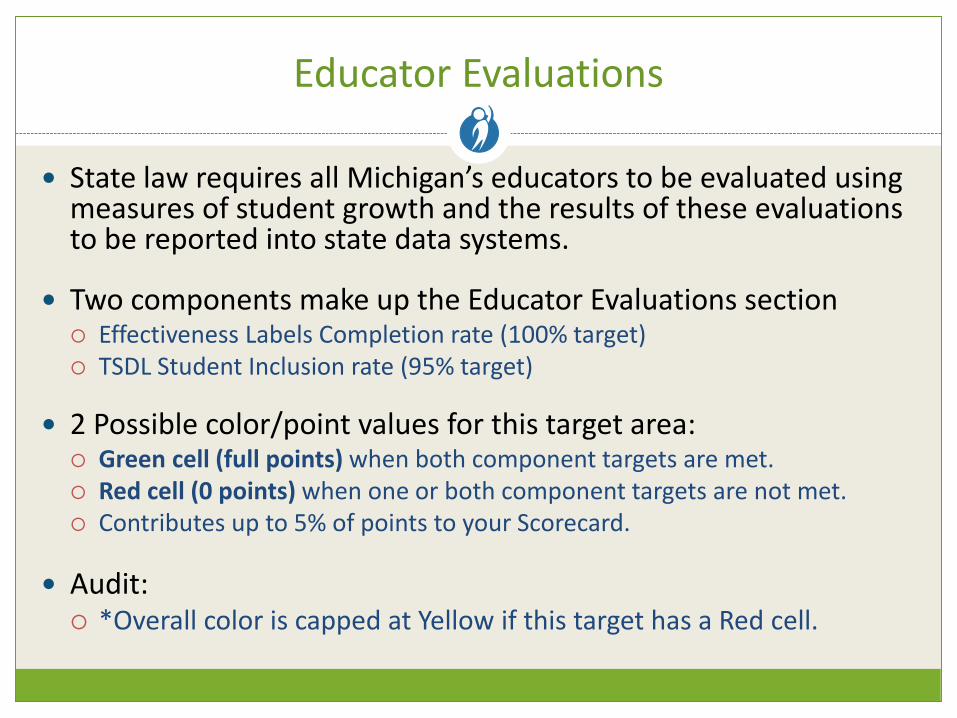
Educator Evaluations
State law requires all Michigan’s educators to be evaluated using measures of student growth and the results of these evaluations to be reported into state data systems.
Two components make up the Educator Evaluations section Effectiveness Labels Completion rate (100% target) TSDL Student Inclusion rate (95% target)
2 Possible color/point values for this target area: Green cell (full points) when both component targets are met. Red cell (0 points) when one or both component targets are not met. Contributes up to 5% of points to your Scorecard.
Audit: *Overall color is capped at Yellow if this target has a Red cell.
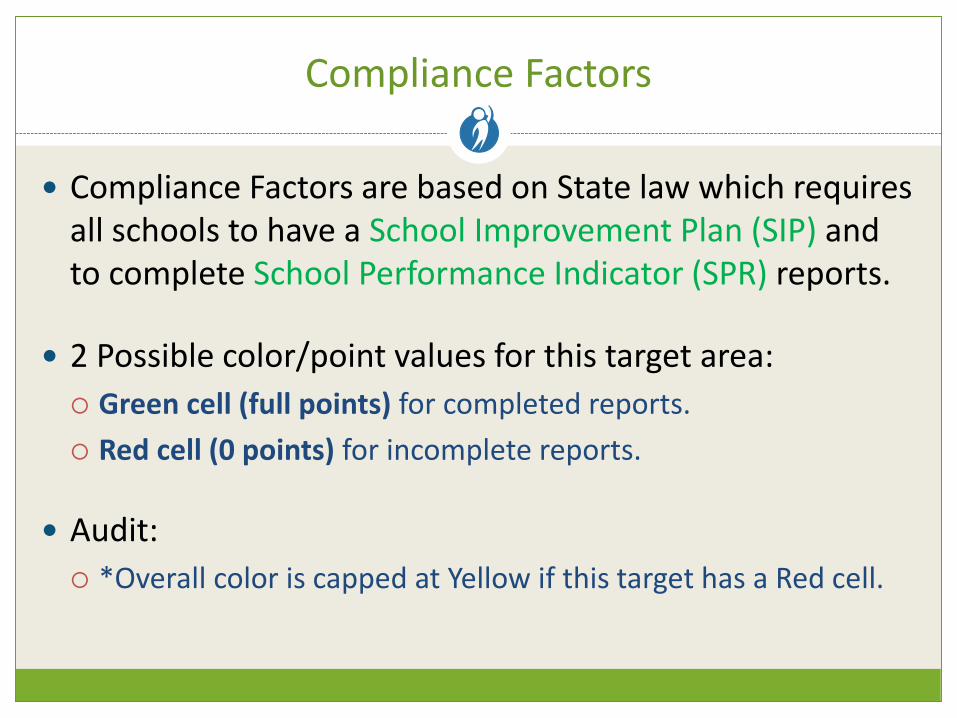
Compliance Factors
Compliance Factors are based on State law which requires all schools to have a School Improvement Plan (SIP) and to complete School Performance Indicator (SPR) reports.
2 Possible color/point values for this target area:
Green cell (full points) for completed reports.
Red cell (0 points) for incomplete reports.
Audit:
*Overall color is capped at Yellow if this target has a Red cell.
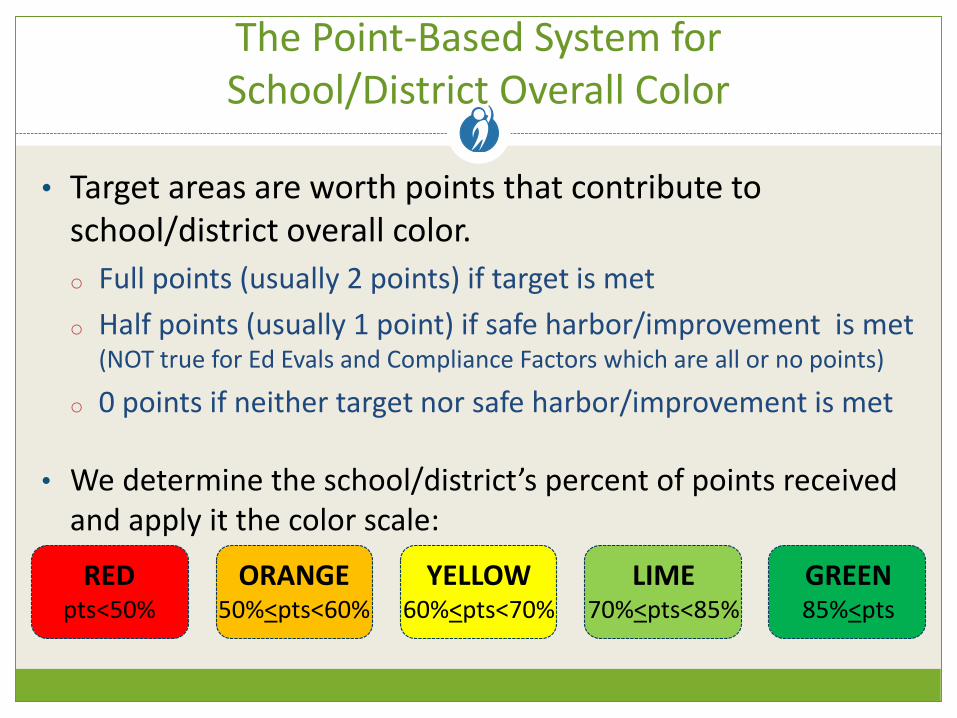
The Point-Based System for School/District Overall Color
• Target areas are worth points that contribute to school/district overall color.
o Full points (usually 2 points) if target is met
o Half points (usually 1 point) if safe harbor/improvement is met (NOT true for Ed Evals and Compliance Factors which are all or no points)
o 0 points if neither target nor safe harbor/improvement is met
• We determine the school/district’s percent of points received and apply it the color scale:
REDpts<50%
ORANGE50%<pts<60%
YELLOW60%<pts<70%
LIME70%<pts<85%
GREEN85%<pts
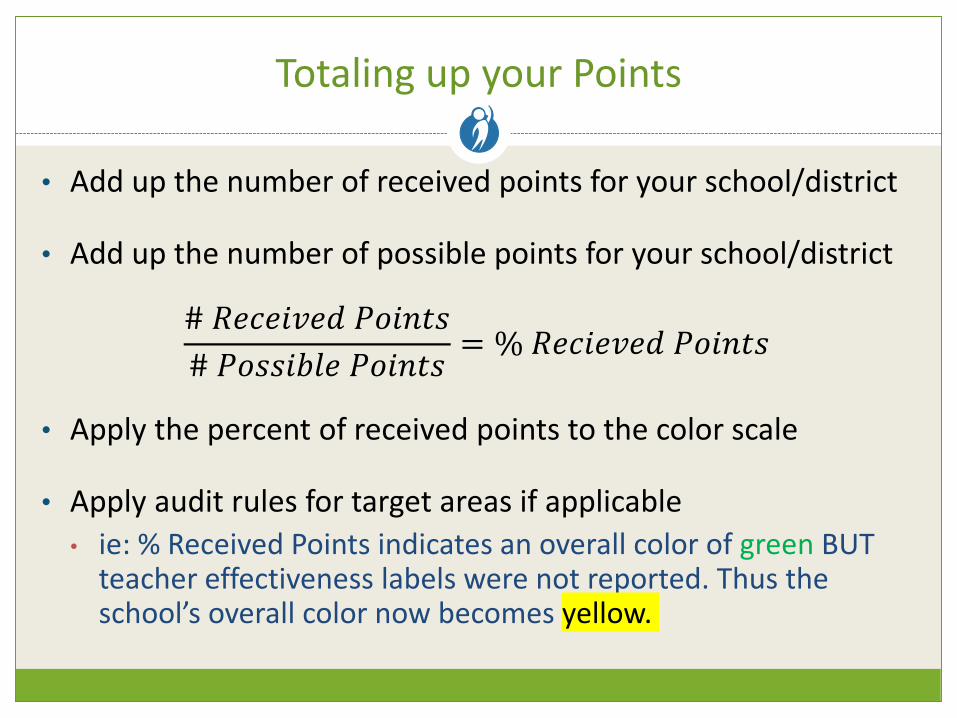
Totaling up your Points
• Add up the number of received points for your school/district
• Add up the number of possible points for your school/district
# 𝑅𝑒𝑐𝑒𝑖𝑣𝑒𝑑 𝑃𝑜𝑖𝑛𝑡𝑠
# 𝑃𝑜𝑠𝑠𝑖𝑏𝑙𝑒 𝑃𝑜𝑖𝑛𝑡𝑠= % 𝑅𝑒𝑐𝑖𝑒𝑣𝑒𝑑 𝑃𝑜𝑖𝑛𝑡𝑠
• Apply the percent of received points to the color scale
• Apply audit rules for target areas if applicable
• ie: % Received Points indicates an overall color of green BUT teacher effectiveness labels were not reported. Thus the school’s overall color now becomes yellow.
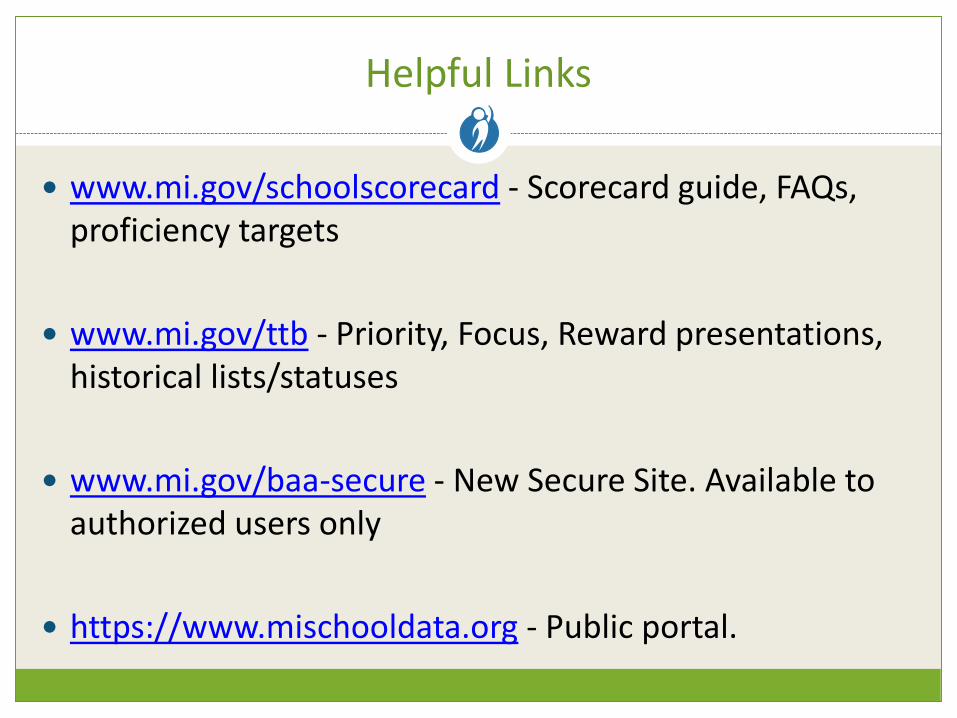
www.mi.gov/schoolscorecard - Scorecard guide, FAQs, proficiency targets
www.mi.gov/ttb - Priority, Focus, Reward presentations, historical lists/statuses
www.mi.gov/baa-secure - New Secure Site. Available to authorized users only
https://www.mischooldata.org - Public portal.
Helpful Links