Embed Size (px)
Citation preview

◆
◆
◆
◆
◆
◆
◆
◆
◆
◆
◆
◆
◆
◆
◆
◆
◆
Michigan School FinanceUnder Proposal A
State Control, Local Consequences

◆
◆
◆
◆
◆
◆
◆
◆
◆
◆
◆
◆
◆
◆
◆
◆
◆
◆
◆
◆
◆
◆
MichiganSchool FinanceUnder Proposal A
State Control, Local Consequences
David ArsenProfessor of
Educational AdministrationCollege of Education
Michigan State University
David N. PlankProfessor and Co-DirectorThe Education Policy CenterMichigan State University
November, 2003


EXECUTIVE SUMMARY
The changes produced by Proposal A have transformed Michigan’s public school system. On balance, these changes have been decidedlypositive. Proposal A led to a significant reduction in property taxes, while simultaneously reducing inequities in the resources provided forMichigan schools.
Proposal A also marks an unprecedented shift of power in Michigan’seducation system, from local communities to state officials. In the past, local citizens and educators played the leading role in decisions about schoolfunding. Now the key actors are state legislators. Local authorities have lost the power to respond to local demands for more (or less) spending on schools. Instead they must look to Lansing.
The financial framework defined by Proposal A provides a sound basis forcontinued improvement in Michigan’s education system, but this does notmean that our state’s school finance policies cannot be improved. After 10years, there are increasing strains in Michigan’s school finance system, whichshould be addressed at the state level.
◆ Proposal A has slowed the growth of total revenue available to Michigan’s public schools.
• After adjusting for inflation, statewide per-pupil revenue increased by13 percent between 1994 and 2002. Compared to the 1980–1994 period,the pace of annual real revenue growth since the passage of Proposal Ahas been cut by nearly half.
• The revenues earmarked for the School Aid Fund under Proposal Ahave never been adequate to satisfy the promises that the Legislaturehas made to Michigan’s public schools. To make up the difference, thestate has transferred an average of more than $500 million per year fromthe state’s General Fund to the SAF. The current structural deficit in theGeneral Fund will make it extremely difficult for the Legislature tocontinue transfers at this level.
◆ Proposal A has affected different school districts in different ways.
The amount of money that the state allocates to each local school district depends on two main factors: the value of the district’s per-pupilfoundation allowance, and the number of pupils enrolled in the district’s schools.
• Most rural districts are better off under Proposal A, because their per-pupil foundation allowance has increased dramatically. Some ruraldistricts are worse off, however, because big enrollment declines haveoverwhelmed increases in the per-pupil foundation allowance.
• Most suburban districts are also better off, because rapidly risingenrollment has compensated for relatively slow growth in the per-pupil foundation allowance. In some lucky suburban districts thefoundation allowance and enrollments have both increasedsignificantly. i
◆ ◆ ◆ ◆ ◆ ◆ ◆ ◆ ◆ ◆ ◆ ◆ ◆ ◆ ◆ ◆ ◆ ◆ ◆ ◆ ◆ ◆ ◆ ◆ ◆ ◆ ◆ ◆

• Most central city and low-income suburban districts are worse off underProposal A, because slow growth in the per-pupil foundation allowancehas been accompanied by falling enrollments.
• The real value of every district’s foundation allowance has declinedin each of the last two years. This trend will be difficult to halt in2004–2005.
◆ Proposal A creates a mismatch between the revenues that the state pro-vides to school districts and charter schools and the costs that they face.
• Michigan’s school funding system provides no compensation forregional cost of living differences, nor is state funding adequatelyadjusted to reflect differences in the cost of educating special needs students.
• Proposal A diminishes the services available to children in declining-enrollment districts, because revenues in these districts fall significantlymore rapidly than costs.
Policy RecommendationsOur recommendations are aimed at preserving the gains that have beenaccomplished under Proposal A, in the face of growing local pressure for change.
1. Avoid further declines in the real value of foundation allowances.The Legislature should take steps to ensure the stability and adequacyof revenues earmarked for the School Aid Fund. The best way to do thiswould be for the state to increase the state education property tax, and toearmark these revenues for the SAF. This change could eliminate the needfor annual General Fund transfers to the SAF, and make education fundingless vulnerable to cyclical changes in Michigan’s economy.
2. Fair and efficient funding should reflect differences in educational costs.Schools facing higher costs must overcome an immediate disadvantage intheir efforts to educate children to meet ambitious state performancestandards. The Legislature should ensure that the basis for distributingrevenues to schools and school districts reflects the actual cost of educatingdifferent students.
3. Students should not be harmed when other children leave their schools.The precipitous revenue declines that now accompany falling enrollmentsare damaging the quality of education in many school districts. Thefinancial burden that accompanies these declines must be distributed over a longer period, in order to give schools an opportunity to adjust to reducedrevenues in a more deliberate and effective way. The Legislature has alreadymodified Proposal A to provide small declining-enrollment rural districtswith transitional support. This support should be extended to all declining-enrollment districts.
These proposals reinforce one another. Without additional revenuesearmarked for the SAF, there is little chance of addressing decliningenrollment and cost differentials in school funding. Similarly, unless the problems of declining enrollment and cost differentials are addressed,it is unlikely that additional SAF revenue will be allocated to the mostpressing educational needs.ii
Michigan School Finance Under Proposal A ◆ ◆ ◆ ◆ ◆ ◆ ◆ ◆ ◆ ◆ ◆ ◆ ◆ ◆ ◆ ◆ ◆ ◆ ◆ ◆ ◆ ◆ ◆ ◆ ◆ ◆ ◆ ◆

TABLE OF CONTENTS
I. Introduction . . . . . . . . . . . . . . . . . . . . . 1
II. Proposal A andMichigan School Finance . . . . . . . . . . 3
III.Measuring the Impact of Proposal A . . . . . . . . . . . . . . . . . . . 13
IV. Current Issues in School Finance Policy . . . . . . . . . . . . 35
V. Conclusion: Preserving Proposal A . . . . . . . . . . . 49
Further Reading . . . . . . . . . . . . . . . . . . . 53
AppendixData Sources and Methods . . . . . . . . . . . . . . . . . 55
iii
State Control, Local Consequences◆ ◆ ◆ ◆ ◆ ◆ ◆ ◆ ◆ ◆ ◆ ◆ ◆ ◆ ◆ ◆ ◆ ◆ ◆ ◆ ◆ ◆ ◆ ◆ ◆ ◆ ◆ ◆

iv
Michigan School Finance Under Proposal A ◆ ◆ ◆ ◆ ◆ ◆ ◆ ◆ ◆ ◆ ◆ ◆ ◆ ◆ ◆ ◆ ◆ ◆ ◆ ◆ ◆ ◆ ◆ ◆ ◆ ◆ ◆ ◆
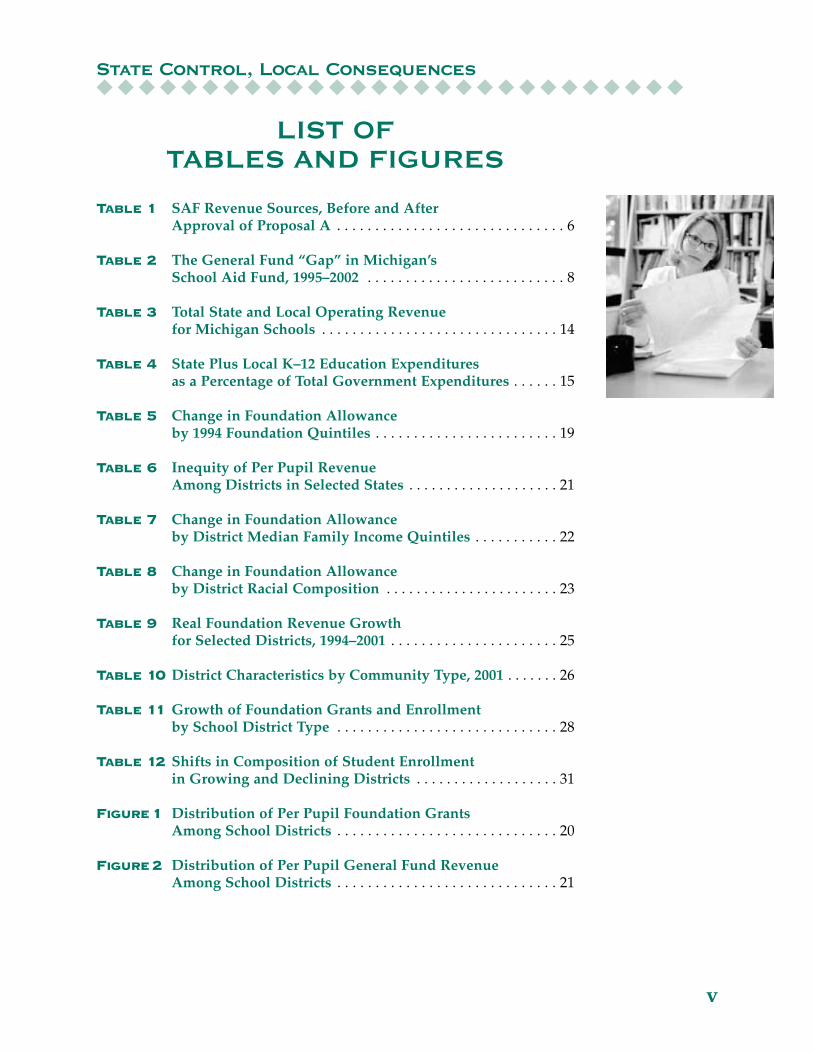
LIST OF TABLES AND FIGURES
Table 1 SAF Revenue Sources, Before and After Approval of Proposal A . . . . . . . . . . . . . . . . . . . . . . . . . . . . . . 6
Table 2 The General Fund “Gap” in Michigan’s School Aid Fund, 1995–2002 . . . . . . . . . . . . . . . . . . . . . . . . . . 8
Table 3 Total State and Local Operating Revenue for Michigan Schools . . . . . . . . . . . . . . . . . . . . . . . . . . . . . . . 14
Table 4 State Plus Local K–12 Education Expenditures as a Percentage of Total Government Expenditures . . . . . . 15
Table 5 Change in Foundation Allowance by 1994 Foundation Quintiles . . . . . . . . . . . . . . . . . . . . . . . . 19
Table 6 Inequity of Per Pupil Revenue Among Districts in Selected States . . . . . . . . . . . . . . . . . . . . 21
Table 7 Change in Foundation Allowance by District Median Family Income Quintiles . . . . . . . . . . . 22
Table 8 Change in Foundation Allowance by District Racial Composition . . . . . . . . . . . . . . . . . . . . . . . 23
Table 9 Real Foundation Revenue Growth for Selected Districts, 1994–2001 . . . . . . . . . . . . . . . . . . . . . . 25
Table 10 District Characteristics by Community Type, 2001 . . . . . . . 26
Table 11 Growth of Foundation Grants and Enrollment by School District Type . . . . . . . . . . . . . . . . . . . . . . . . . . . . . 28
Table 12 Shifts in Composition of Student Enrollment in Growing and Declining Districts . . . . . . . . . . . . . . . . . . . 31
Figure1 Distribution of Per Pupil Foundation Grants Among School Districts . . . . . . . . . . . . . . . . . . . . . . . . . . . . . 20
Figure2 Distribution of Per Pupil General Fund Revenue Among School Districts . . . . . . . . . . . . . . . . . . . . . . . . . . . . . 21
v
State Control, Local Consequences◆ ◆ ◆ ◆ ◆ ◆ ◆ ◆ ◆ ◆ ◆ ◆ ◆ ◆ ◆ ◆ ◆ ◆ ◆ ◆ ◆ ◆ ◆ ◆ ◆ ◆ ◆ ◆

vi
Michigan School Finance Under Proposal A ◆ ◆ ◆ ◆ ◆ ◆ ◆ ◆ ◆ ◆ ◆ ◆ ◆ ◆ ◆ ◆ ◆ ◆ ◆ ◆ ◆ ◆ ◆ ◆ ◆ ◆ ◆ ◆

IINTRODUCTION
In March 1994 Michigan voters approved a dramatic change in the way our state funds its schools. Proposal A shifted the main source ofeducation revenues from the local property tax to the state sales tax. The financing shift was accompanied by a shift in administrative andpolicy-making control to the state level. Decisions once made by localvoters and local officials are now made by the Michigan Legislature. The changes produced by Proposal A have transformed Michigan’spublic school system.
In this report we review the changes that Proposal A has brought aboutin the level and distribution of educational revenues in Michigan, and we ask how these changes have affected local school districts. In thefollowing chapter we review the political background to Proposal A, and explain how Proposal A works. We provide data on how theadoption of Proposal A has affected the revenues available to Michiganschools in the third chapter. The data confirm that school spendingincreased in Michigan in the years immediately following the adoptionof Proposal A, and that Proposal A has made the distribution of revenuesacross Michigan school districts more equitable. Proposal A has notproduced gains for all school districts, however. Some have experiencedlarge revenue increases since 1994, but others have not. A growingnumber have experienced significant revenue losses.
Our analysis reveals two critical problems in the way Michigan nowfunds its schools, which we discuss in Chapter IV. First, Proposal A failsto ensure either fiscal stability or financial adequacy for Michiganschools. The revenue base for the state’s School Aid Fund (SAF) isdangerously vulnerable to cyclical fluctuations in the economy. Revenuefrom sales and income taxes generally fall when the economy goes intorecession. Because the SAF relies so heavily on sales and income taxes,economic downturns can lead to rapid declines in the revenues available for schools.
The research on which this report is based was partly funded by the state-supported MichiganApplied Public Policy Research Program at Michigan State University. The conclusions expressed inthe report are the authors’ own, and do not necessarily reflect the views of funders or of MichiganState University. We wish to express our special thanks to Yongmei Ni, who provided invaluableassistance in assembling and analyzing the empirical databases for this project, and to JeanniePatrick and Chris Reimann for their help with the editing and production of the report. We also wishto acknowledge the assistance and comments that we have received from colleagues and friends,including Tom Clay, Doug Drake, Phil Kearney, Bob Kleine, and Glenda Rader. Their generosity hasmade the report far better than it would otherwise have been. Responsibility for any remainingerrors of fact or interpretation is ours alone. 1
State Control, Local Consequences◆ ◆ ◆ ◆ ◆ ◆ ◆ ◆ ◆ ◆ ◆ ◆ ◆ ◆ ◆ ◆ ◆ ◆ ◆ ◆ ◆ ◆ ◆ ◆ ◆ ◆ ◆ ◆

In addition, the revenues earmarked for the SAF have never been adequateto satisfy the promises that the Legislature has made to Michigan’s public school system. The Legislature has supported growth in educationspending by supplementing SAF revenues with annual appropriationsfrom the General Fund and other sources. The “General Fund gap” in the SAF has averaged more than $500 million per year since the adoptionof Proposal A, even during the economic boom in the late 1990s. Theemergence of a structural deficit in the General Fund and the exhaustion of one-time revenue sources means that future contributions to the SAF from general state revenues are doubtful at best. Michigan schoolstherefore face the prospect of significant and sustained funding reductions,even as their costs continue to grow.
The second critical problem is a potentially serious mismatch betweenthe revenues that the state provides to school districts and charterschools1 and the costs that they face. This problem has two keydimensions. On the one hand, Proposal A imposes a financial burden on districts where enrollment is declining, because their revenues fallsignificantly more rapidly than their costs. On the other hand, thefoundation allowance that the state provides to school districts is notadjusted to reflect differences in the cost of educating different students,which diminishes the efficiency of Michigan’s emerging market forschooling. The failure to strike a better balance between revenues andcosts poses an increasingly serious problem for many school districts and charter schools, including those facing the most severe challenges in Michigan’s education system.
The tenth anniversary of Proposal A’s passage is approaching, whichpresents a good opportunity to take stock of its impacts. In our view,Proposal A has accomplished the key goals that it was intended to address. It has produced substantial benefits for Michigan taxpayers, and it has promoted more uniform funding across local school districts.Reversing course on the key features of Proposal A would make many of the problems facing Michigan’s public school system worse, not better. We nevertheless argue that successfully addressing the critical problemsidentified above will require significant changes in the way Michiganfunds its schools. In the fourth chapter of the report we propose strategiesthat would make Proposal A work better for all Michigan students.
2
Michigan School Finance Under Proposal A ◆ ◆ ◆ ◆ ◆ ◆ ◆ ◆ ◆ ◆ ◆ ◆ ◆ ◆ ◆ ◆ ◆ ◆ ◆ ◆ ◆ ◆ ◆ ◆ ◆ ◆ ◆ ◆
1 Charter schools are funded in the same way as traditional school districts under Proposal A. References to “school districts” in this report should be understood to apply equally to charter schools.

IIPROPOSAL A AND MICHIGAN
SCHOOL FINANCE
Political Background to Proposal A
Before 1994, Michigan relied very heavily on local property taxes to fund schools. More than 60 percent of education revenues came fromlocal sources, with the remainder provided by the state and federalgovernments. As a result, Michigan property taxes were among thehighest in the nation.
Reliance on local property taxes produced wide and growing inequitiesamong Michigan school districts. Districts with lots of property wealthwere able to provide lavish support for local schools while keepingproperty tax rates low. In contrast, property-poor school districts wereobliged to tax themselves at higher rates to raise smaller amounts of revenue.
The property tax burden emerged as a major political issue in Michigan in the 1970s. The Milliken and Blanchard administrations developed aseries of ballot initiatives aimed at changing the school finance system and reducing the property taxes paid by Michigan citizens. The votersdefeated all of these initiatives at the polls. Between 1972 and 1990,Michigan voters rejected four different ballot proposals aimed at reducingproperty taxes. Efforts to accomplish the same goal through legislation or litigation were equally unsuccessful.
When John Engler ran for Governor in 1990, one of his key campaignpromises was a pledge to reduce property taxes by 20 percent. Followinghis election he put forward a new ballot initiative, which was opposed bythe Michigan Education Association (MEA) and other education groups.The voters soundly defeated Proposal 1 in 1992. The following year theGovernor developed a second initiative, in consultation with the MEAand other groups that had opposed his original plan. The voters rejectedthis second initiative as well.
Despite these defeats, political dissatisfaction with property taxesremained powerful, and the Governor remained committed to reducingthem. In July 1993, during a Senate debate on the subject, Senator Debbie Stabenow challenged her Senate colleagues to simply eliminatelocal property taxes as a funding source for Michigan’s public schools.Governor Engler urged support for Stabenow’s proposal, which wasquickly approved by both houses of the Michigan Legislature.
3
State Control, Local Consequences◆ ◆ ◆ ◆ ◆ ◆ ◆ ◆ ◆ ◆ ◆ ◆ ◆ ◆ ◆ ◆ ◆ ◆ ◆ ◆ ◆ ◆ ◆ ◆ ◆ ◆ ◆ ◆
Reliance onlocal propertytaxes producedwide andgrowinginequitiesamong Michiganschool districts.

With this action, the Legislature eliminated Michigan’s main source of educational revenue, leaving the state’s public school system with a potential budget shortfall of almost $6.5 billion. Members spent thefollowing four months scrambling to develop a plan to replace localproperty taxes as a funding source for public schools. They eventuallycame up with two options, a ballot initiative known as Proposal A and a “statutory alternative” that would be implemented automatically if the voters rejected Proposal A. The main revenue source identified inProposal A was a 50 percent increase in the sales tax, while the “statutoryalternative” relied mainly on an increase in the income tax. Both planscalled for partial restoration of the property tax as a funding source forschools, with one portion to be levied by local districts and another by the state. In March 1994 Proposal A was overwhelmingly approved in a special election.
4
Michigan School Finance Under Proposal A ◆ ◆ ◆ ◆ ◆ ◆ ◆ ◆ ◆ ◆ ◆ ◆ ◆ ◆ ◆ ◆ ◆ ◆ ◆ ◆ ◆ ◆ ◆ ◆ ◆ ◆ ◆ ◆

Policy Impact of Proposal A
Proposal A had three major impacts. First, it produced a large reductionin the property tax. According to the Michigan Department of Treasury,Michigan property taxes were 34.4 percent above the national averagebefore the approval of Proposal A. After the implementation of Proposal A, Michigan property taxes were 14.8 percent below thenational average. Between 1993 and 2002 the average millage rate onMichigan homes declined by 44 percent. The average homeowner in Michigan pays approximately $2,000 less in property taxes per year as a result of Proposal A.
Second, Proposal A produced a dramatic centralization of Michigan’sschool finance system. Before the approval of Proposal A, two-thirds of all education revenues were raised locally, and the voters in local schooldistricts set their own property tax rates to support local schools. Sincethe approval of Proposal A, in contrast, the largest share of educationrevenues in Michigan has been raised and distributed by the state, andthe rate of property tax that districts can collect to support local publicschools is fixed by statute. As a result, local school districts have lostvirtually all control over the amount of money available for the operationof their public schools.
Third, Proposal A made school funding more equitable. In 1993–94,before the approval of Proposal A, per-pupil spending in the highest-revenue school districts was more than three times higher than spendingin the lowest-revenue districts. Since the implementation of Proposal A,the spending gap has grown steadily smaller. Three-fourths of all schooldistricts now receive the same per-pupil foundation allowance, while theremaining districts receive somewhat more. The highest-revenue districtsnow spend about twice as much as the lowest-revenue districts. Proposal A reduced the gap by restraining revenue growth in Michigan’shighest-spending school districts and simultaneously providingsignificantly more revenue to low-spending districts.
5
State Control, Local Consequences◆ ◆ ◆ ◆ ◆ ◆ ◆ ◆ ◆ ◆ ◆ ◆ ◆ ◆ ◆ ◆ ◆ ◆ ◆ ◆ ◆ ◆ ◆ ◆ ◆ ◆ ◆ ◆
Local schooldistricts havelost virtually all control overthe amount ofmoney availablefor the operationof their publicschools.

How Does Proposal A Work?
To replace local property tax revenues, Proposal A increased the sales taxand a variety of other taxes, earmarking the new revenues for the SchoolAid Fund (SAF). The revenues in the SAF are distributed to local schooldistricts on a per-pupil basis. School districts receive a foundationallowance for each student they enroll.2
Revenues for the School Aid Fund
Table 1 displays the main sources of revenue for Michigan’s public schoolsystem, before and after the implementation of Proposal A. Sales and usetaxes were increased from 4 percent to 6 percent, with all of the newrevenues going to the SAF. Taxes on cigarettes and other tobacco productswere significantly increased as well. A real estate transfer tax of 0.75 percentwas introduced. All of the new revenues from these taxes were earmarkedfor the SAF. In addition, 14.4 percent of revenues from the income tax(subsequently increased to 23 percent) were also earmarked for the SAF.
6
Michigan School Finance Under Proposal A ◆ ◆ ◆ ◆ ◆ ◆ ◆ ◆ ◆ ◆ ◆ ◆ ◆ ◆ ◆ ◆ ◆ ◆ ◆ ◆ ◆ ◆ ◆ ◆ ◆ ◆ ◆ ◆
Table 1SAF Revenue Sources, Before and After
Approval of Proposal A
Revenue Source Prior to Reform Proposal A
Sales Tax 60% of proceeds 60% from the 4% rate and from the 4% rate 100% from the 2 percentage
point increase
Use Tax All revenue from the 2 percentage point increase
Income Tax 14.4% of collections from the 4.4% rate (down from 4.6%)
Real Estate Transfer Tax All revenue from the .75% tax
Cigarette Tax (per pack) $.02 of the $.25 tax 63.4% of proceeds from the $.75 tax
Other Tobacco Products Proceeds of the 16% tax(on wholesale price)
Liquor Excise Tax Revenue from the 4% tax Revenue from the 4% tax
Lottery Net revenue Net revenue
State Tax on all Property 6 mills
Local Homestead Property Tax 34 mills (average) 0
Local Non-homestead 34 mills (average) 18 millsProperty Tax
Source: Michigan House and Senate Fiscal Agencies, “The Michigan School Aid Act Compiled and Appendices.”Appendix A, October, 1994.
2 The foundation allowance is supplemented in most districts by state and federal “categorical”funding for specific purposes including special education.

Property taxes have continued to provide a significant share of educationalrevenues since 1994. The state levies a uniform 6 mills on all property, with the revenue going directly to the SAF. Local school districts arerequired to levy an additional 18 mills on non-homestead property, withvoter approval.3 Revenues from the tax on non-homestead property remainat the local level. These revenues represent local districts’ contribution tothe state’s foundation allowances. All of the non-homestead revenues thatdistricts raise locally are completely offset by corresponding reductions in state aid within the state funding formula. As a result, property taxes to support schools are effectively state rather than local taxes.
Proposal A permits a small set of districts that had very high spendinglevels in 1994 to levy additional property taxes on homestead property,subject to the approval of local voters.4 About seven percent of thedistricts in the state are in this “hold harmless” group. Some of thesedistricts, including several in suburban Detroit, are very wealthy. Othersare home to large concentrations of valuable non-homestead property,ranging from vacation homes to shopping malls to nuclear power plants.The revenue from local millages allows these districts to maintain theirspending at pre-Proposal A levels, but it does not permit them to increasetheir spending further. Like all other school districts, the “hold harmless”districts can only increase their revenue each year by the amount of theannual increase in the statewide basic foundation grant.
In the first three years after the implementation of Proposal A, localschool districts were permitted to seek enhancement millages of up tothree mills from local voters. The revenues from these millages could be used to supplement the funding provided by the state. Since 1997,however, local school districts may no longer seek enhancement millagesunless they act in concert with the other districts in their IntermediateSchool District (ISD). ISD enhancement millages must be approved by a majority of the electors in the ISD, and the revenues must be shared across districts on an equal per-pupil basis. Only one ISD has won approval for an enhancement millage since 1997.
7
State Control, Local Consequences◆ ◆ ◆ ◆ ◆ ◆ ◆ ◆ ◆ ◆ ◆ ◆ ◆ ◆ ◆ ◆ ◆ ◆ ◆ ◆ ◆ ◆ ◆ ◆ ◆ ◆ ◆ ◆
3 In Michigan, “homestead” property is limited to owner-occupied primary residences. All other property, including rental property and vacation homes, is “non-homestead” property.
4 Without these local millages, maintaining pre-1994 spending levels in these districts would have placed too great a strain on the SAF.

The General Fund Gap
When Proposal A was first approved, the Legislature’s original intentionwas that annual increases in the foundation allowance would be strictlydetermined by the increase in revenues into the SAF, adjusted forchanges in enrollment.5 In fact, however, the revenues earmarked for theSAF under Proposal A fell short of the funds needed to meet legislativecommitments to Michigan’s public schools from the start. The differencebetween the amounts promised to schools by the Legislature and thefunds available in the SAF has been made up each year with revenuesfrom the state’s General Fund budget. (See Table 2.) Nothing in Proposal A requires General Fund contributions to the SAF. Thesediscretionary transfers depend on specific appropriations by theLegislature. Between 1995 and 2003 these supplemental appropriationsamounted to roughly $5 billion, or about 6 percent of all SAF revenues.
In fiscal years 1995 and 1996 more than $600 million in General Fundrevenues were allocated to the SAF. In fiscal year 2002 the Legislaturealso contributed approximately $600 million to the SAF, drawing $200million from the General Fund budget, along with almost $400 millionfrom the Budget Stabilization Fund (the “rainy day” fund). On average,the Legislature has transferred approximately $560 million to the SAFevery year since Proposal A was approved.
8
Michigan School Finance Under Proposal A ◆ ◆ ◆ ◆ ◆ ◆ ◆ ◆ ◆ ◆ ◆ ◆ ◆ ◆ ◆ ◆ ◆ ◆ ◆ ◆ ◆ ◆ ◆ ◆ ◆ ◆ ◆ ◆
Table 2The General Fund “Gap” in Michigan’s School Aid Fund, 1995–2002
1995 1996 1997 1998 1999 2000 2001 2002
General Fund transfer 665 621 278 376 421 420 385 198
Other transfers (BSF) 8 180 23 212 112 48 149 382
School Aid Fund 7,738 8,264 8,691 9,469 9,950 10,479 10,677 10,949
General Fund “gap” ($) 673 801 301 588 533 468 534 580
General Fund “gap” 8.7 9.7 3.5 6.2 5.4 4.5 5.0 5.3as percentage of SAF
Source: Michigan Department of Treasury (2002)
5 For further discussion see Philip C. Kearney and Michael F. Addonizio, A Primer on MichiganSchool Finance, Fourth Edition, 2002, pp. 34, 30.

Michigan’s current budgetary problems can be attributed in part torecession, but it is now becoming apparent that the state’s General Fundfaces a long-term, structural mismatch between spending obligations and revenues. The structural deficit in the General Fund will persist even after a rebound in economic activity.6 In recent years the state hasmade substantial (and continuing) cuts in the single business tax and the income tax. The foregone revenue from these tax reductions amountsto about 14 percent of the General Fund’s revenue. Despite substantialspending cuts already implemented, a $600 million General Fund deficitis now projected for fiscal year 2004. The projected deficit for fiscal year 2005 is $1.2 billion. To balance the budget, either taxes must beincreased or spending obligations must be further reduced, which raisesthe question whether the Legislature can or will continue to fill the “gap”in SAF revenues.
Distribution of Revenues to Individual Districts
The initial foundation allowance that each school district received in1994–95 was based on the revenues that the district had received fromstate and local sources in 1993–94. High-revenue school districts were“held harmless” by ensuring that they continued to receive at least thesame amount of revenue as they had received under the previous schoolfinance system.7 Under Proposal A, these districts received significantlymore money from the state than other districts, but their revenuesincreased at a much slower rate.
The agreement to “hold harmless” previously high-spending schooldistricts had two main consequences. First, it meant that increasedequalization had to be accomplished by “leveling up” (increasing therevenues provided to low-spending districts), rather than by “levelingdown” (decreasing the revenues provided to high-spending districts).Second, since the total tax revenue earmarked for education underProposal A fell far short of the amount needed to raise all districts up to the revenue levels of the highest-spending districts, the value of thefoundation allowance would continue to vary widely across Michiganschool districts.
9
State Control, Local Consequences◆ ◆ ◆ ◆ ◆ ◆ ◆ ◆ ◆ ◆ ◆ ◆ ◆ ◆ ◆ ◆ ◆ ◆ ◆ ◆ ◆ ◆ ◆ ◆ ◆ ◆ ◆ ◆
6 Citizens Research Council, “A Recap of the FY2004 Budget and a Look Ahead to FY2005 andBeyond,” October 2003. Available at www.crcmich.org.
7 In fact, high-revenue districts received a funding increase of at least $160 per pupil in the firstyear of implementation.

In the seven years following the adoption of Proposal A, each Michiganschool district was assigned to one of three groups, based on theirprevious levels of education revenues. Per-pupil foundation allowancesincreased in all districts, but the lowest-revenue districts receivedsignificantly larger increases than higher-revenue districts. In general,funding increased most dramatically in small, rural districts. InOnaway, for example, the per-pupil foundation allowance nearlydoubled under Proposal A, from $3,398 in 1994 to $6,700 in 2003. In urban and suburban districts, in contrast, funding increases weregenerally smaller. In Flint, for example, the per-pupil foundationallowance increased by about 30 percent, from $5,555 in 1994 to $7,252in 2003. In Bloomfield Hills, the foundation allowance increased byabout 16 percent, from $10,294 in 1994 to $11,954 in 2003. By providinglarger increases to previously low-spending districts, Proposal Areduced inequities in funding across districts.
Since 2001 all school districts have received the same annual increase in their per-pupil foundation allowance. The remaining fundingdifferentials between the lowest and highest revenue districts willtherefore persist indefinitely in the absence of further legislative action to reduce them.8
10
Michigan School Finance Under Proposal A ◆ ◆ ◆ ◆ ◆ ◆ ◆ ◆ ◆ ◆ ◆ ◆ ◆ ◆ ◆ ◆ ◆ ◆ ◆ ◆ ◆ ◆ ◆ ◆ ◆ ◆ ◆ ◆
Fundingdifferentialsbetween thelowest and
highest revenuedistricts
will...persistindefinitely
in the absence of further
legislativeaction to
reduce them.
8 All districts receive the same dollar increase each year. For example, the value of the foundationallowance increased by $200 between 2001 and 2002. This uniform per-pupil increase represents asmaller percentage growth in revenue for high-spending districts than lower-spending districts.

11
State Control, Local Consequences◆ ◆ ◆ ◆ ◆ ◆ ◆ ◆ ◆ ◆ ◆ ◆ ◆ ◆ ◆ ◆ ◆ ◆ ◆ ◆ ◆ ◆ ◆ ◆ ◆ ◆ ◆ ◆
Proposal A distributes foundation revenues to school districts based on the number of students that they enroll. The amount of money thatthe state allocates to each local school district therefore depends on twomain factors: the value of the district’s per-pupil foundation allowance,and the number of pupils enrolled in the district’s schools. The revenuesavailable to the school district grow when the value of the per-pupilfoundation allowance rises, or when enrollment increases. Schooldistricts must make do with fewer resources when the value of the per-pupil foundation allowance falls, or when enrollment declines.
Since the adoption of Proposal A in 1994, the per-pupil foundationallowance has increased nearly every year, for every Michigan schooldistrict.9 As noted above, the foundation allowance has increased morerapidly in some districts than in others, but the allowance has increasedin all districts.10 In contrast, enrollments have increased in some schooldistricts, and fallen in others. At the district level, therefore, the fiscalimpact of Proposal A depends at least as much (and often more) onchanges in enrollment as it does on changes in per-pupil funding.
In the following chapter we present data that address two questions.First, we explain how overall financial support for Michigan publicschools has changed under Proposal A. There is no doubt that totalfunding for schools has increased substantially since 1994. The realquestions are whether Proposal A slowed or accelerated real revenuegrowth, and whether the trajectory of funding growth can be maintained.We also place the state’s financial commitment to schools in historicaland comparative perspective, by documenting rates of growth inMichigan’s educational revenues in the years before and after theapproval of Proposal A, and by comparing education funding inMichigan to funding in other states.
Second, we show how Proposal A has changed the distribution ofrevenue among local districts. The new revenues dedicated to educationunder Proposal A have changed the size of the financial pie available topublic schools, but Proposal A has simultaneously changed the way thepie is sliced. Many districts are better off than they were before theapproval of Proposal A. Others are worse off, however, and the numberof “losers” is growing.
9 There was no increase in districts’ foundation allowances in 1998–99. In addition, the stateimplemented a pro-rata reduction in the foundation allowance in FY2003, and an additionalreduction for FY2004 is very likely despite good intentions in both the Legislative andExecutive branches.
10 In some of Michigan’s wealthiest school districts the increase in the foundation allowance hasnot kept pace with inflation. These districts have experienced reductions in the real value (orpurchasing power) of their foundation allowances, even though the nominal value of theallowance has increased.

12
Michigan School Finance Under Proposal A ◆ ◆ ◆ ◆ ◆ ◆ ◆ ◆ ◆ ◆ ◆ ◆ ◆ ◆ ◆ ◆ ◆ ◆ ◆ ◆ ◆ ◆ ◆ ◆ ◆ ◆ ◆ ◆

IIIMEASURING THE IMPACT
OF PROPOSAL A
Trends in Total Financial Support for Michigan Public Schools
How has overall financial support for Michigan public schools changedunder Proposal A? Have education revenues increased more or lessrapidly under Proposal A than under Michigan’s previous system ofschool finance? How sound are the future financial prospects for Michiganschools under Proposal A? Answers to these questions are essential to anevaluation of the adequacy of Michigan’s new school finance system.
Table 3 displays changes in the level of combined state and local operatingrevenue for public schools in selected years over the past two decades.11
To make valid comparisons over time, it is necessary to account for achange in funding responsibility for the state’s school employee retirementsystem. Before Proposal A, the state paid the employers’ contribution to the Michigan Public School Employee Retirement System (MPSERS). This responsibility was shifted to local districts when Proposal A wasimplemented. As a result, the revenue data for 1994 and prior years in Table 3 do not include the employers’ MPSERS contribution, but the 2002 data do. In order to generate post-Proposal A revenue figures that are strictly comparable to the pre-Proposal A period, Table 3 also displays 2002 revenue figures that exclude the employers’ MPSERS contribution.
The total revenues available for the operation of Michigan’s publicschools have increased since 1994. In current dollars, school revenues in 2002 were $13.1 billion, an increase of $4.6 billon over 1994. Adjustingfor inflation and the change in MPSERS financing responsibility, totaleducation revenues in 2002 still exceeded those in 1994 by about $2 billion. This represents an increase of 13 percent, or $803, in averagereal per-pupil revenues between 1994 and 2002.
13
State Control, Local Consequences◆ ◆ ◆ ◆ ◆ ◆ ◆ ◆ ◆ ◆ ◆ ◆ ◆ ◆ ◆ ◆ ◆ ◆ ◆ ◆ ◆ ◆ ◆ ◆ ◆ ◆ ◆ ◆
11 Unless otherwise noted, all the data in this report refer to school years. For ease of exposition,however, we refer to school years by the corresponding fiscal year. So, for example, 1994 refersto the 1993–94 school year, the last school year before Proposal A took effect. Data on mostcomponents of district-level finances are now available only through 2002.

The bottom panel of Table 3 displays changes in the pace of revenuegrowth over three periods, two periods before the passage of Proposal Aand one afterwards. Between 1980 and 1987, total real revenues per pupilincreased at a fairly rapid annual rate of 3.3 percent. This rate of increaseresulted from modest growth in real revenues coupled with decliningstatewide enrollment. Per-pupil revenue growth slowed in the 1987–1994period, despite an acceleration in total revenue, because the state’senrollment began to increase again.
Table 3 shows that the growth of real per-pupil revenues slowed furtherafter the passage of Proposal A. Total revenues and enrollment bothincreased after 1994, but part of the revenue growth reflects the change in funding responsibility for MPSERS. After adjusting for this shift, it is clear that the growth of both total and per-pupil real revenue forMichigan school districts has slowed since the passage of Proposal A.The annual growth of real per-pupil revenue between 1994 and 2002 was 1.5 percent, the slowest growth over any period during the last twodecades. Revenue growth under Proposal A nevertheless outpacedinflation between 1994 and 2002.
14
Michigan School Finance Under Proposal A ◆ ◆ ◆ ◆ ◆ ◆ ◆ ◆ ◆ ◆ ◆ ◆ ◆ ◆ ◆ ◆ ◆ ◆ ◆ ◆ ◆ ◆ ◆ ◆ ◆ ◆ ◆ ◆
Table 3Total State and Local Operating Revenue for Michigan Schools
(Millions) (Per Pupil)Current 2002 Statewide Current 2002
Year Dollars Dollars Membership Dollars Dollars
1980 3,651 7,970 1,910,385 1,911 4,172
1987 5,497 8,708 1,657,423 3,317 5,254
1994 8,482 10,297 1,667,041 5,088 6,177
2002 13,083 13,084 1,731,092 7,558 7,558
2002* 12,082 12,082 1,731,092 6,980 6,980
Growth Rates1980–87 5.8 1.3 -2.0 7.9 3.3
1987–94 6.2 2.4 0.1 6.1 2.3
1994–2002 5.4 3.0 0.5 4.9 2.5
1994–2002* 4.4 2.0 0.5 3.9 1.5
Notes: Figures are based on total General Fund revenue of all local and intermediate school districts and charterschools. *Excludes employers’ contribution to the Michigan Public Schools Employees Retirement System.

In order to increase school funding even at this slower pace, Michigan hasbeen obliged to allocate a growing share of total government spending toelementary and secondary education. Table 4 displays the share of all stateand local government expenditures devoted to education in selected states. Compared to the nation as a whole, Michigan devotes a relativelylarge share of its government spending to education. Moreover, this share increased significantly after the implementation of Proposal A, from 26 percent in 1994 to 29 percent in 1999 (the most recent year forwhich U.S. Census data are available).
In summary, Michigan now funds its schools at a higher level than beforeProposal A, but the rate of annual growth in financial support has slowedin the years between 1994 and 2002 when compared with earlier periods.As we discuss below, the recent decline in state revenues has reduced therate of growth even further since 2002.
15
State Control, Local Consequences◆ ◆ ◆ ◆ ◆ ◆ ◆ ◆ ◆ ◆ ◆ ◆ ◆ ◆ ◆ ◆ ◆ ◆ ◆ ◆ ◆ ◆ ◆ ◆ ◆ ◆ ◆ ◆
Table 4State Plus Local K–12 Education Expenditures
as a Percentage of Total Government Expenditures
Change1994 1999 1994 to 1999
Michigan 25.84 28.55 2.71
Wisconsin 25.40 26.98 1.58
Indiana 25.26 26.11 0.85
Illinois 22.81 25.80 2.99
Ohio 24.43 25.50 1.07
New York 21.63 22.95 1.32
California 19.47 21.48 2.01
United States 23.00 24.30 1.30

The Current Budget Crisis
Like several other states, Michigan is facing one of its worst budget crisessince World War II. In fiscal year 2003, a revenue shortfall in the SAFproduced the first reductions in foundation support for Michigan schooldistricts since Proposal A was approved in 1994. To restore those cuts andpreserve the basic foundation allowance for another year at $6,700, theLegislature cut over $140 million in categorical programs (adult education,career preparation, gifted and talented) from the 2004 budget.
As it turns out, however, the 2003 budget was overly optimistic. SAF revenue collections fell short of projections by nearly $100 million.The 2004 budget must therefore be reassessed to take account of a smallerrevenue base and a slower rate of growth in the SAF than legislators hadpreviously assumed. By all accounts, it will be a challenge to avoid cuts in the $6,700 basic foundation allowance during 2004. Current revenueprojections suggest the possibility of further cuts in real terms during fiscal year 2005.
Education revenues in Michigan are no longer keeping pace with the risingoperating costs that schools face, and school districts across the state arecutting programs and services in response. The squeeze is most acute indistricts where enrollment is declining. What accounts for this shift? Is itmerely the transitory fallout of an economic recession? Or does it point tostructural flaws in the state’s system of school finance under Proposal A?
Without doubt there is a strong cyclical component to the present fiscalpredicament of Michigan’s schools. Both sales and income taxes aresensitive to business cycle fluctuations. Together, these two taxes accountfor two-thirds of the SAF’s tax revenue. It is no surprise that collectionsfrom sales and income taxes weakened during the recession. What mightseem odd, however, is that according to the National Bureau of EconomicResearch the national recession started in March 2001 and officially endedin November 2001. Why did it take until 2003 for the budget crunch to hitMichigan schools?
The answer to this question has two key elements. First, revenues from the state education property tax held up very well during the recession.Total tax revenues flowing to the SAF increased modestly in fiscal years2001 and 2002, because property tax collections grew robustly in bothyears, by about 8 percent in 2001 and 6 percent in 2002. The property taxaccounts for only about 14 percent of the SAF’s tax revenue, but growth in property tax receipts accounted for 80 percent of the increase in taxrevenue during the recession.12
16
Michigan School Finance Under Proposal A ◆ ◆ ◆ ◆ ◆ ◆ ◆ ◆ ◆ ◆ ◆ ◆ ◆ ◆ ◆ ◆ ◆ ◆ ◆ ◆ ◆ ◆ ◆ ◆ ◆ ◆ ◆ ◆
Educationrevenues in
Michigan are nolonger keepingpace with the
rising operatingcosts that
schools face.
12 In addition to being a more stable revenue source, the state education property tax has alsodisplayed a faster long-term growth trajectory (or income elasticity). Even before the recession,the growth rate of state property tax collections exceeded sales tax collections by nearly 50 percentbetween 1995 and 2000, despite provisions in Proposal A that fix the tax rate at 6 mills and restrictincreases in the taxable value of individual properties to the lesser of 5 percent or the rate ofinflation. Faster growth in overall property tax collections is spurred by the expansion ofassessment rolls due to new construction and the reassessment of properties at resale.

Second, and more importantly, between 2001 and 2003 the Legislaturesought to compensate for sagging SAF tax collections by transferringnearly $2 billion to the SAF from a variety of one-time sources. Thesurpluses that had built up in the SAF and Budget Stabilization Fundwere entirely depleted. School bonds were refinanced to take advantageof lower interest rates. A portion of the financial assistance provided toMichigan by the federal government was shifted to the SAF. For fiscalyear 2003, the summer property tax collection was accelerated, so ineffect there were three tax collections during the year instead of two. The problem now facing the Legislature is that these one-time revenuesources have been exhausted, and are no longer available. In fiscal years2004 and after, the SAF will have to rely on tax revenue growth to replacethese funds, and state tax collections have yet to rebound.13
The challenge confronting the 2004 and subsequent budgets is readilyillustrated. In drawing up the budget for fiscal year 2004, the Legislatureestimated that SAF tax revenues would increase at a rate slightly over four percent. A four percent growth in SAF tax revenues would generateabout $400 million in additional funds. This amount would almost replacethe special one-time revenue supplements used up in the 2003 budget. It would not produce any increase in the SAF’s total revenues. If SAF taxrevenues increase by less than four percent—as now seems probable—totalSAF revenues in 2004 will fall below the levels of 2003.
Even if the Legislature manages to maintain total SAF revenues at the2003 level, cutbacks will have to be made in school programs. The basicfoundation allowance ($6,700) must increase by about $150 at the currentrate of inflation (2.2 percent) to maintain its purchasing power. Protectingthe basic foundation allowance against inflation would require anaggregate increase of about $260 million in the SAF in 2004 as comparedto 2003. Even at this level of funding, however, high-revenue districtswould still have to make cuts. A foundation increase of $150 for a districtwith a $12,000 foundation allowance represents only a 1.25 percentfunding increase, well below the rate of inflation. In addition, a few keycosts that school districts face are increasing faster than the rate ofinflation, including expenses for employee health care and pensions.According to the Citizens Research Council, it is entirely possible that any increase in foundation support that the state might manage in thenext couple of years will be completely absorbed by mandatory increases in districts’ employee retirement contributions.
17
State Control, Local Consequences◆ ◆ ◆ ◆ ◆ ◆ ◆ ◆ ◆ ◆ ◆ ◆ ◆ ◆ ◆ ◆ ◆ ◆ ◆ ◆ ◆ ◆ ◆ ◆ ◆ ◆ ◆ ◆
13 Both sales and income tax collections declined during the fourth quarter of fiscal year 2003,fully two years after the recession’s trough.

As the economy rebounds and income and sales tax revenues revive, the fiscal integrity of the SAF will improve. As noted above, however, this will not solve the financial problems facing Michigan schools, becauseof the persistent General Fund gap in SAF revenues. Transfers from theGeneral Fund accounted for 40 percent of the increase in real per-pupileducation revenues that occurred between 1994 and 2002, averaging morethan $500 million each year. The General Fund now faces a large deficit,however, because projected revenues are no longer sufficient to meetcurrent spending commitments. The deficit in the General Fund isstructural, not cyclical—it will not go away even if the economy recovers. As a result, transfers to the SAF on the scale of recent years cannot besustained without major cuts in other areas of the state budget.
The current budget crisis brings the vulnerabilities of Michigan’s schoolfunding under Proposal A into sharp focus. The extent to which it willalter the long-term trajectory of revenue growth for Michigan schools isnot yet clear, but there are few grounds for optimism. If SAF revenuesremain flat through fiscal year 2005, as now appears plausible, and currentrates of inflation and enrollment growth remain unchanged, then theannual rate of real per-pupil revenue growth for Michigan schools since1994 will have declined to 0.3 percent. We return to this issue in Section IV,in our discussion of current school finance policy issues.
18
Michigan School Finance Under Proposal A ◆ ◆ ◆ ◆ ◆ ◆ ◆ ◆ ◆ ◆ ◆ ◆ ◆ ◆ ◆ ◆ ◆ ◆ ◆ ◆ ◆ ◆ ◆ ◆ ◆ ◆ ◆ ◆
The currentbudget crisis
brings thevulnerabilitiesof Michigan’s
school fundingunder
Proposal Ainto
sharp focus.

Changes in the Distribution of Revenues among Local Districts
One of the key goals of Proposal A was to narrow the gap between high- and low-revenue school districts in Michigan. The finance reformdid in fact bring about substantial progress on this front. Formerly low-spending districts received the largest revenue increases, whilerevenue growth in high-spending districts was constrained. Proposal Aalso reduced, but did not eliminate, the very close association betweendistricts’ revenues and their local property wealth that characterizedschool funding in Michigan before 1994.
Table 5 documents the decline in fiscal disparities among Michigandistricts. For this analysis we grouped school districts by the level of their foundation allowance in 1994. We then examined increases infoundation allowances for each group between 1994 and 2002. In thelowest-revenue group the average foundation allowance increased by $2,474. In the highest-revenue group the average increase was only$1,395. In real dollars, the lowest-revenue districts received an additional$1,616 per pupil, while revenues in the highest-spending districts failedto keep pace with inflation.
19
State Control, Local Consequences◆ ◆ ◆ ◆ ◆ ◆ ◆ ◆ ◆ ◆ ◆ ◆ ◆ ◆ ◆ ◆ ◆ ◆ ◆ ◆ ◆ ◆ ◆ ◆ ◆ ◆ ◆ ◆
Table 5Change in Foundation Allowance by 1994 Foundation Quintiles
Mean Foundation Allowance Difference1994 Current 2002
Quintile 1994 in 2002 $ 2002 Dollars Dollars
1 $4,026 $4,884 $6,500 $2,474 $1,616
2 4,385 5,320 6,500 2,115 1,180
3 4,672 5,669 6,500 1,828 831
4 5,242 6,360 6,766 1,524 406
5 6,593 7,999 7,988 1,395 -11
Note: Each quintile includes 111 school districts.

20
Michigan School Finance Under Proposal A ◆ ◆ ◆ ◆ ◆ ◆ ◆ ◆ ◆ ◆ ◆ ◆ ◆ ◆ ◆ ◆ ◆ ◆ ◆ ◆ ◆ ◆ ◆ ◆ ◆ ◆ ◆ ◆
The per-pupil foundation allowance that school districts receive from thestate accounts for 85 percent of all operating revenue among Michiganschool districts. Federal revenues account for another 5 percent, and statecategorical grants and local fees account for the remaining 10 percent.Figure 2 adds revenues from these other sources to foundation revenue.The figure shows that inter-district disparities in total per-pupil revenueshave narrowed since the approval of Proposal A, but by somewhat lessthan the disparities in foundation revenue alone.
The improvement in fiscal equity that has taken place in Michigan under Proposal A compares very favorably to recent trends in other states. Table 6 depicts the extent of funding variation among local schooldistricts in several states. Under Proposal A, Michigan has gone fromhaving greater funding inequality than the median state to being moreequal than the median state. In 1994, 32 states had more equal distributionsof per-pupil revenues across districts than Michigan. By 2000, only 17states had a more equal distribution.
80%
$3,500 $4,500 $5,500 $6,500 $7,500 $8,500 $9,500
70%
60%
50%
40%
30%
20%
10%
0%
1994 (in 2002 $)
2002
Figure 1Distribution of Per-Pupil Foundation Grants
Among School Districts
The equalization of per-pupil foundation allowances across districts is portrayed in Figure 1. The figure clearly shows that Proposal Aincreased equalization by “leveling up” low-revenue districts. By 2002,three-fourths of Michigan school districts received the same per-pupilfoundation allowance of $6,700 from the state.
Note: To accommodate scaling, a few very high-revenue districts have been omittedfrom Figures 1 and 2.

The pace at which Michigan reduced funding disparities between 1994 and 2000 was especially dramatic. Only four states (Nevada, Texas, Washington, and Wyoming) accomplished larger reductions in revenue inequalities during this period. Michigan has continued to improve school revenue equity in the years since 2000.
21
State Control, Local Consequences◆ ◆ ◆ ◆ ◆ ◆ ◆ ◆ ◆ ◆ ◆ ◆ ◆ ◆ ◆ ◆ ◆ ◆ ◆ ◆ ◆ ◆ ◆ ◆ ◆ ◆ ◆ ◆
Table 6Inequity of Per-Pupil Revenue Among Districts
in Selected States
Coefficient of Variation Change1994 2000 1994 to 2000
Nebraska .46 .73 .27
New York .38 .43 .05
Ohio .30 .40 .10
Illinois .38 .29 -.09
Colorado (median state) .26 .28 .02
Michigan .32 .20 -.12
Wisconsin .15 .12 -.03
Indiana .14 .12 -.02
Hawaii 0.0 0.0 0.0
Note: The coefficient of variation is obtained by dividing the standard deviation by the mean. These figures are based on total state plus local General Fund revenue per pupil in individual school districts in each state. Smaller coefficient values implyless inequality.
$3,500 $4,500 $5,500 $6,500 $7,500 $8,500 $9,5000%
40%
35%
30%
25%
20%
15%
10%
5%
1995 (in 2001 $)
2001
Figure 2Distribution of Per-Pupil General Fund Revenue
Among School Districts

Changes in Foundation Allowances by Local Community Characteristics
Michigan citizens often suppose that Proposal A has shifted schoolrevenues from communities inhabited by rich households to thoseinhabited by poor households. This would necessarily be true only ifdistrict median family income and school revenues in 1994 had beenperfectly correlated. In fact, however, the correlation between familyincome and school revenue in 1994 was positive, but not perfect. Many middle income communities had low per-pupil revenues in 1994 because they chose to tax themselves at low rates. By the same token, many communities with high concentrations of poor households,including most of Michigan’s central cities, had per-pupil revenues at or above the statewide average in 1994. Per-pupil revenue was relatively high in these communities because of the presence of substantial non-residential property, relatively high local tax effort (millage rates), and the distribution of state aid before Proposal A.
Table 7 shows the relationship between foundation allowance increasesunder Proposal A and community income levels. We grouped the state’s555 school districts into quintiles based on their 1990 median familyincome. The highest-income districts have indeed received the smallestfoundation increases. The state’s lowest-income districts, however, havenot gained the most. The average foundation allowance increase wasgreater for districts falling between the 20th and 80th percentiles of familyincome distribution than for the state’s poorest quintile of districts.
22
Michigan School Finance Under Proposal A ◆ ◆ ◆ ◆ ◆ ◆ ◆ ◆ ◆ ◆ ◆ ◆ ◆ ◆ ◆ ◆ ◆ ◆ ◆ ◆ ◆ ◆ ◆ ◆ ◆ ◆ ◆ ◆
Table 7Change in Foundation Allowance
by District Median Family Income Quintiles
Mean District Foundation1994 in Difference
Quintile 1994 2002 Dollars 2002 2002 Dollars
1 $5,114 $6,205 $6,809 $604
2 4,725 5,733 6,628 895
3 4,804 5,828 6,689 861
4 5,101 6,188 6,827 639
5 5,904 7,164 7,400 236
Note: 1 is the lowest-income quintile, and 5 is the highest-income quintile.

The formulas that determine district foundation allowance increasesunder Proposal A take no account of community racial or ethniccharacteristics. Districts with differing racial compositions havenevertheless fared differently under the finance reform. In Table 8 wegrouped Michigan’s school districts by the percentage of their studentswho were African-American in 1994. African-American students are veryunevenly distributed across the state’s school districts. Although theymake up 19 percent of students statewide, African-Americans compriseless than one percent of the students in nearly 70 percent of Michigan’sschool districts. African-American students represent more than a thirdof the students in only 25 districts, fewer than five percent of the schooldistricts in Michigan.
The results of this analysis are striking. The districts with the highest shareof African-American students have had the smallest foundation allowanceincreases since 1994. Indeed, the foundation increase for the group ofdistricts with the highest concentration of African-American students issmaller than the increase received by the state’s richest quintile of districtsmeasured by family income. (See Table 7.) The average real foundationincrease in districts where African-Americans comprise less than onepercent of enrollment is nearly four times the increase in districts where at least one-third of the students are African-American.
For the state as a whole, the average real increase in the foundationgrant received by African American students between 1994 and 2001was $208 (in 2001 dollars). The average real foundation grant increasefor all non-African-American students was $338, which is more than 60 percent higher.
23
State Control, Local Consequences◆ ◆ ◆ ◆ ◆ ◆ ◆ ◆ ◆ ◆ ◆ ◆ ◆ ◆ ◆ ◆ ◆ ◆ ◆ ◆ ◆ ◆ ◆ ◆ ◆ ◆ ◆ ◆
The foundationincrease for the group ofdistricts withthe highestconcentration of African-Americanstudents issmaller than theincrease receivedby the state’srichest quintileof districts.
Table 8Change in Foundation Allowance
by District Racial Composition
Percent Mean FoundationAfrican-American Number of (2002 $)Enrollment (1994) Districts 1994 2002 Difference
0–1% 381 $5,849 $6,776 $927
1–5 110 6,430 7,032 601
5–33 39 6,205 6,879 674
>33 25 7,050 7,292 242
Changes in Total Foundation Revenue by Community Characteristics
Under Proposal A the state distributes revenues to school districts on aper-pupil basis. The financial prospects of districts under Proposal Atherefore depend on the interaction of two variables: (1) changes in theper-pupil foundation allowance, as discussed above and (2) changes inenrollment. Discussions of the impact of Proposal A have generallyfocused on changes in the value of foundation allowances, but enrollmentchanges have had equally large effects on district revenues.
Table 9 shows how the interaction of these two variables has affected total foundation revenue in some illustrative Michigan school districts. (All dollar figures in Table 9 are in real, or inflation-adjusted, terms.) Thefirst group in Table 9 includes districts where both variables are increasing.In these lucky districts the real foundation allowance received from thestate has increased rapidly, and enrollments have increased as well. Inrapidly developing districts on the outskirts of metropolitan areas—placeslike Pinckney, Hudsonville, and Rockford—total revenues available forlocal schools have grown dramatically since the adoption of Proposal A.
The second group in Table 9 includes districts where declining realfoundation allowances have been compensated by very rapid enrollmentgrowth. In metro Detroit, for example, suburban school districts includingLake Orion, Dearborn, Northville and West Bloomfield have enjoyed largeincreases in total revenue without increases in their real foundationallowance, because enrollments have increased steadily. The same is truefor some suburban districts in west Michigan, including Forest Hills inKent County.
24
Michigan School Finance Under Proposal A ◆ ◆ ◆ ◆ ◆ ◆ ◆ ◆ ◆ ◆ ◆ ◆ ◆ ◆ ◆ ◆ ◆ ◆ ◆ ◆ ◆ ◆ ◆ ◆ ◆ ◆ ◆ ◆
A large andgrowing number
of urbandistricts have
experiencedsignificant
financial lossesas a result ofProposal A.
The third group in Table 9 includes districts where the positive budgetaryimpact of foundation allowance growth has been overwhelmed by fallingenrollments. Despite receiving substantially more money per pupil fromthe state, the total real revenue available for local schools in districtsincluding Benton Harbor, Hillsdale and several districts in the UpperPeninsula has fallen under Proposal A, because enrollments have declinedfaster than the foundation allowance has grown.
The fourth group in Table 9 includes districts where slow growth in the foundation allowance has accompanied declining enrollments. In thesedistricts the total revenue available for local schools has fallen rapidly. A large and growing number of urban districts have experiencedsignificant financial losses as a result of Proposal A. In districts includingDetroit, Flint, Lansing, Ferndale, and Mt. Clemens, long-termdemographic trends and very small increases in the real foundationallowance have produced severe budget problems.

Table 9Real Foundation Revenue Growth for Selected Districts,
1994–2001
% Change in % Change inReal Foundation % Change Total Real
District Allowance in Enrollment Foundation Revenue
1. Increasing real foundation allowance, increasing enrollmentHudsonville 29.2 33.5 72.5
Vandercook Lake 13.2 34.8 52.6
Pinckney 14.0 27.2 45.1
Rockford 14.0 24.8 42.3
Howell 5.1 27.5 34.0
2. Declining real foundation allowance, increasing enrollmentLake Orion -0.1 42.1 42.0
Forest Hills -0.7 30.6 29.7
Northville -4.4 33.3 27.4
Dearborn -5.3 27.9 21.1
W. Bloomfield -5.6 22.2 15.4
3. Increasing real foundation allowance, declining enrollmentEscanaba 11.1 -14.6 -5.2
Hillsdale 20.3 -26.5 -11.6
Ishpeming 20.6 -28.6 -13.8
Benton Harbor 15.0 -28.9 -18.3
Gwinn 32.7 -50.8 -34.7
4. Slow increase in real foundation allowance, declining enrollmentDetroit 2.4 -10.1 -7.9
Flint 1.7 -16.9 -15.4
Lansing 2.3 -18.6 -16.7
Mt. Clemens 1.1 -27.4 -26.5
Ferndale 0.4 -37.2 -37.0
25
State Control, Local Consequences◆ ◆ ◆ ◆ ◆ ◆ ◆ ◆ ◆ ◆ ◆ ◆ ◆ ◆ ◆ ◆ ◆ ◆ ◆ ◆ ◆ ◆ ◆ ◆ ◆ ◆ ◆ ◆
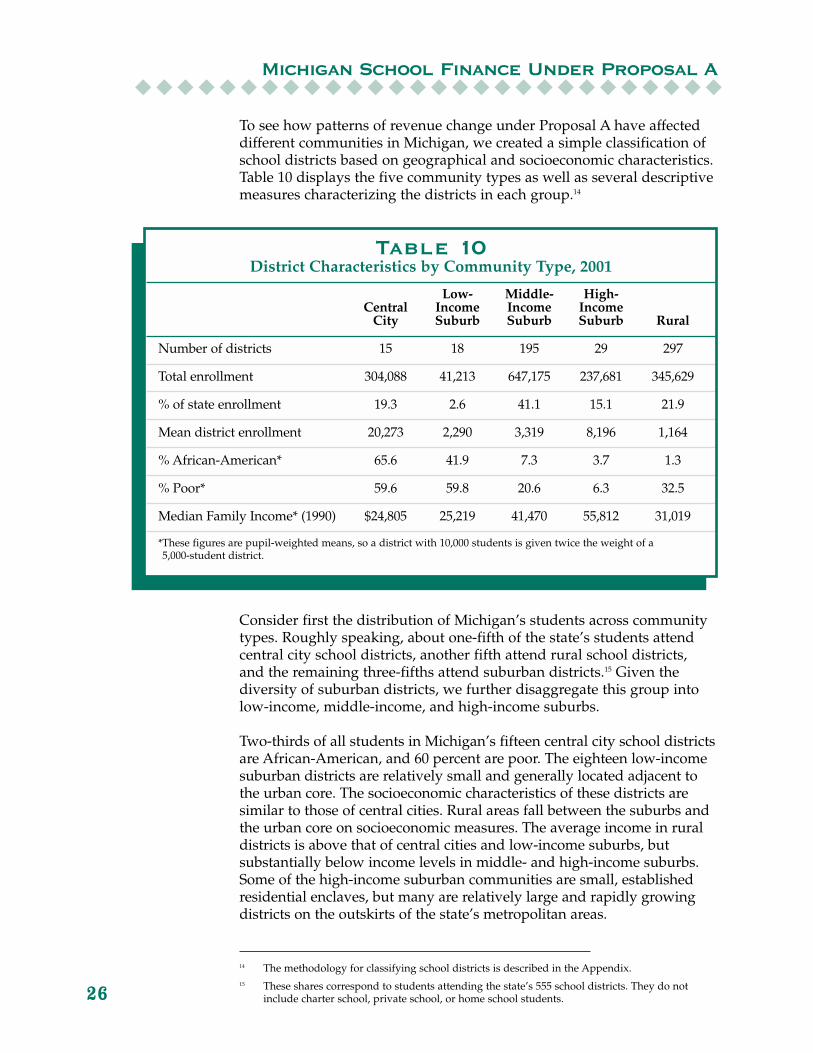
Consider first the distribution of Michigan’s students across communitytypes. Roughly speaking, about one-fifth of the state’s students attendcentral city school districts, another fifth attend rural school districts, and the remaining three-fifths attend suburban districts.15 Given thediversity of suburban districts, we further disaggregate this group intolow-income, middle-income, and high-income suburbs.
Two-thirds of all students in Michigan’s fifteen central city school districtsare African-American, and 60 percent are poor. The eighteen low-incomesuburban districts are relatively small and generally located adjacent tothe urban core. The socioeconomic characteristics of these districts aresimilar to those of central cities. Rural areas fall between the suburbs andthe urban core on socioeconomic measures. The average income in ruraldistricts is above that of central cities and low-income suburbs, butsubstantially below income levels in middle- and high-income suburbs.Some of the high-income suburban communities are small, establishedresidential enclaves, but many are relatively large and rapidly growingdistricts on the outskirts of the state’s metropolitan areas.
To see how patterns of revenue change under Proposal A have affecteddifferent communities in Michigan, we created a simple classification ofschool districts based on geographical and socioeconomic characteristics.Table 10 displays the five community types as well as several descriptivemeasures characterizing the districts in each group.14
26
Michigan School Finance Under Proposal A ◆ ◆ ◆ ◆ ◆ ◆ ◆ ◆ ◆ ◆ ◆ ◆ ◆ ◆ ◆ ◆ ◆ ◆ ◆ ◆ ◆ ◆ ◆ ◆ ◆ ◆ ◆ ◆
Table 10District Characteristics by Community Type, 2001
Low- Middle- High-Central Income Income Income
City Suburb Suburb Suburb Rural
Number of districts 15 18 195 29 297
Total enrollment 304,088 41,213 647,175 237,681 345,629
% of state enrollment 19.3 2.6 41.1 15.1 21.9
Mean district enrollment 20,273 2,290 3,319 8,196 1,164
% African-American* 65.6 41.9 7.3 3.7 1.3
% Poor* 59.6 59.8 20.6 6.3 32.5
Median Family Income* (1990) $24,805 25,219 41,470 55,812 31,019
*These figures are pupil-weighted means, so a district with 10,000 students is given twice the weight of a 5,000-student district.
14 The methodology for classifying school districts is described in the Appendix.15 These shares correspond to students attending the state’s 555 school districts. They do not
include charter school, private school, or home school students.

27
State Control, Local Consequences◆ ◆ ◆ ◆ ◆ ◆ ◆ ◆ ◆ ◆ ◆ ◆ ◆ ◆ ◆ ◆ ◆ ◆ ◆ ◆ ◆ ◆ ◆ ◆ ◆ ◆ ◆ ◆
16 The figures in Table 11 differ from those in Table 9, because they are growth rates rather thanpercentage changes.
Table 11 displays patterns of change in enrollments, real foundationallowances, and total real revenues in these five groups of schooldistricts.16 The data in Table 11 represent average trends across groups.Within each group, of course, there is a range of experiences acrossindividual districts. The table nevertheless makes clear that there arelarge and systematic variations in Proposal A’s impacts across differentkinds of communities in Michigan.
As a group, rural school districts enjoyed exceptional increases in the real value of their per-pupil foundation grants following the adoption of Proposal A. The fiscal advantage of rapid growth in per-pupil revenuewas muted by enrollment decline in rural Michigan, but on balance ruraldistricts still enjoyed solid increases in real total foundation revenue.
The experience of central city and low-income suburban districts wasvery different. On the one hand, central cities and low-income suburbslost students at roughly three times the rate of rural districts. On theother hand, their foundation grants increased at less than one-third therate of rural districts. Enrollment decline overwhelmed the fiscal benefitsof modest foundation increases in both central cities and low-incomesuburbs. In both groups of districts total real foundation revenue hasfallen significantly since the adoption of Proposal A.
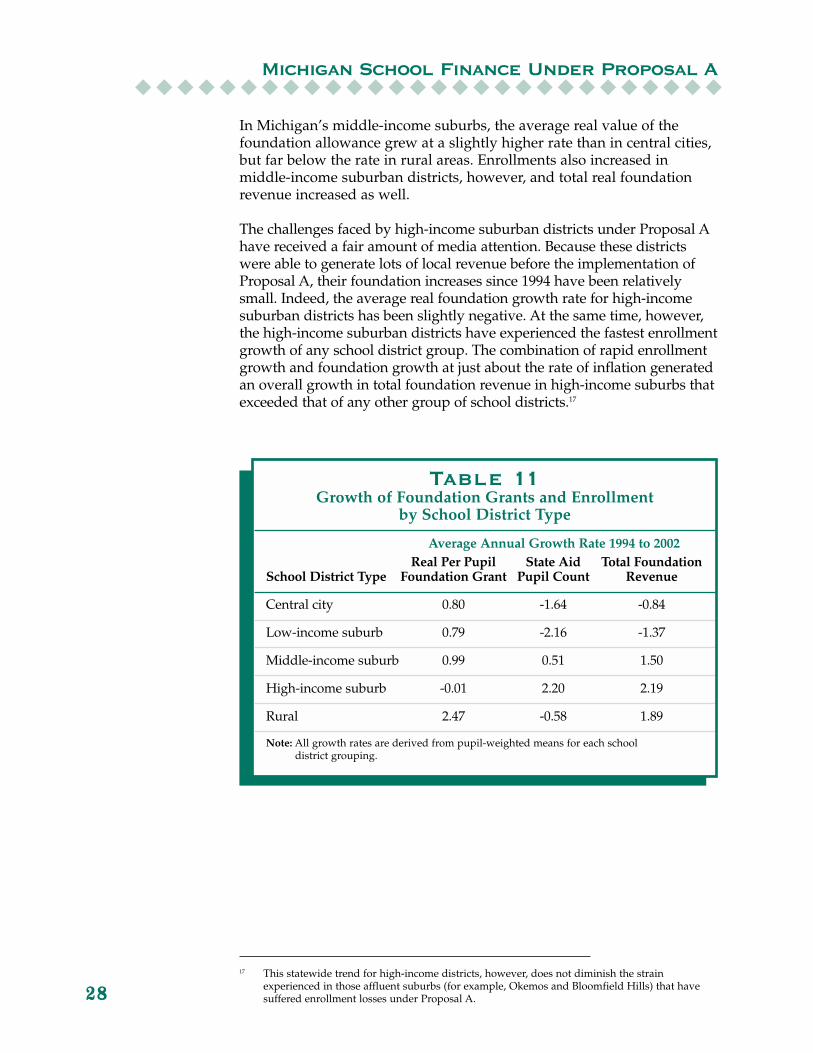
In Michigan’s middle-income suburbs, the average real value of thefoundation allowance grew at a slightly higher rate than in central cities,but far below the rate in rural areas. Enrollments also increased inmiddle-income suburban districts, however, and total real foundationrevenue increased as well.
The challenges faced by high-income suburban districts under Proposal Ahave received a fair amount of media attention. Because these districtswere able to generate lots of local revenue before the implementation ofProposal A, their foundation increases since 1994 have been relativelysmall. Indeed, the average real foundation growth rate for high-incomesuburban districts has been slightly negative. At the same time, however,the high-income suburban districts have experienced the fastest enrollmentgrowth of any school district group. The combination of rapid enrollmentgrowth and foundation growth at just about the rate of inflation generatedan overall growth in total foundation revenue in high-income suburbs thatexceeded that of any other group of school districts.17
28
Michigan School Finance Under Proposal A ◆ ◆ ◆ ◆ ◆ ◆ ◆ ◆ ◆ ◆ ◆ ◆ ◆ ◆ ◆ ◆ ◆ ◆ ◆ ◆ ◆ ◆ ◆ ◆ ◆ ◆ ◆ ◆
Table 11Growth of Foundation Grants and Enrollment
by School District Type
Average Annual Growth Rate 1994 to 2002Real Per Pupil State Aid Total Foundation
School District Type Foundation Grant Pupil Count Revenue
Central city 0.80 -1.64 -0.84
Low-income suburb 0.79 -2.16 -1.37
Middle-income suburb 0.99 0.51 1.50
High-income suburb -0.01 2.20 2.19
Rural 2.47 -0.58 1.89
Note: All growth rates are derived from pupil-weighted means for each school district grouping.
17 This statewide trend for high-income districts, however, does not diminish the strainexperienced in those affluent suburbs (for example, Okemos and Bloomfield Hills) that havesuffered enrollment losses under Proposal A.

The greatest fiscal stress under Proposal A has been felt in urban schooldistricts and in those rural districts with very sharp enrollment declines,including many in the Upper Peninsula. The demographic forces thatunderlie these enrollment shifts are likely to continue. Michigan’s school-aged population is shifting from rural and poorer urban areas to suburbandistricts, and from older suburbs to newer suburbs on the periphery of the state’s metropolitan areas.
Proposal A facilitates this population shift, because school funding followsstudents as they move. At the same time, Proposal A also forces reductionsin educational services in districts where enrollment is declining.18 Newersuburban districts receive large infusions of additional funds to expandtheir educational offerings, while older urban communities must makestaffing and program cuts. These school budgetary changes, in turn,influence households’ perceptions of the condition of local schools. Schoolclosures and teacher layoffs can create negative perceptions that enhancethe prospect that additional families will leave a community, creating aself-reinforcing cycle. For these reasons, Proposal A may not only respondto suburban sprawl, but encourage it as well.
In the long run, school districts must adjust to enrollment changes.Proposal A, however, exacerbates the difficulty of budgetaryadjustments. Spending in declining-enrollment districts cannot bereduced fast enough to match falling revenues without damagingeducational programs, because some costs are essentially fixed in the short run.
By way of illustration, consider the following example based on theLivonia school district. Suppose the district lost one student from everyelementary classroom and one secondary school student from every class during a representative class period of the day. This would reduceenrollments by the equivalent of 743 full-time students, for a loss of over$5 million to the district at its current foundation allowance of $8,105. Yet under this scenario, district costs would scarcely be affected by theenrollment declines. In order to reduce spending in line with the drop in revenue, services and programs for students remaining in the districtwould have to be cut back.
The cost squeeze that accompanies declining enrollment under ProposalA is muted when per-pupil foundation allowances are rising rapidly. It is especially acute, as now, when foundation allowances are stagnantor declining. We return to this issue in our discussion of policy issues in Chapter IV.
29
State Control, Local Consequences◆ ◆ ◆ ◆ ◆ ◆ ◆ ◆ ◆ ◆ ◆ ◆ ◆ ◆ ◆ ◆ ◆ ◆ ◆ ◆ ◆ ◆ ◆ ◆ ◆ ◆ ◆ ◆
Proposal Amay not onlyrespond tosuburbansprawl, butencourage it as well.
18 Prior to Proposal A, Michigan’s system of school finance eased the adjustment process indeclining-enrollment districts somewhat, because local property tax revenues tended to fall lessrapidly than educational costs as enrollment fell.

The Changing Distribution of High-Cost Students
Proposal A aimed to reduce inequities in revenues, but it took virtuallyno account of differences in the cost of providing education services. If policymakers seek to encourage efficiency across a system of schools,then state funding must account for differences in the costs that localdistricts confront. In addition to the problems posed by decliningenrollment, two sources of cost differentials are particularly relevant:those related to regional difference in the cost of living, and those relatedto the added cost of serving special needs students.
The cost of living varies substantially across regions in Michigan, andthis translates into differentials among school districts in the cost ofproviding educational services. In general, costs tend to be higher inurban than in rural areas. Rural school districts face higher costs perpupil for transportation services, but personnel costs account for most of school operating expenditures. Prevailing wages and home prices are much higher in metropolitan Detroit than in most rural areas, andoperating costs for metropolitan area school districts are higher inconsequence. Unlike several other states, Michigan’s school fundingsystem provides no compensation for regional cost of living differences.
The special services required by students with disabilities or those “at-risk” due to family and community poverty entail substantialadditional expense. Michigan’s funding system accounts for only aportion of the added cost of these services through categorical funding.19
Since Proposal A prevents districts from obtaining additional revenuefrom local voters, the uncompensated expense of serving high-coststudents may diminish funds available for regular education students.
If all districts enrolled the same percentage of children with specialneeds, the added burden of educating these students would be equitablyshared across districts. When some districts enroll a larger share ofchildren with special needs than other districts, however, these districtsface a disproportionate financial burden. This is what has happened inMichigan since the adoption of Proposal A.
30
Michigan School Finance Under Proposal A ◆ ◆ ◆ ◆ ◆ ◆ ◆ ◆ ◆ ◆ ◆ ◆ ◆ ◆ ◆ ◆ ◆ ◆ ◆ ◆ ◆ ◆ ◆ ◆ ◆ ◆ ◆ ◆
19 The right of students with disabilities to free and appropriate services is protected under thefederal Individuals with Disabilities Education Act. Michigan reimburses only 28.6 percent ofallowable special education costs incurred by local districts, a reimbursement rate that is very lowby comparison to other states. Michigan districts serving high concentrations of students fromfamilies in poverty (measured by eligibility for free lunches) receive additional categoricalfunding at the rate of 11.5 percent (a 1.115 per-pupil weight) of their foundation allowance. Onlydistricts with 1993–94 per-pupil revenue under $6,500 are eligible for these “at-risk” funds.

A striking feature of the distribution of high- and low-cost studentsacross Michigan schools is that it is systematically related to districtenrollment change. Table 12 shows that there is a strong associationbetween the pace of district enrollment change and the share of studentswho are high-cost. The faster a district loses students, the larger theincrease in the share of remaining students who are poor or who havedisabilities. This suggests that the children leaving declining-enrollmentdistricts are more likely to be lower-cost students, while those left behindare disproportionately high-cost students. This change in studentcomposition clearly intensifies the fiscal strain in declining-enrollmentdistricts. A rising share of high-cost students squeezes school budgets,hastening cuts in educational programs and services. Service cuts in turnencourage additional families to leave the district, which brings aboutfurther reductions in school revenues.
31
State Control, Local Consequences◆ ◆ ◆ ◆ ◆ ◆ ◆ ◆ ◆ ◆ ◆ ◆ ◆ ◆ ◆ ◆ ◆ ◆ ◆ ◆ ◆ ◆ ◆ ◆ ◆ ◆ ◆ ◆
Table 12Shifts in Composition of Student Enrollment
in Growing and Declining Districts
% Change % Special Change in %Enrollment Number of Education Special Ed.1994–2001 Districts 1995 2001 1995–2001
< -20% 31 12.0 16.8 4.8
-20% to -5% 177 11.7 15.0 3.3
-5% to 5% 168 10.7 13.0 2.3
5% to 20% 133 9.9 11.5 1.6
> 20% 45 9.6 11.6 2.0
Total 554 10.9 13.3 2.4
Change in % Poor % Poor
1995 2001 1995–2001
< -20% 31 52.4 57.1 4.7
-20% to -5% 177 44.7 46.2 1.5
-5% to 5% 168 21.5 22.9 1.4
5% to 20% 133 16.2 16.5 0.3
> 20% 45 13.4 13.3 -0.1
Total 554 30.4 30.2 -0.2

Recent state and federal legislation, including No Child Left Behind, hasdefined and mandated high levels of achievement for all students. A keyquestion in school finance policy and litigation is whether the resourcesthat the state provides to public schools and school districts are adequateto accomplish these ambitious educational goals. The standard of“adequacy” will vary across schools and across students, because thecost of ensuring high achievement will be higher for some students thanfor others. Districts in high-cost regions and districts enrollingdisproportionate concentrations of high-cost students may requireadditional resources if they are to meet state accountability standards.
32
Michigan School Finance Under Proposal A ◆ ◆ ◆ ◆ ◆ ◆ ◆ ◆ ◆ ◆ ◆ ◆ ◆ ◆ ◆ ◆ ◆ ◆ ◆ ◆ ◆ ◆ ◆ ◆ ◆ ◆ ◆ ◆

Conclusions
Between 1994 and 2002, Proposal A was associated with modest growthof average per-pupil spending in the state. It also substantially reducedinequality across districts. After ten years, however, Michigan’s schoolfinance system is under increasing strain, for two main reasons.
First, there are growing concerns about the stability and adequacy of the revenues that flow into the state’s school aid fund. Under Proposal A, Michigan’s school funding is more vulnerable to businesscycle fluctuations, as recent declines in the value of the per-pupilfoundation allowance demonstrate. In addition, the state’s SAF has relied on substantial transfers of revenue from the state’s General Fund. Transfers on this scale will be difficult to sustain in light of thestructural deficit in the General Fund.
Second, Proposal A does not adequately address potentially largemismatches between the revenues that districts receive and the costs that they must bear. This problem has three key dimensions, which are attributable to declining district enrollment, concentrations of high-cost students, and regional cost of living differences.
Proposal A has affected different school districts in different ways. The reform generated large increases in per-pupil funding in over 300school districts, particularly formerly low-revenue districts in rural areas.In addition, until the state’s current fiscal crisis, foundation allowancegrowth in suburban areas surpassed inflation in all but the highest-revenue districts. At the same time, the fiscal circumstances of districtsthroughout the state have come to depend heavily on the local rate ofenrollment growth or decline.
Our analyses show that Michigan’s urban school districts have beenespecially hard pressed under Proposal A, because of (1) relatively slow foundation allowance growth, (2) rapid enrollment loss, and (3) a rising share of students who are high-cost. These elements wereproducing fiscal stress in urban school districts even before the currentbudget crisis arrived.
In the following chapter we suggest policy changes that would help toensure that Michigan can continue to provide adequate funding for allschools and students, while protecting the equity and efficiency gainsthat Proposal A has brought to the state’s education system.
33
State Control, Local Consequences◆ ◆ ◆ ◆ ◆ ◆ ◆ ◆ ◆ ◆ ◆ ◆ ◆ ◆ ◆ ◆ ◆ ◆ ◆ ◆ ◆ ◆ ◆ ◆ ◆ ◆ ◆ ◆
After ten years,Michigan’sschool financesystem is under increasingstrain.

34
Michigan School Finance Under Proposal A ◆ ◆ ◆ ◆ ◆ ◆ ◆ ◆ ◆ ◆ ◆ ◆ ◆ ◆ ◆ ◆ ◆ ◆ ◆ ◆ ◆ ◆ ◆ ◆ ◆ ◆ ◆ ◆

IVCURRENT ISSUES IN
SCHOOL FINANCE POLICY
We begin from the premise that the policy framework defined by Proposal A has generally worked well for Michigan’s schools andtaxpayers. Property taxes have been significantly reduced, and thefinancial disparities between Michigan’s highest- and lowest-spendingschool districts have been reduced as well. These are majoraccomplishments, which policymakers should strive to protect.
The overall good that Proposal A has produced does not mean thatMichigan’s school finance policies cannot be improved. The Legislaturehas already made a variety of changes in Proposal A concerning the rules for establishing student counts. Further changes in Proposal Acould help to address other critical issues in Michigan school finance and make Michigan’s school funding system work even better. The changes that we propose would protect the gains that Michigan hasexperienced as a result of Proposal A, while easing some of the financialand administrative burdens that Proposal A has imposed on schools and school districts.
In the current debate about “tweaking” Proposal A, one basic policyquestion must be addressed directly. Much of this debate has focused on the question whether local school districts should be given theopportunity to increase their revenues by restoring their right to levy property taxes to support local schools. There is growing politicalpressure to permit “enhancement millages” in several parts of the state,including districts that have experienced revenue losses under Proposal A as well as districts that have not “won” as much as theywould like.
Our answer to this question is an emphatic “no.” Reintroducing localproperty taxes to support local schools is a bad idea. It would quicklyunravel the gains that have been accomplished by Proposal A, to the benefit of a relatively small—and, for the most part, relatively wealthy—set of school districts.
In our view there are two key features of Proposal A that merit legislativeattention. The first is the problem of adequacy, stability and growth in system-wide revenue. This problem has two main dimensions. On the one hand, the revenues that flow into the School Aid Fund (SAF)have consistently fallen short of the spending promises made by theLegislature, and they will continue to do so without structural changes in Proposal A. On the other hand, the shift from property taxes to salesand income taxes as the principal revenue source for Michigan’seducation system has increased the vulnerability of school funding to business cycle fluctuations. 35
State Control, Local Consequences◆ ◆ ◆ ◆ ◆ ◆ ◆ ◆ ◆ ◆ ◆ ◆ ◆ ◆ ◆ ◆ ◆ ◆ ◆ ◆ ◆ ◆ ◆ ◆ ◆ ◆ ◆ ◆
Reintroducinglocal propertytaxes to supportlocal schools isa bad idea.

The second problem with Proposal A is the mismatch that it createsbetween revenues and costs. This problem also has two dimensions. On the one hand, Proposal A poses a serious challenge for districts whereenrollment is declining. Many of these districts are in rural areas or inlow-income urban centers. Enrollment decline is driven mainly by long-term population shifts, but it has been encouraged and accelerated bypublic policies including Proposal A. On the other hand, Proposal Afails to acknowledge the different cost of educating different kinds ofstudents. This exacerbates the difficulties of schools and school districtsthat educate a disproportionate share of high-cost students, and of thosethat operate in high-cost regions of the state. The fact that declining-enrollment districts also educate a disproportionate share of high-coststudents serves only to reinforce their fiscal plight.
The urgency of the state’s current budget crisis is likely to distract theattention of policymakers from longer-term issues in Michigan schoolfinance. As the state confronts immediate budget shortfalls, however, it makes sense to address these in ways that strengthen rather thanundermine the long-term equity, adequacy, and efficiency of Michigan’ssystem for funding its schools. Some necessary reforms in Proposal Amay help address immediate revenue needs and simultaneously increasethe long-term performance of the public school system. Before addressingthe possibility of structural reforms in Proposal A, therefore, we brieflydiscuss state and local responses to Michigan’s current budget crisis.
A. Responding to the Current Budget Crisis
1. Funding reductions
School finance is once again at the top of the policy agenda in Michigan, as the state faces its worst budget crisis in half a century. In the 2003 fiscalyear, a revenue shortfall in the SAF has produced the first reductions infoundation support for Michigan school districts since Proposal A wasapproved in 1994. The projected revenue shortfall for the 2004 fiscal year is even larger, which could require even deeper cuts.
For the 2003 fiscal year, Governor Granholm issued a directive thatreduced school funding by $127 million through a pro-rata cut of 3.8percent in the state’s non-constitutional funding for Michigan schools. The 2003 budget adopted by the Michigan Legislature called for restoringthese cuts and avoiding cuts in the foundation allowance for the 2004 fiscal year. Whether this can be accomplished depends on how Michigan’seconomy performs in the next several months. There is a good chance that the Legislature may once again need to decide how to distributebudget cuts across school districts.
36
Michigan School Finance Under Proposal A ◆ ◆ ◆ ◆ ◆ ◆ ◆ ◆ ◆ ◆ ◆ ◆ ◆ ◆ ◆ ◆ ◆ ◆ ◆ ◆ ◆ ◆ ◆ ◆ ◆ ◆ ◆ ◆
Some necessaryreforms in
Proposal Amay help
addressimmediate
revenue needsand
simultaneouslyincrease the
long-termperformance of
the publicschool system.
This is not a simple problem, because there is no uniquely “fair” way to assign the cuts. Different strategies will have larger effects in somedistricts than in others. Should the districts that benefited most fromProposal A give back some of their winnings, thus surrendering some of the equity gains from Proposal A? Or, should the districts that have lostground since the approval of Proposal A bear additional losses, furtherdamaging the educational opportunities available to local children?
Pro rata cuts were the only option available in fiscal year 2003. Alternativestrategies for cutting expenditures would have required action by the Legislature, and the Legislature could not agree on an alternativeapproach. For 2004, however, deliberations are underway to find a “fairer” way to distribute anticipated budget cuts across Michigan’sschool districts.
We consider alternative mechanisms for state education funding cutsbelow. Their relevance may extend beyond the current budget crisis. If they fail to address structural problems in the adequacy and stability of the SAF, state policymakers will confront equally hard choices for how to implement budget cuts in years to come.
Pro-rata reduction
Pro-rata cuts are percentage reductions in the state’s non-constitutionalfunding for schools. Two major sources of school funding, constitutionallyprotected funding and funding that the state does not collect, are notsubject to pro-rata cuts. Under Proposal A, the Michigan Constitutionguarantees that no school district will ever receive less revenue than it received from state and local sources in 1994–95. This amount isconstitutionally protected, and therefore not subject to pro-ration.20
The most important revenues that the state does not collect come fromlocal property taxes on non-homestead property and “hold harmless”millages collected in the highest-spending school districts. Others include federal grants to school districts and funds distributed as a part of the Durant settlement.21 Because so many revenue sources areexcluded from pro-rata cuts, pro-ration requires proportionately largerpercentage cuts in unprotected revenues to generate any given level ofsavings for the state budget.
37
State Control, Local Consequences◆ ◆ ◆ ◆ ◆ ◆ ◆ ◆ ◆ ◆ ◆ ◆ ◆ ◆ ◆ ◆ ◆ ◆ ◆ ◆ ◆ ◆ ◆ ◆ ◆ ◆ ◆ ◆
If they fail to addressstructuralproblems in theadequacy andstability of theSAF, statepolicymakerswill confrontequally hardchoices for howto implementbudget cuts inyears to come.
20 The amount ranges from $4,200 in Onaway and many other rural districts to over $10,000 inBirmingham and Bloomfield Hills.
21 In Durant v. State of Michigan, the Michigan Supreme Court ruled against the state in a 17-yearstruggle over special education funding and directed the state to pay more than $200 million to83 school districts and one ISD.

Budget cuts based on pro-ration hit the poorest school districts especiallyhard, for two main reasons. First, in Michigan’s high-spending schooldistricts the share of educational revenue that is constitutionally protectedis relatively high. These districts also collect substantial supplementalrevenue locally through “hold harmless” millages. In consequence, pro-ratacuts produce minimal revenue losses in districts like Bloomfield Hills andBirmingham, and much larger losses in poor districts that receive more oftheir revenue from the state.
Second, high-poverty school districts depend on categorical programsincluding “at-risk” funding to a far greater extent than wealthier districts.Categorical grants from the state are subject to pro-rata reductions, whichcut revenues in the poorest school districts even further.
In addition, pro-ration produces large and arbitrary variations in the size of budget cuts across districts, based on the percentage of theirproperty wealth that is non-homestead property. School districts thathouse valuable non-homestead property collect a large share of theirtotal revenues locally. As a result, only a relatively small share of theirtotal revenue is subject to a pro-rata cut. A school district where a powerplant is located, for example, may receive virtually no state revenues tosupport local schools, so pro-ration has a very small impact on totalrevenues. In districts where non-homestead property is of little value, in contrast, most educational revenues come from the state. In thesedistricts a larger share of total revenue is subject to pro-ration, and pro-rata cuts have a much larger impact.
Uniform dollar reduction
Another way to distribute budget cuts would be to reduce revenues in all school districts by the same absolute dollar amount per pupil.22
If this strategy had been adopted during the 2003 fiscal year instead ofpro-ration, it would have amounted to a cut of roughly $69 per pupil inall Michigan school districts. Reducing all district budgets by the sameper-pupil amount would impose larger costs on most wealthy districtsthan pro-rata cuts, because the constitutional protections that exemptmuch of their revenue from pro-ration would not apply. In percentageterms, however, uniform per-pupil reductions require larger budget cutsin low-revenue than in high-revenue school districts.
38
Michigan School Finance Under Proposal A ◆ ◆ ◆ ◆ ◆ ◆ ◆ ◆ ◆ ◆ ◆ ◆ ◆ ◆ ◆ ◆ ◆ ◆ ◆ ◆ ◆ ◆ ◆ ◆ ◆ ◆ ◆ ◆
22 A bill that would establish this as the rule for future budget reductions under Proposal Apassed the Michigan House of Representatives in 2003.

Uniform percentage reduction
A third alternative would cut the per-pupil foundation allowance in allMichigan school districts by the same percentage. Under this alternative,high-revenue districts would return more to the state than low-revenuedistricts, for the obvious reason that their budgets are larger. With a 1 percent cut, for example, a district with foundation revenue of $10,000per pupil would return $100 per pupil, while a district with foundationrevenue of $6,700 would return $67 per pupil.
Exempting specific revenue sources
In addition to these possibilities, the Legislature could exempt specificrevenue sources from required budget reductions. Exempting categoricalgrants targeted to high-cost students makes good sense, on both equityand efficiency grounds. In her budget proposal for 2003, for example,Governor Granholm sought to protect funding for the “at risk”categorical grant from cuts, on the ground that school districts thateducate large numbers of poor children face the greatest challenges andthe highest costs.
Policy Recommendation
The key question that the Legislature must answer in considering budgetreductions is whether the equity gains produced by Proposal A whenrevenues were rising will be further enhanced, protected, or reversednow that revenues have begun to fall. In our view, two principles shouldguide decisions about budget cuts.
◆ First, revenue cuts should not be influenced by arbitrary districtcharacteristics—that is, characteristics that are unrelated to educationalcosts or needs.
◆ Second, revenue cuts should not fall disproportionately on low-incomedistricts, because they face the state’s greatest educational challenges.
By both of these criteria, uniform dollar reductions and uniformpercentage reductions are superior to pro-rata cuts. In recent budgetnegotiations, the Legislature established uniform dollar reductions as the basis for future revenue cuts, but either one of these options is defensible. Regardless of which alternative is chosen, the revenue base on which reductions are imposed should exclude categoricalfunding targeted to the education of high-cost students (particularlyfunding for special education and “at-risk” students) in order to avoidfurther damage to Michigan’s neediest students and schools.
39
State Control, Local Consequences◆ ◆ ◆ ◆ ◆ ◆ ◆ ◆ ◆ ◆ ◆ ◆ ◆ ◆ ◆ ◆ ◆ ◆ ◆ ◆ ◆ ◆ ◆ ◆ ◆ ◆ ◆ ◆
The key question thatthe Legislaturemust answer in consideringbudgetreductions is whether the equity gainsproduced byProposal Awhen revenueswere rising will be furtherenhanced,protected, orreversed nowthat revenueshave begun to fall.

2. Enhancing Revenue and Increasing Efficiency
Faced with the prospect of declining revenues, most Michigan schooldistricts have begun to respond in familiar ways: closing schools,reconfiguring grades, laying off teachers and eliminating innovativeprograms. Cutting local budgets in these ways may do significantdamage to the quality of education that Michigan children receive.
While cutting programs and laying off teachers are not the mostdesirable responses to the current budget crisis, most districts haveenjoyed limited success in identifying alternative strategies that mightprotect or even enhance the educational opportunities provided to localchildren. As state support for education stagnates or declines, however,there are ways in which local actors can enhance revenues or increaseefficiency in order to improve the educational services that they provide.
Revenue enhancement: ISD millages
As noted above, Proposal A permits school districts in an IntermediateSchool District (ISD) to levy up to three additional mills on propertywithin the ISD with the approval of local voters. The enhancementmillage must be approved by a majority of voters in the ISD, and the newrevenues must be distributed across all of the constituent school districtsin the ISD on a uniform per-pupil basis. The value of a mill ranges fromjust under $100 to over $300 per-pupil across the 57 ISDs in Michigan.
In the Kent ISD, for example, levying one mill on property would yieldapproximately $171 per pupil. This one mill levy would produce morethan $3.5 million per year for the Grand Rapids Public Schools, and morethan $500,000 per year for districts including Northview, Lowell, andKenowa Hills. Levying three mills would produce three times as muchrevenue. New revenues from ISD millages could help school districts toavoid the most damaging consequences of the present budget crisis.
40
Michigan School Finance Under Proposal A ◆ ◆ ◆ ◆ ◆ ◆ ◆ ◆ ◆ ◆ ◆ ◆ ◆ ◆ ◆ ◆ ◆ ◆ ◆ ◆ ◆ ◆ ◆ ◆ ◆ ◆ ◆ ◆

Increased efficiency: consolidation and shared services
Despite the tradition of local control in Michigan’s public school system,there is growing recognition that cooperative ventures involving multipleschools and school districts can enhance efficiency and service quality. It no longer makes sense for all Michigan school districts to provide a full array of services—from transportation to payroll administration to Advanced Placement courses—”in house.” Finding ways to shareresources across district boundaries may provide cost savings, and expandthe educational opportunities available to many students. In a period ofdeclining budgets, taking advantage of these opportunities should be anurgent priority.
One possibility is consolidation, in which two or more local schooldistricts agree to merge into a single, larger district. There are manysteps that can be taken short of full consolidation, however. Theseinclude sharing administrative and other services, and providing joint instructional programs (on-site or on-line). Some of thesearrangements can be established through bi-lateral or multi-lateralcooperation among districts. Others may require leadership andcoordination through the ISDs.
Michigan families are demanding an ever-expanding array of specializededucational experiences for their children (e.g., science and technologyintensive programs, alternative education, advanced placement courses,compensatory education, vocational education, expanded foreignlanguage instruction). While educators may agree on the educationalmerit of such programs, providing them can be prohibitively expensivefor individual districts.
Cooperative ventures among districts may offer real savings in programcosts and significant benefits for students in public schools. Takingadvantage of these opportunities would require districts to worktogether and share resources in unfamiliar ways. This might posepolitical challenges, but in a period of increasingly tight budgets the familiar alternatives are surely worse.
41
State Control, Local Consequences◆ ◆ ◆ ◆ ◆ ◆ ◆ ◆ ◆ ◆ ◆ ◆ ◆ ◆ ◆ ◆ ◆ ◆ ◆ ◆ ◆ ◆ ◆ ◆ ◆ ◆ ◆ ◆

B. Stability, Adequacy, and the General Fund Gap
Under Michigan’s centralized system of school finance, the fiscal prospectsof every school district in the state depend on the stability and growth ofthe revenue streams flowing into the School Aid Fund (SAF). With respectto stability, it is desirable for the SAF to rely on revenue sources that do notvary dramatically over the course of the business cycle. Stability in the SAFmakes it possible for school districts to budget and plan on the basis ofrealistic revenue estimates. With respect to growth, the SAF should expandover time as economic activity and incomes in the state expand. Steadygrowth in the revenue base of the SAF is necessary to ensure that the funds available for school districts are adequate to meet the rising cost of educating Michigan students. The current budget crisis makes it clearthat the stability and adequacy of funding for Michigan’s schools underProposal A need to be improved.
1. Stability of revenue sources
The SAF now relies very heavily on relatively volatile funding sourcesincluding income and sales taxes. As the present budget crisisdemonstrates, reliance on revenues from these sources leaves the SAF vulnerable to economic downturns. Shifting the mix of taxes that go into the SAF to include greater reliance on property taxes wouldprovide greater revenue stability for Michigan’s schools. In contrast to revenues from sales and income taxes, state education property taxcollections have continued to grow right through the recession.
2. Adequacy of SAF revenues
In every year since Proposal A was approved, the Legislature has had to appropriate a significant amount of General Fund money to “top up”the funds available in the SAF in order to finance increases in foundationallowances. In the past two years the Legislature has also providedsignificant revenues from the Budget Stabilization Fund and othersources to meet budgetary promises to school districts. Eliminating theGeneral Fund “gap” in the SAF would require earmarking additionalrevenue sources for schools.
42
Michigan School Finance Under Proposal A ◆ ◆ ◆ ◆ ◆ ◆ ◆ ◆ ◆ ◆ ◆ ◆ ◆ ◆ ◆ ◆ ◆ ◆ ◆ ◆ ◆ ◆ ◆ ◆ ◆ ◆ ◆ ◆

Policy Recommendation
In our view, the best way to increase the stability of the SAF would be to increase the statewide education property tax rate, with the newrevenues earmarked for the SAF. Increasing the statewide property taxon homestead and non-homestead property from six to eight mills, for example, would generate approximately $600 million per year. A property tax increase of this magnitude would sustain the modest rate of revenue growth received by Michigan schools between 1994 and 2002,but not increase it further.
This shift would have four desirable consequences. First, it would makeeducation funding less vulnerable to cyclical changes in Michigan’seconomy, making revenues for schools more predictable over time.Second, it would support growth in the SAF, because the current stateeducation property tax has been more responsive to long-term growth in state economic activity than other taxes earmarked for the SAF. Third,it could be structured to eliminate the General Fund “gap” in the SAF,replacing annual appropriations from the Legislature with earmarkedrevenues. Finally, assigning these new revenues to the SAF would easethe current pressure on the General Fund, freeing revenue for otherpurposes of state government that are virtually certain to face seriouscuts in the next year or so.
An increase in the statewide property tax would probably require a voteof the people. For the owner of an average home with a market value of$128,000, state equalized value of $64,000, and taxable value of $50,000,two additional mills would raise annual property tax payments by $100.This compares to Proposal A’s property tax cut on the same home of$2,000 per year.23 The actual income forgone by the taxpayer in thisexample would in fact be significantly less than $100, because propertytax payments, unlike sales taxes, are deductible from federal incometaxes. In effect, the federal government would subsidize roughly aquarter of the state’s additional revenue collection.24
43
State Control, Local Consequences◆ ◆ ◆ ◆ ◆ ◆ ◆ ◆ ◆ ◆ ◆ ◆ ◆ ◆ ◆ ◆ ◆ ◆ ◆ ◆ ◆ ◆ ◆ ◆ ◆ ◆ ◆ ◆
23 This example relies on the Michigan Department of Treasury’s estimate of the market andtaxable values for the average Michigan home and the estimated annual property tax saving forthis property in 2002 as a result of Proposal A.
24 The actual subsidy for individual taxpayers would depend on their marginal tax rate under thefederal income tax. For taxpayers who itemize deductions, the higher one’s tax bracket, thelarger the percentage of property tax payments the federal government would pay.

C. The Mismatch Between Revenues and Costs
The revenues that school districts receive from the state under Proposal Amay not always meet the cost of providing an adequate education for local students, for two main reasons. On the one hand, the value of thefoundation allowance is the same for all students in a school district orcharter school, even though the cost of providing an adequate educationcan be far higher for some students than for others. Categorical grantsdefray some of these additional costs, but school districts and charterschools that educate a disproportionate share of high-cost students maynevertheless find themselves at a severe financial disadvantage. Moreover,costs are higher in some regions of the state than in others, which may alsojustify differential funding. On the other hand, revenues fall much fasterthan costs in school districts where enrollment is declining. The resultingmismatch between revenues and costs makes it difficult to provide anadequate education for the students who remain enrolled.
1. Cost-based funding
In contrast to the school funding formulas in several other states,Michigan’s school aid is not adjusted for the different cost of living (and running schools) in different parts of the state, nor does it fullyacknowledge the differential cost of educating different kinds of students(e.g., elementary versus secondary students, children with special needs).Taking fuller account of cost differentials in the distribution of stateschool aid would offer two key benefits.
First, it would address the concerns expressed by schools and schooldistricts in high-cost regions of Michigan that the revenues they receivefrom the state fall short of the amounts needed to meet their educationalresponsibilities. Second, adjusting state funding to reflect cost differencesamong students would make Michigan’s increasingly market-basededucation system work more fairly and efficiently. State funding nowcreates an incentive for schools to specialize in the education of low-coststudents. Cost-based funding would work against this incentive bycompensating school districts and charter schools that take on the greatestchallenges in the state’s education system.
44
Michigan School Finance Under Proposal A ◆ ◆ ◆ ◆ ◆ ◆ ◆ ◆ ◆ ◆ ◆ ◆ ◆ ◆ ◆ ◆ ◆ ◆ ◆ ◆ ◆ ◆ ◆ ◆ ◆ ◆ ◆ ◆
State fundingnow creates an incentive
for schools to specialize
in the education
of low-coststudents.

Policy Recommendation
There are two ways to address the mismatch between revenues and costs under Proposal A. On the one hand, the Legislature could adopt a weighted-pupil count, under which the value of the per-pupilfoundation allowance would be adjusted to reflect variability in the costof providing an adequate education for different students. For example, a larger weight in the funding formula might be assigned to high schoolstudents, or to students with special needs, or to students attendingschools in high-cost areas. The districts and charter schools where these students are enrolled would receive a larger per-pupil foundationallowance to meet the higher cost of educating them. Alternatively, thestate could increase the quantity of categorical funding that it targets to high-cost students and high-cost areas.
2. Transitional support for declining-enrollment districts
Providing transitional support to school districts where enrollment isdeclining would make it possible for these districts to respond morethoughtfully and deliberately to revenue reductions over time. Under the present system, falling enrollment can launch an acceleratingdownward spiral in local school districts, as budget reductions lead to program cuts and further enrollment declines. One Michigan schooldistrict has already “gone bankrupt,” and a growing number of othersare in danger of doing so.
Pupil counts used for the distribution of foundation revenue are basedon a blend of the current and previous year’s enrollment. In 1995, the head count procedure assigned a weight of 0.5 for enrollment in the previous spring and 0.5 for the current year. By 2002, the state’s“blended” pupil count gave weights of 0.2 for the previous year’senrollment and 0.8 for the current year’s. These changes have increased the fiscal strain on declining-enrollment districts.25
45
State Control, Local Consequences◆ ◆ ◆ ◆ ◆ ◆ ◆ ◆ ◆ ◆ ◆ ◆ ◆ ◆ ◆ ◆ ◆ ◆ ◆ ◆ ◆ ◆ ◆ ◆ ◆ ◆ ◆ ◆
25 In her proposed FY04 budget, Governor Granholm called for pupil count weights to be restoredto 50 percent based on last year’s enrollment and 50 percent on the current year’s enrollment.The Legislature rejected this change. The current formula favors districts where enrollments arestable or increasing.

As noted in Section III, declining enrollment in Michigan is primarilyconcentrated in rural and urban school districts. The Legislature hasalready enacted changes in head count procedures to ease the financialplight of declining-enrollment rural districts. Since 2000, districts withfewer than 1,500 students and enrollment density of less than 4.5students per square mile have been able to calculate their pupil count asthe average of the prior three years, if that generates a higher figure than the standard blended count. The three-year average enables these small rural districts to phase in their budgetary cuts more gradually than larger districts are required to do.26
Policy Recommendation
In our view, the best way to address the problems faced by declining-enrollment districts would be to increase the weight of past-yearenrollments in the formula for counting pupils, which would helpdistricts to minimize the damaging effects of rapid enrollment decline.The Legislature has already approved three-year enrollment averagingfor declining-enrollment rural school districts. At a minimum, thisopportunity should be extended to all districts. Declining-enrollmentschool districts could also receive targeted categorical grants to reducethe danger of an accelerating spiral of decline, but this is a lessattractive option.
46
Michigan School Finance Under Proposal A ◆ ◆ ◆ ◆ ◆ ◆ ◆ ◆ ◆ ◆ ◆ ◆ ◆ ◆ ◆ ◆ ◆ ◆ ◆ ◆ ◆ ◆ ◆ ◆ ◆ ◆ ◆ ◆
26 The population density threshold of 4.5 is so low that it also precludes many rural declining-enrollment districts from taking advantage of the three-year blended count average.

D. Funding for School Infrastructure
The question of infrastructure funding has received a lot of attention inrecent discussions of Proposal A and Michigan school finance.27 This is acritically important problem, but it has nothing to do with Proposal A.Proposal A changed the way that Michigan funds the operation of ourschools. It did not address the way that we fund school infrastructure.
Capital spending has increased dramatically in Michigan school districtssince 1994, in part because the reduction in property taxes brought aboutby Proposal A made voters less hostile to new bond issues. This increasehas not benefited all districts, however; in fact, it has increased the distancebetween those school districts with adequate facilities and those without.Michigan remains one of the few states that does not provide some form of subsidization for capital costs in low-property-wealth districts.
Capital expenditure for school construction and other investmentscontinues to rely entirely on local property tax revenue. As a result, school districts that are home to expensive residential property or valuablecommercial/industrial property are able to build marvelous schools.Districts that lack these advantages are unable to repair decaying buildingsconstructed in the nineteenth century. Inequities in capital funding arevastly greater than inequities in operational funding ever were, becausethe state makes almost no effort to supplement local resources when itcomes to capital spending.
Ensuring adequate school facilities for all Michigan students will requirenew legislation and new state revenues, independent of any changes that may be made in Proposal A. The Education Policy Center and theCitizens Research Council are currently conducting research aimed atassessing the scale of Michigan’s infrastructure needs and identifyingpolicy options for addressing these. A report based on this study will be published in 2004.
47
State Control, Local Consequences◆ ◆ ◆ ◆ ◆ ◆ ◆ ◆ ◆ ◆ ◆ ◆ ◆ ◆ ◆ ◆ ◆ ◆ ◆ ◆ ◆ ◆ ◆ ◆ ◆ ◆ ◆ ◆
Inequities incapital fundingare vastlygreater thaninequities inoperationalfunding ever were.
27 See “From Proposal A to Proposal A+: A discussion of issues and options regarding thefinancial requirements of public education in Michigan,” Report to the State Board of Educationfrom Tom Watkins, Superintendent of Public Instruction and the School Finance Task Force,March 2002. See also the follow-up report, “Financing Michigan’s Public Schools: Requirements,Issues, and Options,” October 2002.

48
Michigan School Finance Under Proposal A ◆ ◆ ◆ ◆ ◆ ◆ ◆ ◆ ◆ ◆ ◆ ◆ ◆ ◆ ◆ ◆ ◆ ◆ ◆ ◆ ◆ ◆ ◆ ◆ ◆ ◆ ◆ ◆

VCONCLUSION:
PRESERVING PROPOSAL A
On balance, the dramatic changes brought about by Proposal A havebeen decidedly positive. Proposal A led to a significant reduction inproperty taxes, while simultaneously reducing inequities in the way Michigan funds its schools. The financial framework defined byProposal A provides a sound basis for continued improvement in theequity and effectiveness of Michigan’s education system.
At the same time, Proposal A marks an unprecedented shift of power inMichigan’s education system, from local to state actors. In the past, localcitizens and educators played the leading role in decisions about localschools, including the level of funding. Communities could approvemillages that reflected their preferences for education or responded todistinctive local costs. Economists have long celebrated this local flexibilityas enhancing the overall efficiency of a state’s K-12 education system.
Under Proposal A, local authorities have lost the power to respond to local demands for more (or less) spending on schools. Instead they mustlook to Lansing. Now the key actors are state legislators and other groupsinfluential at the state level. Proposal A also implicitly tied school fundingto a wide range of other public policy issues. Decisions on questionsranging from business taxation to the payment of medical benefits forfamilies that lack private health insurance to incarceration guidelines for the state’s prisons now affect the resources available for local schools.
Discontent with the loss of local control over the quantity of resourcesavailable for local schools remains muted so long as funding is expanding.When funding is stagnant or declining, however, displeasure increases.With the present budget crisis in Michigan, the number of school districtsthat perceive themselves to be “losers” under Proposal A has growndramatically. The danger in the present moment is that political pressurefrom these communities will begin to undo the central accomplishments of Proposal A.
49
State Control, Local Consequences◆ ◆ ◆ ◆ ◆ ◆ ◆ ◆ ◆ ◆ ◆ ◆ ◆ ◆ ◆ ◆ ◆ ◆ ◆ ◆ ◆ ◆ ◆ ◆ ◆ ◆ ◆ ◆
The danger in the presentmoment is that politicalpressure from thesecommunitieswill begin to undo the centralaccomplishmentsof Proposal A.

To preserve the gains that have been accomplished under Proposal A, we have recommended three major changes in the way Michigan fundsits schools.
◆ The Legislature should take steps to ensure the stability and adequacyof revenues earmarked for the SAF. The best way to do this would befor the state to increase the state education property tax, and toearmark the revenues from this tax to the SAF. This change wouldsupport long-term planning for schools and school districts, andprotect students from unanticipated budget shortfalls.
◆ The Legislature should ensure that the basis for distributing revenuesto schools and school districts reflects the different cost of educatingdifferent students. This is essential on equity and adequacy grounds,because schools facing higher costs must overcome an immediatedisadvantage in their efforts to educate children to meet statestandards for student performance. A move toward cost-basedfunding is also essential in order to limit incentives to specialize in the education of low-cost students in Michigan’s increasinglycompetitive market for schooling.
◆ The Legislature should take further steps to provide transitionalsupport to school districts where enrollment is declining. Theprecipitous revenue declines that now accompany falling enrollmentsare doing severe damage to the quality of education in many schooldistricts. The financial burden that accompanies these declines mustbe distributed over a longer period, in order to give decliningdistricts an opportunity to adjust to reduced revenues in a moredeliberate and effective way.
These proposals reinforce one another. Without additional revenuesearmarked for the SAF, there is little chance of addressing decliningenrollment and cost differentials in school funding. By the same token,unless the problems of declining enrollment and cost differentials areaddressed, it is unlikely that additional SAF revenue will be allocated to the most pressing educational needs.
50
Michigan School Finance Under Proposal A ◆ ◆ ◆ ◆ ◆ ◆ ◆ ◆ ◆ ◆ ◆ ◆ ◆ ◆ ◆ ◆ ◆ ◆ ◆ ◆ ◆ ◆ ◆ ◆ ◆ ◆ ◆ ◆

A two-mill increase in the state property tax earmarked for the SAF wouldnot restore growth in Michigan’s education revenues to the rates thatprevailed before Proposal A. Nor would it preclude the need for continuedausterity among Michigan school districts and schools. It would, however,help to forestall cuts in education programs that will be unavoidableotherwise, at a time when the federal No Child Left Behind legislation hassharply increased performance expectations. It would increase the typicalMichigan homeowner’s property tax payment by less than 10 percent ofthe annual value of the property tax saving produced by Proposal A.
In this report we have also argued that the Legislature should resistdemands to “tweak” Proposal A by restoring local property taxes as afunding source for local schools. Restoring the local option to levyproperty taxes to support schools would over time undo many of theequity gains that Proposal A has brought about, to the benefit of arelatively small number of students.
The current budget crisis illuminates some fundamental problems in the way that Michigan now funds its schools. Addressing these problemsin the ways that we have suggested will help to preserve the gains thatMichigan has accomplished under Proposal A, while ensuring adequatefunding for the education of our state’s children into the future.
51
State Control, Local Consequences◆ ◆ ◆ ◆ ◆ ◆ ◆ ◆ ◆ ◆ ◆ ◆ ◆ ◆ ◆ ◆ ◆ ◆ ◆ ◆ ◆ ◆ ◆ ◆ ◆ ◆ ◆ ◆

52
Michigan School Finance Under Proposal A ◆ ◆ ◆ ◆ ◆ ◆ ◆ ◆ ◆ ◆ ◆ ◆ ◆ ◆ ◆ ◆ ◆ ◆ ◆ ◆ ◆ ◆ ◆ ◆ ◆ ◆ ◆ ◆

FURTHER READING
Charles L. Ballard, Paul N. Courant, Douglas C. Drake, Ronald C. Fisher,and Elizabeth R. Gerber. Michigan at the Millenium: A Benchmark andAnalysis of Its Fiscal and Economic Structure. Michigan State UniversityPress, 2003.
C. Philip Kearney and Michael F. Addonizio. A Primer on Michigan SchoolFinance. Fourth Edition. 2002.
Office of Revenue and Tax Analysis, Michigan Department of Treasury.“School Finance Reform in Michigan. Proposal A: Retrospective.”December 2002.
53
State Control, Local Consequences◆ ◆ ◆ ◆ ◆ ◆ ◆ ◆ ◆ ◆ ◆ ◆ ◆ ◆ ◆ ◆ ◆ ◆ ◆ ◆ ◆ ◆ ◆ ◆ ◆ ◆ ◆ ◆

54
Michigan School Finance Under Proposal A ◆ ◆ ◆ ◆ ◆ ◆ ◆ ◆ ◆ ◆ ◆ ◆ ◆ ◆ ◆ ◆ ◆ ◆ ◆ ◆ ◆ ◆ ◆ ◆ ◆ ◆ ◆ ◆

APPENDIXData Sources and Methods
Unless otherwise noted, the empirical results presented in this report rely on data obtained from the Michigan Department of Education. Data for other states, underlying Tables 4 and 6, were obtained from the U.S. Census Bureau.
The classification of school district types, presented in Tables 10 and 11,utilized National Center for Education Statistics (NCES) data. The NCESclassifies school districts using Metropolitan Statistical Areas (MSA)defined by the U.S. Office of Management and Budget.
Our “central city” classification includes school districts that the NCESclassifies as primarily serving “Large Cities” and “Mid-size Cities.” The NCES classifies a few suburban districts with extensive employmentas “Mid-sized Cities” (e.g., East Lansing, Dearborn, and Kearsley). We classified these districts as suburban.
Our suburban district classifications are based on two criteria: (1) theNCES classifies them as “serving an MSA but not primarily its centralcity” and (2) they have population density of at least 20 people persquare mile. The second condition is necessary because MSAs followcounty boundaries which may include outlying rural areas. Our “high-income suburb” classification includes suburban districts with medianhome value in 1990 greater than $95,000. Our “low-income suburb”classification includes suburban districts with median home value in1990 of less than $42,000. Our “middle-income suburb” group includessuburban districts with median home value in 1990 greater than or equalto $42,000 and less than or equal to $95,000.
Our “rural” district group includes those classified by the NCES as“outside an MSA” plus those within an MSA with population density of less than 20 people per square mile.
55
State Control, Local Consequences◆ ◆ ◆ ◆ ◆ ◆ ◆ ◆ ◆ ◆ ◆ ◆ ◆ ◆ ◆ ◆ ◆ ◆ ◆ ◆ ◆ ◆ ◆ ◆ ◆ ◆ ◆ ◆

56
Michigan School Finance Under Proposal A ◆ ◆ ◆ ◆ ◆ ◆ ◆ ◆ ◆ ◆ ◆ ◆ ◆ ◆ ◆ ◆ ◆ ◆ ◆ ◆ ◆ ◆ ◆ ◆ ◆ ◆ ◆ ◆

The Education Policy Center at Michigan State UniversityCollege of Education, 201 Erickson Hall, East Lansing, Michigan 48824-1034
Phone: (517) 355-4494 • Fax: (517) 432-6202