Embed Size (px)
Citation preview

STATE OF MICHIGAN
Michigan Fish Consumption Advisory Program
Guidance Document
Date Final: September 14, 2016
Version 4.0

ii
Contents
List of Tables ............................................................................................................................. iv
List of Figures ............................................................................................................................ iv
Acronyms, Abbreviations and Symbols ................................................................................... vii
Executive Summary ................................................................................................. ix
Michigan Fish Consumption Advisory Program Guidance Document ..................... 1
Introduction ................................................................................................................................. 1
Types of Fish Consumption Guidelines ...................................................................................... 1
Waterbody- and Species-Specific Guidelines ......................................................................... 1
Statewide Consumption Guidelines ........................................................................................ 6
Consumption Guidelines for Purchased Fish .......................................................................... 6
Emergency Fish Consumption Guidelines.............................................................................. 7
Methods for Calculating MDHHS Fish Consumption Screening Values (FCSV). ..................................................................................................... A-1
Background ............................................................................................................................. A-2
Risk Assessment Equations .................................................................................................... A-2
DDT, DDD, and DDE FCSV Worksheet ............................................................................... A-8
Toxic Equivalents for Dioxins, Furans and co-planar Polychlorinated Biphenyls (Dioxin-like Chemicals [DLCs]) FCSV Worksheet .................................................................................. A-11
Mercury FCSV Worksheet ................................................................................................... A-14
Polychlorinated Biphenyls (PCBs) FCSV Worksheet .......................................................... A-16
Perfluorooctane Sulfonate (PFOS) FCSV Worksheet .......................................................... A-19
Selenium FCSV Worksheet .................................................................................................. A-22
Toxaphene FCSV Worksheet ............................................................................................... A-25
Sum of Toxaphene Parlars 26, 50, 62 (∑3PC26,50,62) FCSV Worksheet .......................... A-28
Additional Public Health Considerations for Waterbody- and Species- Specific Consumption Guidelines..........................................................................B-1
Background ............................................................................................................................. B-2
Waterbody-Specific Conditions .............................................................................................. B-2
Dataset-Specific Conditions.................................................................................................... B-2
Supporting Documentation for Statewide Eat Safe Fish Guidelines for Species from Inland Waters Contaminated with Mercury. ...................................C-1
Introduction ............................................................................................................................. C-2
iii
Background ............................................................................................................................. C-2
Discussion ............................................................................................................................... C-3
Statewide Mercury Guidelines for Walleye ............................................................................ C-5
Statewide Mercury Guidelines for Northern Pike .................................................................. C-8
Statewide Mercury Guidelines for Muskellunge .................................................................. C-12
Statewide Mercury Guidelines for Largemouth & Smallmouth Bass .................................. C-13
Statewide Mercury Guideline for Yellow Perch ................................................................... C-15
Statewide Mercury Guideline for Rock Bass........................................................................ C-18
Statewide Mercury Guidelines for Crappie .......................................................................... C-20
Statewide Mercury Guideline for Sunfish ............................................................................ C-22
Statewide Mercury Guideline for Sucker ............................................................................. C-24
Statewide Guidelines for Bullhead ....................................................................................... C-26
Supporting Documentation for Statewide Eat Safe Fish Guidelines for Carp and Catfish from Inland Waters Contaminated with Mercury and PCBs. D-1
Introduction ............................................................................................................................. D-2
Background ............................................................................................................................. D-2
Discussion ............................................................................................................................... D-3
Statewide Consumption Guidelines for Carp ......................................................................... D-5
Statewide Consumption Guidelines for Channel Catfish ....................................................... D-8
Document Version Log. ................................................................... E-1
iv
List of Tables Table 1. Fish Consumption Screening Values (FSCV) for DDT plus metabolites, dioxin-like
chemicals, mercury, PCBs, PFOS, selenium, and toxaphene. .............................................. 5
Table A-1. Average body weights by age group. ....................................................................... A-4
Table A-2. Ingestion rate in ounces adjusted by body weight. ................................................... A-5
Table A-3. Ingestion rate (grams per day) for an 80-kg body weight and corresponding meal categories. .......................................................................................................................... A-5
Table A-4. Exposure frequency (fish meals per year) and corresponding meal categories. ...... A-6
Table B-1. Length breaks by fish species commonly encountered. [Note: This table can be updated with additional species and lengths as needed.] .................................................. B-5
Table C-1. Mercury Fish Consumption Screening Values (FCSV) by meal category. .............. C-4
Table C-2. Estimated mercury concentration (ppm) in filets of walleye from Michigan rivers and inland lakes based on samples collected from 1984 through 2010. Estimates are based on results of linear regression. ................................................................................................ C-6
Table C-3. Estimated mercury concentration (ppm) in filets of northern pike from Michigan rivers and inland lakes based on samples collected from 1984 through 2010. Estimates are based on results of linear regression. ................................................................................ C-9
Table C-4. Estimated mercury concentration (ppm) in filets of largemouth and smallmouth bass from Michigan rivers and inland lakes based on samples collected from 1984 through 2010. Estimates are based on results of linear regression. .............................................. C-14
Table D-1. Mercury Fish Consumption Screening Values by meal category. ........................... D-3
Table D-2. Polychlorinated Biphenyls Fish Consumption Screening Values by meal category.. D-4
List of Figures Figure C-1. Diagram of mercury cycling in a lake and watershed. From Engstrom (2007).
Copyright 2007 National Academy of Sciences, United States of America. .................... C-3
Figure C-2. Cumulative distribution function of mercury concentrations in walleye larger than 20 inches with estimated percentiles for key fish consumption screening values. ................ C-5
Figure C-3. Cumulative distribution function of mercury concentrations in walleye between 15 and 20 inches with estimated percentiles for key fish consumption screening values...... C-6
Figure C-4. Mercury concentration in filets versus length of walleye collected from Michigan inland lakes and impoundments between 1984 and 2010. ................................................ C-7

v
Figure C-5. Cumulative distribution function of mercury concentrations in all legal sized walleye with estimated percentiles for key fish consumption screening values. ........................... C-7
Figure C-6. Cumulative distribution function of mercury concentrations in northern pike at least 30 inches in length with estimated percentiles for key fish consumption screening values. ........................................................................................................................................... C-8
Figure C-7. Cumulative distribution function of mercury concentrations in northern pike between 24 and 30 inches in length with estimated percentiles for key fish consumption screening values. ................................................................................................................................ C-9
Figure C-8. Mercury concentration in filets versus length of northern pike collected from Michigan inland lakes and impoundments between 1984 and 2010. .............................. C-10
Figure C-9. Cumulative distribution function of mercury concentrations in northern pike at least 24 inches in length with estimated percentiles for key fish consumption screening values. ......................................................................................................................................... C-11
Figure C-10. Mercury concentrations in filets versus length of muskellunge collected from four Michigan waterbodies between 1985 to 2010. ................................................................ C-12
Figure C-11. Cumulative distribution function of mercury concentrations in largemouth and smallmouth bass at least 14 inches in length with estimated percentiles for key fish consumption screening values. ........................................................................................ C-13
Figure C-12. Mercury concentration in filets versus length of largemouth bass and smallmouth bass collected from Michigan inland lakes and impoundments between 1984 and 2010. .. C-14
Figure C-13. Cumulative distribution function of mercury concentrations in yellow perch 10 inches or larger with estimated percentiles for key fish consumption screening values. C-15
Figure C-14. Mercury concentration in filets versus length of yellow perch collected from Michigan inland lakes and impoundments between 1984 and 2010. .............................. C-16
Figure C-15. Cumulative distribution function of mercury concentrations in yellow perch with estimated percentiles for key fish consumption screening values. .................................. C-17
Figure C-16. Cumulative distribution function of mercury concentrations in rock bass with estimated percentiles for key fish consumption screening values. .................................. C-18
Figure C-17. Mercury concentration in filets versus length of rock bass collected from Michigan inland lakes and impoundments between 1984 and 2010. .............................................. C-19
Figure C-18. Cumulative distribution function of mercury concentrations in crappie with estimated percentiles for key fish consumption screening values. .................................. C-20
Figure C-19. Mercury concentration in filets versus length of crappie collected from Michigan inland lakes and impoundments between 1984 and 2010. .............................................. C-21
Figure C-20. Cumulative distribution function of mercury concentrations in sunfish with estimated percentiles for key fish consumption screening values. .................................. C-22
Figure C-21. Mercury concentration in filets versus length of sunfish collected from Michigan inland lakes and impoundments between 1984 and 2010. .............................................. C-23
vi
Figure C-22. Cumulative distribution function of mercury concentrations in sucker with estimated percentiles for key fish consumption screening values. .................................. C-24
Figure C-23. Mercury concentration in filets versus length of sucker collected from inland waters of Michigan between 1984 and 2010. ............................................................................. C-25
Figure C-24. Cumulative distribution function of mercury concentrations in bullhead with estimated percentiles for key fish consumption screening values. ................................. C-26
Figure C-25. Mercury concentrations in filets versus length of bullhead collected from Michigan inland lakes and impoundments between 1985 and 2006. .............................................. C-27
Figure D-1. Cumulative distribution function of PCB concentrations in carp from inland waters of Michigan with estimated percentiles for key fish consumption screening values. ....... D-5
Figure D-2. Total PCB concentration in filets versus length of carp collected from inland waters of Michigan between 2001 and 2010. ............................................................................... D-6
Figure D-3. Total PCB concentration in filets versus length of carp collected from inland waters of Michigan between 2001 and 2010. ............................................................................... D-7
Figure D-4. Mercury concentration in filets versus length of carp collected from Michigan inland lakes and impoundments between 1984 and 2010. ........................................................... D-7
Figure D-5. Cumulative distribution function of PCB concentrations in channel catfish with estimated percentiles for key fish consumption screening values. .................................... D-8
Figure D-6. Total PCB concentration in filets versus length of channel catfish collected from inland waters of Michigan between 1985 and 2010. ......................................................... D-9
Figure D-7. Cumulative distribution function of mercury concentrations in channel catfish with estimated percentiles for key mercury fish consumption screening values. ................... D-10
Figure D-8. Mercury concentration in filets versus length of channel catfish collected from inland waters of Michigan between 2002 and 2010. ....................................................... D-11

vii
Acronyms, Abbreviations and Symbols % percent / per < less than > greater than ∑ sum ≤ less than or equal to µ micro µg microgram(s) µU micro units ACL Analytical Chemistry Laboratory of the MDHHS Bureau of Laboratories AT averaging time BW body weight COC chemicals of concern CR cancer risk CSF cancer slope factor cv coefficient of variation DDD dichlorodiphenyldichloroethane DDE dichlorodiphenyldichloroethylene DDT dichlorodiphenyltrichloroethane DLC dioxin-like chemicals ED exposure duration EF exposure frequency EPA Environmental Protection Agency FAWCAC Fish and Wildlife Contaminants Advisory Committee FCMP Fish Contaminant Monitoring Program FCSV Fish Consumption Screening Values FDA Food and Drug Administration g gram(s) Guidelines Fish Consumption Guidelines Hg mercury IgG immunoglobulin G IgM immunoglobulin M IOM Institute of Medicine IR ingestion rate IRIS Integrated Risk Information System kg kilogram(s) LOAEL lowest-observed-adverse-effect level MDA Michigan Department of Agriculture, now known as MDARD MDARD Michigan Department of Agriculture and Rural Development MDCH Michigan Department of Community Health MDEQ Michigan Department of Environmental Quality MDHHS Michigan Department of Health and Human Services MDNR Michigan Department of Natural Resources MESB Michigan Environmental Science Board MFCAP Michigan Fish Consumption Advisory Program
viii
ml milliliter ng nanogram(s) NIH National Institute of Health NOAEL no-observed-adverse-effect level o,p’- ortho, para prime oz ounce p,p'- para, para prime PBPK physiologically-based pharmacokinetic model PC parlar congeners PCB polychlorinated biphenyl PFOS perfluorooctane sulfonate pg picogram(s) ppb part(s) per billion ppm part(s) per million ppt part(s) per trillion p-value probability value r2 coefficient of determination RfD reference dose RSC relative source contribution SAR structure-activity relationships TCDD 2,3,7,8-Tetrachlorodibenzo-p-dioxin TEQ toxic equivalency TSH thyroid stimulating hormone UCL upper confidence limit US United States
ix
Executive Summary Fish consumption guidelines (hereafter referred to as “Guidelines”) are public health advisories issued by the Michigan Department of Health and Human Services (MDHHS) under the authority of the Michigan Public Health Code (Act 368 of 1978). Since 1970, MDHHS1 has issued Guidelines to provide the public with the information needed to make decisions to protect themselves and their families from the health risks of consuming fish that contain environmental contaminants.
The department’s Mission statement summarizes the intent of Michigan’s Guidelines:
Protect, preserve, and promote the health and safety of the people of Michigan with particular attention to providing for the needs of vulnerable and under-served populations.2
When followed, the Guidelines help consumers to minimize the health risks and maximize the benefits of consuming fish from Michigan. These Guidelines are not regulatory requirements and are not enforced by legal authority.
The Michigan Fish Consumption Advisory Program issues four types of Guidelines: Waterbody- and Species-Specific Guidelines are issued for a specific Michigan surface
waterbody where specific types of fish have been tested and found to contain chemical contaminants.
Statewide Guidelines are issued when contaminants are found in one or more tested fish species from multiple waterbodies dispersed across Michigan. Statewide guidelines apply to all Michigan rivers and inland lakes, but not to the Great Lakes. Lake-wide advisories may be issued for an entire Great Lake if a contaminant is found in tested fish throughout the lake.
Purchased Fish Guidelines are based on the U.S. Food and Drug Administration mercury data collected from fish tested from the U.S. food supply.
Emergency Guidelines are issued when fish are tested and found to contain levels of chemical contaminants that raise immediate and unexpected public health concerns.
MDHHS develops Guidelines using U.S. Environmental Protection Agency (EPA) guidance that was extensively reviewed by Federal, State, and Native American tribal stakeholders.3 The EPA guidance for fish advisories in turn relies on an extensive body of human health risk assessment guidance and policy4 that has undergone extensive peer and public review.
Guidelines are reviewed prior to public release by the MDHHS Division of Environmental Health and the inter-departmental Fish and Wildlife Consumption Advisory Committee that
1 Former agency names are the Michigan Department of Public Health and the Michigan Department of Community Health. 2 MDCH Mission Statement http://www.michigan.gov/mdch/0,4612,7-132-63157_51216-100765--,00.html 3 U.S. EPA. Guidance for Assessing Chemical Contaminant Data for Use in Fish Advisories. Available at http://water.epa.gov. 4 See http://www.epa.gov/oswer/riskassessment/toolthh.htm.

ii
includes representatives from the Michigan Departments of Natural Resources, Environmental Quality, Agriculture and Rural Development, in addition to MDHHS.
1
Michigan Fish Consumption Advisory Program Guidance Document Introduction Fish consumption guidelines (hereafter referred to as “Guidelines”) are public health advisories issued by the Michigan Department of Health and Human Services (MDHHS) under the authority of the Michigan Public Health Code (Act 368 of 1978). Since 1970, MDHHS5 has issued Guidelines to provide the public with the information needed to make decisions to protect themselves and their families from the health risks of consuming fish that contain environmental contaminants. The department’s Mission statement summarizes the intent of Michigan’s Guidelines:
Protect, preserve, and promote the health and safety of the people of Michigan with particular attention to providing for the needs of vulnerable and under-served populations.6
The Guidelines include information about fish selection, preparation, and recommended frequency of consumption for everyone, including sensitive groups such as children. When followed, the Guidelines will help consumers to minimize the health risks associated with the contaminants found in fish. These Guidelines are not regulatory requirements and are not enforced by legal authority. Guidelines cannot be used to monitor temporal or spatial contaminant trends; input (loading or deposition) or removal of chemicals from a waterbody; or regulatory requirements or processes at sites impacted by point-source industrial contamination. Types of Fish Consumption Guidelines The Michigan Fish Consumption Advisory Program (MFCAP) produces four types of Guidelines: (1) waterbody- and species-specific; (2) statewide; (3) purchased; and (4) emergency. Waterbody- and Species-Specific Guidelines Overview The waterbody- and species-specific Guidelines are evaluated annually by MDHHS in cooperation with the Michigan Department of Environmental Quality (MDEQ), the Michigan Department of Natural Resources (MDNR), and the Michigan Department of Agriculture and Rural Development (MDARD). The MFCAP relies on fish contaminant data from the MDEQ’s Fish Contaminant Monitoring Program (FCMP). MDNR Fisheries Division and the MDEQ annually collect fish samples from 5 Former agency names are the Michigan Department of Public Health and the Michigan Department of Community Health. 6 MDCH Mission Statement http://www.michigan.gov/mdch/0,4612,7-132-63157_51216-100765--,00.html
2
selected waterbodies throughout Michigan. MDEQ processes the samples into species-appropriate edible portions (generally filets) that are provided to the MDHHS Bureau of Laboratories – Analytical Chemistry Laboratory (MDHHS-ACL) for chemical analysis and data validation. The MDEQ FCMP compiles the data into an annual report, which is posted online at (http://www.michigan.gov/deq/0,1607,7-135-3313_3686_3728-32393--,00.html). Assessment Process Fish Consumption Screening Values and Meal Categories MDHHS toxicologists develop Fish Consumption Screening Values (FCSVs) based on a review of the best available scientific literature about the adverse health effects associated with a chemical of concern (COC). FCSVs are chemical concentration ranges in fish tissue that are associated with the following fish meal categories:
• 16 meals per month • 12 meals per month • 8 meals per month • 4 meals per month • 2 meals per month • 1 meals per month • 6 meals per year • Limited • Do Not Eat
Appendix A provides a detailed description of the methodology used to develop the FCSVs and the associated fish meal categories.
Waterbody Selection and Sample Collection The MDNR Fisheries Division conducts annual assessments on the Great Lakes that border Michigan (Superior, Michigan, Huron, and Erie), connecting channels, and numerous inland rivers and lakes to meet fishery management needs. The MDEQ, in collaboration with MDHHS, requests samples of fish from waterbodies that have not been recently sampled (e.g., within 5 to 10 years), have not been adequately sampled (e.g., too few samples, limited range of fish lengths), or where there are outstanding analytical or public health questions. In addition to the MDNR sampling, the MDEQ conducts limited fish collections as needed. Typically, two fish species that accumulate COCs will be collected from a waterbody. The first species is usually a long-lived, top-predator fish that feeds on other fish (e.g., walleye, northern pike, lake trout, largemouth bass, or smallmouth bass). The second is a long-lived, fatty, omnivorous, bottom feeding species (e.g., catfish or carp). An ideal sample size is 10 or more fish per species from each waterbody. At the request of MDHHS and/or MDEQ, expanded-collections will be conducted on waterbodies with documented chemical contamination, extensive fishing activity, previously demonstrated elevated COC concentrations in fish, or outstanding public health questions.
3
Sample Storage, Processing, and Chemical Analysis Procedures for the storage and processing of fish samples are developed by the FCMP and documented in the annual reports available at http://www.michigan.gov/deq/0,1607,7-135-3313_3686_3728-32393--,00.html. The MDHHS-ACL conducts or oversees all fish analyses under established protocols and provides validated data to the FCMP and MFCAP. In brief, fish samples are labeled by location and maintained frozen until processed into the commonly eaten portion (generally filets) according to standard operating procedures. Each portion is treated as a discrete sample and analyzed for COCs. The list of COCs for analysis may differ by waterbody based on existing knowledge about likely contamination. In general, samples of top predator fish from inland lakes with no known point-source contamination are analyzed for mercury only. Samples from the Great Lakes, tributaries of the Great Lakes, large lakes near the Great Lakes, and lakes in southeast Michigan are analyzed for mercury, organochlorine pesticides, and polychlorinated biphenyls (PCBs). Selected samples are analyzed for dioxin-like chemicals (dioxins, furans, and dioxin-like PCBs). Additional analytes may be added when there are waterbody-specific chemical contamination concerns. Data Handling The MDHHS-ACL provides the validated analytical results to the MDEQ in an electronic spreadsheet format, which is then maintained in a database by the MDEQ FCMP. Dataset Selection MDHHS and MDEQ consider the following factors in selecting a representative dataset for each COC: (1) the number of samples; (2) the year(s) the fish were collected as it relates to known temporal trends of COCs in Michigan fish; (3) the fate and transport of the COC in the environment; (4) the source of contamination; and (5) behavior of fish in contiguous waters that lack migration barriers. Since multiple factors can determine the final dataset, MDHHS and MDEQ conduct the following analysis to maintain a consistent approach to selecting representative data.
1. The MFCAP has a goal of 10 or more data points, each from a discrete sample, for each chemical, species, and waterbody (or section of a large waterbody) combination per sampling year with at least two sample years conducted in the previous 10 years. An approximately even distribution of samples within and across the range of commonly harvested fish lengths is preferred. When these goals are not met, MDHHS and MDEQ may calculate summary statistics on available datasets with as few as five sample results per chemical and review datasets with less than five sample results for the occurrence of highly elevated concentrations. When dataset limitations exist, additional public health considerations may apply (Appendix B). MDHHS and MDEQ will request additional sample collection and analysis, as necessary. As new samples become available, these data are incorporated into an updated dataset.

4
2. The level of COCs found in a fish sample represents the measured concentration at the
time of sample collection; therefore more recent samples may be most representative of current contaminant levels. However, the MDEQ FCMP has documented temporal trends in the fish tissue concentrations of several persistent, bioaccumulative COCs. These trends are most reliable when fish contamination is a result of non-point sources. In these cases, older datasets can be considered representative of current concentrations and additional sample collection may not be necessary for chemicals whose temporal trend has been demonstrated to not change significantly (Appendix B).
3. The status of the source of COCs is also an important consideration. Many point sources of historical contamination have been identified and either eliminated or controlled. Temporal trend analysis at these locations may indicate either stable or declining levels of COCs in fish tissue. Sources that are either uncontrolled or not characterized with regards to the chemical’s fate from the source to the fish may increase the uncertainty about the representativeness of a dataset. Such datasets may require additional public health considerations when setting Guidelines (Appendix B).
4. Waterbody-specific datasets are preferred, but combining datasets of the same species in
contiguous waterbodies may be necessary if there are no barriers to fish migration. Factors such as the biology of the fish (e.g., migratory behavior), the absence of impediments to fish movement (e.g., dams), presence of a point-source chemical input, and comparison of concentrations in the same species collected from both waterbodies are considered when selecting representative datasets for contiguous waters.
Data Summary and Review Datasets are identified for either discrete chemicals (e.g., mercury, selenium, perfluorooctane sulfonate [PFOS]) or groups of chemicals (e.g., total polychlorinated biphenyls [PCBs]; sum of dichlorodiphenyltrichloroethane (DDT), dichlorodiphenyldichloroethylene (DDD), dichlorodiphenyldichloroethane (DDE); toxic equivalency of dioxins, furans, and co-planar PCBs) where appropriate. Methods for handling results below the limit of quantification or limit of detection are summarized in the FCMP report. Data that represent highly elevated concentrations are flagged for further evaluation. MDHHS-ACL may be requested to re-check the analytical data to ensure the data point is valid. Only data points demonstrated to be invalid are removed from the dataset. Summary statistics, including the minimum and maximum concentrations, median, mean and the 95% upper confidence limit (UCL) about the mean, are identified for each contaminant dataset as appropriate. For datasets with a minimum of five samples, a scatter plot and a regression equation of the COC concentrations (y-axis) versus fish length (x-axis) are created. Regressions that are found to be solely determined by a single data point or having a negative slope are not used in determining the consumption guidelines.
Identification of Meal Categories Where a regression analysis of a COC database identifies a positive slope with a correlation coefficient (R2) greater than 0.6, MDHHS uses this analysis to estimate COC concentrations for fish lengths between the minimum and maximum lengths in the dataset. The estimated
5
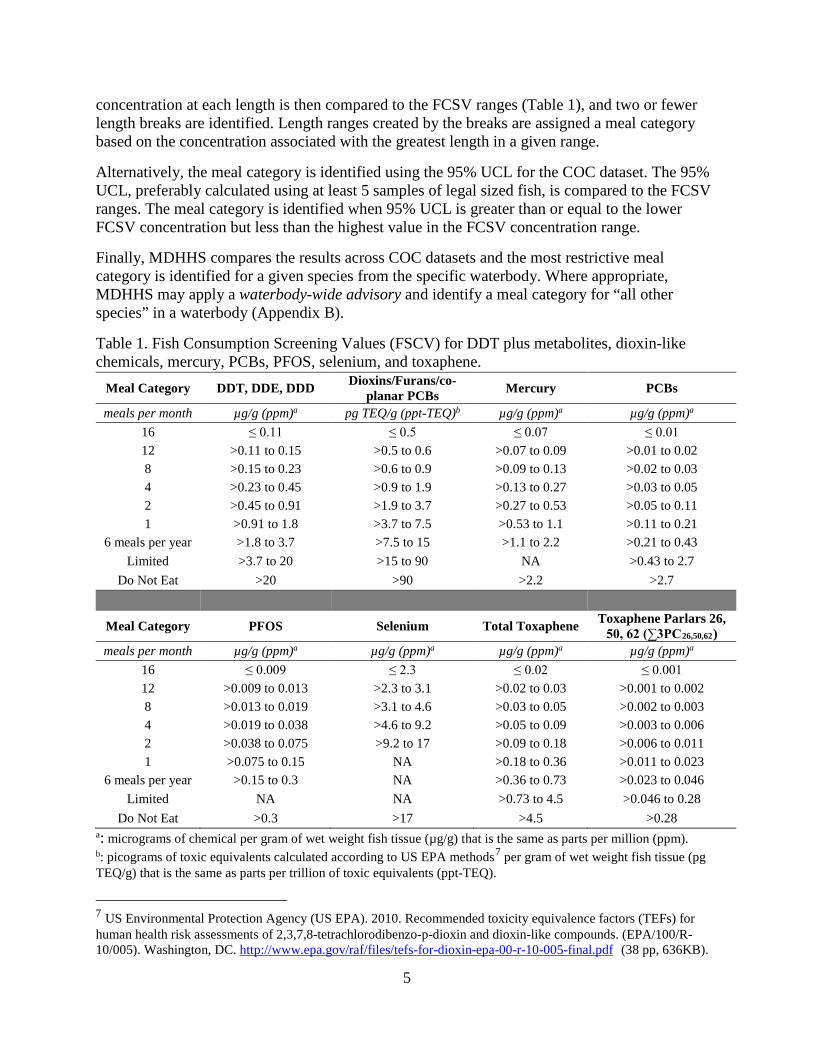
concentration at each length is then compared to the FCSV ranges (Table 1), and two or fewer length breaks are identified. Length ranges created by the breaks are assigned a meal category based on the concentration associated with the greatest length in a given range. Alternatively, the meal category is identified using the 95% UCL for the COC dataset. The 95% UCL, preferably calculated using at least 5 samples of legal sized fish, is compared to the FCSV ranges. The meal category is identified when 95% UCL is greater than or equal to the lower FCSV concentration but less than the highest value in the FCSV concentration range. Finally, MDHHS compares the results across COC datasets and the most restrictive meal category is identified for a given species from the specific waterbody. Where appropriate, MDHHS may apply a waterbody-wide advisory and identify a meal category for “all other species” in a waterbody (Appendix B). Table 1. Fish Consumption Screening Values (FSCV) for DDT plus metabolites, dioxin-like chemicals, mercury, PCBs, PFOS, selenium, and toxaphene.
a: micrograms of chemical per gram of wet weight fish tissue (µg/g) that is the same as parts per million (ppm). b: picograms of toxic equivalents calculated according to US EPA methods7 per gram of wet weight fish tissue (pg TEQ/g) that is the same as parts per trillion of toxic equivalents (ppt-TEQ).
7 US Environmental Protection Agency (US EPA). 2010. Recommended toxicity equivalence factors (TEFs) for human health risk assessments of 2,3,7,8-tetrachlorodibenzo-p-dioxin and dioxin-like compounds. (EPA/100/R-10/005). Washington, DC. http://www.epa.gov/raf/files/tefs-for-dioxin-epa-00-r-10-005-final.pdf (38 pp, 636KB).
Meal Category DDT, DDE, DDD Dioxins/Furans/co-planar PCBs Mercury PCBs
meals per month µg/g (ppm)a pg TEQ/g (ppt-TEQ)b µg/g (ppm)a µg/g (ppm)a
16 ≤ 0.11 ≤ 0.5 ≤ 0.07 ≤ 0.01 12 >0.11 to 0.15 >0.5 to 0.6 >0.07 to 0.09 >0.01 to 0.02 8 >0.15 to 0.23 >0.6 to 0.9 >0.09 to 0.13 >0.02 to 0.03 4 >0.23 to 0.45 >0.9 to 1.9 >0.13 to 0.27 >0.03 to 0.05 2 >0.45 to 0.91 >1.9 to 3.7 >0.27 to 0.53 >0.05 to 0.11 1 >0.91 to 1.8 >3.7 to 7.5 >0.53 to 1.1 >0.11 to 0.21
6 meals per year >1.8 to 3.7 >7.5 to 15 >1.1 to 2.2 >0.21 to 0.43 Limited >3.7 to 20 >15 to 90 NA >0.43 to 2.7
Do Not Eat >20 >90 >2.2 >2.7
Meal Category PFOS Selenium Total Toxaphene Toxaphene Parlars 26, 50, 62 (∑3PC26,50,62)
meals per month µg/g (ppm)a µg/g (ppm)a µg/g (ppm)a µg/g (ppm)a
16 ≤ 0.009 ≤ 2.3 ≤ 0.02 ≤ 0.001 12 >0.009 to 0.013 >2.3 to 3.1 >0.02 to 0.03 >0.001 to 0.002 8 >0.013 to 0.019 >3.1 to 4.6 >0.03 to 0.05 >0.002 to 0.003 4 >0.019 to 0.038 >4.6 to 9.2 >0.05 to 0.09 >0.003 to 0.006 2 >0.038 to 0.075 >9.2 to 17 >0.09 to 0.18 >0.006 to 0.011 1 >0.075 to 0.15 NA >0.18 to 0.36 >0.011 to 0.023
6 meals per year >0.15 to 0.3 NA >0.36 to 0.73 >0.023 to 0.046 Limited NA NA >0.73 to 4.5 >0.046 to 0.28
Do Not Eat >0.3 >17 >4.5 >0.28
6
Establishment of Consumption Guidelines MDHHS staff, together with the MDEQ, reviews the fish contaminant data with management in the Division of Environmental Health to identify appropriate Guidelines for each tested species and waterbody. New Guidelines for specific waterbodies or fish species not previously listed are established using the process described above. Where Guidelines have been previously identified, this process is also used to reassess the data and either retain or modify the consumption recommendations. Before relaxing a Guideline, MDHHS typically requires two years of sampling data that achieve the MFCAP dataset goals and demonstrate that COC concentrations have declined. However, when point-source contamination is a concern, additional data over a longer span of years may be required to adequately characterize COC concentrations in fish over time. The Guidelines are reported first to the interdepartmental Fish and Wildlife Contaminants Advisory Committee (FAWCAC) for review and concurrence. The Guidelines are then posted on-line in the Michigan Eat Safe Fish Guide at www.michigan.gov/eatsafefish. Dependent on the availability of funding, a limited number of printed copies are made available to the public upon request and through selected venues. Statewide Consumption Guidelines Statewide consumption guidelines may be issued when a COC is found in one or more fish species from multiple waterbodies dispersed across a wide geographic range in Michigan. A statewide advisory generally applies to all rivers and inland lakes, but not to the Great Lakes. Lake-wide advisories may be issued for an entire Great Lake if a COC is found throughout the waterbody. Statewide consumption guidelines are not predicated on COC data for every location and species for which guidance is issued and are not evaluated on an annual basis, but may be re-evaluated when temporal trend data suggest chemical concentrations in the environment have changed. Appendix C provides an evaluation of the available information regarding mercury in Michigan fish. Appendix D provides an evaluation of PCB and mercury data for catfish and carp in Michigan waterbodies. Consumption Guidelines for Purchased Fish In 2004, the US Food and Drug Administration (US FDA) and the US Environmental Protection Agency (US EPA) issued a nationwide mercury fish advisory for sensitive populations (http://www.fda.gov/Food/FoodborneIllnessContaminants/BuyStoreServeSafeFood/ucm110591.htm):
7
The Food and Drug Administration (FDA) and the Environmental Protection Agency (EPA) are advising women who may become pregnant, pregnant women, nursing mothers, and young children to avoid some types of fish and eat fish and shellfish that are lower in mercury.
In 2005, MDHHS8 provided consumption guidance for purchased fish based on species-specific mean mercury concentrations using the US FDA dataset. Mean concentrations were compared to the US EPA’s mercury fish consumption limit screening ranges and assigned to meal categories. The purchased-fish consumption guidance was presented to the MDARD Michigan Food Safety Alliance (http://www.michigan.gov/mdard/0,4610,7-125-1568_2387_2435-15870--,00.html). Emergency Fish Consumption Guidelines Emergency fish consumption guidelines are issued: (1) when hazardous substances are unexpectedly released into Michigan waters; (2) where conditions present an immediate concern about the safety of fish consumption; (3) or when a COC is found in fish samples at high concentrations immediately prompting a “Do Not Eat” advisory. Emergency fish consumption guidelines remain in effect until quantitative analytical chemistry data are available to indicate that the fish may be safely eaten. Emergency guidelines based on toxins from events such as algal blooms or botulism outbreaks may be rescinded without analytical data because these events can be seasonal and transient.
8 Formerly the Michigan Department of Community Health

A-1
Methods for Calculating MDHHS Fish Consumption Screening Values (FCSV).
A-2
Background The Michigan Department of Health and Human Services (MDHHS) develops Fish Consumption Screening Values (FCSVs) for the Michigan Fish Consumption Advisory Program to evaluate levels of chemicals commonly analyzed for and found in fish from Michigan waterbodies. MDHHS may also conduct a site- or chemical-specific risk assessment when a novel contaminant presents a public health concern (ATSDR 2005), but may not always develop formal screening values. FCSVs are not used for regulatory oversight of commercially sold fish. MDHHS uses the FCSVs to recommend meal consumption guidelines for an individual species of fish from a specific source such as an inland lake, river, or one of the Great Lakes. FCSVs are also used to establish Statewide Guidelines. The FCSVs define the breakpoint(s) between meal consumption categories (e.g., 1 meal per month versus 2 meals per month). MDHHS uses the US Environmental Protection Agency (US EPA) risk assessment methodology (US EPA 1989, 2000, 2005, 2011), to calculate FCSVs that are protective for everyone, including vulnerable populations such as people with existing medical conditions and unborn and young children. MDHHS commonly develops FCSVs based on non-cancer risks, unless the chemical is identified by the US EPA as mutagenic9. Currently, none of the chemicals commonly tested for and found in fish from Michigan surface waters are considered mutagenic.10 The US EPA makes this determination using a weight-of-evidence approach that includes: the finding of tumors in exposed humans (preferred) and treated laboratory animals; the chemical and physical properties of the chemical; structure-activity relationships (SARs) as compared with other carcinogenic chemicals; and studies assessing potential carcinogenic mode(s) of action. If a fish contaminant is considered mutagenic, MDHHS will calculate both cancer and non-cancer FCSVs and use the ones that are most protective of public health.
Risk Assessment Equations The FCSV equations shown below yield values for most chemicals in micrograms per gram of fish (µg/g), which are equivalent to parts per million (ppm). The total dioxin toxic equivalent (TEQ) FCSVs are provided in picograms per gram of fish (pg/g), which are equivalent to parts per trillion (ppt).
9 In the context of carcinogenicity, EPA defines a mutagenic as a chemical, or its metabolite, that reacts with or binds to DNA in a manner that causes mutations. 10 http://www.epa.gov/oswer/riskassessment/sghandbook/chemicals.htm.
A-3
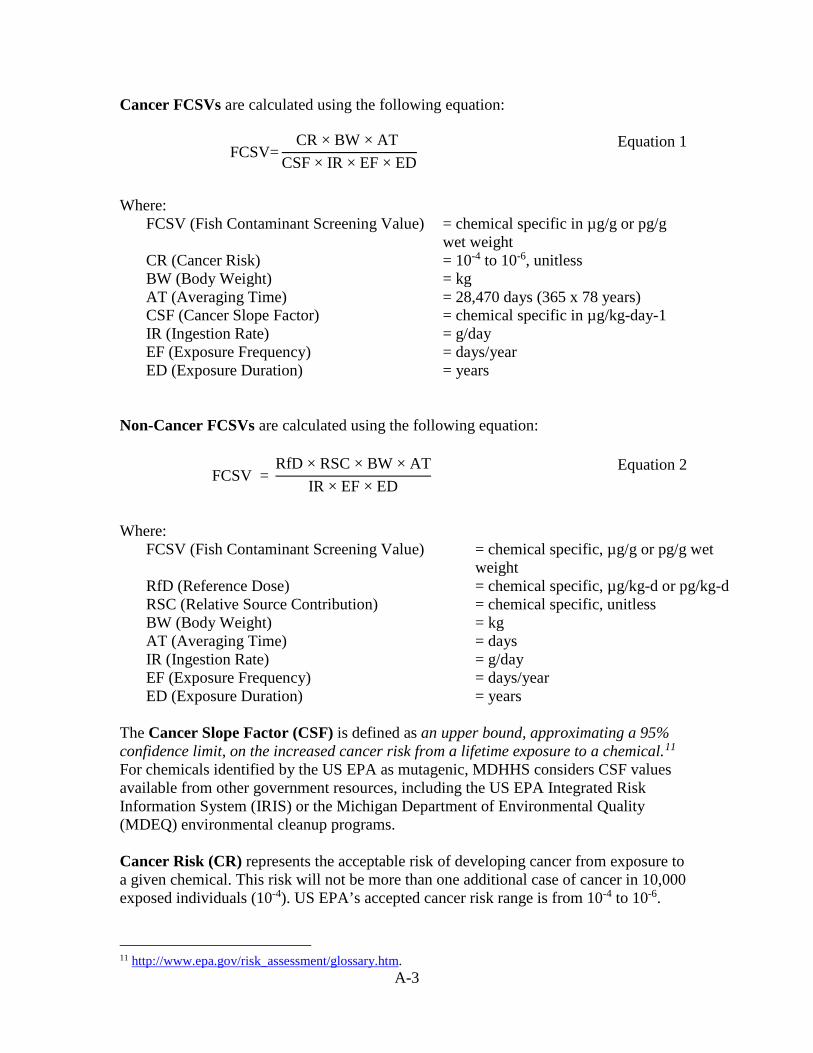
Cancer FCSVs are calculated using the following equation:
FCSV=CR × BW × AT
CSF × IR × EF × ED
Equation 1
Where:
FCSV (Fish Contaminant Screening Value) = chemical specific in µg/g or pg/g wet weight
CR (Cancer Risk) = 10-4 to 10-6, unitless BW (Body Weight) = kg AT (Averaging Time) = 28,470 days (365 x 78 years) CSF (Cancer Slope Factor) = chemical specific in µg/kg-day-1 IR (Ingestion Rate) = g/day EF (Exposure Frequency) = days/year ED (Exposure Duration) = years
Non-Cancer FCSVs are calculated using the following equation:
Where:
FCSV (Fish Contaminant Screening Value) = chemical specific, µg/g or pg/g wet weight
RfD (Reference Dose) = chemical specific, µg/kg-d or pg/kg-d RSC (Relative Source Contribution) = chemical specific, unitless BW (Body Weight) = kg AT (Averaging Time) = days IR (Ingestion Rate) = g/day EF (Exposure Frequency) = days/year ED (Exposure Duration) = years
The Cancer Slope Factor (CSF) is defined as an upper bound, approximating a 95% confidence limit, on the increased cancer risk from a lifetime exposure to a chemical.11 For chemicals identified by the US EPA as mutagenic, MDHHS considers CSF values available from other government resources, including the US EPA Integrated Risk Information System (IRIS) or the Michigan Department of Environmental Quality (MDEQ) environmental cleanup programs. Cancer Risk (CR) represents the acceptable risk of developing cancer from exposure to a given chemical. This risk will not be more than one additional case of cancer in 10,000 exposed individuals (10-4). US EPA’s accepted cancer risk range is from 10-4 to 10-6.
11 http://www.epa.gov/risk_assessment/glossary.htm.
FCSV = RfD × RSC × BW × AT
IR × EF × ED
Equation 2

A-4
The Chronic Reference Dose (RfD) is defined as an estimate (with uncertainty spanning perhaps an order of magnitude) of a daily oral exposure to the human population (including sensitive subgroups) that is likely to be without an appreciable risk of deleterious effects during a lifetime.12 MDHHS evaluates the currently available scientific literature for chemical contaminants in fish to identify exposure thresholds below which there are no observable adverse effects. MDHHS considers RfD values available from other government resources including the EPA IRIS database or the MDEQ environmental cleanup programs, as well as Minimal Risk Levels (MRLs) generated by the Agency for Toxic Substances and Disease Registry (ATSDR). MDHHS may calculate an RfD if existing values are not available or not appropriate for generating FCSVs. The Relative Source Contribution (RSC) factor is used only in the non-cancer FCSV equation and represents the portion of the RfD that can be attributed only to eating fish. People can be exposed to chemicals through sources other than eating fish, such as in other food, drinking water, or air. MDHHS may account for these other sources when calculating the FCSVs for some contaminants. MDHHS sets the RSC at 1.0 if no significant exposures from other sources are anticipated, allowing for 100 percent of the exposure to come from eating fish. An RSC less than 1.0 assumes that additional exposure from other sources is likely. Body Weight (BW) values are taken from the EPA Exposure Factors Handbook (Table A-1), which provides average body weight by age range for males and females combined (EPA 2011).
Table A-1. Average body weights by age group.
Age Group Body Weight years kilograms (kg) 1 to 2 11.4 2 to 3 13.8 3 to 6 18.6 6 to11 31.8
11 to 16 56.8 16 to 21 71.6 Adults 80.0
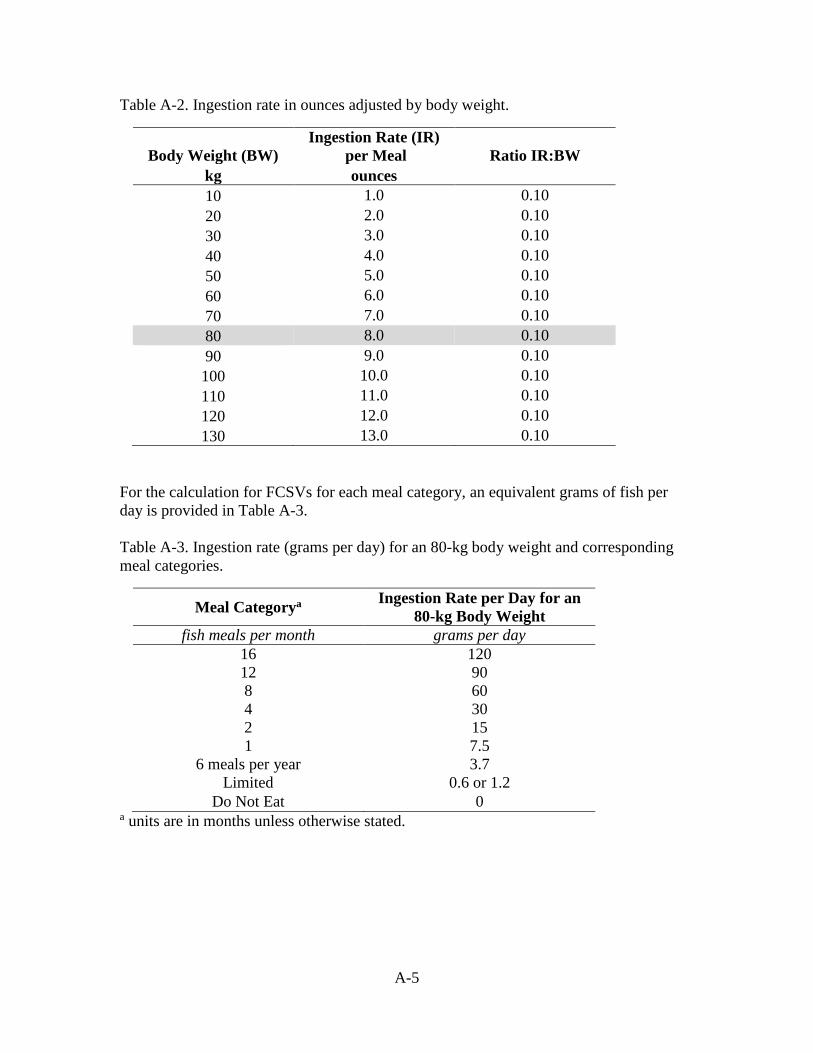
Ingestion Rate (IR) is the weight in grams of fish eaten per meal and is assumed to be proportional to BW (Table A-2). The IR for an adult weighing 80 kg is assumed to be 227 grams, or 8 ounces, per meal (uncooked weight). MDHHS adjusts IRs proportionally to BWs in accordance with Table A-2. The resulting FCSVs remain constant for each body weight and meal size combination allowing for uniform consumption recommendations for all age groups including children and adults.
12 Ibid.
A-5
Table A-2. Ingestion rate in ounces adjusted by body weight.
Body Weight (BW) Ingestion Rate (IR)
per Meal Ratio IR:BW kg ounces 10 1.0 0.10 20 2.0 0.10 30 3.0 0.10 40 4.0 0.10 50 5.0 0.10 60 6.0 0.10 70 7.0 0.10 80 8.0 0.10 90 9.0 0.10 100 10.0 0.10 110 11.0 0.10 120 12.0 0.10 130 13.0 0.10
For the calculation for FCSVs for each meal category, an equivalent grams of fish per day is provided in Table A-3. Table A-3. Ingestion rate (grams per day) for an 80-kg body weight and corresponding meal categories.
Meal Categorya Ingestion Rate per Day for an 80-kg Body Weight
fish meals per month grams per day 16 120 12 90 8 60 4 30 2 15 1 7.5
6 meals per year 3.7 Limited 0.6 or 1.2
Do Not Eat 0 a units are in months unless otherwise stated.
A-6
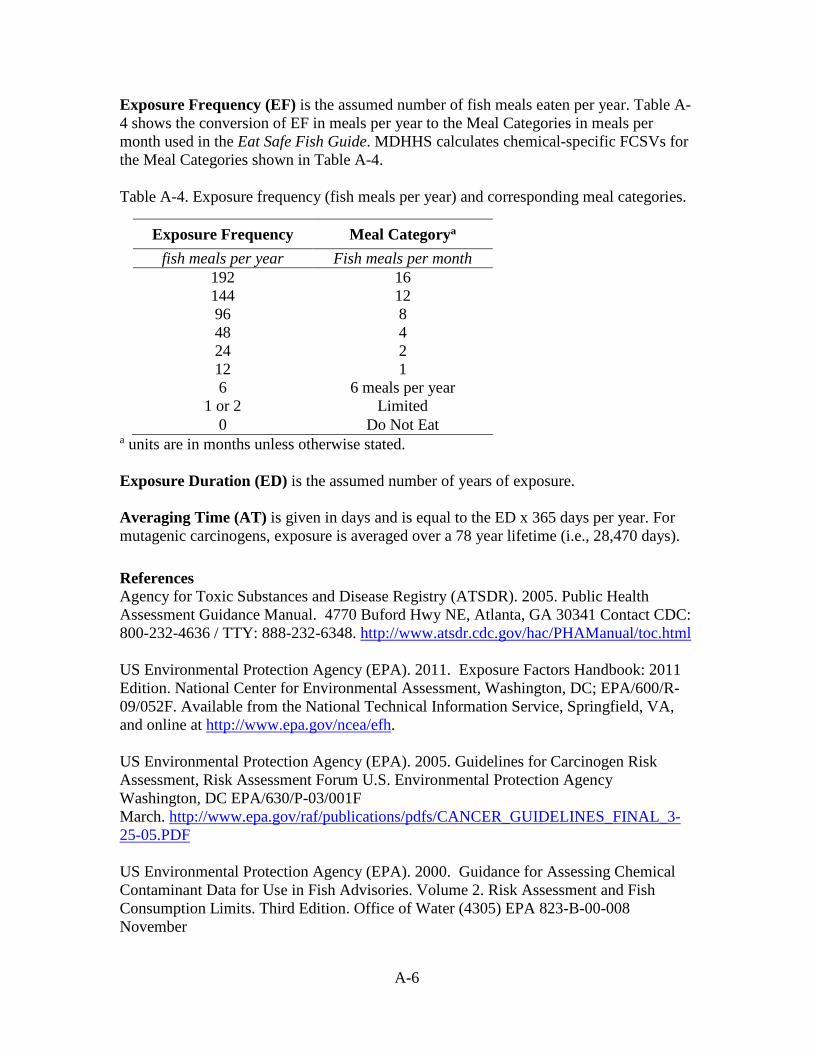
Exposure Frequency (EF) is the assumed number of fish meals eaten per year. Table A-4 shows the conversion of EF in meals per year to the Meal Categories in meals per month used in the Eat Safe Fish Guide. MDHHS calculates chemical-specific FCSVs for the Meal Categories shown in Table A-4. Table A-4. Exposure frequency (fish meals per year) and corresponding meal categories.
Exposure Frequency Meal Categorya
fish meals per year Fish meals per month 192 16 144 12 96 8 48 4 24 2 12 1 6 6 meals per year
1 or 2 Limited 0 Do Not Eat
a units are in months unless otherwise stated. Exposure Duration (ED) is the assumed number of years of exposure. Averaging Time (AT) is given in days and is equal to the ED x 365 days per year. For mutagenic carcinogens, exposure is averaged over a 78 year lifetime (i.e., 28,470 days). References Agency for Toxic Substances and Disease Registry (ATSDR). 2005. Public Health Assessment Guidance Manual. 4770 Buford Hwy NE, Atlanta, GA 30341 Contact CDC: 800-232-4636 / TTY: 888-232-6348. http://www.atsdr.cdc.gov/hac/PHAManual/toc.html US Environmental Protection Agency (EPA). 2011. Exposure Factors Handbook: 2011 Edition. National Center for Environmental Assessment, Washington, DC; EPA/600/R-09/052F. Available from the National Technical Information Service, Springfield, VA, and online at http://www.epa.gov/ncea/efh. US Environmental Protection Agency (EPA). 2005. Guidelines for Carcinogen Risk Assessment, Risk Assessment Forum U.S. Environmental Protection Agency Washington, DC EPA/630/P-03/001F March. http://www.epa.gov/raf/publications/pdfs/CANCER_GUIDELINES_FINAL_3-25-05.PDF US Environmental Protection Agency (EPA). 2000. Guidance for Assessing Chemical Contaminant Data for Use in Fish Advisories. Volume 2. Risk Assessment and Fish Consumption Limits. Third Edition. Office of Water (4305) EPA 823-B-00-008 November

A-7
2000. http://water.epa.gov/scitech/swguidance/fishshellfish/techguidance/risk/upload/2009_04_23_fish_advice_volume2_v2cover.pdf US Environmental Protection Agency (EPA). 1989. Risk Assessment Guidance for Superfund Volume I Human Health Evaluation Manual (Part A) Interim Final. EPA/540/1-89/002 December 1989. Office of Emergency and Remedial Response. U.S. Environmental Protection Agency Washington, D.C. 20450. http://www.epa.gov/oswer/riskassessment/ragsa/index.htm
A-8
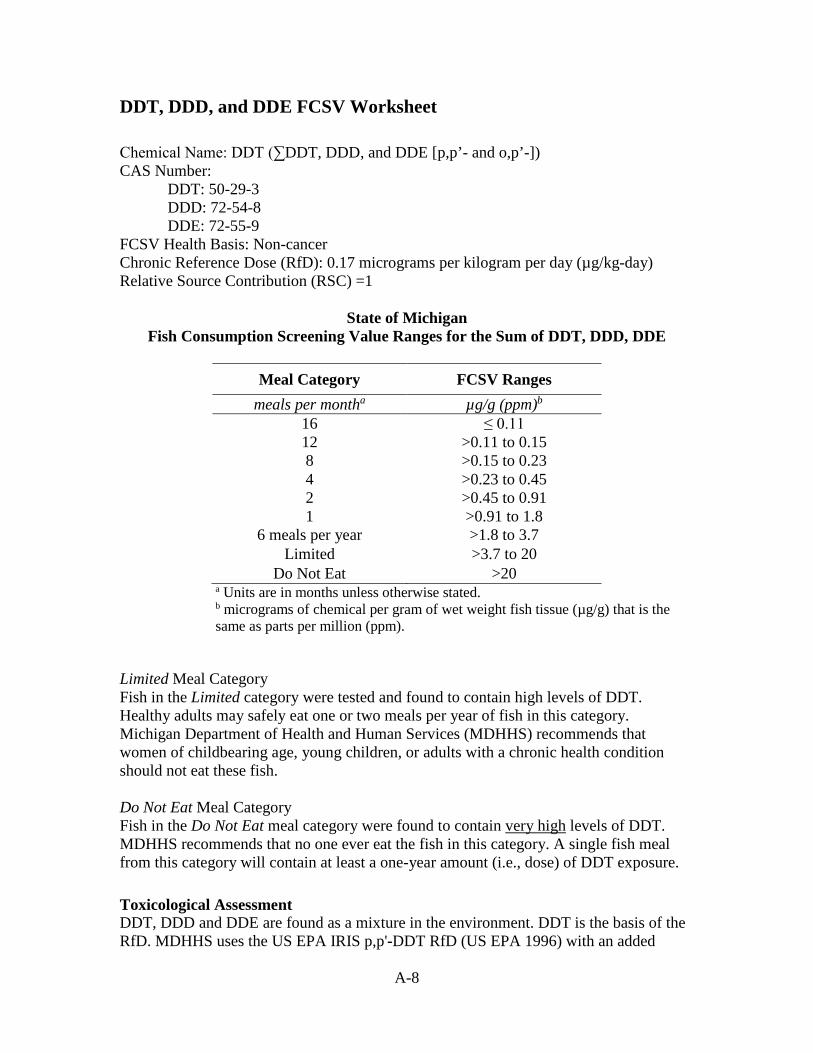
DDT, DDD, and DDE FCSV Worksheet Chemical Name: DDT (∑DDT, DDD, and DDE [p,p’- and o,p’-]) CAS Number:
DDT: 50-29-3 DDD: 72-54-8 DDE: 72-55-9
FCSV Health Basis: Non-cancer Chronic Reference Dose (RfD): 0.17 micrograms per kilogram per day (µg/kg-day) Relative Source Contribution (RSC) =1
State of Michigan
Fish Consumption Screening Value Ranges for the Sum of DDT, DDD, DDE
Meal Category FCSV Ranges meals per montha µg/g (ppm)b
16 ≤ 0.11 12 >0.11 to 0.15 8 >0.15 to 0.23 4 >0.23 to 0.45 2 >0.45 to 0.91 1 >0.91 to 1.8
6 meals per year >1.8 to 3.7 Limited >3.7 to 20
Do Not Eat >20 a Units are in months unless otherwise stated. b micrograms of chemical per gram of wet weight fish tissue (µg/g) that is the same as parts per million (ppm).
Limited Meal Category Fish in the Limited category were tested and found to contain high levels of DDT. Healthy adults may safely eat one or two meals per year of fish in this category. Michigan Department of Health and Human Services (MDHHS) recommends that women of childbearing age, young children, or adults with a chronic health condition should not eat these fish. Do Not Eat Meal Category Fish in the Do Not Eat meal category were found to contain very high levels of DDT. MDHHS recommends that no one ever eat the fish in this category. A single fish meal from this category will contain at least a one-year amount (i.e., dose) of DDT exposure. Toxicological Assessment DDT, DDD and DDE are found as a mixture in the environment. DDT is the basis of the RfD. MDHHS uses the US EPA IRIS p,p'-DDT RfD (US EPA 1996) with an added

A-9
uncertainty factor for an incomplete database on genotoxicity (MDCH 2012). A detailed review of DDT, DDD, and DDE toxicology and epidemiology literature is provided at www.michigan.gov/eatsafefish under Reports & Science (MDCH 2012). The chronic RfD for DDT is derived from a study of lesions in rat livers. This study was selected because it was of sufficient duration and had doses over the range of the dose-response curve (MDCH 2012). A no-observed-adverse-effect level (NOAEL) was identified as 1 part per million (ppm), which is equivalent to a dose of 0.05 milligrams per kilogram per day (mg/kg-day). US EPA applied a 100-fold combined uncertainty factor (10 for extrapolation from animals to humans and 10 for human variability), resulting in an RfD of 5x10⁻⁴ mg/kg-day (US EPA 1996). MDHHS applied an additional uncertainty factor of 3 for an incomplete database for genotoxicity, resulting in a final chronic RfD of 0.17 µg/kg-day. Cancer Risk Considerations The US EPA considers DDT, DDD, and DDE to be probable human carcinogens based on sufficient evidence of carcinogenicity in animals. DDT, DDD, and DDE are tumor promoters, but are not considered to be mutagenic or tumor initiators. Applying the US EPA’s p,p’-DDT or p,p’-DDE upper-bound cancer slope factor of 0.34 (mg/kg-day)-1 to the FCSVs, the resulting upper-bound risk is between 4 and 10 additional cancers for every 100,000 individuals exposed for 30 to 78 years, respectively. MDHHS finds this cancer risk to be low and the DDT, DDD, and DDE FCSVs adequately protective of cancer risk. Vulnerable (Sensitive) Population Considerations The chronic RfD is an estimate of a daily oral exposure for a chronic duration (up to a lifetime) to the human population (including susceptible subgroups) that is likely to be without an appreciable risk of adverse health effects over a lifetime. Human fetuses can be exposed during development to DDT, DDD, and DDE from contaminated fish that the mother eats. Further exposure to newborns and older babies could occur through the mother’s breast milk. If toxic exposure levels are high enough during critical growth stages, the developing body systems of the fetus or baby can sustain permanent damage. MDHHS agrees that the RfD approach is protective of sensitive subpopulations. Child development may be altered from exposure to DDT and DDE at an early age. Three different observational studies of prenatally exposed children found an association between higher DDT exposures and lower child development scores for children up to four years of age (MDCH 2012). DDE prenatal exposure was also found to have associations in two of the studies; however, the findings were less consistent. Epidemiology studies provide mixed but supportive evidence for an association between early life exposures to DDE and reduced childhood or pubertal growth. Even beyond prenatal exposure, DDT and DDE may impact the normal development of children. The Child Health and Development study, a longitudinal cohort study in California, found that prepubertal exposure to p,p’-DDT was correlated with increased incidence of breast cancer in adulthood (MDCH 2012).

A-10
References Michigan Department of Community Health (MDCH). 2012. Technical support document for DDT, DDD, and DDE reference dose (RfD) as the basis for Michigan fish consumption screening values (FCSVs). State of Michigan. Lansing, Michigan. US Environmental Protection Agency (US EPA). 1996. p,p'-dichlorodiphenyltrichloroethane (DDT) (CASRN 50-29-03). Retrieved August 2012, from Integrated Risk Information System: http://www.epa.gov/iris/subst/0147.htm
A-11
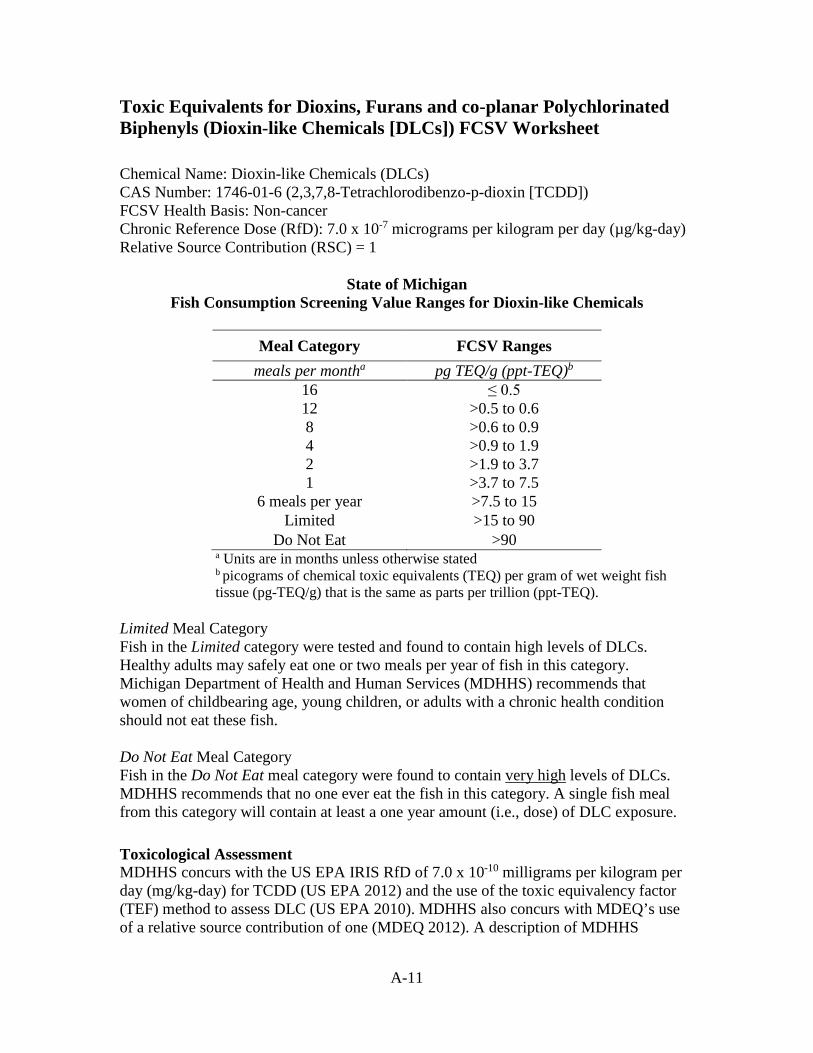
Toxic Equivalents for Dioxins, Furans and co-planar Polychlorinated Biphenyls (Dioxin-like Chemicals [DLCs]) FCSV Worksheet Chemical Name: Dioxin-like Chemicals (DLCs) CAS Number: 1746-01-6 (2,3,7,8-Tetrachlorodibenzo-p-dioxin [TCDD]) FCSV Health Basis: Non-cancer Chronic Reference Dose (RfD): 7.0 x 10⁻⁷ micrograms per kilogram per day (µg/kg-day) Relative Source Contribution (RSC) = 1
State of Michigan Fish Consumption Screening Value Ranges for Dioxin-like Chemicals
Meal Category FCSV Ranges
meals per montha pg TEQ/g (ppt-TEQ)b 16 ≤ 0.5 12 >0.5 to 0.6 8 >0.6 to 0.9 4 >0.9 to 1.9 2 >1.9 to 3.7 1 >3.7 to 7.5
6 meals per year >7.5 to 15 Limited >15 to 90
Do Not Eat >90 a Units are in months unless otherwise stated b picograms of chemical toxic equivalents (TEQ) per gram of wet weight fish tissue (pg-TEQ/g) that is the same as parts per trillion (ppt-TEQ).
Limited Meal Category Fish in the Limited category were tested and found to contain high levels of DLCs. Healthy adults may safely eat one or two meals per year of fish in this category. Michigan Department of Health and Human Services (MDHHS) recommends that women of childbearing age, young children, or adults with a chronic health condition should not eat these fish. Do Not Eat Meal Category Fish in the Do Not Eat meal category were found to contain very high levels of DLCs. MDHHS recommends that no one ever eat the fish in this category. A single fish meal from this category will contain at least a one year amount (i.e., dose) of DLC exposure. Toxicological Assessment MDHHS concurs with the US EPA IRIS RfD of 7.0 x 10⁻¹⁰ milligrams per kilogram per day (mg/kg-day) for TCDD (US EPA 2012) and the use of the toxic equivalency factor (TEF) method to assess DLC (US EPA 2010). MDHHS also concurs with MDEQ’s use of a relative source contribution of one (MDEQ 2012). A description of MDHHS

A-12
selection of the US EPA RfD is provided at www.michigan.gov/eatsafefish under Reports & Science (MDCH 2013). US EPA based the chronic RfD on co-critical human studies that demonstrated altered thyroid function (Baccarelli et al. 2008) and impaired adult male reproductive function (Mocarelli et al. 2008). Both studies investigated TCDD exposures to a residential population living in Seveso, Italy during a large chemical manufacturing plant accident in 1976. The Baccarelli study compared serum thyroid stimulating hormone (TSH) levels in neonates to the mothers’ TCDD exposure during the 1976 accident, 17-29 years prior to pregnancy. The adverse effect was identified as an increase in TSH levels above the World Health Organization standard of 5 micro units per milliliter of blood (µU/ml), indicating dysregulation of thyroid hormone metabolism. The Mocarelli study reported decreased adult sperm concentrations and decreased motile sperm counts in men who were 1-9 years old living in Seveso, Italy in 1976. From the Baccarelli study, the US EPA used the study’s regression model to estimate a maternal plasma TCDD concentration at the neonatal TSH level of concern and a human physiologically-based pharmacokinetic (PBPK) model to determine the maternal intake rate lowest-observed-adverse-effect level (LOAEL) of 2.0 x10⁻⁸ mg/kg-day. In the Mocarelli study it was not clear if the effects were related to the peak exposure or to the average exposure. US EPA used a human toxicokinetic model to calculate an oral exposure of 0.032 nanogram per kilogram-day (ng/kg-day) associated with the lowest effective peak TCDD serum concentration of 68 ppt TCDD. Then, starting with the peak TCDD exposure and accounting for background TCDD exposure, the average daily serum TCDD level and an associated oral exposure of 0.0080 ng/kg-day was estimated over a five year period. A combined uncertainty factor of 30 was applied to the LOAEL, 10 for the use of LOAEL and 3 for inter-human variability, resulting in the RfD of 7 × 10⁻¹⁰ mg/kg-day (7.0 x 10⁻⁷ µg/kg-day). Cancer Risk Considerations Currently, US EPA is re-assessing the cancer potency of TCDD (US EPA 2012). The Michigan Department of Environmental Quality (MDEQ) identifies a cancer slope factor of 75,000 (mg/kg-day)-1 for TCDD to develop environmental cleanup criteria. Applying the MDEQ cancer slope factor to the FCSVs, the resulting upper-bound risk is between 4 and 10 additional cancers for every 100,000 individuals exposed for 30 to 78 years, respectively. MDHHS concludes that the non-cancer FCSV is adequately protective of cancer risk. Vulnerable (Sensitive) Population Considerations Human fetuses are exposed during development to DLCs in contaminated fish that the mother eats. Exposure to newborns and older babies could occur through the mother’s breast milk. If toxic exposure levels are high enough during critical growth stages, the developing body systems of children can sustain permanent damage.
A-13
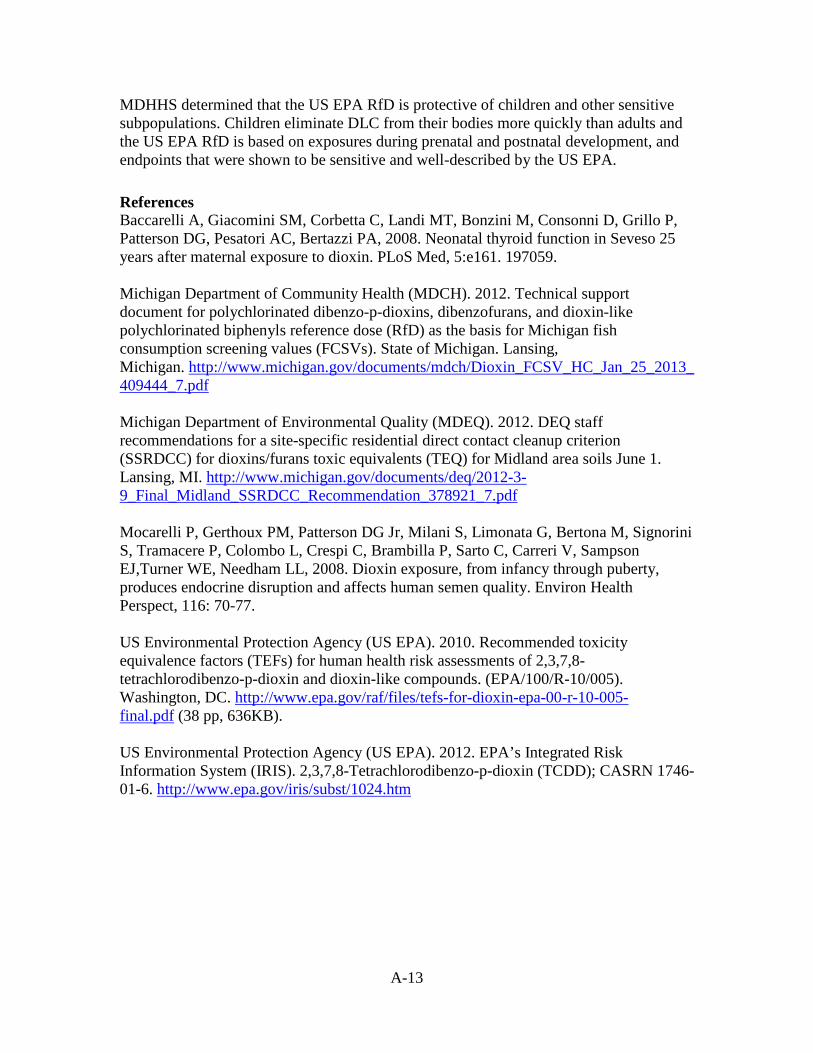
MDHHS determined that the US EPA RfD is protective of children and other sensitive subpopulations. Children eliminate DLC from their bodies more quickly than adults and the US EPA RfD is based on exposures during prenatal and postnatal development, and endpoints that were shown to be sensitive and well-described by the US EPA. References Baccarelli A, Giacomini SM, Corbetta C, Landi MT, Bonzini M, Consonni D, Grillo P, Patterson DG, Pesatori AC, Bertazzi PA, 2008. Neonatal thyroid function in Seveso 25 years after maternal exposure to dioxin. PLoS Med, 5:e161. 197059. Michigan Department of Community Health (MDCH). 2012. Technical support document for polychlorinated dibenzo-p-dioxins, dibenzofurans, and dioxin-like polychlorinated biphenyls reference dose (RfD) as the basis for Michigan fish consumption screening values (FCSVs). State of Michigan. Lansing, Michigan. http://www.michigan.gov/documents/mdch/Dioxin_FCSV_HC_Jan_25_2013_409444_7.pdf Michigan Department of Environmental Quality (MDEQ). 2012. DEQ staff recommendations for a site-specific residential direct contact cleanup criterion (SSRDCC) for dioxins/furans toxic equivalents (TEQ) for Midland area soils June 1. Lansing, MI. http://www.michigan.gov/documents/deq/2012-3-9_Final_Midland_SSRDCC_Recommendation_378921_7.pdf Mocarelli P, Gerthoux PM, Patterson DG Jr, Milani S, Limonata G, Bertona M, Signorini S, Tramacere P, Colombo L, Crespi C, Brambilla P, Sarto C, Carreri V, Sampson EJ,Turner WE, Needham LL, 2008. Dioxin exposure, from infancy through puberty, produces endocrine disruption and affects human semen quality. Environ Health Perspect, 116: 70-77. US Environmental Protection Agency (US EPA). 2010. Recommended toxicity equivalence factors (TEFs) for human health risk assessments of 2,3,7,8-tetrachlorodibenzo-p-dioxin and dioxin-like compounds. (EPA/100/R-10/005). Washington, DC. http://www.epa.gov/raf/files/tefs-for-dioxin-epa-00-r-10-005-final.pdf (38 pp, 636KB). US Environmental Protection Agency (US EPA). 2012. EPA’s Integrated Risk Information System (IRIS). 2,3,7,8-Tetrachlorodibenzo-p-dioxin (TCDD); CASRN 1746-01-6. http://www.epa.gov/iris/subst/1024.htm

A-14
Mercury FCSV Worksheet Chemical Name: Methylmercury CAS Number: 22967-92-6 FCSV Health Basis: Non-cancer Chronic Reference Dose (RfD): 0.1 micrograms per kilogram per day (µg/kg-day) Relative Source Contribution (RSC) = 1
State of Michigan Fish Consumption Screening Value Ranges for Mercury
Meal Category FCSV Ranges meals per montha µg/g (ppm)b
16 ≤ 0.07 12 >0.07 to 0.09 8 >0.09 to 0.13 4 >0.13 to 0.27 2 >0.27 to 0.53 1 >0.53 to 1.1
6 meals per year >1.1 to 2.2 Do Not Eat >2.2
a: Units are in months unless otherwise stated. b micrograms of chemical per gram of wet weight fish tissue (µg/g) that is the same as parts per million (ppm).
Limited Meal Category This category does not apply to mercury due to toxicological assessment considerations (see section below). Do Not Eat Meal Category Fish in the Do Not Eat meal category were found to contain high levels of mercury. Michigan Department of Health and Human Services (MDHHS) recommends that no one ever eat the fish in this category. A single fish meal from this category will contain at least a two month amount (i.e., dose) of mercury exposure. Toxicological Assessment Methylmercury is more than 90 percent of the mercury speciation found in fish filets. MDHHS concurs with the US EPA IRIS RfD of 0.1 µg/kg-day for methylmercury (US EPA 2001). A detailed review of methylmercury toxicology and epidemiology literature is provided at www.michigan.gov/eatsafefish under Reports & Science (MDCH 2009). The RfD is based on a human neurodevelopmental study of fetal exposure from the mother’s consumption of contaminated fish during pregnancy. A composite uncertainty factor of 10 for pharmacokinetic and pharmacodynamic variability was applied by the US EPA, resulting in the RfD of 0.1 µg/kg-day.
A-15
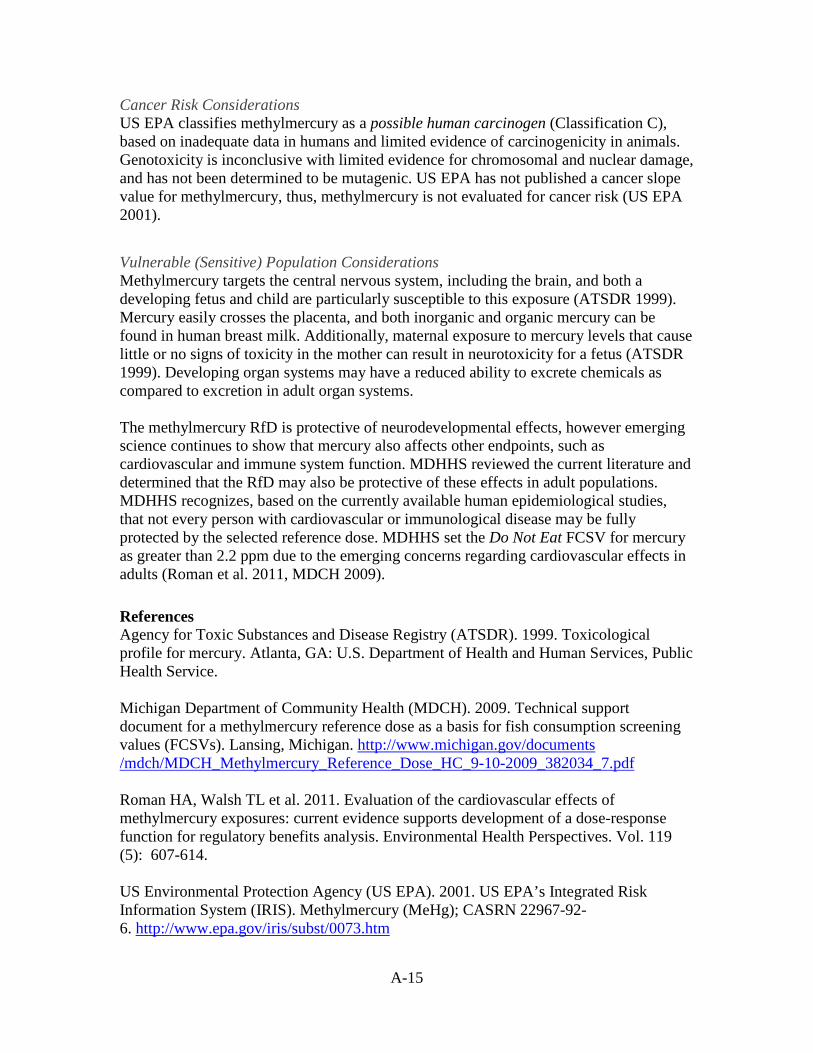
Cancer Risk Considerations US EPA classifies methylmercury as a possible human carcinogen (Classification C), based on inadequate data in humans and limited evidence of carcinogenicity in animals. Genotoxicity is inconclusive with limited evidence for chromosomal and nuclear damage, and has not been determined to be mutagenic. US EPA has not published a cancer slope value for methylmercury, thus, methylmercury is not evaluated for cancer risk (US EPA 2001). Vulnerable (Sensitive) Population Considerations Methylmercury targets the central nervous system, including the brain, and both a developing fetus and child are particularly susceptible to this exposure (ATSDR 1999). Mercury easily crosses the placenta, and both inorganic and organic mercury can be found in human breast milk. Additionally, maternal exposure to mercury levels that cause little or no signs of toxicity in the mother can result in neurotoxicity for a fetus (ATSDR 1999). Developing organ systems may have a reduced ability to excrete chemicals as compared to excretion in adult organ systems. The methylmercury RfD is protective of neurodevelopmental effects, however emerging science continues to show that mercury also affects other endpoints, such as cardiovascular and immune system function. MDHHS reviewed the current literature and determined that the RfD may also be protective of these effects in adult populations. MDHHS recognizes, based on the currently available human epidemiological studies, that not every person with cardiovascular or immunological disease may be fully protected by the selected reference dose. MDHHS set the Do Not Eat FCSV for mercury as greater than 2.2 ppm due to the emerging concerns regarding cardiovascular effects in adults (Roman et al. 2011, MDCH 2009). References Agency for Toxic Substances and Disease Registry (ATSDR). 1999. Toxicological profile for mercury. Atlanta, GA: U.S. Department of Health and Human Services, Public Health Service. Michigan Department of Community Health (MDCH). 2009. Technical support document for a methylmercury reference dose as a basis for fish consumption screening values (FCSVs). Lansing, Michigan. http://www.michigan.gov/documents /mdch/MDCH_Methylmercury_Reference_Dose_HC_9-10-2009_382034_7.pdf Roman HA, Walsh TL et al. 2011. Evaluation of the cardiovascular effects of methylmercury exposures: current evidence supports development of a dose-response function for regulatory benefits analysis. Environmental Health Perspectives. Vol. 119 (5): 607-614. US Environmental Protection Agency (US EPA). 2001. US EPA’s Integrated Risk Information System (IRIS). Methylmercury (MeHg); CASRN 22967-92-6. http://www.epa.gov/iris/subst/0073.htm
A-16
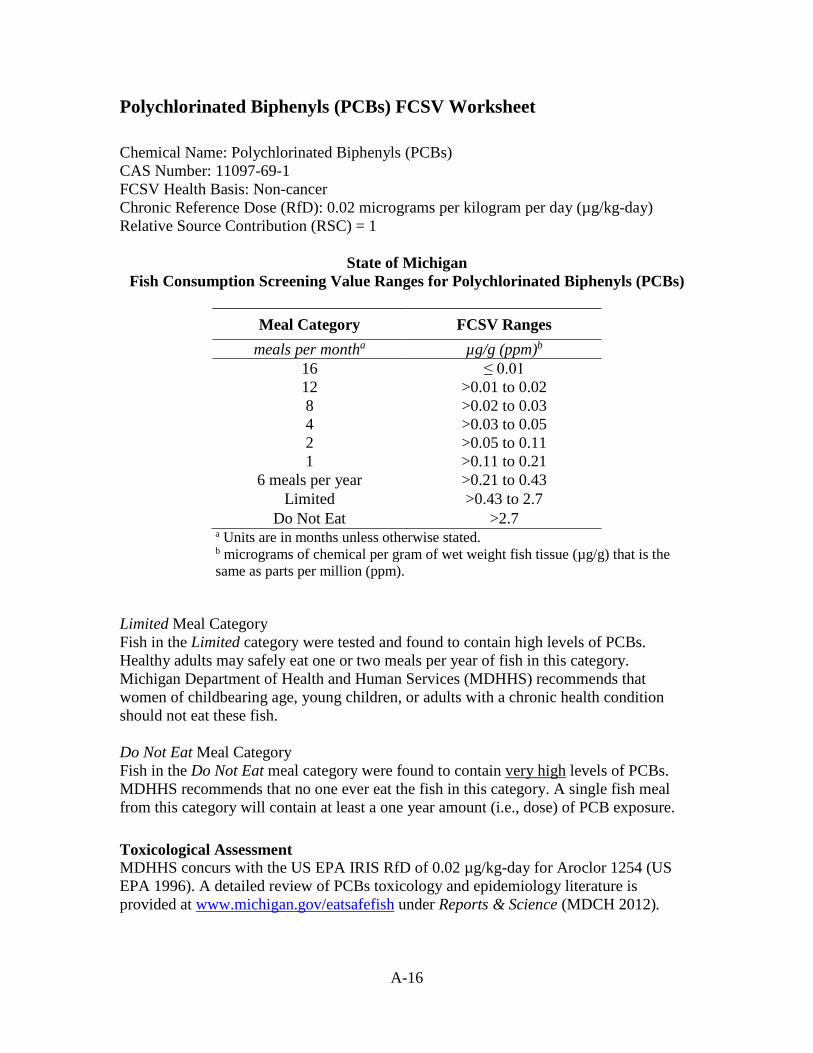
Polychlorinated Biphenyls (PCBs) FCSV Worksheet Chemical Name: Polychlorinated Biphenyls (PCBs) CAS Number: 11097-69-1 FCSV Health Basis: Non-cancer Chronic Reference Dose (RfD): 0.02 micrograms per kilogram per day (µg/kg-day) Relative Source Contribution (RSC) = 1
State of Michigan Fish Consumption Screening Value Ranges for Polychlorinated Biphenyls (PCBs)
Meal Category FCSV Ranges
meals per montha µg/g (ppm)b 16 ≤ 0.01 12 >0.01 to 0.02 8 >0.02 to 0.03 4 >0.03 to 0.05 2 >0.05 to 0.11 1 >0.11 to 0.21
6 meals per year >0.21 to 0.43 Limited >0.43 to 2.7
Do Not Eat >2.7 a Units are in months unless otherwise stated. b micrograms of chemical per gram of wet weight fish tissue (µg/g) that is the same as parts per million (ppm).
Limited Meal Category Fish in the Limited category were tested and found to contain high levels of PCBs. Healthy adults may safely eat one or two meals per year of fish in this category. Michigan Department of Health and Human Services (MDHHS) recommends that women of childbearing age, young children, or adults with a chronic health condition should not eat these fish. Do Not Eat Meal Category Fish in the Do Not Eat meal category were found to contain very high levels of PCBs. MDHHS recommends that no one ever eat the fish in this category. A single fish meal from this category will contain at least a one year amount (i.e., dose) of PCB exposure. Toxicological Assessment MDHHS concurs with the US EPA IRIS RfD of 0.02 µg/kg-day for Aroclor 1254 (US EPA 1996). A detailed review of PCBs toxicology and epidemiology literature is provided at www.michigan.gov/eatsafefish under Reports & Science (MDCH 2012).

A-17
The RfD is based on a sub-chronic rhesus monkey study of clinical and immunological endpoints. Significant dose-response trends were observed for clinical endpoints and significant decreases in immunoglobulin G (IgG) and immunoglobulin M (IgM) for all doses with the exception of IgM in the group given the lowest dose of Aroclor 1254. The US EPA applied a combined uncertainty factor of 300 based on 3 for animal to human extrapolation, 10 for sensitive individuals, 3 for sub-chronic to chronic extrapolation, and 3 for using a lowest-observed-adverse-effect level (LOAEL), resulting in 0.02 µg/kg-day. Cancer Risk Considerations The US EPA considers mixtures of PCBs to be probable human carcinogens based on sufficient evidence of carcinogenicity in animals. US EPA does not identify PCBs as mutagenic. Applying the US EPA’s PCB upper-bound cancer slope factor of 2.0 per milligram per kilogram per day [(mg/kg-day)-1] to the FCSVs, the resulting upper-bound risk is between 3 and 8 additional cancers for every 100,000 individuals exposed for 30 to 78 years, respectively. MDHHS concludes that the non-cancer PCB FCSV is adequately protective of cancer risk. The Great Lakes Sport Fish Advisory Task Force (1993) took a similar approach to MDHHS by using a non-cancer value called the Health Protective Value (HPV) in place of the US EPA cancer slope value. The Task Force stated that HPV should fall within the one in 10-4 to 10-6 life-time cancer risk range (GLSFATF 1993). The MDHHS PCB FCSV approach is consistent with the Protocol for a Uniform Great Lakes Sport Fish Consumption Advisory.
Vulnerable (Sensitive) Population Considerations Human fetuses are exposed during development to PCBs in contaminated fish that the mother eats. Exposure to newborn and older babies could occur through the mother’s breast milk. In addition, infants may have a reduced capacity to metabolize and eliminate PCBs, due to still developing organ systems. If toxic exposure levels are high enough during critical growth stages, the developing body systems of children can sustain permanent damage. Based on several factors, MDHHS determined that the US EPA RfD is protective of these sensitive subpopulations. First, there is a variety of PCB associated immune effects that have been reported in humans, both children and adults. Second, an estimated RfD for neuropsychological effects is also 0.02 μg/kg-day, which indicates that the Aroclor 1254 RfD would be protective against those types of developmental effects. Third, in a study using Aroclor 1254, prenatal exposure to 80 μg/kg-day did not alter infant monkey birth weights. The 80 μg/kg-day is higher than the point-of-departure used as a basis for the Aroclor 1254 RfD, and so this RfD will be protective of additional developmental effects. A detailed review of the developmental effects of PCBs is provided at www.michigan.gov/eatsafefish under Reports & Science. References Great Lakes Sport Fish Advisory Task Force (GLSFATF). 1993. Protocol for a Uniform Great Lakes Sport Fish Consumption Advisory. September 1993.

A-18
Michigan Department of Community Health (MDCH). 2012. Technical support document for a polychlorinated biphenyl reference dose (RfD) as the basis for a fish consumption screening values (FCSVs). State of Michigan. Lansing, Michigan. US Environmental Protection Agency (US EPA). 1996. US EPA’s Integrated Risk Information System (IRIS). Aroclor 1254; CASRN 11097-69-1. http://www.epa.gov/iris/subst/0389.htm
A-19
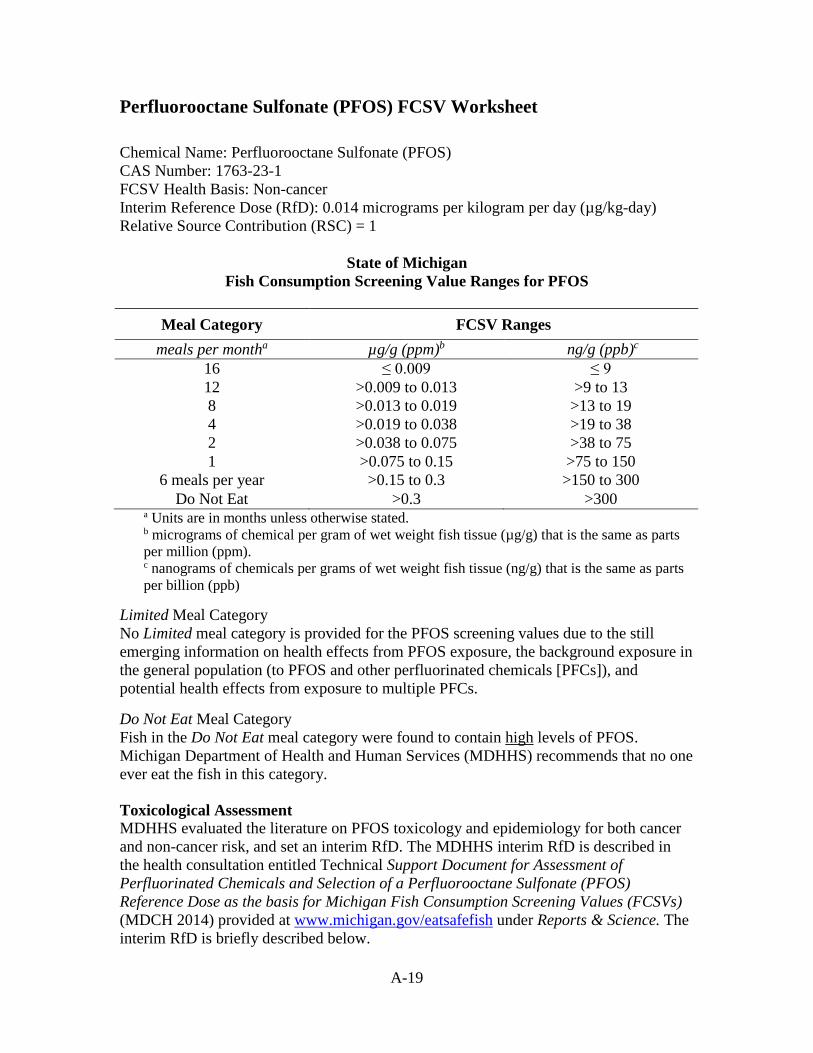
Perfluorooctane Sulfonate (PFOS) FCSV Worksheet Chemical Name: Perfluorooctane Sulfonate (PFOS) CAS Number: 1763-23-1 FCSV Health Basis: Non-cancer Interim Reference Dose (RfD): 0.014 micrograms per kilogram per day (µg/kg-day) Relative Source Contribution (RSC) = 1
State of Michigan Fish Consumption Screening Value Ranges for PFOS
a Units are in months unless otherwise stated. b micrograms of chemical per gram of wet weight fish tissue (µg/g) that is the same as parts per million (ppm). c nanograms of chemicals per grams of wet weight fish tissue (ng/g) that is the same as parts per billion (ppb)
Limited Meal Category No Limited meal category is provided for the PFOS screening values due to the still emerging information on health effects from PFOS exposure, the background exposure in the general population (to PFOS and other perfluorinated chemicals [PFCs]), and potential health effects from exposure to multiple PFCs. Do Not Eat Meal Category Fish in the Do Not Eat meal category were found to contain high levels of PFOS. Michigan Department of Health and Human Services (MDHHS) recommends that no one ever eat the fish in this category.
Toxicological Assessment MDHHS evaluated the literature on PFOS toxicology and epidemiology for both cancer and non-cancer risk, and set an interim RfD. The MDHHS interim RfD is described in the health consultation entitled Technical Support Document for Assessment of Perfluorinated Chemicals and Selection of a Perfluorooctane Sulfonate (PFOS) Reference Dose as the basis for Michigan Fish Consumption Screening Values (FCSVs) (MDCH 2014) provided at www.michigan.gov/eatsafefish under Reports & Science. The interim RfD is briefly described below.
Meal Category FCSV Ranges meals per montha µg/g (ppm)b ng/g (ppb)c
16 ≤ 0.009 ≤ 9 12 >0.009 to 0.013 >9 to 13 8 >0.013 to 0.019 >13 to 19 4 >0.019 to 0.038 >19 to 38 2 >0.038 to 0.075 >38 to 75 1 >0.075 to 0.15 >75 to 150
6 meals per year >0.15 to 0.3 >150 to 300 Do Not Eat >0.3 >300

A-20
MDHHS selected a no-observed-adverse-effect level (NOAEL) of 0.03 milligrams per kilogram per day (mg/kg-d) from a sub-chronic monkey study (N=44 monkeys). Health effects identified in the treated monkeys included reduced cholesterol and thyroid hormone levels (Seacat et al. 2002). Physiologically-based pharmacokinetic modeling was used to determine a time-integrated serum concentration, also known as an area under the curve (AUC), associated with the NOAEL. The Michigan Department of Environmental Quality Water Resources Division used the AUC of 22,100 milligrams/Liter*hour in their derivation of a Rule 57 Human Noncancer Value for PFOS (MDEQ 2014). The AUC, adjusted for duration of the study (182 days [d]), resulted in an average serum concentration (5.06 mg/L) at steady-state. The average serum concentration can be converted to a human equivalent dose at steady-state using information on PFOS clearance in humans. The human equivalent dose (4.1x10⁻⁴ mg/kg/d) associated with the NOAEL was divided by a total uncertainty factor of 30 (10 for human-to-human variability and 3 for animal-to-human toxicodynamic variability not accounted for in the human equivalent dose calculation), resulting in the MDHHS interim RfD of 1.4 x 10⁻⁵ mg/kg/d. Although the US EPA has released a draft health effect assessment for PFOS, no RfD has been finalized as yet. MDHHS will continue to follow the progress of that assessment and re-evaluate the interim RfD when the U.S. EPA issues a final value.
Cancer Risk Considerations No studies of humans exposed orally to PFOS were identified in the Agency for Toxic Substances and Disease Registry (ATSDR) Toxicology Profile (ATSDR 2009). Animal studies provided inconclusive results regarding PFOS carcinogenicity (ATSDR 2009). Some animal studies reported DNA damage that was likely due to reactive oxygen species (ATSDR 2009). PFOS was found to be non-mutagenic in bacteria, human lymphocytes, or rat hepatocytes (ATSDR 2009). MDHHS has not identified a cancer slope factor for PFOS.
Vulnerable (Sensitive) Population Considerations Human fetuses are exposed during development to PFOS from contaminated fish that the mother eats. Exposure to newborn and older babies could occur through the mother’s breast milk. In addition, infants may have a reduced capacity to eliminate PFOS, due to still developing organ systems. Literature describing associations between PFOS exposure and effects in children is limited (ATSDR 2009). Studies of rodents exposed to PFOS have shown development effects (ATSDR 2009).
References Agency for Toxic Substances and Disease Registry (ATSDR). 2009. Toxicological profile for perfluoroalkyls. (Draft for Public Comment) Atlanta, GA: U.S. Department of Health and Human Services, Public Health Service. Michigan Department of Community Health (MDCH). 2014. Technical Support Document for Assessment of Perfluorinated Chemicals and Selection of a Perfluorooctane Sulfonate (PFOS) Reference Dose as the basis for Michigan Fish Consumption Screening Values (FCSVs). Health Consultation. Lansing, MI.

A-21
Michigan Department of Environmental Quality (MDEQ). 2014. Toxicological Assessment for Perfluorooctane Sulfonic Acid (CASRN 1763-23-1) Human Noncancer Value. Seacat AM, Thomford PJ, et al. 2002. Subchronic toxicity studies on perfluorooctanesulfonate potassium salt in Cynomolgus monkeys. Toxicol. Sci. 68:249-264.
A-22
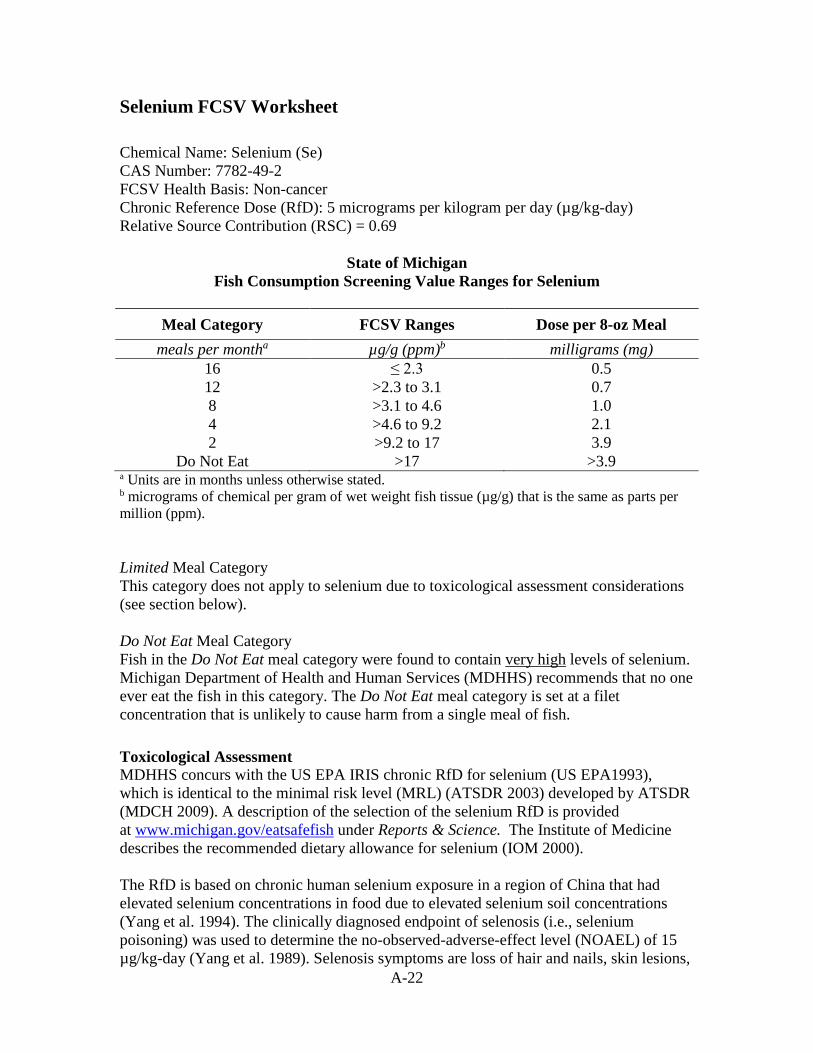
Selenium FCSV Worksheet Chemical Name: Selenium (Se) CAS Number: 7782-49-2 FCSV Health Basis: Non-cancer Chronic Reference Dose (RfD): 5 micrograms per kilogram per day (µg/kg-day) Relative Source Contribution (RSC) = 0.69
State of Michigan Fish Consumption Screening Value Ranges for Selenium
Meal Category FCSV Ranges Dose per 8-oz Meal
meals per montha µg/g (ppm)b milligrams (mg) 16 ≤ 2.3 0.5 12 >2.3 to 3.1 0.7 8 >3.1 to 4.6 1.0 4 >4.6 to 9.2 2.1 2 >9.2 to 17 3.9
Do Not Eat >17 >3.9 a Units are in months unless otherwise stated. b micrograms of chemical per gram of wet weight fish tissue (µg/g) that is the same as parts per million (ppm). Limited Meal Category This category does not apply to selenium due to toxicological assessment considerations (see section below). Do Not Eat Meal Category Fish in the Do Not Eat meal category were found to contain very high levels of selenium. Michigan Department of Health and Human Services (MDHHS) recommends that no one ever eat the fish in this category. The Do Not Eat meal category is set at a filet concentration that is unlikely to cause harm from a single meal of fish. Toxicological Assessment MDHHS concurs with the US EPA IRIS chronic RfD for selenium (US EPA1993), which is identical to the minimal risk level (MRL) (ATSDR 2003) developed by ATSDR (MDCH 2009). A description of the selection of the selenium RfD is provided at www.michigan.gov/eatsafefish under Reports & Science. The Institute of Medicine describes the recommended dietary allowance for selenium (IOM 2000). The RfD is based on chronic human selenium exposure in a region of China that had elevated selenium concentrations in food due to elevated selenium soil concentrations (Yang et al. 1994). The clinically diagnosed endpoint of selenosis (i.e., selenium poisoning) was used to determine the no-observed-adverse-effect level (NOAEL) of 15 µg/kg-day (Yang et al. 1989). Selenosis symptoms are loss of hair and nails, skin lesions,

A-23
nausea, irritability, fatigue, and mild nerve damage (Yang et al. 1983, NIH 2012). An uncertainty factor of 3 for human variability was applied by the US EPA resulting in an RfD of 5 µg/kg-day. A second study of human selenium exposure (North Dakota, US), looking for clinical signs of selenosis, was considered by the US EPA to be supportive of this RfD (Longnecker 1994). Acute human exposure to selenium is not well defined (Olsen 1986), but has occurred. Olsen (1986) summarized acute and chronic selenium poisoning that resulted in symptoms that could be considered selenosis. The best example was 57-year-old female who consumed a daily vitamin supplement (31 mg per tablet) for 11 days and acquired selenosis. She recovered from the exposure. Olsen (1986) suggested that a maximum single oral dose of 0.05 mg Se/kg body weight for adults or young adults is not likely to cause harm. For an 80-kg adult, this is equal to 4 mg of selenium in a single meal. Based on acute toxicity concerns that a few high doses may be harmful to vulnerable populations, MDHHS set the maximum FCSV for selenium to 17 parts per million (ppm), which is equivalent to 3.9 mg of selenium in an 8-oz meal (227 grams) and a dose of 0.05 mg Se/kg body weight. MDHHS recommends that no one eat a meal of fish that exceeds 17 ppm of selenium. Cancer Risk Considerations US EPA classifies selenium as not classifiable as to carcinogenicity in humans (Classification D), based on inadequate data in humans and inadequate evidence of carcinogenicity in animals (US EPA 1993). US EPA has not published a cancer slope value for selenium, thus, selenium is not evaluated for cancer risk. Vulnerable (Sensitive) Population Considerations The primary epidemiology study used to set the chronic RfD found that children did not exhibit signs of selenosis when exposed to amounts of selenium that did result in clinical symptoms in adults (Yang et al. 1983, Yang et al. 1989). References Agency for Toxic Substances and Disease Registry (ATSDR). 2003. Toxicological profile for Selenium. Atlanta, GA: U.S. Department of Health and Human Services, Public Health Service.
Institute of Medicine, Food and Nutrition Board. Dietary Reference Intakes: Vitamin C, Vitamin E, Selenium, and Carotenoids. National Academy Press, Washington, DC, 2000.
Longnecker, MP, Taylor PR, et al. 1991. Selenium in diet, blood, and toenails in relation to human health in a seleniferous area. Am. J. Clin. Nutr. 53: 1288-1294. Michigan Department of Community Health (MDCH). 2009. Technical Support Document for a Methylmercury Reference Dose as a Basis for Fish Consumption Screening Values (FCSVs). Lansing, Michigan.

A-24
National Institutes of Health (NIH). 2012. Dietary Supplement Fact Sheet: Selenium. Office of Dietary Supplements. October 12, 1012. http://ods.od.nih.gov/factsheets/Selenium-HealthProfessional/ Olson, OE. 1986. Selenium toxicity in animals with emphasis on man. International Journal of Toxicology. 5:45-70. US Environmental Protection Agency (US EPA). 1993. Selenium and compounds (CASRN 7782-49-2). Integrated Risk Information System. http://www.epa.gov/iris/subst/0472.htm Yang G, Wang S, Zhou R, et al. 1983. Endemic selenium intoxication of humans in China. Am J Clin Nutr 37:872-881. Yang G, Yin S, Zhou R, et al. 1989. Studies of safe maximal daily dietary Se-intake in a seleniferous area in China. II. Relation between Se-intake and the manifestation of clinical signs and certain biochemical alterations in blood and urine [published erratum appears in J Trace Elem Electrolytes Health Dis 3(4):250.] J Trace Elem Electrolytes Health Dis 3(3):123-130. Yang G, Zhou R. 1994. Further observations on the human maximum safe dietary selenium intake in a seleniferous area of China. J Trace Elem Electrolytes Health Dis. 8:159-165.
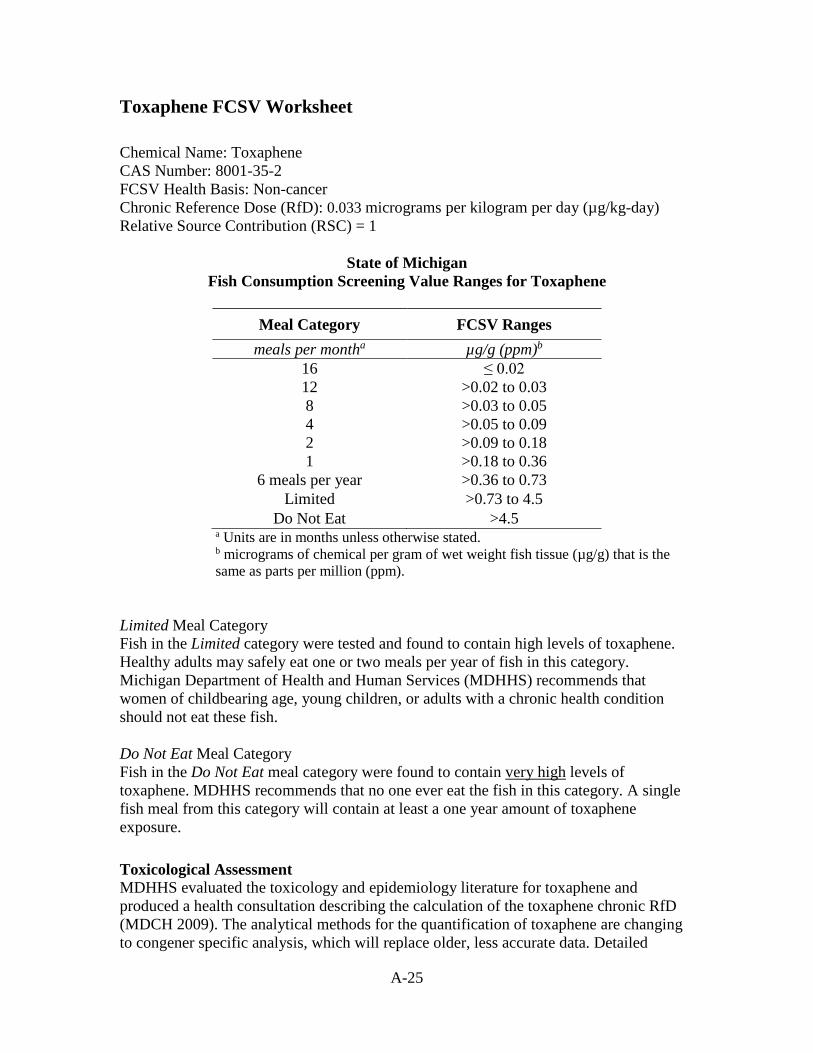
A-25
Toxaphene FCSV Worksheet Chemical Name: Toxaphene CAS Number: 8001-35-2 FCSV Health Basis: Non-cancer Chronic Reference Dose (RfD): 0.033 micrograms per kilogram per day (µg/kg-day) Relative Source Contribution (RSC) = 1
State of Michigan Fish Consumption Screening Value Ranges for Toxaphene
Meal Category FCSV Ranges
meals per montha µg/g (ppm)b
16 ≤ 0.02 12 >0.02 to 0.03 8 >0.03 to 0.05 4 >0.05 to 0.09 2 >0.09 to 0.18 1 >0.18 to 0.36
6 meals per year >0.36 to 0.73 Limited >0.73 to 4.5
Do Not Eat >4.5 a Units are in months unless otherwise stated. b micrograms of chemical per gram of wet weight fish tissue (µg/g) that is the same as parts per million (ppm).
Limited Meal Category Fish in the Limited category were tested and found to contain high levels of toxaphene. Healthy adults may safely eat one or two meals per year of fish in this category. Michigan Department of Health and Human Services (MDHHS) recommends that women of childbearing age, young children, or adults with a chronic health condition should not eat these fish. Do Not Eat Meal Category Fish in the Do Not Eat meal category were found to contain very high levels of toxaphene. MDHHS recommends that no one ever eat the fish in this category. A single fish meal from this category will contain at least a one year amount of toxaphene exposure. Toxicological Assessment MDHHS evaluated the toxicology and epidemiology literature for toxaphene and produced a health consultation describing the calculation of the toxaphene chronic RfD (MDCH 2009). The analytical methods for the quantification of toxaphene are changing to congener specific analysis, which will replace older, less accurate data. Detailed

A-26
information is provided in a technical document at www.michigan.gov/eatsafefish under Reports & Science. The RfD was derived from a study of female monkeys. They were treated for over a year (75 weeks, subchronic exposure) with multiple doses of technical toxaphene. Immune system function was assessed after 33 weeks of treatment (MDCH 2009). A no-observed-adverse-effect level (NOAEL) of 0.1 milligrams per kilogram per day (mg/kg-day) was identified from this subchronic study. MDHHS applied a combined uncertainty factor of 3,000 based on animal to human extrapolation (UF=10), human to human variability (UF=10), sub-chronic to chronic extrapolation (UF=10), and a modifying factor of 3 for possible developmental effects, resulting in an RfD of 0.033 µg/kg/day (MDCH 2009). Cancer Risk Considerations The US EPA considers toxaphene to be a probable human carcinogen based on sufficient evidence of carcinogenicity in animals. US EPA has not listed toxaphene as having mutagenic mode of action. Most studies show toxaphene is not genotoxic in mammalian cells, but can be genotoxic in prokaryotic organisms (ATSDR 2010). The weight of evidence suggests a nongenotoxic mode of action for toxaphene tumorigenicity (ATSDR 2010). Applying the US EPA’s toxaphene upper-bound cancer slope factor of 1.1 (mg/kg-day)-1 to the FCSVs, the resulting upper-bound risk is between 3 and 7 additional cancers for every 100,000 individuals exposed for 30 to 78 years, respectively. MDHHS finds this cancer risk to be low and the toxaphene FCSV adequately protective of cancer risk. Vulnerable (Sensitive) Population Considerations Human fetuses would be exposed during development to toxaphene from contaminated fish that the mother eats. Further exposure to newborns and older babies could occur through the mother’s breast milk. If toxic exposure levels are high enough during critical growth stages, the developing body systems of children can sustain permanent damage. MDHHS’s derived chronic RfD is based on an endpoint that is protective of sensitive subpopulations. The selected endpoint of suppression of immune system response is a subclinical endpoint that has been documented in animals including monkeys. The Agency for Toxic Substances and Disease Registry (ATSDR) used the same immune system study as MDHHS to establish the ATSDR intermediate oral Minimal Risk Level (MRL) (ATSDR 2010). Infants and children are especially sensitive to immune suppression because the immune system does not reach maturity until 10 to 12 years of age (ATSDR 2010). The immunosuppression also applies to adults, as adults with impaired immune systems are more susceptible to disease, including cancer. Few neurodevelopmental studies of toxaphene have been conducted, and the existing information is inconclusive for this endpoint (ATSDR 2010).

A-27
References Agency for Toxic Substances and Disease Registry (ATSDR). 2010. Toxicological profile for toxaphene. (Draft for Public Comment) Atlanta, GA: U.S. Department of Health and Human Services, Public Health Service. Michigan Department of Community Health (MDCH). 2009. Technical support document for a toxaphene reference dose (RfD) as a basis for fish consumption screening values (FCSVs). State of Michigan. Lansing, Michigan.
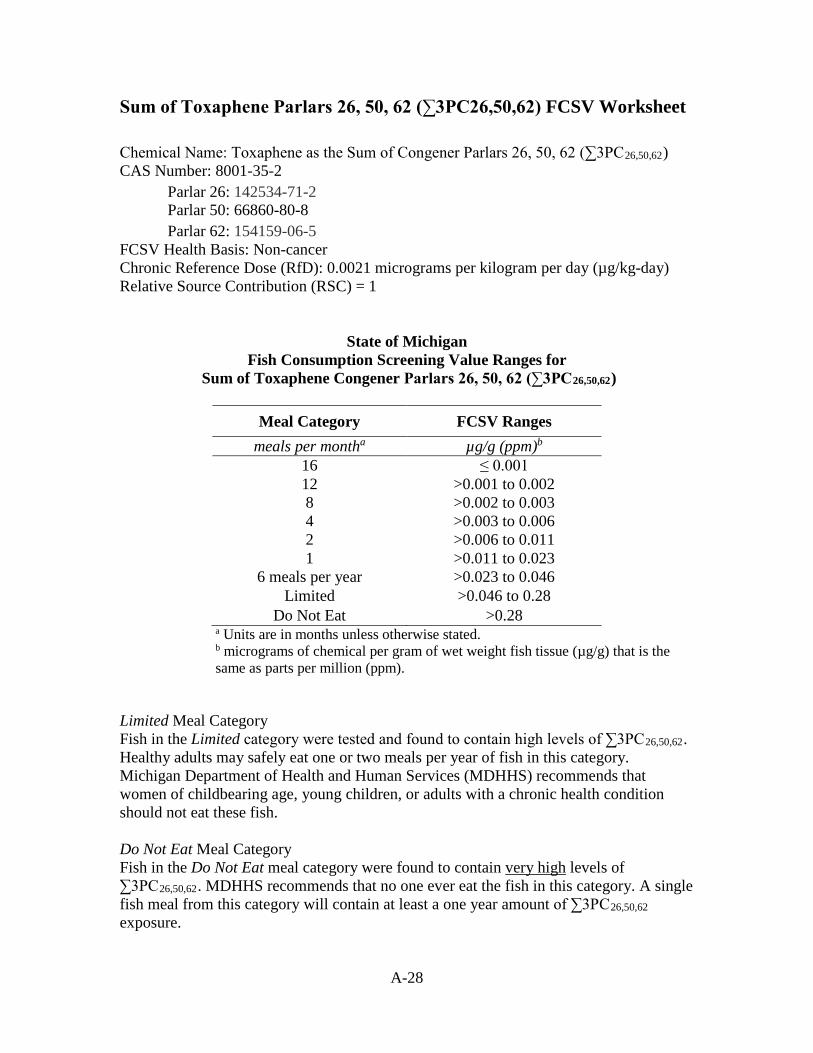
A-28
Sum of Toxaphene Parlars 26, 50, 62 (∑3PC26,50,62) FCSV Worksheet Chemical Name: Toxaphene as the Sum of Congener Parlars 26, 50, 62 (∑3PC26,50,62) CAS Number: 8001-35-2
Parlar 26: 142534-71-2 Parlar 50: 66860-80-8
Parlar 62: 154159-06-5 FCSV Health Basis: Non-cancer Chronic Reference Dose (RfD): 0.0021 micrograms per kilogram per day (µg/kg-day) Relative Source Contribution (RSC) = 1
State of Michigan Fish Consumption Screening Value Ranges for
Sum of Toxaphene Congener Parlars 26, 50, 62 (∑3PC26,50,62)
Meal Category FCSV Ranges meals per montha µg/g (ppm)b
16 ≤ 0.001 12 >0.001 to 0.002 8 >0.002 to 0.003 4 >0.003 to 0.006 2 >0.006 to 0.011 1 >0.011 to 0.023
6 meals per year >0.023 to 0.046 Limited >0.046 to 0.28
Do Not Eat >0.28 a Units are in months unless otherwise stated. b micrograms of chemical per gram of wet weight fish tissue (µg/g) that is the same as parts per million (ppm).
Limited Meal Category Fish in the Limited category were tested and found to contain high levels of ∑3PC26,50,62. Healthy adults may safely eat one or two meals per year of fish in this category. Michigan Department of Health and Human Services (MDHHS) recommends that women of childbearing age, young children, or adults with a chronic health condition should not eat these fish. Do Not Eat Meal Category Fish in the Do Not Eat meal category were found to contain very high levels of ∑3PC26,50,62. MDHHS recommends that no one ever eat the fish in this category. A single fish meal from this category will contain at least a one year amount of ∑3PC26,50,62 exposure.
A-29
Toxicological Assessment MDHHS evaluated the toxaphene toxicology and epidemiology literature and produced a health consultation describing the calculation of the toxaphene chronic RfD (MDCH 2009). The analytical methods for the quantification of toxaphene are changing to congener specific analysis, which will replace older, less accurate data. A document describing the RfD and these analytical considerations is provided at www.michigan.gov/eatsafefish under Reports & Science. The RfD was derived from a study of partially hepatectomized rats treated subcutaneously for 20 weeks with a mixture of weathered toxaphene that included Parlar congeners 26, 50, and 62. The concentration of 26, 50, and 62 were quantified in the extract injected into the rats. The number of altered hepatic foci expressing placental glutathione-S-transferase (GST-p-AHF), which is an indication of tumor promotion, was quantified. None of the treatment groups had altered hepatic foci, however concentration changes at the highest concentrations were reported for GST-p-AHF. A no-observed-adverse-effect level (NOAEL) of 0.0021 milligrams per kilogram per day (mg/kg/day) for the sum of Parlar congeners 26, 50, and 62 (∑3PC26,50,62) was identified. MDHHS applied a combined uncertainty factor of 100 based on animal to human extrapolation (UF=10) and human to human variability (UF=10) to the NOAEL resulting in 0.0000021 mg/kg-day (0.0021 µg/kg-day). Cancer Risk Considerations Toxaphene is a mixture of chemicals that US EPA considers to be probable human carcinogens based on sufficient evidence of carcinogenicity in animals. Parlars 26, 50, 62 are three of those chemical that are persistent in fish and humans. The RfD used to calculate the FCSVs for the ∑3PC26,50,62 is based on cancer promotion measured by the occurrence of pre-cancerous hepatic foci, making this RfD protective of cancer risk. Vulnerable (Sensitive) Population Considerations Human fetuses would be exposed during development to toxaphene from contaminated fish that the mother eats. Further exposure to newborns and older babies could occur through the mother’s breast milk. If toxic exposure levels are high enough during critical growth stages, the developing body systems of children can sustain permanent damage. Toxaphene is a pesticide made up of a mixture of over 670 chemicals. When it is released into the environment, a subset of those chemicals accumulate in fish and people. Parlars 26, 50, and 62 are three toxaphene congeners that persist in fish and people and correlated to a pre-cancerous endpoint. The more accurate analytical quantification of ∑3PC26,50,62 as well the choice of a sensitive endpoint makes this chronic RfD a protective approach for vulnerable populations. References Michigan Department of Community Health (MDCH). 2009. Technical support document for a toxaphene reference dose (RfD) as a basis for fish consumption screening values (FCSVs). State of Michigan. Lansing, Michigan.

B-1
Additional Public Health Considerations for Waterbody- and Species- Specific Consumption Guidelines

B-2
Background Each waterbody- and species-specific guideline can have conditions that require additional considerations beyond the standard assessment process. Conditions can be caused by water-specific contamination issues (e.g. point-source contamination) and/or dataset-specific issues (e.g. small sample size; limited range of fish lengths, older sample collection years). Some conditions are relatively common and the approaches to those are described below; other conditions are rare or unique to waterbodies or datasets and require a unique, tailored evaluation.
Waterbody-Specific Conditions Additional consideration may be needed for waterbodies where a point-source of contamination can be identified. Specific concerns include uncertainty regarding impacts to the ecosystem, fate and transport of the chemical of concern (COC) in the environment, and uptake by the fish. Most of these conditions are multifaceted and unique to a waterbody, resulting in the need to apply additional consideration in selecting the appropriate guideline for fish consumption (see section below). For waterbodies with highly elevated COC contamination, a waterbody-wide guideline may be appropriate. A waterbody-wide guideline is a meal frequency that is recommended for all fish in the waterbody that lack adequate datasets to issue species-specific guidelines, yet are highly likely to be contaminated. This type of guideline can be recommended when both of the following conditions exist:
1. Analytical data are available for a. A minimum of two fish species, and b. One of those species is a non-benthic feeding fish, and c. A guideline recommending consumption be limited to 6 meals per year or
less identified by the Michigan Department of Health and Human Services (MDHHS)
2. The chemical contamination is partly from sources other than atmospheric deposition, such as a point-source discharge from a known site of environmental contamination where data are available to indicate that site contaminants are also found in fish.
The meal consumption category for a waterbody-wide guideline recommended for all fish species lacking contaminant data will be set to a protective meal category of 6 meals or less per year unless additional data are available to support an alternative. Additional fish sampling and analyses will be requested.
Dataset-Specific Conditions The standard data assessment process can require additional considerations when dataset limitations are encountered. Dataset limitations include datasets with less than five samples for each species and chemical; datasets in which the most recent data are more than 15 years old; datasets with samples that are not of legal length; datasets that lack
B-3
longer lengths of fish; and datasets that may not include mercury levels as mercury is anticipated to be in almost all freshwater fish. When datasets with limitations demonstrate the presence of chemical contamination, additional considerations are applied to reach a health protective guideline. Sample Size Considerations A dataset of less than five samples per chemical, species and waterbody is considered insufficient for evaluation using the standard assessment process. Datasets with less than five samples will be reviewed by MDHHS staff for values that exceed a Limited fish consumption screening value and concerns will be provided to management. Statewide Eat Safe Fish Guidelines for mercury and polychlorinated biphenyls (PCBs) apply to all Michigan waters except for the Great Lakes and may address some datasets with insufficient sample size. Year of Sample Collection Considerations The level of COCs found in a fish sample represents the measured concentration at the time of collection; therefore more recent samples may be most representative of current contaminant levels. The Michigan Department of Environmental Quality (MDEQ) has documented temporal trends in the fish tissue concentrations of several persistent, bioaccumulative COCs in five rivers, eight lakes, and the Great Lakes13. Trend data are available for polychlorinated biphenyls (PCBs), total dichlorodiphenyltrichloroethane (DDT) and its metabolites, total chlordane, and mercury. No trend data are available for other COCs. These documented trends can be used to select a conservative estimate of similar trends for other waters that do not have known point-source contamination. MDEQ used analytical data from whole fish samples to demonstrate that total PCBs, total DDT and its metabolites, and total chlordane concentrations declined by at least three percent (3%) per year depending on the species and location14. One inland lake and one river had non-significant trends for total DDT, but none of the studied waterbodies showed increasing trends. The median reduction was between five (5%) and nine percent (9%) across all waterbodies. Assuming a three (3%) to five percent (5%) reduction in PCBs or DDT per year, a decline of 50 percent in whole fish concentrations would occur after approximately 15 years. A 50 percent decline would allow for a less restrictive guideline for these COCs. For mercury, no consistent trend across waterbodies has been observed by the MDEQ whole fish trend monitoring program. The program reported that 10 of 13 waterbody-species combinations from inland lakes and rivers showed no statistically significant change over time, with one combination having a significant increase and two combinations showing a significant decrease8. Location-species combinations from the
13 MDEQ Fish Contaminant Monitoring Program. http://www.michigan.gov/deq/0,1607,7-135-3313_3686_3728-32393--,00.html 14 MDEQ Fish Contaminant Monitoring Program. 2008 Report. http://www.michigan.gov/documents/deq/wb-swas-fcmp-2008report_284691_7.pdf

B-4
Great Lakes were reported to have no change over time for 10 sites, increasing trends for nine, and a decreasing trend for one. Temporal Trend Adjustments for PCBs, DDT, or Chlordane Guidelines for PCBs, DDT, or chlordane that are based on datasets that are 15 years and older can be relaxed one meal category, one time, when:
1. There are at least five samples per chemical in the dataset, and 2. There are no source control or legacy contamination concerns, and 3. The existing guideline is no more restrictive than six meals per year.
Additional sample collection and analysis from the specific waterbody is required for any further relaxation of the guidelines. The temporal trend adjustment cannot be applied:
1. To the limited or do not eat meal categories, or 2. When mercury concentrations would cause a more restrictive advisory, or 3. When the dataset is too limited to be evaluated using the standard assessment
process.
Temporal Trend Adjustments for Mercury At this time, no adjustment to the Guidelines for mercury can be applied because the MDEQ has not demonstrated a consistent trend in mercury levels in fish across waterbodies. Temporal Trend Adjustments for Other Chemicals No adjustment can be made to the Guidelines for other COCs unless supporting information becomes available. Fish Length Considerations The standard assessment process is most accurate when the lengths of the fish samples span the range that can be legally harvested. Datasets that include only smaller fish may not provide an accurate representation of COC concentrations in larger fish. This is particularly true for mercury, PCBs, DDT, and dioxin like chemicals (DLCs) that accumulate to higher concentrations in longer, older fish. Datasets that include samples from fish smaller than the legal length (i.e., sub-legal) can result in statistics that are skewed low and do not represent the legally harvestable lengths. The following adjustments to guidelines can be made for these situations. Sub-legal Length Samples When the dataset includes sub-legal length fish but regression analysis identifies a positive correlation coefficient (R2) greater than 0.6, then the regression analysis can be used to select a length break(s) to set a guideline(s). For lengths outside the length range
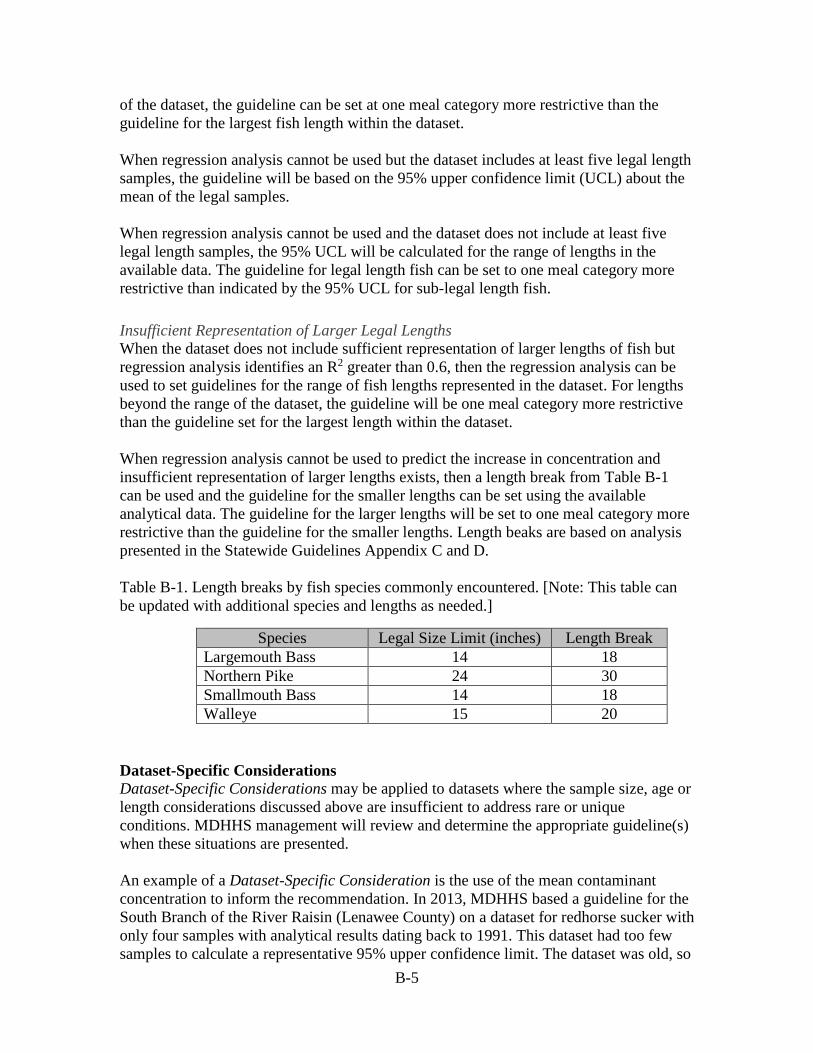
B-5
of the dataset, the guideline can be set at one meal category more restrictive than the guideline for the largest fish length within the dataset. When regression analysis cannot be used but the dataset includes at least five legal length samples, the guideline will be based on the 95% upper confidence limit (UCL) about the mean of the legal samples. When regression analysis cannot be used and the dataset does not include at least five legal length samples, the 95% UCL will be calculated for the range of lengths in the available data. The guideline for legal length fish can be set to one meal category more restrictive than indicated by the 95% UCL for sub-legal length fish. Insufficient Representation of Larger Legal Lengths When the dataset does not include sufficient representation of larger lengths of fish but regression analysis identifies an R2 greater than 0.6, then the regression analysis can be used to set guidelines for the range of fish lengths represented in the dataset. For lengths beyond the range of the dataset, the guideline will be one meal category more restrictive than the guideline set for the largest length within the dataset. When regression analysis cannot be used to predict the increase in concentration and insufficient representation of larger lengths exists, then a length break from Table B-1 can be used and the guideline for the smaller lengths can be set using the available analytical data. The guideline for the larger lengths will be set to one meal category more restrictive than the guideline for the smaller lengths. Length beaks are based on analysis presented in the Statewide Guidelines Appendix C and D. Table B-1. Length breaks by fish species commonly encountered. [Note: This table can be updated with additional species and lengths as needed.]
Species Legal Size Limit (inches) Length Break Largemouth Bass 14 18 Northern Pike 24 30 Smallmouth Bass 14 18 Walleye 15 20
Dataset-Specific Considerations Dataset-Specific Considerations may be applied to datasets where the sample size, age or length considerations discussed above are insufficient to address rare or unique conditions. MDHHS management will review and determine the appropriate guideline(s) when these situations are presented. An example of a Dataset-Specific Consideration is the use of the mean contaminant concentration to inform the recommendation. In 2013, MDHHS based a guideline for the South Branch of the River Raisin (Lenawee County) on a dataset for redhorse sucker with only four samples with analytical results dating back to 1991. This dataset had too few samples to calculate a representative 95% upper confidence limit. The dataset was old, so
B-6
the available data were not likely to be representative of current COC concentrations. In addition, the length of the samples was limited to smaller sizes under 13 inches. This limited dataset demonstrated that mercury is present in this waterbody and fish species. A temporal trend adjustment could not be applied because the MDEQ cannot demonstrate a consistent trend in mercury levels in Michigan fish. Further, the MDEQ predicts that mercury concentrations are either steady or increasing and that mercury concentrations tend to increase with the length of the fish, thus longer fish typically have higher concentrations. One option was to rely on the Statewide Safe Fish Guideline for mercury in sucker, which has a guideline of eight meals per month. However, the mean concentration of mercury in these four sucker samples of 0.225 parts per million (ppm) indicates a meal category of four meals per month is more appropriate. The Statewide guideline of eight meals a month would not have been sufficiently protective of public health. In this example, the final guidelines were based on the limited available data for smaller fish with a guideline for larger fish set to one meal category more restrictive as shown below:
No one should eat more than 4 meals per month of South Branch River Raisin sucker less than 13 inches or 2 meals per month of sucker greater than 13 inches due to mercury. Dataset is limited due to age of the data and sample size. A dataset specific consideration to use the mean mercury concentration and a length break were applied.

C-1
Supporting Documentation for Statewide Eat Safe Fish Guidelines for Species from Inland Waters Contaminated with Mercury.
C-2
Introduction Fish consumption guidelines (hereafter referred to as “Guidelines”) are public health advisories issued by the Michigan Department of Health and Human Services (MDHHS) under the authority of the Michigan Public Health Code (Act 368 of 1978). Statewide consumption guidelines may be issued when a chemical of concern (COC) is found in one or more fish species from multiple waterbodies dispersed across a wide geographic range in Michigan. A statewide advisory generally applies to all rivers and inland lakes, but not to the Great Lakes. Lake-wide advisories may be issued for a region of a Great Lake or the entire Great Lake if a COC is found to be a concern throughout the defined area. The purpose of this document is to provide technical support for the statewide mercury fish consumption guidelines. Guidelines that are issued for specific fish species and waterbodies should be followed rather than the statewide guidelines when they differ. MDHHS will issue statewide fish consumption guidelines when:
• A COC prompts guidelines for waterbodies that are dispersed across a wide geographic range; and
• The data support the conclusion that guidelines are appropriate for many species and waterbodies, including those without existing data; and
• The species-waterbody specific guideline approach is not feasible for every affected waterbody and species given the statewide extent of the contamination.
Statewide consumption guidelines are not predicated on COC data for every location and species for which the guidance is issued. These guidelines are not evaluated on an annual basis, but may be re-evaluated if temporal trend data suggest chemical concentrations in the environment have changed.
Background Some chemicals, such as mercury and polychlorinated biphenyls (PCBs), are widely dispersed in Michigan’s environment. These chemicals are persistent and bioaccumulative in aquatic systems, and may also biomagnify in the foodweb. These COCs may enter Michigan surface waters from both wet and dry atmospheric deposition and non-point source runoff. Michigan has about 76,000 miles of streams and rivers and 46,000 inland lakes and ponds greater than 0.1 acre in size, many of which do not have public access. It is not feasible, therefore, to develop species- and waterbody-specific fish consumption guidelines for every fish and location in Michigan. However, mercury is one of two chemicals that most often prompt MDHHS Eat Safe Fish Guidelines. In 1989, MDHHS published the first statewide mercury fish consumption guidance for top predator fish species and larger sizes of panfish. The guidance applied to these species found in all inland lakes, including those lakes where no fish samples had been collected. Two sets of guidelines were previously provided: one for women of childbearing age and children under the age of 15 years old, and a second, less restrictive set, for everyone else. No technical document exists that provides a summary of the mercury data or other information that was used to support the 1989 guidance. In a 1998 Michigan Environmental Science Board document, a brief
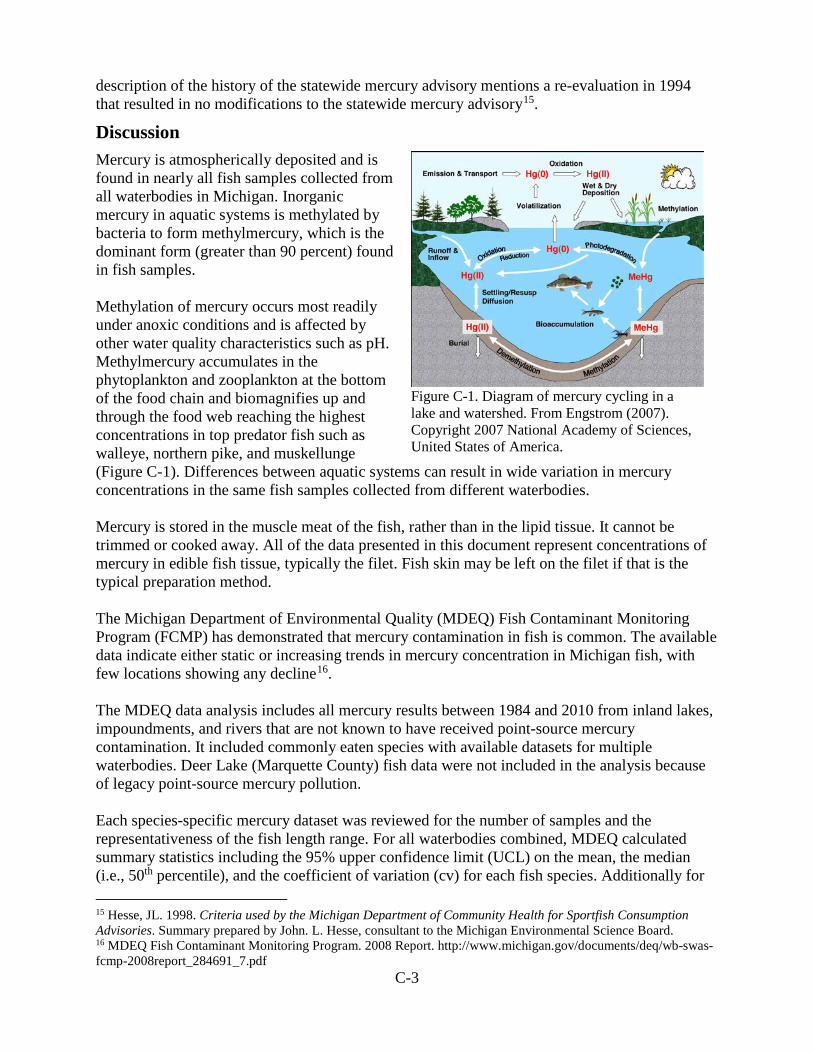
C-3
description of the history of the statewide mercury advisory mentions a re-evaluation in 1994 that resulted in no modifications to the statewide mercury advisory15.
Discussion Mercury is atmospherically deposited and is found in nearly all fish samples collected from all waterbodies in Michigan. Inorganic mercury in aquatic systems is methylated by bacteria to form methylmercury, which is the dominant form (greater than 90 percent) found in fish samples. Methylation of mercury occurs most readily under anoxic conditions and is affected by other water quality characteristics such as pH. Methylmercury accumulates in the phytoplankton and zooplankton at the bottom of the food chain and biomagnifies up and through the food web reaching the highest concentrations in top predator fish such as walleye, northern pike, and muskellunge (Figure C-1). Differences between aquatic systems can result in wide variation in mercury concentrations in the same fish samples collected from different waterbodies. Mercury is stored in the muscle meat of the fish, rather than in the lipid tissue. It cannot be trimmed or cooked away. All of the data presented in this document represent concentrations of mercury in edible fish tissue, typically the filet. Fish skin may be left on the filet if that is the typical preparation method. The Michigan Department of Environmental Quality (MDEQ) Fish Contaminant Monitoring Program (FCMP) has demonstrated that mercury contamination in fish is common. The available data indicate either static or increasing trends in mercury concentration in Michigan fish, with few locations showing any decline16. The MDEQ data analysis includes all mercury results between 1984 and 2010 from inland lakes, impoundments, and rivers that are not known to have received point-source mercury contamination. It included commonly eaten species with available datasets for multiple waterbodies. Deer Lake (Marquette County) fish data were not included in the analysis because of legacy point-source mercury pollution. Each species-specific mercury dataset was reviewed for the number of samples and the representativeness of the fish length range. For all waterbodies combined, MDEQ calculated summary statistics including the 95% upper confidence limit (UCL) on the mean, the median (i.e., 50th percentile), and the coefficient of variation (cv) for each fish species. Additionally for 15 Hesse, JL. 1998. Criteria used by the Michigan Department of Community Health for Sportfish Consumption Advisories. Summary prepared by John. L. Hesse, consultant to the Michigan Environmental Science Board. 16 MDEQ Fish Contaminant Monitoring Program. 2008 Report. http://www.michigan.gov/documents/deq/wb-swas-fcmp-2008report_284691_7.pdf
Figure C-1. Diagram of mercury cycling in a lake and watershed. From Engstrom (2007). Copyright 2007 National Academy of Sciences, United States of America.
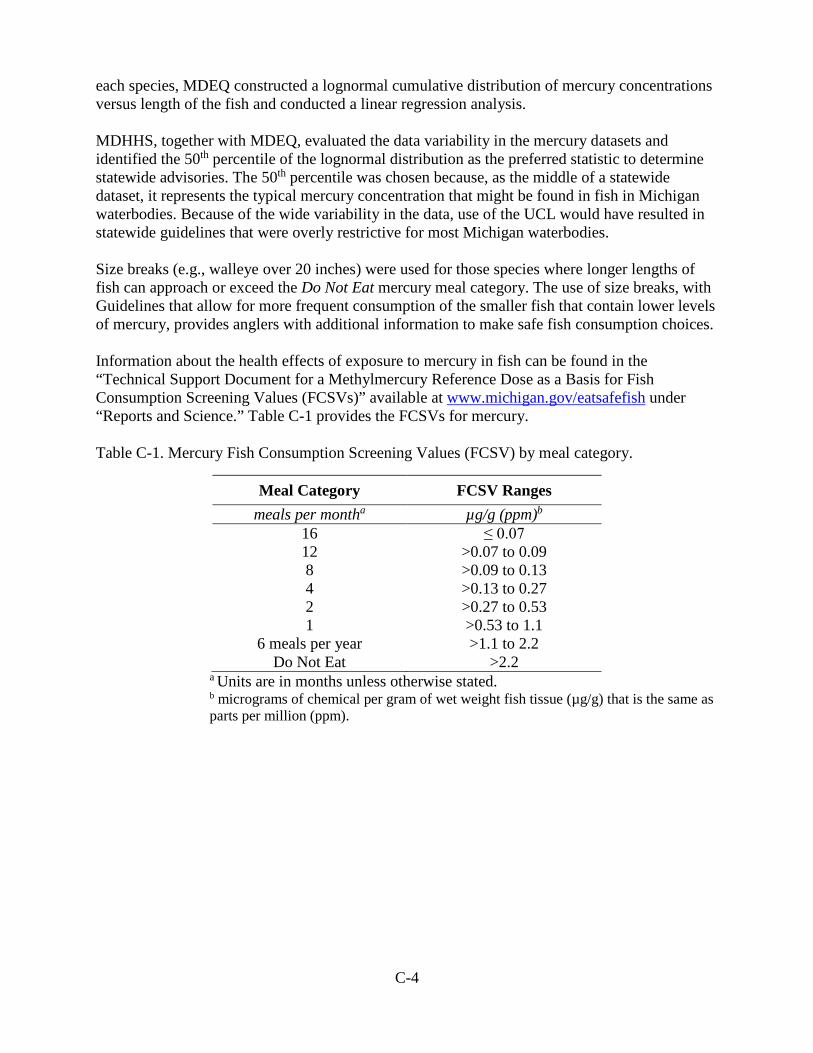
C-4
each species, MDEQ constructed a lognormal cumulative distribution of mercury concentrations versus length of the fish and conducted a linear regression analysis. MDHHS, together with MDEQ, evaluated the data variability in the mercury datasets and identified the 50th percentile of the lognormal distribution as the preferred statistic to determine statewide advisories. The 50th percentile was chosen because, as the middle of a statewide dataset, it represents the typical mercury concentration that might be found in fish in Michigan waterbodies. Because of the wide variability in the data, use of the UCL would have resulted in statewide guidelines that were overly restrictive for most Michigan waterbodies. Size breaks (e.g., walleye over 20 inches) were used for those species where longer lengths of fish can approach or exceed the Do Not Eat mercury meal category. The use of size breaks, with Guidelines that allow for more frequent consumption of the smaller fish that contain lower levels of mercury, provides anglers with additional information to make safe fish consumption choices. Information about the health effects of exposure to mercury in fish can be found in the “Technical Support Document for a Methylmercury Reference Dose as a Basis for Fish Consumption Screening Values (FCSVs)” available at www.michigan.gov/eatsafefish under “Reports and Science.” Table C-1 provides the FCSVs for mercury. Table C-1. Mercury Fish Consumption Screening Values (FCSV) by meal category.
Meal Category FCSV Ranges meals per montha µg/g (ppm)b
16 ≤ 0.07 12 >0.07 to 0.09 8 >0.09 to 0.13 4 >0.13 to 0.27 2 >0.27 to 0.53 1 >0.53 to 1.1
6 meals per year >1.1 to 2.2 Do Not Eat >2.2
a Units are in months unless otherwise stated. b micrograms of chemical per gram of wet weight fish tissue (µg/g) that is the same as parts per million (ppm).
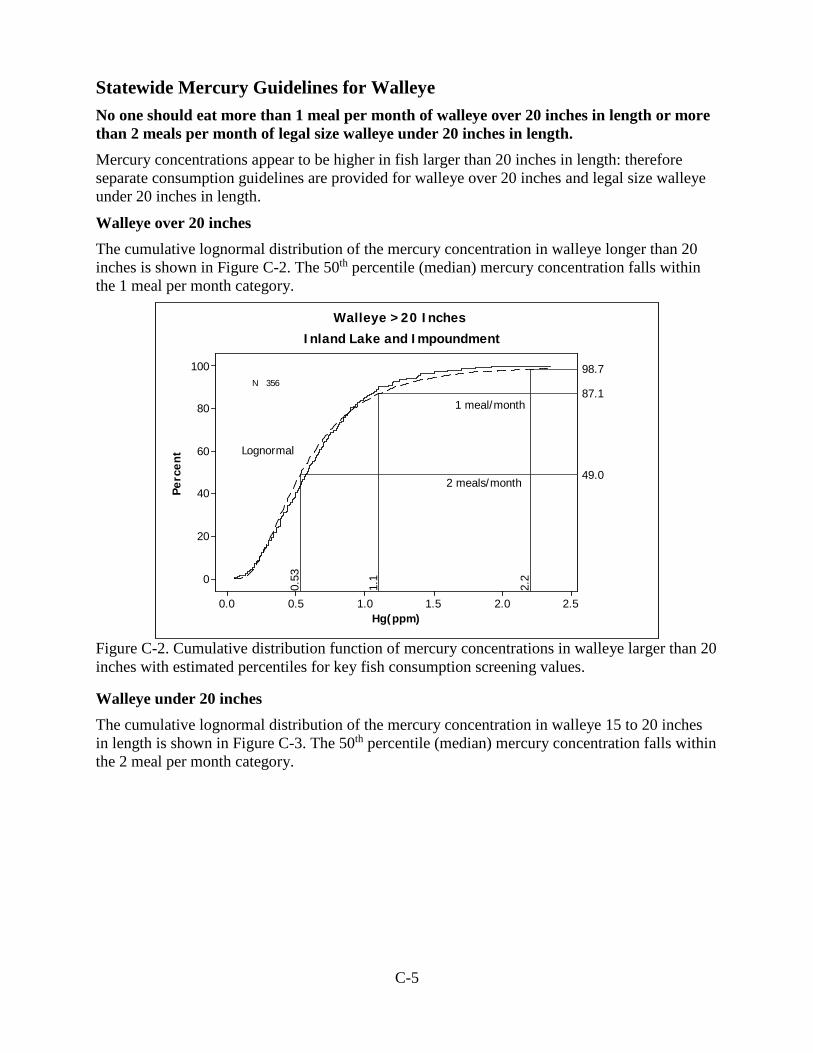
C-5
Statewide Mercury Guidelines for Walleye No one should eat more than 1 meal per month of walleye over 20 inches in length or more than 2 meals per month of legal size walleye under 20 inches in length. Mercury concentrations appear to be higher in fish larger than 20 inches in length: therefore separate consumption guidelines are provided for walleye over 20 inches and legal size walleye under 20 inches in length.
Walleye over 20 inches The cumulative lognormal distribution of the mercury concentration in walleye longer than 20 inches is shown in Figure C-2. The 50th percentile (median) mercury concentration falls within the 1 meal per month category.
2.52.01.51.00.50.0
100
80
60
40
20
0
Hg(ppm)
Perc
ent
2.2
98.71.
1
87.1
0.53
49.0
N 356
Lognormal
Inland Lake and ImpoundmentWalleye >20 Inches
1 meal/month
2 meals/month
Figure C-2. Cumulative distribution function of mercury concentrations in walleye larger than 20 inches with estimated percentiles for key fish consumption screening values.
Walleye under 20 inches The cumulative lognormal distribution of the mercury concentration in walleye 15 to 20 inches in length is shown in Figure C-3. The 50th percentile (median) mercury concentration falls within the 2 meal per month category.

C-6
2.52.01.51.00.50.0
100
80
60
40
20
0
Hg(ppm)
Perc
ent
2.2
99.7
1.1
95.8
0.53
73.3
0.27
34.4
0.13
6.5
0.09 1.9
N 978
Lognormal
Walleye 15 - 20 InchesInland Lake and Impoundment
1 meal/month
2 meals/month
4 meals/month
Figure C-3. Cumulative distribution function of mercury concentrations in walleye between 15 and 20 inches with estimated percentiles for key fish consumption screening values.
Additional Analyses for Walleye Mercury concentrations in walleye collected from rivers are generally lower than the concentrations in walleye collected from inland lakes and impoundments (Table C-2). Table C-2. Estimated mercury concentration (ppm) in filets of walleye from Michigan rivers and inland lakes based on samples collected from 1984 through 2010. Estimates are based on results of linear regression.
Lakes/Impoundments Rivers
Length (inches)
Estimated Concentration Meals/Month
Estimated Concentration Meals/Month
15 0.33 2 0.21 4 18 0.46 2 0.27 4 20 0.55 1 0.32 2 22 0.64 1 0.39 2 28 0.91 1 0.68 1 30 1.00 1 0.81 1 32 1.08 0.5 0.98 1
Linear regression of walleye length versus mercury concentration was highly significant (p-value approaching zero), although the R2 was only 0.17 (Figure C-4). The 95% UCL on the mean mercury concentration is 0.49 ppm. The walleye mercury data are moderately variable (cv = 0.67).
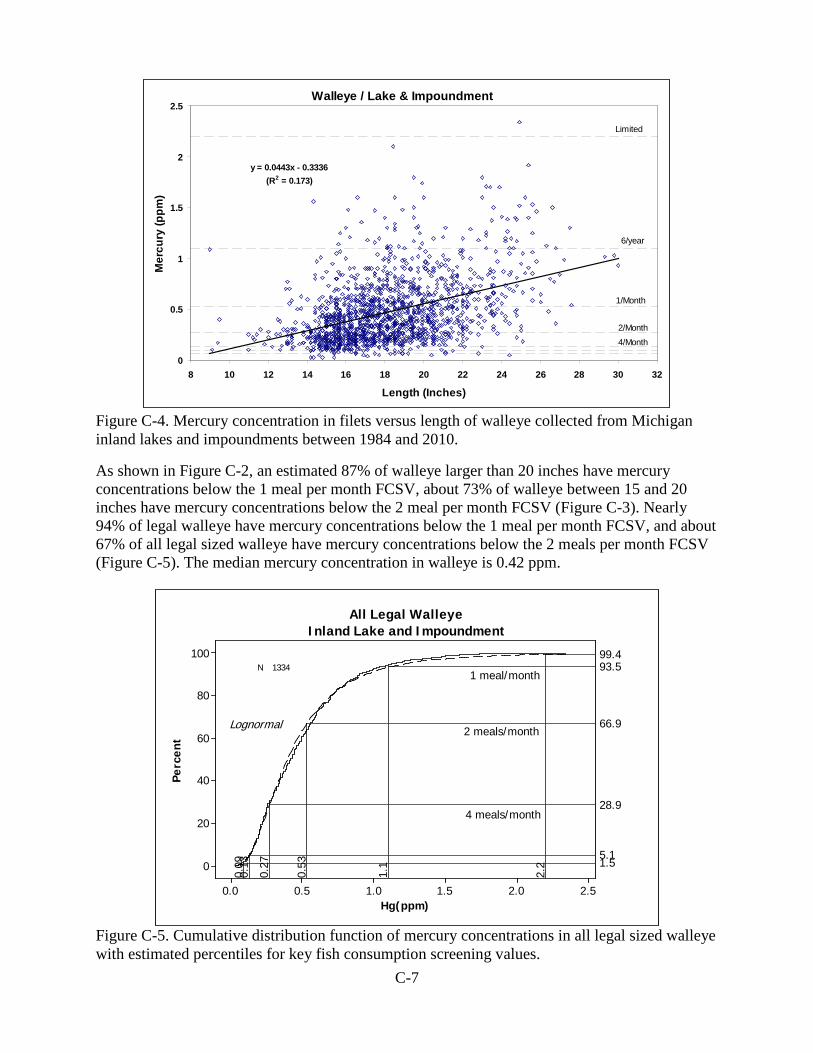
C-7
Figure C-4. Mercury concentration in filets versus length of walleye collected from Michigan inland lakes and impoundments between 1984 and 2010.
As shown in Figure C-2, an estimated 87% of walleye larger than 20 inches have mercury concentrations below the 1 meal per month FCSV, about 73% of walleye between 15 and 20 inches have mercury concentrations below the 2 meal per month FCSV (Figure C-3). Nearly 94% of legal walleye have mercury concentrations below the 1 meal per month FCSV, and about 67% of all legal sized walleye have mercury concentrations below the 2 meals per month FCSV (Figure C-5). The median mercury concentration in walleye is 0.42 ppm.
2.52.01.51.00.50.0
100
80
60
40
20
0
Hg(ppm)
Perc
ent
2.2
99.4
1.1
93.5
0.53
66.9
0.27
28.9
0.13
5.1
0.09 1.5
N 1334
Lognormal
All Legal WalleyeInland Lake and Impoundment
1 meal/month
2 meals/month
4 meals/month
Figure C-5. Cumulative distribution function of mercury concentrations in all legal sized walleye with estimated percentiles for key fish consumption screening values.
Walleye / Lake & Impoundment
y = 0.0443x - 0.3336(R2 = 0.173)
0
0.5
1
1.5
2
2.5
8 10 12 14 16 18 20 22 24 26 28 30 32
Length (Inches)
Mer
cury
(ppm
)
Limited
6/year
1/Month
2/Month
4/Month
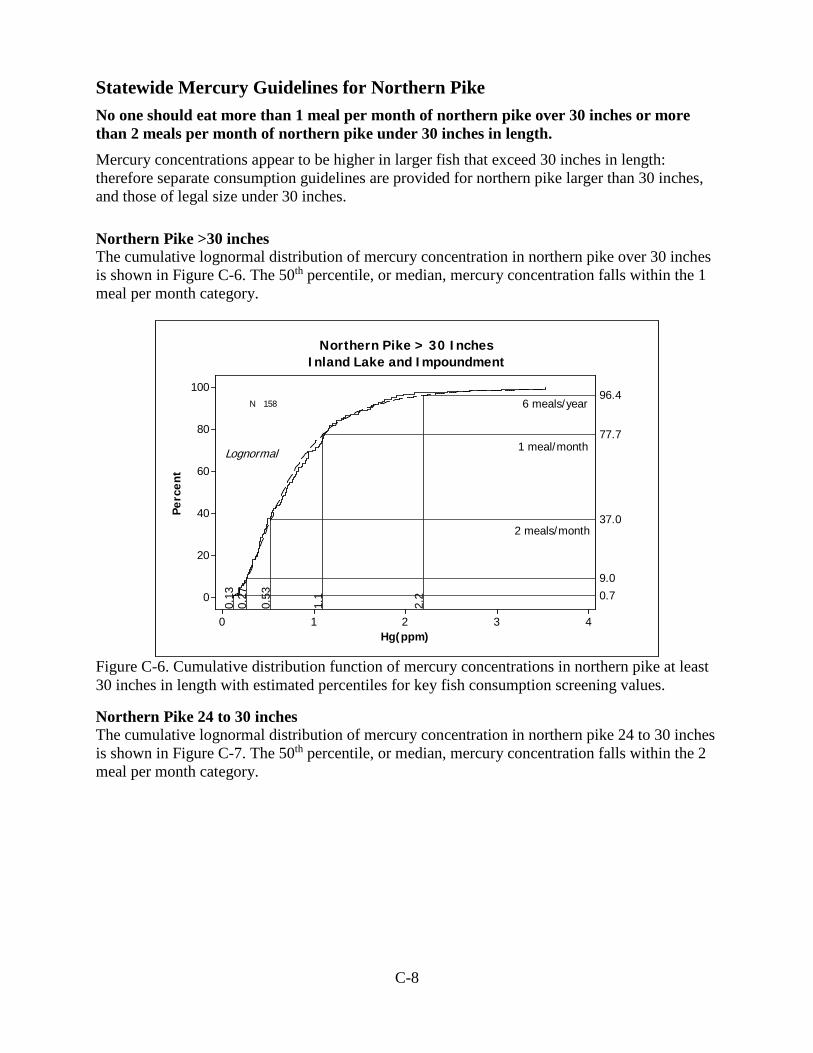
C-8
Statewide Mercury Guidelines for Northern Pike No one should eat more than 1 meal per month of northern pike over 30 inches or more than 2 meals per month of northern pike under 30 inches in length. Mercury concentrations appear to be higher in larger fish that exceed 30 inches in length: therefore separate consumption guidelines are provided for northern pike larger than 30 inches, and those of legal size under 30 inches. Northern Pike >30 inches The cumulative lognormal distribution of mercury concentration in northern pike over 30 inches is shown in Figure C-6. The 50th percentile, or median, mercury concentration falls within the 1 meal per month category.
43210
100
80
60
40
20
0
Hg(ppm)
Perc
ent
2.2
96.4
1.1
77.7
0.53
37.0
0.27
9.0
0.13 0.7
N 158
Lognormal
Northern Pike > 30 InchesInland Lake and Impoundment
1 meal/month
2 meals/month
6 meals/year
Figure C-6. Cumulative distribution function of mercury concentrations in northern pike at least 30 inches in length with estimated percentiles for key fish consumption screening values.
Northern Pike 24 to 30 inches The cumulative lognormal distribution of mercury concentration in northern pike 24 to 30 inches is shown in Figure C-7. The 50th percentile, or median, mercury concentration falls within the 2 meal per month category.

C-9
2.52.01.51.00.50.0
100
80
60
40
20
0
Hg(ppm)
Perc
ent
2.2
99.5
1.1
93.0
0.53
61.2
0.27
20.6
0.13 2.2
Loc -0.8084Scale 0.6117N 690
Lognormal
Northern Pike 24-30 InchesInland Lake and Impoundment
1 meal/month
2 meals/month
Figure C-7. Cumulative distribution function of mercury concentrations in northern pike between 24 and 30 inches in length with estimated percentiles for key fish consumption screening values.
Additional Analyses for Northern Pike Mercury concentrations in northern pike collected from rivers are generally lower than the concentrations in northern pike collected from inland lakes and impoundments (Table C-3). Table C-3. Estimated mercury concentration (ppm) in filets of northern pike from Michigan rivers and inland lakes based on samples collected from 1984 through 2010. Estimates are based on results of linear regression.
Lakes/Impoundments Rivers
Length (inches)
Estimated Concentration Meals/Month
Estimated Concentration Meals/Month
24 0.51 2 0.25 4 26 0.57 1 0.27 4 28 0.63 1 0.28 2 30 0.69 1 0.3 2 32 0.75 1 0.32 2 34 0.81 1 0.33 2 36 0.87 1 0.35 2 38 0.92 1 0.37 2 40 0.98 1 0.39 2 42 1.04 1 0.41 2
Linear regression of northern pike length versus mercury concentration was highly significant (p-value approaching zero), although the R2 was only 0.13 (Figure C-8). The 95% UCL on the mean mercury concentration is 0.53 ppm. The northern pike mercury data are moderately variable (cv = 0.69).
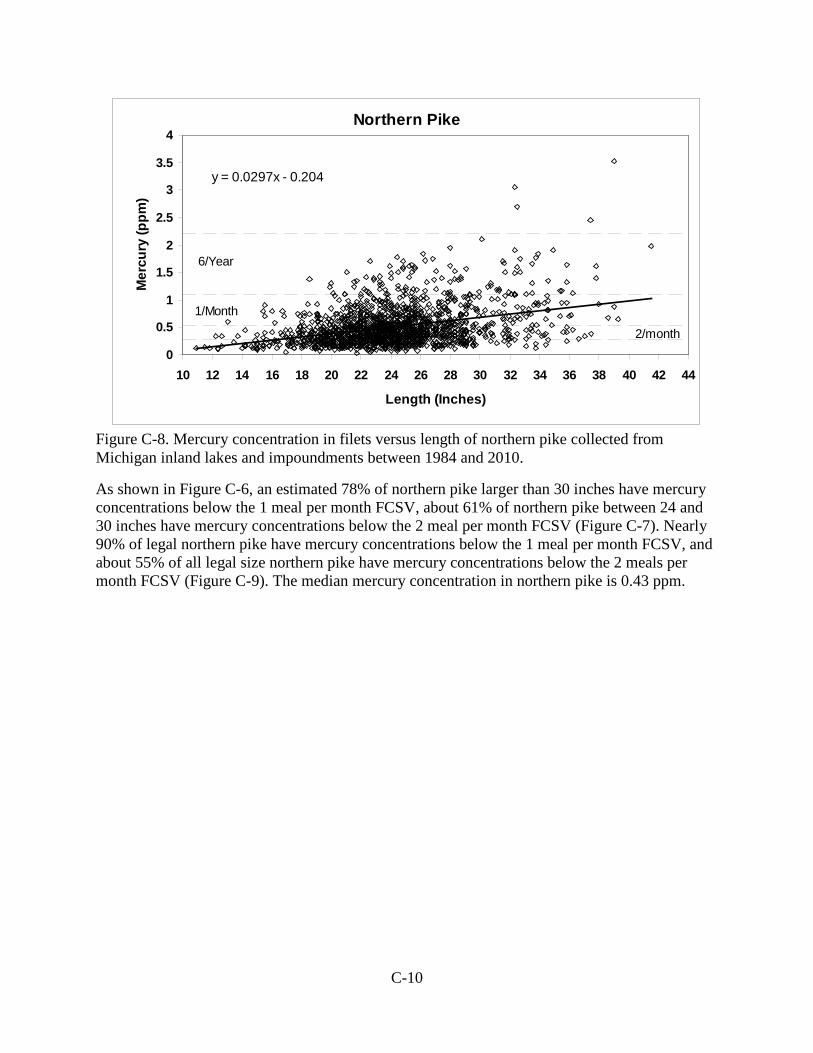
C-10
Figure C-8. Mercury concentration in filets versus length of northern pike collected from Michigan inland lakes and impoundments between 1984 and 2010.
As shown in Figure C-6, an estimated 78% of northern pike larger than 30 inches have mercury concentrations below the 1 meal per month FCSV, about 61% of northern pike between 24 and 30 inches have mercury concentrations below the 2 meal per month FCSV (Figure C-7). Nearly 90% of legal northern pike have mercury concentrations below the 1 meal per month FCSV, and about 55% of all legal size northern pike have mercury concentrations below the 2 meals per month FCSV (Figure C-9). The median mercury concentration in northern pike is 0.43 ppm.
Northern Pike
y = 0.0297x - 0.204
0
0.5
1
1.5
2
2.5
3
3.5
4
10 12 14 16 18 20 22 24 26 28 30 32 34 36 38 40 42 44
Length (Inches)
Mer
cury
(ppm
)
6/Year
1/Month
2/month
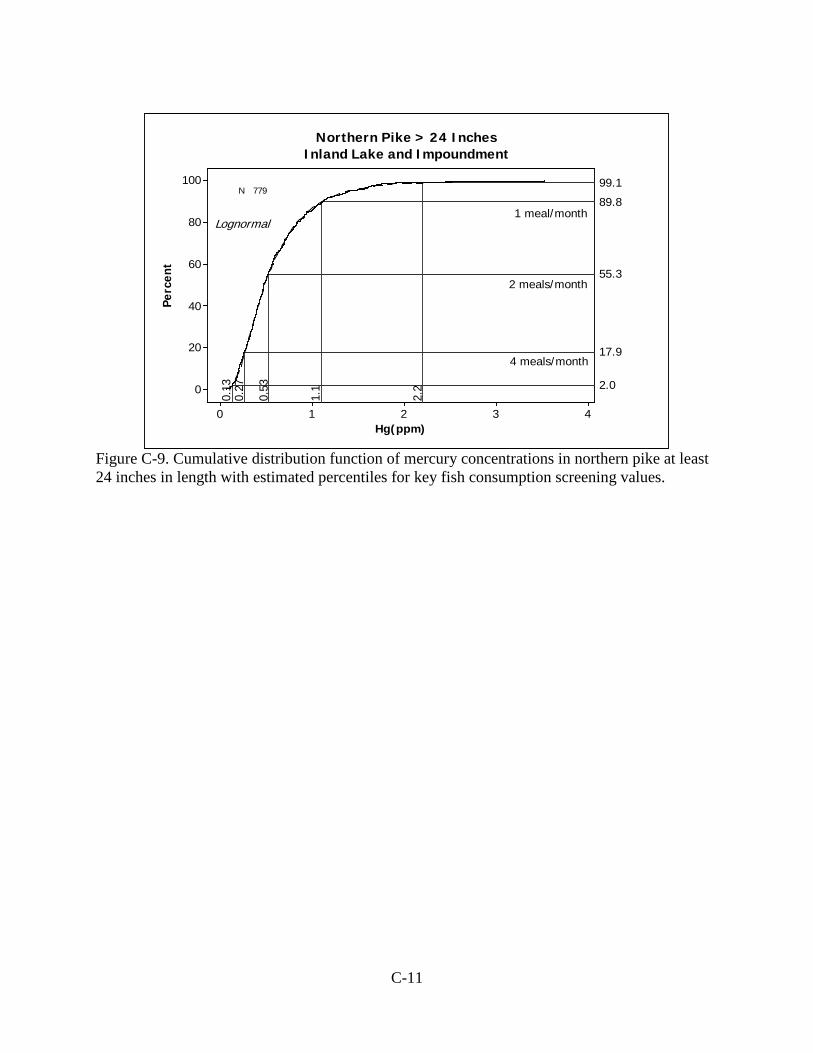
C-11
43210
100
80
60
40
20
0
Hg(ppm)
Perc
ent
2.2
99.1
1.1
89.8
0.53
55.3
0.27
17.9
0.13 2.0
N 779
Lognormal
Northern Pike > 24 InchesInland Lake and Impoundment
1 meal/month
2 meals/month
4 meals/month
Figure C-9. Cumulative distribution function of mercury concentrations in northern pike at least 24 inches in length with estimated percentiles for key fish consumption screening values.
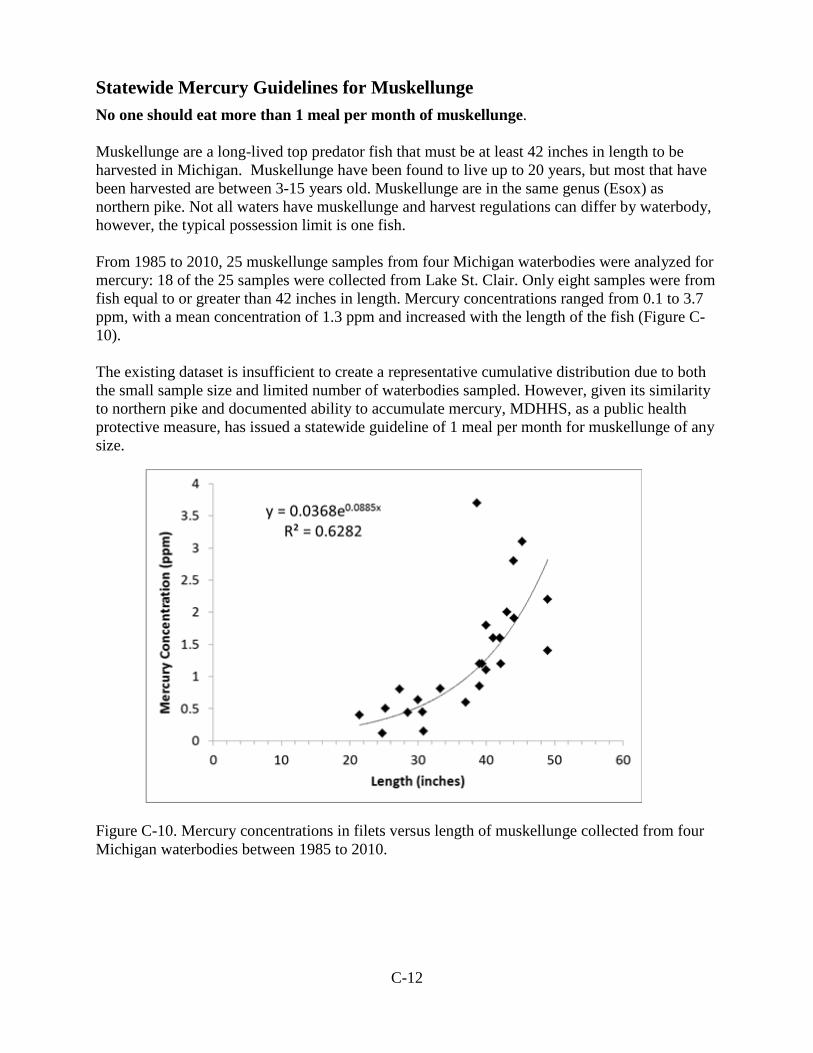
C-12
Statewide Mercury Guidelines for Muskellunge No one should eat more than 1 meal per month of muskellunge. Muskellunge are a long-lived top predator fish that must be at least 42 inches in length to be harvested in Michigan. Muskellunge have been found to live up to 20 years, but most that have been harvested are between 3-15 years old. Muskellunge are in the same genus (Esox) as northern pike. Not all waters have muskellunge and harvest regulations can differ by waterbody, however, the typical possession limit is one fish. From 1985 to 2010, 25 muskellunge samples from four Michigan waterbodies were analyzed for mercury: 18 of the 25 samples were collected from Lake St. Clair. Only eight samples were from fish equal to or greater than 42 inches in length. Mercury concentrations ranged from 0.1 to 3.7 ppm, with a mean concentration of 1.3 ppm and increased with the length of the fish (Figure C-10). The existing dataset is insufficient to create a representative cumulative distribution due to both the small sample size and limited number of waterbodies sampled. However, given its similarity to northern pike and documented ability to accumulate mercury, MDHHS, as a public health protective measure, has issued a statewide guideline of 1 meal per month for muskellunge of any size.
Figure C-10. Mercury concentrations in filets versus length of muskellunge collected from four Michigan waterbodies between 1985 to 2010.

C-13
Statewide Mercury Guidelines for Largemouth & Smallmouth Bass No one should eat more than 2 meals per month of legal size largemouth or smallmouth bass under 18 inches or more than 1 meal per month of largemouth or smallmouth bass over 18 inches. Largemouth bass and smallmouth bass were combined for this analysis because the two species are very similar in habit and physiology, and tend to have very similar contaminant concentrations. Also, people may mistake one species for the other. The cumulative lognormal distribution of the mercury concentration in all largemouth and smallmouth bass samples is shown in Figure C-11. The 50th percentile (median) of the entire dataset falls within the 2 meals per month category; however the dataset includes few fish over 18 inches in length. Larger fish generally exhibit greater mercury concentrations, therefore MDHHS chose 1 meal per month as the Guideline for largemouth and smallmouth bass over 18 inches.
2.52.01.51.00.50.0
100
80
60
40
20
0
Hg(ppm)
Perc
ent
99.9
2.2
97.5
1.1
74.2
0.53
29.0
0.27 3.1
0.13
N 1262
Lognormal
Largemouth & Smallmouth Bass > 14 InchesInland Lake and Impoundment
1 meal/month
2 meals/month
4 meals/month
Figure C-11. Cumulative distribution function of mercury concentrations in largemouth and smallmouth bass at least 14 inches in length with estimated percentiles for key fish consumption screening values.
Additional Analyses for Largemouth and Smallmouth Bass Mercury concentrations in bass collected from rivers are generally lower than the concentrations in bass collected from inland lakes and impoundments (Table C-4).

C-14
Table C-4. Estimated mercury concentration (ppm) in filets of largemouth and smallmouth bass from Michigan rivers and inland lakes based on samples collected from 1984 through 2010. Estimates are based on results of linear regression.
Lakes/Impoundments Rivers Length (inches)
Estimated Concentration Meals/Month Estimated
Concentration Meals/Month
14 0.37 2 0.26 4 16 0.46 2 0.36 2 18 0.55 1 0.47 2 20 0.64 1 0.57 1 22 0.72 1 0.67 1 24 0.81 1 0.77 1 26 0.90 1 0.87 1
Linear regression of bass length versus mercury concentration was highly significant (p-value approaching zero), although the R2 was only 0.19 (Figure C-12). The 95% UCL on the mean mercury concentration in largemouth and smallmouth bass is 0.39 ppm. The bass mercury data are moderately variable (cv = 0.55). As shown in Figure C-11, an estimated 97% of legal size largemouth and smallmouth bass (≥ 14 inches) have mercury concentrations under the 1 meal per month FCSV; approximately 74% of legal size bass have mercury concentrations less than the 2 meals per month FCSV. The median mercury concentration measured in legal size bass was 0.38 ppm, however nearly 75% of the legal size bass sampled from inland waters were 16 inches or less; based on the linear regression for lakes/impoundments bass larger than 16 inches are likely to have mercury concentrations in the 1 meal per month range.
Figure C-12. Mercury concentration in filets versus length of largemouth bass and smallmouth bass collected from Michigan inland lakes and impoundments between 1984 and 2010.
Largemouth & Smallmouth BassLake & Impoundment
y = 0.0442x - 0.2489R2 = 0.1875
0
0.5
1
1.5
2
2.5
6 8 10 12 14 16 18 20 22
Length (Inches)
Mer
cury
(ppm
)
Limited
6/Year
1/Month
2/Month

C-15
Statewide Mercury Guideline for Yellow Perch No one should eat more than 4 meals per month of yellow perch from inland waters. The cumulative lognormal distribution of the mercury concentration in yellow perch over 10 inches in length is shown in Figure C-13. The 50th percentile (median) falls in the 4 meals per month category.
1.21.00.80.60.40.20.0
100
80
60
40
20
0
Hg(ppm)
Perc
ent
1.1
99.4
0.53
91.3
0.27
61.6
0.13
19.6
N 101
Lognormal
Yellow Perch > 10-inchesInland Lake and Impoundment
4 meals/month
2 meals/month
8 meals/month
Figure C-13. Cumulative distribution function of mercury concentrations in yellow perch 10 inches or larger with estimated percentiles for key fish consumption screening values.

C-16
Additional Analyses for Yellow Perch
Figure C-14. Mercury concentration in filets versus length of yellow perch collected from Michigan inland lakes and impoundments between 1984 and 2010.
Linear regression of yellow perch length versus mercury concentration was significant (p-value =0.006), but the R2 was only 0.03, and the slope indicates that concentrations increase only modestly with increase in length (Figure C-14). The 95% UCL on the mean mercury concentration in yellow perch is 0.27 ppm. The yellow perch mercury data are moderately variable (cv = 0.71). As shown in Figure C-13, an estimated 62% of yellow perch larger than 10 inches have mercury concentrations less than the 4 meals per month screening value of 0.27 ppm. Approximately 69% of all yellow perch have mercury concentrations lower than the 4 meals per month screening value (Figure C-15), and the median mercury concentration is 0.19 ppm.
Yellow Perch / Lake & Impoundment
y = 0.0192x + 0.0559R2 = 0.0336
0
0.2
0.4
0.6
0.8
1
1.2
6 8 10 12 14 16
Length (Inches)
Mer
cury
(ppm
)
1/Month
2/Month
4/Month
8/Month
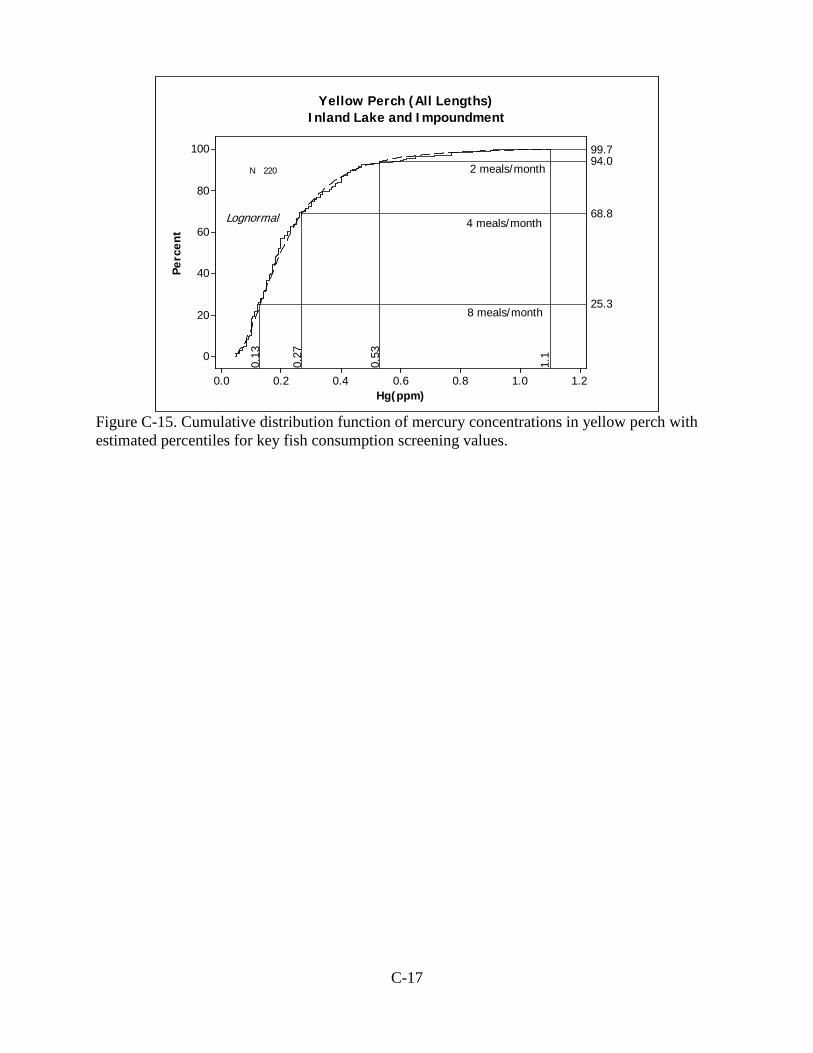
C-17
1.21.00.80.60.40.20.0
100
80
60
40
20
0
Hg(ppm)
Perc
ent
1.1
99.7
0.53
94.0
0.27
68.8
0.13
25.3
N 220
Lognormal 4 meals/month
Yellow Perch (All Lengths)Inland Lake and Impoundment
2 meals/month
8 meals/month
Figure C-15. Cumulative distribution function of mercury concentrations in yellow perch with estimated percentiles for key fish consumption screening values.
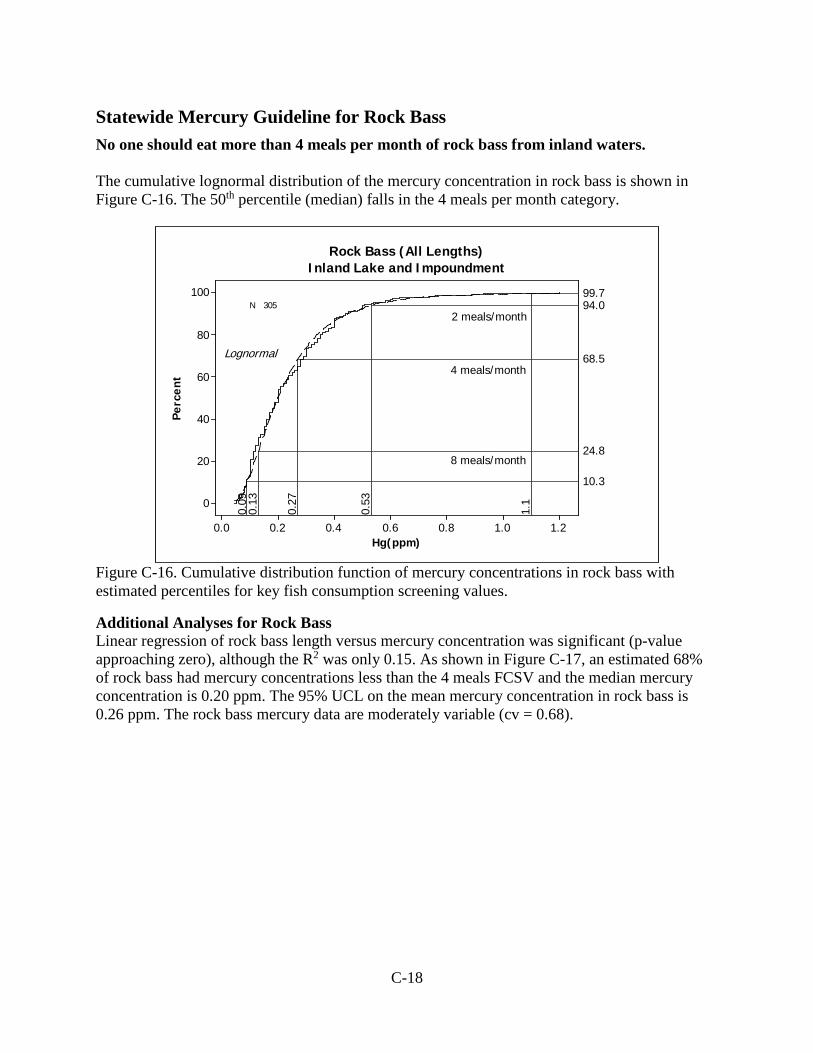
C-18
Statewide Mercury Guideline for Rock Bass No one should eat more than 4 meals per month of rock bass from inland waters. The cumulative lognormal distribution of the mercury concentration in rock bass is shown in Figure C-16. The 50th percentile (median) falls in the 4 meals per month category.
1.21.00.80.60.40.20.0
100
80
60
40
20
0
Hg(ppm)
Perc
ent
1.1
99.7
0.53
94.00.
27
68.5
0.13
24.8
0.09
10.3
N 305
Lognormal
Rock Bass (All Lengths)Inland Lake and Impoundment
2 meals/month
4 meals/month
8 meals/month
Figure C-16. Cumulative distribution function of mercury concentrations in rock bass with estimated percentiles for key fish consumption screening values.
Additional Analyses for Rock Bass Linear regression of rock bass length versus mercury concentration was significant (p-value approaching zero), although the R2 was only 0.15. As shown in Figure C-17, an estimated 68% of rock bass had mercury concentrations less than the 4 meals FCSV and the median mercury concentration is 0.20 ppm. The 95% UCL on the mean mercury concentration in rock bass is 0.26 ppm. The rock bass mercury data are moderately variable (cv = 0.68).

C-19
Figure C-17. Mercury concentration in filets versus length of rock bass collected from Michigan inland lakes and impoundments between 1984 and 2010.
Rock Bass / Lake & Impoundment
y = 0.0479e0.1699x
R2 = 0.1545
0
0.2
0.4
0.6
0.8
1
1.2
1.4
4 5 6 7 8 9 10 11 12
Length (Inches)
Mer
cury
(ppm
)
4/month
2/month
1/month
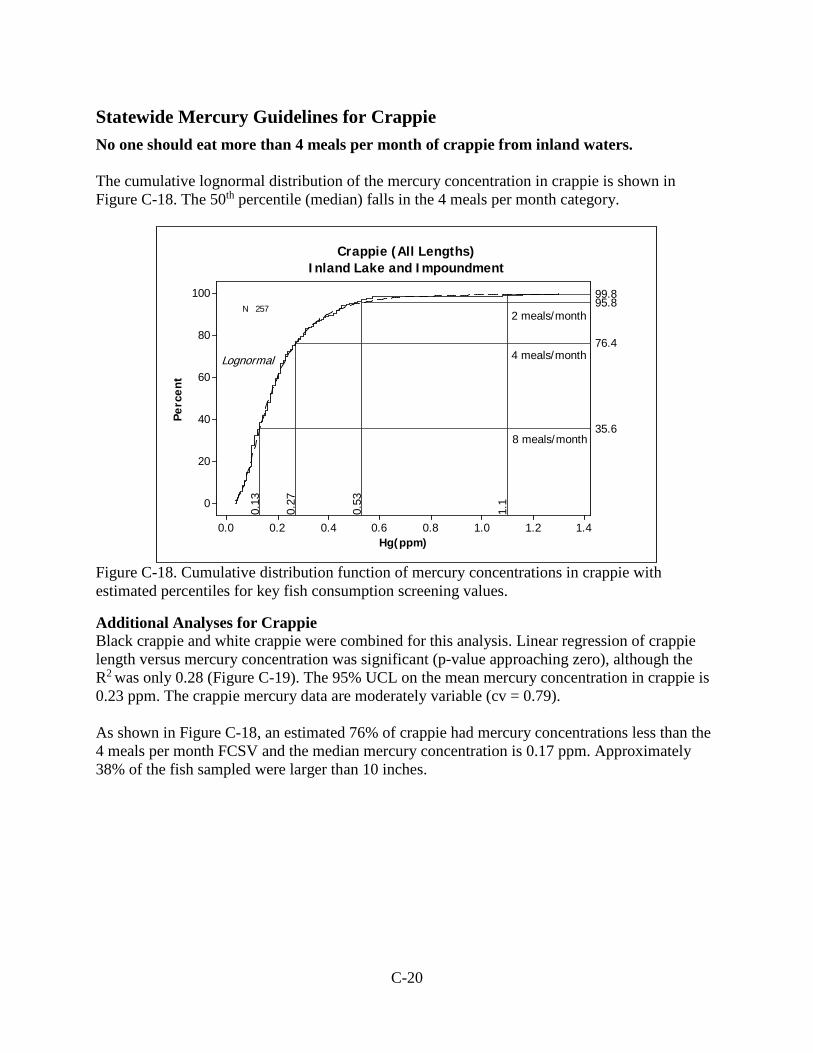
C-20
Statewide Mercury Guidelines for Crappie No one should eat more than 4 meals per month of crappie from inland waters. The cumulative lognormal distribution of the mercury concentration in crappie is shown in Figure C-18. The 50th percentile (median) falls in the 4 meals per month category.
1.41.21.00.80.60.40.20.0
100
80
60
40
20
0
Hg(ppm)
Perc
ent
1.1
99.8
0.53
95.80.
27
76.4
0.13
35.6
N 257
Lognormal
Crappie (All Lengths)Inland Lake and Impoundment
2 meals/month
4 meals/month
8 meals/month
Figure C-18. Cumulative distribution function of mercury concentrations in crappie with estimated percentiles for key fish consumption screening values.
Additional Analyses for Crappie Black crappie and white crappie were combined for this analysis. Linear regression of crappie length versus mercury concentration was significant (p-value approaching zero), although the R2 was only 0.28 (Figure C-19). The 95% UCL on the mean mercury concentration in crappie is 0.23 ppm. The crappie mercury data are moderately variable (cv = 0.79). As shown in Figure C-18, an estimated 76% of crappie had mercury concentrations less than the 4 meals per month FCSV and the median mercury concentration is 0.17 ppm. Approximately 38% of the fish sampled were larger than 10 inches.
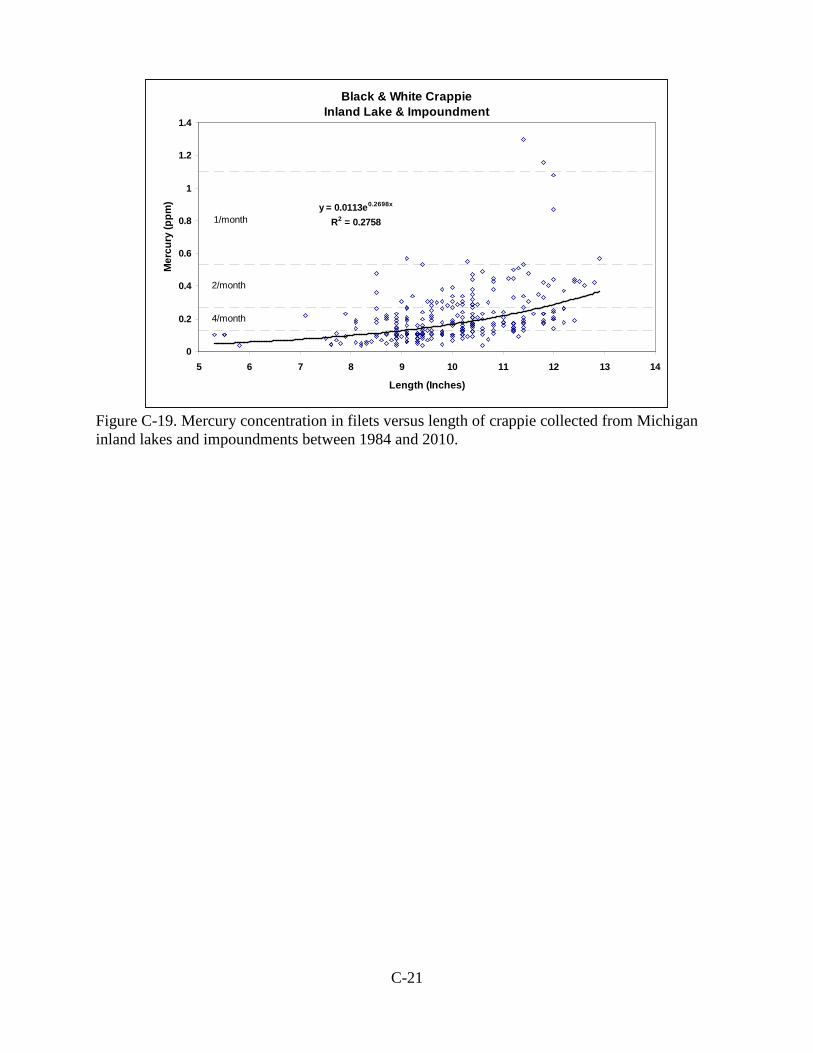
C-21
Figure C-19. Mercury concentration in filets versus length of crappie collected from Michigan inland lakes and impoundments between 1984 and 2010.
Black & White CrappieInland Lake & Impoundment
y = 0.0113e0.2698x
R2 = 0.2758
0
0.2
0.4
0.6
0.8
1
1.2
1.4
5 6 7 8 9 10 11 12 13 14
Length (Inches)
Mer
cury
(ppm
)
4/month
2/month
1/month
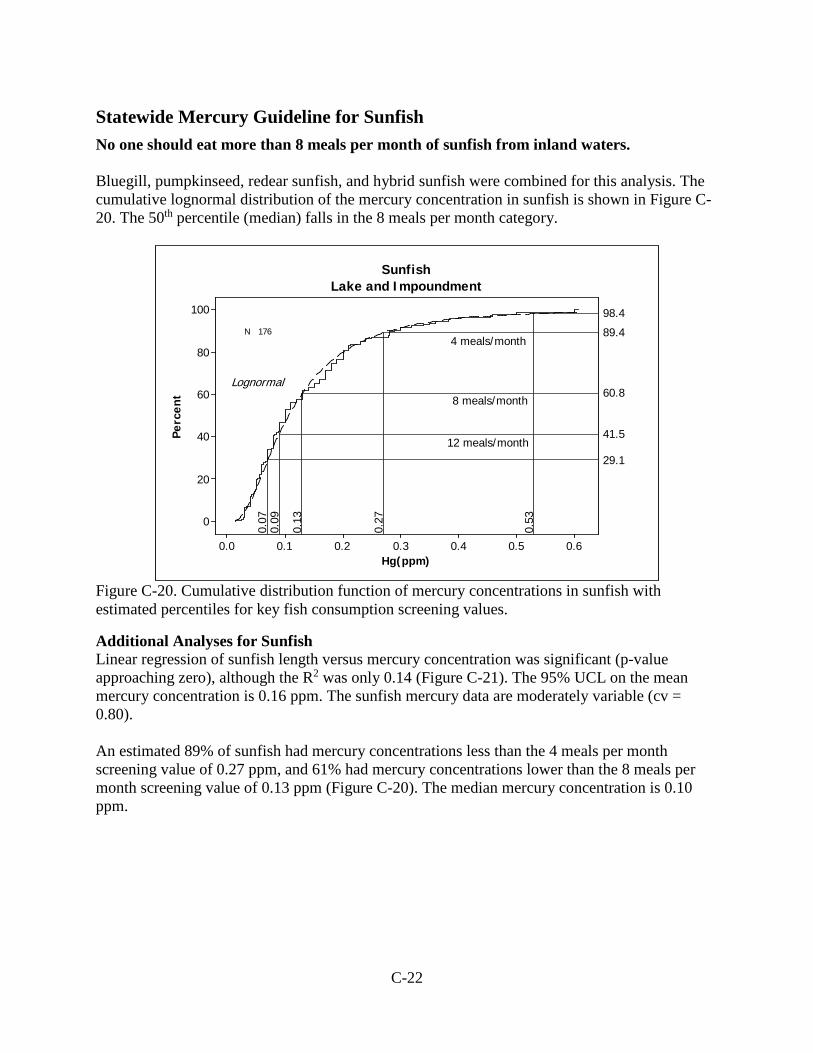
C-22
Statewide Mercury Guideline for Sunfish No one should eat more than 8 meals per month of sunfish from inland waters. Bluegill, pumpkinseed, redear sunfish, and hybrid sunfish were combined for this analysis. The cumulative lognormal distribution of the mercury concentration in sunfish is shown in Figure C-20. The 50th percentile (median) falls in the 8 meals per month category.
0.60.50.40.30.20.10.0
100
80
60
40
20
0
Hg(ppm)
Perc
ent
0.53
98.4
0.27
89.4
0.13
60.8
0.09
41.5
0.07
29.1
N 176
Lognormal
SunfishLake and Impoundment
4 meals/month
8 meals/month
12 meals/month
Figure C-20. Cumulative distribution function of mercury concentrations in sunfish with estimated percentiles for key fish consumption screening values.
Additional Analyses for Sunfish Linear regression of sunfish length versus mercury concentration was significant (p-value approaching zero), although the R2 was only 0.14 (Figure C-21). The 95% UCL on the mean mercury concentration is 0.16 ppm. The sunfish mercury data are moderately variable (cv = 0.80). An estimated 89% of sunfish had mercury concentrations less than the 4 meals per month screening value of 0.27 ppm, and 61% had mercury concentrations lower than the 8 meals per month screening value of 0.13 ppm (Figure C-20). The median mercury concentration is 0.10 ppm.

C-23
Figure C-21. Mercury concentration in filets versus length of sunfish collected from Michigan inland lakes and impoundments between 1984 and 2010.
Sunfish / Lake & Impoundment
y = 0.0222e0.2121x
R2 = 0.1451
0
0.1
0.2
0.3
0.4
0.5
0.6
0.7
4 5 6 7 8 9 10 11
Length (Inches)
Mer
cury
(ppm
)
4/Month
8/Month
2/Month
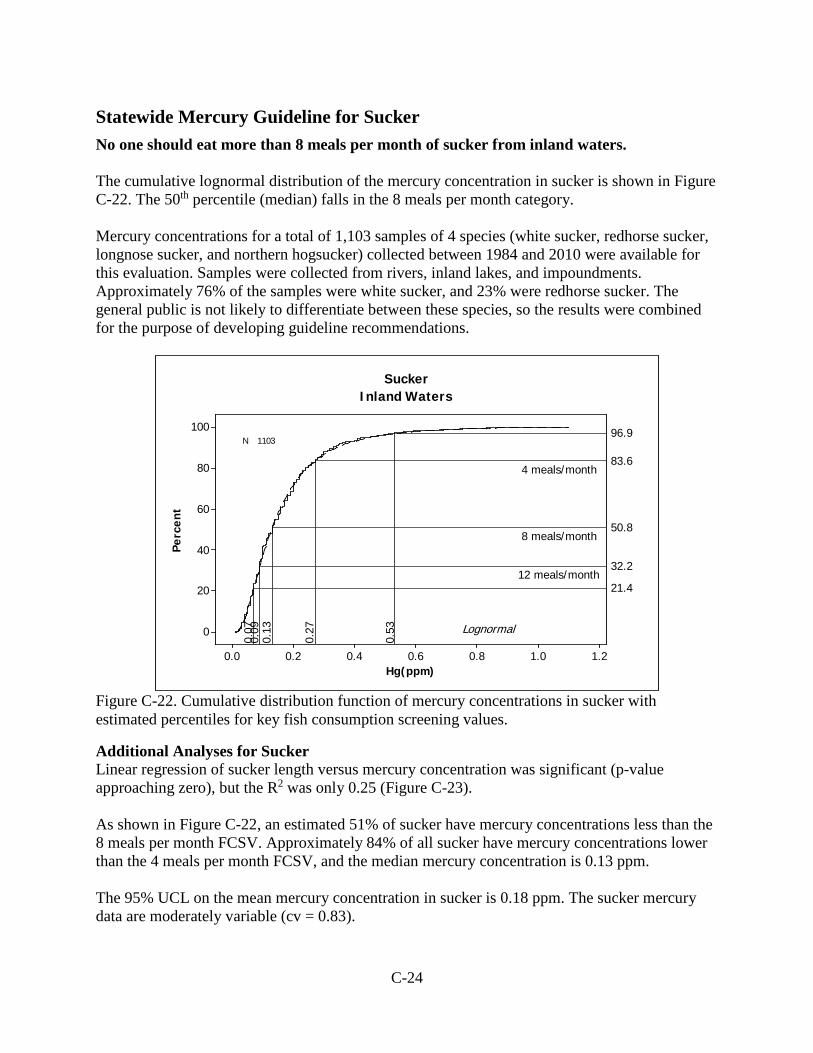
C-24
Statewide Mercury Guideline for Sucker No one should eat more than 8 meals per month of sucker from inland waters. The cumulative lognormal distribution of the mercury concentration in sucker is shown in Figure C-22. The 50th percentile (median) falls in the 8 meals per month category. Mercury concentrations for a total of 1,103 samples of 4 species (white sucker, redhorse sucker, longnose sucker, and northern hogsucker) collected between 1984 and 2010 were available for this evaluation. Samples were collected from rivers, inland lakes, and impoundments. Approximately 76% of the samples were white sucker, and 23% were redhorse sucker. The general public is not likely to differentiate between these species, so the results were combined for the purpose of developing guideline recommendations.
1.21.00.80.60.40.20.0
100
80
60
40
20
0
Hg(ppm)
Perc
ent
0.53
96.9
0.27
83.6
0.13
50.8
0.09
32.2
0.07
21.4
N 1103
Lognormal
SuckerInland Waters
8 meals/month
4 meals/month
12 meals/month
Figure C-22. Cumulative distribution function of mercury concentrations in sucker with estimated percentiles for key fish consumption screening values.
Additional Analyses for Sucker Linear regression of sucker length versus mercury concentration was significant (p-value approaching zero), but the R2 was only 0.25 (Figure C-23). As shown in Figure C-22, an estimated 51% of sucker have mercury concentrations less than the 8 meals per month FCSV. Approximately 84% of all sucker have mercury concentrations lower than the 4 meals per month FCSV, and the median mercury concentration is 0.13 ppm. The 95% UCL on the mean mercury concentration in sucker is 0.18 ppm. The sucker mercury data are moderately variable (cv = 0.83).
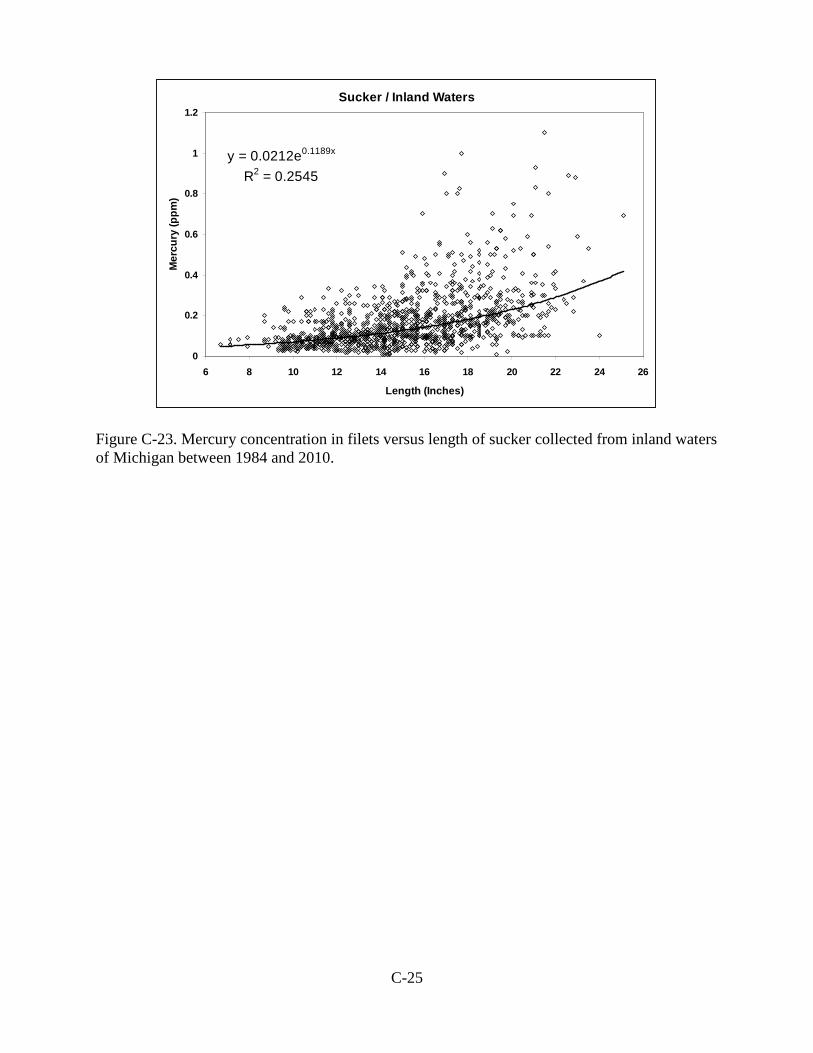
C-25
Figure C-23. Mercury concentration in filets versus length of sucker collected from inland waters of Michigan between 1984 and 2010.
Sucker / Inland Waters
y = 0.0212e0.1189x
R2 = 0.2545
0
0.2
0.4
0.6
0.8
1
1.2
6 8 10 12 14 16 18 20 22 24 26
Length (Inches)
Mer
cury
(ppm
)
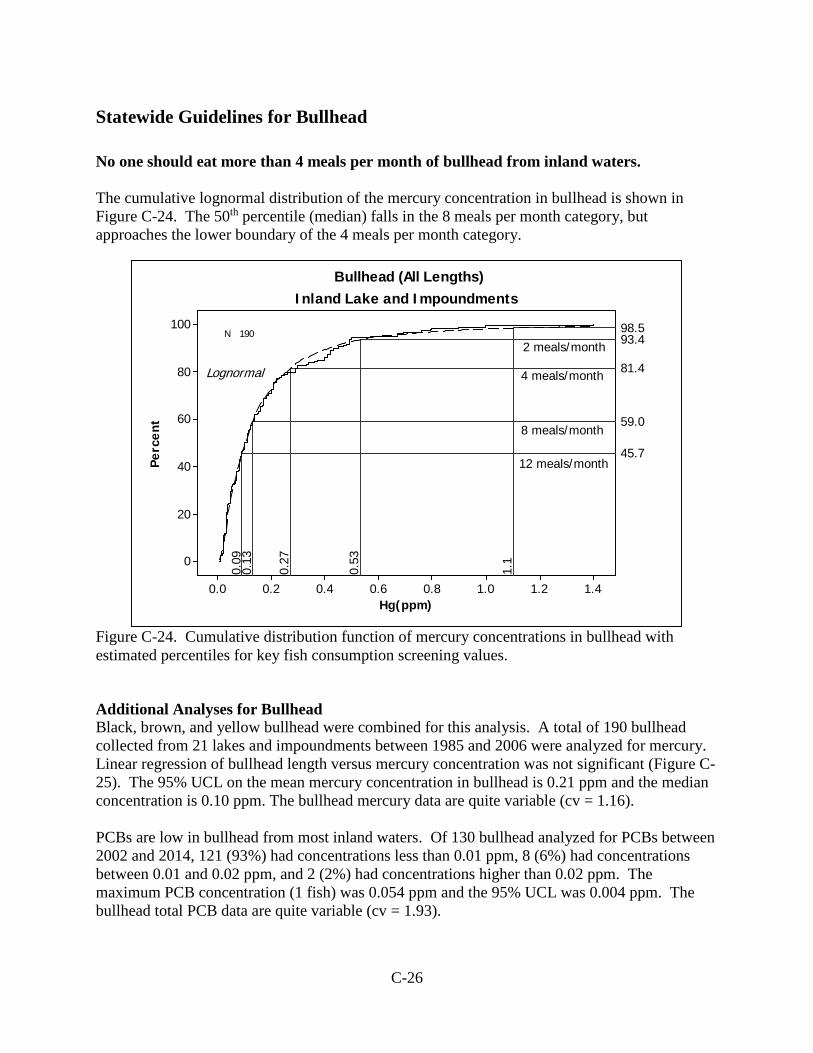
C-26
Statewide Guidelines for Bullhead No one should eat more than 4 meals per month of bullhead from inland waters. The cumulative lognormal distribution of the mercury concentration in bullhead is shown in Figure C-24. The 50th percentile (median) falls in the 8 meals per month category, but approaches the lower boundary of the 4 meals per month category.
1.41.21.00.80.60.40.20.0
100
80
60
40
20
0
Hg(ppm)
Perc
ent
1.1
98.5
0.53
93.4
0.27
81.4
0.13
59.0
0.09
45.7
N 190
Lognormal
Bullhead (All Lengths)Inland Lake and Impoundments
12 meals/month
8 meals/month
4 meals/month
2 meals/month
Figure C-24. Cumulative distribution function of mercury concentrations in bullhead with estimated percentiles for key fish consumption screening values.
Additional Analyses for Bullhead Black, brown, and yellow bullhead were combined for this analysis. A total of 190 bullhead collected from 21 lakes and impoundments between 1985 and 2006 were analyzed for mercury. Linear regression of bullhead length versus mercury concentration was not significant (Figure C-25). The 95% UCL on the mean mercury concentration in bullhead is 0.21 ppm and the median concentration is 0.10 ppm. The bullhead mercury data are quite variable (cv = 1.16). PCBs are low in bullhead from most inland waters. Of 130 bullhead analyzed for PCBs between 2002 and 2014, 121 (93%) had concentrations less than 0.01 ppm, 8 (6%) had concentrations between 0.01 and 0.02 ppm, and 2 (2%) had concentrations higher than 0.02 ppm. The maximum PCB concentration (1 fish) was 0.054 ppm and the 95% UCL was 0.004 ppm. The bullhead total PCB data are quite variable (cv = 1.93).

C-27
Figure C-25. Mercury concentrations in filets versus length of bullhead collected from Michigan inland lakes and impoundments between 1985 and 2006.
0
0.2
0.4
0.6
0.8
1
1.2
7 8 9 10 11 12 13 14 15 16
Mer
cury
(ppm
)
Length (Inches)
BullheadInland Lake & Impoundment
4/Month
2/Month
1/Month

D-1
Supporting Documentation for Statewide Eat Safe Fish Guidelines for Carp and Catfish from Inland Waters Contaminated with Mercury and PCBs.
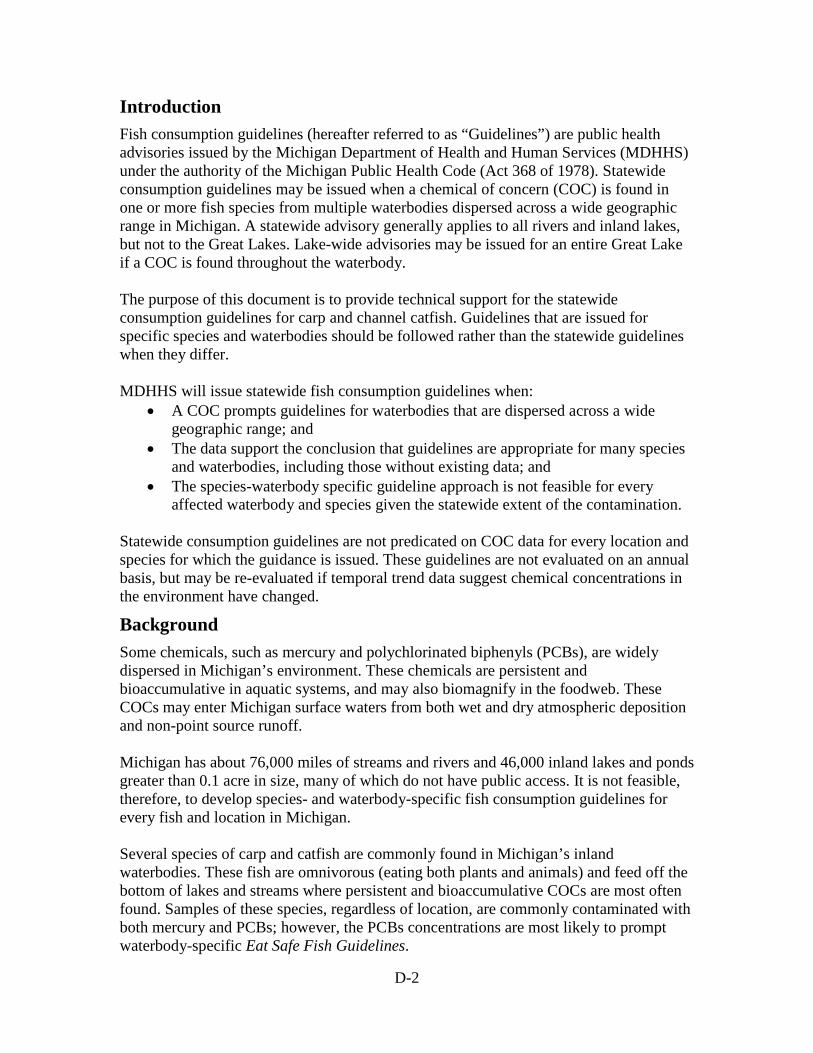
D-2
Introduction Fish consumption guidelines (hereafter referred to as “Guidelines”) are public health advisories issued by the Michigan Department of Health and Human Services (MDHHS) under the authority of the Michigan Public Health Code (Act 368 of 1978). Statewide consumption guidelines may be issued when a chemical of concern (COC) is found in one or more fish species from multiple waterbodies dispersed across a wide geographic range in Michigan. A statewide advisory generally applies to all rivers and inland lakes, but not to the Great Lakes. Lake-wide advisories may be issued for an entire Great Lake if a COC is found throughout the waterbody. The purpose of this document is to provide technical support for the statewide consumption guidelines for carp and channel catfish. Guidelines that are issued for specific species and waterbodies should be followed rather than the statewide guidelines when they differ. MDHHS will issue statewide fish consumption guidelines when:
• A COC prompts guidelines for waterbodies that are dispersed across a wide geographic range; and
• The data support the conclusion that guidelines are appropriate for many species and waterbodies, including those without existing data; and
• The species-waterbody specific guideline approach is not feasible for every affected waterbody and species given the statewide extent of the contamination.
Statewide consumption guidelines are not predicated on COC data for every location and species for which the guidance is issued. These guidelines are not evaluated on an annual basis, but may be re-evaluated if temporal trend data suggest chemical concentrations in the environment have changed.
Background Some chemicals, such as mercury and polychlorinated biphenyls (PCBs), are widely dispersed in Michigan’s environment. These chemicals are persistent and bioaccumulative in aquatic systems, and may also biomagnify in the foodweb. These COCs may enter Michigan surface waters from both wet and dry atmospheric deposition and non-point source runoff. Michigan has about 76,000 miles of streams and rivers and 46,000 inland lakes and ponds greater than 0.1 acre in size, many of which do not have public access. It is not feasible, therefore, to develop species- and waterbody-specific fish consumption guidelines for every fish and location in Michigan. Several species of carp and catfish are commonly found in Michigan’s inland waterbodies. These fish are omnivorous (eating both plants and animals) and feed off the bottom of lakes and streams where persistent and bioaccumulative COCs are most often found. Samples of these species, regardless of location, are commonly contaminated with both mercury and PCBs; however, the PCBs concentrations are most likely to prompt waterbody-specific Eat Safe Fish Guidelines.

D-3
Discussion Mercury and PCBs are atmospherically deposited COCs found in nearly all carp and catfish samples collected from Michigan waterbodies. The available data indicate that, while mercury concentrations are either static or increasing, PCB fish concentrations are declining at a minimum of 3% per year in waters with no known point source of PCB contamination. The MDEQ data analysis includes all mercury results between 1984 and 2010 from inland lakes, impoundments, and rivers that are not known to have received point-source mercury contamination. Deer Lake (Marquette County) fish data were not included in the analysis because of legacy point-source mercury pollution. For PCBs, the MDEQ used only data collected after 2000 and excluded data from waters with a known point source of PCB contamination, including the Kalamazoo River (including Portage Creek), Rouge River, Huron River, Muskegon Lake, and Thompson Lake (Livingston County). The MDEQ reviewed each dataset for the number of samples and the representativeness of the fish length range. MDEQ then calculated summary statistics including the 95% upper confidence limit (UCL) on the mean, the median (i.e., 50th percentile), and the coefficient of variation (cv) individually for carp and channel catfish. Additionally for each species, MDEQ constructed a lognormal cumulative distribution of mercury and PCB concentrations versus length of the fish and conducted a linear regression analysis. Information about the health effects of exposure to mercury in fish can be found in the “Technical Support Document for a Methylmercury Reference Dose as a Basis for Fish Consumption Screening Values (FCSVs)” available at www.michigan.gov/eatsafefish under “Reports and Science.” Table D-1 provides the FCSVs for mercury.
Table D-1. Mercury Fish Consumption Screening Values by meal category.
Meal Category FCSV Ranges meals per montha µg/g (ppm)b
16 ≤ 0.07 12 >0.07 to 0.09 8 >0.09 to 0.13 4 >0.13 to 0.27 2 >0.27 to 0.53 1 >0.53 to 1.1
6 meals per year >1.1 to 2.2 Do Not Eat >2.2
a: Units are in months unless otherwise stated. b micrograms of chemical per gram of fish tissue (µg/g) that is the same as parts per million (ppm).
Information about the health effects of exposure to PCBs in fish can be found in the “Technical Support Document for a Polychlorinated Biphenyl Reference Dose as a Basis

D-4
for Fish Consumption Screening Values (FCSVs)” available at www.michigan.gov/eatsafefish under “Reports and Science.” Table D-2 provides the FCSVs for PCBs.
Table D-2. Polychlorinated Biphenyls Fish Consumption Screening Values by meal category.
Meal Category FCSV Ranges meals per montha µg/g (ppm)b
16 ≤ 0.01 12 >0.01 to 0.02 8 >0.02 to 0.03 4 >0.03 to 0.05 2 >0.05 to 0.11 1 >0.11 to 0.21
6 meals per year >0.21 to 0.43 Limited >0.43 to 2.7
Do Not Eat >2.7 a: Units are in months unless otherwise stated. b micrograms of chemical per gram of wet weight fish tissue (µg/g) that is the same as parts per million (ppm).

D-5
Statewide Consumption Guidelines for Carp No one should eat more than 2 meals per month of carp from any river or inland lake: where available, waterbody-specific guidance should be followed if it differs from the statewide guidelines. The statewide consumption guideline for carp is based on concentrations of PCBs in these fish. Consumption could be doubled if the consumer follows the MDHHS cleaning and cooking guidance provided in the Eat Safe Fish Guide. Data Analysis PCBs The cumulative lognormal distribution of the PCB concentration in carp is shown in Figure D-1. The 50th percentile (median) concentration falls within the 4 meals per month category, but closely approaches the lower boundary for the 2 meals per month category. The carp PCB dataset is highly variable with a cv of 1.6. In addition, multiple discrete samples meet or exceed the lower FCSV for the Limited meal category. Therefore, MDHHS set the statewide consumption guideline at 2 meals per month. However, PCBs preferentially accumulate in the lipid (fatty) tissue. Trimming the fat from the muscle and cooking the fish in a way that lets the fat drip away (e.g., on a grate) may remove as much as 50 percent of the PCBs. Therefore, consumption can be doubled if the consumer follows the MDHHS cleaning and cooking guidance provided in the Eat Safe Fish Guide.
2.52.01.51.00.50.0
100
80
60
40
20
0
PCB(ppm)
Perc
ent
91.8
0.43
84.1
0.21
73.9
0.11
58.1
0.05
N 274
Lognormal
Carp / Inland Lake & Impoundment
4 meals/month
2 meals/month
1 meal/month
Figure D-1. Cumulative distribution function of PCB concentrations in carp from inland waters of Michigan with estimated percentiles for key fish consumption screening values.
As shown in Figure D-1, an estimated 58% of carp from inland waters have total PCB concentrations lower than the 4 meals per month screening value of 0.05 ppm. Nearly
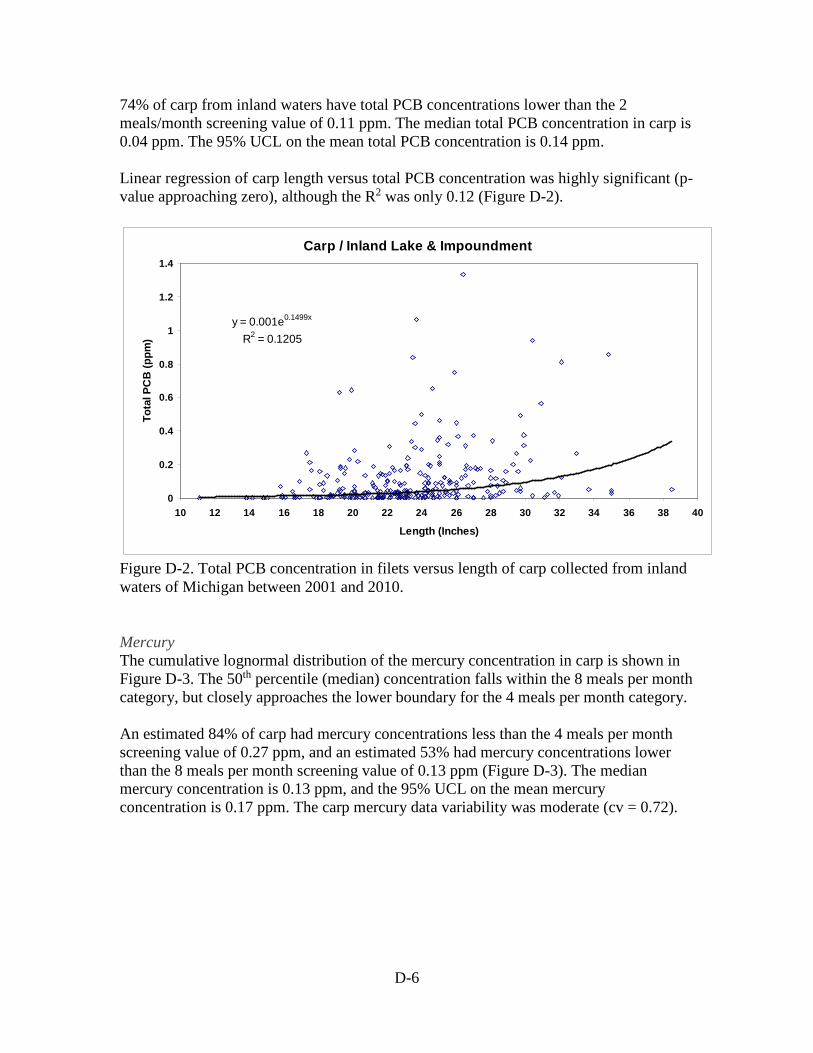
D-6
74% of carp from inland waters have total PCB concentrations lower than the 2 meals/month screening value of 0.11 ppm. The median total PCB concentration in carp is 0.04 ppm. The 95% UCL on the mean total PCB concentration is 0.14 ppm. Linear regression of carp length versus total PCB concentration was highly significant (p-value approaching zero), although the R2 was only 0.12 (Figure D-2).
Figure D-2. Total PCB concentration in filets versus length of carp collected from inland waters of Michigan between 2001 and 2010.
Mercury The cumulative lognormal distribution of the mercury concentration in carp is shown in Figure D-3. The 50th percentile (median) concentration falls within the 8 meals per month category, but closely approaches the lower boundary for the 4 meals per month category. An estimated 84% of carp had mercury concentrations less than the 4 meals per month screening value of 0.27 ppm, and an estimated 53% had mercury concentrations lower than the 8 meals per month screening value of 0.13 ppm (Figure D-3). The median mercury concentration is 0.13 ppm, and the 95% UCL on the mean mercury concentration is 0.17 ppm. The carp mercury data variability was moderate (cv = 0.72).
Carp / Inland Lake & Impoundment
y = 0.001e0.1499x
R2 = 0.1205
0
0.2
0.4
0.6
0.8
1
1.2
1.4
10 12 14 16 18 20 22 24 26 28 30 32 34 36 38 40
Length (Inches)
Tota
l PC
B (p
pm)
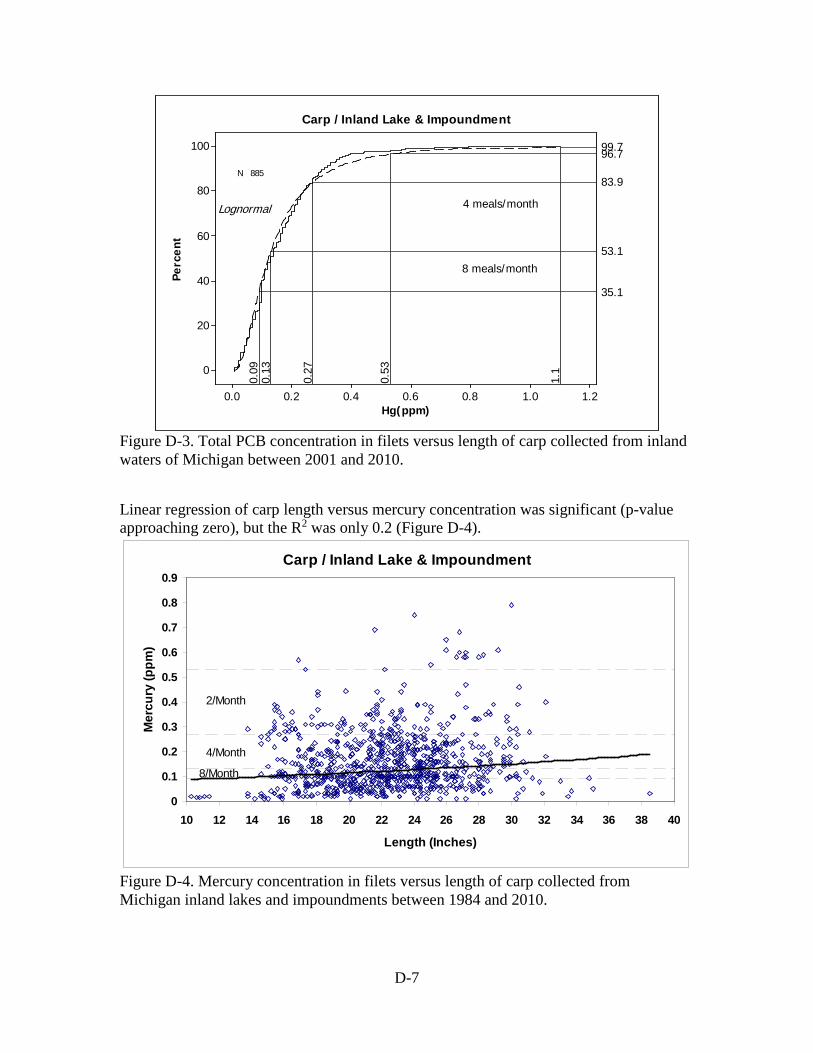
D-7
1.21.00.80.60.40.20.0
100
80
60
40
20
0
Hg(ppm)
Perc
ent
1.1
99.7
0.53
96.7
0.27
83.9
0.13
53.10.
09
35.1
N 885
Lognormal
Carp / Inland Lake & Impoundment
4 meals/month
8 meals/month
Figure D-3. Total PCB concentration in filets versus length of carp collected from inland waters of Michigan between 2001 and 2010.
Linear regression of carp length versus mercury concentration was significant (p-value approaching zero), but the R2 was only 0.2 (Figure D-4).
Figure D-4. Mercury concentration in filets versus length of carp collected from Michigan inland lakes and impoundments between 1984 and 2010.
Carp / Inland Lake & Impoundment
0
0.1
0.2
0.3
0.4
0.5
0.6
0.7
0.8
0.9
10 12 14 16 18 20 22 24 26 28 30 32 34 36 38 40
Length (Inches)
Mer
cury
(ppm
)
4/Month
8/Month
2/Month
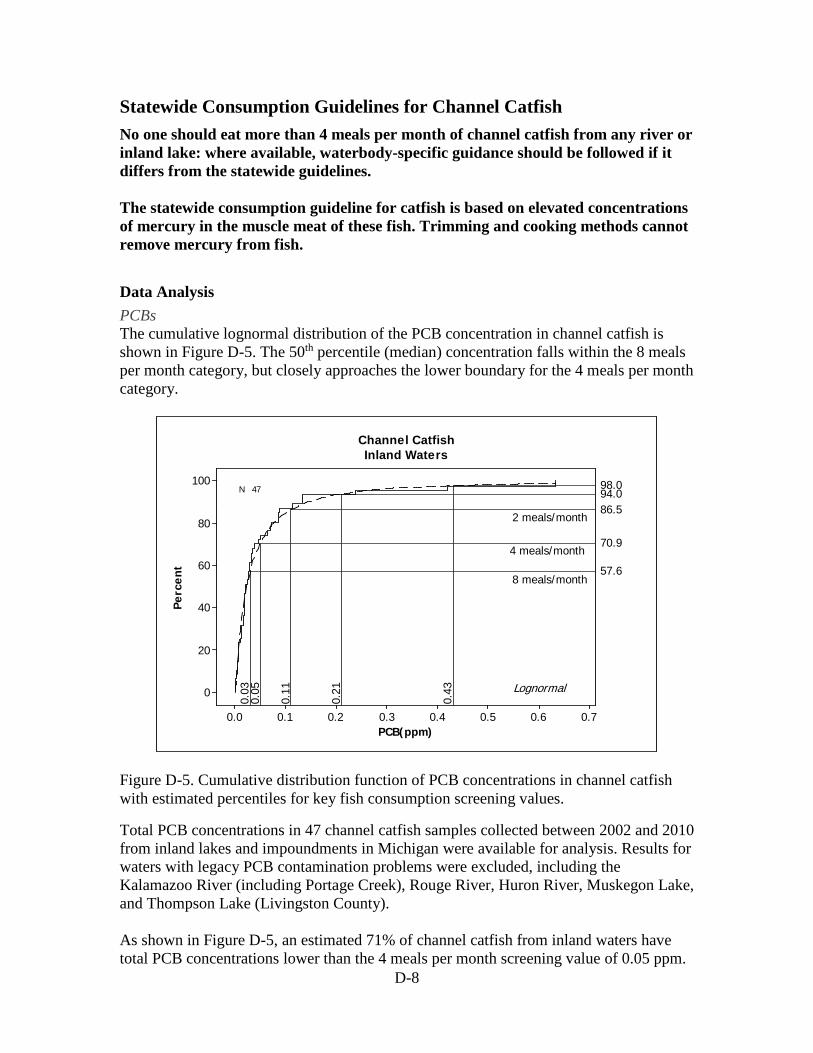
D-8
Statewide Consumption Guidelines for Channel Catfish No one should eat more than 4 meals per month of channel catfish from any river or inland lake: where available, waterbody-specific guidance should be followed if it differs from the statewide guidelines. The statewide consumption guideline for catfish is based on elevated concentrations of mercury in the muscle meat of these fish. Trimming and cooking methods cannot remove mercury from fish. Data Analysis PCBs The cumulative lognormal distribution of the PCB concentration in channel catfish is shown in Figure D-5. The 50th percentile (median) concentration falls within the 8 meals per month category, but closely approaches the lower boundary for the 4 meals per month category.
0.70.60.50.40.30.20.10.0
100
80
60
40
20
0
PCB(ppm)
Perc
ent
0.43
98.0
0.21
94.0
0.11
86.5
0.05
70.9
0.03
57.6
N 47
Lognormal
Channel CatfishInland Waters
4 meals/month
8 meals/month
2 meals/month
Figure D-5. Cumulative distribution function of PCB concentrations in channel catfish with estimated percentiles for key fish consumption screening values.
Total PCB concentrations in 47 channel catfish samples collected between 2002 and 2010 from inland lakes and impoundments in Michigan were available for analysis. Results for waters with legacy PCB contamination problems were excluded, including the Kalamazoo River (including Portage Creek), Rouge River, Huron River, Muskegon Lake, and Thompson Lake (Livingston County). As shown in Figure D-5, an estimated 71% of channel catfish from inland waters have total PCB concentrations lower than the 4 meals per month screening value of 0.05 ppm.

D-9
Nearly 58% of channel catfish from inland waters have total PCB concentrations lower than the 8 meals/month screening value of 0.03 ppm. The median total PCB concentration in channel catfish is 0.02 ppm, and the 95% UCL on the mean total PCB concentration is 0.08 ppm. The channel catfish PCB data are highly variable (cv = 1.9). Linear regression of channel catfish length versus total PCB concentration was significant (p-value = 0.04), although the R2 was only 0.09 (Figure D-6).
Figure D-6. Total PCB concentration in filets versus length of channel catfish collected from inland waters of Michigan between 1985 and 2010.
Mercury The cumulative lognormal distribution of the mercury concentrations in channel catfish is shown in Figure D-7. The 50th percentile (median) concentration falls within the 4 meals per month category.
Channel CatfishInland Waters
y = 0.0112x - 0.1562R2 = 0.0933
0
0.1
0.2
0.3
0.4
0.5
0.6
0.7
12 14 16 18 20 22 24 26
Length (Inches)
Tota
l PC
B (p
pm)
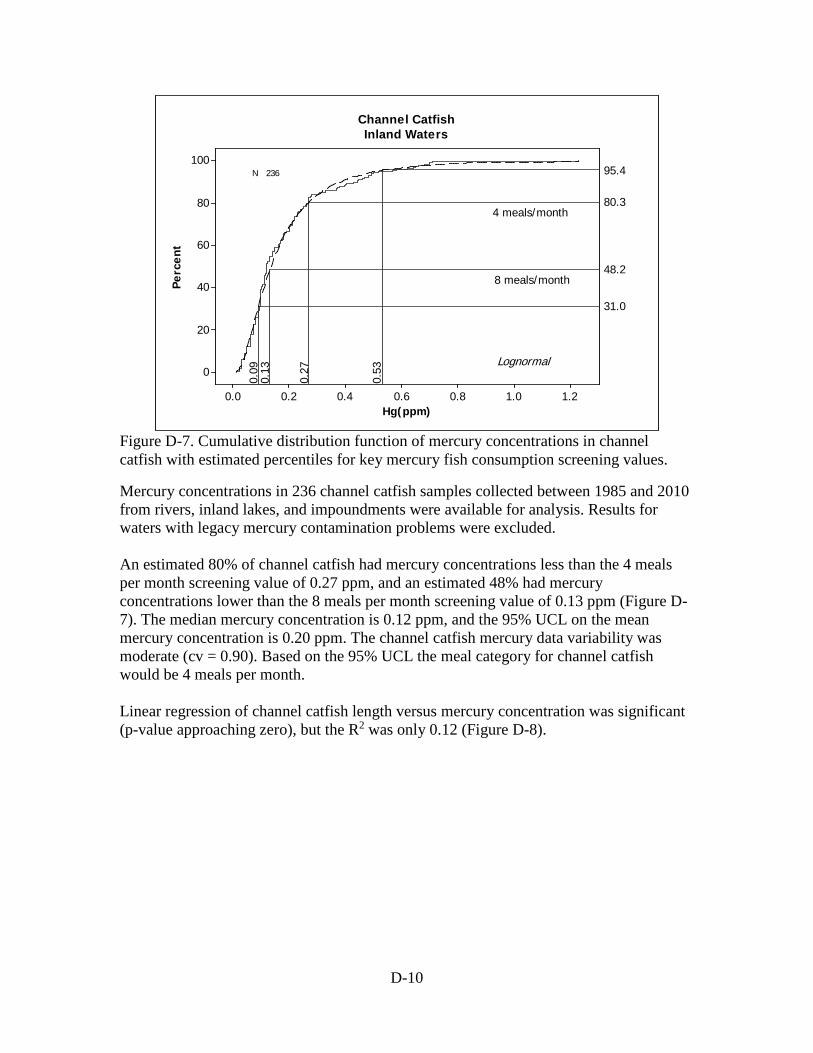
D-10
1.21.00.80.60.40.20.0
100
80
60
40
20
0
Hg(ppm)
Perc
ent
0.53
95.4
0.27
80.3
0.13
48.20.
09
31.0
N 236
Lognormal
8 meals/month
4 meals/month
Channel CatfishInland Waters
Figure D-7. Cumulative distribution function of mercury concentrations in channel catfish with estimated percentiles for key mercury fish consumption screening values.
Mercury concentrations in 236 channel catfish samples collected between 1985 and 2010 from rivers, inland lakes, and impoundments were available for analysis. Results for waters with legacy mercury contamination problems were excluded. An estimated 80% of channel catfish had mercury concentrations less than the 4 meals per month screening value of 0.27 ppm, and an estimated 48% had mercury concentrations lower than the 8 meals per month screening value of 0.13 ppm (Figure D-7). The median mercury concentration is 0.12 ppm, and the 95% UCL on the mean mercury concentration is 0.20 ppm. The channel catfish mercury data variability was moderate (cv = 0.90). Based on the 95% UCL the meal category for channel catfish would be 4 meals per month. Linear regression of channel catfish length versus mercury concentration was significant (p-value approaching zero), but the R2 was only 0.12 (Figure D-8).

D-11
Figure D-8. Mercury concentration in filets versus length of channel catfish collected from inland waters of Michigan between 2002 and 2010.
Channel Catfish / Inland Waters
y = 0.0178x - 0.1398R2 = 0.1224
0
0.2
0.4
0.6
0.8
1
1.2
1.4
10 12 14 16 18 20 22 24 26 28 30
Length (Inches)
Mer
cury
(ppm
)
4/Month
8/Month
2/Month
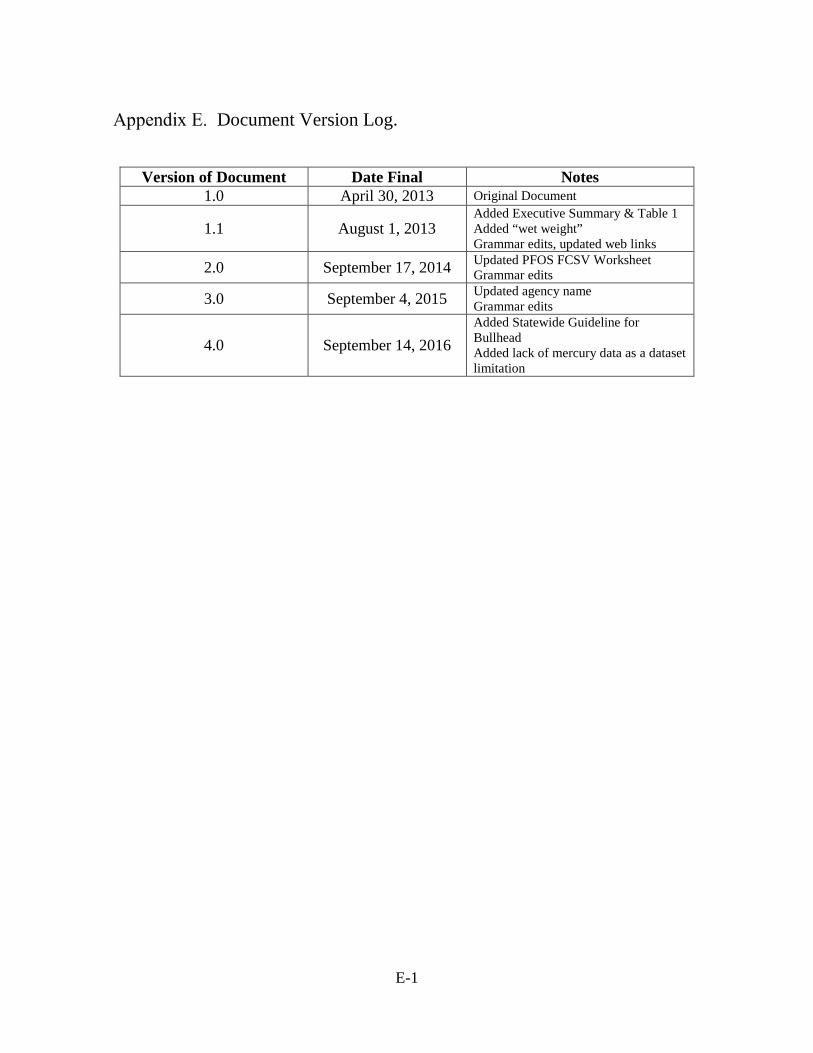
E-1
Document Version Log.
Version of Document Date Final Notes 1.0 April 30, 2013 Original Document
1.1 August 1, 2013 Added Executive Summary & Table 1 Added “wet weight” Grammar edits, updated web links
2.0 September 17, 2014 Updated PFOS FCSV Worksheet Grammar edits
3.0 September 4, 2015 Updated agency name Grammar edits
4.0 September 14, 2016 Added Statewide Guideline for Bullhead Added lack of mercury data as a dataset limitation