Embed Size (px)
Citation preview
Richland Operations Office P.O. Box 550 Richland, Washington 99352
Office of River Protection P.O. Box 450 Richland, Washington 99352
U.S. Department of Energy Hanford Site
21-SGD-001408 April 22, 2021 Ms. Emerald Laija, Program Manager U.S. Environmental Protection Agency 1200 Pennsylvania Ave., NW MC 5106R Washington, District of Columbia 20460 Dear Ms. Laija: 200-ZP-1 OPERABLE UNIT OPTIMIZATION STUDY SAMPLING AND ANALYSIS PLAN This letter transmits the approved 200-ZP-1 Operable Unit Optimization Study Sampling and Analysis Plan DOE/RL-2019-76, Revision 0 and the Review Comment Record to the U.S. Environmental Protection Agency (EPA). This document incorporates EPA's comments and outlines the sampling needed to support the 200-ZP-1 Operable Unit Optimization Study Plan. If there are any questions, please contact me or your staff may contact Kate Amrhein, of my staff, on (509) 376-9391. Sincerely, Michael W. Cline, Director
Soil and Groundwater Division Richland Operations Office
SGD:KEA Attachments: 1. DOE/RL-2019-76, R0 2. DOE/RL-2019-76, R0, Comment Record cc: See page 2
Michael W. Cline Digitally signed by Michael W. Cline Date: 2021.04.22 09:05:35 -07'00'
Ms. Emerald Laija: -2- 21-SGD-001408 cc w/ attach: J. Bell, NPT D. B. Bowen, Ecology R. Buck, Wanapum L. Contreras, YN D. R. Einan, EPA S. Leckband, HAB N. M. Menard, Ecology M. Murphy, CTUIR S. N. Schleif, Ecology M. Woods, ODOE
April 22, 2021
Administrative Record (200-ZP-1) Environmental Portal
cc w/o attach: S. G. Austin, CPCCo S. L. Brasher, HMIS M. E. Byrnes, CPCCo S. W. Davis, HMIS R. E. Fox, CPCCo
DOE/RL-2019-76Revision 0
200-ZP-1 OPERABLE UNIT OPTIMIZATION STUDYSAMPLING AND ANALYSIS PLAN
Prepared for the U.S. Department of EnergyAssistant Secretary for Environmental Management
P.O. Box 550 Richland, Washington 99352
Approved for Public Release; Further Dissemination Unlimited

DOE/RL-2019-76Revision 0
200-ZP-1 OPERABLE UNIT OPTIMIZATION STUDY SAMPLINGAND ANALYSIS PLAN
Date PublishedJanuary 2021
Prepared for the U.S. Department of Energy Assistant Secretary for Environmental Management
P.O. Box 550 Richland, Washington 99352
Release Approval Date
By Janis D. Aardal at 9:19 am, Jan 12, 2021
Approved for Public Release; Further Dissemination Unlimited
DOE/RL-2019-76Revision 0
TRADEMARK DISCLAIMER Reference herein to any specific commercial product, process, or service bytradename, trademark, manufacturer, or otherwise, does not necessarilyconstitute or imply its endorsement, recommendation, or favoring by theUnited States Government or any agency thereof or its contractors orsubcontractors.
This report has been reproduced from the best available copy.
Printed in the United States of America
DOE/RL-2019-76, REV. 0
iii
Signature Page
Title: 200-ZP-1 Operable Unit Optimization Study Sampling and Analysis Plan
Concurrence:
________________________________ ___________________________________ __________
Print Name Signature Date
U.S. Department of Energy, Richland Operations Office
________________________________ ___________________________________ __________
Print Name Signature Date
U.S. Environmental Protection Agency
Michael W. Cline Digitally signed by Michael W. Cline Date: 2021.01.19 15:47:02 -08'00'
EMERALD LAIJA Digitally signed by EMERALD LAIJA Date: 2021.01.21 09:38:42 -05'00'

DOE/RL-2019-76, REV. 0
iv
This page intentionally left blank.
DOE/RL-2019-76, REV. 0
v
Contents
1 Introduction .................................................................................................................................... 1-1
1.1 Project Scope and Objective ................................................................................................... 1-4
1.1.1 Remedy Implementation Documentation ................................................................... 1-6
1.1.2 Scope ................................................................................................................... 1-7
1.1.3 Objectives ................................................................................................................... 1-9
1.2 Background ............................................................................................................................ 1-9
1.2.1 Site Geology/Hydrology ........................................................................................... 1-11
1.2.2 Groundwater Flow .................................................................................................... 1-11
1.2.3 Sources of Contamination ......................................................................................... 1-11
1.2.4 Contaminant Plumes ................................................................................................. 1-12
1.3 Data Quality Objective Summary ........................................................................................ 1-17
1.3.1 Statement of the Problem .......................................................................................... 1-17
1.3.2 Project Task and Problem Definition ........................................................................ 1-17
1.3.3 Decision Statements and Decision Rules .................................................................. 1-18
1.3.4 Data Inputs and Sampling Design ............................................................................. 1-22
1.4 Target Analytes .................................................................................................................... 1-25
1.5 Project Schedule ................................................................................................................... 1-26
2 Quality Assurance Project Plan .................................................................................................... 2-1
2.1 Project Management ............................................................................................................... 2-1
2.1.1 Project/Task Organization ........................................................................................... 2-1
2.1.2 Quality Objectives and Criteria ................................................................................... 2-5
2.1.3 Methods-Based Analysis ............................................................................................ 2-5
2.1.4 Special Training/Certification ..................................................................................... 2-9
2.1.5 Documents and Records ............................................................................................. 2-9
2.2 Data Generation and Acquisition ......................................................................................... 2-11
2.2.1 Analytical Methods Requirements ............................................................................ 2-12
2.2.2 Field Analytical Methods .......................................................................................... 2-13
2.2.3 Quality Control ......................................................................................................... 2-13
2.2.4 Measurement Equipment .......................................................................................... 2-18
2.2.5 Instrument and Equipment Testing, Inspection, and Maintenance ........................... 2-18
2.2.6 Instrument/Equipment Calibration and Frequency ................................................... 2-19
2.2.7 Inspection/Acceptance of Supplies and Consumables .............................................. 2-19
2.2.8 Nondirect Measurements .......................................................................................... 2-19
2.2.9 Data Management ..................................................................................................... 2-19
2.3 Assessment and Oversight .................................................................................................... 2-19
2.3.1 Assessments and Response Actions .......................................................................... 2-19
DOE/RL-2019-76, REV. 0
vi
2.3.2 Reports to Management ............................................................................................ 2-20
2.4 Data Review and Usability ................................................................................................... 2-20
2.4.1 Data Review and Verification ................................................................................... 2-20
2.4.2 Data Validation ......................................................................................................... 2-20
2.4.3 Reconciliation with User Requirements ................................................................... 2-21
3 Field Sampling Plan ....................................................................................................................... 3-1
3.1 Sampling Objectives/Design .................................................................................................. 3-1
3.2 Sample Locations and Frequency ........................................................................................... 3-1
3.3 Sampling Methods .................................................................................................................. 3-5
3.3.1 Decontamination of Sampling Equipment .................................................................. 3-6
3.3.2 Radiological Field Data .............................................................................................. 3-7
3.3.3 Water Levels ............................................................................................................... 3-8
3.4 Documentation of Field Activities ......................................................................................... 3-8
3.4.1 Corrective Actions and Deviations for Sampling Activities ....................................... 3-9
3.5 Calibration of Field Equipment .............................................................................................. 3-9
3.6 Sample Handling .................................................................................................................. 3-10
3.6.1 Containers ................................................................................................................. 3-10
3.6.2 Container Labeling .................................................................................................... 3-11
3.6.3 Sample Custody ........................................................................................................ 3-11
3.6.4 Sample Transportation .............................................................................................. 3-12
4 Management of Waste ................................................................................................................... 4-1
5 Health and Safety ........................................................................................................................... 5-1
6 Reporting ........................................................................................................................................ 6-1
7 References ....................................................................................................................................... 7-1
Appendix
A Data Quality Objectives for the 200-ZP-1 Operable Unit Optimization Study ........................ A-i
DOE/RL-2019-76, REV. 0
vii
Figures
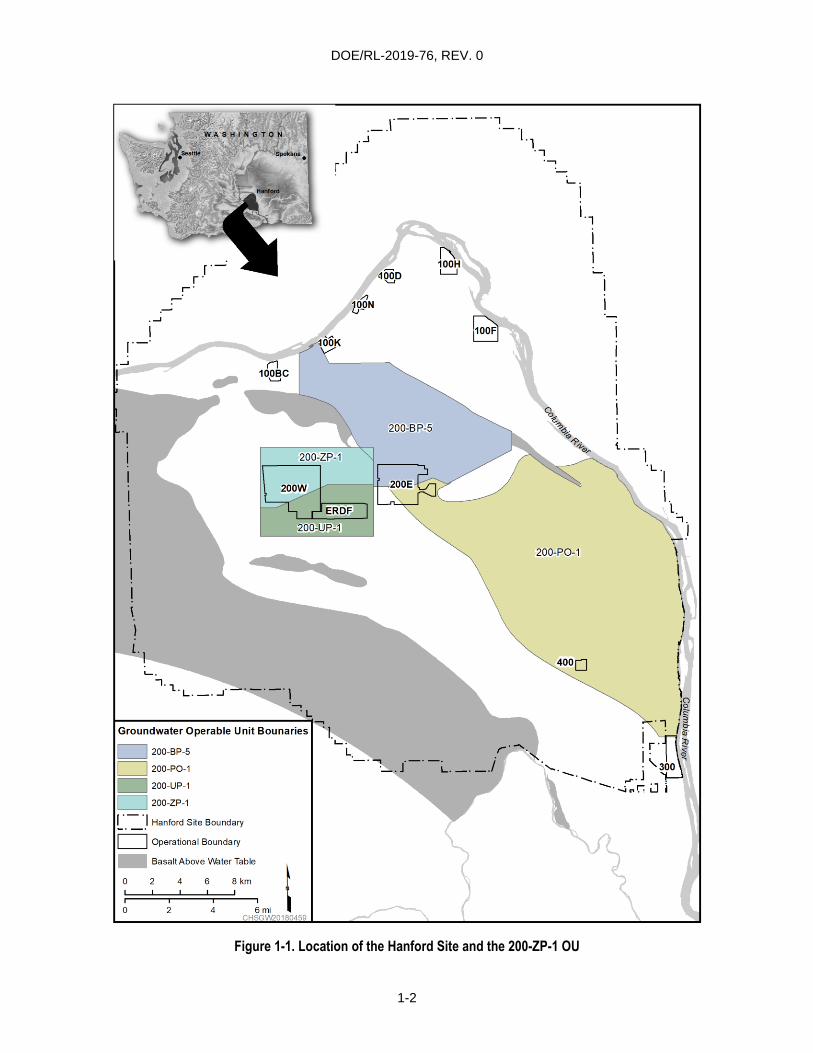
Figure 1-1. Location of the Hanford Site and the 200-ZP-1 OU ............................................................ 1-2
Figure 1-2. 200-ZP-1 OU Optimization Study Long-Term Groundwater Monitoring Network ........... 1-5
Figure 1-3. 200-ZP-1 OU Remedy Implementation and Reporting ....................................................... 1-8
Figure 1-4. Two-Dimensional Model Prediction of 200-ZP-1 OU Carbon Tetrachloride Plume ........ 1-13
Figure 1-5. Hydrogeologic Three-Dimensional Model Cross Section of Carbon
Tetrachloride Plume, North to South (A to A′) .................................................................. 1-15
Figure 1-6. Hydrogeologic Three-Dimensional Model Cross Section of Carbon
Tetrachloride Plume, West to East (B to B′) ...................................................................... 1-16
Figure 2-1. Project Organization ............................................................................................................ 2-2
Tables
Table 1-1. Principal Study Questions .................................................................................................. 1-18
Table 1-2. Decision Statements ........................................................................................................... 1-19
Table 1-3. Decision Rules ................................................................................................................... 1-20
Table 1-4. Summary of Data Inputs to Resolve DSs .......................................................................... 1-21
Table 1-5. 200-ZP-1 OU Optimization Study Long-Term Monitoring Well Network ....................... 1-23
Table 1-6. Analytes for 200-ZP-1 OU Optimization Study Long-Term Groundwater Monitoring .... 1-26
Table 2-1. Data Quality Indicators ........................................................................................................ 2-6
Table 2-2. Change Control for Sampling Projects ................................................................................ 2-9
Table 2-3. Performance Requirements for Sample Analysis .............................................................. 2-12
Table 2-4. QC Samples ....................................................................................................................... 2-13
Table 2-5. Field and Laboratory QC Elements and Acceptance Criteria ............................................ 2-14
Table 2-6. Holding-Time Guidelines for Laboratory Analytes ........................................................... 2-18
Table 3-1. 200-ZP-1 OU Optimization Study Long-Term Groundwater Monitoring Schedule ........... 3-1

DOE/RL-2019-76, REV. 0
viii
This page intentionally left blank.
DOE/RL-2019-76, REV. 0
ix
Terms
AEA Atomic Energy Act of 1954
CERCLA Comprehensive Environmental Response, Compensation, and Liability
Act of 1980
COC contaminant of concern
COPC contaminants of potential concern
DOE U.S. Department of Energy
DOE-RL U.S. Department of Energy, Richland Operations Office
DOT U.S. Department of Transportation
DQI data quality indicator
DQO data quality objective
DR decision rule
DS decision statement
DUA data usability assessment
DUP laboratory sample duplicate
EB equipment blank
Ecology Washington State Department of Ecology
EPA U.S. Environmental Protection Agency
F&T fate and transport
FS feasibility study
FSO Field Sample Operations
FTB full trip blank
FWS field work supervisor
FXR field transfer blank
FY fiscal year
HASQARD Hanford Analytical Services Quality Assurance Requirements Document
HEIS Hanford Environmental Information System
IATA International Air Transportation Association
LCS laboratory control sample
MB method blank
DOE/RL-2019-76, REV. 0
x
MNA monitored natural attenuation
MS matrix spike
MSD matrix spike duplicate
NTU nephelometric turbidity unit
O&M operations and maintenance
OSP optimization study plan
OU operable unit
P&T pump and treat
P2R Model Plateau to River Model
PMP performance monitoring plan
PSQ principal study question
QA quality assurance
QAPjP quality assurance project plan
QC quality control
QSM Quality Systems Manual
RAO remedial action objective
RCRA Resource Conservation and Recovery Act of 1976
RCT radiological control technician
RD/RAWP remedial design/remedial action work plan
Rlm Ringold Formation member of Wooded Island – lower mud unit
ROD Record of Decision
Rwia Ringold Formation member of Wooded Island – unit A
Rwie Ringold Formation member of Wooded Island – unit E
S&GRP Soil and Groundwater Remediation Project
SAP sampling and analysis plan
SMR Sample Management and Reporting
SPLIT field split sample
SUR surrogate
TCE trichloroethene
Tri-Party Agreement Hanford Federal Facility Agreement and Consent Order
DOE/RL-2019-76, REV. 0
1-1
1 Introduction
A focused optimization study is currently underway that is designed to evaluate changes to the current
pump and treat (P&T) configuration for the 200-ZP-1 Groundwater Operable Unit (OU) to increase
carbon tetrachloride treatment capacity. Figure 1-1 depicts the location of the Hanford Site and the
200-ZP-1 OU. The optimization study requirements are documented in DOE/RL-2019-38, 200-ZP-1
Operable Unit Optimization Study Plan (hereinafter referred to as the 200-ZP-1 OU optimization study
plan [OSP]). The optimization study is being conducted in conjunction with the activities identified in
DOE/RL-2008-78, Rev. 1, 200 West Area 200-ZP-1 Pump-and-Treat Remedial Design/Remedial Action
Work Plan (hereinafter referred to as the 200-ZP1 P&T remedial design/remedial action -work plan
[RD/RAWP]). The 200-ZP-1 OU OSP documents a remedial optimization approach designed to
increase carbon tetrachloride removal from within the Ringold Formation member of Wooded Island –
unit E (Rwie) and ultimately accelerate progress toward attaining groundwater cleanup goals.
The 200-ZP-1 OU optimization study groundwater monitoring has been divided into two phases:
near-term (first year of the study) and long-term (second year through the duration of the study). This
sampling and analysis plan (SAP) presents the 200-ZP-1 OU optimization study long-term groundwater
monitoring requirements.
Groundwater remediation at the 200-ZP-1 OU is currently in progress in accordance with
EPA et al., 2008, Record of Decision Hanford 200 Area 200-ZP-1 Superfund Site, Benton County,
Washington (hereinafter referred to as the 200-ZP-1 OU Record of Decision [ROD]). The groundwater
remedy detailed in the 200-ZP-1 OU ROD is comprised of P&T, flow-path control, and institutional
controls, followed by monitored natural attenuation (MNA). The ROD estimates that remediation will
require 125 years to achieve final cleanup levels for eight contaminants of concern (COCs), with carbon
tetrachloride being the primary risk driver and with a high concentration relative to the cleanup level and
corresponding large mass within the aquifer. The remedy is designed so P&T and MNA will occur
concurrently during the 25-year period of active P&T to reduce contaminant concentrations, and then
MNA will further reduce concentrations over the following 100 years to final cleanup levels.
Operations began at the 200 West P&T in July 2012, and remedy performance has been evaluated
annually since that time. The results of the evaluations are documented in annual 200 West Area P&T
reports (e.g., DOE/RL-2019-68, Calendar Year 2019 Annual Summary Report for Pump and Treat
Operations in the Hanford Site Central Plateau Operable Units). The evaluations have demonstrated that
system-wide flow rates, plume hydraulic containment, and mass recovery rates are following the targets
established in the 200-ZP-1 P&T RD/RAWP (DOE/RL-2008-78, Rev. 0 REISSUE). However,
assessment of 200-ZP-1 OU remedy performance for the first 6 years of implementation has indicated
that the P&T configuration needs to be modified to increase the capacity for carbon tetrachloride
remediation. Data and information obtained following issuance of the 200-ZP-1 OU ROD
(EPA et al., 2008) suggest that conditions are less favorable for attaining the carbon tetrachloride cleanup
level with the current P&T configuration in the timeframe specified in the ROD.
DOE/RL-2019-76, REV. 0
1-2
Figure 1-1. Location of the Hanford Site and the 200-ZP-1 OU
DOE/RL-2019-76, REV. 0
1-3
Multiple factors impact remedy performance, and additional and more frequent data collection and
additional information are needed to optimize the P&T remedy and support potential modifications of the
associated remedy decision documents. Among the factors impacting remedy performance are:
The slower-than-anticipated degradation rate for carbon tetrachloride (630 years versus the 41.3-year
half-life used in Rev. 0 of the 200-ZP-1 P&T RD/RAWP [DOE/RL-2008-78]), which greatly reduced
the contribution of abiotic degradation to carbon tetrachloride natural attenuation and necessitates
greater P&T operating rates and/or longer duration to reduce concentrations to the point that MNA
can achieve cleanup levels in the timeframe specified in the 200-ZP-1 OU ROD (EPA et al., 2008).
A larger mass of carbon tetrachloride is present in the Rwie than was presented in DOE/RL-2007-28,
Feasibility Study Report for the 200-ZP-1 Groundwater Operable Unit (hereinafter referred to as the
200-ZP-1 OU feasibility study [FS]).
Most nitrate in groundwater is currently present at concentrations that are less than an order of
magnitude above the cleanup level. Considering current nitrate concentration trends and assuming
there is no continuing source of nitrate, sufficient nitrate may have already been removed from the
aquifer (resulting in substantial concentration reductions) to enable a transition to the MNA phase of
the remedy that will still allow the nitrate cleanup level to be reached within the timeframe specified
in the 200-ZP-1 OU ROD (EPA et al., 2008).
Optimization of the 200-ZP-1 OU P&T remedy performance is needed to accelerate carbon tetrachloride
mass removal and increase treatment capacity to levels that are expected to approach the
required cleanup criteria.
Regulatory approval was obtained to implement the 200-ZP-1 OU OSP (DOE/RL-2019-38) on
September 30, 2019. The purpose of the optimization study is to collect and interpret data to evaluate
remedy performance enhancements through P&T configuration changes associated with 200 West P&T
operations. It is intended that the results from the study will provide the technical basis for
recommendations regarding whether to formally modify the P&T configuration and the associated
remedy decision documents.
The 200-ZP-1 OU OSP (DOE/RL-2019-38) emphasizes configuration changes and data collection for
the Rwie and provides the basis and approach for conducting the optimization study to meet the needs
detailed in the 200-ZP-1 P&T RD/RAWP (DOE/RL-2008-78, Rev. 1). The purpose of the optimization
study is to collect and interpret data to evaluate remedy performance enhancements and P&T
configuration changes associated with P&T operations. The data quality objective (DQO) process was
used to determine and document the data and information to be collected and evaluated in order to meet
the optimization study objectives. Appendix A presents the DQOs for the OSP. This focused SAP was
developed to specify the data that will be collected to support the 200-ZP-1 OU OSP long-term
groundwater monitoring requirements.
The optimization study focuses on the Rwie and is anticipated to have minimal impact on contamination
in the Ringold Formation member of Wooded Island – unit A (Rwia), except (1) in areas where the
intervening low-conductivity Ringold Formation lower mud unit (Rlm) is absent so the unconfined
aquifer is continuous within the Rwie and Rwia, and (2) where some of the extraction and injection wells
are screened within both the Rwie and Rwia. A separate investigation is being performed to more fully
evaluate and understand the nature and extent of contamination in the Rwia, which will then be used to
determine the treatment needs for that unit. Activities to be performed as part of the Rwia investigation
are detailed in DOE/RL-2019-23, 200-ZP-1 Operable Unit Ringold Formation A Characterization
Sampling and Analysis Plan (hereinafter referred to as the Ringold A SAP).
DOE/RL-2019-76, REV. 0
1-4
The 200-ZP-1 OU OSP (DOE/RL-2019-38) was approved on September 30, 2019, providing the
regulatory approval to begin the optimization study. The optimization study groundwater monitoring
requirements have been divided into two phases: near-term and long-term. The duration of the near-term
200-ZP-1 OU optimization study groundwater monitoring is defined as the one-year period following
suspension of the active biological treatment, which occurred on October 9, 2019 (i.e., fiscal year
[FY] 2020). The near-term groundwater sampling and analysis requirements were implemented through
TPA-CN-0875, TPA Change Notice Form, DOE/RL-2009-115, Performance Monitoring Plan for the
200-ZP-1 Operable Unit Remedial Action, Revision 2, and are not included in this SAP.
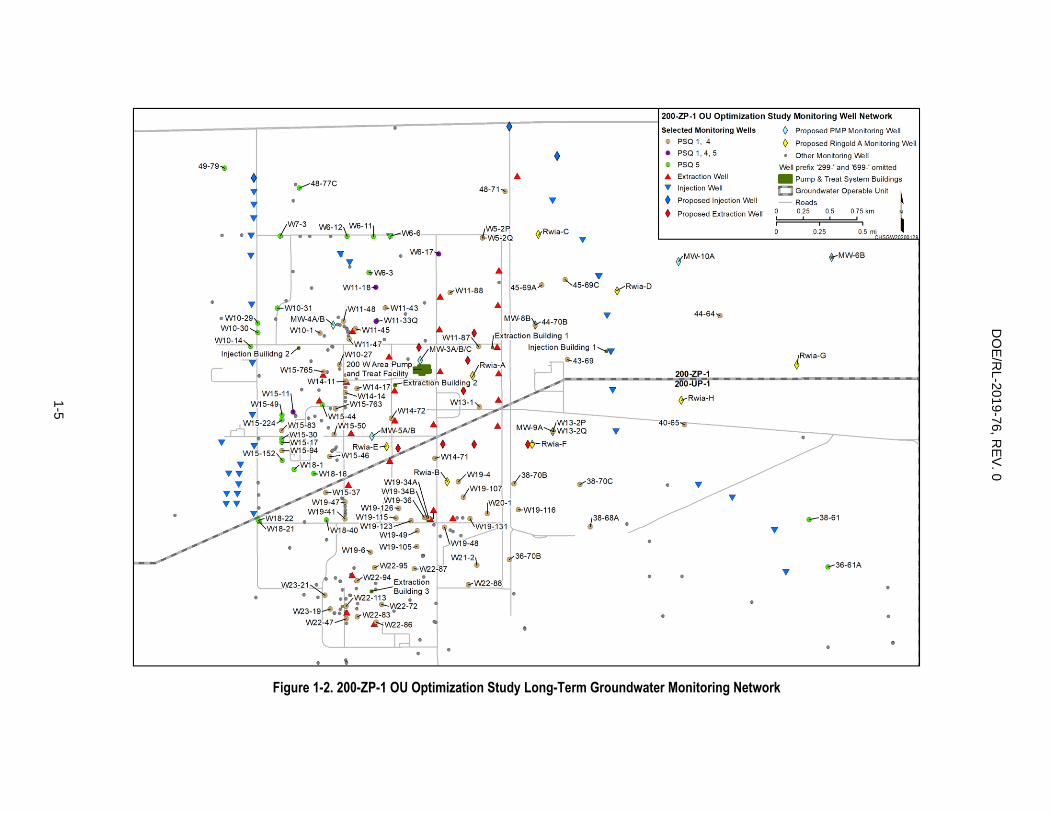
The duration of long-term groundwater monitoring for the 200-ZP-1 OU optimization study is defined as
starting after the end of the near-term monitoring and continuing through the duration of the optimization
study (i.e., FY 2021 through FY 2024, with the possibility of extending through FY 2026). The sampling
and analytical requirements for the optimization study long-term groundwater monitoring are documented
in this SAP. Figure 1-2 depicts the 200-ZP-1 OU optimization study long-term groundwater monitoring
well network. Each new well (e.g., Resource Conservation and Recovery Act of 1976 [RCRA], the
Atomic Energy Act of 1954 [AEA], and 200-UP-1 OU) installed in proximity to the 200-ZP-1 OU carbon
tetrachloride plume during the optimization study timeframe will be evaluated for inclusion in the study.
Section 1.3.4 discusses the steps to be used in the well selection process.
A comprehensive evaluation was initiated in FY 2020 (and continues into FY 2021) as a separate activity
taking place concurrently with the optimization study to provide a technical assessment of near- and
long-term projected plume remediation, COC treatment, and source contaminant requirements for other
COCs and contaminants of potential concern (COPCs). The resulting recommendations from this effort
will develop the basis for additional remedy optimization actions that will be integrated into necessary
Comprehensive Environmental Response, Compensation, and Liability Act of 1980 (CERCLA) decision
documents and remedy optimization efforts (anticipated to occur in the FY 2021/2022 timeframe) for
relevant OUs in the Central Plateau, including 200-ZP-1. An initial summary of these activities is
presented in SGW-65172-VA, 200-ZP-1 Optimization Study – Resolution of RL Comments Regarding
Integration of a Comprehensive Remediation Evaluation of Groundwater Plumes and Well Networks.
1.1 Project Scope and Objective
Performance assessment of the 200-ZP-1 OU remedy for the first 6 years of remedy implementation has
indicated that the P&T configuration needs to be modified to increase the capacity to recover and treat
carbon tetrachloride and ultimately accelerate progress toward attaining groundwater cleanup goals.
The purpose of the optimization study is to collect and interpret data to evaluate remedy performance
enhancement through P&T configuration changes associated with 200 West P&T operations. It is
intended that the results from the optimization study will provide a technical basis for recommendations
on whether to formally modify the P&T configuration and the associated remedy decision documents.
1-5
DO
E/R
L-2
019
-76
, RE
V. 0
Figure 1-2. 200-ZP-1 OU Optimization Study Long-Term Groundwater Monitoring Network
DOE/RL-2019-76, REV. 0
1-6
The optimization study will be conducted consistent with U.S. Environmental Protection Agency (EPA)
guidelines provided in EPA 542-R-13-008, Remediation Optimization: Definition, Scope and Approach.
The 200-ZP-1 OU OSP (DOE/RL-2019-38) provides an overall approach to perform changes to the
treatment facility and the well network to increase carbon tetrachloride treatment capacity. Initial data
collection (beginning immediately following suspension of biological treatment at the 200 West P&T) is
being conducted under the OSP and DOE/RL-2009-115, Performance Monitoring Plan for the 200-ZP-1
Groundwater Operable Unit Remedial Action (hereinafter referred to as the 200-ZP-1 OU performance
monitoring plan [PMP]) (as amended by TPA-CN-0875). This SAP specifies the optimization study
long-term groundwater monitoring data collection activities. As data are gathered during the study,
adjustments to the sampling and analysis approach may be made, if needed, to achieve optimization
study objectives.
The 200-ZP-1 OU OSP (DOE/RL-2019-38) lists four tasks to be conducted:
Task 1: Suspend active biological treatment at the 200 West P&T, prepare study implementation
documents, and install new extraction/injection wells.
Task 2: Perform facility and well network upgrades to enable increased treatment capacity at the
200 West P&T.
Task 3: Collect data and perform monitoring.
Task 4: Prepare reports.
The activities detailed in this SAP are intended to support Task 3 and will be documented as part of
Task 4. Long-term monitoring under this SAP will include obtaining data currently collected through
existing SAPs as well as analyzing samples from existing wells for analytes not currently collected under
existing SAPs. The frequency of sample collection will also increase at various wells under this SAP.
The primary data collection elements for Task 3 include information from the 200 West P&T (influent
and effluent COC concentrations, as well as additional process operational monitoring data), COC mass
recovery data, aquifer hydraulic head data, and constituent concentrations at monitoring wells over the
period of data collection. Data collection efforts under this SAP are limited to those associated with the
optimization study long-term groundwater monitoring, as discussed in Chapters 2 and 3.
In Task 4, the data generated under Task 3 will be analyzed, interpreted, and compared to outputs from
fate and transport (F&T) modeling. The F&T analysis is used to evaluate the effect of the P&T
configuration changes made during the optimization study. The analyses include hydraulic trends,
gradients, drawdown, and flow and capture; evaluation of temporal trends and spatial distribution of
constituents; and mass recovery. Data evaluations will occur following data collection in order to make
adjustments to data collection or operations, including groundwater monitoring, if needed.
1.1.1 Remedy Implementation Documentation
The 200-ZP-1 OU remedy is implemented through multiple implementation documents, including
the following:
DOE/RL-2008-78, Rev. 1 (200-ZP-1 P&T RD/RAWP)
DOE/RL-2019-23 (Ringold A SAP)
DOE/RL-2019-38 (200-ZP-1 OU OSP)
DOE/RL-2009-115 (200-ZP-1 OU PMP)
DOE/RL-2019-76, REV. 0
1-7
DOE/RL-2009-124, 200 West Pump and Treat Operations and Maintenance Plan (hereinafter
referred to as the 200 West P&T operations and maintenance [O&M] plan)
Reporting activities are provided through annual P&T reports, quarterly regulatory briefings, and an
annual P&T remedy progress assessment report. Changes to the P&T configuration performed as part of
the optimization study may require revisions to the 200-ZP-1 OU PMP (DOE/RL-2009-115) and the
200 West P&T O&M plan (DOE/RL-2009-124).
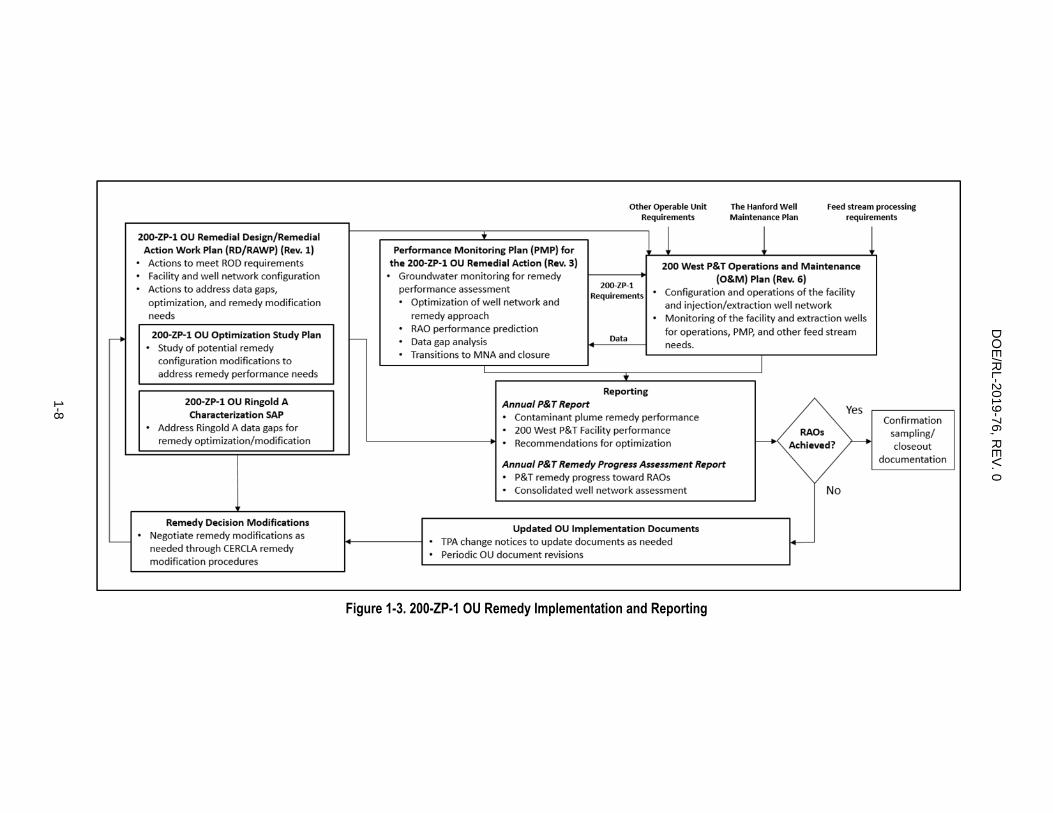
Figure 1-3 shows the relationship between 200-ZP-1 OU remedy implementation documents and remedy
reporting, optimization, decisions, and management. As shown in the figure, the 200-ZP-1 P&T
RD/RAWP (DOE/RL-2008-78, Rev. 1) describes the remedy tasks and provides the overall direction for
remedy implementation to meet 200-ZP-1 OU ROD (EPA et al., 2008) requirements. The 200-ZP-1 OU
PMP (DOE/RL-2009-115) and the 200 West P&T O&M plan (DOE/RL-2009-124) guide the approach
for remedy implementation. Specifically, the PMP describes data collection and interpretation to conduct
remedy performance assessment and support remedy implementation decisions. The O&M plan guides
operation and data collection for the 200 West P&T, as well as the injection and extraction well networks.
The PMP provides the requirements that the O&M plan must incorporate to meet plume remediation
needs. The O&M plan activities provide data to the PMP for use in performance assessment.
1.1.2 Scope
The 200-ZP-1 OU OSP (DOE/RL-2019-38) provides an overall approach to conduct well network
optimization to increase carbon tetrachloride recovery and treatment capacity and to perform necessary
changes at the treatment facility. Appendix A of this SAP provides the DQOs which support the OSP.
This SAP was developed to detail the sampling and analysis activities necessary to support the
optimization study long-term groundwater monitoring data collection needs of the OSP. Data collection
efforts under this SAP are limited to those activities associated with the 200-ZP-1 OU optimization study
long-term groundwater monitoring and are detailed in Chapters 2 and 3. Activities included in this SAP
are intended to support OSP Task 3 and will be documented as part of OSP Task 4. Figure 1-2 depicts the
200-ZP-1 OU optimization study long-term groundwater monitoring well network.
The F&T analysis (OSP Task 4) will be used to evaluate the effect of the P&T configuration changes
made during the optimization study. The analyses include hydraulic trends, gradients, drawdown, and
flow and capture; evaluation of temporal trends and the spatial distribution of constituents; and mass
recovery. Data evaluations (including modeled F&T predictions) will occur following data collection in
order to make adjustments to data collection or operations, including groundwater monitoring, if needed.
Each new well installed in proximity to the 200-ZP-1 OU carbon tetrachloride plume during the
optimization study timeframe will be evaluated for inclusion in the study. Section 1.3.4 lists the steps to
be used in the well selection process.
1-8
DO
E/R
L-2
019
-76
, RE
V. 0
Figure 1-3. 200-ZP-1 OU Remedy Implementation and Reporting
DOE/RL-2019-76, REV. 0
1-9
1.1.3 Objectives
The primary objectives of the sampling activities identified in this SAP include the following:
Obtain new and existing data to quantify the increased carbon tetrachloride mass removal rate and
concentration reductions under the optimization study configurations (e.g., increased extraction rate
and increased carbon tetrachloride treatment capacity).
Obtain new and existing data to compare anticipated remedy performance for carbon tetrachloride
under the optimization study configurations to pre-optimization study performance.
Obtain new and existing data to quantify nitrate plume behavior.
The comprehensive evaluation initiated in FY 2020 as a separate activity taking place concurrently with
the optimization study will provide a technical assessment of near- and long-term projected plume
remediation, COC treatment, and source contaminant requirements for other COCs and COPCs.
The resulting recommendations from this effort will develop the basis for additional remedy optimization
actions that will be integrated into necessary CERCLA decision documents and remedy optimization
efforts (anticipated to occur in the FY 2021/2022 timeframe) for relevant Central Plateau OUs, including
the 200-ZP-1 OU.
Data collected from existing wells under this SAP will be used to update groundwater elevation (contour)
maps, three-dimensional contaminant plume depictions, and F&T models.
Section 1.3 discusses the DQOs that guide this SAP.
1.2 Background
The 200 Areas are located on a broad, relatively flat plain that constitutes a local topographic high
commonly referred to as the Central Plateau. The 200-ZP-1 OU underlies the northern portion of the
200 West Area, which is located at the western side of the Central Plateau.
The 200-ZP-1 OU comprises groundwater contaminated by releases from facilities and waste sites
associated with Hanford Site former plutonium concentration and recovery operations at Z Plant
and plutonium separation operations at T Plant. The 200-ZP-1 OU includes several groundwater
contaminant plumes that span about 18 km2 (7 mi2) beneath the 200 West Area. Figure 1-1 shows the
location of the 200-ZP-1 OU at the Hanford Site. The main COC in groundwater for the 200-ZP-1 OU is
carbon tetrachloride.
The 200-ZP-1 OU remedy began operating in 2012 using the 200 West P&T. Overall performance of
200-ZP-1 OU P&T activities through the initial 6 years of operation demonstrated that flow rates, plume
containment, and mass extraction performance are consistent with the targets established in the
200-ZP-1 P&T RD/RAWP (DOE/RL-2008-78, Rev. 0 REISSUE). However, data and information
obtained following issuance of the 200-ZP-1 OU ROD (EPA et al., 2008) suggest that conditions are less
favorable for attaining the carbon tetrachloride cleanup level with the current P&T configuration in the
timeframe specified in the ROD. In addition, active biological treatment limited plant throughput and was
not needed to remediate carbon tetrachloride. This data and information include the following:
DOE/RL-2019-76, REV. 0
1-10
The site-specific abiotic degradation rate of carbon tetrachloride (as presented in PNNL-22062,
Abiotic Degradation Rates for Carbon Tetrachloride and Chloroform: Final Report) has been
determined to be about an order of magnitude slower than the degradation rate assumed in the
200-ZP-1 OU FS (DOE/RL-2007-28). As a result of the slower natural degradation rate, more
intensive P&T efforts and/or a longer cleanup duration are needed to achieve the carbon tetrachloride
cleanup levels specified in the 200-ZP-1 OU ROD (EPA et al., 2008).
More carbon tetrachloride contamination is present in Rwie than was identified in the 200-ZP-1 OU
FS (Section 2.4 in DOE/RL-2007-28). Current estimates indicate that over a third more carbon
tetrachloride mass resides within the Rwie than was assumed in the 200-ZP-1 OU FS.
A predictive groundwater F&T modeling analysis was conducted using this new information to evaluate
whether the current P&T configuration could meet the remedial action objectives (RAOs) identified in the
200-ZP-1 OU ROD (EPA et al., 2008) for carbon tetrachloride, which is the primary risk driver and has
a high concentration relative to the cleanup level and a corresponding large mass within the aquifer.
The analysis indicated that without modification, carbon tetrachloride concentrations would not meet
cleanup levels within the 125-year timeframe. The analysis also suggested that sufficient nitrate treatment
may have occurred to transition to MNA, based on nitrate concentrations being less than an order of
magnitude above the cleanup level and the significant amount of nitrate removed from the aquifer as of
the end of December 2019.
The predictive analysis resulted in an initial evaluation of P&T configuration changes to focus on
increasing the carbon tetrachloride treatment capacity of the 200 West P&T to diminish the plume in
the Rwie. To improve carbon tetrachloride cleanup, a third air stripper tower and additional extraction
and injection wells are required to accommodate greater total overall operating capacity for the
200 West P&T. The 200 West P&T is currently operating at its original design capacity of 9,500 L/min
(2,500 gal/min) maximum throughput, but only 6,800 L/min (1,800 gal/min) are available for the
200-ZP-1 OU due to water being treated from other feed streams. In addition, nitrate in groundwater is
currently present primarily at concentrations less than an order of magnitude above the cleanup level.
Considering current nitrate concentration trends and assuming there is no continuing source of nitrate,
sufficient nitrate may have already been removed from the aquifer to enable a transition to the MNA
phase of the remedy that will still allow the nitrate cleanup level to be reached within the timeframe
specified in the 200-ZP-1 OU ROD (EPA et al., 2008). It is anticipated that suspending active biological
treatment will allow resources to be focused to expand the well network and increase the P&T capacity
for carbon tetrachloride to approximately 14,200 L/min (3,750 gal/min), with the 200-ZP-1 OU treatment
capacity to increase to 11,621 L/min (3,070 gal/min).
Plume dynamics for COCs from water quality data collected and evaluated under the 200-ZP-1 OU PMP
(DOE/RL-2009-115) will be used to predict whether RAOs are expected to be achieved for all of the
COCs under the optimization study configurations within the timeframe in the 200-ZP-1 OU ROD
(EPA et al., 2008). In addition, a comprehensive evaluation has been initiated to provide a technical
assessment of near- and long-term projected plume remediation, COC treatment, and source contaminant
requirements for other COCs and COPCs (SGW-65172-VA).
As previously noted, new data collected since issuance of the 200-ZP-1 P&T RD/RAWP
(DOE/RL-2008-78, Rev. 0 REISSUE) show that more carbon tetrachloride contamination is present in
the lower Rwia portion of the aquifer than was identified in the 200-ZP-1 OU FS (Section 2.4 in
DOE/RL-2007-28). Current estimates indicate that approximately 25% of the remaining carbon
tetrachloride mass resides within the Rwia compared to approximately 12% assumed in the 200-ZP-1 OU
FS. The data also indicate lower hydraulic conductivity in the Rwia aquifer when compared to the Rwie,
DOE/RL-2019-76, REV. 0
1-11
causing additional remediation difficulties. The Ringold A SAP (DOE/RL-2019-23) was developed to
better characterize the Rwia. Characterization activities under the Ringold A SAP are planned to be
performed concurrently with the 200-ZP-1 OU optimization study.
The following sections summarize the hydrogeology, groundwater flow, contaminant plumes, and
contamination sources for the 200-ZP-1 OU. A summary of the DQO process and outcomes is
also provided.
1.2.1 Site Geology/Hydrology
The Hanford Site lies in a sediment-filled basin on the Columbia Plateau in southeastern Washington
State (Figure 1-1). The Central Plateau is a relatively flat, prominent terrace near the center of the
Hanford Site. The Columbia River Basalt Group and a sequence of overlying sediments comprise the
local geology. The overlying sediments are approximately 169 m (555 ft) thick, with surface elevations
ranging from approximately 200 to 217 m (660 to 712 ft). The sediment thickness in the 200 West Area
above the water table ranges from 40 to 75 m (132 to 246 ft). Sediments in the vadose zone include the
Ringold Formation (the uppermost Rwie and the Ringold upper mud unit), the Cold Creek unit, and the
Hanford formation.
Groundwater beneath the 200 West Area is primarily found in unconfined and semiconfined sedimentary
aquifer systems and in deeper confined aquifers within the basalt. The unconfined aquifer in the
200-ZP-1 OU primarily occurs in the Rwie. The low-permeability Rlm forms the base of the unconfined
aquifer in much of the 200-ZP-1 OU. Where present, the Rlm is a semiconfining unit that separates and
distinguishes the conditions and contaminants above the unit from those below it in the semiconfined
aquifer, which resides in the Rwia. However, the Rlm is not present in some portions of the OU, and the
unconfined aquifer extends into the Rwia in these areas.
1.2.2 Groundwater Flow
Groundwater in the unconfined aquifer flows from areas where the water table is higher (west of the
Hanford Site) to areas where the water table is lower (the Columbia River), with velocities typically
ranging from 0.0001 to 0.5 m/d (0.00033 to 1.64 ft/d). Groundwater flow through the Central Plateau
generally occurs in a predominantly easterly direction, with velocities approximating 0.0001 m/d
(0.0003 ft/d) in fine-textured, lower permeability Ringold sediments (SGW-38815, Water-Level
Monitoring Plan for the Hanford Site Soil and Groundwater Remediation Project). The depth of the
water table in the 200 West Area varies from about 50 m (164 ft) in the southwest corner (near the former
216-U-10 Pond) to >100 m (328 ft) to the north.
1.2.3 Sources of Contamination
The 200-ZP-1 OU includes several groundwater contaminant plumes collectively covering an area of
approximately 18 km2 (7 mi2) beneath much of the 200 West Area. The 200 West Area contains waste
management facilities and former irradiated fuel-reprocessing facilities. The major waste streams that
contributed to groundwater contamination were associated with plutonium-finishing operations at the
Z Plant facilities and the plutonium separation operations at the T Plant facilities in the 200 West Area.
Liquid waste disposal to cribs and trenches near these facilities resulted in several groundwater
contaminant plumes in the 200-ZP-1 OU.
The groundwater COCs identified in the 200-ZP-1 OU ROD (EPA et al., 2008) include carbon
tetrachloride, total chromium, hexavalent chromium, iodine-129, nitrate, technetium-99, trichloroethene
(TCE), and tritium. The primary carbon tetrachloride and TCE sources were associated with liquid waste
discharges from plutonium separation processes at the Plutonium Finishing Plant to the 216-Z-1A,
216-Z-9, and 216-Z-18 Cribs and Trenches. These sources have been mitigated and there is no longer
DOE/RL-2019-76, REV. 0
1-12
a continuing carbon tetrachloride source that would contribute to a plume of concern (DOE/RL-2014-48,
Response Action Report for the 200-PW-1 Operable Unit Soil Vapor Extraction Remediation).
The carbon tetrachloride plume area is about 18 km2 (7 mi2) and primarily extends north, south, and east
from the source areas.
Sources of chromium, iodine-129, nitrate, TCE, technetium-99, and tritium contamination in the
200-ZP-1 OU include releases from past leaks in single-shell tanks and pipelines in Waste Management
Areas T and TX-TY, and liquid waste disposal from plutonium-processing operations to cribs and
trenches adjacent to the waste management areas. Except for nitrate, the remaining contaminant plumes in
the 200-ZP-1 OU are predominately located within the boundaries of the carbon tetrachloride plume.
1.2.4 Contaminant Plumes
To support performance evaluation of the 200-ZP-1 OU remedy, 98 monitoring wells are currently
monitored and sampled within the footprint of the 200-ZP-1 and 200-UP-1 OUs. Data obtained during
and following remedial investigations and identified in the 200-ZP-1 OU FS (DOE/RL-2007-28) indicate
that groundwater contamination was present from the water table to the base of the unconfined aquifer
(DOE/RL-2008-78, Rev. 0 REISSUE).The uppermost aquifer in the 200-ZP-1 OU is unconfined and
occurs primarily within the Rwie but also contiguously within the Rwia where the intervening Rlm
is absent.
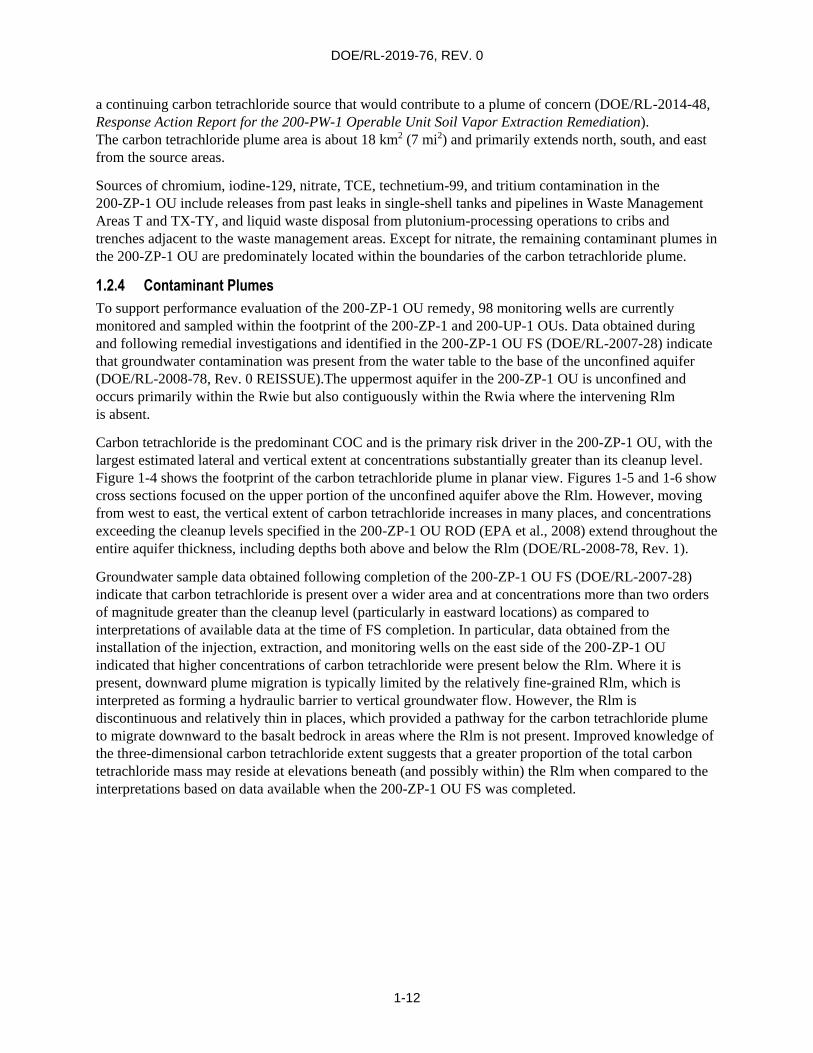
Carbon tetrachloride is the predominant COC and is the primary risk driver in the 200-ZP-1 OU, with the
largest estimated lateral and vertical extent at concentrations substantially greater than its cleanup level.
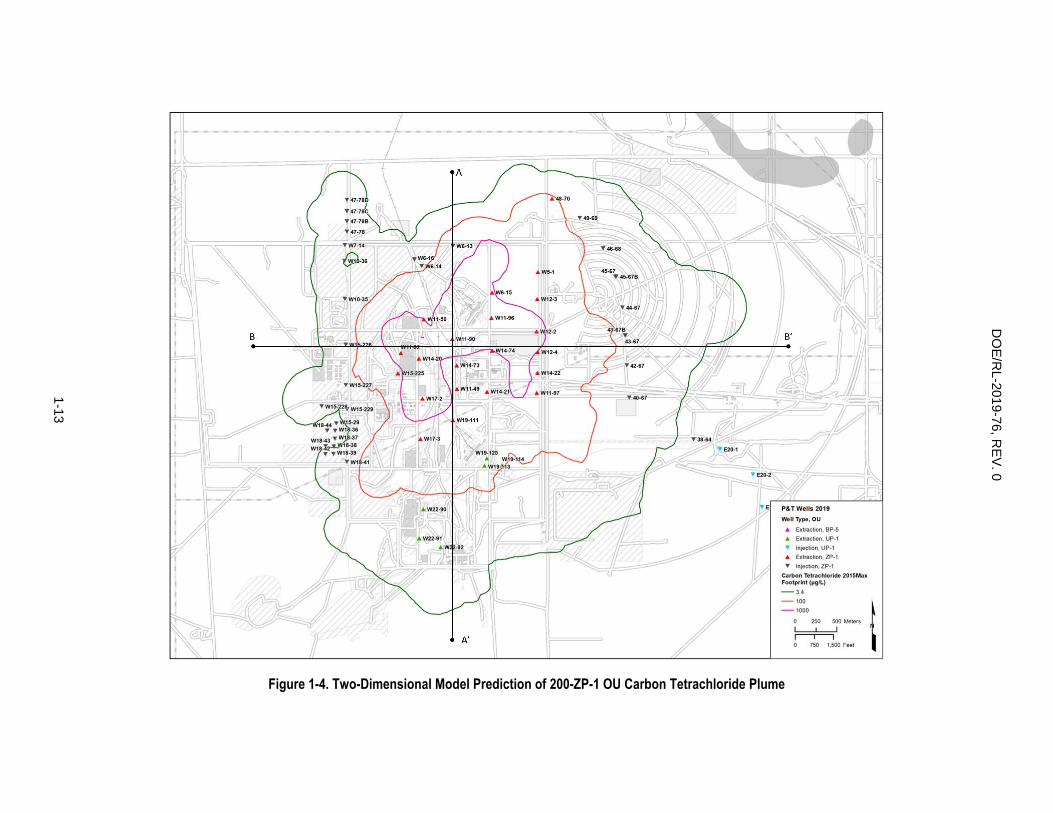
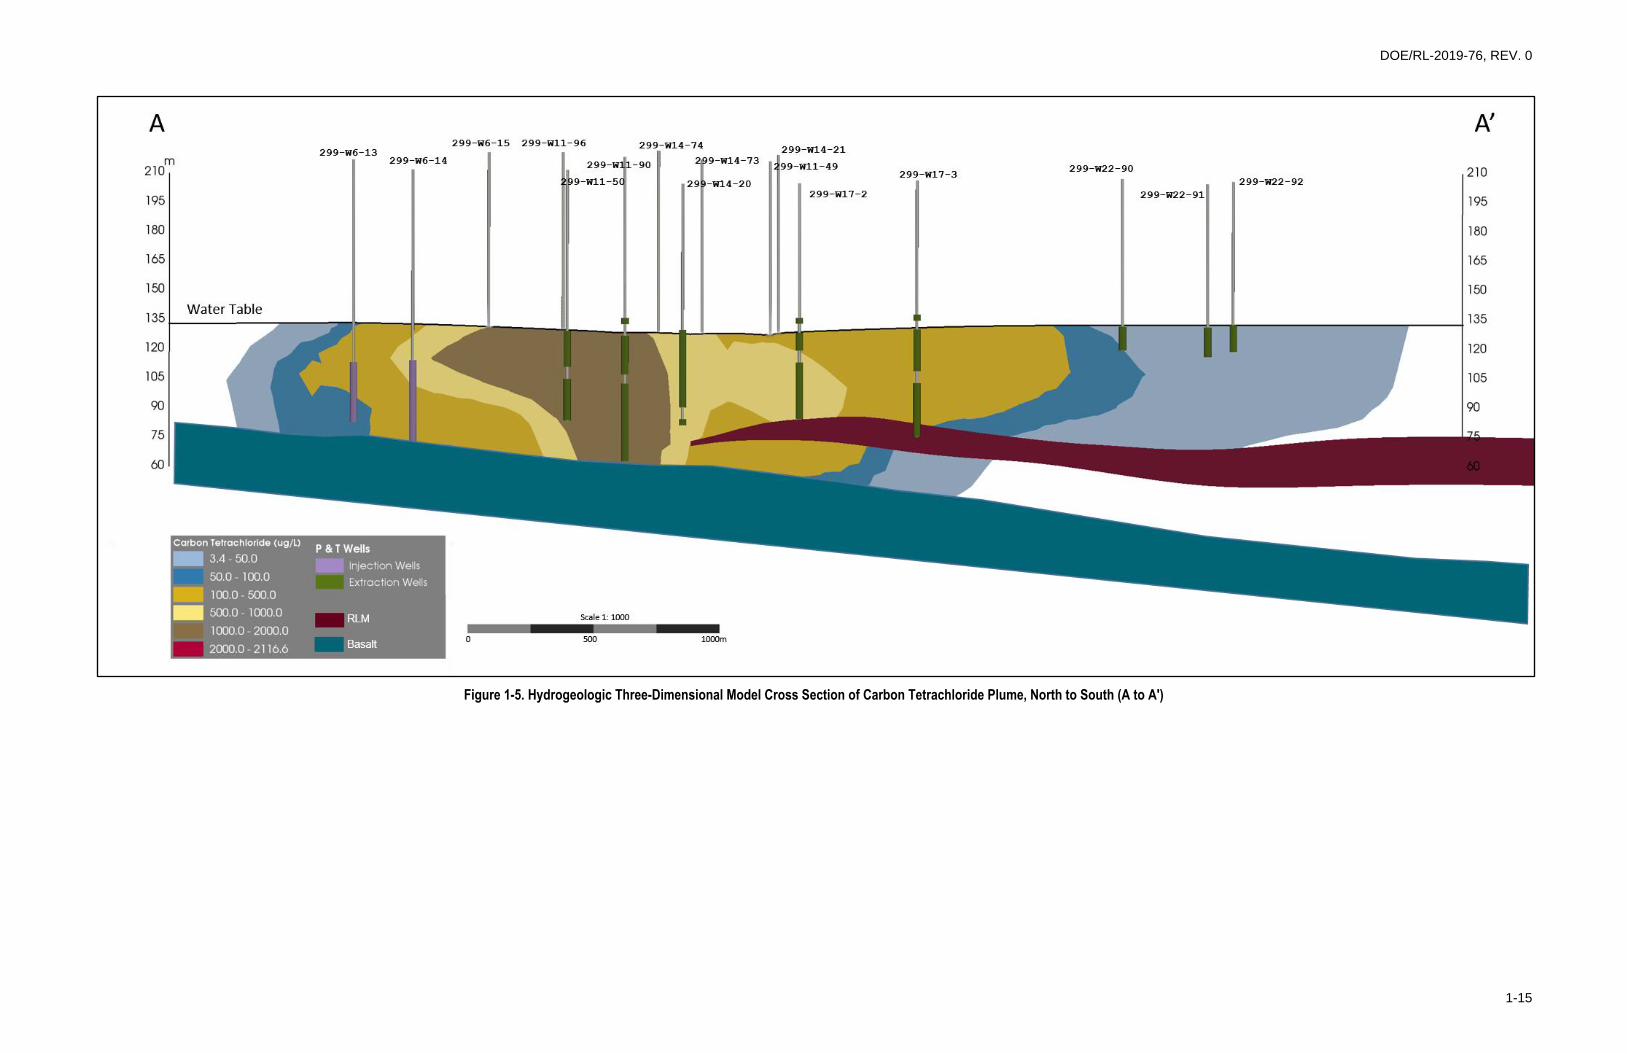
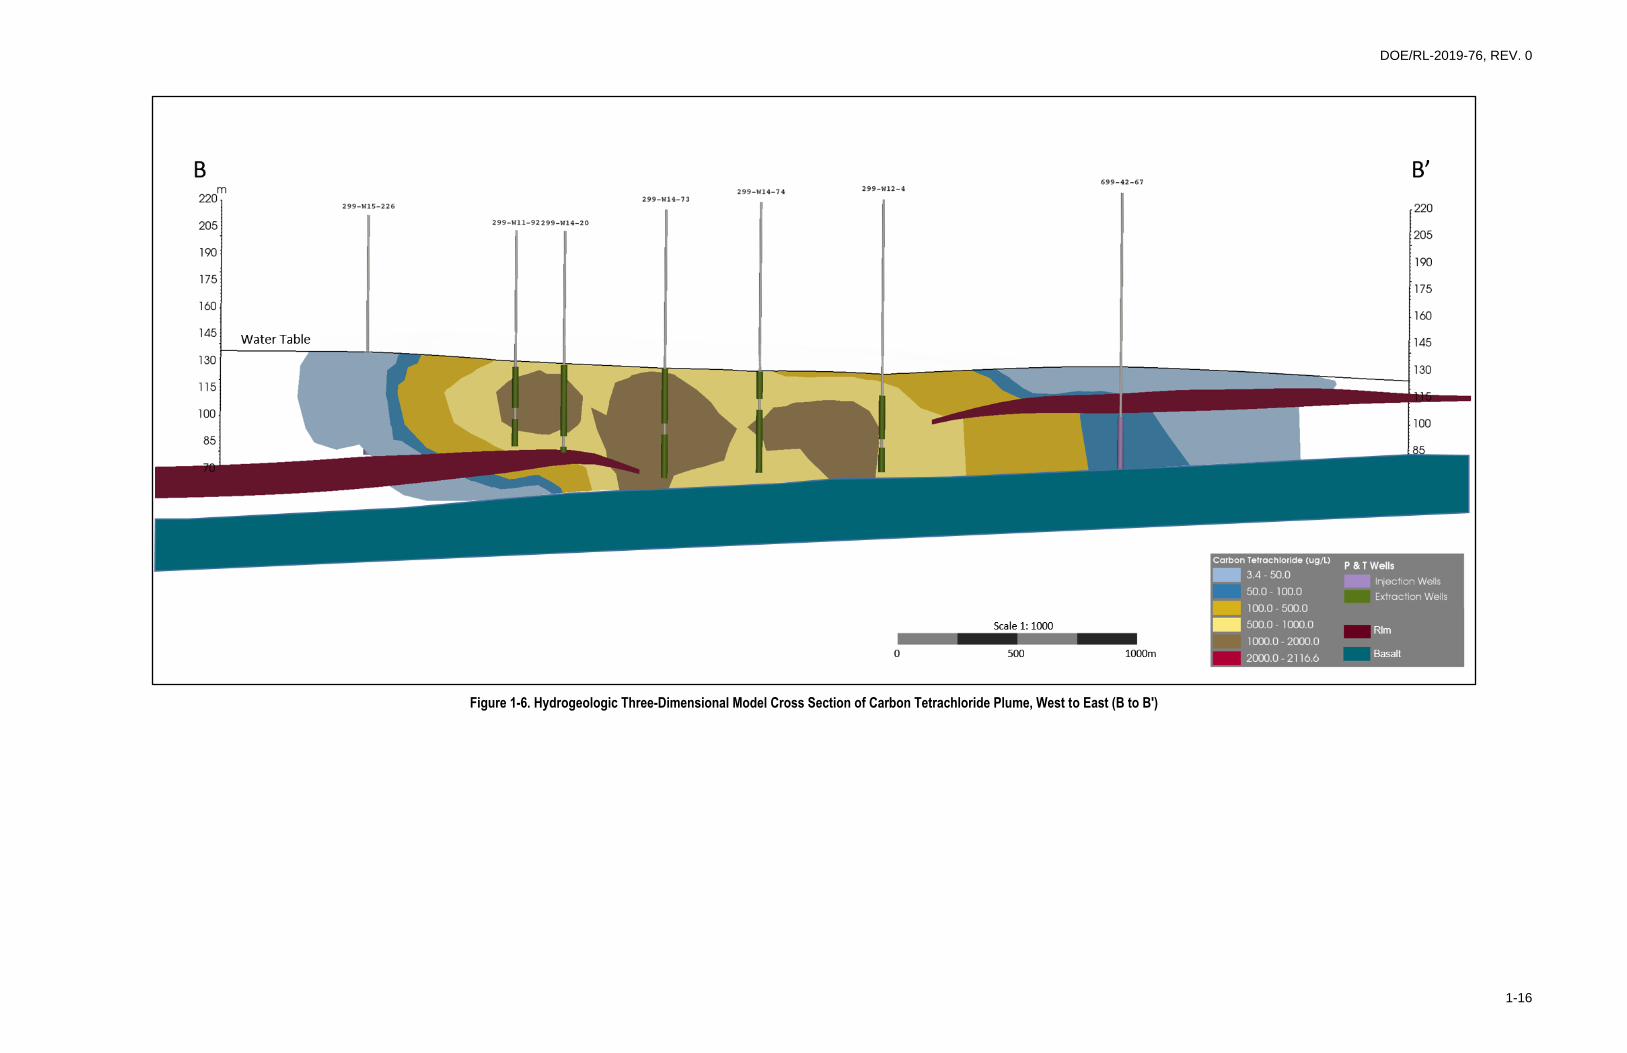
Figure 1-4 shows the footprint of the carbon tetrachloride plume in planar view. Figures 1-5 and 1-6 show
cross sections focused on the upper portion of the unconfined aquifer above the Rlm. However, moving
from west to east, the vertical extent of carbon tetrachloride increases in many places, and concentrations
exceeding the cleanup levels specified in the 200-ZP-1 OU ROD (EPA et al., 2008) extend throughout the
entire aquifer thickness, including depths both above and below the Rlm (DOE/RL-2008-78, Rev. 1).
Groundwater sample data obtained following completion of the 200-ZP-1 OU FS (DOE/RL-2007-28)
indicate that carbon tetrachloride is present over a wider area and at concentrations more than two orders
of magnitude greater than the cleanup level (particularly in eastward locations) as compared to
interpretations of available data at the time of FS completion. In particular, data obtained from the
installation of the injection, extraction, and monitoring wells on the east side of the 200-ZP-1 OU
indicated that higher concentrations of carbon tetrachloride were present below the Rlm. Where it is
present, downward plume migration is typically limited by the relatively fine-grained Rlm, which is
interpreted as forming a hydraulic barrier to vertical groundwater flow. However, the Rlm is
discontinuous and relatively thin in places, which provided a pathway for the carbon tetrachloride plume
to migrate downward to the basalt bedrock in areas where the Rlm is not present. Improved knowledge of
the three-dimensional carbon tetrachloride extent suggests that a greater proportion of the total carbon
tetrachloride mass may reside at elevations beneath (and possibly within) the Rlm when compared to the
interpretations based on data available when the 200-ZP-1 OU FS was completed.
1-1
3
DO
E/R
L-2
019
-76
, RE
V. 0
Figure 1-4. Two-Dimensional Model Prediction of 200-ZP-1 OU Carbon Tetrachloride Plume

DOE/RL-2019-76, REV. 0
1-14
This page intentionally left blank.
DOE/RL-2019-76, REV. 0
1-15
Figure 1-5. Hydrogeologic Three-Dimensional Model Cross Section of Carbon Tetrachloride Plume, North to South (A to A′)
DOE/RL-2019-76, REV. 0
1-16
Figure 1-6. Hydrogeologic Three-Dimensional Model Cross Section of Carbon Tetrachloride Plume, West to East (B to B′)
DOE/RL-2019-76, REV. 0
1-17
1.3 Data Quality Objective Summary
The DQO process is a strategic planning approach used to define the criteria that a data collection design
should satisfy. This process is used to ensure that the type, quantity, and quality of the environmental data
used in decision making will be appropriate for the intended application. The DQOs for this SAP were
developed in accordance with EPA/240/B-06/001, Guidance on Systematic Planning Using the Data
Quality Objectives Process (EPA QA/G-4). The DQO process involves a series of logical steps used to
plan for the resource-effective acquisition of environmental data. The performance and acceptance criteria
are determined through the DQO process, which serves as the basis for designing the plan to collect data
of sufficient quality and quantity to support project goals. Appendix A of this SAP presents the DQO
process used to support the sample design presented in this SAP.
This SAP identifies groundwater data collection efforts that support the 200-ZP-1 OU OSP
(DOE/RL-2019-38). Samples collected as part of this SAP will be used to support decisions related to
remedy performance and optimization in the Rwie. Sample analysis includes carbon tetrachloride and
anions (nitrate, nitrite, chloride, and sulfate) for all wells and biofouling indicators (total organic carbon,
manganese, and nickel) for select wells in the optimization study long-term groundwater monitoring
network. This section presents the key outputs resulting from the DQO process.
1.3.1 Statement of the Problem
Data and information obtained during the first 6 years of P&T remedy implementation in the
200-ZP-1 OU suggest that conditions within the OU are less favorable for attaining RAOs and cleanup
levels for carbon tetrachloride within the timeframes identified in the 200-ZP-1 OU ROD
(EPA et al., 2008). The main factors contributing to these conditions include an order of magnitude
slower abiotic degradation rate and a larger extent and mass of carbon tetrachloride relative to the
assumptions used in the 200-ZP-1 OU FS (DOE/RL-2007-28). In addition, most nitrate in groundwater is
currently present at concentrations less than an order of magnitude above the cleanup level. Considering
current nitrate concentration trends and assuming there is no continuing source of nitrate, sufficient nitrate
may have already been removed from the aquifer to enable a transition to the MNA phase of the remedy
that will still allow the nitrate cleanup level to be reached within the timeframe specified in the
200-ZP-1 OU ROD (EPA et al., 2008). As a result, data are needed to provide a technical basis showing
optimization of the 200-ZP-1 OU P&T remedy performance that increases carbon tetrachloride treatment
capacity and accelerates mass removal, achieving the cleanup levels. In addition, biofouling parameter
data are required to evaluate whether continued disinfection of injection wells is warranted.
A significant amount of nitrate in the 200-ZP-1 OU (2,186,276 kg) (SGW-64504-VA, 200 West Pump
and Treat Facility – 4th Quarter CY2019 Briefing) has been extracted and treated by the P&T system
since the beginning of remedy operations, and the nitrate plume may have been sufficiently diminished
such that active nitrate treatment is no longer needed to meet the RAOs identified in the 200-ZP-1 OU
ROD (EPA et al., 2008). Therefore, an evaluation of suspending the active biological treatment
component of the 200 West P&T and transitioning to MNA for nitrate is warranted and additional anion
data, including nitrate, are required.
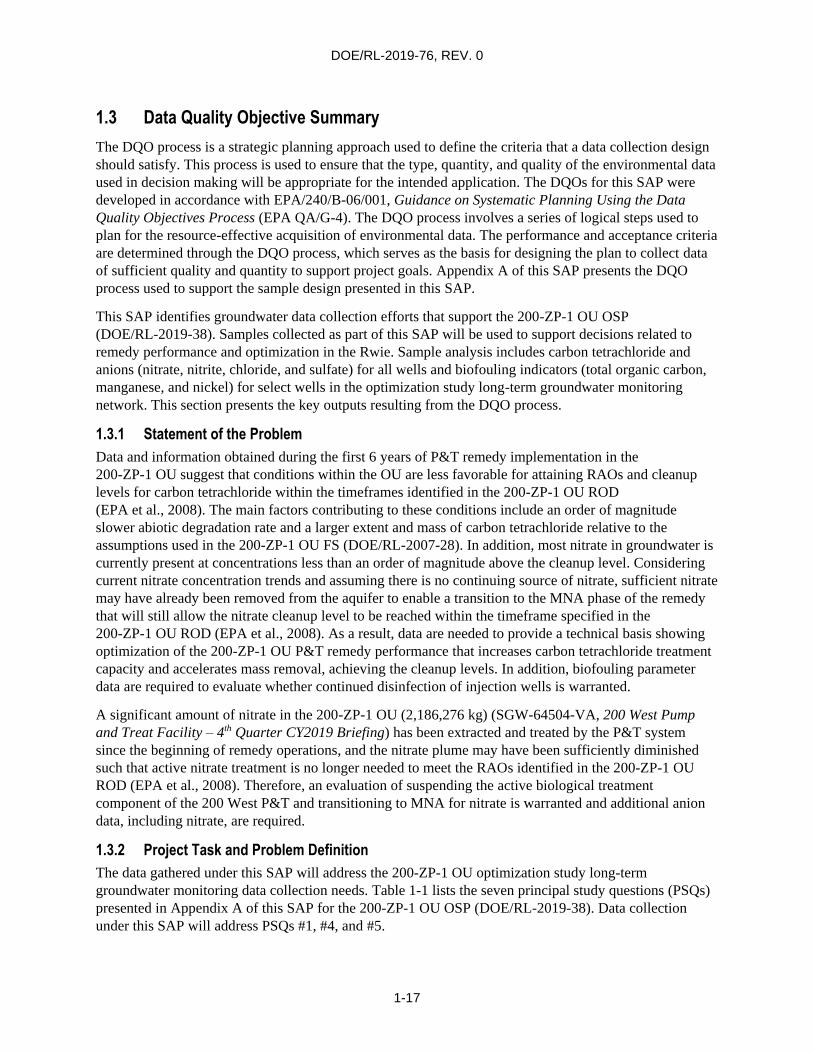
1.3.2 Project Task and Problem Definition
The data gathered under this SAP will address the 200-ZP-1 OU optimization study long-term
groundwater monitoring data collection needs. Table 1-1 lists the seven principal study questions (PSQs)
presented in Appendix A of this SAP for the 200-ZP-1 OU OSP (DOE/RL-2019-38). Data collection
under this SAP will address PSQs #1, #4, and #5.
DOE/RL-2019-76, REV. 0
1-18
Table 1-1. Principal Study Questions
PSQ # Principal Study Question
Data Collection
Addressed in
This SAP?
1
Can a technical basis be prepared showing a desired carbon tetrachloride mass removal
rate along with associated plume area and concentration reductions under the
optimization study configurations using existing data collection strategies
(DOE/RL-2009-115; DOE/RL-2009-124)?
Yes
2
Can a technical basis be prepared that sufficiently evaluates the effectiveness of carbon
tetrachloride plume containment under the optimization study configurations using
existing data collection strategies (DOE/RL-2009-115; DOE/RL-2009-124)?
No
3
Can a technical basis be prepared that sufficiently evaluates injection well
performance (e.g., specific injection capacity) under the optimization study
configurations when compared to pre‑optimization study performance?
No
4
Can a technical basis be prepared that compares anticipated remedy performance for
carbon tetrachloride under the optimization study configurations with predicted
pre-optimization study performance?
Yes
5
Can a technical basis be prepared showing nitrate plume behavior under the
optimization study configurations to confirm that transition to MNA is appropriate
for nitrate?
Yes
6 Can a technical basis be prepared that confirms treated effluent quality meets injection
criteria (except for nitrate)? ? No
7
Can a technical basis be prepared that predicts whether RAOs are expected to be
achieved for all COCs under the optimization study configurations within the
timeframe of the 200‑ZP‑1 OU ROD (EPA et al., 2008) ?
No
References:
DOE/RL-2009-115, Performance Monitoring Plan for the 200-ZP-1 Groundwater Operable Unit Remedial Action.
DOE/RL-2009-124, 200 West Pump and Treat Operations and Maintenance Plan.
EPA et al., 2008, Record of Decision Hanford 200 Area 200-ZP-1 Superfund Site, Benton County, Washington.
Note: Data collection under this SAP will address only PSQs #1, #4, and #5. Data collection for PSQ’s #2, #3, #6 and #7 are
referenced in Appendix A of this SAP.
COC = contaminant of concern
MNA = monitored natural attenuation
OU = operable unit
PSQ = principal study question
RAO = remedial action objective
ROD = Record of Decision
SAP = sampling and analysis plan
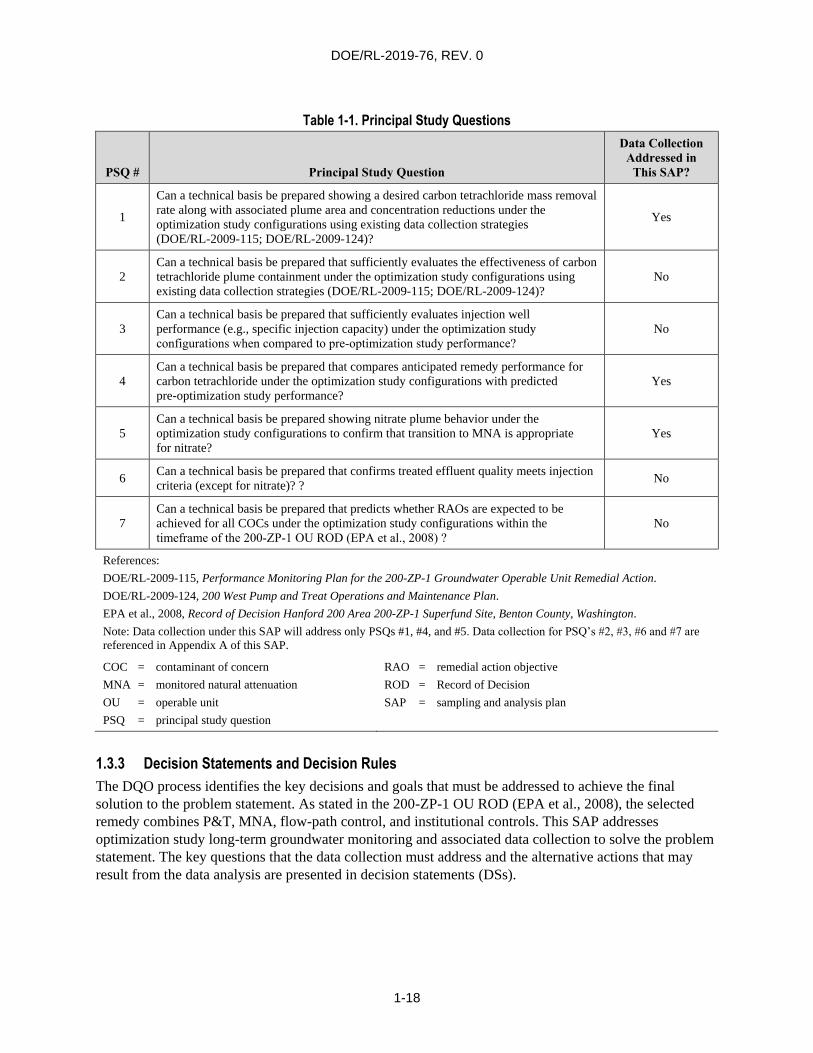
1.3.3 Decision Statements and Decision Rules
The DQO process identifies the key decisions and goals that must be addressed to achieve the final
solution to the problem statement. As stated in the 200-ZP-1 OU ROD (EPA et al., 2008), the selected
remedy combines P&T, MNA, flow-path control, and institutional controls. This SAP addresses
optimization study long-term groundwater monitoring and associated data collection to solve the problem
statement. The key questions that the data collection must address and the alternative actions that may
result from the data analysis are presented in decision statements (DSs).
DOE/RL-2019-76, REV. 0
1-19
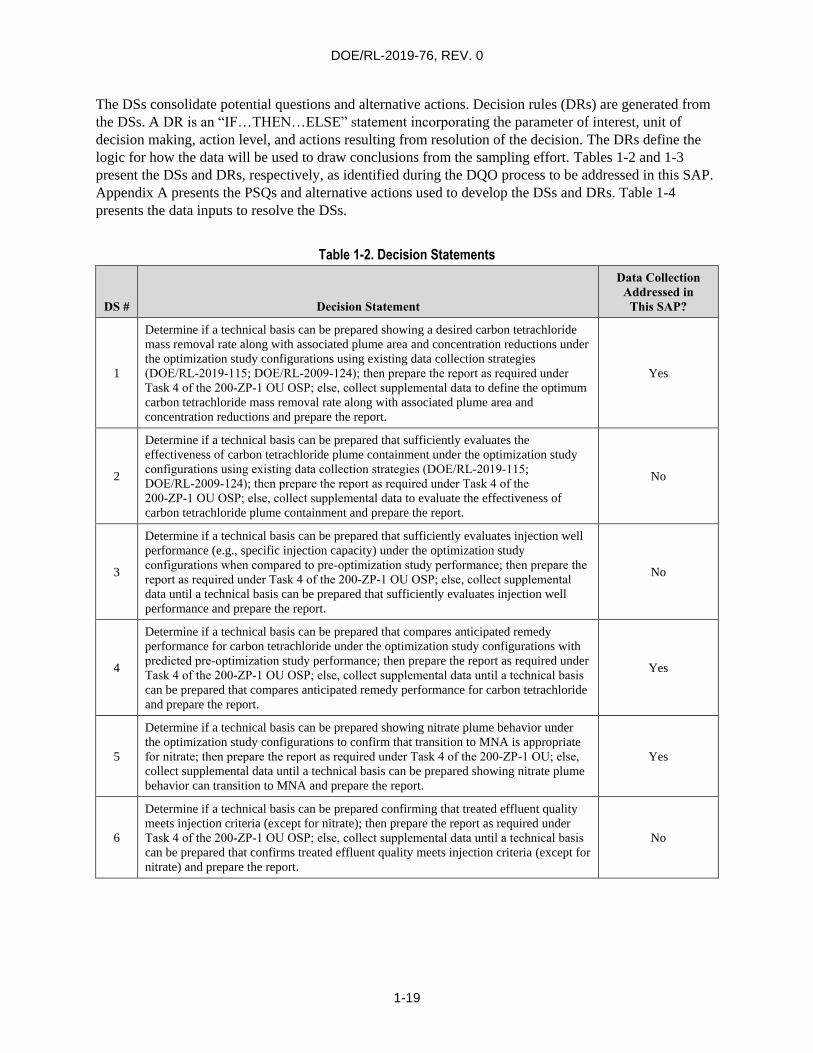
The DSs consolidate potential questions and alternative actions. Decision rules (DRs) are generated from
the DSs. A DR is an “IF…THEN…ELSE” statement incorporating the parameter of interest, unit of
decision making, action level, and actions resulting from resolution of the decision. The DRs define the
logic for how the data will be used to draw conclusions from the sampling effort. Tables 1-2 and 1-3
present the DSs and DRs, respectively, as identified during the DQO process to be addressed in this SAP.
Appendix A presents the PSQs and alternative actions used to develop the DSs and DRs. Table 1-4
presents the data inputs to resolve the DSs.
Table 1-2. Decision Statements
DS # Decision Statement
Data Collection
Addressed in
This SAP?
1
Determine if a technical basis can be prepared showing a desired carbon tetrachloride
mass removal rate along with associated plume area and concentration reductions under
the optimization study configurations using existing data collection strategies
(DOE/RL‑2019‑115; DOE/RL‑2009‑124); then prepare the report as required under
Task 4 of the 200‑ZP‑1 OU OSP; else, collect supplemental data to define the optimum
carbon tetrachloride mass removal rate along with associated plume area and
concentration reductions and prepare the report.
Yes
2
Determine if a technical basis can be prepared that sufficiently evaluates the
effectiveness of carbon tetrachloride plume containment under the optimization study
configurations using existing data collection strategies (DOE/RL‑2019‑115;
DOE/RL‑2009‑124); then prepare the report as required under Task 4 of the
200‑ZP‑1 OU OSP; else, collect supplemental data to evaluate the effectiveness of
carbon tetrachloride plume containment and prepare the report.
No
3
Determine if a technical basis can be prepared that sufficiently evaluates injection well
performance (e.g., specific injection capacity) under the optimization study
configurations when compared to pre‑optimization study performance; then prepare the
report as required under Task 4 of the 200‑ZP‑1 OU OSP; else, collect supplemental
data until a technical basis can be prepared that sufficiently evaluates injection well
performance and prepare the report.
No
4
Determine if a technical basis can be prepared that compares anticipated remedy
performance for carbon tetrachloride under the optimization study configurations with
predicted pre‑optimization study performance; then prepare the report as required under
Task 4 of the 200‑ZP‑1 OU OSP; else, collect supplemental data until a technical basis
can be prepared that compares anticipated remedy performance for carbon tetrachloride
and prepare the report.
Yes
5
Determine if a technical basis can be prepared showing nitrate plume behavior under
the optimization study configurations to confirm that transition to MNA is appropriate
for nitrate; then prepare the report as required under Task 4 of the 200‑ZP‑1 OU; else,
collect supplemental data until a technical basis can be prepared showing nitrate plume
behavior can transition to MNA and prepare the report.
Yes
6
Determine if a technical basis can be prepared confirming that treated effluent quality
meets injection criteria (except for nitrate); then prepare the report as required under
Task 4 of the 200‑ZP‑1 OU OSP; else, collect supplemental data until a technical basis
can be prepared that confirms treated effluent quality meets injection criteria (except for
nitrate) and prepare the report.
No
DOE/RL-2019-76, REV. 0
1-20
Table 1-2. Decision Statements
DS # Decision Statement
Data Collection
Addressed in
This SAP?
7
Determine if a technical basis can be prepared that predicts whether RAOs are expected
to be achieved for all of the COCs under the optimization study configurations within
the timeframe of the 200‑ZP‑1 OU ROD (EPA et al., 2008); then prepare the report as
required under Task 4 of the 200‑ZP‑1 OU OSP; else, collect supplemental data until
a technical basis can be prepared that predicts whether RAOs are expected to be
achieved for all COCs and prepare the report.
No
References:
DOE/RL-2009-115, Performance Monitoring Plan for the 200-ZP-1 Groundwater Operable Unit Remedial Action.
DOE/RL-2009-124, 200 West Pump and Treat Operations and Maintenance Plan.
EPA et al., 2008, Record of Decision Hanford 200 Area 200-ZP-1 Superfund Site, Benton County, Washington.
COC = contaminant of concern
DS = decision statement
MNA = monitored natural attenuation
OSP = optimization study plan
OU = operable unit
RAO = remedial action objective
ROD = Record of Decision
SAP = sampling and analysis plan
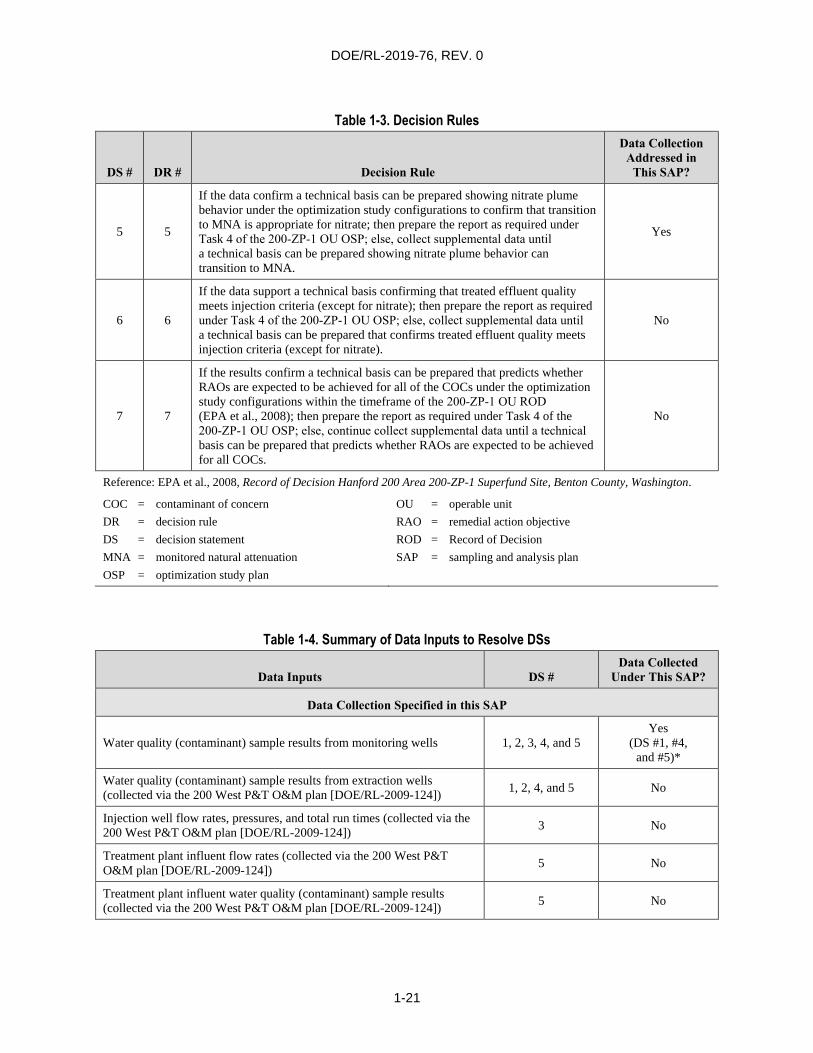
Table 1-3. Decision Rules
DS # DR # Decision Rule
Data Collection
Addressed in
This SAP?
1 1
If the data confirm the desired carbon tetrachloride mass removal rate along
with associated plume area and concentration reductions are achieved under
the optimization study configurations; then prepare the report as required
under Task 4 of the 200‑ZP‑1 OU OSP; else, collect supplemental data until
a technical basis can define the optimum carbon tetrachloride mass removal
rate along with associated plume area and concentration reductions.
Yes
2 2
If the data confirm a technical basis can be prepared that sufficiently evaluates
the effectiveness of carbon tetrachloride plume containment under the
optimization study configurations; then prepare the report as required under
Task 4 of the 200‑ZP‑1 OU OSP; else, collect supplemental data until
a technical basis can be prepared that sufficiently evaluates the effectiveness
of carbon tetrachloride plume containment.
No
3 3
If the data confirm a technical basis can be prepared that sufficiently evaluates
injection well performance (e.g., specific injection capacity) under the
optimization study configurations when compared to pre‑optimization study
performance; then prepare the report as required under Task 4 of the
200‑ZP‑1 OU OSP; else, collect supplemental data until a technical basis can
prepared that sufficiently evaluates injection well performance.
No
4 4
If the data confirm a technical basis can be prepared that compares anticipated
remedy performance for carbon tetrachloride under the optimization study
configurations with predicted pre‑optimization study performance; then
prepare the report as required under Task 4 of the 200‑ZP‑1 OU OSP; else,
collect supplemental data until a technical basis can be prepared that compares
anticipated remedy performance for carbon tetrachloride.
Yes
DOE/RL-2019-76, REV. 0
1-21
Table 1-3. Decision Rules
DS # DR # Decision Rule
Data Collection
Addressed in
This SAP?
5 5
If the data confirm a technical basis can be prepared showing nitrate plume
behavior under the optimization study configurations to confirm that transition
to MNA is appropriate for nitrate; then prepare the report as required under
Task 4 of the 200‑ZP‑1 OU OSP; else, collect supplemental data until
a technical basis can be prepared showing nitrate plume behavior can
transition to MNA.
Yes
6 6
If the data support a technical basis confirming that treated effluent quality
meets injection criteria (except for nitrate); then prepare the report as required
under Task 4 of the 200‑ZP‑1 OU OSP; else, collect supplemental data until
a technical basis can be prepared that confirms treated effluent quality meets
injection criteria (except for nitrate).
No
7 7
If the results confirm a technical basis can be prepared that predicts whether
RAOs are expected to be achieved for all of the COCs under the optimization
study configurations within the timeframe of the 200‑ZP‑1 OU ROD
(EPA et al., 2008); then prepare the report as required under Task 4 of the
200‑ZP‑1 OU OSP; else, continue collect supplemental data until a technical
basis can be prepared that predicts whether RAOs are expected to be achieved
for all COCs.
No
Reference: EPA et al., 2008, Record of Decision Hanford 200 Area 200-ZP-1 Superfund Site, Benton County, Washington.
COC = contaminant of concern
DR = decision rule
DS = decision statement
MNA = monitored natural attenuation
OSP = optimization study plan
OU = operable unit
RAO = remedial action objective
ROD = Record of Decision
SAP = sampling and analysis plan
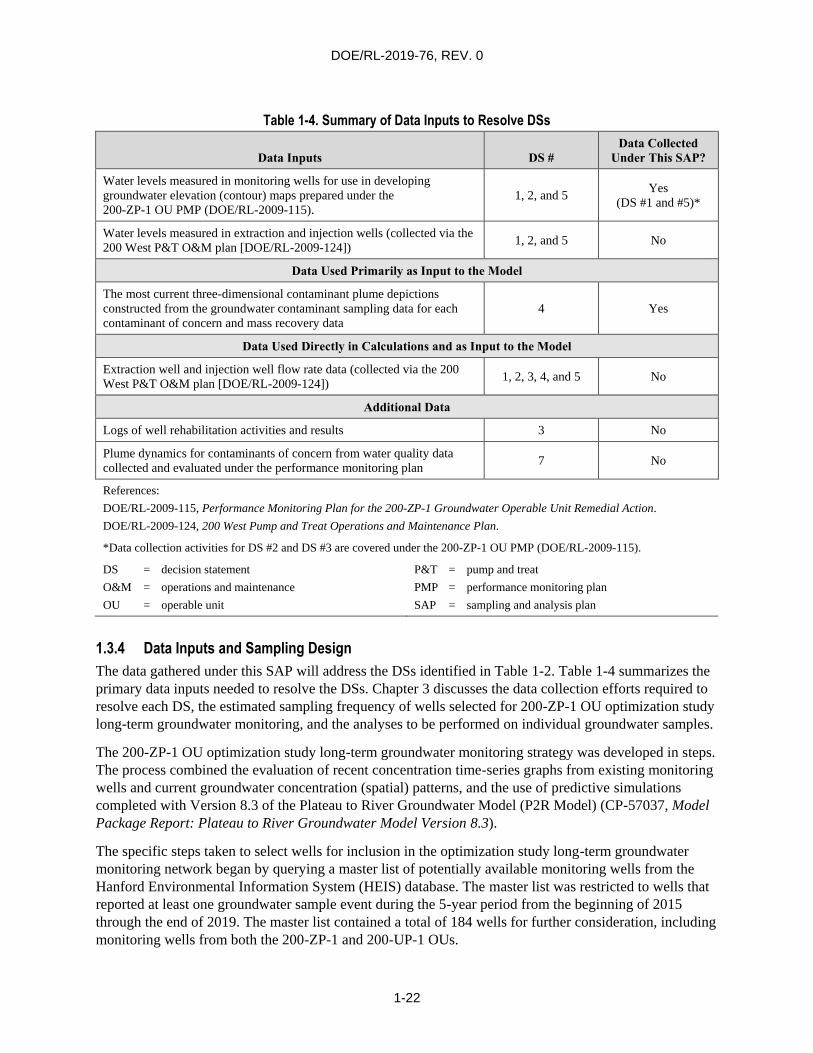
Table 1-4. Summary of Data Inputs to Resolve DSs
Data Inputs DS #
Data Collected
Under This SAP?
Data Collection Specified in this SAP
Water quality (contaminant) sample results from monitoring wells 1, 2, 3, 4, and 5
Yes
(DS #1, #4,
and #5)*
Water quality (contaminant) sample results from extraction wells
(collected via the 200 West P&T O&M plan [DOE/RL-2009-124]) 1, 2, 4, and 5 No
Injection well flow rates, pressures, and total run times (collected via the
200 West P&T O&M plan [DOE/RL-2009-124]) 3 No
Treatment plant influent flow rates (collected via the 200 West P&T
O&M plan [DOE/RL-2009-124]) 5 No
Treatment plant influent water quality (contaminant) sample results
(collected via the 200 West P&T O&M plan [DOE/RL-2009-124]) 5 No
DOE/RL-2019-76, REV. 0
1-22
Table 1-4. Summary of Data Inputs to Resolve DSs
Data Inputs DS #
Data Collected
Under This SAP?
Water levels measured in monitoring wells for use in developing
groundwater elevation (contour) maps prepared under the
200-ZP-1 OU PMP (DOE/RL-2009-115).
1, 2, and 5 Yes
(DS #1 and #5)*
Water levels measured in extraction and injection wells (collected via the
200 West P&T O&M plan [DOE/RL-2009-124]) 1, 2, and 5 No
Data Used Primarily as Input to the Model
The most current three-dimensional contaminant plume depictions
constructed from the groundwater contaminant sampling data for each
contaminant of concern and mass recovery data
4 Yes
Data Used Directly in Calculations and as Input to the Model
Extraction well and injection well flow rate data (collected via the 200
West P&T O&M plan [DOE/RL-2009-124]) 1, 2, 3, 4, and 5 No
Additional Data
Logs of well rehabilitation activities and results 3 No
Plume dynamics for contaminants of concern from water quality data
collected and evaluated under the performance monitoring plan 7 No
References:
DOE/RL-2009-115, Performance Monitoring Plan for the 200-ZP-1 Groundwater Operable Unit Remedial Action.
DOE/RL-2009-124, 200 West Pump and Treat Operations and Maintenance Plan.
*Data collection activities for DS #2 and DS #3 are covered under the 200-ZP-1 OU PMP (DOE/RL-2009-115).
DS = decision statement
O&M = operations and maintenance
OU = operable unit
P&T = pump and treat
PMP = performance monitoring plan
SAP = sampling and analysis plan
1.3.4 Data Inputs and Sampling Design
The data gathered under this SAP will address the DSs identified in Table 1-2. Table 1-4 summarizes the
primary data inputs needed to resolve the DSs. Chapter 3 discusses the data collection efforts required to
resolve each DS, the estimated sampling frequency of wells selected for 200-ZP-1 OU optimization study
long-term groundwater monitoring, and the analyses to be performed on individual groundwater samples.
The 200-ZP-1 OU optimization study long-term groundwater monitoring strategy was developed in steps.
The process combined the evaluation of recent concentration time-series graphs from existing monitoring
wells and current groundwater concentration (spatial) patterns, and the use of predictive simulations
completed with Version 8.3 of the Plateau to River Groundwater Model (P2R Model) (CP-57037, Model
Package Report: Plateau to River Groundwater Model Version 8.3).
The specific steps taken to select wells for inclusion in the optimization study long-term groundwater
monitoring network began by querying a master list of potentially available monitoring wells from the
Hanford Environmental Information System (HEIS) database. The master list was restricted to wells that
reported at least one groundwater sample event during the 5-year period from the beginning of 2015
through the end of 2019. The master list contained a total of 184 wells for further consideration, including
monitoring wells from both the 200-ZP-1 and 200-UP-1 OUs.

DOE/RL-2019-76, REV. 0
1-23
The master list was then reduced based on the locations of wells relative to each other, to the main area of
interest, and with regard to the availability of well as-built screen intervals. The review and reduction
were completed by a group of 200-ZP-1 OU subject matter experts as follows:
All monitoring wells located outside the area of interest were removed from the list.
Areas where several monitoring wells on the list were relatively closely spaced (clustered) were
further evaluated. Recent sampling frequency was taken into consideration, with priority for selection
given to a well currently sampled more frequently than other wells within the cluster and screened at
the appropriate depth. Wells that would likely provide redundant information (when considering their
proximity to each other and to injection and extraction wells) were removed from the list.
Wells without confirmed or confirmable as-built screen information were removed from the list.
This review reduced the initial master list of 184 monitoring wells to the 93 monitoring wells included in
the optimization study long-term monitoring well network shown in Figure 1-2. Table 1-5 lists the
200-ZP-1 OU optimization study long-term monitoring well network and the DSs to be addressed by the
data from each well. Each new well installed in proximity of the 200-ZP-1 OU during the optimization
study timeframe will be evaluated for inclusion in the study.
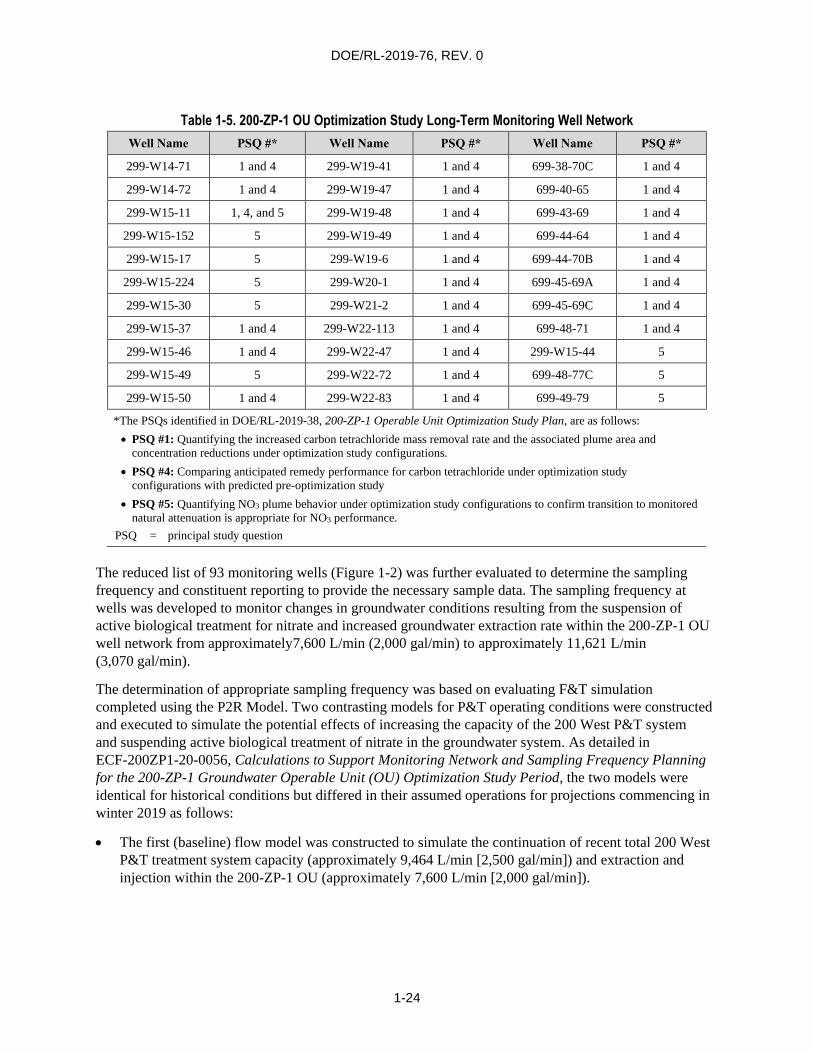
Table 1-5. 200-ZP-1 OU Optimization Study Long-Term Monitoring Well Network
Well Name PSQ #* Well Name PSQ #* Well Name PSQ #*
299-W10-1 1 and 4 299-W15-763 1 and 4 299-W22-86 1 and 4
299-W10-14 5 299-W15-765 1 and 4 299-W22-87 1 and 4
299-W10-27 1 and 4 299-W15-83 1 and 4 299-W22-88 1 and 4
299-W10-29 5 299-W15-94 1 and 4 299-W22-94 1 and 4
299-W10-30 5 299-W18-1 5 299-W22-95 1 and 4
299-W10-31 5 299-W18-16 5 299-W23-19 1 and 4
299-W11-18 1, 4, and 5 299-W18-21 5 299-W23-21 1 and 4
299-W11-33Q 1, 4, and 5 299-W18-22 5 299-W5-2P 1 and 4
299-W11-43 1 and 4 299-W18-40 5 299-W5-2Q 1 and 4
299-W11-45 1 and 4 299-W19-105 1 and 4 299-W6-11 5
299-W11-47 1 and 4 299-W19-107 1 and 4 299-W6-12 5
299-W11-48 1 and 4 299-W19-115 1 and 4 299-W6-17 1, 4, and 5
299-W11-87 1 and 4 299-W19-116 1 and 4 299-W6-3 5
299-W11-88 1 and 4 299-W19-123 1 and 4 299-W6-6 5
299-W13-1 1 and 4 299-W19-126 1 and 4 299-W7-3 5
299-W13-2P 1 and 4 299-W19-131 1 and 4 699-36-61A 5
299-W13-2Q 1 and 4 299-W19-34A 1 and 4 699-36-70B 1 and 4
299-W14-11 1 and 4 299-W19-34B 1 and 4 699-38-61 5
299-W14-14 1 and 4 299-W19-36 1 and 4 699-38-68A 1 and 4
299-W14-17 1 and 4 299-W19-4 1 and 4 699-38-70B 1 and 4
DOE/RL-2019-76, REV. 0
1-24
Table 1-5. 200-ZP-1 OU Optimization Study Long-Term Monitoring Well Network
Well Name PSQ #* Well Name PSQ #* Well Name PSQ #*
299-W14-71 1 and 4 299-W19-41 1 and 4 699-38-70C 1 and 4
299-W14-72 1 and 4 299-W19-47 1 and 4 699-40-65 1 and 4
299-W15-11 1, 4, and 5 299-W19-48 1 and 4 699-43-69 1 and 4
299-W15-152 5 299-W19-49 1 and 4 699-44-64 1 and 4
299-W15-17 5 299-W19-6 1 and 4 699-44-70B 1 and 4
299-W15-224 5 299-W20-1 1 and 4 699-45-69A 1 and 4
299-W15-30 5 299-W21-2 1 and 4 699-45-69C 1 and 4
299-W15-37 1 and 4 299-W22-113 1 and 4 699-48-71 1 and 4
299-W15-46 1 and 4 299-W22-47 1 and 4 299-W15-44 5
299-W15-49 5 299-W22-72 1 and 4 699-48-77C 5
299-W15-50 1 and 4 299-W22-83 1 and 4 699-49-79 5
*The PSQs identified in DOE/RL-2019-38, 200-ZP-1 Operable Unit Optimization Study Plan, are as follows:
PSQ #1: Quantifying the increased carbon tetrachloride mass removal rate and the associated plume area and
concentration reductions under optimization study configurations.
PSQ #4: Comparing anticipated remedy performance for carbon tetrachloride under optimization study
configurations with predicted pre-optimization study
PSQ #5: Quantifying NO3 plume behavior under optimization study configurations to confirm transition to monitored
natural attenuation is appropriate for NO3 performance.
PSQ = principal study question
The reduced list of 93 monitoring wells (Figure 1-2) was further evaluated to determine the sampling
frequency and constituent reporting to provide the necessary sample data. The sampling frequency at
wells was developed to monitor changes in groundwater conditions resulting from the suspension of
active biological treatment for nitrate and increased groundwater extraction rate within the 200-ZP-1 OU
well network from approximately7,600 L/min (2,000 gal/min) to approximately 11,621 L/min
(3,070 gal/min).
The determination of appropriate sampling frequency was based on evaluating F&T simulation
completed using the P2R Model. Two contrasting models for P&T operating conditions were constructed
and executed to simulate the potential effects of increasing the capacity of the 200 West P&T system
and suspending active biological treatment of nitrate in the groundwater system. As detailed in
ECF-200ZP1-20-0056, Calculations to Support Monitoring Network and Sampling Frequency Planning
for the 200-ZP-1 Groundwater Operable Unit (OU) Optimization Study Period, the two models were
identical for historical conditions but differed in their assumed operations for projections commencing in
winter 2019 as follows:
The first (baseline) flow model was constructed to simulate the continuation of recent total 200 West
P&T treatment system capacity (approximately 9,464 L/min [2,500 gal/min]) and extraction and
injection within the 200-ZP-1 OU (approximately 7,600 L/min [2,000 gal/min]).
DOE/RL-2019-76, REV. 0
1-25
The second (expanded) flow model was constructed to simulate future operating conditions with an
increased 200 West P&T total overall system capacity of approximately 13,173 L/min
(3,480 gal/min), and increased extraction and injection within the 200-ZP-1 OU of approximately
11,621 L/min (3,070 gal/min) facilitated by the addition of 10 hypothetical extraction wells.
The flow model was then used to make two sets of transport simulations to evaluate the F&T of the water
injected at the injection wells once active biological treatment of nitrate was suspended. In the first
simulation, the potential migration of the injected water was evaluated using the “unit plume” transport
simulation approach. For this analysis, a unit concentration (i.e., C = 1.0) was used to represent water
injected at the 200-ZP-1 OU injection wells. As water migrates away from the injection wells, the effects
of mixing and dispersion within the aquifer are simulated. As a result of the mixing and dispersion over
time and throughout space, the simulated concentration in groundwater represents the fraction of the
original water (i.e., of the injected water) that is present (after mixing and other processes) from that
which was injected at the well.
For the second simulation, the flow model was executed and then used to simulate the F&T of both
nitrate and carbon tetrachloride for the period from 2015 through 2137 using initial conditions
(three-dimensional plumes) representing conditions during 2015 (ECF-200ZP1-20-0056) for
each constituent.
Post-processing of both sets of simulations focused on preparing time-series plots of concentrations for
the reduced list of 93 monitoring wells. The second set of simulations calculated the concentrations of
nitrate and carbon tetrachloride directly. Because the first set of simulations used a “unit plume”
approach, it was necessary to convert the unit concentrations into approximate concentrations of nitrate
and carbon tetrachloride. Time-series concentrations at each monitoring well were approximated from the
“unit plume” simulations using the following equation:
𝑈𝐵𝑊𝑡 × 𝐸𝑉𝑁𝑂3 + (1 − 𝑈𝐵𝑊𝑡) × �̅�
where:
UBW = unit concentration simulated at each monitoring wells
EVNO3 = concentration of nitrate in the untreated effluent, which was assumed to be
120,000 mg/L (as nitrate [NO3])
Ā = average of the last four nitrate sample concentrations at the corresponding
monitoring well.
The time-series plots were then evaluated to identify monitoring wells with the highest potential to
provide data for each individual PSQ (defined in Appendix A of this SAP). Specifically, the nitrate
time-series plots, which compared measured nitrate concentrations (simulated predicted concentrations
and estimated timing of substantial concentration changes), were used to evaluate the probable nitrate
plume behavior under the expanded capacity and absent nitrate active treatment. The carbon tetrachloride
time-series plots were used to compare anticipated remedy performance under the increased capacity with
predicted performance without increased capacity, as well as to identify wells for which measurable
changes in carbon tetrachloride concentration may result during the optimization study period.
1.4 Target Analytes
Target analytes were selected to address the DSs (Table 1-1) and specific data inputs associated with the
optimization study long-term groundwater monitoring (Table 1-3). Table 1-6 lists the target analytes and
purpose for inclusion.
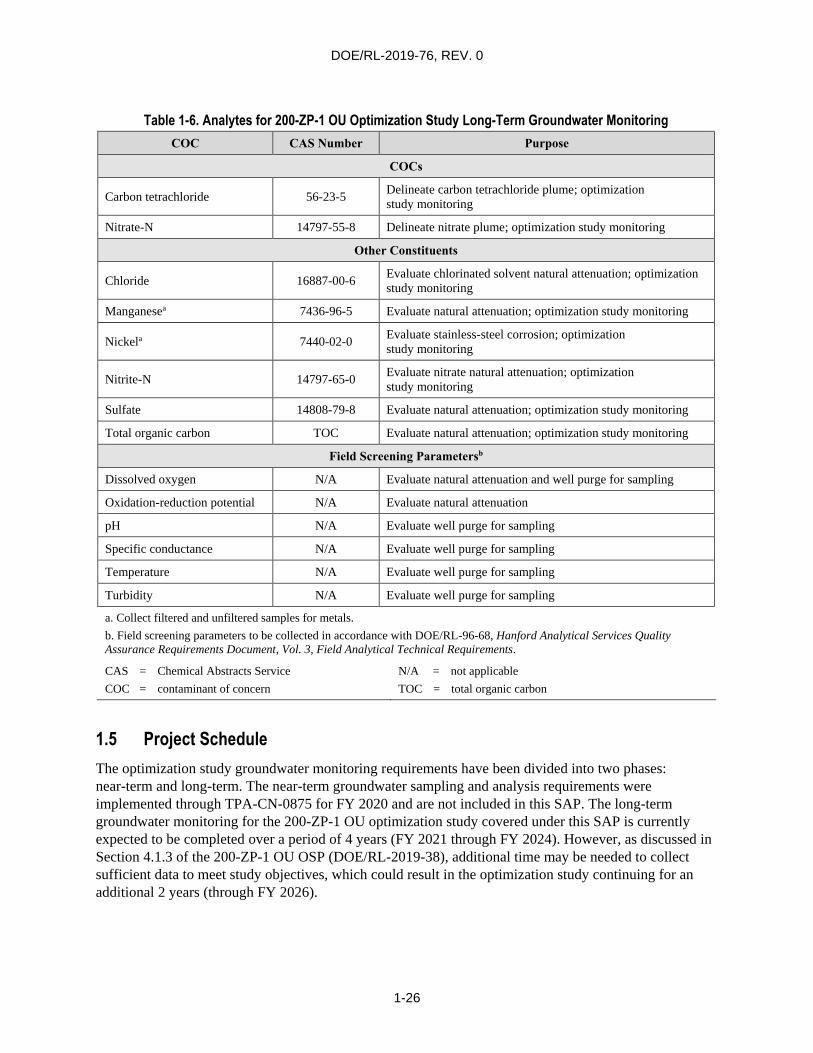
DOE/RL-2019-76, REV. 0
1-26
Table 1-6. Analytes for 200-ZP-1 OU Optimization Study Long-Term Groundwater Monitoring
COC CAS Number Purpose
COCs
Carbon tetrachloride 56-23-5 Delineate carbon tetrachloride plume; optimization
study monitoring
Nitrate-N 14797-55-8 Delineate nitrate plume; optimization study monitoring
Other Constituents
Chloride 16887-00-6 Evaluate chlorinated solvent natural attenuation; optimization
study monitoring
Manganesea 7436-96-5 Evaluate natural attenuation; optimization study monitoring
Nickela 7440-02-0 Evaluate stainless-steel corrosion; optimization
study monitoring
Nitrite-N 14797-65-0 Evaluate nitrate natural attenuation; optimization
study monitoring
Sulfate 14808-79-8 Evaluate natural attenuation; optimization study monitoring
Total organic carbon TOC Evaluate natural attenuation; optimization study monitoring
Field Screening Parametersb
Dissolved oxygen N/A Evaluate natural attenuation and well purge for sampling
Oxidation-reduction potential N/A Evaluate natural attenuation
pH N/A Evaluate well purge for sampling
Specific conductance N/A Evaluate well purge for sampling
Temperature N/A Evaluate well purge for sampling
Turbidity N/A Evaluate well purge for sampling
a. Collect filtered and unfiltered samples for metals.
b. Field screening parameters to be collected in accordance with DOE/RL-96-68, Hanford Analytical Services Quality
Assurance Requirements Document, Vol. 3, Field Analytical Technical Requirements.
CAS = Chemical Abstracts Service
COC = contaminant of concern
N/A = not applicable
TOC = total organic carbon
1.5 Project Schedule
The optimization study groundwater monitoring requirements have been divided into two phases:
near-term and long-term. The near-term groundwater sampling and analysis requirements were
implemented through TPA-CN-0875 for FY 2020 and are not included in this SAP. The long-term
groundwater monitoring for the 200-ZP-1 OU optimization study covered under this SAP is currently
expected to be completed over a period of 4 years (FY 2021 through FY 2024). However, as discussed in
Section 4.1.3 of the 200-ZP-1 OU OSP (DOE/RL-2019-38), additional time may be needed to collect
sufficient data to meet study objectives, which could result in the optimization study continuing for an
additional 2 years (through FY 2026).
DOE/RL-2019-76, REV. 0
2-1
2 Quality Assurance Project Plan
A quality assurance project plan (QAPjP) establishes the quality requirements for environmental data
collection. It includes planning, implementation, and assessment of sampling tasks, field measurements,
laboratory analysis, and data review. This chapter describes the applicable environmental data collection
requirements and controls based on the quality assurance (QA) elements found in EPA/240/B-01/003,
EPA Requirements for Quality Assurance Project Plans (EPA QA/R-5); and DOE/RL-96-68, Hanford
Analytical Services Quality Assurance Requirements Document (HASQARD). DoD/DOE, 2019,
Department of Defense (DoD) Department of Energy (DOE) Consolidated Quality Systems Manual
(QSM) for Environmental Laboratories (hereinafter referred to as the DoD/DOE Quality Systems Manual
[QSM]), is also discussed. Section 7.8 of the Hanford Federal Facility Agreement and Consent Order
Action Plan (Tri-Party Agreement Action Plan) (Ecology et al., 1989b) requires QA/quality control (QC)
and sampling and analysis activities to specify the QA requirements for past-practice processes. This
QAPjP also describes applicable requirements and controls based on guidance in Ecology Publication
No. 04-03-030, Guidelines for Preparing Quality Assurance Project Plans for Environmental Studies;
and EPA/240/R-02/009, Guidance for Quality Assurance Project Plans (EPA QA/G-5). This QAPjP
supplements the contractor’s environmental QA program plan.
This QAPjP includes the following sections that describe the quality requirements and controls applicable
to Hanford Site OU sampling activities:
Section 2.1, “Project Management”
Section 2.2, “Data Generation and Acquisition”
Section 2.3, “Assessment and Oversight”
Section 2.4, “Data Review and Usability”
2.1 Project Management
The section includes project goals, planned management approaches, and planned output documentation.
2.1.1 Project/Task Organization
The contractor or its approved subcontractor is responsible for planning, coordinating, sampling, and
shipping samples to the laboratory. The contractor is also responsible for preparing and maintaining
configuration control of the SAP and assisting the U.S. Department of Energy, Richland Operations
Office (DOE-RL) project manager in obtaining approval of the SAP and future proposed revisions to
the SAP. The project organization is described in the following sections and is shown in Figure 2-1.
2.1.1.1 Regulatory Lead
The lead regulatory agency for the 200-ZP-1 OU is EPA. The lead regulatory agency is responsible for
regulatory oversight of cleanup projects and activities. EPA retains approval authority for all SAPs.
EPA works with DOE-RL to resolve concerns regarding the work described in this SAP in accordance
with Ecology et al., 1989a, Hanford Federal Facility Agreement and Consent Order
(Tri-Party Agreement).
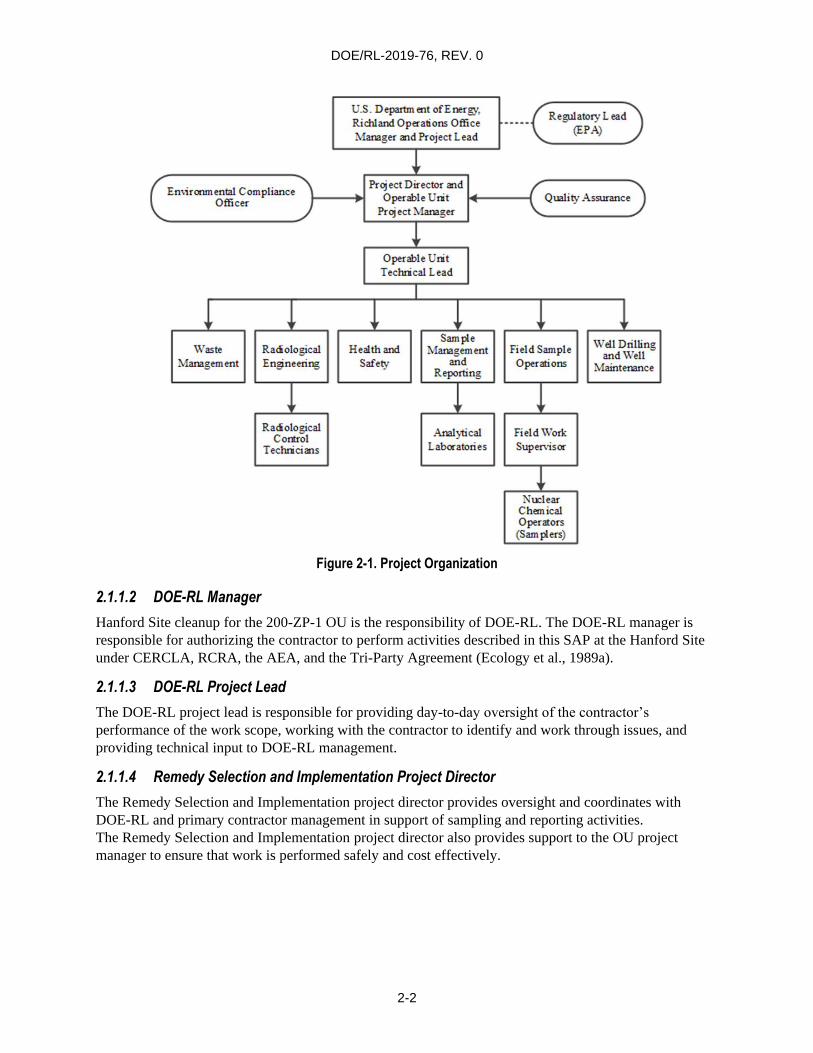
DOE/RL-2019-76, REV. 0
2-2
Figure 2-1. Project Organization
2.1.1.2 DOE-RL Manager
Hanford Site cleanup for the 200-ZP-1 OU is the responsibility of DOE-RL. The DOE-RL manager is
responsible for authorizing the contractor to perform activities described in this SAP at the Hanford Site
under CERCLA, RCRA, the AEA, and the Tri-Party Agreement (Ecology et al., 1989a).
2.1.1.3 DOE-RL Project Lead
The DOE-RL project lead is responsible for providing day-to-day oversight of the contractor’s
performance of the work scope, working with the contractor to identify and work through issues, and
providing technical input to DOE-RL management.
2.1.1.4 Remedy Selection and Implementation Project Director
The Remedy Selection and Implementation project director provides oversight and coordinates with
DOE-RL and primary contractor management in support of sampling and reporting activities.
The Remedy Selection and Implementation project director also provides support to the OU project
manager to ensure that work is performed safely and cost effectively.
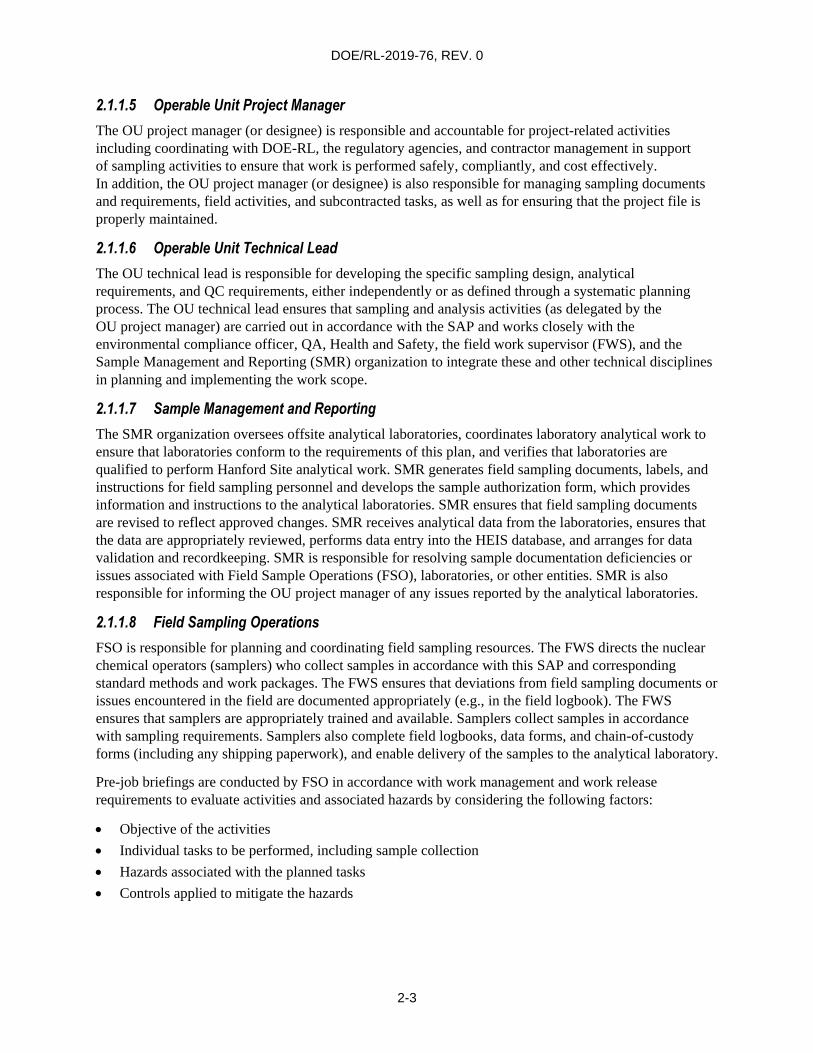
DOE/RL-2019-76, REV. 0
2-3
2.1.1.5 Operable Unit Project Manager
The OU project manager (or designee) is responsible and accountable for project-related activities
including coordinating with DOE-RL, the regulatory agencies, and contractor management in support
of sampling activities to ensure that work is performed safely, compliantly, and cost effectively.
In addition, the OU project manager (or designee) is also responsible for managing sampling documents
and requirements, field activities, and subcontracted tasks, as well as for ensuring that the project file is
properly maintained.
2.1.1.6 Operable Unit Technical Lead
The OU technical lead is responsible for developing the specific sampling design, analytical
requirements, and QC requirements, either independently or as defined through a systematic planning
process. The OU technical lead ensures that sampling and analysis activities (as delegated by the
OU project manager) are carried out in accordance with the SAP and works closely with the
environmental compliance officer, QA, Health and Safety, the field work supervisor (FWS), and the
Sample Management and Reporting (SMR) organization to integrate these and other technical disciplines
in planning and implementing the work scope.
2.1.1.7 Sample Management and Reporting
The SMR organization oversees offsite analytical laboratories, coordinates laboratory analytical work to
ensure that laboratories conform to the requirements of this plan, and verifies that laboratories are
qualified to perform Hanford Site analytical work. SMR generates field sampling documents, labels, and
instructions for field sampling personnel and develops the sample authorization form, which provides
information and instructions to the analytical laboratories. SMR ensures that field sampling documents
are revised to reflect approved changes. SMR receives analytical data from the laboratories, ensures that
the data are appropriately reviewed, performs data entry into the HEIS database, and arranges for data
validation and recordkeeping. SMR is responsible for resolving sample documentation deficiencies or
issues associated with Field Sample Operations (FSO), laboratories, or other entities. SMR is also
responsible for informing the OU project manager of any issues reported by the analytical laboratories.
2.1.1.8 Field Sampling Operations
FSO is responsible for planning and coordinating field sampling resources. The FWS directs the nuclear
chemical operators (samplers) who collect samples in accordance with this SAP and corresponding
standard methods and work packages. The FWS ensures that deviations from field sampling documents or
issues encountered in the field are documented appropriately (e.g., in the field logbook). The FWS
ensures that samplers are appropriately trained and available. Samplers collect samples in accordance
with sampling requirements. Samplers also complete field logbooks, data forms, and chain-of-custody
forms (including any shipping paperwork), and enable delivery of the samples to the analytical laboratory.
Pre-job briefings are conducted by FSO in accordance with work management and work release
requirements to evaluate activities and associated hazards by considering the following factors:
Objective of the activities
Individual tasks to be performed, including sample collection
Hazards associated with the planned tasks
Controls applied to mitigate the hazards
DOE/RL-2019-76, REV. 0
2-4
Environment in which the job will be performed
Facility where the job will be performed
Equipment and materials required
2.1.1.9 Quality Assurance
The QA point of contact provides independent oversight and is responsible for addressing QA issues on
the project and overseeing implementation of the project QA requirements. Responsibilities include
reviewing project documents including the QAPjP and participating in QA assessments on sample
collection and analysis activities, as appropriate.
2.1.1.10 Environmental Compliance Officer
The environmental compliance officer provides technical oversight, direction, and acceptance of project
and subcontracted environmental work and develops appropriate mitigation measures with the goal of
minimizing adverse environmental impacts.
2.1.1.11 Health and Safety
The Health and Safety organization is responsible for coordinating industrial safety and health support
within the project as carried out through health and safety plans, job hazard analyses, and other pertinent
safety documents required by federal regulations or internal primary contractor work requirements.
2.1.1.12 Radiological Engineering
Radiological Engineering is responsible for the following:
Providing radiological engineering and project health physics support
Conducting as low as reasonably achievable reviews, exposure and release modeling, and
radiological controls optimization
Identifying radiological hazards and ensuring that appropriate controls are implemented to maintain
worker exposures to hazards at levels as low as reasonably achievable
Interfacing with the project Health and Safety representative and other appropriate personnel as
needed to plan and direct project radiological control technician (RCT) support.
2.1.1.13 Waste Management
Waste Management is responsible for identifying waste management sampling/characterization
requirements to ensure regulatory compliance and for interpreting data to determine waste designations
and profiles. Waste Management communicates policies and practices and ensures project compliance for
storage, transportation, disposal, and waste tracking in a safe and cost-effective manner.
2.1.1.14 Analytical Laboratories
The analytical laboratories accept, manage, prepare, and analyze samples in accordance with established
methods and the requirements of their subcontract, and provide necessary data packages containing
analytical and QC results. Laboratories provide explanations of results to support data review and in
response to resolution of analytical issues. Laboratory quality requirements are consistent with
HASQARD requirements (DOE/RL-96-68). The laboratories are evaluated under the DOE Consolidated
Audit–Accreditation Program (or its successor programs) to DoD/DOE (2019) QSM requirements.
The HASQARD requirements (beyond those within the DoD/DOE QSM) are also evaluated under the
DOE/RL-2019-76, REV. 0
2-5
DOE Consolidated Audit–Accreditation Program. Laboratories are accredited by the Washington State
Department of Ecology (Ecology) for the analyses performed under this SAP.
2.1.1.15 Well Drilling and Well Maintenance
The well drilling and maintenance manager and the well coordination and planning manager are
responsible for the following:
Planning, coordinating, and executing drilling construction
Performing well maintenance activities
Coordinating with the OU technical lead regarding field constraints that could affect sampling design
Coordinating well decommissioning with DOE-RL in accordance with the substantive standards of
WAC 173-160, “Minimum Standards for Construction and Maintenance of Wells”
2.1.2 Quality Objectives and Criteria
The QA objective of this plan is to ensure that the generation of analytical data of known and appropriate
quality is acceptable and useful in order to meet the evaluation requirements identified in this SAP.
Data descriptors known as data quality indicators (DQIs) help determine the acceptability and usefulness
of data to the user. The principal DQIs (precision, accuracy, representativeness, comparability,
completeness, bias, and sensitivity) are defined in Table 2-1 for the purposes of this SAP.
Data quality is defined by the degree of rigor in the acceptance criteria assigned to the DQIs.
The acceptance criteria are typically set by the analytical method itself; however, project-specific
requirements require more stringent acceptance criteria. Section 2.2.1 lists the project-specific acceptance
criteria. Applicable QC guidelines, DQI acceptance criteria, and levels of effort for assessing data
quality are dictated by the intended use of the data and the requirements of the analytical method.
The DQIs are evaluated during a process to assess data usability (Section 2.4.3).
2.1.3 Methods-Based Analysis
Laboratory testing for the analytes discussed in Sections 1.4 and 2.2.1 may include nontarget analytes that
are part of the analytical method (i.e., methods-based reporting). The additional constituents that are part
of the method and reported by the laboratory are for informational purposes. Analytical performance
requirements will be applicable only to the analytes specific to this SAP. Poor QC related to nontarget
analyte results would not result in any required corrective action by the laboratory, except for the
application of proper result qualification flags.
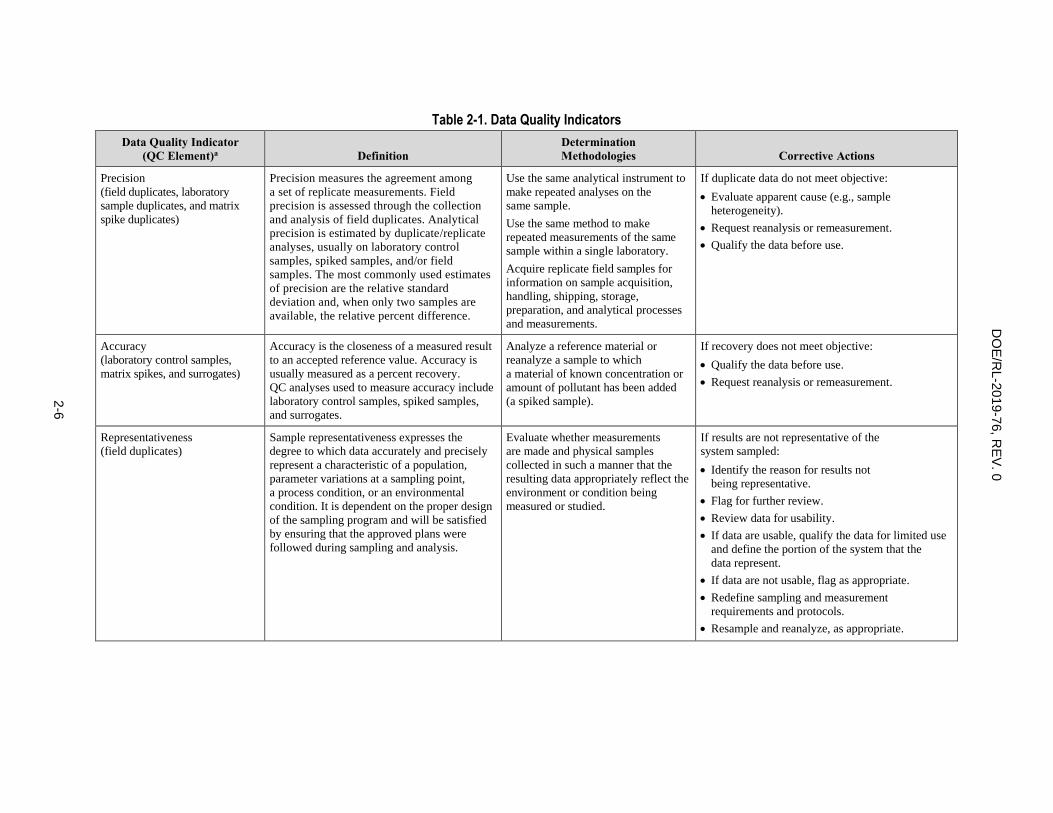
2-6
DO
E/R
L-2
019
-76
, RE
V. 0
Table 2-1. Data Quality Indicators
Data Quality Indicator
(QC Element)a Definition
Determination
Methodologies Corrective Actions
Precision
(field duplicates, laboratory
sample duplicates, and matrix
spike duplicates)
Precision measures the agreement among
a set of replicate measurements. Field
precision is assessed through the collection
and analysis of field duplicates. Analytical
precision is estimated by duplicate/replicate
analyses, usually on laboratory control
samples, spiked samples, and/or field
samples. The most commonly used estimates
of precision are the relative standard
deviation and, when only two samples are
available, the relative percent difference.
Use the same analytical instrument to
make repeated analyses on the
same sample.
Use the same method to make
repeated measurements of the same
sample within a single laboratory.
Acquire replicate field samples for
information on sample acquisition,
handling, shipping, storage,
preparation, and analytical processes
and measurements.
If duplicate data do not meet objective:
Evaluate apparent cause (e.g., sample
heterogeneity).
Request reanalysis or remeasurement.
Qualify the data before use.
Accuracy
(laboratory control samples,
matrix spikes, and surrogates)
Accuracy is the closeness of a measured result
to an accepted reference value. Accuracy is
usually measured as a percent recovery.
QC analyses used to measure accuracy include
laboratory control samples, spiked samples,
and surrogates.
Analyze a reference material or
reanalyze a sample to which
a material of known concentration or
amount of pollutant has been added
(a spiked sample).
If recovery does not meet objective:
Qualify the data before use.
Request reanalysis or remeasurement.
Representativeness
(field duplicates)
Sample representativeness expresses the
degree to which data accurately and precisely
represent a characteristic of a population,
parameter variations at a sampling point,
a process condition, or an environmental
condition. It is dependent on the proper design
of the sampling program and will be satisfied
by ensuring that the approved plans were
followed during sampling and analysis.
Evaluate whether measurements
are made and physical samples
collected in such a manner that the
resulting data appropriately reflect the
environment or condition being
measured or studied.
If results are not representative of the
system sampled:
Identify the reason for results not
being representative.
Flag for further review.
Review data for usability.
If data are usable, qualify the data for limited use
and define the portion of the system that the
data represent.
If data are not usable, flag as appropriate.
Redefine sampling and measurement
requirements and protocols.
Resample and reanalyze, as appropriate.
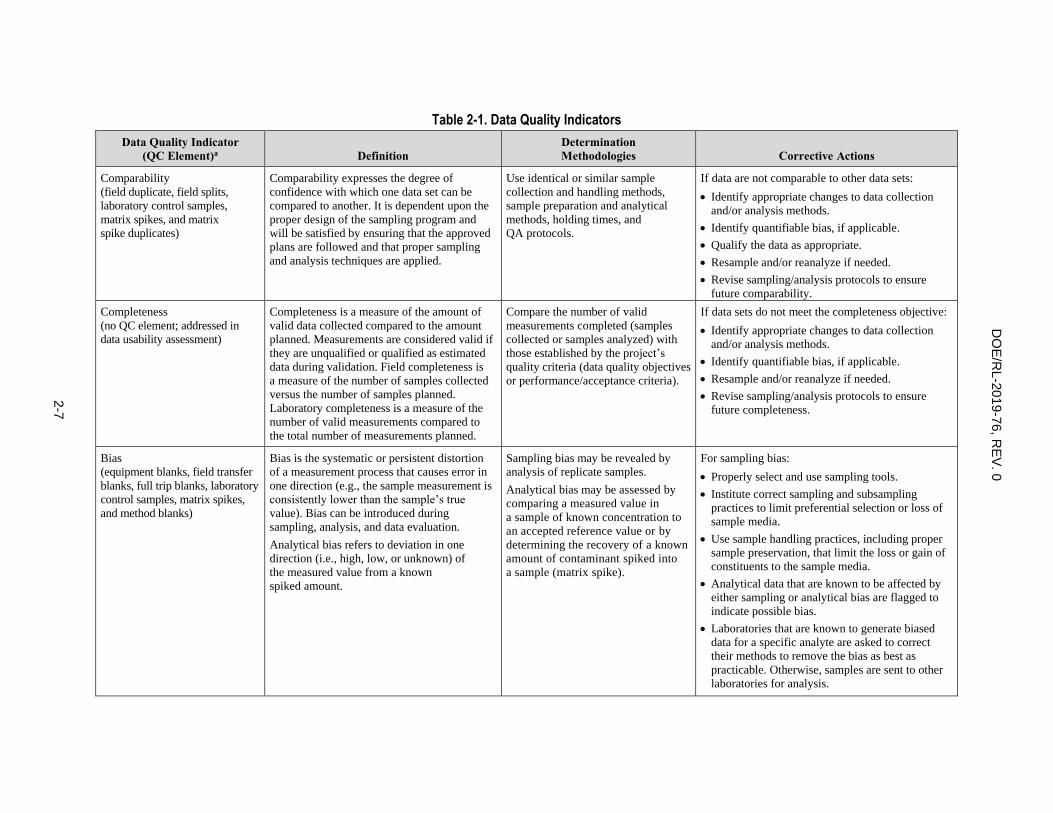
2-7
DO
E/R
L-2
019
-76
, RE
V. 0
Table 2-1. Data Quality Indicators
Data Quality Indicator
(QC Element)a Definition
Determination
Methodologies Corrective Actions
Comparability
(field duplicate, field splits,
laboratory control samples,
matrix spikes, and matrix
spike duplicates)
Comparability expresses the degree of
confidence with which one data set can be
compared to another. It is dependent upon the
proper design of the sampling program and
will be satisfied by ensuring that the approved
plans are followed and that proper sampling
and analysis techniques are applied.
Use identical or similar sample
collection and handling methods,
sample preparation and analytical
methods, holding times, and
QA protocols.
If data are not comparable to other data sets:
Identify appropriate changes to data collection
and/or analysis methods.
Identify quantifiable bias, if applicable.
Qualify the data as appropriate.
Resample and/or reanalyze if needed.
Revise sampling/analysis protocols to ensure
future comparability.
Completeness
(no QC element; addressed in
data usability assessment)
Completeness is a measure of the amount of
valid data collected compared to the amount
planned. Measurements are considered valid if
they are unqualified or qualified as estimated
data during validation. Field completeness is
a measure of the number of samples collected
versus the number of samples planned.
Laboratory completeness is a measure of the
number of valid measurements compared to
the total number of measurements planned.
Compare the number of valid
measurements completed (samples
collected or samples analyzed) with
those established by the project’s
quality criteria (data quality objectives
or performance/acceptance criteria).
If data sets do not meet the completeness objective:
Identify appropriate changes to data collection
and/or analysis methods.
Identify quantifiable bias, if applicable.
Resample and/or reanalyze if needed.
Revise sampling/analysis protocols to ensure
future completeness.
Bias
(equipment blanks, field transfer
blanks, full trip blanks, laboratory
control samples, matrix spikes,
and method blanks)
Bias is the systematic or persistent distortion
of a measurement process that causes error in
one direction (e.g., the sample measurement is
consistently lower than the sample’s true
value). Bias can be introduced during
sampling, analysis, and data evaluation.
Analytical bias refers to deviation in one
direction (i.e., high, low, or unknown) of
the measured value from a known
spiked amount.
Sampling bias may be revealed by
analysis of replicate samples.
Analytical bias may be assessed by
comparing a measured value in
a sample of known concentration to
an accepted reference value or by
determining the recovery of a known
amount of contaminant spiked into
a sample (matrix spike).
For sampling bias:
Properly select and use sampling tools.
Institute correct sampling and subsampling
practices to limit preferential selection or loss of
sample media.
Use sample handling practices, including proper
sample preservation, that limit the loss or gain of
constituents to the sample media.
Analytical data that are known to be affected by
either sampling or analytical bias are flagged to
indicate possible bias.
Laboratories that are known to generate biased
data for a specific analyte are asked to correct
their methods to remove the bias as best as
practicable. Otherwise, samples are sent to other
laboratories for analysis.
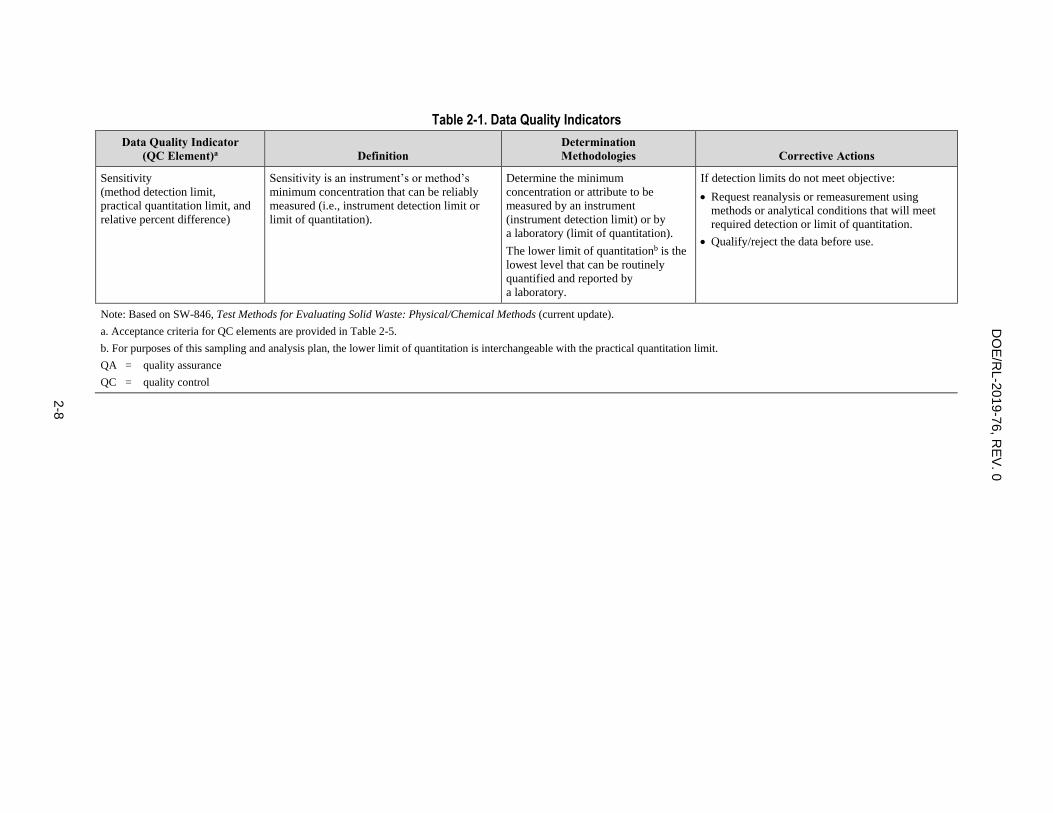
2-8
DO
E/R
L-2
019
-76
, RE
V. 0
Table 2-1. Data Quality Indicators
Data Quality Indicator
(QC Element)a Definition
Determination
Methodologies Corrective Actions
Sensitivity
(method detection limit,
practical quantitation limit, and
relative percent difference)
Sensitivity is an instrument’s or method’s
minimum concentration that can be reliably
measured (i.e., instrument detection limit or
limit of quantitation).
Determine the minimum
concentration or attribute to be
measured by an instrument
(instrument detection limit) or by
a laboratory (limit of quantitation).
The lower limit of quantitationb is the
lowest level that can be routinely
quantified and reported by
a laboratory.
If detection limits do not meet objective:
Request reanalysis or remeasurement using
methods or analytical conditions that will meet
required detection or limit of quantitation.
Qualify/reject the data before use.
Note: Based on SW-846, Test Methods for Evaluating Solid Waste: Physical/Chemical Methods (current update).
a. Acceptance criteria for QC elements are provided in Table 2-5.
b. For purposes of this sampling and analysis plan, the lower limit of quantitation is interchangeable with the practical quantitation limit.
QA = quality assurance
QC = quality control
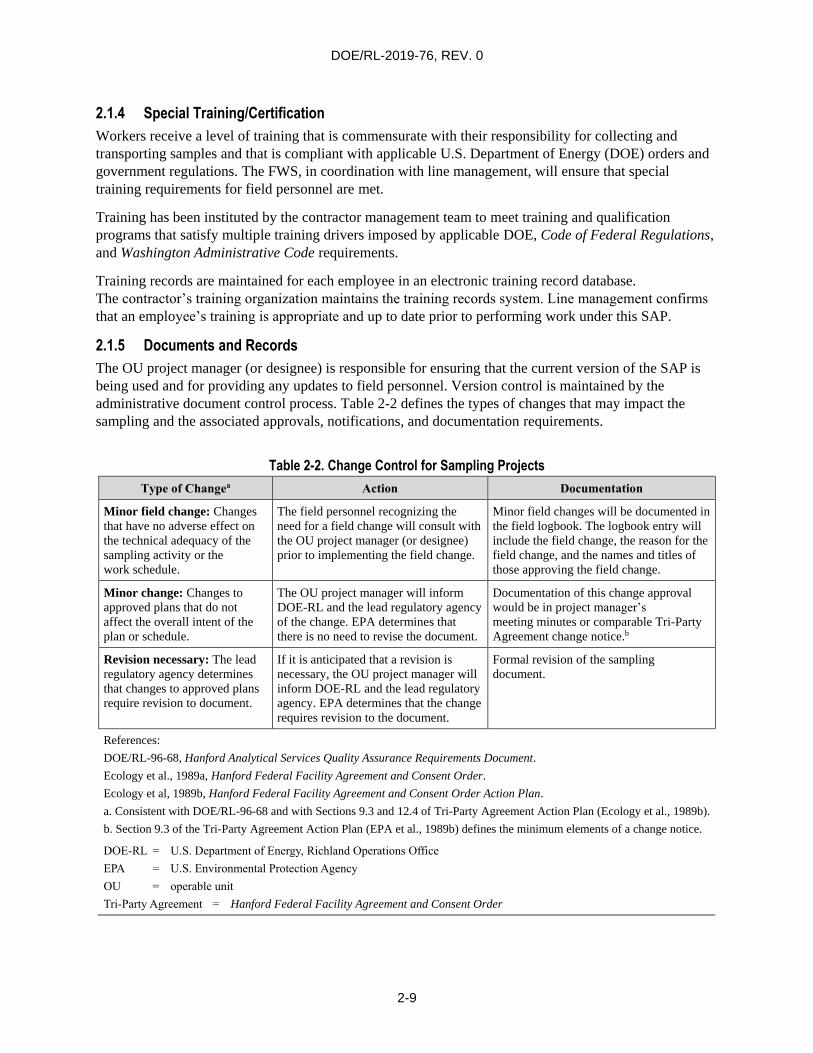
DOE/RL-2019-76, REV. 0
2-9
2.1.4 Special Training/Certification
Workers receive a level of training that is commensurate with their responsibility for collecting and
transporting samples and that is compliant with applicable U.S. Department of Energy (DOE) orders and
government regulations. The FWS, in coordination with line management, will ensure that special
training requirements for field personnel are met.
Training has been instituted by the contractor management team to meet training and qualification
programs that satisfy multiple training drivers imposed by applicable DOE, Code of Federal Regulations,
and Washington Administrative Code requirements.
Training records are maintained for each employee in an electronic training record database.
The contractor’s training organization maintains the training records system. Line management confirms
that an employee’s training is appropriate and up to date prior to performing work under this SAP.
2.1.5 Documents and Records
The OU project manager (or designee) is responsible for ensuring that the current version of the SAP is
being used and for providing any updates to field personnel. Version control is maintained by the
administrative document control process. Table 2-2 defines the types of changes that may impact the
sampling and the associated approvals, notifications, and documentation requirements.
Table 2-2. Change Control for Sampling Projects
Type of Changea Action Documentation
Minor field change: Changes
that have no adverse effect on
the technical adequacy of the
sampling activity or the
work schedule.
The field personnel recognizing the
need for a field change will consult with
the OU project manager (or designee)
prior to implementing the field change.
Minor field changes will be documented in
the field logbook. The logbook entry will
include the field change, the reason for the
field change, and the names and titles of
those approving the field change.
Minor change: Changes to
approved plans that do not
affect the overall intent of the
plan or schedule.
The OU project manager will inform
DOE-RL and the lead regulatory agency
of the change. EPA determines that
there is no need to revise the document.
Documentation of this change approval
would be in project manager’s
meeting minutes or comparable Tri-Party
Agreement change notice.b
Revision necessary: The lead
regulatory agency determines
that changes to approved plans
require revision to document.
If it is anticipated that a revision is
necessary, the OU project manager will
inform DOE-RL and the lead regulatory
agency. EPA determines that the change
requires revision to the document.
Formal revision of the sampling
document.
References:
DOE/RL-96-68, Hanford Analytical Services Quality Assurance Requirements Document.
Ecology et al., 1989a, Hanford Federal Facility Agreement and Consent Order.
Ecology et al, 1989b, Hanford Federal Facility Agreement and Consent Order Action Plan.
a. Consistent with DOE/RL-96-68 and with Sections 9.3 and 12.4 of Tri-Party Agreement Action Plan (Ecology et al., 1989b).
b. Section 9.3 of the Tri-Party Agreement Action Plan (EPA et al., 1989b) defines the minimum elements of a change notice.
DOE-RL = U.S. Department of Energy, Richland Operations Office
EPA = U.S. Environmental Protection Agency
OU = operable unit
Tri-Party Agreement = Hanford Federal Facility Agreement and Consent Order
DOE/RL-2019-76, REV. 0
2-10
Regarding minor field changes, the OU technical lead (in coordination with the Soil and Groundwater
Remediation Project [S&GRP] subject matter expert) will approve deviations from the SAP that do not
have an adverse effect on the technical integrity or adequacy of the sampling activity. Examples of minor
field changes are as follows:
During groundwater sampling, most groundwater samples will be pumped, although use of another
method may be authorized by the OU technical lead.
The sample depths provided in this SAP are estimated based on known characterization data
and geology collected from nearby wells. For this reason, adjustments to the sample depths are
anticipated. The sample depths may be altered during drilling in consultation with the
OU technical lead.
During split-spoon sampling, if insufficient material is recovered or the split spoon is overdriven, then
(when feasible) a second split spoon will be collected prior to advancing the borehole. If there is
not enough sample volume recovered during split-spoon sampling, laboratory-approved minimum
sample volumes will be used to run all required sample analyses. If it is not possible to collect
sufficient sample volume and perform all analyses, then DOE-RL will be consulted to concur on
the path forward.
Groundwater samples may not be collected before a minimum of three well casing volumes have
been purged and water chemistry (e.g., temperature, pH, and conductivity) has stabilized within
10% variance over three consecutive measurements unless approved by the OU technical lead.
Note that one borehole volume is acceptable if water chemistry (e.g., temperature, pH, and
conductivity) has stabilized within 10% variance over three consecutive measurements for the
depth-discrete groundwater samples collected during drilling.
Regarding minor changes, the OU technical lead (in coordination with the S&GRP subject matter expert)
will consult with DOE-RL and the lead regulatory agency when deviations from the SAP do not affect the
overall intent of the plan. Examples of minor changes include the following:
Changing the type of sample being collected. For example, collecting continuous grab samples
instead of continuous cores.
Selecting a different well construction material and/or well design.
Changing to a different drilling method.
The OU technical lead (in coordination with the S&GRP subject matter expert) will inform DOE-RL and
EPA of deviations from the SAP that affect the overall intent and schedule may require revision to the
approved plan.
Logbooks are required to document field sampling activities. The logbook must be identified with
a unique project name and number. Only authorized individuals may make entries into the logbooks.
Logbooks will be controlled in accordance with internal work requirements and processes. Data forms are
also required for field activities and will be controlled in accordance with internal work requirements
and processes.
The FWS and SMR are responsible for ensuring that the field instructions are maintained and aligned
with revisions or approved changes to the SAP. SMR will ensure that deviations from the SAP
(i.e., minor field changes, as documented in Table 2-2) are reflected in revised field sampling documents
for the samplers and the analytical laboratory. All other changes need to be documented by the
DOE/RL-2019-76, REV. 0
2-11
OU technical lead through Tri-Party Agreement change notice or an update to the SAP. The FWS will
ensure that deviations from the SAP or problems encountered in the field are documented appropriately
(e.g., in the field logbook).
The OU project manager, FWS, or designee is responsible for communicating field corrective
action requirements and ensuring that immediate corrective actions are applied to field activities.
The OU project manager is also responsible for ensuring that project files are appropriately set up and
maintained. The project files will contain project records or references to their storage locations. Project
files may include the following information:
Operational records and logbooks
Data forms
Global positioning system data (a copy will be provided to SMR)
Inspection or assessment reports and corrective action reports
Field summary reports
Interim progress reports
Final reports
Photographs
The following records are managed and maintained by SMR personnel:
Completed field sampling logbooks
Field drilling and analytical data
Groundwater sample reports and field sample reports
Completed chain-of-custody forms
Sample receipt records
Laboratory data packages
Analytical data verification and validation reports
Analytical data “case file purges” (i.e., raw data purged from laboratory files) provided by the
offsite analytical laboratories
Convenience copies of laboratory analytical results are maintained in the HEIS database. Records may be
stored in either electronic (e.g., in the managed records area of the Integrated Document Management
System) or hardcopy format (e.g., DOE Records Holding Area). Documentation and records, regardless
of medium or format, are controlled in accordance with internal work requirements and processes that
ensure accuracy and retrievability of stored records. Records required by the Tri-Party Agreement
(Ecology et al., 1989a) will be managed in accordance with Tri-Party Agreement requirements.
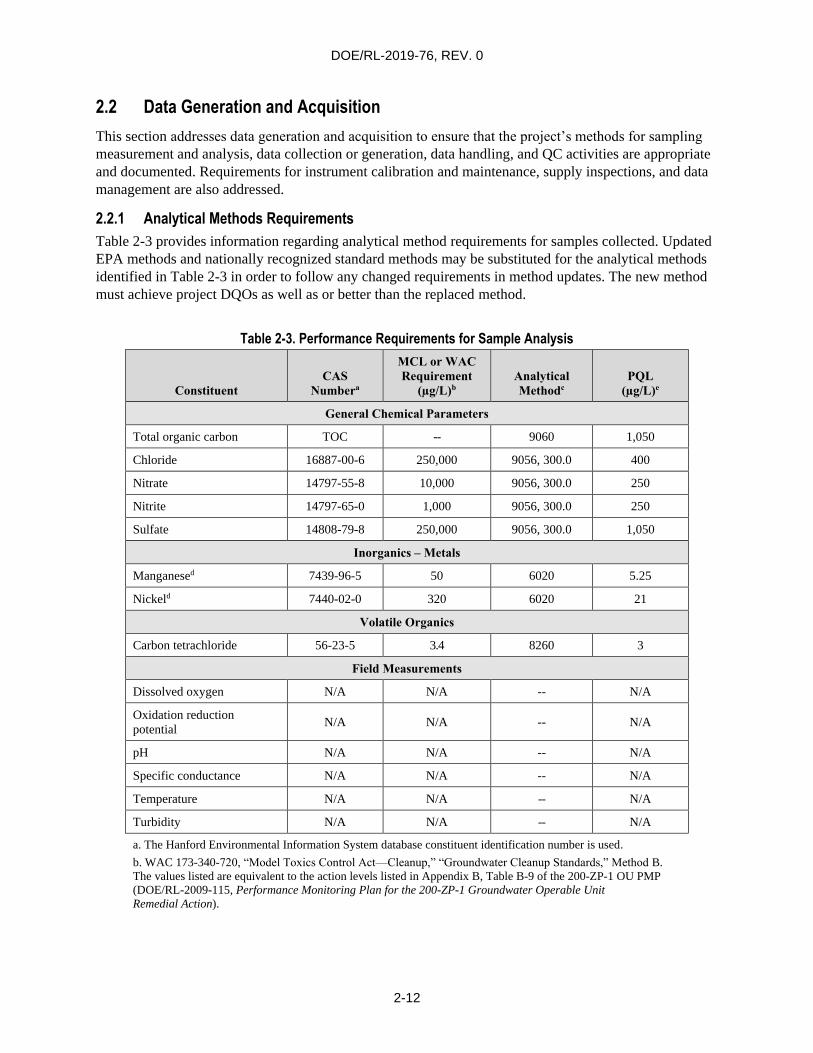
DOE/RL-2019-76, REV. 0
2-12
2.2 Data Generation and Acquisition
This section addresses data generation and acquisition to ensure that the project’s methods for sampling
measurement and analysis, data collection or generation, data handling, and QC activities are appropriate
and documented. Requirements for instrument calibration and maintenance, supply inspections, and data
management are also addressed.
2.2.1 Analytical Methods Requirements
Table 2-3 provides information regarding analytical method requirements for samples collected. Updated
EPA methods and nationally recognized standard methods may be substituted for the analytical methods
identified in Table 2-3 in order to follow any changed requirements in method updates. The new method
must achieve project DQOs as well as or better than the replaced method.
Table 2-3. Performance Requirements for Sample Analysis
Constituent
CAS
Numbera
MCL or WAC
Requirement
(µg/L)b
Analytical
Methodc
PQL
(µg/L)e
General Chemical Parameters
Total organic carbon TOC -- 9060 1,050
Chloride 16887-00-6 250,000 9056, 300.0 400
Nitrate 14797-55-8 10,000 9056, 300.0 250
Nitrite 14797-65-0 1,000 9056, 300.0 250
Sulfate 14808-79-8 250,000 9056, 300.0 1,050
Inorganics – Metals
Manganesed 7439-96-5 50 6020 5.25
Nickeld 7440-02-0 320 6020 21
Volatile Organics
Carbon tetrachloride 56-23-5 3.4 8260 3
Field Measurements
Dissolved oxygen N/A N/A -- N/A
Oxidation reduction
potential N/A N/A -- N/A
pH N/A N/A -- N/A
Specific conductance N/A N/A -- N/A
Temperature N/A N/A -- N/A
Turbidity N/A N/A -- N/A
a. The Hanford Environmental Information System database constituent identification number is used.
b. WAC 173-340-720, “Model Toxics Control Act—Cleanup,” “Groundwater Cleanup Standards,” Method B.
The values listed are equivalent to the action levels listed in Appendix B, Table B-9 of the 200-ZP-1 OU PMP
(DOE/RL-2009-115, Performance Monitoring Plan for the 200-ZP-1 Groundwater Operable Unit
Remedial Action).
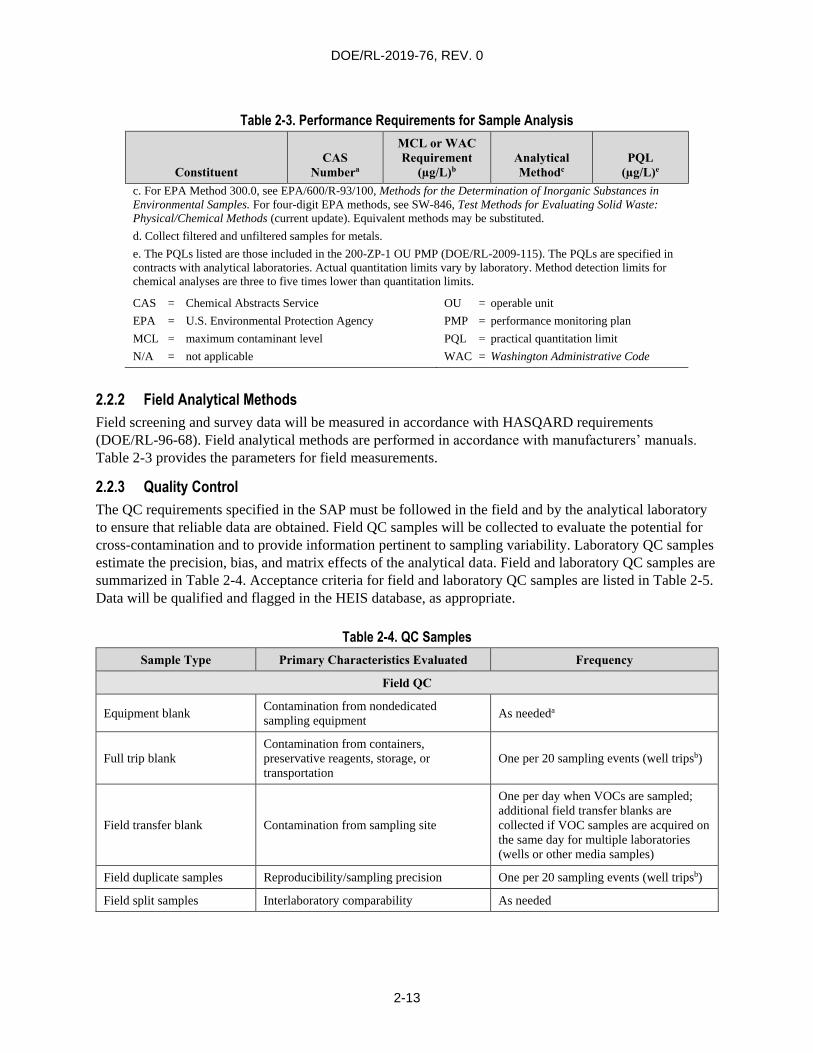
DOE/RL-2019-76, REV. 0
2-13
Table 2-3. Performance Requirements for Sample Analysis
Constituent
CAS
Numbera
MCL or WAC
Requirement
(µg/L)b
Analytical
Methodc
PQL
(µg/L)e
c. For EPA Method 300.0, see EPA/600/R-93/100, Methods for the Determination of Inorganic Substances in
Environmental Samples. For four-digit EPA methods, see SW-846, Test Methods for Evaluating Solid Waste:
Physical/Chemical Methods (current update). Equivalent methods may be substituted.
d. Collect filtered and unfiltered samples for metals.
e. The PQLs listed are those included in the 200-ZP-1 OU PMP (DOE/RL-2009-115). The PQLs are specified in
contracts with analytical laboratories. Actual quantitation limits vary by laboratory. Method detection limits for
chemical analyses are three to five times lower than quantitation limits.
CAS = Chemical Abstracts Service
EPA = U.S. Environmental Protection Agency
MCL = maximum contaminant level
N/A = not applicable
OU = operable unit
PMP = performance monitoring plan
PQL = practical quantitation limit
WAC = Washington Administrative Code
2.2.2 Field Analytical Methods
Field screening and survey data will be measured in accordance with HASQARD requirements
(DOE/RL-96-68). Field analytical methods are performed in accordance with manufacturers’ manuals.
Table 2-3 provides the parameters for field measurements.
2.2.3 Quality Control
The QC requirements specified in the SAP must be followed in the field and by the analytical laboratory
to ensure that reliable data are obtained. Field QC samples will be collected to evaluate the potential for
cross-contamination and to provide information pertinent to sampling variability. Laboratory QC samples
estimate the precision, bias, and matrix effects of the analytical data. Field and laboratory QC samples are
summarized in Table 2-4. Acceptance criteria for field and laboratory QC samples are listed in Table 2-5.
Data will be qualified and flagged in the HEIS database, as appropriate.
Table 2-4. QC Samples
Sample Type Primary Characteristics Evaluated Frequency
Field QC
Equipment blank Contamination from nondedicated
sampling equipment As neededa
Full trip blank
Contamination from containers,
preservative reagents, storage, or
transportation
One per 20 sampling events (well tripsb)
Field transfer blank Contamination from sampling site
One per day when VOCs are sampled;
additional field transfer blanks are
collected if VOC samples are acquired on
the same day for multiple laboratories
(wells or other media samples)
Field duplicate samples Reproducibility/sampling precision One per 20 sampling events (well tripsb)
Field split samples Interlaboratory comparability As needed
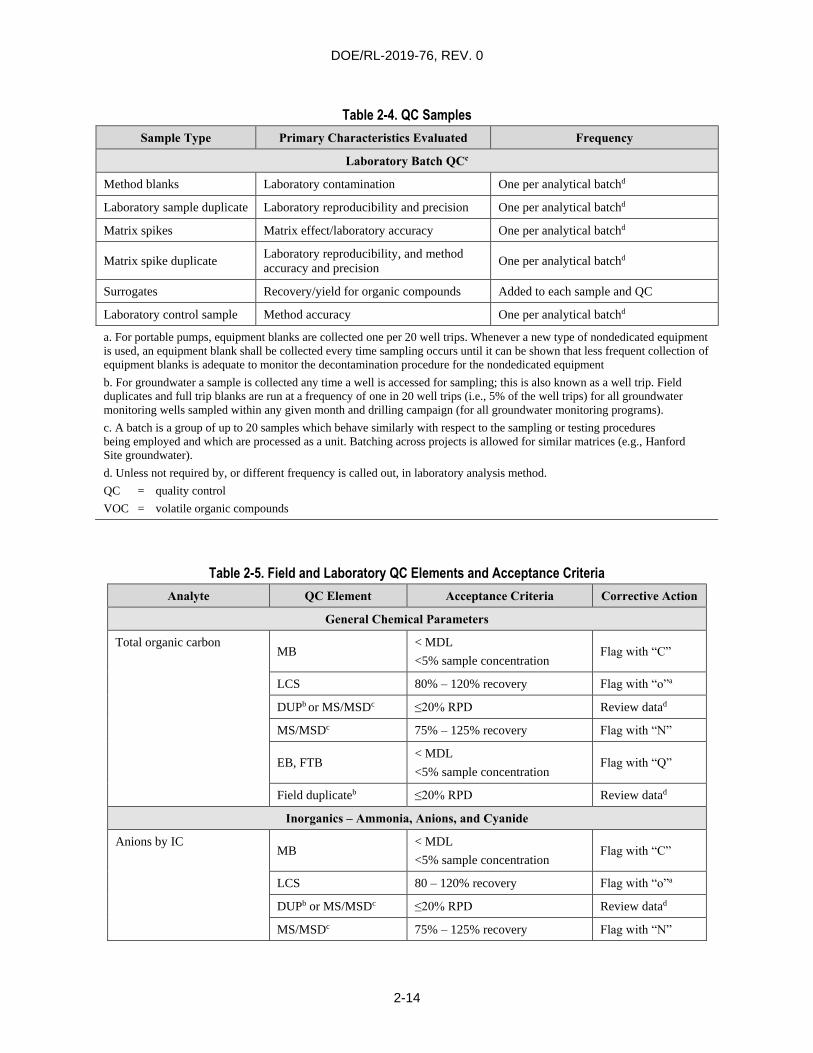
DOE/RL-2019-76, REV. 0
2-14
Table 2-4. QC Samples
Sample Type Primary Characteristics Evaluated Frequency
Laboratory Batch QCc
Method blanks Laboratory contamination One per analytical batchd
Laboratory sample duplicate Laboratory reproducibility and precision One per analytical batchd
Matrix spikes Matrix effect/laboratory accuracy One per analytical batchd
Matrix spike duplicate Laboratory reproducibility, and method
accuracy and precision One per analytical batchd
Surrogates Recovery/yield for organic compounds Added to each sample and QC
Laboratory control sample Method accuracy One per analytical batchd
a. For portable pumps, equipment blanks are collected one per 20 well trips. Whenever a new type of nondedicated equipment
is used, an equipment blank shall be collected every time sampling occurs until it can be shown that less frequent collection of
equipment blanks is adequate to monitor the decontamination procedure for the nondedicated equipment
b. For groundwater a sample is collected any time a well is accessed for sampling; this is also known as a well trip. Field
duplicates and full trip blanks are run at a frequency of one in 20 well trips (i.e., 5% of the well trips) for all groundwater
monitoring wells sampled within any given month and drilling campaign (for all groundwater monitoring programs).
c. A batch is a group of up to 20 samples which behave similarly with respect to the sampling or testing procedures
being employed and which are processed as a unit. Batching across projects is allowed for similar matrices (e.g., Hanford
Site groundwater).
d. Unless not required by, or different frequency is called out, in laboratory analysis method.
QC = quality control
VOC = volatile organic compounds
Table 2-5. Field and Laboratory QC Elements and Acceptance Criteria
Analyte QC Element Acceptance Criteria Corrective Action
General Chemical Parameters
Total organic carbon MB
< MDL
<5% sample concentration Flag with “C”
LCS 80% – 120% recovery Flag with “o”a
DUPb or MS/MSDc ≤20% RPD Review datad
MS/MSDc 75% – 125% recovery Flag with “N”
EB, FTB < MDL
<5% sample concentration Flag with “Q”
Field duplicateb ≤20% RPD Review datad
Inorganics – Ammonia, Anions, and Cyanide
Anions by IC MB
< MDL
<5% sample concentration Flag with “C”
LCS 80 – 120% recovery Flag with “o”a
DUPb or MS/MSDc ≤20% RPD Review datad
MS/MSDc 75% – 125% recovery Flag with “N”
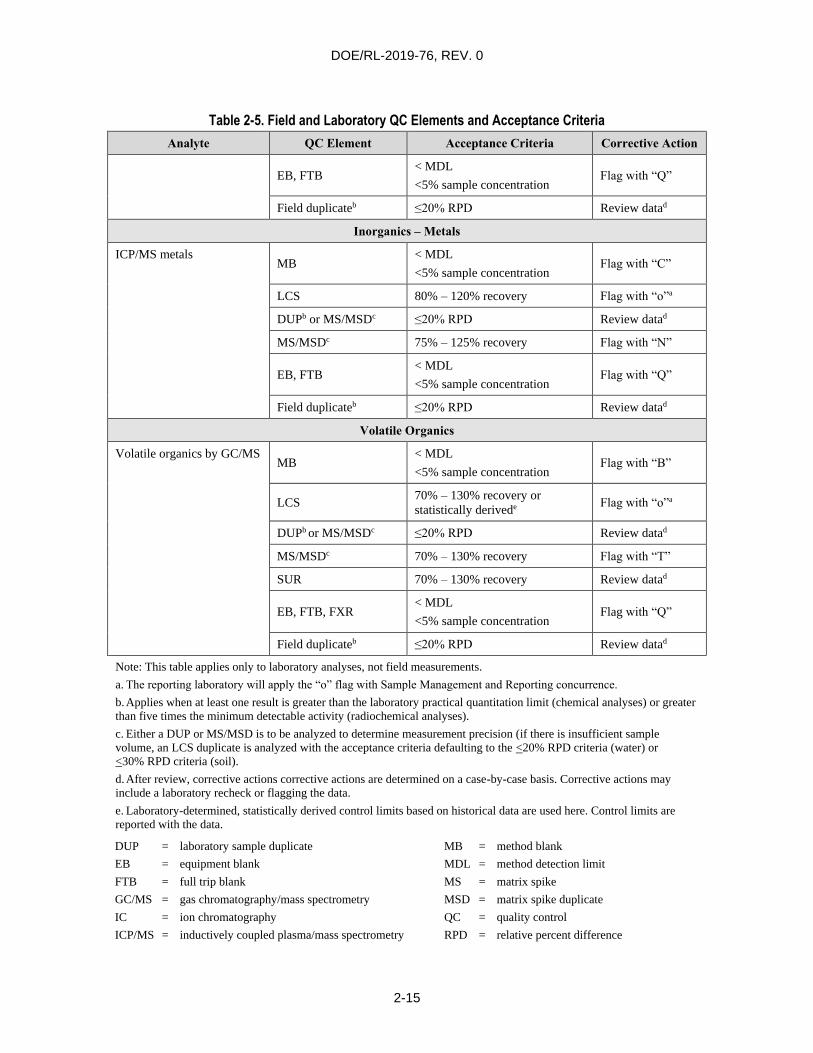
DOE/RL-2019-76, REV. 0
2-15
Table 2-5. Field and Laboratory QC Elements and Acceptance Criteria
Analyte QC Element Acceptance Criteria Corrective Action
EB, FTB < MDL
<5% sample concentration Flag with “Q”
Field duplicateb ≤20% RPD Review datad
Inorganics – Metals
ICP/MS metals MB
< MDL
<5% sample concentration Flag with “C”
LCS 80% – 120% recovery Flag with “o”a
DUPb or MS/MSDc ≤20% RPD Review datad
MS/MSDc 75% – 125% recovery Flag with “N”
EB, FTB < MDL
<5% sample concentration Flag with “Q”
Field duplicateb ≤20% RPD Review datad
Volatile Organics
Volatile organics by GC/MS MB
< MDL
<5% sample concentration Flag with “B”
LCS 70% – 130% recovery or
statistically derivede Flag with “o”a
DUPb or MS/MSDc ≤20% RPD Review datad
MS/MSDc 70% – 130% recovery Flag with “T”
SUR 70% – 130% recovery Review datad
EB, FTB, FXR < MDL
<5% sample concentration Flag with “Q”
Field duplicateb ≤20% RPD Review datad
Note: This table applies only to laboratory analyses, not field measurements.
a. The reporting laboratory will apply the “o” flag with Sample Management and Reporting concurrence.
b. Applies when at least one result is greater than the laboratory practical quantitation limit (chemical analyses) or greater
than five times the minimum detectable activity (radiochemical analyses).
c. Either a DUP or MS/MSD is to be analyzed to determine measurement precision (if there is insufficient sample
volume, an LCS duplicate is analyzed with the acceptance criteria defaulting to the <20% RPD criteria (water) or
<30% RPD criteria (soil).
d. After review, corrective actions corrective actions are determined on a case-by-case basis. Corrective actions may
include a laboratory recheck or flagging the data.
e. Laboratory-determined, statistically derived control limits based on historical data are used here. Control limits are
reported with the data.
DUP = laboratory sample duplicate
EB = equipment blank
FTB = full trip blank
GC/MS = gas chromatography/mass spectrometry
IC = ion chromatography
ICP/MS = inductively coupled plasma/mass spectrometry
MB = method blank
MDL = method detection limit
MS = matrix spike
MSD = matrix spike duplicate
QC = quality control
RPD = relative percent difference
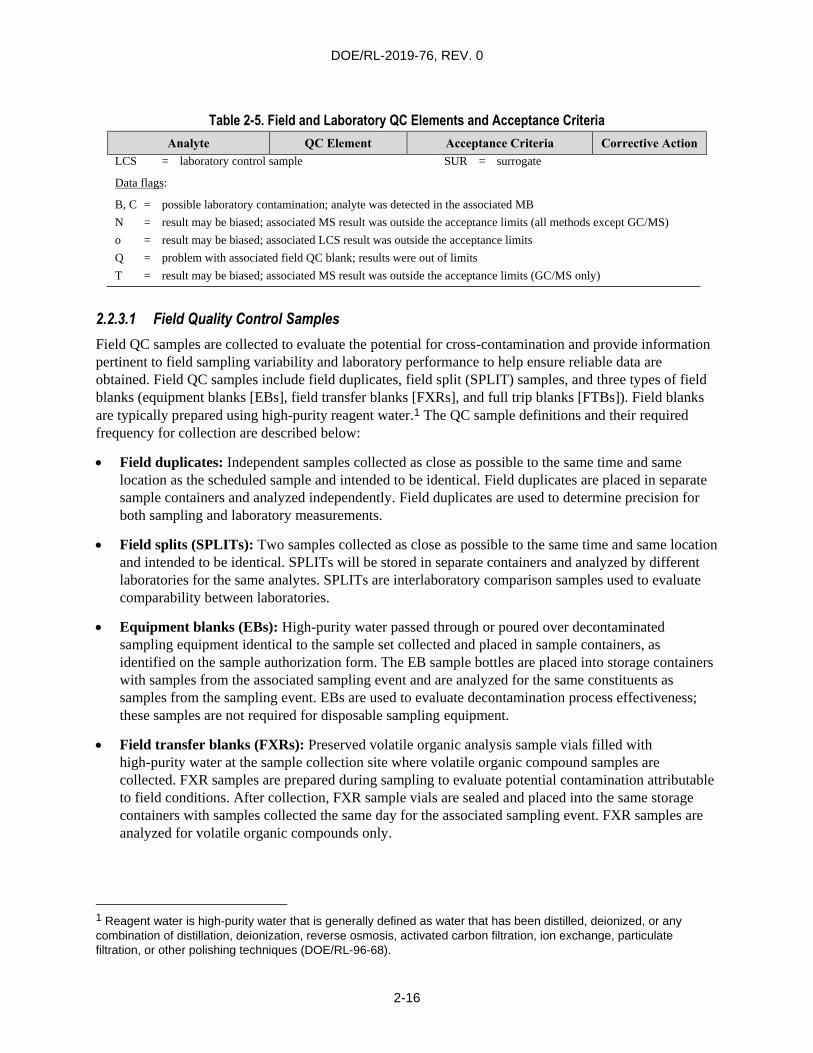
DOE/RL-2019-76, REV. 0
2-16
Table 2-5. Field and Laboratory QC Elements and Acceptance Criteria
Analyte QC Element Acceptance Criteria Corrective Action
LCS = laboratory control sample SUR = surrogate
Data flags:
B, C = possible laboratory contamination; analyte was detected in the associated MB
N = result may be biased; associated MS result was outside the acceptance limits (all methods except GC/MS)
o = result may be biased; associated LCS result was outside the acceptance limits
Q = problem with associated field QC blank; results were out of limits
T = result may be biased; associated MS result was outside the acceptance limits (GC/MS only)
2.2.3.1 Field Quality Control Samples
Field QC samples are collected to evaluate the potential for cross-contamination and provide information
pertinent to field sampling variability and laboratory performance to help ensure reliable data are
obtained. Field QC samples include field duplicates, field split (SPLIT) samples, and three types of field
blanks (equipment blanks [EBs], field transfer blanks [FXRs], and full trip blanks [FTBs]). Field blanks
are typically prepared using high-purity reagent water.1 The QC sample definitions and their required
frequency for collection are described below:
Field duplicates: Independent samples collected as close as possible to the same time and same
location as the scheduled sample and intended to be identical. Field duplicates are placed in separate
sample containers and analyzed independently. Field duplicates are used to determine precision for
both sampling and laboratory measurements.
Field splits (SPLITs): Two samples collected as close as possible to the same time and same location
and intended to be identical. SPLITs will be stored in separate containers and analyzed by different
laboratories for the same analytes. SPLITs are interlaboratory comparison samples used to evaluate
comparability between laboratories.
Equipment blanks (EBs): High-purity water passed through or poured over decontaminated
sampling equipment identical to the sample set collected and placed in sample containers, as
identified on the sample authorization form. The EB sample bottles are placed into storage containers
with samples from the associated sampling event and are analyzed for the same constituents as
samples from the sampling event. EBs are used to evaluate decontamination process effectiveness;
these samples are not required for disposable sampling equipment.
Field transfer blanks (FXRs): Preserved volatile organic analysis sample vials filled with
high-purity water at the sample collection site where volatile organic compound samples are
collected. FXR samples are prepared during sampling to evaluate potential contamination attributable
to field conditions. After collection, FXR sample vials are sealed and placed into the same storage
containers with samples collected the same day for the associated sampling event. FXR samples are
analyzed for volatile organic compounds only.
1 Reagent water is high-purity water that is generally defined as water that has been distilled, deionized, or any
combination of distillation, deionization, reverse osmosis, activated carbon filtration, ion exchange, particulate
filtration, or other polishing techniques (DOE/RL-96-68).
DOE/RL-2019-76, REV. 0
2-17
Full trip blanks (FTBs): Bottles prepared by the sampling team before traveling to the sampling site.
The preserved bottle set is either for volatile organic analysis only or is identical to the set that will be
collected in the field. The bottles are filled with high-purity water and then sealed and transported
(unopened) to the field in the same storage containers used for samples collected that day. Collected
FTBs are typically analyzed for the same constituents as the samples from the associated sampling
event. FTBs are used to evaluate potential sample contamination from the sample bottles,
preservative, handling, storage, and transportation.
2.2.3.2 Laboratory Quality Control Samples
Internal QA/QC programs are maintained by laboratories used by the project. Laboratory QA includes
a comprehensive QC program that includes the use of laboratory control samples (LCSs), laboratory
sample duplicates (DUPs), matrix spikes (MSs), matrix spike duplicates (MSDs), method blanks (MBs),
and surrogates (SURs). These QC analyses are required by EPA methods (e.g., those in SW-846, Test
Methods for Evaluating Solid Waste: Physical/Chemical Methods [current update]) and will-be run at the
frequency specified in the respective references (unless superseded by agreement). The QC checks
outside of control limits are documented in analytical laboratory reports during data usability assessments
(DUAs). Laboratory QC checks and their typical frequencies are listed in Table 2-4. Acceptance criteria
are presented in Table 2-5. Descriptions of the various types of laboratory QC samples are as follows:
Laboratory control sample (LCS): A control matrix (e.g., reagent water) spiked with analytes
representing the target analytes or certified reference material used to evaluate laboratory accuracy.
Laboratory sample duplicate (DUP): An intralaboratory replicate sample that is used to evaluate
the precision of a method in a given sample matrix.
Matrix spike (MS): An aliquot of a sample spiked with a known concentration of target analyte(s).
The MS is used to assess the bias of a method in a given sample matrix. Spiking occurs prior to
sample preparation and analysis.
Matrix spike duplicate (MSD): A replicate spiked aliquot of a sample that is subjected to the entire
sample preparation and analytical process. MSD results are used to determine the bias and precision
of a method in a given sample matrix.
Method blank (MB): An analyte-free matrix to which the same reagents are added in the same
volumes or proportions as used in the sample processing. The MB is carried through the sample
preparation and analytical procedure and is used to quantify contamination resulting from the
analytical process.
Surrogate (SUR): A compound added to every sample in the analysis batch (field samples and QC
samples) prior to preparation. SURs are typically similar in chemical composition to the analyte being
determined, but they are not normally encountered. SURs are expected to respond to the preparation
and measurement systems in a manner similar to the analytes of interest. Because SURs are added to
every standard, sample, and QC sample, they are used to evaluate overall method performance in
a given matrix. SURs are used only in organic analyses.
Laboratories are required to analyze samples within the holding times specified in Table 2-6. In some
instances, constituents in the samples not analyzed within holding times may be compromised by
volatilization, decomposition, or by other chemical changes. Data from samples analyzed outside of
holding times are flagged in the HEIS database with an “H.”
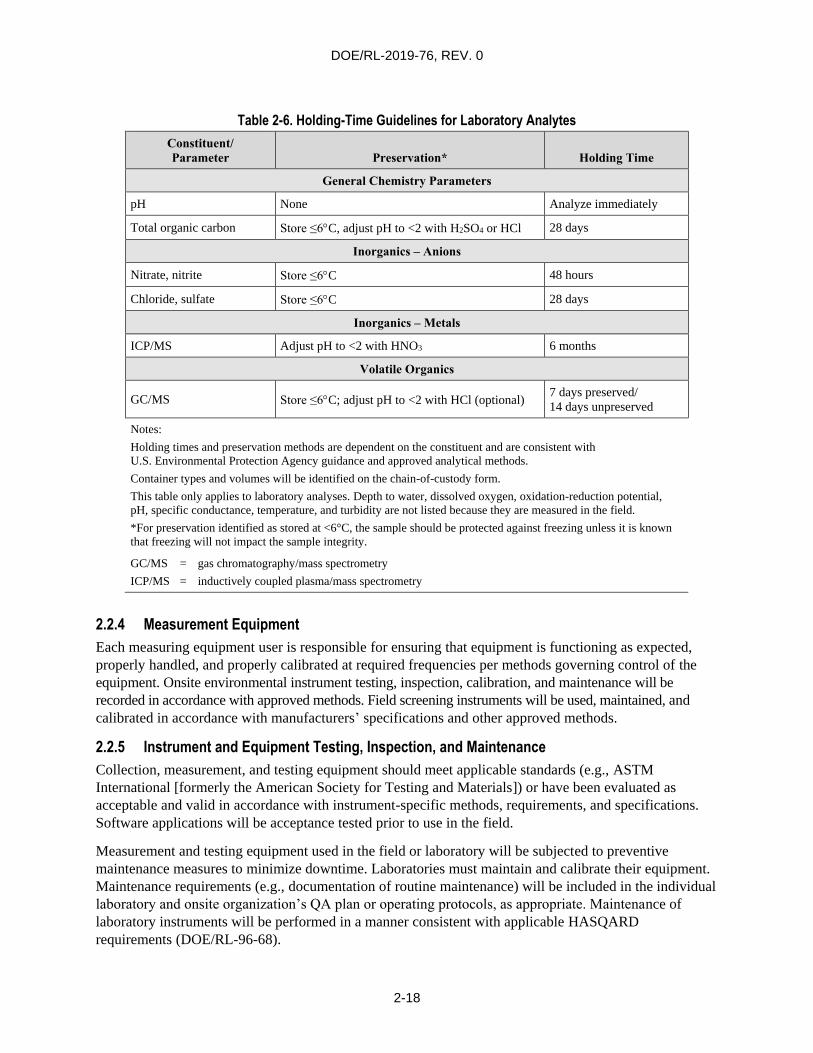
DOE/RL-2019-76, REV. 0
2-18
Table 2-6. Holding-Time Guidelines for Laboratory Analytes
Constituent/
Parameter Preservation* Holding Time
General Chemistry Parameters
pH None Analyze immediately
Total organic carbon Store ≤6C, adjust pH to <2 with H2SO4 or HCl 28 days
Inorganics – Anions
Nitrate, nitrite Store ≤6C 48 hours
Chloride, sulfate Store ≤6C 28 days
Inorganics – Metals
ICP/MS Adjust pH to <2 with HNO3 6 months
Volatile Organics
GC/MS Store ≤6C; adjust pH to <2 with HCl (optional) 7 days preserved/
14 days unpreserved
Notes:
Holding times and preservation methods are dependent on the constituent and are consistent with
U.S. Environmental Protection Agency guidance and approved analytical methods.
Container types and volumes will be identified on the chain-of-custody form.
This table only applies to laboratory analyses. Depth to water, dissolved oxygen, oxidation-reduction potential,
pH, specific conductance, temperature, and turbidity are not listed because they are measured in the field.
*For preservation identified as stored at <6°C, the sample should be protected against freezing unless it is known
that freezing will not impact the sample integrity.
GC/MS = gas chromatography/mass spectrometry
ICP/MS = inductively coupled plasma/mass spectrometry
2.2.4 Measurement Equipment
Each measuring equipment user is responsible for ensuring that equipment is functioning as expected,
properly handled, and properly calibrated at required frequencies per methods governing control of the
equipment. Onsite environmental instrument testing, inspection, calibration, and maintenance will be
recorded in accordance with approved methods. Field screening instruments will be used, maintained, and
calibrated in accordance with manufacturers’ specifications and other approved methods.
2.2.5 Instrument and Equipment Testing, Inspection, and Maintenance
Collection, measurement, and testing equipment should meet applicable standards (e.g., ASTM
International [formerly the American Society for Testing and Materials]) or have been evaluated as
acceptable and valid in accordance with instrument-specific methods, requirements, and specifications.
Software applications will be acceptance tested prior to use in the field.
Measurement and testing equipment used in the field or laboratory will be subjected to preventive
maintenance measures to minimize downtime. Laboratories must maintain and calibrate their equipment.
Maintenance requirements (e.g., documentation of routine maintenance) will be included in the individual
laboratory and onsite organization’s QA plan or operating protocols, as appropriate. Maintenance of
laboratory instruments will be performed in a manner consistent with applicable HASQARD
requirements (DOE/RL-96-68).
DOE/RL-2019-76, REV. 0
2-19
2.2.6 Instrument/Equipment Calibration and Frequency
Section 3.5 discusses field equipment calibration. Analytical laboratory instruments are calibrated in
accordance with the laboratory’s QA plan and applicable Hanford Site requirements.
2.2.7 Inspection/Acceptance of Supplies and Consumables
Consumables, supplies, and reagents will be reviewed in accordance with requirements and will be
appropriate for their use. Supplies and consumables used in support of sampling and analysis activities are
procured in accordance with internal work requirements and processes. Responsibilities and interfaces
necessary to ensure that items procured/acquired for the contractor meet the specific technical and quality
requirements must be in place. The procurement system ensures that purchased items comply with
applicable procurement specifications. Supplies and consumables are checked and accepted by users prior
to use.
2.2.8 Nondirect Measurements
Data obtained from sources such as computer databases, programs, literature files, and historical
databases will be technically reviewed to the same extent as data generated as part of any sampling and
analysis QA/QC effort. Data used in evaluations will be identified by source.
2.2.9 Data Management
The SMR organization, in coordination with the OU project manager, is responsible for ensuring that
analytical data are appropriately reviewed, managed, and stored in accordance with applicable
programmatic requirements governing data management methods.
Electronic data access, when appropriate, will be through a Hanford Site database (e.g., HEIS). Where
electronic data are not available, hardcopies will be provided in accordance with Section 9.6 of the
Tri-Party Agreement Action Plan (Ecology et al., 1989b).
Laboratory errors are reported to SMR through an established process. For reported laboratory errors,
a sample issue resolution form will be initiated in accordance with applicable methods. This process is
used to document analytical errors and to establish their resolution with the OU project manager.
The sample issue resolution forms become a permanent part of the analytical data package for future
reference and for records management.
2.3 Assessment and Oversight
Assessment and oversight activities address the effectiveness of project implementation and associated
QA/QC activities. The purpose of assessment is to ensure that the QAPjP is implemented as prescribed.
2.3.1 Assessments and Response Actions
Assessments may be performed to verify compliance with the requirements outlined in this SAP, project
field instructions, the QAPjP, methods, and regulatory requirements. Deficiencies identified by these
assessments will be reported in accordance with existing programmatic requirements. The project line
management chain coordinates the corrective actions/deficiency resolutions in accordance with the
QA program, the corrective action management program, and methods associated with these programs.
When appropriate, corrective actions will be taken by the OU project manager (or designee). A DUA may
be performed for the identified SAP activities. The DUA results will be provided to the OU project
manager. No other planned assessments have been identified. If circumstances arise in the field dictating
the need for additional assessments, then additional assessments will be performed.
DOE/RL-2019-76, REV. 0
2-20
Oversight activities in the analytical laboratories, including corrective action management, are conducted
in accordance with the laboratories’ QA plans. SMR oversees offsite analytical laboratories and verifies
that the laboratories are qualified to perform Hanford Site analytical work.
2.3.2 Reports to Management
Program and project management (as appropriate) will be made aware of deficiencies identified by
assessments and oversight. Issues reported by the laboratories are communicated to SMR, which then
initiates a sample issue resolution form. The process is used to document analytical or sample issues and
to establish resolution with the OU project manager. If an assessment finding results in sampling issues
that affect a regulatory requirement, DOE will be informed and the matter will be discussed with the
regulatory agencies.
2.4 Data Review and Usability
This section addresses QA activities that occur after data collection. Implementation of these activities
determines whether the data conform to the specified criteria, thus satisfying the project objectives.
2.4.1 Data Review and Verification
Data review and verification are performed to confirm that sampling and chain-of-custody documentation
are complete. This review includes linking sample numbers to specific sampling locations and reviewing
sample collection dates and sample preparation and analysis dates to assess whether holding times (if any)
have been met. Furthermore, review of QC data is used to determine whether analyses have met the data
quality requirements specified in this SAP.
The criteria for verification include, but are not limited to, review for contractual compliance
(samples were analyzed as requested), use of the correct analytical method, transcription errors, correct
application of dilution factors, appropriate reporting of dry weight versus wet weight, and correct
application of conversion factors. Field QA/QC results will be reviewed to ensure that the results
are usable.
The OU technical lead performs data reviews to help determine if observed changes reflect potential data
errors, which may result in submitting a request for data review on questionable data. The laboratory may
be asked to check calculations or reanalyze the sample. In extreme cases, another sample may be
collected. Results of the request for data review process are used to flag the data appropriately in
the HEIS database and/or to add comments.
2.4.2 Data Validation
Data validation is an independent assessment to ensure data reliability. Analytical data validation provides
a level of assurance that an analyte is present or absent. Validation may also include the following:
Verification of instrument calibrations
Evaluation of analytical results based on MBs
Recovery of various internal standards
Correctness of uncertainty calculations
Correctness of identification and quantification of analytes
The effect of quality deficiencies on data reliability
The contractor follows the data validation process described in EPA-540-R-2017-001, National
Functional Guidelines for Inorganic Superfund Methods Data Review; and EPA-540-R-2017-002,
National Functional Guidelines for Organic Superfund Methods Data Review, adjusted for use with
DOE/RL-2019-76, REV. 0
2-21
SW-846 (current update), HASQARD (DOE/RL-96-68), and radiochemistry methods. The criteria for
data validation are based on a graded approach, using five levels of validation (Levels A through E).
Level A is the lowest level and is the same as verification. Level E is a 100% review of all data
(e.g., calibration data and calculations of representative samples from the data set). Data validation will
be performed to Level C, which is a review of the QC data. Level C validation consists of a review of the
QC data and specifically requires verification of deliverables; requested versus reported analytes; and
qualification of the results based on evaluation of analytical holding times, MB results, MS/MSD results,
SUR recoveries, and duplicate sample results. Level C data validation is generally equivalent to Level 2A
(EPA 540-R-08-005, Guidance for Labeling Externally Validated Laboratory Analytical Data for
Superfund Use). Level C data validation may be performed on at least 5% of the data by matrix and
analyte group under the direction of SMR. “Analyte group” refers to categories such as radionuclides,
volatile chemicals, semivolatiles, metals, and anions. The goal is to include each of the various analyte
groups and matrices during the data validation process. The DOE-RL project lead or OU project manager
may specify a higher percentage of data to be validated or that data validation be performed at
higher levels.
2.4.3 Reconciliation with User Requirements
The purpose of reconciliation with user requirements is to determine if quantitative data are of the correct
type and are of adequate quality and quantity to meet the project data needs. The DUA process is the
scientific and statistical evaluation of previously verified and validated data to determine if information
obtained from environmental data operations are of the right type, quality, and quantity to support their
intended use (usability). The DUA process uses the entirety of the collected data to determine usability
for decision making. If a statistical sampling design was used during field sampling activities, then the
DUA will be performed following guidance in EPA/240/B-06/003, Data Quality Assessment: Statistical
Methods for Practitioners (EPA QA/G-9S). When judgmental (focused) sampling designs are
implemented in the field, DQIs such as precision, accuracy/bias, representativeness, comparability,
completeness, and sensitivity for the specific data sets (individual data packages) will be evaluated in
accordance with EPA/240/R-02/004, Guidance on Environmental Data Verification and Data Validation
(EPA QA/G-8). Data verification and data validation are integral to the statistical data quality assessment
process and the DQI evaluation process. Results of the DUA processes will be used by the OU project
manager to interpret the data and determine if the DQOs for this activity have been met.

DOE/RL-2019-76, REV. 0
2-22
This page intentionally left blank.
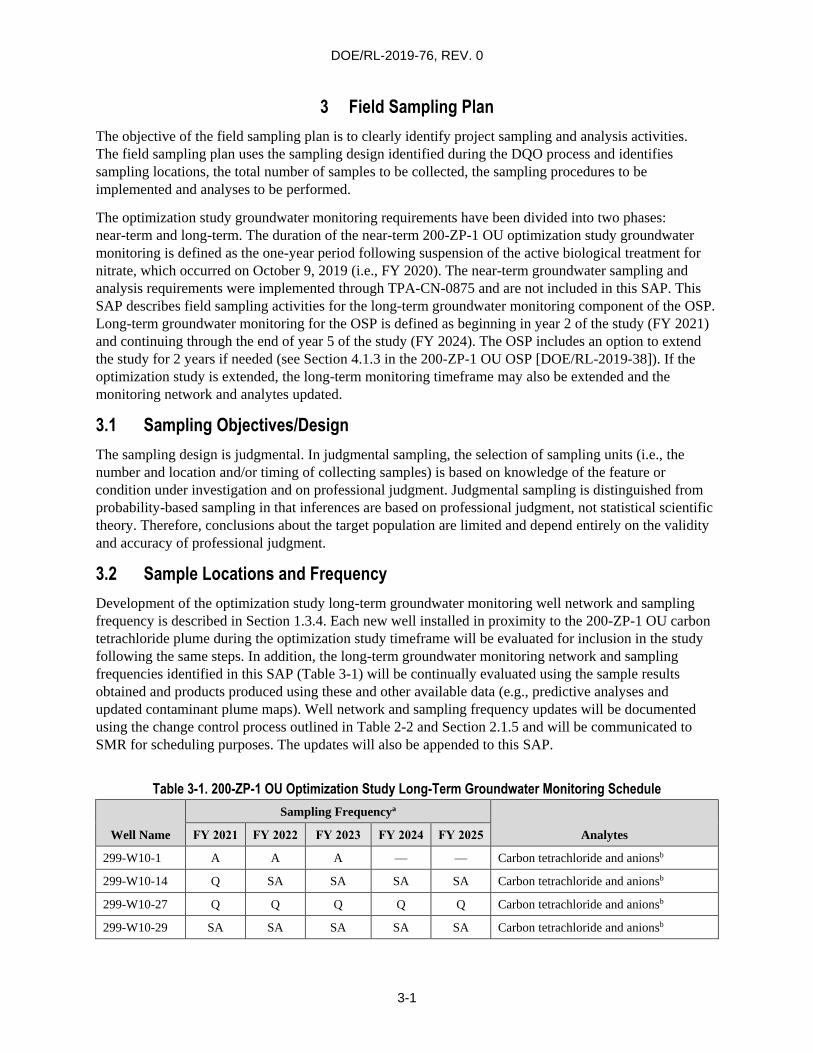
DOE/RL-2019-76, REV. 0
3-1
3 Field Sampling Plan
The objective of the field sampling plan is to clearly identify project sampling and analysis activities.
The field sampling plan uses the sampling design identified during the DQO process and identifies
sampling locations, the total number of samples to be collected, the sampling procedures to be
implemented and analyses to be performed.
The optimization study groundwater monitoring requirements have been divided into two phases:
near-term and long-term. The duration of the near-term 200-ZP-1 OU optimization study groundwater
monitoring is defined as the one-year period following suspension of the active biological treatment for
nitrate, which occurred on October 9, 2019 (i.e., FY 2020). The near-term groundwater sampling and
analysis requirements were implemented through TPA-CN-0875 and are not included in this SAP. This
SAP describes field sampling activities for the long-term groundwater monitoring component of the OSP.
Long-term groundwater monitoring for the OSP is defined as beginning in year 2 of the study (FY 2021)
and continuing through the end of year 5 of the study (FY 2024). The OSP includes an option to extend
the study for 2 years if needed (see Section 4.1.3 in the 200-ZP-1 OU OSP [DOE/RL-2019-38]). If the
optimization study is extended, the long-term monitoring timeframe may also be extended and the
monitoring network and analytes updated.
3.1 Sampling Objectives/Design
The sampling design is judgmental. In judgmental sampling, the selection of sampling units (i.e., the
number and location and/or timing of collecting samples) is based on knowledge of the feature or
condition under investigation and on professional judgment. Judgmental sampling is distinguished from
probability-based sampling in that inferences are based on professional judgment, not statistical scientific
theory. Therefore, conclusions about the target population are limited and depend entirely on the validity
and accuracy of professional judgment.
3.2 Sample Locations and Frequency
Development of the optimization study long-term groundwater monitoring well network and sampling
frequency is described in Section 1.3.4. Each new well installed in proximity to the 200-ZP-1 OU carbon
tetrachloride plume during the optimization study timeframe will be evaluated for inclusion in the study
following the same steps. In addition, the long-term groundwater monitoring network and sampling
frequencies identified in this SAP (Table 3-1) will be continually evaluated using the sample results
obtained and products produced using these and other available data (e.g., predictive analyses and
updated contaminant plume maps). Well network and sampling frequency updates will be documented
using the change control process outlined in Table 2-2 and Section 2.1.5 and will be communicated to
SMR for scheduling purposes. The updates will also be appended to this SAP.
Table 3-1. 200-ZP-1 OU Optimization Study Long-Term Groundwater Monitoring Schedule
Well Name
Sampling Frequencya
Analytes FY 2021 FY 2022 FY 2023 FY 2024 FY 2025
299-W10-1 A A A — — Carbon tetrachloride and anionsb
299-W10-14 Q SA SA SA SA Carbon tetrachloride and anionsb
299-W10-27 Q Q Q Q Q Carbon tetrachloride and anionsb
299-W10-29 SA SA SA SA SA Carbon tetrachloride and anionsb
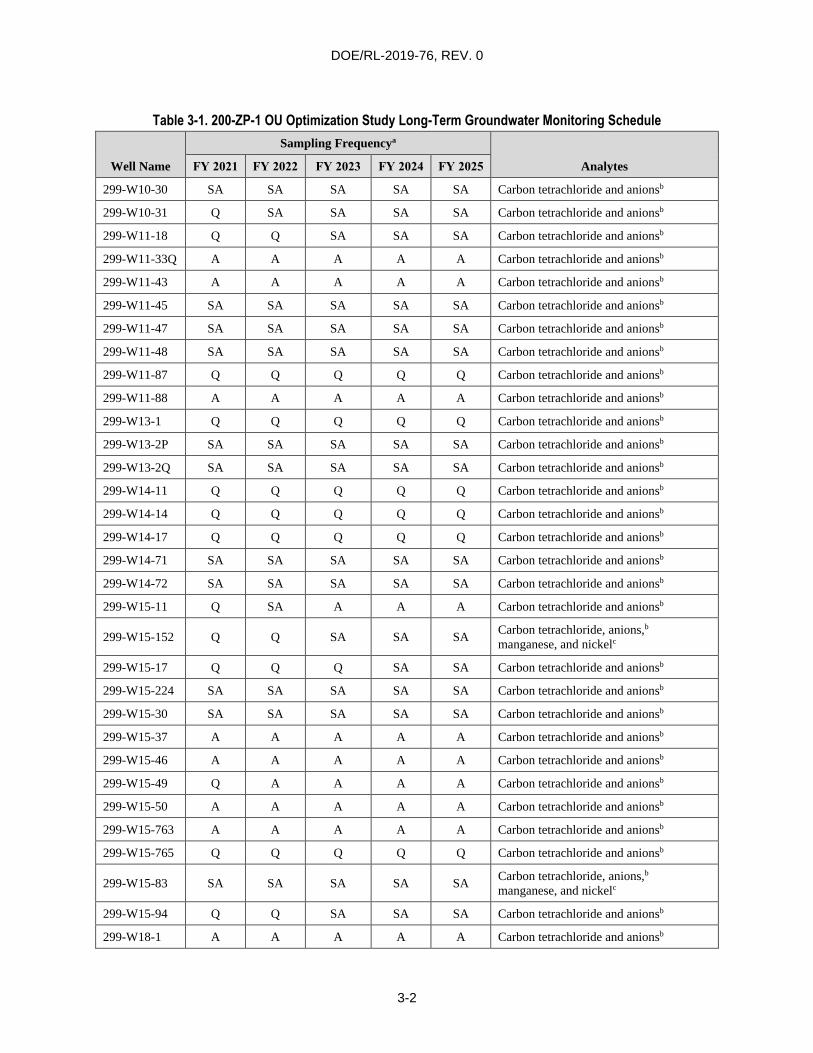
DOE/RL-2019-76, REV. 0
3-2
Table 3-1. 200-ZP-1 OU Optimization Study Long-Term Groundwater Monitoring Schedule
Well Name
Sampling Frequencya
Analytes FY 2021 FY 2022 FY 2023 FY 2024 FY 2025
299-W10-30 SA SA SA SA SA Carbon tetrachloride and anionsb
299-W10-31 Q SA SA SA SA Carbon tetrachloride and anionsb
299-W11-18 Q Q SA SA SA Carbon tetrachloride and anionsb
299-W11-33Q A A A A A Carbon tetrachloride and anionsb
299-W11-43 A A A A A Carbon tetrachloride and anionsb
299-W11-45 SA SA SA SA SA Carbon tetrachloride and anionsb
299-W11-47 SA SA SA SA SA Carbon tetrachloride and anionsb
299-W11-48 SA SA SA SA SA Carbon tetrachloride and anionsb
299-W11-87 Q Q Q Q Q Carbon tetrachloride and anionsb
299-W11-88 A A A A A Carbon tetrachloride and anionsb
299-W13-1 Q Q Q Q Q Carbon tetrachloride and anionsb
299-W13-2P SA SA SA SA SA Carbon tetrachloride and anionsb
299-W13-2Q SA SA SA SA SA Carbon tetrachloride and anionsb
299-W14-11 Q Q Q Q Q Carbon tetrachloride and anionsb
299-W14-14 Q Q Q Q Q Carbon tetrachloride and anionsb
299-W14-17 Q Q Q Q Q Carbon tetrachloride and anionsb
299-W14-71 SA SA SA SA SA Carbon tetrachloride and anionsb
299-W14-72 SA SA SA SA SA Carbon tetrachloride and anionsb
299-W15-11 Q SA A A A Carbon tetrachloride and anionsb
299-W15-152 Q Q SA SA SA Carbon tetrachloride, anions,b
manganese, and nickelc
299-W15-17 Q Q Q SA SA Carbon tetrachloride and anionsb
299-W15-224 SA SA SA SA SA Carbon tetrachloride and anionsb
299-W15-30 SA SA SA SA SA Carbon tetrachloride and anionsb
299-W15-37 A A A A A Carbon tetrachloride and anionsb
299-W15-46 A A A A A Carbon tetrachloride and anionsb
299-W15-49 Q A A A A Carbon tetrachloride and anionsb
299-W15-50 A A A A A Carbon tetrachloride and anionsb
299-W15-763 A A A A A Carbon tetrachloride and anionsb
299-W15-765 Q Q Q Q Q Carbon tetrachloride and anionsb
299-W15-83 SA SA SA SA SA Carbon tetrachloride, anions,b
manganese, and nickelc
299-W15-94 Q Q SA SA SA Carbon tetrachloride and anionsb
299-W18-1 A A A A A Carbon tetrachloride and anionsb
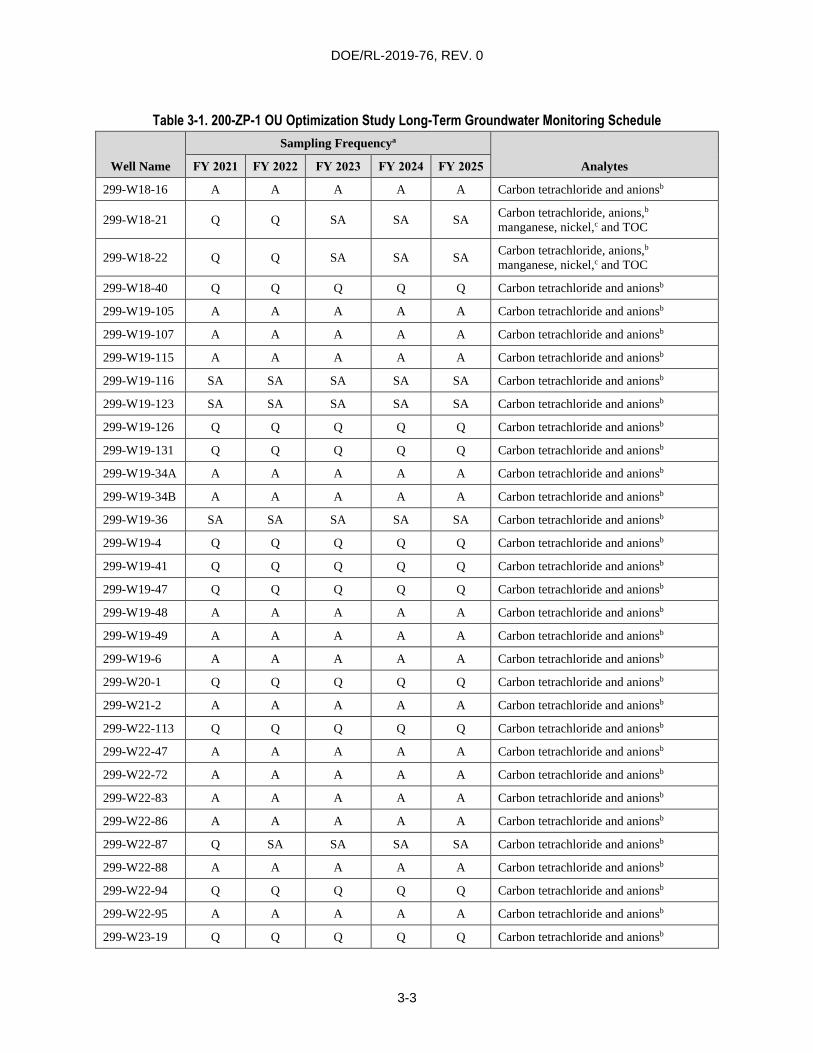
DOE/RL-2019-76, REV. 0
3-3
Table 3-1. 200-ZP-1 OU Optimization Study Long-Term Groundwater Monitoring Schedule
Well Name
Sampling Frequencya
Analytes FY 2021 FY 2022 FY 2023 FY 2024 FY 2025
299-W18-16 A A A A A Carbon tetrachloride and anionsb
299-W18-21 Q Q SA SA SA Carbon tetrachloride, anions,b
manganese, nickel,c and TOC
299-W18-22 Q Q SA SA SA Carbon tetrachloride, anions,b
manganese, nickel,c and TOC
299-W18-40 Q Q Q Q Q Carbon tetrachloride and anionsb
299-W19-105 A A A A A Carbon tetrachloride and anionsb
299-W19-107 A A A A A Carbon tetrachloride and anionsb
299-W19-115 A A A A A Carbon tetrachloride and anionsb
299-W19-116 SA SA SA SA SA Carbon tetrachloride and anionsb
299-W19-123 SA SA SA SA SA Carbon tetrachloride and anionsb
299-W19-126 Q Q Q Q Q Carbon tetrachloride and anionsb
299-W19-131 Q Q Q Q Q Carbon tetrachloride and anionsb
299-W19-34A A A A A A Carbon tetrachloride and anionsb
299-W19-34B A A A A A Carbon tetrachloride and anionsb
299-W19-36 SA SA SA SA SA Carbon tetrachloride and anionsb
299-W19-4 Q Q Q Q Q Carbon tetrachloride and anionsb
299-W19-41 Q Q Q Q Q Carbon tetrachloride and anionsb
299-W19-47 Q Q Q Q Q Carbon tetrachloride and anionsb
299-W19-48 A A A A A Carbon tetrachloride and anionsb
299-W19-49 A A A A A Carbon tetrachloride and anionsb
299-W19-6 A A A A A Carbon tetrachloride and anionsb
299-W20-1 Q Q Q Q Q Carbon tetrachloride and anionsb
299-W21-2 A A A A A Carbon tetrachloride and anionsb
299-W22-113 Q Q Q Q Q Carbon tetrachloride and anionsb
299-W22-47 A A A A A Carbon tetrachloride and anionsb
299-W22-72 A A A A A Carbon tetrachloride and anionsb
299-W22-83 A A A A A Carbon tetrachloride and anionsb
299-W22-86 A A A A A Carbon tetrachloride and anionsb
299-W22-87 Q SA SA SA SA Carbon tetrachloride and anionsb
299-W22-88 A A A A A Carbon tetrachloride and anionsb
299-W22-94 Q Q Q Q Q Carbon tetrachloride and anionsb
299-W22-95 A A A A A Carbon tetrachloride and anionsb
299-W23-19 Q Q Q Q Q Carbon tetrachloride and anionsb
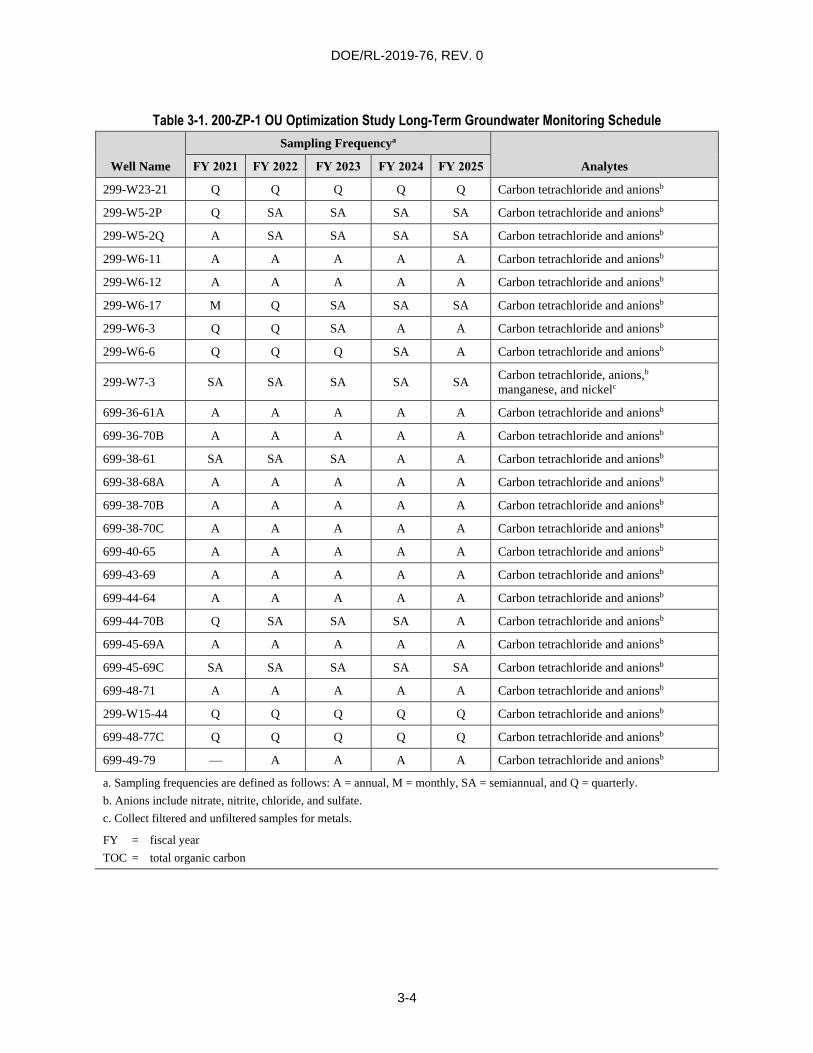
DOE/RL-2019-76, REV. 0
3-4
Table 3-1. 200-ZP-1 OU Optimization Study Long-Term Groundwater Monitoring Schedule
Well Name
Sampling Frequencya
Analytes FY 2021 FY 2022 FY 2023 FY 2024 FY 2025
299-W23-21 Q Q Q Q Q Carbon tetrachloride and anionsb
299-W5-2P Q SA SA SA SA Carbon tetrachloride and anionsb
299-W5-2Q A SA SA SA SA Carbon tetrachloride and anionsb
299-W6-11 A A A A A Carbon tetrachloride and anionsb
299-W6-12 A A A A A Carbon tetrachloride and anionsb
299-W6-17 M Q SA SA SA Carbon tetrachloride and anionsb
299-W6-3 Q Q SA A A Carbon tetrachloride and anionsb
299-W6-6 Q Q Q SA A Carbon tetrachloride and anionsb
299-W7-3 SA SA SA SA SA Carbon tetrachloride, anions,b
manganese, and nickelc
699-36-61A A A A A A Carbon tetrachloride and anionsb
699-36-70B A A A A A Carbon tetrachloride and anionsb
699-38-61 SA SA SA A A Carbon tetrachloride and anionsb
699-38-68A A A A A A Carbon tetrachloride and anionsb
699-38-70B A A A A A Carbon tetrachloride and anionsb
699-38-70C A A A A A Carbon tetrachloride and anionsb
699-40-65 A A A A A Carbon tetrachloride and anionsb
699-43-69 A A A A A Carbon tetrachloride and anionsb
699-44-64 A A A A A Carbon tetrachloride and anionsb
699-44-70B Q SA SA SA A Carbon tetrachloride and anionsb
699-45-69A A A A A A Carbon tetrachloride and anionsb
699-45-69C SA SA SA SA SA Carbon tetrachloride and anionsb
699-48-71 A A A A A Carbon tetrachloride and anionsb
299-W15-44 Q Q Q Q Q Carbon tetrachloride and anionsb
699-48-77C Q Q Q Q Q Carbon tetrachloride and anionsb
699-49-79 — A A A A Carbon tetrachloride and anionsb
a. Sampling frequencies are defined as follows: A = annual, M = monthly, SA = semiannual, and Q = quarterly.
b. Anions include nitrate, nitrite, chloride, and sulfate.
c. Collect filtered and unfiltered samples for metals.
FY = fiscal year
TOC = total organic carbon
DOE/RL-2019-76, REV. 0
3-5
3.3 Sampling Methods
Sampling may include, but is not limited to, the following methods:
Field screening measurements
Radiological screening
Borehole sampling
Groundwater sampling
Water-level measurements
Groundwater samples will be collected post-well purging in accordance with the current revision of
applicable operating methods, as described in general in the following discussion. Groundwater samples
are collected after field measurements of purged groundwater have stabilized:
pH: Two consecutive measurements agree within 0.2 pH units,
Temperature: Two consecutive measurements agree within 0.2°C (32.3°F).
Conductivity: Two consecutive measurements agree within 10% of each other.
Turbidity: Less than 5 nephelometric turbidity units (NTUs) prior to sampling (or upon
recommendation of the OU technical lead).
Dissolved oxygen and oxidation-reduction potential also will be measured in the field under this SAP.
Dissolved oxygen and oxidation-reduction potential measurements are not required to be stable prior to
sample collection.
Unless special requirements are requested from the OU technical lead, wells are typically purged using
the equivalent volume as that of three borehole diameters multiplied by the length of the saturated portion
of the well screen. Stable field readings are also required, as specified above. The default pumping rate is
7.6 to 45.4 L/min (2 to 12 gal/min) depending on the pump, although this is not practical at every well.
On occasions when the purge volume is extraordinarily large, wells are purged for a minimum of
one hour and then sampled once stable field readings are obtained.
Field measurements (except for turbidity) are obtained using a flow-through cell. Groundwater is pumped
directly from the well to the flow-through cell. At the beginning of the sampling event, field crews attach
a clean, stainless-steel sampling manifold to the riser discharge. The manifold has two valves and
two ports: one port is used only for purge water, and the other port is used to supply water to the
flow-through cell. Probes are inserted into the flow-through cell to measure pH, temperature,
conductivity, dissolved oxygen, and oxidation-reduction potential. Turbidity is measured by inserting
a sample vial into a turbidimeter. The purge water is discharged to the purge water truck.
Once field measurements have stabilized, the hose supplying water to the flow-through cell is
disconnected and a clean, stainless-steel drop leg is attached for sampling. The flow rate is reduced during
sampling to minimize loss of volatiles (if any) and prevent overfilling the bottles. Sample bottles are filled
in a sequence designed to minimize loss of volatiles (if any). Filtered samples are collected after
collection of the unfiltered samples. For some constituents (e.g., metals), both filtered and unfiltered
samples are collected. If additional samples require filtration (e.g., at turbidity >5 NTUs), an inline,
disposable 0.45 µm filter is used.
DOE/RL-2019-76, REV. 0
3-6
Typically, three traditional types of environmental-grade sampling pumps (i.e., Grundfos, Hydrostar™,
and submersible electrical pumps) are used for groundwater sampling at Hanford Site monitoring wells.
In addition, low-purge-volume, adjustable-rate bladder pumps may be used. Individual pumps are
selected based on the unique characteristics of the well and the sampling requirements.
A small number of wells may not support sample collection via pumping because of low yield or due to
the physical characteristics of the well. In these cases, a grab sample may be obtained. In cases where
there is not sufficient yield, purge water activities are not performed.
Low-purge-volume sampling methodology for collecting groundwater samples is also being implemented
at the Hanford Site. Low-flow purging and sampling uses a low-purge-volume, adjustable-rate bladder
pump with flow rates typically on the order of 0.1 to 0.5 L/min (0.26 to 0.13 gal/min). This methodology
is intended to minimize excessive movement of water from the soil formation into the well. The objective
is to pump in a manner that minimizes stress (drawdown) to the system. Purge volumes for wells using
low-purge bladder pumps are determined on a well-specific basis based on drawdown, pumping rate,
pump and sample line volume, and volume required to obtain stable field conditions prior to
collecting samples.
Preservatives are required for certain types of samples. Preservatives (based on the media type and
analytical methods) are added to the collection bottles before their use in the field. Groundwater samples
may require filtering in the field, as noted on the chain-of-custody form.
To ensure sample and data usability, the sampling associated with this SAP will be performed in
accordance with HASQARD requirements (DOE/RL-96-68) for sample collection, collection equipment,
sample handling, and sample shipment to the laboratory.
Table 2-6 specifies the sample preservation and holding-time requirements for groundwater samples.
These requirements are in accordance with the analytical methods specified in Table 2-3. The container
types, preservatives, and volumes will be identified on the sample authorization form and
chain-of-custody form. This SAP defines a “sample” as a set of filled sample bottles for the purpose of
beginning holding-time restrictions.
Holding times are the maximum periods allowed between sample collection and laboratory analysis,
as summarized in Table 2-6. Exceeding required holding times could result in changes in constituent
concentrations due to volatilization, decomposition, or other chemical alterations. Required
holding times depend on the constituent and are listed in analytical method compilations such as
APHA/AWWA/WEF, Standard Methods For the Examination of Water and Wastewater Compendium
(current revision). Recommended holding times are also provided in HASQARD (DOE/RL-96-68).
3.3.1 Decontamination of Sampling Equipment
Sampling equipment will be decontaminated in accordance with sampling equipment decontamination
methods. To prevent potential sample contamination, care should be taken to use decontaminated
equipment for each specific sampling activity.
Grundfos is a registered trademark of Grundfos Holding A/S Corporation, Bjerringbro, Denmark.
Hydrostar™ is a trademark of Instrumentation Northwest, Redmond, Washington.
DOE/RL-2019-76, REV. 0
3-7
Special care should be taken to avoid the following common ways in which cross-contamination or
background contamination may compromise the samples:
Improperly storing or transporting sampling equipment and sample containers
Contaminating the equipment or sample bottles by setting the equipment/sample bottle on or near
potential contamination sources (e.g., uncovered ground)
Handling bottles or equipment with dirty hands or gloves
Improperly decontaminating equipment before sampling or between sampling events
Decontamination of sampling equipment is performed using high-purity water in each step. In general,
three rinse cycles are performed to decontaminate sampling equipment: a detergent rinse, an acid rinse,
and a water rinse. During the detergent rinse, the equipment is washed in a phosphate-free detergent
solution, followed by rinsing with high-purity water in three sequential containers. After the third
high-purity water rinse, equipment that is stainless steel or glass is rinsed in a 1M nitric acid solution
(pH <2). Equipment is then rinsed with high-purity water in three sequential containers (the high-purity
water rinses following the acid rinse are conducted in separate water containers that are not used for
detergent rinse). Following the final high-purity water rinse, equipment is rinsed in hexane and then
placed on a rack to dry. Dry equipment is loaded into a drying oven, and the oven is set at 50°C (122°F)
for items that are not metal or glass or at 100°C (212°F) for metal or glass. Once reaching temperature,
the equipment is baked for 20 minutes and then cooled. The equipment is then removed from the oven,
and the equipment is wrapped in clean, unused aluminum foil using surgeon’s gloves. The wrapped
equipment is stored in a custody-locked, controlled access area.
To decontaminate sampling pumps that are not permanently installed, the pump cowling is first removed,
washed (if needed) in phosphate-free detergent solution, and then reinstalled on the pump. The pump is
then submerged in phosphate-free detergent solution, and 11.4 L (3 gal) of solution are pumped through
the unit and disposed. Detergent solution is then circulated through the submerged pump in high-purity
water and 30.3 L (8 gal) of high-purity water are pumped through the unit and disposed. The pump is
removed from the high-purity water and the intake and housing are covered with plastic sleeving.
The cleaning is documented on a tag affixed to the pump, which includes the following information:
Date pump cleaned
Pump identification
Comments
Signature of person performing the decontamination
3.3.2 Radiological Field Data
Alpha and beta/gamma data collection in the field will be used as needed to support sampling and
analysis efforts. Radiological screening will be performed by the RCT or other qualified personnel in
accordance with Hanford Site procedures. The RCT will record field measurements, noting the location of
the sample and the elevated instrument reading. Elevated measurements will be relayed for inclusion in
the field activity report or operational records, as applicable.
The following information will be provided to field personnel performing work in support of this SAP:
Instructions to RCTs on the methods required to measure sample activity and media for gamma,
alpha, and/or beta emissions, as appropriate.
DOE/RL-2019-76, REV. 0
3-8
Information regarding the portable radiological field instrumentation including a physical description
of the instruments, radiation and energy response characteristics, calibration/maintenance and
performance testing descriptions, and the application/operation of the instrument. These instruments
are commonly used at the Hanford Site to obtain measurements of removable surface contamination
measurements and direct measurements of the total surface contamination.
Instructions regarding the minimum requirements for documenting radiological controls information
in accordance with 10 CFR 835, “Occupational Radiation Protection.”
Instructions for managing the identification, creation, review, approval, storage, transfer, and retrieval
of radiological information.
The minimum standards and practices necessary for preparing, performing, and retaining
radiological-related information.
The requirements associated with preparing and transporting regulated material.
Daily reports of radiological surveys and measurements collected during conduct of field
investigation activities. Data will be cross-referenced between laboratory analytical data and radiation
measurements to facilitate interpreting the investigation results.
3.3.3 Water Levels
Groundwater levels are measured annually across the Hanford Site to construct water table maps that are
used to determine the direction and rate of groundwater flow in the unconfined aquifer (SGW-38815).
Water levels are also measured in wells that are screened in confined or partially confined aquifers to help
determine horizontal and vertical hydraulic gradients.
Using a calibrated depth measurement tape, the depth to water is also recorded in each well prior to
sampling. When two consecutive measurements are taken that agree within 6 mm (0.24 in.), the final
determined measurement is recorded, along with the date and time for the specific event. The depth to
groundwater is subtracted from the elevation of a reference point (usually the top of the casing) to obtain
the water-level elevation. The top of the casing is a known elevation reference point because it has been
surveyed to local reference data.
3.4 Documentation of Field Activities
Logbooks and data forms are required for sampling field activities and will be used in accordance with
HASQARD requirements (DOE/RL-96-68). A logbook must be identified with a unique project name
and number. Only authorized persons may make entries into logbooks. Logbook entries will be reviewed
by the FWS, cognizant scientist/engineer, or other responsible manager; the review will be documented
with a signature and date. Logbooks will be permanently bound, waterproof, and ruled with sequentially
numbered pages. Pages will not be removed from logbooks for any reason. Entries will be made in
indelible ink. Corrections will be made by marking through the erroneous data with a single line, entering
the correct data, and initialing and dating the changes.
Data forms may be used to collect field information; however, information recorded on data forms must
follow the same requirements as those for logbooks. The data forms must be referenced in the logbooks.
A summary of information to be recorded in logbooks or on the data forms is as follows:
Day and date; time task started; weather conditions; and names, titles, and organizations of personnel
performing the task.
DOE/RL-2019-76, REV. 0
3-9
Purpose of visit to the task area.
Site activities in specific detail (e.g., maps and drawings) or the forms used to record such
information (e.g., soil boring log or well completion log). Also, details of any field tests that were
conducted, as well as reference to any forms that were used, other data records, and methods followed
in conducting the activity.
Details of any field calibrations and surveys that were conducted. Reference any forms that were
used, other data records, and the methods followed in conducting the calibrations and surveys.
Details of any samples collected and the preparation (if any) of SPLITS, DUPs, MSs, or field blanks.
Reference the methods followed for sample collection or preparation; list the location of the sample
collected, sample type, each label or tag numbers, sample identification, sample containers and
volume, preservation method, packaging, chain-of-custody form number, and analytical request form
number pertinent to each sample or sample set; and note the time and the name of the individual to
whom sample custody was transferred.
Time, equipment type, serial or identification number, and methods followed for decontamination and
equipment maintenance performed. Reference the page numbers of any logbook where detailed
information is recorded.
Any equipment failures or breakdowns that occurred, with a brief description of repairs
or replacements
3.4.1 Corrective Actions and Deviations for Sampling Activities
The OU project manager, FWS, appropriate field crew supervisors, and SMR personnel must document
deviations from protocols and any issues pertaining to sample collection, chain-of-custody forms, target
analytes, contaminants, sample transport, or noncompliant monitoring. An example of a deviation would
be samples not collected due to field conditions.
As appropriate, such deviations or issues will be documented (e.g., in the field logbook) in accordance
with internal corrective action methods. The OU project manager, FWS, field crew supervisors, or SMR
personnel will be responsible for communicating field corrective action requirements and ensuring that
corrective actions are applied to field activities as soon as practical.
Changes in sample activities that require notification, approval, and documentation will be performed as
specified in Table 2-2.
3.5 Calibration of Field Equipment
Onsite environmental instruments are calibrated in accordance with manufacturers’ operating instructions,
internal work requirements and processes, and/or field instructions that provide direction for equipment
calibration or verification of accuracy by analytical methods. Calibration records will include the raw
calibration data, identification of the standards used, associated reports, date of analysis, and analyst’s
name or initials. The results from all instrument calibration activities are recorded in accordance with
HASQARD requirements (DOE/RL-96-68).
Field instrumentation calibration and QA checks will be performed as follows:
Prior to initial use of a field analytical measurement system.
At the frequency recommended by the manufacturer or methods, or as required by regulations.
DOE/RL-2019-76, REV. 0
3-10
Upon failure to meet specified QC criteria.
Calibration of radiological field instruments on the Hanford Site is performed by the MSA prime
contractor, as specified by their calibration program.
Daily calibration checks, as required, will be performed and documented for each instrument used.
These checks will be made on standard materials sufficiently like the matrix under consideration for
direct comparison of data. Analysis times will be sufficient to establish detection efficiency
and resolution.
Using standards for calibration that are traceable to a nationally recognized standard agency source or
measurement system. Manufacturers’ recommendations for storage and handling of standards (if any)
will be followed. Expired standards will not be used for calibration.
3.6 Sample Handling
Sample handling and transfer will be in accordance with established methods to preclude loss of identity,
damage, deterioration, and loss of sample. Custody seals or custody tape will be used to verify that
sample integrity has been maintained during sample transport. The custody seal will be inscribed with the
sampler’s initials and date. If, during the chain-of-custody process, it is discovered that the custody tape
has been tampered with or broken on the sample bottle, the sample will be analyzed but the results will
include a flag to indicate that custody was broken. If the custody tape has been tampered with or broken
on the cooler, the sample custodian shall note this on the sample receiving documentation.
A sampling and analytical database is used to track samples from the point of collection through the
laboratory analysis process.
3.6.1 Containers
Samples will be collected (where and when appropriate) in break-resistant containers. The field sample
collection record will indicate the lot number of the bottles used in sample collection. When commercially
pre-cleaned containers are used in the field, the lot identification will be retained for documentation.
Containers will be capped and stored in an environment that minimizes the possibility of sample container
contamination. If contamination of the stored sample containers occurs, corrective actions will be
implemented to prevent reoccurrences. Contaminated sample containers cannot be used for a sampling
event. Container sizes may vary depending on laboratory-specific volumes/requirements for meeting
analytical detection limits. Container types and sample amounts/volumes are identified on the
chain-of-custody form.
If required, the Radiological Control organization will measure the contamination levels and the dose
rates associated with the filled sample containers. This information and other data will be used to
select proper packaging, marking, labeling, and shipping paperwork and to verify that the sample can
be received by the analytical laboratory in accordance with the laboratory’s radioactivity acceptance
criteria. If the dose rate on the outside of a sample container or the curie content exceeds levels acceptable
by an offsite laboratory, the FWS (in consultation with SMR) can send smaller sample volumes to
the laboratory.
DOE/RL-2019-76, REV. 0
3-11
3.6.2 Container Labeling
Each sample is identified by affixing a standardized label or tag to the container. This label or tag will
contain the sample identification number. The label will identify (or provide reference to associate the
sample with) the date and time of collection, preservative used (if applicable), analysis required, and the
collector’s name or initials. Sample labels may be either pre-printed or handwritten in indelible or
waterproof ink.
3.6.3 Sample Custody
Sample custody will be maintained in accordance with existing protocols to ensure that sample integrity
is maintained throughout the analytical process. Chain-of-custody protocols will be followed
throughout sample collection, transfer, analysis, and disposal to ensure that sample integrity is
maintained. A chain-of-custody record will be initiated in the field at the time of sampling and will
accompany each sample or set of samples shipped to any laboratory.
Shipping requirements will determine how sample shipping containers are prepared for shipment.
The analyses requested for each sample will be indicated on the accompanying chain-of-custody form.
Each time the responsibility for sample custody changes, the new and previous custodians will sign the
record and note the date and time. The field sampling team will make a copy of the signed record before
sample shipment and transmit the copy to SMR.
The following minimum information is required on a completed chain-of-custody form:
Project name
Collectors’ names
Unique sample number
Date, time, and location (or traceable reference thereto) of sample collection
Matrix
Preservatives
Chain-of-possession information (i.e., signatures and printed names of each individual involved in the
transfer of sample custody and storage locations, and dates/times of receipt and relinquishment)
Requested analyses (or reference thereto)
Number of sample containers per unique sample identification number
Shipped-to information (i.e., analytical laboratory performing the analysis)
Samplers should note any anomalies with the samples. If anomalies are found, samplers should inform
SMR so special direction for analysis can be provided to the laboratory if deemed necessary.
Sample custody will be maintained at subcontract laboratories in accordance with established procedures.
Upon receipt of samples, subcontract laboratories will notify SMR of any Hanford Site chain-of-custody
issues. Subcontracted laboratories will also notify SMR of any chain-of-custody issues identified within
the laboratory.
DOE/RL-2019-76, REV. 0
3-12
3.6.4 Sample Transportation
Packaging and transportation instructions will comply with applicable transportation regulations and DOE
requirements. Regulations for classifying, describing, packaging, marking, labeling, and transporting
hazardous materials, hazardous substances, and hazardous wastes are enforced by the U.S. Department of
Transportation (DOT) as described in 49 CFR 171, “Transportation,” “General Information, Regulations,
and Definitions,” through 177, “Carriage by Public Highway.”2 Carrier-specific requirements defined in
the current edition of International Air Transportation Association (IATA) Dangerous Goods Regulations
will also be used when preparing sample shipments conveyed by air freight providers.
Samples containing hazardous constituents above regulated amounts will be considered hazardous
material in transportation and will be transported in accordance with DOT/IATA requirements. If the
sample material is known or can be identified, then it will be packaged, marked, labeled, and shipped
according to the specific instructions for that material. Appropriate laboratory notifications will be made,
if necessary, through the SMR project coordinator.
Materials are classified by DOT/IATA as radioactive when the isotope specific activity concentration
and the exempt consignment limits described in 49 CFR 173, “Shippers—General Requirements for
Shipments and Packagings,” are exceeded. Samples will be screened (or relevant historical data will be
used) to determine if these values are exceeded. When screening or historical data indicate that samples
are radioactive, the radioactive samples will be properly classified, described, packaged, marked, labeled,
and transported in accordance with DOT/IATA requirements.
Prior to shipping radioactive samples to the laboratory, the organization responsible for shipping will
notify the laboratory of the approximate number of and radiological levels of the samples. The laboratory
is responsible for ensuring that the applicable license limits are not exceeded. Prior to sample receipt, the
laboratory will provide SMR with written acceptance for the samples with elevated radioactive
contamination or dose.
2 Transportation regulations 49 CFR 174, “Carriage by Rail”; and 49 CFR 176, “Carriage by Vessel,” are not
applicable, as these two transportation methods are not used.
DOE/RL-2019-76, REV. 0
4-1
4 Management of Waste
Waste materials are generated during sample collection, processing, and subsampling activities. Waste
will be managed in accordance with Appendix B of the 200 West P&T O&M plan (DOE/RL-2009-124).
Miscellaneous solid waste that has contacted suspect dangerous waste will be managed as dangerous
waste. Purge water and decontamination fluids will be collected and managed in accordance with
DOE/RL-2009-80, Investigation Derived Waste Purgewater Management Work Plan; and
DOE/RL-2011-41, Hanford Site Strategy for Management of Investigation Derived Waste. Packaging
and labeling during waste storage and transportation will meet the applicable substantive federal and/or
state requirements. Waste materials requiring collection will be placed in containers appropriate for the
material and the receiving facility in accordance with the applicable waste management or waste control
plan and applicable substantive federal and/or state requirements.
Offsite analytical laboratories are responsible for the disposal of unused sample quantities and wastes
from analytical processes.

DOE/RL-2019-76, REV. 0
4-2
This page intentionally left blank.
DOE/RL-2019-76, REV. 0
5-1
5 Health and Safety
DOE established the hazardous waste operations safety and health program pursuant to the
Price-Anderson Amendments Act of 1988 to ensure the safety and health of workers involved in
mixed-waste site activities. The program was developed to comply with the requirements of 10 CFR 851,
“Worker Safety and Health Program,” which incorporates the standards of 29 CFR 1910.120,
“Occupational Safety and Health Standards,” “Hazardous Waste Operations and Emergency Response”;
10 CFR 830, “Nuclear Safety Management”; and 10 CFR 835. The health and safety program defines the
chemical, radiological, and physical hazards and specifies the controls and requirements for daily work
activities on the overall Hanford Site. Personnel training; control of industrial safety and radiological
hazards; personal protective equipment; site control and general emergency response to spills, fire,
accidents, injury, site visitors; and incident reporting are governed by the health and safety program.
Site-specific health and safety plans will be used to supplement the general health and safety program.

DOE/RL-2019-76, REV. 0
5-2
This page intentionally left blank.
DOE/RL-2019-76, REV. 0
6-1
6 Reporting
Interim and final reporting for the 200-ZP-1 OU optimization study is presented in Chapter 9 of the
200-ZP-1 OU OSP (DOE/RL-2019-38). The work performed under this SAP and the results and
information acquired will be presented in multiple reports. The activities detailed in this SAP are intended
to support Task 3 and will be documented as part of Task 4 of the 200-ZP-1 OU optimization study.
During Tasks 1, 2, and 3 of the optimization study, interim reporting of optimization study progress,
annual operational costs, and remedy performance will be incorporated in annual 200 West P&T reports.
During Task 4, a final optimization study report will be prepared to summarize the results of the
optimization study (as detailed in Section 9.2 of DOE/RL-2019-38). In addition, the laboratories will
report sample results in analytical data packages.
The long-term groundwater monitoring network and sampling frequencies for the monitoring wells and
associated analytes identified in this SAP (Table 3-1) will be continually evaluated using the sample
results obtained and products produced using these and other available data (e.g., predictive analyses and
updated contaminant plume maps). Reporting will be periodically as needed (i.e., quarterly or
semiannually) to report on progress, in addition to the annual reporting identified above for Tasks 1, 2,
and 3. Well network and sampling frequency changes or updates will be documented using the change
control process outlined in Table 2-2 and Section 2.1.5 and will be communicated to SMR for
scheduling purposes.

DOE/RL-2019-76, REV. 0
6-2
This page intentionally left blank.
DOE/RL-2019-76, REV. 0
7-1
7 References
10 CFR 830, “Nuclear Safety Management,” Subpart A, “Quality Assurance Requirements,” Code of
Federal Regulations. Available at: http://www.ecfr.gov/cgi-bin/text-
idx?c=ecfr&rgn=div5&view=text&node=10:4.0.2.5.27&idno=10.
10 CFR 835, “Occupational Radiation Protection,” Code of Federal Regulations. Available at:
http://www.ecfr.gov/cgi-bin/text-
idx?SID=15c56aeaa1e8ea2a2fb3914f862177e0&mc=true&node=pt10.4.835&rgn=div5.
10 CFR 851, “Worker Safety and Health Program,” Code of Federal Regulations. Available at:
http://www.ecfr.gov/cgi-bin/text-
idx?SID=47e3de0454360a17406cb89ade0c966d&mc=true&node=pt10.4.851&rgn=div5.
29 CFR 1910.120, “Occupational Safety and Health Standards,” “Hazardous Waste Operations and
Emergency Response,” Code of Federal Regulations. Available at: http://www.ecfr.gov/cgi-
bin/text-idx?c=ecfr&rgn=div8&view=text&node=29:5.1.1.1.8.8.33.14&idno=29.
49 CFR, “Transportation,” Code of Federal Regulations. Available at: http://www.ecfr.gov/cgi-bin/text-
idx?SID=670b98fcf27b2244917cfdf3293b16e4&tpl=/ecfrbrowse/Title49/49cfrv2_02.tpl#0.
171, “General Information, Regulations, and Definitions.”
172, “Hazardous Materials Table, Special Provisions, Hazardous Materials Communications,
Emergency Response Information, Training Requirements, and Security Plans.”
173, “Shippers—General Requirements for Shipments and Packagings.”
175, “Carriage by Aircraft.”
177, “Carriage by Public Highway.”
APHA/AWWA/WEF, Standard Methods For the Examination of Water and Wastewater, current
revision, American Public Health Association, American Water Works Association, and Water
Environment Federation, Washington, D.C.
Atomic Energy Act of 1954, as amended, 42 USC 2011, Pub. L. 83-703, 68 Stat. 919. Available at:
https://www.energy.gov/sites/prod/files/2017/10/f38/Atomic%20Energy%20Act%20of%201954
%20%28AEA%29%20in%20U.S.C..pdf.
Comprehensive Environmental Response, Compensation, and Liability Act of 1980, 42 USC 9601, et seq.,
Pub. L. 107-377, December 31, 2002. Available at:
https://www.csu.edu/cerc/researchreports/documents/CERCLASummary1980.pdf.
CP-57037, 2020, Model Package Report: Plateau to River Groundwater Model Version 8.3, Rev. 2,
CH2M HILL Plateau Remediation Company, Richland, Washington. Available at:
https://pdw.hanford.gov/document/AR-03674.
DoD/DOE, 2019, Department of Defense (DoD) Department of Energy (DOE) Consolidated Quality
Systems Manual (QSM) for Environmental Laboratories, Version 5.3, U.S. Department of
Defense Data Quality Workgroup and the U.S. Department of Energy Consolidated Audit
Program, Washington, D.C. Available at: https://denix.osd.mil/edqw/documents/manuals/qsm-
version-5-3-final/.
DOE/RL-2019-76, REV. 0
7-2
DOE/RL-96-68, 2014, Hanford Analytical Services Quality Assurance Requirements Document,
Volume 1, Administrative Requirements; Volume 2, Sampling Technical Requirements; Volume 3,
Field Analytical Technical Requirements; and Volume 4, Laboratory Technical Requirements,
Rev. 4, U.S. Department of Energy, Richland Operations Office, Richland, Washington.
Available at:
http://www.hanford.gov/files.cfm/DOE-RL-96-68-VOL1-04.pdf.
http://www.hanford.gov/files.cfm/DOE-RL-96-68-VOL2-04.pdf.
http://www.hanford.gov/files.cfm/DOE-RL-96-68-VOL3-04.pdf.
http://www.hanford.gov/files.cfm/DOE-RL-96-68-VOL4-04.pdf.
DOE/RL-2007-28, 2008, Feasibility Study Report for the 200-ZP-1 Groundwater Operable Unit, Rev. 0,
U.S. Department of Energy, Richland Operations Office, Richland, Washington. Available at:
https://pdw.hanford.gov/document/0808050315.
https://pdw.hanford.gov/document/00098828.
DOE/RL-2008-78, 2009, 200 West Area 200-ZP-1 Pump-and-Treat Remedial Design/Remedial Action
Work Plan, Rev. 0 REISSUE, U.S. Department of Energy, Richland Operations Office, Richland,
Washington. Available at: https://pdw.hanford.gov/document/0096137.
DOE/RL-2008-78, 200 West Area 200-ZP-1 Pump-and-Treat Remedial Design/Remedial Action Work
Plan, Rev. 1, U.S. Department of Energy, Richland Operations Office, Richland, Washington.
Available at: https://pdw.hanford.gov/document/AR-04507.
DOE/RL-2009-80, 2009, Investigation Derived Waste Purgewater Management Work Plan, Rev. 0,
U.S. Department of Energy, Richland Operations Office, Richland, Washington. Available at:
https://pdw.hanford.gov/document/0095792.
DOE/RL-2009-115, 2020, Performance Monitoring Plan for the 200-ZP-1 Groundwater Operable Unit
Remedial Action, Rev. 3, U.S. Department of Energy, Richland Operations Office, Richland,
Washington. Available at: https://pdw.hanford.gov/document/AR-03747.
DOE/RL-2009-124, 200 West Pump and Treat Operations and Maintenance Plan, current revision,
U.S. Department of Energy, Richland Operations Office, Richland, Washington.
DOE/RL-2011-41, 2011, Hanford Site Strategy for Management of Investigation Derived Waste, Rev. 0,
U.S. Department of Energy, Richland Operations Office, Richland, Washington. Available at:
https://pdw.hanford.gov/document/0093937.
DOE/RL-2014-48, 2016, Response Action Report for the 200-PW-1 Operable Unit Soil Vapor Extraction
Remediation, Rev. 0, U.S. Department of Energy, Richland Operations Office, Richland,
Washington. Available at https://pdw.hanford.gov/document/0074963H.
DOE/RL-2019-23, 2020, 200-ZP-1 Operable Unit Ringold Formation A Characterization Sampling and
Analysis Plan, Rev. 0, U.S. Department of Energy, Richland Operations Office, Richland,
Washington. Available at: https://pdw.hanford.gov/document/AR-03566.
DOE/RL-2019-38, 2019, 200-ZP-1 Operable Unit Optimization Study Plan, Rev. 0, U.S. Department of
Energy, Richland Operations Office, Richland, Washington. Available at:
https://pdw.hanford.gov/document/AR-03236.
DOE/RL-2019-76, REV. 0
7-3
DOE/RL-2019-68, 2020, Calendar Year 2019 Annual Summary Report for Pump and Treat Operations in
the Hanford Site Central Plateau Operable Units, Rev. 0, U.S. Department of Energy, Richland
Operations Office, Richland, Washington. Available at: https://pdw.hanford.gov/document/AR-
04159.
ECF-200ZP1-20-0056, Calculations to Support Monitoring Network and Sampling Frequency Planning
for the 200-ZP-1 Groundwater Operable Unit (OU) Optimization Study Period, Rev. 0 (pending),
CH2M HILL Plateau Remediation Company, Richland, Washington.
Ecology, EPA, and DOE, 1989a, Hanford Federal Facility Agreement and Consent Order, 2 vols.,
as amended, Washington State Department of Ecology, U.S. Environmental Protection Agency,
and U.S. Department of Energy, Olympia, Washington. Available at:
http://www.hanford.gov/?page=81.
Ecology, EPA, and DOE, 1989b, Hanford Federal Facility Agreement and Consent Order Action Plan,
Washington State Department of Ecology, U.S. Environmental Protection Agency, and
U.S. Department of Energy, Olympia, Washington. Available at:
http://www.hanford.gov/?page=82.
Ecology Publication No. 04-03-030, 2004, Guidelines for Preparing Quality Assurance Project Plans for
Environmental Studies, revised December 2016, Washington State Department of Ecology,
Olympia, Washington. Available at:
https://fortress.wa.gov/ecy/publications/documents/0403030.pdf.
EPA/240/B-01/003, 2001, EPA Requirements for Quality Assurance Project Plans, EPA QA/R-5, Office
of Environmental Information, U.S. Environmental Protection Agency, Washington, D.C.
Available at: https://www.epa.gov/sites/production/files/2016-06/documents/r5-final_0.pdf.
EPA/240/B-06/001, 2006, Guidance on Systematic Planning Using the Data Quality Objectives Process,
EPA QA/G-4, Office of Environmental Information, U.S. Environmental Protection Agency,
Washington, D.C. Available at:
https://www.epa.gov/sites/production/files/documents/guidance_systematic_planning_dqo_proce
ss.pdf.
EPA/240/B-06/003, 2006, Data Quality Assessment: Statistical Methods for Practitioners,
EPA QA/G-9S, Office of Environmental Information, U.S. Environmental Protection Agency,
Washington, D.C. Available at: https://www.epa.gov/sites/production/files/2015-
08/documents/g9s-final.pdf.
EPA/240/R-02/004, 2002, Guidance on Environmental Data Verification and Data Validation,
EPA QA/G-8, Office of Environmental Information, U.S. Environmental Protection Agency,
Washington, D.C. Available at: https://www.epa.gov/sites/production/files/2015-
06/documents/g8-final.pdf.
EPA/240/R-02/009, 2002, Guidance for Quality Assurance Project Plans, EPA QA/G-5, Office of
Environmental Information, U.S. Environmental Protection Agency, Washington, D.C.
Available at: https://www.epa.gov/sites/production/files/2015-06/documents/g5-final.pdf.
EPA 540-R-08-005, 2009, Guidance for Labeling Externally Validated Laboratory Analytical Data for
Superfund Use, OSWER 9200.1-85, Office of Solid Waste and Emergency Response,
U.S. Environmental Protection Agency, Washington, D.C. Available at:
https://nepis.epa.gov/Exe/ZyPURL.cgi?Dockey=P1002WWF.TXT.
DOE/RL-2019-76, REV. 0
7-4
EPA-540-R-2017-001, 2017, National Functional Guidelines for Inorganic Superfund Methods Data
Review, Office of Superfund Remediation and Technology Innovation, U.S. Environmental
Protection Agency, Washington, D.C. Available at:
https://www.epa.gov/sites/production/files/2017-
01/documents/national_functional_guidelines_for_inorganic_superfund_methods_data_review_0
1302017.pdf.
EPA-540-R-2017-002, 2017, National Functional Guidelines for Organic Superfund Methods Data
Review, Office of Superfund Remediation and Technology Innovation, U.S. Environmental
Protection Agency, Washington, D.C. Available at:
https://www.epa.gov/sites/production/files/2017-
01/documents/national_functional_guidelines_for_organic_superfund_methods_data_review_013
072017.pdf.
EPA 542-R-13-008, 2013, Remediation Optimization: Definition, Scope and Approach, Office of Solid
Waste and Emergency Response and Office of Superfund Remediation and Technology
Innovation, U.S. Environmental Protection Agency, Washington, D.C. Available at:
https://www.epa.gov/sites/production/files/2015-
08/documents/optimizationprimer_final_june2013.pdf.
EPA/600/R-93/100, 1993, Methods for the Determination of Inorganic Substances in Environmental
Samples, Office of Research and Development, U.S. Environmental Protection Agency,
Cincinnati, Ohio. Available at:
https://nepis.epa.gov/Exe/ZyPDF.cgi/30002U3P.PDF?Dockey=30002U3P.PDF.
EPA, Ecology, and DOE, 2008, Record of Decision Hanford 200 Area 200-ZP-1 Superfund Site, Benton
County, Washington, U.S. Environmental Protection Agency, Washington State Department of
Ecology, and U.S. Department of Energy, Olympia, Washington. Available at:
https://pdw.hanford.gov/document/00098825.
IATA, 2019, Dangerous Goods Regulations, 60th Edition, International Air Transport Association,
Montreal, Quebec, Canada.
PNNL-22062, 2012, Abiotic Degradation Rates for Carbon Tetrachloride and Chloroform: Final Report,
RPT-DVZ-AFRI-012, Pacific Northwest National Laboratory, Richland, Washington. Available
at: https://www.pnnl.gov/main/publications/external/technical_reports/PNNL-22062.pdf.
Price-Anderson Amendments Act of 1988, Pub. L. 100-408, Aug. 20, 1988, 102 Stat. 1066, 42 USC 2010,
et seq. Available at: https://www.govinfo.gov/content/pkg/STATUTE-102/pdf/STATUTE-102-
Pg1066.pdf.
Resource Conservation and Recovery Act of 1976, Pub. L. 94-580, 42 USC 6901 et seq. Available at:
https://www.gpo.gov/fdsys/pkg/STATUTE-90/pdf/STATUTE-90-Pg2795.pdf.
SGW-38815, 2009, Water-Level Monitoring Plan for the Hanford Site Soil and Groundwater
Remediation Project, Rev. 0, CH2M HILL Plateau Remediation Company, Richland,
Washington. Available at: https://pdw.hanford.gov/document/0082378H.
SGW-64504-VA, 2020, 200 West Pump and Treat Facility – 4th Quarter CY2019 Briefing, Rev. 0
pending, CH2M HILL Plateau Remediation Company, Richland, Washington.
DOE/RL-2019-76, REV. 0
7-5
SGW-65172-VA, 2020, 200-ZP-1 Optimization Study – Resolution of RL Comments Regarding
Integration of a Comprehensive Remediation Evaluation of Groundwater Plumes and Well
Networks, Rev. 0, CH2M HILL Plateau Remediation Company, Richland, Washington. Available
at: https://pdw.hanford.gov/document/AR-04157.
SW-846, Test Methods for Evaluating Solid Waste: Physical/Chemical Methods, current update, Office
of Solid Waste and Emergency Response, U.S. Environmental Protection Agency,
Washington, D.C. Available at: https://www.epa.gov/hw-sw846.
TPA-CN-0875, 2019, TPA Change Notice Form, DOE/RL-2009-115, Performance Monitoring Plan for
the 200-ZP-1 Operable Unit Remedial Action, Revision 2, U.S. Department of Energy, Richland
Operations Office, Richland, Washington, November 6. Available at:
https://pdw.hanford.gov/document/AR-03254.
WAC 173-160, “Minimum Standards for Construction and Maintenance of Wells,” Washington
Administrative Code, Olympia, Washington. Available at:
http://apps.leg.wa.gov/WAC/default.aspx?cite=173-160.
WAC 173-340-720, “Model Toxics Control Act—Cleanup,” “Groundwater Cleanup Standards,”
Washington Administrative Code, Olympia, Washington. Available at:
http://apps.leg.wa.gov/WAC/default.aspx?cite=173-340-720.

DOE/RL-2019-76, REV. 0
7-6
This page intentionally left blank.
DOE/RL-2019-76, REV. 0
A-i
Appendix A
Data Quality Objectives for the 200-ZP-1 Operable Unit
Optimization Study

DOE/RL-2019-76, REV. 0
A-ii
This page intentionally left blank.
DOE/RL-2019-76, REV. 0
A-iii
Contents
A1 State the Problem .......................................................................................................................... A-1
A2 Identify the Goals of the Study..................................................................................................... A-2
A3 Identify the Information Inputs ................................................................................................... A-5
A3.1 Data Inputs to Resolve Decision Statement #1 ..................................................................... A-9
A3.2 Data Inputs to Resolve Decision Statement #2 ................................................................... A-10
A3.3 Data Inputs to Resolve Decision Statement #3 ................................................................... A-10
A3.4 Data Inputs to Resolve Decision Statement #4 ................................................................... A-10
A3.5 Data Inputs to Resolve Decision Statement #5 ................................................................... A-11
A3.6 Data Inputs to Resolve Decision Statement #6 ................................................................... A-11
A3.7 Data Inputs to Resolve Decision Statement #7 ................................................................... A-11
A4 Define the Boundaries of the Study ........................................................................................... A-12
A5 Develop the Analytical Approach and Decision Rules ............................................................. A-12
A6 Specify Performance or Acceptance Criteria ........................................................................... A-16
A6.1 Groundwater Levels ............................................................................................................ A-17
A6.2 Pumping Rates ..................................................................................................................... A-18
A6.3 Contaminant Concentrations ............................................................................................... A-18
A6.4 Other Measured Parameters ................................................................................................ A-19
A6.5 Model Predictions................................................................................................................ A-20
A7 Develop the Plan for Obtaining Data ........................................................................................ A-21
A8 References .................................................................................................................................... A-22
Tables
Table A-1. Analytes for 200-ZP-1 OU Optimization Study Groundwater Monitoring ........................ A-6
Table A-2. Performance Requirements for Groundwater Analysis ...................................................... A-7
Table A-3. Summary of Data Inputs to Resolve DSs ........................................................................... A-8
Table A-4. Decision Rules .................................................................................................................. A-16

DOE/RL-2019-76, REV. 0
A-iv
This page intentionally left blank.
DOE/RL-2019-76, REV. 0
A-v
Terms
AA alternative action
COC contaminant of concern
DQO data quality objective
DR decision rule
DS decision statement
F&T fate and transport
FY fiscal year
MNA monitored natural attenuation
O&M operations and maintenance
OSP optimization study plan
OU operable unit
P&T pump and treat
PMP performance monitoring plan
PSQ principal study question
RAO remedial action objective
ROD Record of Decision
Rwie Ringold Formation member of Wooded Island – unit E
SAP sampling and analysis plan

DOE/RL-2019-76, REV. 0
A-vi
This page intentionally left blank.
DOE/RL-2019-76, REV. 0
A-1
A Data Quality Objectives
The data quality objectives (DQOs) for the 200-ZP-1 Operable Unit (OU) optimization study, as
established in DOE/RL-2019-38, 200-ZP-1 Operable Unit Optimization Study Plan (hereinafter referred
to as the 200-ZP-1 OU optimization study plan [OSP]), were developed in accordance with
EPA/240/B-06-001, Guidance on Systematic Planning Using the Data Quality Objectives Process
(EPA QA/G-4). The DQO process involves a series of logical steps used to plan for the resource-effective
acquisition of environmental data. The performance and acceptable criteria are determined through
the DQO process, which serves as the basis for designing the plan to collect data of adequate quality
and sufficient quantity to support project goals. The DQO process consists of the following seven
iterative steps:
1. State the problem.
2. Identify the goals of the study.
3. Identify the information inputs.
4. Define the boundaries of the study.
5. Develop the analytic approach and decision rules (DRs).
6. Specify performance or acceptance criteria.
7. Develop the plan for obtaining data.
Each of the steps is further discussed in this appendix.
A1 State the Problem
The first step in the DQO process is to define the problem. For the 200-ZP-1 OU, evaluation of the
selected remedy specified in EPA et al., 2008, Record of Decision Hanford 200 Area 200-ZP-1 Superfund
Site, Benton County, Washington (hereinafter referred to as the 200-ZP-1 OU Record of Decision [ROD])
is the ultimate purpose of data collection for the OU. Data and information obtained during the first
6 years of pump and treat (P&T) remedy implementation in the 200-ZP-1 OU suggest that conditions
within the OU are less favorable for attaining remedial action objectives (RAOs) and cleanup levels for
carbon tetrachloride within the timeframes identified in 200-ZP-1 OU ROD. Main factors contributing to
these conditions include an order-of-magnitude slower abiotic degradation rate and a larger contaminant
extent and mass for carbon tetrachloride relative to the assumptions used in DOE/RL-2007-28, Feasibility
Study Report for the 200-ZP-1 Groundwater Operable Unit. As a result, data is needed to provide
a technical basis showing optimization of the 200-ZP-1 OU P&T remedy performance that increases
carbon tetrachloride treatment capacity and accelerates mass removal in order to determine whether the
cleanup levels can be achieved within the 125-year timeframe specified in the 200-ZP-1 OU ROD.
In addition, biofouling parameter data is required to evaluate whether continued disinfection of injection
wells is warranted.
A significant amount of nitrate in the 200-ZP-1 OU (2,186,276 kg) has been extracted and treated by the
P&T system since the beginning of the remedy operations, and the nitrate plume may have been
sufficiently diminished such that active nitrate treatment is no longer needed to meet the RAOs identified
in the 200-ZP-1 OU ROD (EPA et al., 2008). Therefore, an evaluation of suspending the active biological
treatment component of the 200 West P&T and transitioning to monitored natural attenuation (MNA)
for nitrate is warranted and additional anion data, including nitrate, is required.
DOE/RL-2019-76, REV. 0
A-2
The 200-ZP-1 OU OSP (DOE/RL-2019-38), developed in accordance with U.S. Environmental
Protection Agency (EPA) guidelines (EPA 542-R-13-008, Remediation Optimization: Definition, Scope
and Approach), provides objectives and an overall approach to evaluate changes to the treatment facility
and the well network to increase the treatment capacity for carbon tetrachloride and suspend active
biological treatment of nitrate. Data (e.g., facility operational and effluent data, contaminant mass
extraction data, and contaminant plume behavior data) are needed to meet the OSP objectives and to
support future 200-ZP-1 OU remedy decisions. The data will be incorporated into fate and transport
(F&T) modeling and will be used in remedy performance and optimization evaluations. Analytical data
are needed to refine F&T models to determine whether RAOs for carbon tetrachloride and nitrate may be
achieved under optimization study configurations (e.g., increased extraction rate and increased carbon
tetrachloride treatment capacity).
A2 Identify the Goals of the Study
The second step of the DQO process identifies the key decisions and/or goals that must be addressed
to achieve the final solution. The goal of the 200-ZP-1 OU optimization study sampling and analysis
plan (SAP) (provided in the main text of this document) is to provide data of adequate quality and
sufficient quantity to meet the optimization study objectives, as specified in the 200-ZP-1 OU OSP
(DOE/RL-2019-38), which are intended to support future plume remediation in the Ringold Formation
member of Wooded Island – unit E (Rwie) and to verify MNA transition for nitrate.
The primary objective of the study is to provide a technical basis showing optimization of carbon
tetrachloride remediation that supports consideration of potential future 200-ZP-1 OU remedy
modifications (DOE/RL-2019-38). To accomplish this objective, data will need to be collected to support
the following performance monitoring analyses:
Quantify the increased carbon tetrachloride mass removal rate, as well as the associated plume area
volume and concentration reductions under the optimization study configurations.
Evaluate the effectiveness of carbon tetrachloride plume containment under the optimization
study configurations.
Evaluate injection well performance (e.g., specific injection capacity) under the optimization study
configurations and compare that to pre-optimization study performance.
Compare anticipated remedy performance for carbon tetrachloride under the optimization study
configurations with predicted pre-optimization study performance.
Quantify nitrate plume behavior under the optimization study configurations to confirm that transition
to MNA is appropriate for nitrate.
Confirm that treated effluent quality meets injection criteria (except for nitrate).
Predict whether RAOs are expected to be achieved for all contaminants of concern (COCs) under the
optimization study configurations within the timeframe identified in the 200-ZP-1 OU ROD
(EPA et al., 2008).
Additional data will be collected outside of this SAP to support the following secondary optimization
study objectives:
Estimate the costs of the optimization study configurations to support future remedy decisions.
DOE/RL-2019-76, REV. 0
A-3
Integrate data obtained from the Ringold Formation member of Wooded Island – unit A
characterization efforts, which will be collected in accordance with DOE/RL-2019-23, 200-ZP-1
Operable Unit Ringold Formation A Characterization Sampling and Analysis Plan (hereinafter
referred to as the Ringold A SAP), into the overall evaluation of COC plume behavior under the
optimization study configurations.
The supplemental data gathered under this optimization study SAP (analysis of additional parameters,
increased sample frequency in some wells, etc.) will address the additional data needs not already covered
in DOE/RL-2009-115, Performance Monitoring Plan for the 200-ZP-1 Groundwater Operable Unit
Remedial Action (hereinafter referred to as the 200-ZP-1 OU performance monitoring plan [PMP];
DOE/RL-2009-124, 200 West Pump and Treat Operations and Maintenance Plan (hereinafter referred
to as the 200 West P&T operations and maintenance [O&M] plan); and the Ringold A SAP
(DOE/RL-2019-23). Data collected under the PMP, the O&M plan, and the Ringold A SAP may be
used to support the optimization study.
The principal study questions (PSQs) that the data collection must address, along with alternative
actions (AAs) that may result based on the analysis of the collected data, are as follows:
PSQ #1: Can a technical basis be prepared showing a desired carbon tetrachloride mass removal rate
along with associated plume area and concentration reductions under the optimization study
configurations using existing data collection strategies (DOE/RL-2009-115; DOE/RL-2009-124)?
– AA #1A: Yes. No supplemental data collection is required and the report will be prepared as
required under Task 4 of the 200‑ZP‑1 OU OSP; or
– AA #1B: No. Collect supplemental data to define the optimum carbon tetrachloride mass
removal rate along with associated plume area and concentration reductions and prepare the
report as required under Task 4 of the 200-ZP-1 OU OSP.
PSQ #2: Can a technical basis be prepared that sufficiently evaluates the effectiveness of carbon
tetrachloride plume containment under the optimization study configurations using existing data
collection strategies (DOE/RL-2009-115; DOE/RL-2009-124)?
– AA #2A: Yes. No supplemental data collection is required and the report will be prepared as
required under Task 4 of the 200‑ZP‑1 OU OSP; or
– AA #2B: No. Collect supplemental data to evaluate the effectiveness of carbon tetrachloride
plume containment and prepare the report as required under Task 4 of the 200-ZP-1 OU OSP.
PSQ #3: Can a technical basis be prepared that evaluates injection well performance (e.g., specific
injection capacity) under the optimization study configurations when compared to pre-optimization
study performance?
– AA #3A: Yes. No supplemental data collection is required and the report will be prepared as
required under Task 4 of the 200‑ZP‑1 OU OSP; or
– AA #3B: No. Collect supplemental data until a technical basis can be prepared that sufficiently
evaluates injection well performance and prepare the report as required under Task 4 of the
200-ZP-1 OU OSP.
PSQ #4: Can a technical basis be prepared that compares anticipated remedy performance for carbon
tetrachloride under the optimization study configurations with predicted pre-optimization
study performance?
DOE/RL-2019-76, REV. 0
A-4
– AA #4A: Yes. No supplemental data collection is required and the report will be prepared as
required under Task 4 of the 200‑ZP‑1 OU OSP; or
– AA #4B: No. Collect supplemental data until a technical basis can be prepared that compares
anticipated remedy performance for carbon tetrachloride and prepare the report as required under
Task 4 of the 200-ZP-1 OU OSP.
PSQ #5: Can a technical basis be prepared showing nitrate plume behavior under the optimization
study configurations to confirm that transition to MNA is appropriate for nitrate?
– AA #5A: Yes. No supplemental data collection is required and the report will be prepared as
required under Task 4 of the 200‑ZP‑1 OU OSP; or
– AA #5B: No. Collect supplemental data until a technical basis can be prepared showing nitrate
plume behavior can transition to MNA and prepare the report required under Task 4 of the
200-ZP-1 OU OSP.
PSQ #6: Can a technical basis be prepared that confirms treated effluent quality meets injection
criteria (except for nitrate)?
– AA #6A: Yes. No supplemental data collection is required and the report will be prepared as
required under Task 4 of the 200‑ZP‑1 OU OSP; or
– AA #6B: No. Collect supplemental data until a technical basis can be prepared that confirms
treated effluent quality meets injection criteria (except for nitrate) and prepare the report as
required under Task 4 of the 200-ZP-1 OU OSP.
PSQ #7: Can a technical basis be prepared that predicts whether RAOs are expected to be achieved
for all COCs under the optimization study configurations within the timeframe of the 200-ZP-1 OU
ROD (EPA et al., 2008)?
– AA #7A: Yes. No supplemental data collection is required and the report will be prepared as
required under Task 4 of the 200‑ZP‑1 OU OSP; or
– AA #7B: No. Collect supplemental data until a technical basis can be prepared that predicts
whether RAOs are expected to be achieved for all COCs and prepare the report as required under
Task 4 of the 200-ZP-1 OU OSP.
The resulting decision statements (DSs) are the basis for discussion in the subsequent DQO process steps:
DS #1: Determine if a technical basis can be prepared showing a desired carbon tetrachloride
mass removal rate along with associated plume area and concentration reductions under the
optimization study configurations using existing data collection strategies (DOE/RL‑2019‑115;
DOE/RL-2009‑124); then prepare the report as required under Task 4 of the 200‑ZP‑1 OU OSP; else,
collect supplemental data to define the optimum carbon tetrachloride mass removal rate along with
associated plume area and concentration reductions and prepare the report.
DS #2: Determine if a technical basis can be prepared that sufficiently evaluates the effectiveness of
carbon tetrachloride plume containment under the optimization study configurations using existing
data collection strategies (DOE/RL‑2019‑115; DOE/RL‑2009‑124); then prepare the report as
required under Task 4 of the 200‑ZP‑1 OU OSP; else, collect supplemental data to evaluate the
effectiveness of carbon tetrachloride plume containment and prepare the report.
DOE/RL-2019-76, REV. 0
A-5
DS #3: Determine if a technical basis can be prepared that sufficiently evaluates injection well
performance (e.g., specific injection capacity) under the optimization study configurations when
compared to pre-optimization study performance; then prepare the report as required under Task 4 of
the 200‑ZP‑1 OU OSP; else, collect supplemental data until a technical basis can be prepared that
sufficiently evaluates injection well performance and prepare the report.
DS #4: Determine if a technical basis can be prepared that compares anticipated remedy performance
for carbon tetrachloride under the optimization study configurations with predicted pre-optimization
study performance; then prepare the report as required under Task 4 of the 200‑ZP‑1 OU OSP; else,
collect supplemental data until a technical basis can be prepared that compares anticipated remedy
performance for carbon tetrachloride and prepare the report.
DS #5: Determine if a technical basis can be prepared showing nitrate plume behavior under the
optimization study configurations to confirm that transition to MNA is appropriate for nitrate; then
prepare the report as required under Task 4 of the 200‑ZP‑1 OU OSP; else, collect supplemental data
until a technical basis can be prepared showing nitrate plume behavior can transition to MNA and
prepare the report.
DS #6: Determine if a technical basis can be prepared confirming that treated effluent quality meets
injection criteria (except for nitrate); then prepare the report as required under Task 4 of the
200-ZP-1 OU OSP; else, collect supplemental data until a technical basis can be prepared that
confirms treated effluent quality meets injection criteria (except for nitrate) and prepare the report.
DS #7: Determine if a technical basis can be prepared that predicts whether RAOs are expected to be
achieved for all of the COCs under the optimization study configurations within the timeframe of the
200-ZP-1 OU ROD (EPA et al., 2008); then prepare the report as required under Task 4 of the
200-ZP-1 OU OSP; else, collect supplemental data until a technical basis can be prepared that
predicts whether RAOs are expected to be achieved for all COCs and prepare the report.
A3 Identify the Information Inputs
The third step of the DQO process identifies the data and information that may be needed to resolve
the DSs listed in Section A2. The types and specifications of primary data that are collected are
summarized below:
Contaminant sampling data for the groundwater monitoring network: Contaminant sampling for
the 200-ZP-1 OU optimization study monitoring well network is spatially sufficient to include
possible 200 West Area contaminant sources in its coverage, as well as to delineate the horizontal and
vertical extent of carbon tetrachloride contamination above the cleanup levels. The groundwater
samples will be analyzed for the constituents listed in Table A-1. Table A-1 also summarizes the
groundwater samples that are analyzed for other constituents (which include key biogeochemical and
field parameters) for various data uses. Table A-2 lists the analytical methods and performance
requirements for the COCs and other constituents. Table A-2 also lists the highest allowable practical
quantitation limits for the select 200-ZP-1 OU COCs and other constituents.
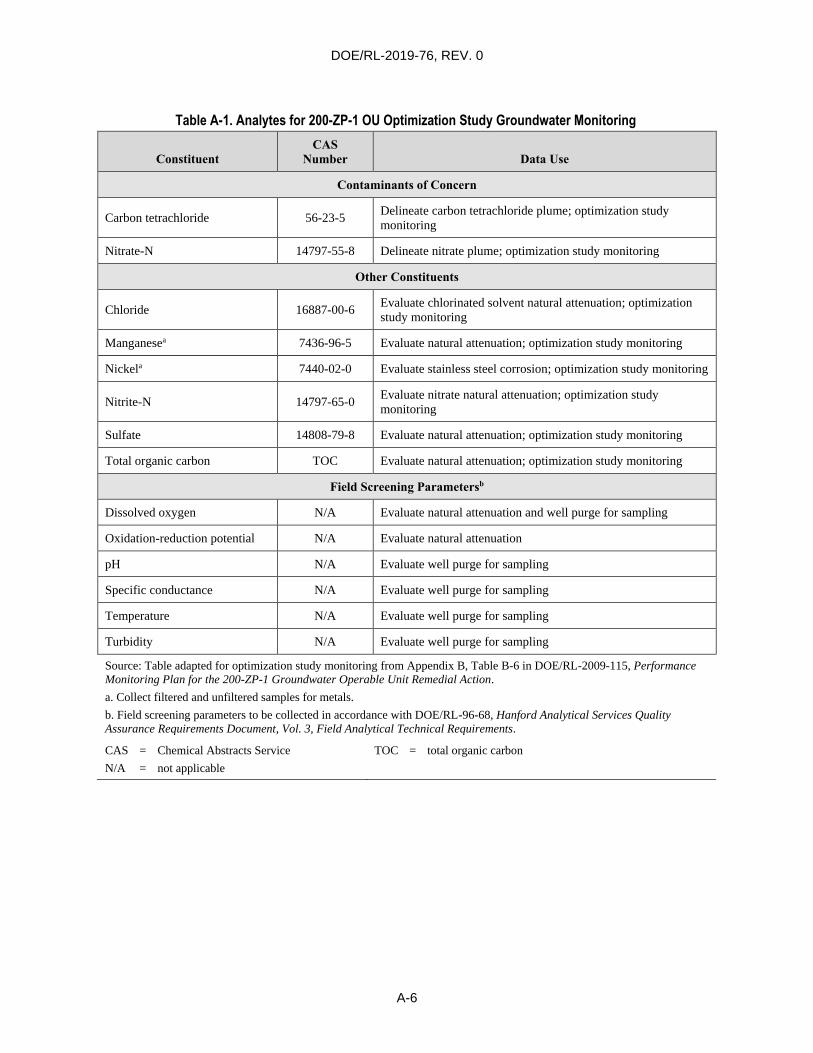
DOE/RL-2019-76, REV. 0
A-6
Table A-1. Analytes for 200-ZP-1 OU Optimization Study Groundwater Monitoring
Constituent
CAS
Number Data Use
Contaminants of Concern
Carbon tetrachloride 56-23-5 Delineate carbon tetrachloride plume; optimization study
monitoring
Nitrate-N 14797-55-8 Delineate nitrate plume; optimization study monitoring
Other Constituents
Chloride 16887-00-6 Evaluate chlorinated solvent natural attenuation; optimization
study monitoring
Manganesea 7436-96-5 Evaluate natural attenuation; optimization study monitoring
Nickela 7440-02-0 Evaluate stainless steel corrosion; optimization study monitoring
Nitrite-N 14797-65-0 Evaluate nitrate natural attenuation; optimization study
monitoring
Sulfate 14808-79-8 Evaluate natural attenuation; optimization study monitoring
Total organic carbon TOC Evaluate natural attenuation; optimization study monitoring
Field Screening Parametersb
Dissolved oxygen N/A Evaluate natural attenuation and well purge for sampling
Oxidation-reduction potential N/A Evaluate natural attenuation
pH N/A Evaluate well purge for sampling
Specific conductance N/A Evaluate well purge for sampling
Temperature N/A Evaluate well purge for sampling
Turbidity N/A Evaluate well purge for sampling
Source: Table adapted for optimization study monitoring from Appendix B, Table B-6 in DOE/RL-2009-115, Performance
Monitoring Plan for the 200-ZP-1 Groundwater Operable Unit Remedial Action.
a. Collect filtered and unfiltered samples for metals.
b. Field screening parameters to be collected in accordance with DOE/RL-96-68, Hanford Analytical Services Quality
Assurance Requirements Document, Vol. 3, Field Analytical Technical Requirements.
CAS = Chemical Abstracts Service
N/A = not applicable
TOC = total organic carbon
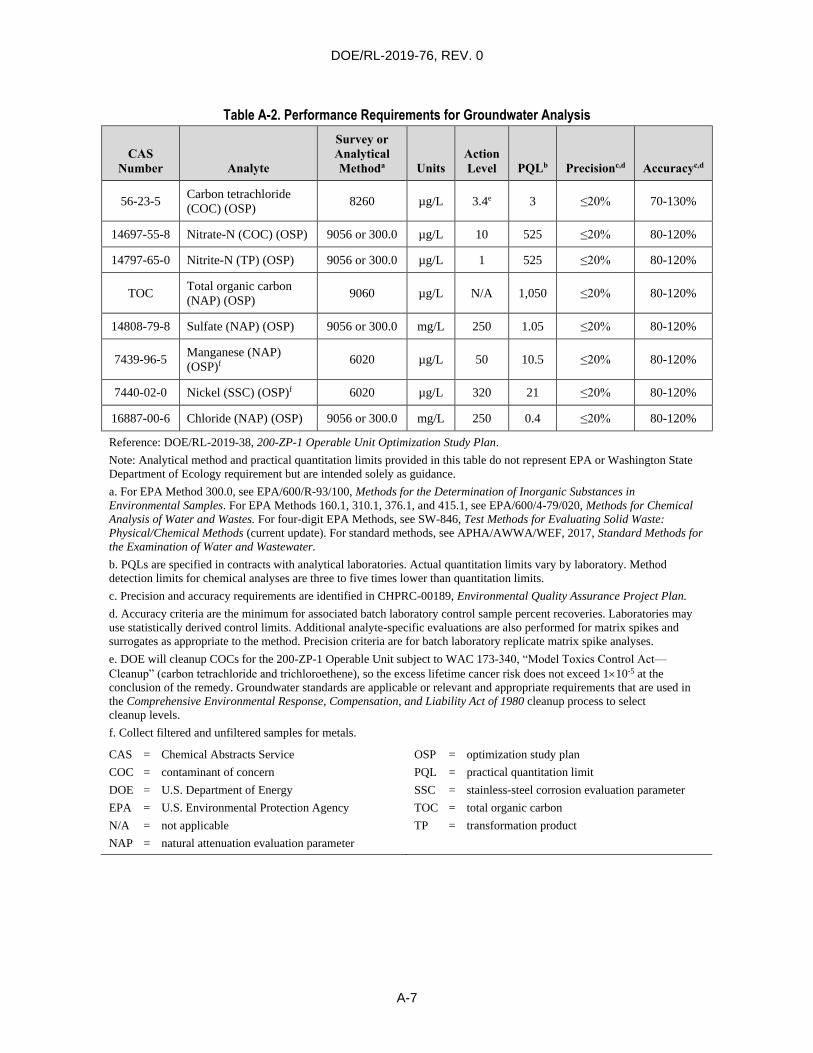
DOE/RL-2019-76, REV. 0
A-7
Table A-2. Performance Requirements for Groundwater Analysis
CAS
Number Analyte
Survey or
Analytical
Methoda Units
Action
Level PQLb Precisionc,d Accuracyc,d
56-23-5 Carbon tetrachloride
(COC) (OSP) 8260 µg/L 3.4e 3 ≤20% 70-130%
14697-55-8 Nitrate-N (COC) (OSP) 9056 or 300.0 µg/L 10 525 ≤20% 80-120%
14797-65-0 Nitrite-N (TP) (OSP) 9056 or 300.0 µg/L 1 525 ≤20% 80-120%
TOC Total organic carbon
(NAP) (OSP) 9060 µg/L N/A 1,050 ≤20% 80-120%
14808-79-8 Sulfate (NAP) (OSP) 9056 or 300.0 mg/L 250 1.05 ≤20% 80-120%
7439-96-5 Manganese (NAP)
(OSP)f 6020 µg/L 50 10.5 ≤20% 80-120%
7440-02-0 Nickel (SSC) (OSP)f 6020 µg/L 320 21 ≤20% 80-120%
16887-00-6 Chloride (NAP) (OSP) 9056 or 300.0 mg/L 250 0.4 ≤20% 80-120%
Reference: DOE/RL-2019-38, 200-ZP-1 Operable Unit Optimization Study Plan.
Note: Analytical method and practical quantitation limits provided in this table do not represent EPA or Washington State
Department of Ecology requirement but are intended solely as guidance.
a. For EPA Method 300.0, see EPA/600/R-93/100, Methods for the Determination of Inorganic Substances in
Environmental Samples. For EPA Methods 160.1, 310.1, 376.1, and 415.1, see EPA/600/4-79/020, Methods for Chemical
Analysis of Water and Wastes. For four-digit EPA Methods, see SW-846, Test Methods for Evaluating Solid Waste:
Physical/Chemical Methods (current update). For standard methods, see APHA/AWWA/WEF, 2017, Standard Methods for
the Examination of Water and Wastewater.
b. PQLs are specified in contracts with analytical laboratories. Actual quantitation limits vary by laboratory. Method
detection limits for chemical analyses are three to five times lower than quantitation limits.
c. Precision and accuracy requirements are identified in CHPRC-00189, Environmental Quality Assurance Project Plan.
d. Accuracy criteria are the minimum for associated batch laboratory control sample percent recoveries. Laboratories may
use statistically derived control limits. Additional analyte-specific evaluations are also performed for matrix spikes and
surrogates as appropriate to the method. Precision criteria are for batch laboratory replicate matrix spike analyses.
e. DOE will cleanup COCs for the 200-ZP-1 Operable Unit subject to WAC 173-340, “Model Toxics Control Act—
Cleanup” (carbon tetrachloride and trichloroethene), so the excess lifetime cancer risk does not exceed 110-5 at the
conclusion of the remedy. Groundwater standards are applicable or relevant and appropriate requirements that are used in
the Comprehensive Environmental Response, Compensation, and Liability Act of 1980 cleanup process to select
cleanup levels.
f. Collect filtered and unfiltered samples for metals.
CAS = Chemical Abstracts Service
COC = contaminant of concern
DOE = U.S. Department of Energy
EPA = U.S. Environmental Protection Agency
N/A = not applicable
NAP = natural attenuation evaluation parameter
OSP = optimization study plan
PQL = practical quantitation limit
SSC = stainless-steel corrosion evaluation parameter
TOC = total organic carbon
TP = transformation product
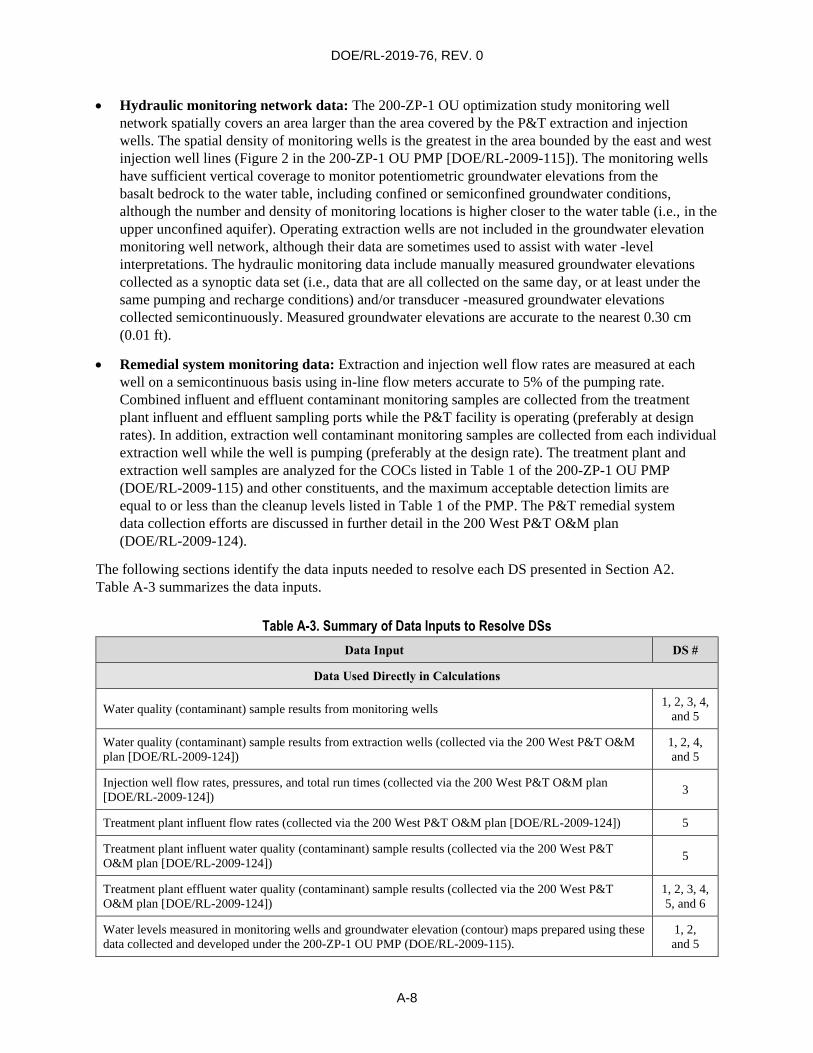
DOE/RL-2019-76, REV. 0
A-8
Hydraulic monitoring network data: The 200-ZP-1 OU optimization study monitoring well
network spatially covers an area larger than the area covered by the P&T extraction and injection
wells. The spatial density of monitoring wells is the greatest in the area bounded by the east and west
injection well lines (Figure 2 in the 200-ZP-1 OU PMP [DOE/RL-2009-115]). The monitoring wells
have sufficient vertical coverage to monitor potentiometric groundwater elevations from the
basalt bedrock to the water table, including confined or semiconfined groundwater conditions,
although the number and density of monitoring locations is higher closer to the water table (i.e., in the
upper unconfined aquifer). Operating extraction wells are not included in the groundwater elevation
monitoring well network, although their data are sometimes used to assist with water -level
interpretations. The hydraulic monitoring data include manually measured groundwater elevations
collected as a synoptic data set (i.e., data that are all collected on the same day, or at least under the
same pumping and recharge conditions) and/or transducer -measured groundwater elevations
collected semicontinuously. Measured groundwater elevations are accurate to the nearest 0.30 cm
(0.01 ft).
Remedial system monitoring data: Extraction and injection well flow rates are measured at each
well on a semicontinuous basis using in-line flow meters accurate to 5% of the pumping rate.
Combined influent and effluent contaminant monitoring samples are collected from the treatment
plant influent and effluent sampling ports while the P&T facility is operating (preferably at design
rates). In addition, extraction well contaminant monitoring samples are collected from each individual
extraction well while the well is pumping (preferably at the design rate). The treatment plant and
extraction well samples are analyzed for the COCs listed in Table 1 of the 200-ZP-1 OU PMP
(DOE/RL-2009-115) and other constituents, and the maximum acceptable detection limits are
equal to or less than the cleanup levels listed in Table 1 of the PMP. The P&T remedial system
data collection efforts are discussed in further detail in the 200 West P&T O&M plan
(DOE/RL-2009-124).
The following sections identify the data inputs needed to resolve each DS presented in Section A2.
Table A-3 summarizes the data inputs.
Table A-3. Summary of Data Inputs to Resolve DSs
Data Input DS #
Data Used Directly in Calculations
Water quality (contaminant) sample results from monitoring wells 1, 2, 3, 4,
and 5
Water quality (contaminant) sample results from extraction wells (collected via the 200 West P&T O&M
plan [DOE/RL-2009-124])
1, 2, 4,
and 5
Injection well flow rates, pressures, and total run times (collected via the 200 West P&T O&M plan
[DOE/RL-2009-124]) 3
Treatment plant influent flow rates (collected via the 200 West P&T O&M plan [DOE/RL-2009-124]) 5
Treatment plant influent water quality (contaminant) sample results (collected via the 200 West P&T
O&M plan [DOE/RL-2009-124]) 5
Treatment plant effluent water quality (contaminant) sample results (collected via the 200 West P&T
O&M plan [DOE/RL-2009-124])
1, 2, 3, 4,
5, and 6
Water levels measured in monitoring wells and groundwater elevation (contour) maps prepared using these
data collected and developed under the 200-ZP-1 OU PMP (DOE/RL-2009-115).
1, 2,
and 5
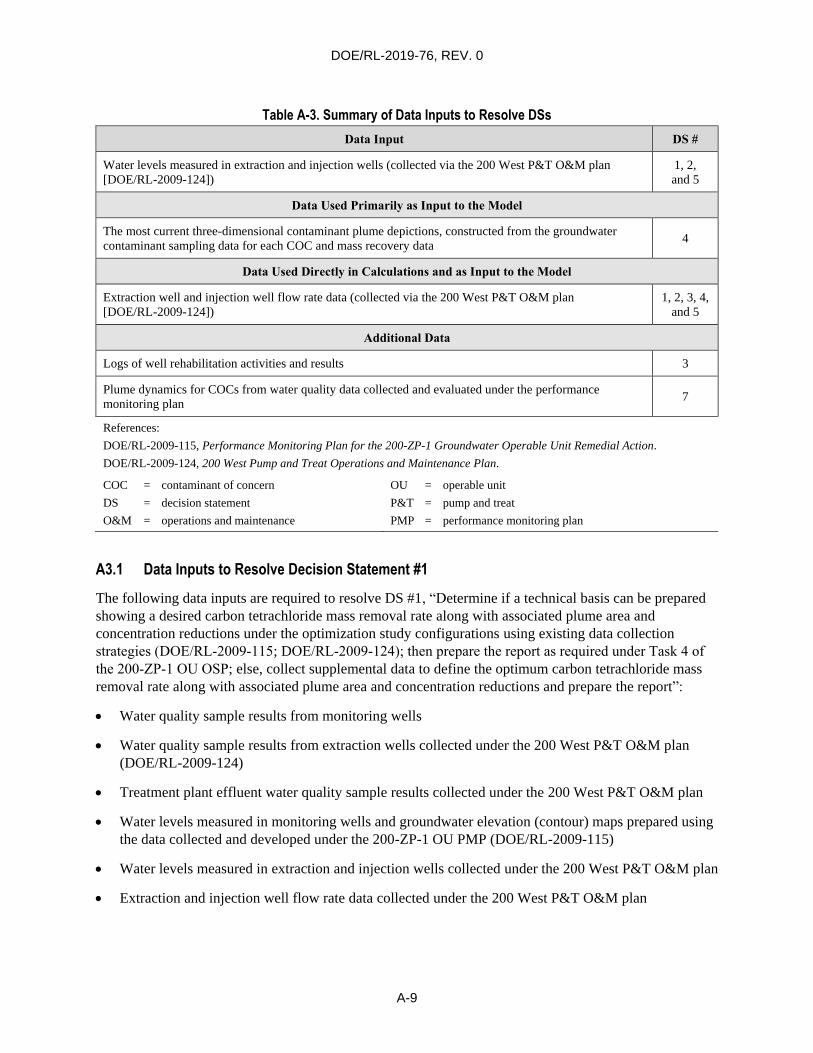
DOE/RL-2019-76, REV. 0
A-9
Table A-3. Summary of Data Inputs to Resolve DSs
Data Input DS #
Water levels measured in extraction and injection wells (collected via the 200 West P&T O&M plan
[DOE/RL-2009-124])
1, 2,
and 5
Data Used Primarily as Input to the Model
The most current three-dimensional contaminant plume depictions, constructed from the groundwater
contaminant sampling data for each COC and mass recovery data 4
Data Used Directly in Calculations and as Input to the Model
Extraction well and injection well flow rate data (collected via the 200 West P&T O&M plan
[DOE/RL-2009-124])
1, 2, 3, 4,
and 5
Additional Data
Logs of well rehabilitation activities and results 3
Plume dynamics for COCs from water quality data collected and evaluated under the performance
monitoring plan 7
References:
DOE/RL-2009-115, Performance Monitoring Plan for the 200-ZP-1 Groundwater Operable Unit Remedial Action.
DOE/RL-2009-124, 200 West Pump and Treat Operations and Maintenance Plan.
COC = contaminant of concern
DS = decision statement
O&M = operations and maintenance
OU = operable unit
P&T = pump and treat
PMP = performance monitoring plan
A3.1 Data Inputs to Resolve Decision Statement #1
The following data inputs are required to resolve DS #1, “Determine if a technical basis can be prepared
showing a desired carbon tetrachloride mass removal rate along with associated plume area and
concentration reductions under the optimization study configurations using existing data collection
strategies (DOE/RL‑2009‑115; DOE/RL‑2009‑124); then prepare the report as required under Task 4 of
the 200‑ZP‑1 OU OSP; else, collect supplemental data to define the optimum carbon tetrachloride mass
removal rate along with associated plume area and concentration reductions and prepare the report”:
Water quality sample results from monitoring wells
Water quality sample results from extraction wells collected under the 200 West P&T O&M plan
(DOE/RL-2009-124)
Treatment plant effluent water quality sample results collected under the 200 West P&T O&M plan
Water levels measured in monitoring wells and groundwater elevation (contour) maps prepared using
the data collected and developed under the 200-ZP-1 OU PMP (DOE/RL-2009-115)
Water levels measured in extraction and injection wells collected under the 200 West P&T O&M plan
Extraction and injection well flow rate data collected under the 200 West P&T O&M plan
DOE/RL-2019-76, REV. 0
A-10
A3.2 Data Inputs to Resolve Decision Statement #2
The following data inputs are required to resolve DS #2, “Determine if a technical basis can be prepared
that sufficiently evaluates the effectiveness of carbon tetrachloride plume containment under the
optimization study configurations using existing data collection strategies (DOE/RL‑2009‑115;
DOE/RL-2009‑124); then prepare the report as required under Task 4 of the 200‑ZP‑1 OU OSP; else,
collect supplemental data to evaluate the effectiveness of carbon tetrachloride plume containment and
prepare the report”:
Water quality sample results from monitoring wells
Water quality sample results from extraction wells collected under the 200 West P&T O&M plan
(DOE/RL-2009-124)
Treatment plant effluent water quality sample results collected under the 200 West P&T O&M plan
Water levels measured in monitoring wells and groundwater elevation (contour) maps prepared using
the data collected and developed under the 200-ZP-1 OU PMP (DOE/RL-2009-115)
Water levels measured in extraction and injection wells collected under the 200 West P&T O&M plan
Extraction and injection well flow rate data collected under the 200 West P&T O&M plan
A3.3 Data Inputs to Resolve Decision Statement #3
The following data inputs are required to resolve DS #3, “Determine if a technical basis can be prepared
that sufficiently evaluates injection well performance (e.g., specific injection capacity) under the
optimization study configurations when compared to pre-optimization study performance; then prepare
the report as required under Task 4 of the 200‑ZP‑1 OU OSP; else, collect supplemental data until a
technical basis can be prepared that sufficiently evaluates injection well performance and prepare the
report”:
Water quality sample results from monitoring wells
Injection well flow rate data, pressures, and total run times collected under the 200 West P&T O&M
plan (DOE/RL-2009-124) and used to calculate specific injection capacity
Treatment plant effluent water quality sample results collected under the 200 West P&T O&M plan
Extraction and well injection flow rate data collected from the 200 West P&T O&M plan
Logs of well rehabilitation activities and results
A3.4 Data Inputs to Resolve Decision Statement #4
The following data inputs are required to resolve DS #4, “Determine if a technical basis can be prepared
that compares anticipated remedy performance for carbon tetrachloride under the optimization study
configurations with predicted pre-optimization study performance; then prepare the report as required
under Task 4 of the 200-ZP-1 OU OSP; else, collect supplemental data until a technical basis can be
prepared that compares anticipated remedy performance for carbon tetrachloride and prepare the report”:
Water quality sample results from monitoring wells
DOE/RL-2019-76, REV. 0
A-11
Water quality sample results from extraction wells collected under the 200 West P&T O&M plan
(DOE/RL-2009-124)
Treatment plant effluent water quality sample results collected under the 200 West P&T O&M plan
Extraction and injection well flow rate data collected under the 200 West P&T O&M plan
The most current three-dimensional contaminant plume depictions, which are constructed from the
groundwater contaminant sampling data for each COC and mass recovery data
A3.5 Data Inputs to Resolve Decision Statement #5
The following data inputs are required to resolve DS #5, “Determine if a technical basis can be prepared
showing nitrate plume behavior under the optimization study configurations to confirm transition to MNA
is appropriate for nitrate; then prepare the report as required under Task 4 of the 200-ZP-1 OU OSP; else,
collect supplemental data until a technical basis can be prepared showing nitrate plume behavior can
transition to MNA and prepare the report”:
Water quality sample results from monitoring wells
Water quality sample results from extraction wells collected under the 200 West P&T O&M plan
(DOE/RL-2009-124)
Treatment plant influent flow rates collected under the 200 West P&T O&M plan
Treatment plant influent water quality sample results collected under the 200 West P&T O&M plan
Treatment plant effluent water quality sample results collected under the 200 West P&T O&M plan
Water levels measured in monitoring wells and groundwater elevation (contour) maps prepared using
these data collected and developed under the 200-ZP-1 OU PMP (DOE/RL-2009-115)
Water levels measured in extraction and injection wells collected under the 200 West P&T O&M plan
Extraction and injection well flow rate data collected under the 200 West P&T O&M plan
A3.6 Data Inputs to Resolve Decision Statement #6
The following data inputs are required to resolve DS #6, “Determine if a technical basis can be prepared
that confirms treated effluent quality meets injection criteria (except for nitrate); then prepare the report as
required under Task 4 of the 200-ZP-1 OU OSP; else, collect supplemental data until a technical basis can
be prepared that confirms treated effluent quality meets injection criteria (except for nitrate) and prepare
the report”:
Treatment plant effluent water quality sample results collected under the 200 West P&T O&M plan
(DOE/RL-2009-124)
A3.7 Data Inputs to Resolve Decision Statement #7
The following data inputs are required to resolve DS #7, “Determine if a technical basis can be prepared
that predicts whether RAOs are expected to be achieved for all COCs under the optimization study
configurations within the timeframe of the 200-ZP-1 OU ROD [EPA et al., 2008]; then prepare the report
as required under Task 4 of the 200-ZP-1 OU OSP; else, collect supplemental data until a technical basis
DOE/RL-2019-76, REV. 0
A-12
can be prepared that predicts whether RAOs are expected to be achieved for all of the COCs and write the
report”:
Plume dynamics for COCs from water quality data collected and evaluated under the 200-ZP-1 OU
PMP (DOE/RL-2009-115)
A4 Define the Boundaries of the Study
The fourth step of the DQO process is used to identify the spatial and temporal features pertinent to the
decision-making process. The 200-ZP-1 OU performance monitoring network and other monitoring wells
(200-UP-1 OU; Comprehensive Environmental Response, Compensation, and Liability Act; Atomic
Energy Act of 1954; and other newly installed wells) must be monitored to provide data of adequate
quality and quantity to meet the optimization study objectives, which are intended to support future plume
remediation in the Rwie and to verify transition to MNA for nitrate.
Spatially, this performance monitoring (data collection under this study) covers an area from the western
injection well line to the eastern leading edges of the 200-ZP-1 OU plumes. Elevations range from the top
of the basalt bedrock to the water table.
Temporally, near-term and long-term performance monitoring (data collected under this study) began at
the start of fiscal year (FY) 2020 and will continue until optimization study objectives are achieved,
which is estimated to be 5 to 7 years (based on Hanford Site priority work activities and available funding
each fiscal year). Regional and location flow and transport modeling will consider the full hydrogeologic
system and plume transport, spatially and temporally.
A5 Develop the Analytical Approach and Decision Rules
The fifth step of the DQO process involves developing an analytical approach and DRs that outline how
the performance monitoring data will be used to make decisions regarding the progress of the selected
remedy. The DRs for each DS provide clear requirements that guide the decision-making process.
The first three stages of the decision-making process include five workflow components necessary to
successfully monitor and improve performance and ultimately make decisions before proceeding to the
next stage. These workflow components are summarized as the collection of primary data (monitor); the
analysis of primary data (calculate); the modeling for predicting success and for evaluating potential
changes (predict); the reporting of the monitoring, calculations, and predictions (report); and making
necessary changes to the system to improve remedy performance (optimize). The fourth and final stage of
the decision-making process, attainment demonstration, includes three primary workflow components:
collection of primary data (monitor), analysis of primary data (calculate), and the reporting of the
monitoring and analysis data and the recommended decision (report).
The general approach to resolve DSs and manage the remedy uses a combination of several types of
primary data and associated data analysis, as well as a comparison of data to F&T model predictions.
The approach uses these multiple lines of evidence (not a single metric) in an integrated remedy
performance evaluation. Each primary and derived element of the approach provides essential information
to be used in the decision-making process, but limitations of each element exist and must be considered.
Additionally, integrating each element with other elements is necessary to successfully and efficiently
support the decision-making process. The three fundamental components are defined as follows:
Information: Compiled, reduced, and summarized data collected through measurement and
observation, then processed through specified data-reduction techniques to provide the desired input
to the analysis. Information is always based on measurement and observation.
DOE/RL-2019-76, REV. 0
A-13
Limitation: The analysis of information and the resulting knowledge and understanding contain
inherent uncertainties and limitations. These limitations may constrain the ability to extrapolate the
knowledge or understanding beyond identified spatial or temporal boundaries. Specific uncertainties
will be identified that bound the ability to extrapolate from current conditions.
Integration: Collection of measurements and observations presents the opportunity for integration
with other projects and activities, including data collection performed for other OUs. Conversely,
information and developed knowledge may be shared with other projects through integration
activities. Measurements and observations collected and used through integration activities must be
assessed to ensure that they meet the data quality requirements of the current activity and that their
uncertainty and limitations are understood. Information should be clearly identified as based on either
direct data (i.e., collected under the auspices of this activity) or indirect data (i.e., collected through
an integration activity).
Derived data and simulation elements of the approach are listed below, as well as a description of the
information provided by the element, its limitations, and how it is integrated with other elements to
support remedy performance evaluation and management. While many of the elements described below
are gathered under the 200-ZP-1 OU PMP (DOE/RL-2009-115), some of the information is gathered and
provided from data collection efforts conducted via the 200 West P&T O&M plan (DOE/RL-2009-124)
and the 200-ZP-1 OU OSP (DOE/RL-2019-38).
Monitoring well concentration trends:
– Information: Time series of COC concentration in groundwater at monitoring locations based on
measurement and observation.
– Limitation: Limitations are driven by measurement data quality indicators (i.e., precision,
accuracy, representativeness, completeness, and comparability) for individual
location measurements.
– Integration: Data collection offers opportunity for integration with neighboring OUs
(e.g., 200-UP-1 and 200-BP-5).
Contaminant mass removal over time (plume and individual well):
– Information: Time series of COC concentrations in extracted groundwater and post-treatment
effluent based on measurement and observation for individual locations and then extrapolated via
computation to represent the plume overall (P&T operational data).
– Limitation: The most substantial limitation is the interpolation over distance (horizontal and
vertical) between points of measurement and over time (where measurements are relatively
infrequent) and extrapolation beyond points of measurement when necessary. This is particularly
true under dynamic treatment conditions (e.g., P&T), where measured conditions may be
transient in the short term. Individual measurements are subject to limitations driven by
measurement DQOs (i.e., precision, accuracy, representativeness, completeness,
and comparability).
– Integration: This analysis offers the opportunity for integration in data collection with all
(or any) other OUs providing feedstock to the treatment plant.
DOE/RL-2019-76, REV. 0
A-14
Mass degradation over time (plume and individual well):
– Information: Estimation of COC mass degradation requires information based on measurement
and observation of concentrations in groundwater at monitoring locations, in extracted water, and
in post-treatment effluent water, as well as P&T influent and effluent flow rates (P&T operational
data). This can provide an inference of the degraded mass. Refinement of the inferred degraded
mass requires calculation based on knowledge of biological and abiotic COC decay rates under
site conditions.
– Limitation: Estimation of degradation by difference has inherent uncertainty due to variability in
measurements, uncertainty in estimates of mass in the aquifer, and uncertainties in understanding
of the degradation processes.
– Integration: Mass degradation estimates are largely confined to use by the target OU.
Plume volume changes over time (including selected plume contour depictions):
– Information: Changes in time over three-dimensional spatial distribution of the concentration of
COCs in groundwater at monitoring locations based on measurement and observation and
extrapolated through computational approaches to the overall plume.
– Limitation: The most substantial limitation is in interpolation over distance (horizontal and
vertical) between points of measurement and extrapolation beyond points of measurement where
necessary. This is particularly true under dynamic treatment conditions (e.g., P&T), where
measured conditions may be transient in the short term. In addition, the monitoring location
densities decrease with depth in the target aquifer, which adds uncertainty to the extrapolation
calculations. Individual measurements are subject to limitations driven by measurement DQOs
(i.e., precision, accuracy, representativeness, completeness, and comparability).
– Integration: Data collection offers opportunity for integration with neighboring OUs
(e.g., 200-UP-1 and 200-BP-5).
Hydraulic heads and capture zones (plume and individual well):
– Information: This requires information describing the hydraulic conditions within the aquifer
based on measurement and observation, as well as an understanding of aquifer properties to
extrapolate groundwater movement relative to dynamic well conditions (i.e., extraction and
injection). Additional information includes P&T operational data.
– Limitation: As with plume analyses, head and capture analyses are subject to limitations in data
collection (e.g., accuracy, precision, and representativeness of water-level measurement) and
computational capability (e.g., representativeness of selected aquifer hydraulic properties with
respect to actual site conditions). Extrapolations of individual dynamic well conditions to the
aquifer are frequently uncertain.
– Integration: Water-level data and capture zone analyses are applicable to integration with
neighboring OUs (e.g., 200-UP-1 and 200-BP-5) and integration with Hanford Sitewide
groundwater modeling activities.
DOE/RL-2019-76, REV. 0
A-15
P&T operational data and other institutional data:
– Information: Information assembled primarily from measurement and observation of water
quality and volumetric observations during plant operations. This includes groundwater
extraction rates and locations, process effluent injection rates and locations, water quality
(e.g., COC concentrations and geochemistry) of plant influent and effluent, and processed
information describing individual extraction and injection well performance. Institutional
information includes sitewide decisions regarding future land use, as well as selecting points of
calculation and compliance for the groundwater remedy.
– Limitation: As with other inputs, operational data are subject to uncertainties in measurement
and observation data quality. Most of these data are indirect to the 200-ZP-1 OU PMP
(DOE/RL-2009-115) and will need to be assessed for DQO comparability. Most hydraulic
measurements are collected from dynamic monitoring locations (e.g., extraction and injection
wells) and must be carefully considered for comparability when incorporating into the knowledge
base of the overall aquifer.
– Integration: Operational information is directly integrated with other OUs that supply water to
the treatment plant (e.g., 200-UP-1 and 200-BP-5 OUs).
Model predictions of plume behavior and remedy performance:
– Information: Modeling activities require integrating all of the inputs described above to
refine the model performance and enhance the predictability of the model output. Models must be
assembled to represent the system as accurately as reasonable and refined routinely with inputs
based on measurement and observation. As additional information describing aquifer physical
and hydraulic properties becomes available, the model basis must be refined to incorporate the
new information so the model remains representative and comparable to the system.
– Limitations: Models are inherently subject to uncertainties in inputs and definition of
computational parameters. Modeling tools allow calculation of predicted conditions over wide
physical areas and over long periods of time into the future. The level of uncertainty in model
outputs generally increases with the area (and volume) of the aquifer described and with the
simulation time period. A well-performing model should produce a description of aquifer
conditions over relatively short time periods (e.g., years). Short-period descriptive runs should be
performed regularly to ensure continued model representativeness. If short-term results are
comparable, the level of confidence can increase in the longer-term analyses.
– Integration: Models used for the 200-ZP-1 OU are integral to the overall Central Plateau
modeling effort. Two-way integration is essential to provide OU-specific outputs to neighboring
OUs, as well as using neighboring OU inputs to check and validate the target OU model results.
While some of these elements are evaluated annually, some types of data analysis and modeling
evaluation are more appropriately conducted more frequently. During the 200-ZP-1 OU optimization
study period, trend analyses will be conducted annually, although the new data will be plotted and
compared to trend confidence and prediction intervals following receipt of the data. Significant deviations
from confidence or prediction intervals will be used to initiate more frequent evaluation or data collection.
Similarly, model prediction updates would occur at the same frequency. The approach will also consider
three-dimensional aspects of the plume, especially when evaluating plume configuration and mass
changes over time and determining whether the monitoring network needs to be updated either laterally
or vertically.
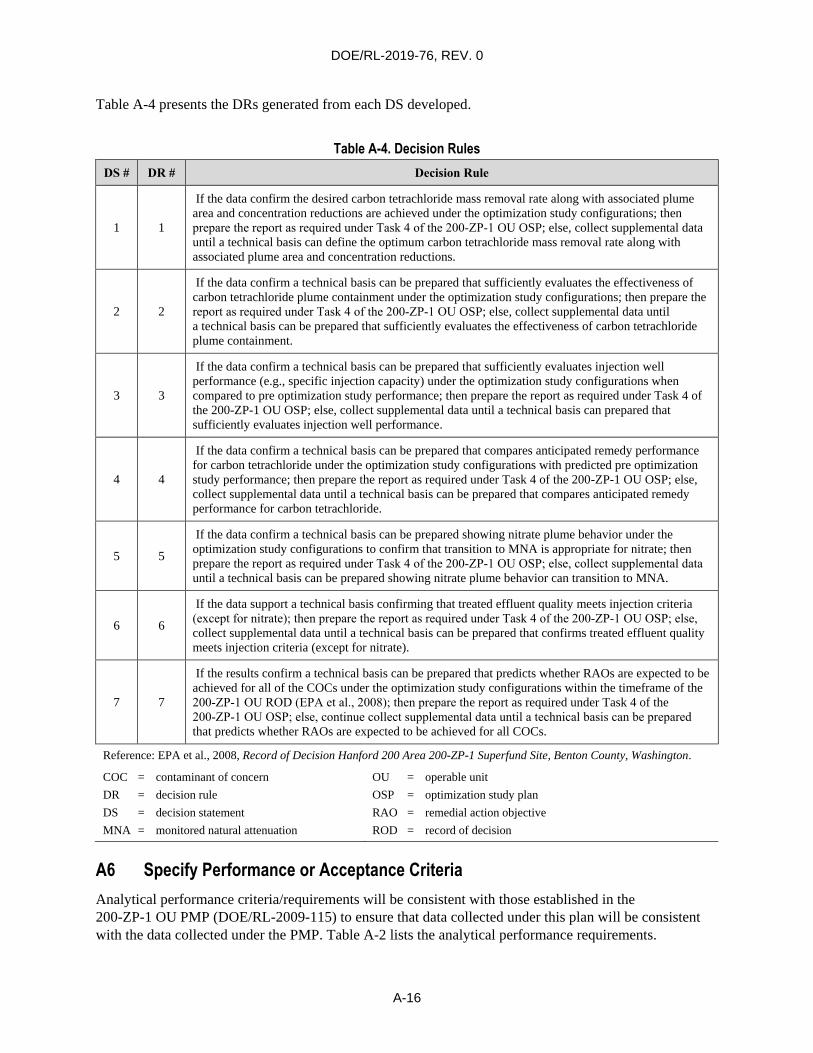
DOE/RL-2019-76, REV. 0
A-16
Table A-4 presents the DRs generated from each DS developed.
Table A-4. Decision Rules
DS # DR # Decision Rule
1 1
If the data confirm the desired carbon tetrachloride mass removal rate along with associated plume
area and concentration reductions are achieved under the optimization study configurations; then
prepare the report as required under Task 4 of the 200‑ZP‑1 OU OSP; else, collect supplemental data
until a technical basis can define the optimum carbon tetrachloride mass removal rate along with
associated plume area and concentration reductions.
2 2
If the data confirm a technical basis can be prepared that sufficiently evaluates the effectiveness of
carbon tetrachloride plume containment under the optimization study configurations; then prepare the
report as required under Task 4 of the 200‑ZP‑1 OU OSP; else, collect supplemental data until
a technical basis can be prepared that sufficiently evaluates the effectiveness of carbon tetrachloride
plume containment.
3 3
If the data confirm a technical basis can be prepared that sufficiently evaluates injection well
performance (e.g., specific injection capacity) under the optimization study configurations when
compared to pre optimization study performance; then prepare the report as required under Task 4 of
the 200-ZP-1 OU OSP; else, collect supplemental data until a technical basis can prepared that
sufficiently evaluates injection well performance.
4 4
If the data confirm a technical basis can be prepared that compares anticipated remedy performance
for carbon tetrachloride under the optimization study configurations with predicted pre optimization
study performance; then prepare the report as required under Task 4 of the 200-ZP-1 OU OSP; else,
collect supplemental data until a technical basis can be prepared that compares anticipated remedy
performance for carbon tetrachloride.
5 5
If the data confirm a technical basis can be prepared showing nitrate plume behavior under the
optimization study configurations to confirm that transition to MNA is appropriate for nitrate; then
prepare the report as required under Task 4 of the 200‑ZP‑1 OU OSP; else, collect supplemental data
until a technical basis can be prepared showing nitrate plume behavior can transition to MNA.
6 6
If the data support a technical basis confirming that treated effluent quality meets injection criteria
(except for nitrate); then prepare the report as required under Task 4 of the 200‑ZP‑1 OU OSP; else,
collect supplemental data until a technical basis can be prepared that confirms treated effluent quality
meets injection criteria (except for nitrate).
7 7
If the results confirm a technical basis can be prepared that predicts whether RAOs are expected to be
achieved for all of the COCs under the optimization study configurations within the timeframe of the
200‑ZP‑1 OU ROD (EPA et al., 2008); then prepare the report as required under Task 4 of the
200‑ZP‑1 OU OSP; else, continue collect supplemental data until a technical basis can be prepared
that predicts whether RAOs are expected to be achieved for all COCs.
Reference: EPA et al., 2008, Record of Decision Hanford 200 Area 200-ZP-1 Superfund Site, Benton County, Washington.
COC = contaminant of concern
DR = decision rule
DS = decision statement
MNA = monitored natural attenuation
OU = operable unit
OSP = optimization study plan
RAO = remedial action objective
ROD = record of decision
A6 Specify Performance or Acceptance Criteria
Analytical performance criteria/requirements will be consistent with those established in the
200-ZP-1 OU PMP (DOE/RL-2009-115) to ensure that data collected under this plan will be consistent
with the data collected under the PMP. Table A-2 lists the analytical performance requirements.
DOE/RL-2019-76, REV. 0
A-17
The sixth step of the DQO process involves deriving the performance or acceptance criteria that the
collected data need to achieve to minimize the possibility of either making erroneous conclusions or
failing to keep uncertainty in estimates to within acceptable levels. Typically, the DR as a statistical
hypothesis test is specified in this section, and the consequences of making incorrect decisions from the
statistical hypothesis test are examined. The sampling design is judgmental and not statistically based.
Decisions regarding remedial action success will be based on the guidelines in OSWER 9283.1-44,
Recommended Approach for Evaluating Completion of Groundwater Restoration Remedial Actions at
a Groundwater Monitoring Well.
More quantitative specifications of data quality are defined and presented as part of the quality assurance
project plan provided in Section B2 in Appendix B of the 200-ZP-1 OU PMP (DOE/RL-2009-115).
The following sections present the potential uncertainties associated with the performance monitoring
data to be collected and the potential impacts of those uncertainties.
A6.1 Groundwater Levels
Groundwater-level data consist of several components:
Depth-to-water measurement from top of casing
Surveyed elevation of the top of casing
Surveyed northing and easting coordinates of the well
Elevation interval in the aquifer at which the depth to water is representative (well screen top and
bottom elevations)
The most critical components of groundwater-level data are the depth-to-water measurement and the top
of casing elevation. Elevations for the top of casing are typically specified to the nearest 0.3 cm (0.01 ft),
and depth-to-water measurements are typically specified to the nearest 0.61 cm (0.02 ft). Errors on the
order of a couple of hundredths of a foot can be significant in situations where small horizontal hydraulic
gradients are expected (e.g., in hydraulic stagnation zones between competing extraction wells) or when
calculating vertical hydraulic gradients. In such sensitive areas, capture zone analyses can result in
significant errors, leading to less-than-expected plume capture or unnecessary overpumping.
Groundwater elevation errors can be detected by preparing a two-dimensional water table map and
looking for irregularities in the elevation contours. Also, a groundwater elevation data set can be
compared to the previously collected data set to look for irregularities. While difficult to detect, these
errors can be managed by designing hydraulic capture zones conservatively with a margin of safety so
small errors in measured groundwater elevations do not lead to less-than-expected plume capture or
unnecessary overpumping.
Ground surface elevations are typically provided to the nearest 0.03 m (0.10 ft) and are used along with
the top and bottom screen depths to calculate the top and bottom screen elevations. Errors up to 1.5 m
(5 ft) in top and bottom screen elevations would likely have little impact on the use of groundwater
elevation data because hydraulic stresses are transmitted fairly easily through the aquifer. Since much
of the well construction data for the 200-ZP-1 OU monitoring wells are historical, screened interval data
from monitoring wells may have the potential for significant uncertainty. However, well screen elevation
errors are likely not a significant concern for groundwater elevation data since the vertical spatial
position of groundwater elevation measurement is typically interpreted as the potentiometric groundwater
elevation at the mid-screen elevation in the well. These mid-screen elevation data points can be used in
DOE/RL-2019-76, REV. 0
A-18
the groundwater flow model by comparing them to simulated heads taken from model grid cell
center elevations.
The surveyed northing and easting coordinates are typically provided to the nearest 0.03 m (0.10 ft).
However, errors of up to 1.5 m (5 ft) in well coordinates should have little impact on any processes or
significant decisions. In addition, well coordinates are relatively easy to verify in the field. Thus, well
coordinate errors are likely not a concern.
A6.2 Pumping Rates
Measured pumping rates collected via the 200 West P&T O&M plan (DOE/RL-2009-124) are used to
monitor system performance and ensure that the system is operating within design specifications.
Pumping rates are also used in model calibration, plume shell calibration, model simulations, and
extraction well contaminant mass removal calculations. Pumping rates should be measured on
a semicontinuous basis using in-line flow meters accurate to 5% of the flow rate.
Extraction well flow rate errors can be detected by comparing the sum of the extraction well pumping
rates to the combined influent flow rate at the treatment plant. Pumping rate errors of a couple of liters per
minute/gallons per minute would have little impact on the simulated capture zone for an extraction well
pumping at 379 L/min (100 gal/min). For mass removal calculations for an extraction well with an
influent carbon tetrachloride concentration of 1,000 µg/L, for every 3.8 L/min (1 gal/min) error in flow
rate, there would be an approximately 2 kg/yr error in calculated contaminant mass extracted. If the
carbon tetrachloride plume is assumed to have a dissolved-phase mass above the cleanup level of
approximately 1,221 kg, then this error is approximately 0.2% of the plume mass. For current Hanford
Site laboratory contracts using Method 8260 in SW-846, Test Methods for Evaluating Solid Waste:
Physical/Chemical Methods (current update), the reported carbon tetrachloride concentrations are to be
accurate to within ±20%. For an extraction well pumping at 379 L/min (100 gal/min) with an influent
carbon tetrachloride concentration of 1,000 µg/L, this error percentage could result in the calculated mass
extracted being under- or over-reported by approximately 40 kg/yr. This is equivalent to a 76 L/min
(20 gal/min) flow rate error for a 379 L/min (100 gal/min) flow rate. Therefore, pumping rate errors of
a couple of liters per minute/gallons per minute should have little impact on any significant decisions.
A6.3 Contaminant Concentrations
Contaminant concentration data consist of several components, including the actual groundwater sample,
subsequent laboratory analysis, and the three-dimensional spatial position from which the sample
originated in the aquifer. Table A-2 lists the performance requirements for laboratory analyses.
Contaminant concentrations from analytical laboratory analyses are needed to construct three-dimensional
contaminant plume depictions, calculate the contaminant mass extracted from the extraction wells, and
ultimately verify that cleanup levels have been achieved. To meet this goal, the analytical method
detection limits should be equal to or less than the cleanup levels.
Failure to set analytical laboratory detection limits equal to or less than the cleanup levels could result in
groundwater contaminant monitoring data of insufficient quality to determine a successful cleanup.
Since three-dimensional contaminant plume depictions are usually constructed with the lowest
concentration isosurface set at the cleanup level, use of analytical laboratory detection limits above the
cleanup levels will result in a lack of data to establish the plume outer boundaries. This will result in
errors in the reported mass and volume statistics, errors in extraction well capture analyses, and errors in
simulated contaminant transport.
DOE/RL-2019-76, REV. 0
A-19
Other types of errors (e.g., random nonrepresentative samples and/or laboratory analyses) should have
limited impact on any significant decisions regarding remedy performance. Typically, if a sample result
seems erroneous and the result is critical (i.e., the result significantly changes the conceptual site model,
indicates loss of capture, or falsely indicates plume cleanup), the sampling is repeated at that location to
verify the result. Significant decisions are generally not based on one sample result. An erroneous sample
result could impact the kriged concentrations in a limited area of a contaminant plume. However,
the plume depictions are usually regenerated annually, so the error would be relatively short-lived.
Horizontal spatial position errors are usually of such a small magnitude that they would have little impact
on any processes or significant decisions. Surveyed northing and easting coordinates are typically
provided to the nearest 0.03 m (0.10 ft). Errors of up to 1.5 m (5 ft) in well coordinates would usually
have little impact. In addition, well coordinates are relatively easy to verify in the field; thus, well
coordinate errors are likely not a concern.
Ground surface elevations are typically provided to the nearest 0.03 m (0.10 ft), which is usually used
along with the top and bottom screen depths to calculate the top and bottom screen elevations. Errors in
top and bottom screen elevations of a couple of feet would likely have little impact on the use of
concentration data. However, contaminant concentrations tend to be highly vertically heterogeneous,
and an error of 3.0 m (10 ft) or more in a screened interval could introduce significant errors in the
three-dimensional contaminant plume depictions. Because much of the well construction data is historical
for the older 200-ZP-1 OU monitoring wells, the potential exists for significant errors in the reported well
screened intervals. Such errors could potentially lead to errors in the three-dimensional contaminant
plume depictions and less-than-expected plume capture.
Another vertical spatial position issue with the 200-ZP-1 OU monitoring wells is that many of the wells
have relatively long screened intervals. The screen length for groundwater monitoring wells typically
ranges from 1.5 to 4.6 m (5 to 20 ft); however, many 200-ZP-1 OU monitoring wells have screen lengths
in excess of 9.1 m (30 ft). The variations in screen length can lead to uncertainties in the vertical position
from which groundwater samples were extracted and can cause high contaminant concentration intervals
to be diluted by less contaminated groundwater from other aquifer intervals. Again, such errors could
potentially lead to errors in the three-dimensional contaminant plume depictions and less-than-expected
plume capture.
Vertical spatial position errors in contaminant concentration sampling data are relatively difficult to
detect and manage. Well construction information for a particular monitoring well should be reviewed if
samples collected from the well are questionable in relation to other upgradient and downgradient
samples. However, the relatively low density of samples usually makes it difficult to detect these types
of errors. In general, the uncertainty in three-dimensional contaminant plume delineation caused by the
sparse sampling network is much greater than all of the other sources of contaminant concentration
uncertainty. This uncertainty is furthered by the relative coarseness of the contaminant transport model
grid and the uncertainty in the model transport parameters. These errors are most often managed by using
professional judgment when evaluating the three-dimensional plume depictions and resulting model
simulations for consistency with the conceptual site model and hydrologic principles, as well as by
questioning any discrepancies.
A6.4 Other Measured Parameters
Table A-1 lists other constituent parameters that are included with laboratory analyses. Evaluating these
parameters may provide a better understanding of natural attenuation conditions and/or reaction pathways
within the reactive zones of the plumes. Measurement errors for these parameters would usually have
little impact on any significant decisions regarding natural attenuation processes.
DOE/RL-2019-76, REV. 0
A-20
Table A-1 also lists the groundwater parameters typically measured in the field at each sampled
monitoring well during each monitoring event. These parameters may be monitored continuously in
a flow-through cell apparatus during monitoring well sampling. Stable readings are an indication that
sufficient purgewater has been withdrawn from a well and that a representative sample of the
groundwater can be collected. These parameters are also important for MNA processes. Field
measurement errors for these parameters would usually have little impact on any significant decisions
regarding natural attenuation processes.
A6.5 Model Predictions
Groundwater flow and contaminant transport models are important tools for simulating hydraulic capture
and predicting whether the remedial goals of 95% mass reduction within 25 years and aquifer cleanup
within 125 years will be achieved. However, uncertainties are associated with the use of the model that
can lead to a sense of false confidence in the accuracy of the model predictions. These uncertainties can
be minimized by using multiple lines of evidence to increase the confidence in model predictions by
ensuring that all available data are used. Some of the available methods are described below.
The ability of the groundwater flow model to simulate hydraulic capture accurately can be evaluated by
(1) comparing simulated hydraulic containment with estimates of hydraulic containment prepared using
other methods (such as geostatistics); and/or (2) using a residual analysis method technique, which
compares the simulated head distribution from the model to the measured groundwater elevations, and
displaying the difference in terms of hydraulic capture. This technique is useful for determining if the
model calibration is adequate and ensures that available data are used to make important decisions
regarding plume capture and remedial system optimization. The residual analysis method technique for
analyzing hydraulic data includes the following steps:
1. Calculate the head residuals between the groundwater elevations measured at the monitoring wells
during the synoptic monitoring event and the simulated heads from the groundwater flow model
using the remedial system extraction and injection rates recorded during the synoptic
monitoring event.
2. Analyze the spatial distribution of model results and the application of head residuals to amend the
model results and produce an estimated potentiometric head distribution that closely approximates
the measured data while retaining the hydraulic insight of the model.
3. Apply the amended flow field to generate estimated remedial system hydraulic capture zones.
Particle tracking should be used to generate the capture zones using both the unadjusted simulated
head field and the residual analysis method-amended head field that more closely matches the actual
hydraulic conditions based on the measured groundwater elevations. Application of the residual analysis
method technique may indicate that the current 200 West Area groundwater flow model is not adequate
to accurately predict plume capture and migration, in which case the model should be recalibrated.
The groundwater elevation data collected during the most recent water-level monitoring event would
provide the calibration targets for model recalibration.
The ability of the groundwater transport model to accurately simulate plume migration depends, in part,
on the accuracy of the starting concentration distribution (three-dimensional plume depiction) and the
contaminant transport parameters used in the model. Additionally, the processes represented in the model
are an approximation for the real transport processes. The three-dimensional plume for each contaminant
will adequately represent the available sampling data at the sampling locations based on the method of
construction (e.g., using an interpolation method such as kriging). The uncertainty involves the areas in
DOE/RL-2019-76, REV. 0
A-21
between the sampling locations and the outer boundaries of the plume depictions. The accuracy of each
three-dimensional plume depiction can be increased by providing additional sampling locations; however,
increasing the number of monitoring wells is expensive. Another method that can be used to reduce this
uncertainty involves using measured extraction well contaminant concentrations as calibration targets for
the contaminant transport model and adjusting each plume contaminant distribution until the simulated
extraction well concentrations and mass recovery rates agree with the measured extraction
well concentrations. Also, the outer plume boundaries (both horizontal and vertical) can be controlled
during kriging by using control points and masking or blanking to ensure that the plume boundaries do
not extend above the water table and, in general, agree with the conceptual site model and professional
judgment. Use of these methods, with appropriate documentation of any assumptions invoked,
ensures that all available lines of evidence are being used to construct the three-dimensional
contaminant distributions.
The contaminant transport parameters used in the model can be evaluated by (1) migrating previously
constructed plume versions forward in time and comparing the simulated contaminant concentrations to
the most recent measured contaminant concentrations at selected monitoring well locations, or (2) using
backward simulation approaches to estimate the origins of contaminant mass that has been recovered at
extraction wells. These evaluations can reduce the uncertainty in the transport parameters controlling the
physical, chemical, and biological processes that influence contaminant F&T, and it may result in changes
to the model parameters that control dispersion, retardation, and biodegradation. These methods ensure
that all available lines of evidence are used to reduce the uncertainty associated with model predictions.
A7 Develop the Plan for Obtaining Data
The seventh step of the DQO process is to develop the sampling and analysis design to generate the
data needed to address the goals for the 200-ZP-1 OU selected remedy. The design for collecting data
for contaminant concentration monitoring, hydraulic monitoring, and flow rate monitoring is
presented in Chapter 3 in the main text of this document, in Appendix B of the 200-ZP-1 OU PMP
(DOE/RL-2009-115), in the 200 West P&T O&M plan (DOE/RL-2009-124), and in the 200-ZP-1 OU
OSP (DOE/RL-2019-38). The design is summarized as follows:
Identify monitoring needs to be conducted through FY 2025 (FY 2020 implemented through TPA-
CN-0875, TPA Change Notice Form, DOE/RL-2009-115, Performance Monitoring Plan for the 200-
ZP-1 Operable Unit Remedial Action, Revision 2). In FY 2025, the need for extending the
optimization study will be determined, and subsequent monitoring will be specified at that time if the
study is extended.
Well location and monitoring for constituents needed to meet all objectives for the 200-ZP-1 OU OSP
(DOE/RL-2019-38).
Monitoring will typically include carbon tetrachloride, nitrate, sulfate, and chloride (near-term and
long-term monitoring).
Biofouling parameters will include manganese, nickel, and total organic carbon for selected wells
(primarily for near-term monitoring).
Detailed monitoring well sample schedule, as presented in the SAP (provided in the main text of
this document).
DOE/RL-2019-76, REV. 0
A-22
A8 References
Atomic Energy Act of 1954, as amended, 42 USC 2011, Pub. L. 83-703, 68 Stat. 919. Available at:
https://www.energy.gov/sites/prod/files/2017/10/f38/Atomic%20Energy%20Act%20of%201954
%20%28AEA%29%20in%20U.S.C..pdf.
APHA/AWWA/WEF, 2017, Standard Methods For the Examination of Water and Wastewater,
23rd Edition, American Public Health Association, American Water Works Association, and
Water Environment Federation, Washington, D.C.
CHPRC-00189, 2019, Environmental Quality Assurance Program Plan, Rev. 16, CH2M HILL Plateau
Remediation Company, Richland, Washington. Available at:
https://pdw.hanford.gov/document/AR-03390.
Comprehensive Environmental Response, Compensation, and Liability Act of 1980, 42 USC 9601, et seq.,
Pub. L. 107-377, December 31, 2002. Available at:
https://www.csu.edu/cerc/researchreports/documents/CERCLASummary1980.pdf.
DOE/RL-96-68, 2014, Hanford Analytical Services Quality Assurance Requirements Document,
Volume 3, Field Analytical Technical Requirements; and Volume 4, Laboratory Technical
Requirements, Rev. 4, U.S. Department of Energy, Richland Operations Office, Richland,
Washington. Available at:
http://www.hanford.gov/files.cfm/DOE-RL-96-68-VOL3-04.pdf.
DOE/RL-2007-28, 2008, Feasibility Study Report for the 200-ZP-1 Groundwater Operable Unit, Rev. 0,
U.S. Department of Energy, Richland Operations Office, Richland, Washington. Available at:
https://pdw.hanford.gov/document/0808050315.
https://pdw.hanford.gov/document/00098828.
DOE/RL-2009-115, 2020, Performance Monitoring Plan for the 200-ZP-1 Groundwater Operable Unit
Remedial Action, Rev. 3, U.S. Department of Energy, Richland Operations Office, Richland,
Washington. Available at: https://pdw.hanford.gov/document/AR-03747.
DOE/RL-2009-124, 200 West Pump and Treat Operations and Maintenance Plan, current revision,
U.S. Department of Energy, Richland Operations Office, Richland, Washington.
DOE/RL-2019-23, 2020, 200-ZP-1 Operable Unit Ringold Formation A Characterization Sampling and
Analysis Plan, Rev. 0, U.S. Department of Energy, Richland Operations Office, Richland,
Washington. Available at: https://pdw.hanford.gov/document/AR-03566.
DOE/RL-2019-38, 2019, 200-ZP-1 Operable Unit Optimization Study Plan, Rev. 0, U.S. Department of
Energy, Richland Operations Office, Richland, Washington. Available at:
https://pdw.hanford.gov/document/AR-03236.
EPA 542-R-13-008, 2013, Remediation Optimization: Definition, Scope and Approach, Office of Solid
Waste and Emergency Response and Office of Superfund Remediation and Technology
Innovation, U.S. Environmental Protection Agency, Washington, D.C. Available at:
https://www.epa.gov/sites/production/files/2015-
08/documents/optimizationprimer_final_june2013.pdf.
DOE/RL-2019-76, REV. 0
A-23
EPA/240/B-06-001, 2006, Guidance on Systematic Planning Using the Data Quality Objectives Process,
EPA QA/G-4, Office of Environmental Information, U.S. Environmental Protection Agency,
Washington, D.C. Available at:
https://www.epa.gov/sites/production/files/documents/guidance_systematic_planning_dqo_proce
ss.pdf.
EPA/600/4-79/020, 1983, Methods for Chemical Analysis of Water and Wastes, Office of Research and
Development, U.S. Environmental Protection Agency, Washington, D.C. Available at:
http://nepis.epa.gov/Exe/ZyPURL.cgi?Dockey=30000Q10.TXT.
EPA/600/R-93/100, 1993, Methods for the Determination of Inorganic Substances in Environmental
Samples, Office of Research and Development, U.S. Environmental Protection Agency,
Cincinnati, Ohio. Available at:
https://nepis.epa.gov/Exe/ZyPDF.cgi/30002U3P.PDF?Dockey=30002U3P.PDF.
EPA, Ecology, and DOE, 2008, Record of Decision Hanford 200 Area 200-ZP-1 Superfund Site, Benton
County, Washington, U.S. Environmental Protection Agency, Washington State Department of
Ecology, and U.S. Department of Energy, Olympia, Washington. Available at:
https://pdw.hanford.gov/document/00098825.
OSWER 9283.1-44, 2014, Recommended Approach for Evaluating Completion of Groundwater
Restoration Remedial Actions at a Groundwater Monitoring Well, U.S. Environmental Protection
Agency, Washington, D.C. Available at:
https://nepis.epa.gov/Exe/ZyPURL.cgi?Dockey=P100NB98.TXT.
SW-846, Test Methods for Evaluating Solid Waste: Physical/Chemical Methods, current update, Office
of Solid Waste and Emergency Response, U.S. Environmental Protection Agency,
Washington, D.C. Available at: https://www.epa.gov/hw-sw846.
TPA-CN-0875, 2019, TPA Change Notice Form, DOE/RL-2009-115, Performance Monitoring Plan for
the 200-ZP-1 Operable Unit Remedial Action, Revision 2, U.S. Department of Energy, Richland
Operations Office, Richland, Washington, November 6. Available at:
https://pdw.hanford.gov/document/AR-03254.
WAC 173-340, “Model Toxics Control Act—Cleanup,” Washington Administrative Code, Olympia,
Washington. Available at: http://apps.leg.wa.gov/WAC/default.aspx?cite=173-340.

DOE/RL-2019-76, REV. 0
A-24
This page intentionally left blank.
CHPRC - REVIEW COMMENT RECORD (RCR) 1. Date 2. Review No.
12/16/2020 3. Project No.
Page 1 of 3
A-6004-835 (REV 1)
5. Document Number(s)/Title(s) 6. Program/Project/Building Number 7. Reviewer 8. Organization/Group 9. Location/Phone DOE/RL-2019-76, 200-ZP-1 Operable Unit Optimization Study Sampling and Analysis Plan
Emerald Laija EPA Washington, DC 202.564.2724
17. Comment Submittal Approval 10. Agreement With Indicated Comment Disposition(s) 11. CLOSED
Reviewer/Point of Contact (print and sign) Reviewer/Point of Contact (print and sign)
Date Organization Manager (optional) (print and sign)
Date Date
Author/Originator (print and sign) Author/Originator (print and sign)
12. Item 13a. Comments 13b. Basis
13c. Recommendation
14. Reviewer Concurrence Required
(Y or N) 15. Disposition (provide justification if NOT accepted) 16.
Status
Comment 1 Section 1, page 1-3, lines 12-13
This bullet should be deleted
Accept with modification. The text was revised as follows: “Most nitrate in groundwater is currently present at concentrations that are less than an order of magnitude above the cleanup level. Considering current nitrate concentration trends and assuming there is no continuing source of nitrate, sufficient nitrate may have already been removed from the aquifer (resulting in substantial concentration reductions) to enable a transition to the MNA phase of the remedy that will still allow the nitrate cleanup level to be reached within the timeframe specified in the 200-ZP-1 OU ROD (EPA et al., 2008).” Text similar to that in the bullet associated with the comment appeared in two other places within the document (Section 1.2, page 1-10, lines 14-17, and Section 1.3.1, page 1-17, lines 7-9). A similar update was made to the text in these locations.
Closed
CHPRC - REVIEW COMMENT RECORD (RCR) 1. Date 2. Review No.
12/16/2020 3. Project No.
Page 2 of 3
A-6004-835 (REV 1)
Comment 2 Section 1.1.3,
page 1-9
Add an objective that states, “Obtain new and existing data to quantify impacts on the behavior of other COCs in ZP-1.” We cannot ignore the other COCs in this optimization effort.
Accept with modification. The evaluation of new data collection and existing data to quantify the impacts of the current optimization efforts on the behavior of other COCs is included in this SAP. Per the objectives of the OSP, PSQ#7 and DS#7 (described in Appendix A) address the data collection for evaluating attainment of RAOs for all COCs. Section A3.7 describes that current data collection efforts under the PMP would be sufficient to prepare a technical basis for this objective. In addition, a comprehensive plume evaluation effort was initiated to occur concurrently with the optimization study to further evaluate additional optimization needs for other COCs and COPCs throughout the Central Plateau. This comprehensive plume evaluation activity is described on page 1-4 of Chapter 1, and text has been added following the bullets in Section 1.1.3 (page 1-9): “The comprehensive evaluation initiated in FY 2020 as a separate activity taking place concurrently with the optimization study will provide a technical assessment of near- and long-term projected plume remediation, COC treatment, and source contaminant requirements for other COCs and contaminants of potential concern (COPCs). The resulting recommendations from this effort will develop the basis for additional remedy optimization actions that will be integrated into necessary CERCLA decision documents and remedy optimization efforts (anticipated to occur in the FY 2021/2022 timeframe) for relevant OUs in the Central Plateau, including 200-ZP-1.”
Closed
CHPRC - REVIEW COMMENT RECORD (RCR) 1. Date 2. Review No.
12/16/2020 3. Project No.
Page 3 of 3
A-6004-835 (REV 1)
Comment 3 Section 1.2, page 1-10, lines 14-19
The emphasis here fails to acknowledge the other COCs that need to be addressed in ZP-1.
Accept with modification. A new paragraph has been added following line 19 to describe how the other COCs will be addressed. This text states, “Plume dynamics for COCs from water quality data collected and evaluated under the 200-ZP-1 OU PMP (DOE/RL-2009-115) will be used to predict whether RAOs are expected to be achieved for all of the COCs under the optimization study configurations within the timeframe of the 200-ZP-1 ROD (EPA et al., 2008). In addition, a comprehensive evaluation has been initiated to provide a technical assessment of near- and long-term projected plume remediation, COC treatment, and source contaminant requirements for other COCs and COPCs (SGW-65172-VA).”
Closed
Comment 4 Section 2.4.2, page 2-21, lines 17-21
Formatting issue – missing bullets
Accepted. Formatting corrected to add bullets to list.
Closed
Comment 5 Section 3.3, page 3-5, lines 4-7
Formatting issue – missing bullets
Accepted. Formatting corrected to add bullets to list.
Closed