Embed Size (px)
Citation preview
Michael OrrDirector
Center for Real Estate Theory and PracticeMarch 10, 2015
Greater Phoenix Housing Market
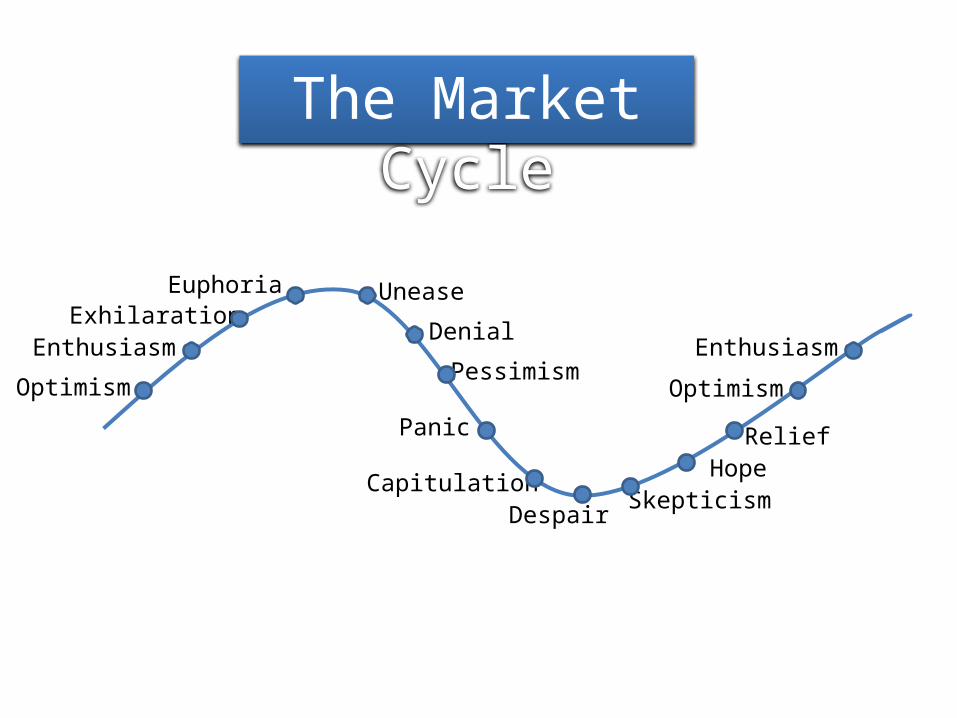
Euphoria
Denial
Despair
HopeSkepticism
Optimism
EnthusiasmExhilaration
Unease
Pessimism
Panic
Capitulation
Relief
Optimism
Enthusiasm
The Market Cycle
Euphoria
Denial
Despair
HopeSkepticism
Optimism
EnthusiasmExhilaration
Unease
Pessimism
Panic
Capitulation
Relief
Optimism
Enthusiasm
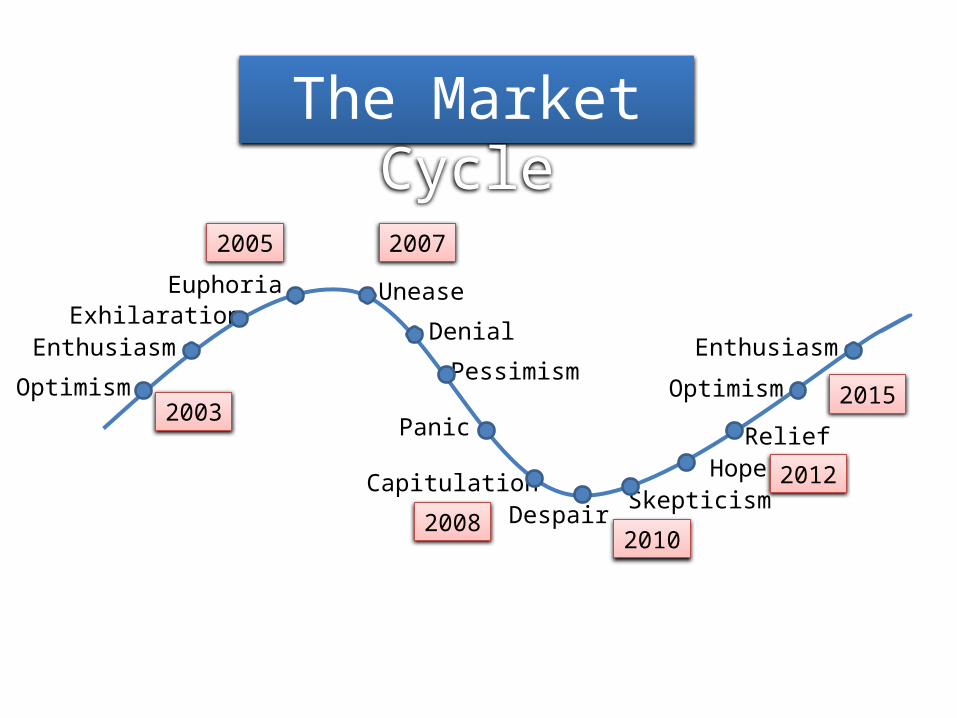
The Market Cycle
2005
20082010
2015
2007
2012
2003
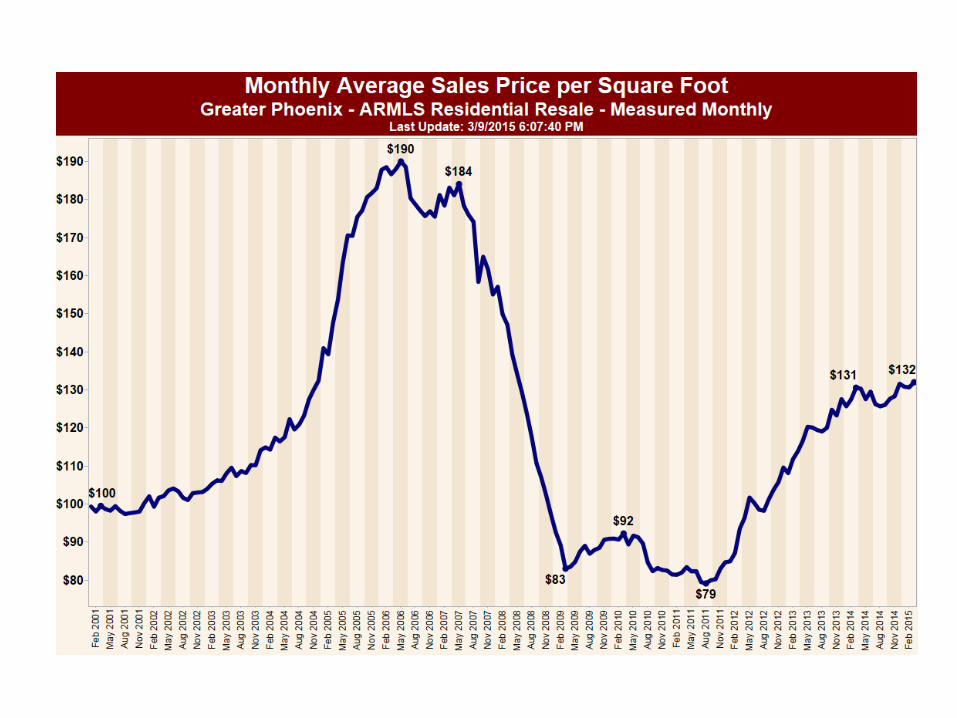
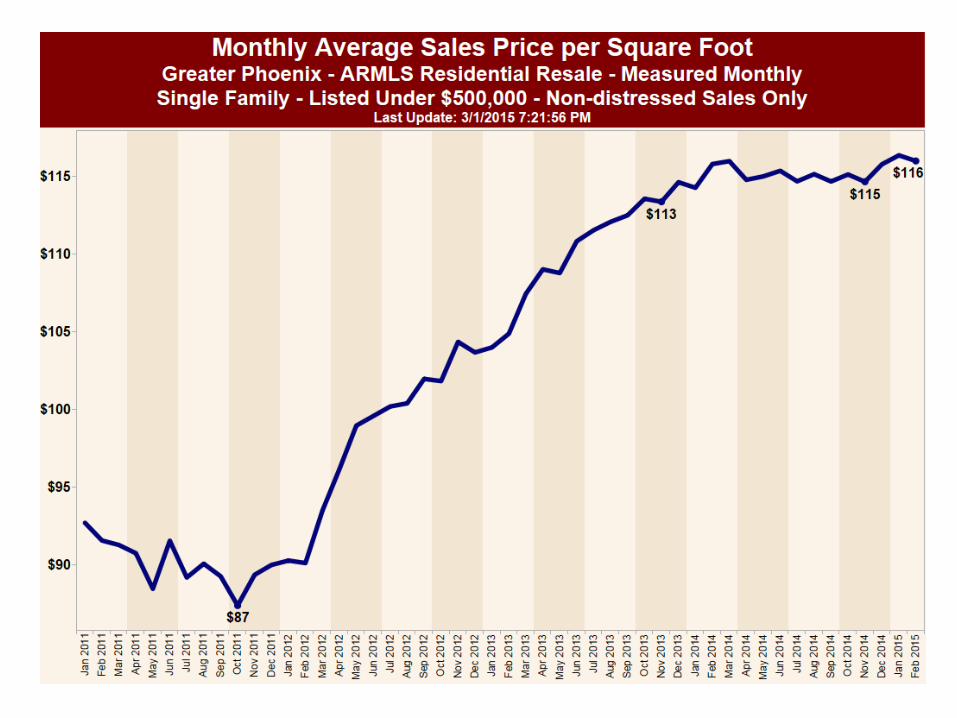
Most Home Prices Are Flator Keeping Pace with Inflation
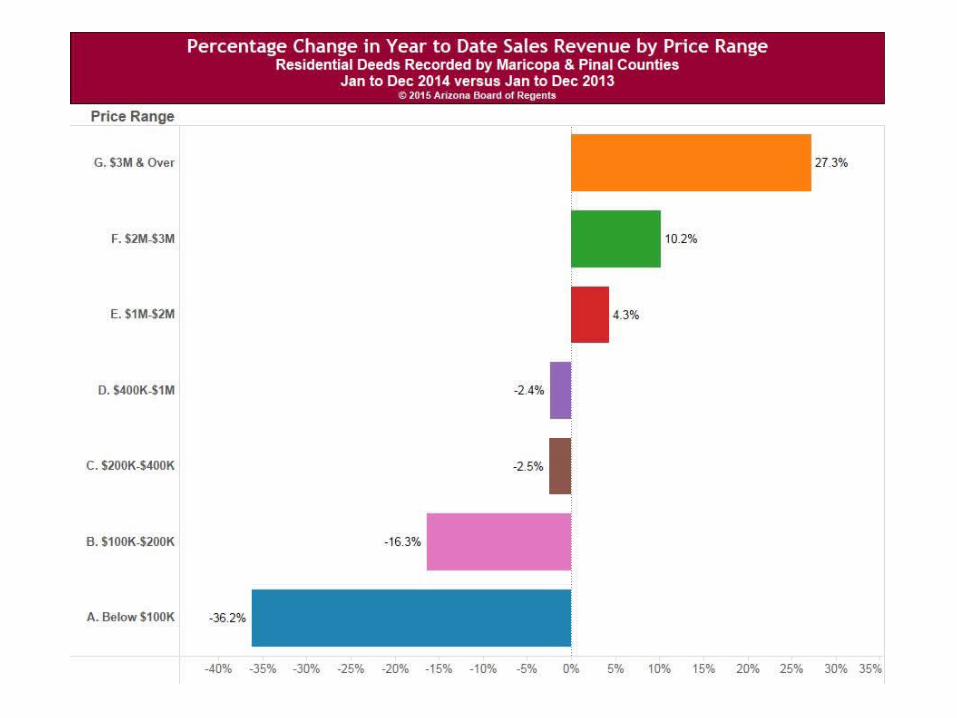
Some Segments are Falling or Rising, but Not Much
Outlook: Positive for Second Half of 2015
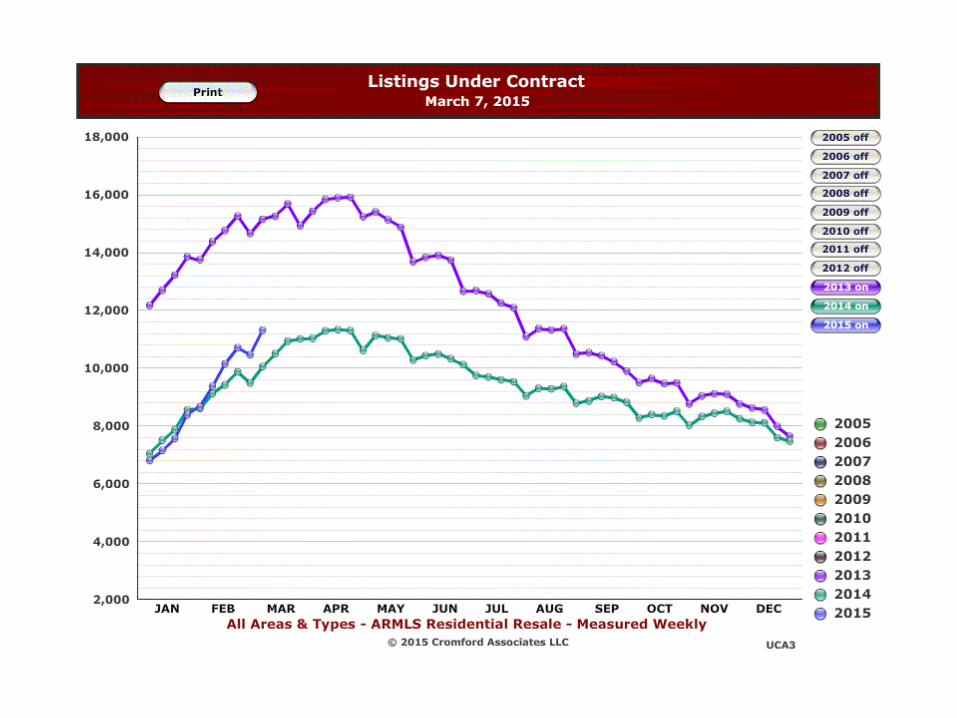
Demand for Homes to Buy Has Been Weak While
Demand for Homes to Rent Is Very Strong
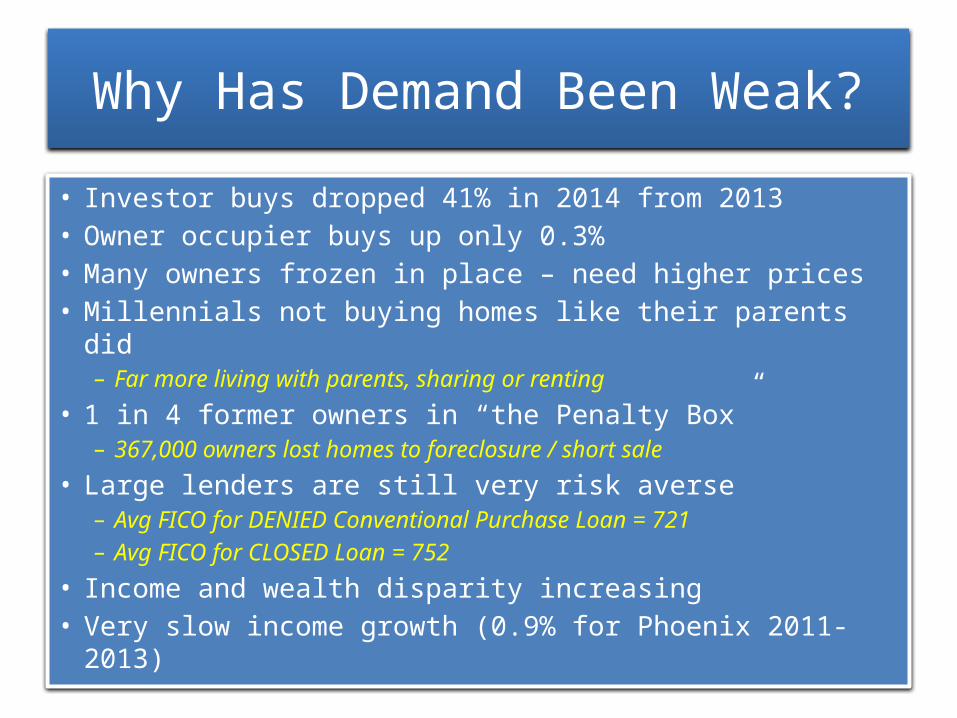
Why Has Demand Been Weak?
• Investor buys dropped 41% in 2014 from 2013• Owner occupier buys up only 0.3%• Many owners frozen in place – need higher prices• Millennials not buying homes like their parents did
– Far more living with parents, sharing or renting
• 1 in 4 former owners in “the Penalty Box”– 367,000 owners lost homes to foreclosure / short sale
• Large lenders are still very risk averse– Avg FICO for DENIED Conventional Purchase Loan = 721– Avg FICO for CLOSED Loan = 752
• Income and wealth disparity increasing• Very slow income growth (0.9% for Phoenix 2011-2013)
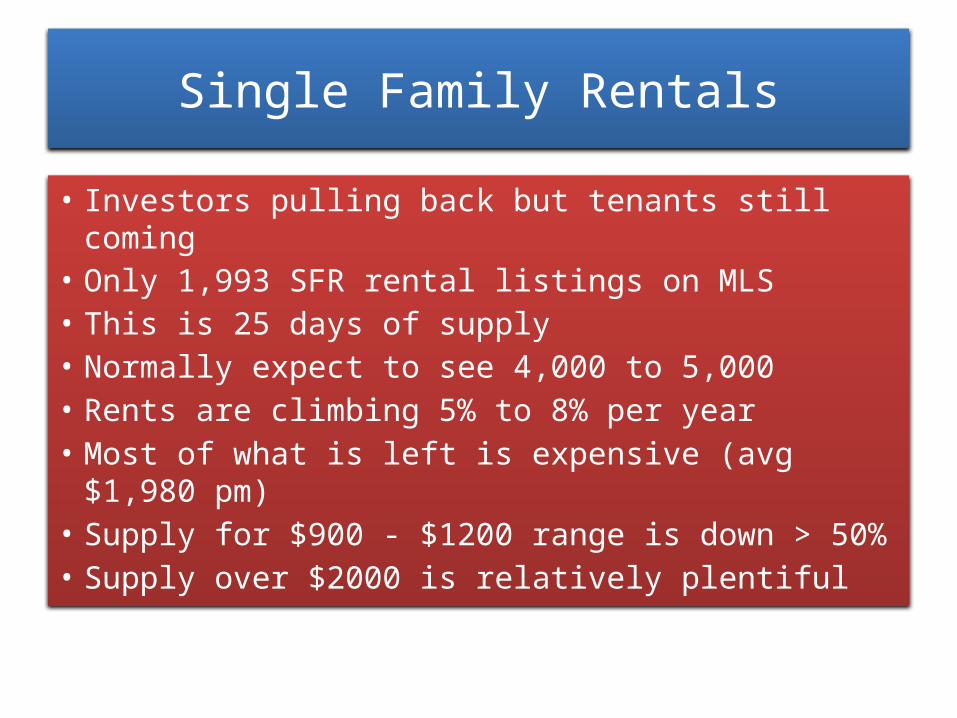
Single Family Rentals
• Investors pulling back but tenants still coming• Only 1,993 SFR rental listings on MLS• This is 25 days of supply• Normally expect to see 4,000 to 5,000• Rents are climbing 5% to 8% per year• Most of what is left is expensive (avg $1,980 pm)• Supply for $900 - $1200 range is down > 50%• Supply over $2000 is relatively plentiful

Prediction Is Very Difficult, Especially About the Future
- Neils Bohr (1885-1962)
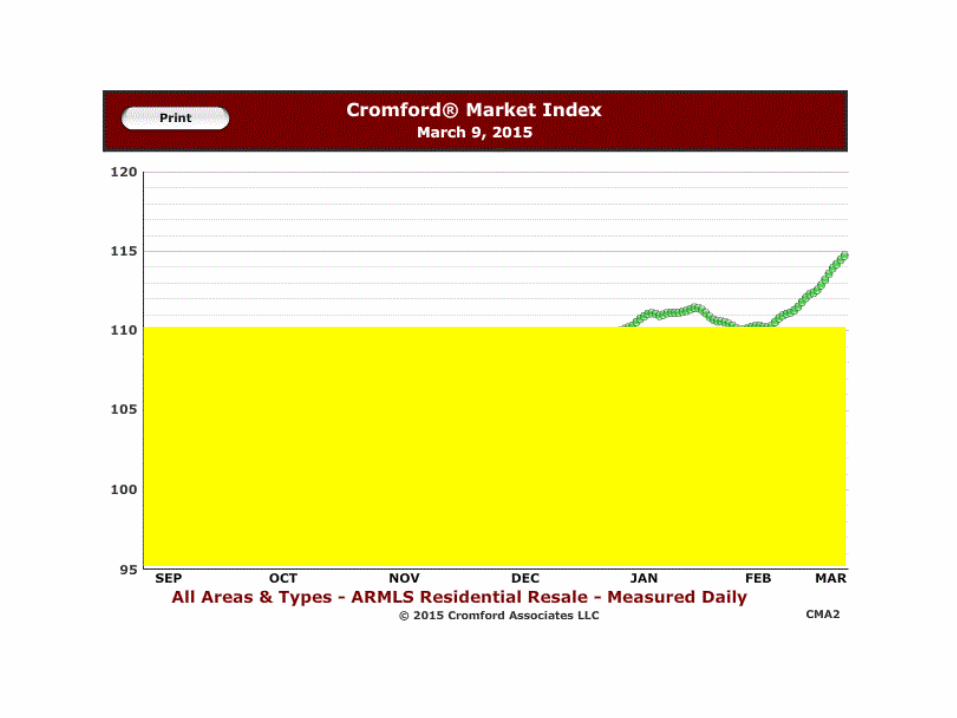
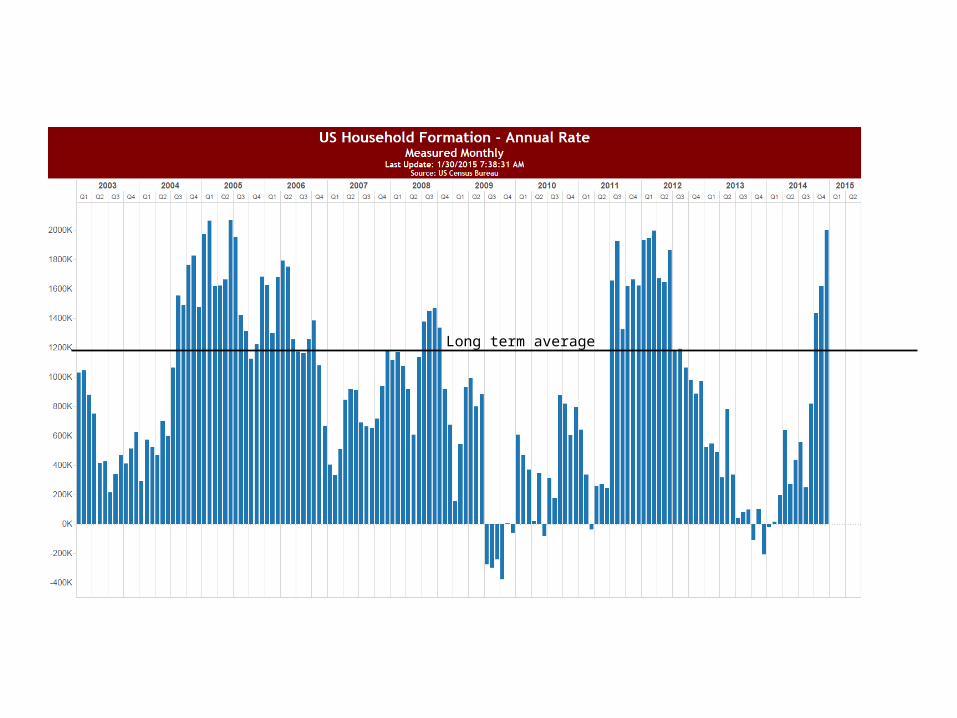
Long term average
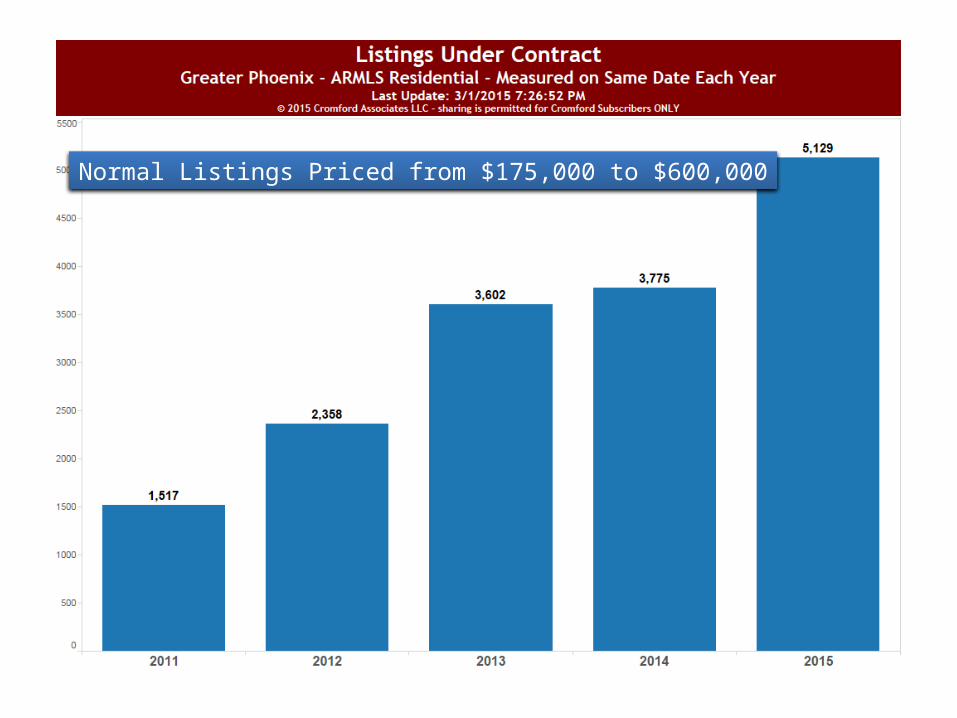
Normal Listings Priced from $175,000 to $600,000
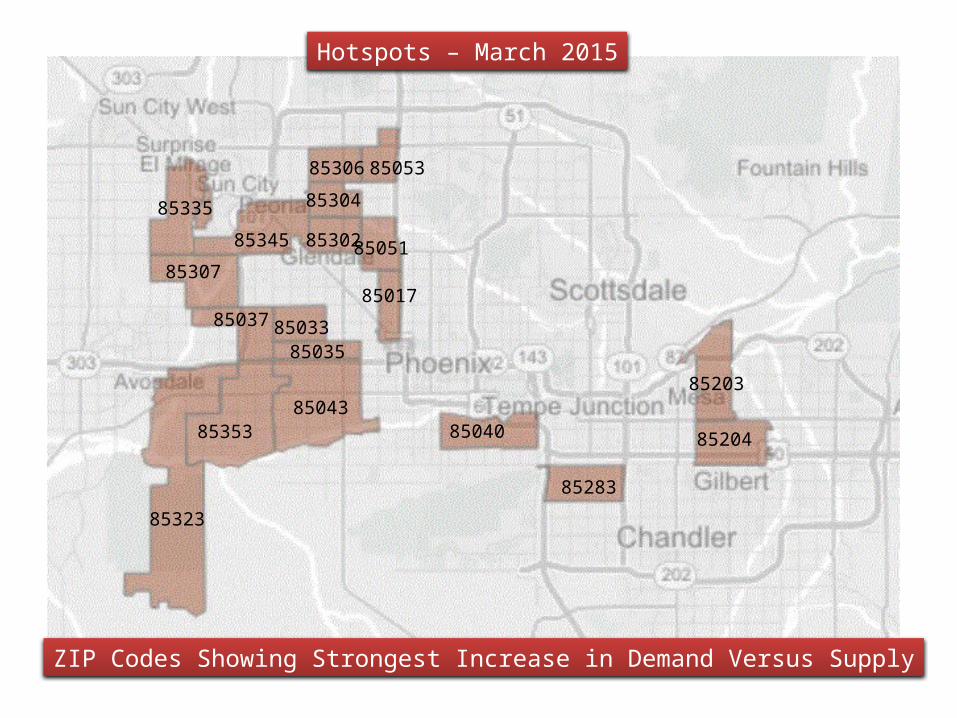
Hotspots – March 2015
8504385353
85323
8503385035
85037
85335
85307
85345 8530285051
85017
85304
85306 85053
85040
85283
85203
85204
ZIP Codes Showing Strongest Increase in Demand Versus Supply
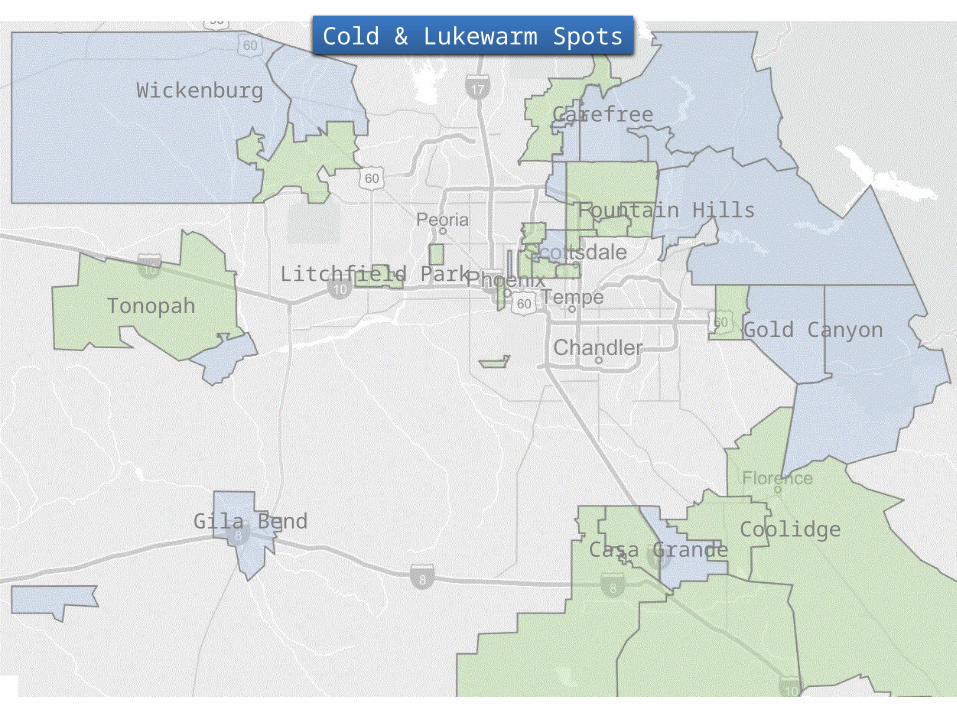
Cold & Lukewarm Spots
Gila Bend
Carefree
Fountain Hills
Casa Grande
Gold Canyon
Coolidge
Wickenburg
TonopahLitchfield Park
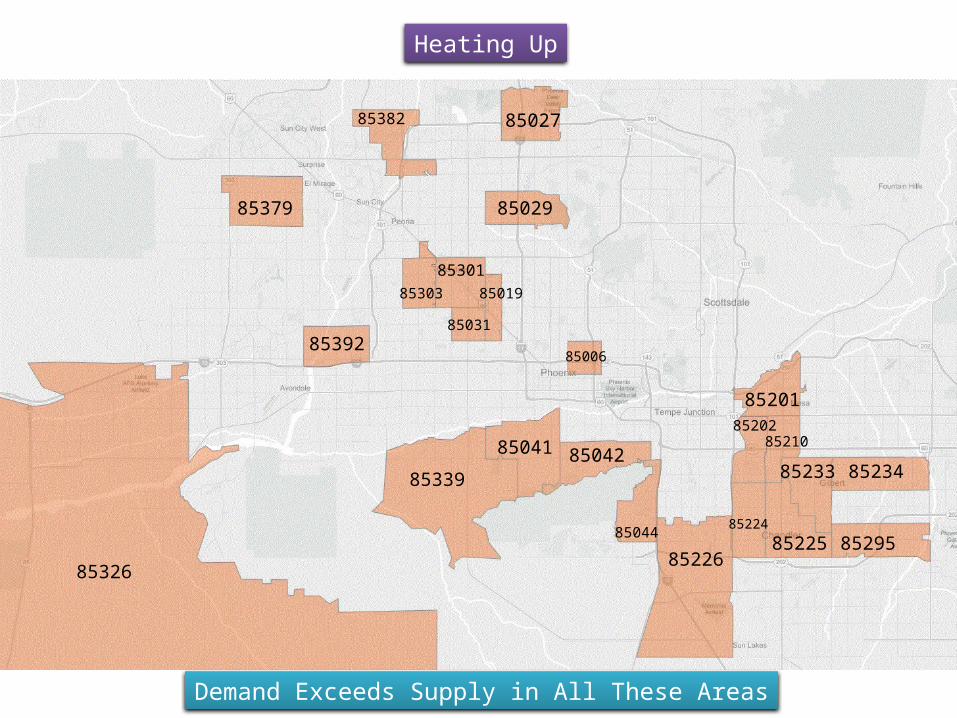
Heating Up
85326
85392
85379
85382 85027
85029
85303
8530185019
85031
85006
85339
85041 85042
Demand Exceeds Supply in All These Areas
85044
85226
85224
85225 85295
85233 85234
8520185202
85210
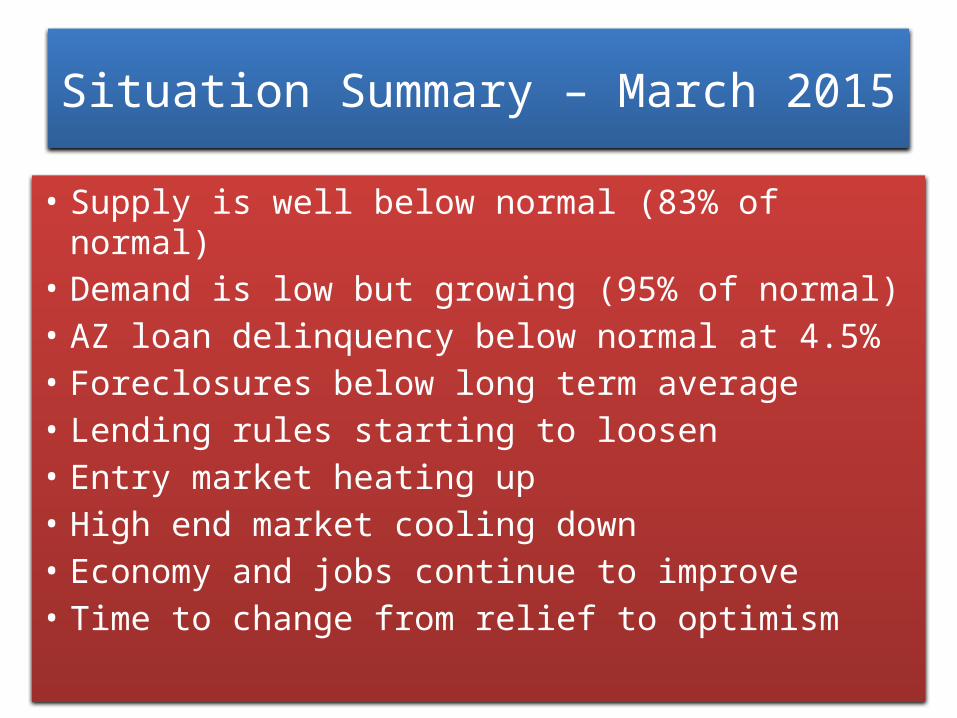
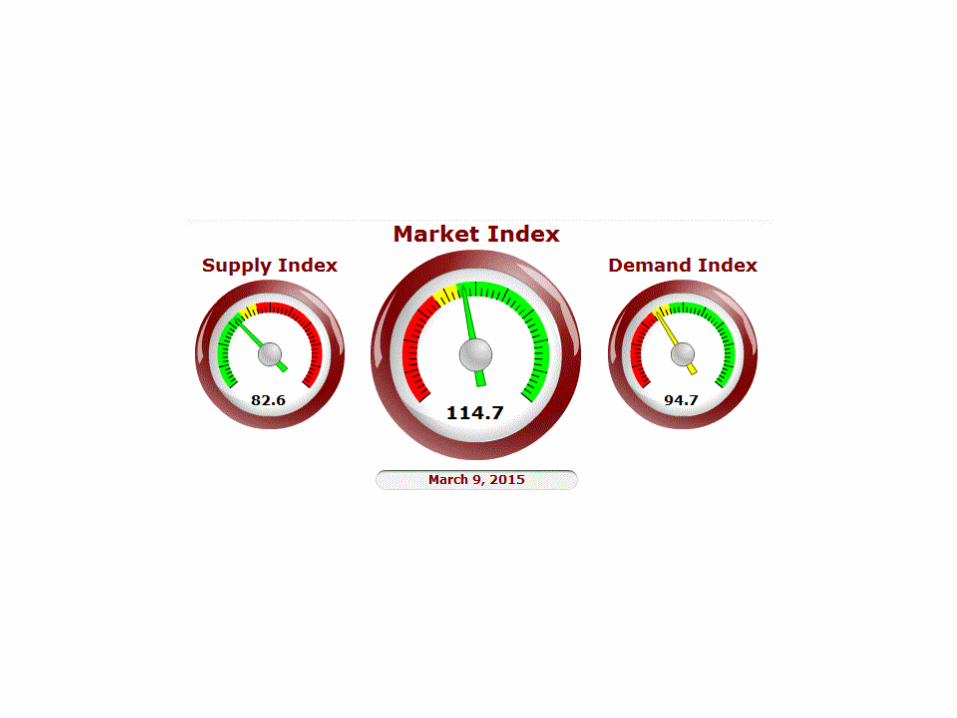
Situation Summary – March 2015
• Supply is well below normal (83% of normal) • Demand is low but growing (95% of normal)• AZ loan delinquency below normal at 4.5%• Foreclosures below long term average• Lending rules starting to loosen• Entry market heating up• High end market cooling down• Economy and jobs continue to improve• Time to change from relief to optimism

Michael OrrDirector
Center for Real EstateTheory and Practice