Embed Size (px)
Citation preview
Partial Discharge Measurement and Monitoring on High Voltage XLPE Cables
Michael Krüger, Rene Hummel, Stefan Böhler, OMICRON Austria
Maik Ufferhardt, OMICRON New Zealand
Alan McGuigan, OMICRON Australia
SUMMARY To check production quality, partial discharge (PD) measurements are performed on underground
cables or cable drums. PD impulses propagate through the cable and are reflected at the ends and on
joints. By measuring the delay between the impulse which is directly coming into the PD instrument
and the impulse which is reflected at the end, a location of the PD source can be done. Due to
reflections, partial discharges generally occur as pulse groups, which can lead to superimposed
oscillations of the PD filter which is required to determine the charge value as per IEC 60270. With a
new approach of simultaneous measurement at different receiver frequencies the superposition effects
can be eliminated.
With PD monitoring the reliability and availability of the equipment will increase and the life
time of the cable lines will be extended. Other important benefits of monitoring are higher
safety for the personnel and reduced environmental risks.
In the paper recommendations are given for the application of monitoring techniques to HV XLPE
cable systems. Particular attention is paid to: Sensitivity of PD measurements, multi-channel
evaluation technique for separation of PD sources and suppression of external noise, selective parts of
the hardware of the monitoring system like e.g.: inductive PD sensor, PD acquisition unit, optical
communication technology, power supply solutions and system engineering requirements;
KEYWORDS
Multi-channel PD systems, simultaneous PD measurement at all joints, digital PD instruments, PD
measurement on long underground cables, damping of impulses along the cable
21, rue d’Artois, F-75008 PARIS AUCKLAND 2013
http : //www.cigre.org

2
INTRODUCTION
The long term reliability of an underground cable installation depends on many factors: good
materials, good design and manufacturing, successful approval testing, defined operating conditions
and perfect assembly of accessories on site. It is considered necessary to carry out field testing to
confirm the quality of the proper installation. The purpose of after-laying testing is to check that the
cable laying and accessory installation have been correctly executed. Testing is required to confirm
contractual conditions and enable the owner-ship of the system to be transferred from the contractor to
the customer. It is not the purpose of the after-laying testing to demonstrate that the manufactured
quality of the cable or accessories is good. In the high voltage field, mounting of joints and
terminations should be done by well trained and skilled fitters following well proven erection
procedures. Efficient quality assurance (QA) procedures should always be the basis for the formal take
over by the customer of installed HV cable systems. [1].
AFTER-LAYING TESTS ON HIGH VOLTAGE CABLES
The following two IEC standards contain after-laying tests on HV cables:
IEC 60840, Edition 3.0 “Power cables with extruded insulation and their accessories for rated
voltages above 30 kV up to 150 kV – Test methods and requirements [2]
IEC 62067, Edition 1.1 “Power cables with extruded insulation and their accessories for rated
voltages above 150 kV up to 500 kV – Test methods and requirements [3]
The tables 1 and 2 show the test voltages after-laying.
Table 1 Test voltages according IEC 60840
Table 2 After-laying test voltages according to IEC 62067
3
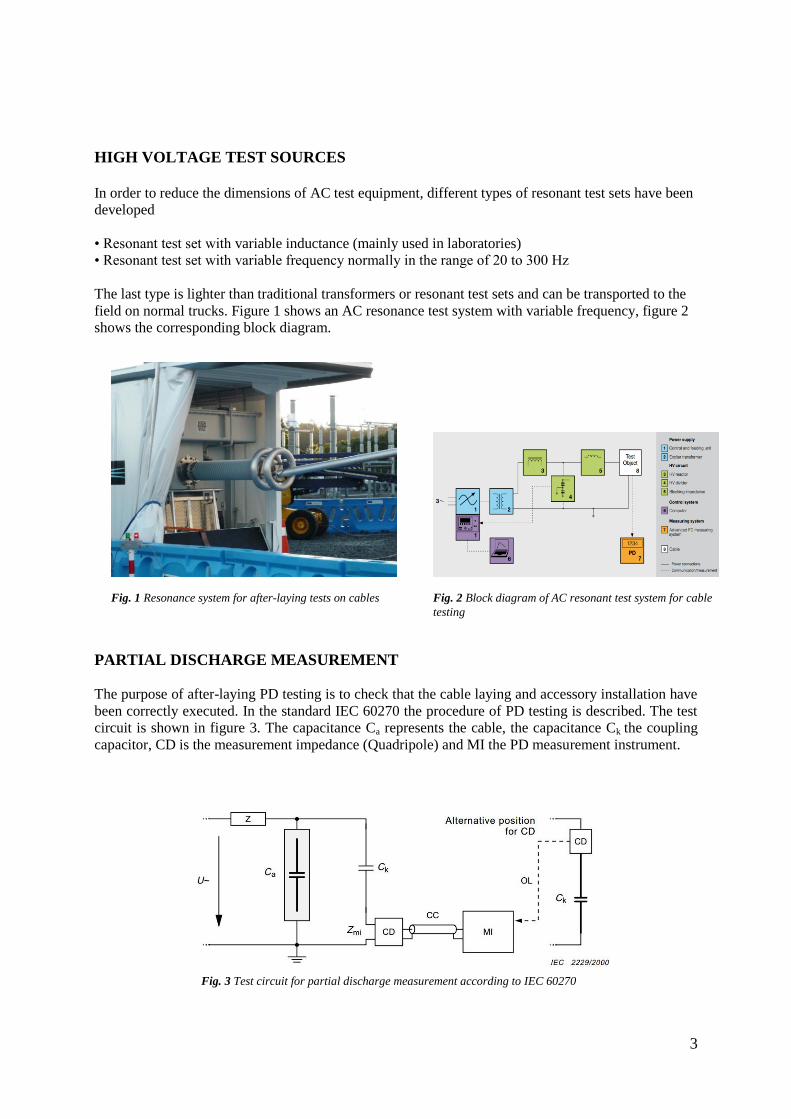
HIGH VOLTAGE TEST SOURCES
In order to reduce the dimensions of AC test equipment, different types of resonant test sets have been
developed
• Resonant test set with variable inductance (mainly used in laboratories)
• Resonant test set with variable frequency normally in the range of 20 to 300 Hz
The last type is lighter than traditional transformers or resonant test sets and can be transported to the
field on normal trucks. Figure 1 shows an AC resonance test system with variable frequency, figure 2
shows the corresponding block diagram.
PARTIAL DISCHARGE MEASUREMENT
The purpose of after-laying PD testing is to check that the cable laying and accessory installation have
been correctly executed. In the standard IEC 60270 the procedure of PD testing is described. The test
circuit is shown in figure 3. The capacitance Ca represents the cable, the capacitance Ck the coupling
capacitor, CD is the measurement impedance (Quadripole) and MI the PD measurement instrument.
Fig. 2 Block diagram of AC resonant test system for cable
testing
Fig. 1 Resonance system for after-laying tests on cables
Fig. 3 Test circuit for partial discharge measurement according to IEC 60270

4
The general calibration of the PD measurement circuit according to IEC 60270 is shown in figure 4.
The calibration for PD measurements on cables according to IEC 60885-3 is shown in figure 5 [4].
Modern PD instruments are working digitally. This has important advantages especially for long
underground cables. With a communication over fibre optical cables, several instruments can measure
synchronously within a few nanoseconds. This way PD instruments can be positioned on each joint
along the cable to detect PD from the joints and the end terminations with high sensitivity. Figure 6
shows the block diagram of such a digital PD instrument.
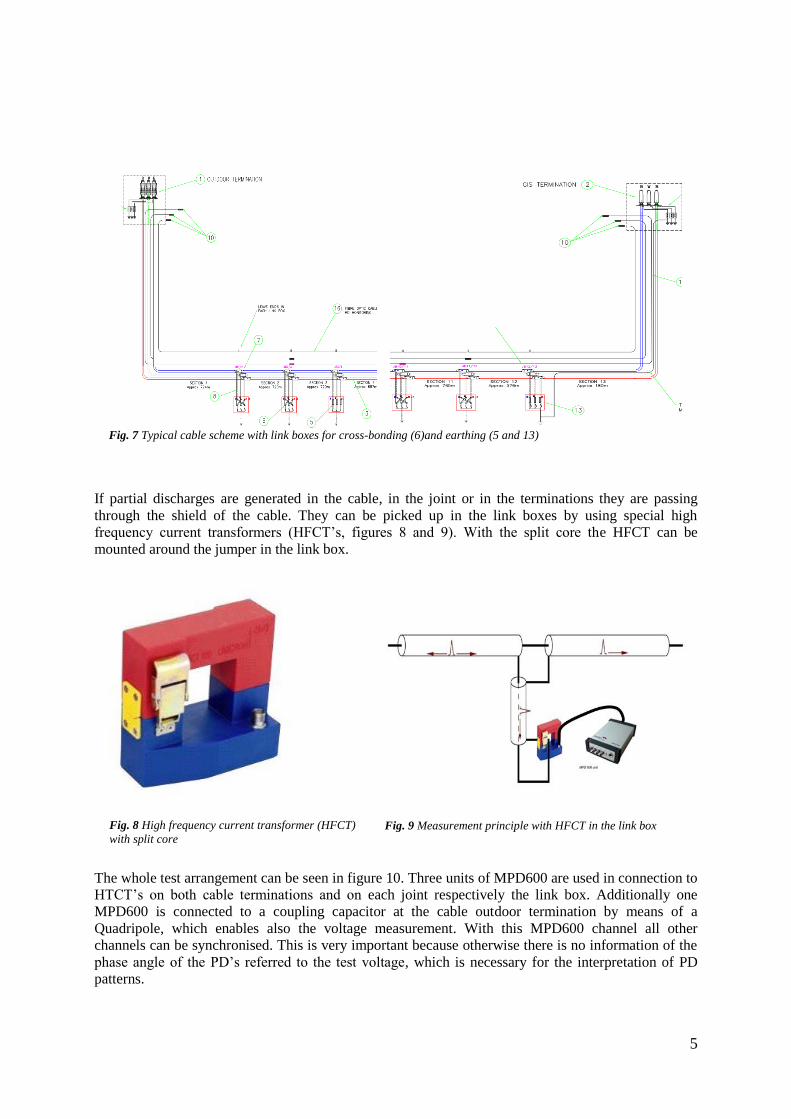
Figure 7 shows a high voltage underground cable with joints and corresponding link boxes for cross-
bonding of the cable shield and for grounding. One end of the cable is terminated with an outdoor
termination the other end is connected to a GIS. An optical fibre cable is installed together with the
HV cable for communication of the PD instruments to get them synchronised. Each PD instrument
acts as repeater for the optical signals. This way the length of the fibre optical cables is not critical
because the digital signals along the optical cable are repeated with each instrument. All PD
instruments can be mounted into the link boxes and can stay there for the high voltage tests of all
phases. The simultaneous access of all PD instruments is done normally from the end of the cable
where the high voltage test set is located. So the whole test procedure can be done from one place.
Fig. 4 Calibration according to IEC 60270 (general)
Fig. 5 Calibration according to IEC 60885 (cables)
Fig. 6 Block diagram of a digital PD instrument (IEC 60270 draft)
5
If partial discharges are generated in the cable, in the joint or in the terminations they are passing
through the shield of the cable. They can be picked up in the link boxes by using special high
frequency current transformers (HFCT’s, figures 8 and 9). With the split core the HFCT can be
mounted around the jumper in the link box.
The whole test arrangement can be seen in figure 10. Three units of MPD600 are used in connection to
HTCT’s on both cable terminations and on each joint respectively the link box. Additionally one
MPD600 is connected to a coupling capacitor at the cable outdoor termination by means of a
Quadripole, which enables also the voltage measurement. With this MPD600 channel all other
channels can be synchronised. This is very important because otherwise there is no information of the
phase angle of the PD’s referred to the test voltage, which is necessary for the interpretation of PD
patterns.
Fig. 7 Typical cable scheme with link boxes for cross-bonding (6)and earthing (5 and 13)
Fig. 8 High frequency current transformer (HFCT)
with split core
Fig. 9 Measurement principle with HFCT in the link box

6
.
Fig. 10 Test arrangement with MPD600 units at the coupling capacitor, the terminations and the joints
Fig. 11 Performance check of HFCT’s (principle)
Fig. 12 Performance check of a HFCT in a link box
7
The MPD600 which is connected to the coupling capacitor can be calibrated according to the
standards IEC 60270 and 60885 (figures 4 and 5). The standards don’t include the calibration of PD
instruments which are connected to HFCT’s. A real calibration is not possible because no impulse can
be injected directly into the closed and buried joint. Therefore a check of performance is normally
done (figures 11 and 12). The calibrator is connected to one turn of wire through the core of the
HFCT. The check shown in figure 12 includes also the mutual coupling of the jumper and the cable
between the joint and the link box. Normally the PD correction factor is approximately 5.5 for one
turn through the core window. The correction factor is nearly constant for PD measurement
frequencies from 500kHz up to 6MHz.
Selection of the PD Measurement Frequency
In IEC 60270 lower and upper frequency limit are given for wide band PD instruments.
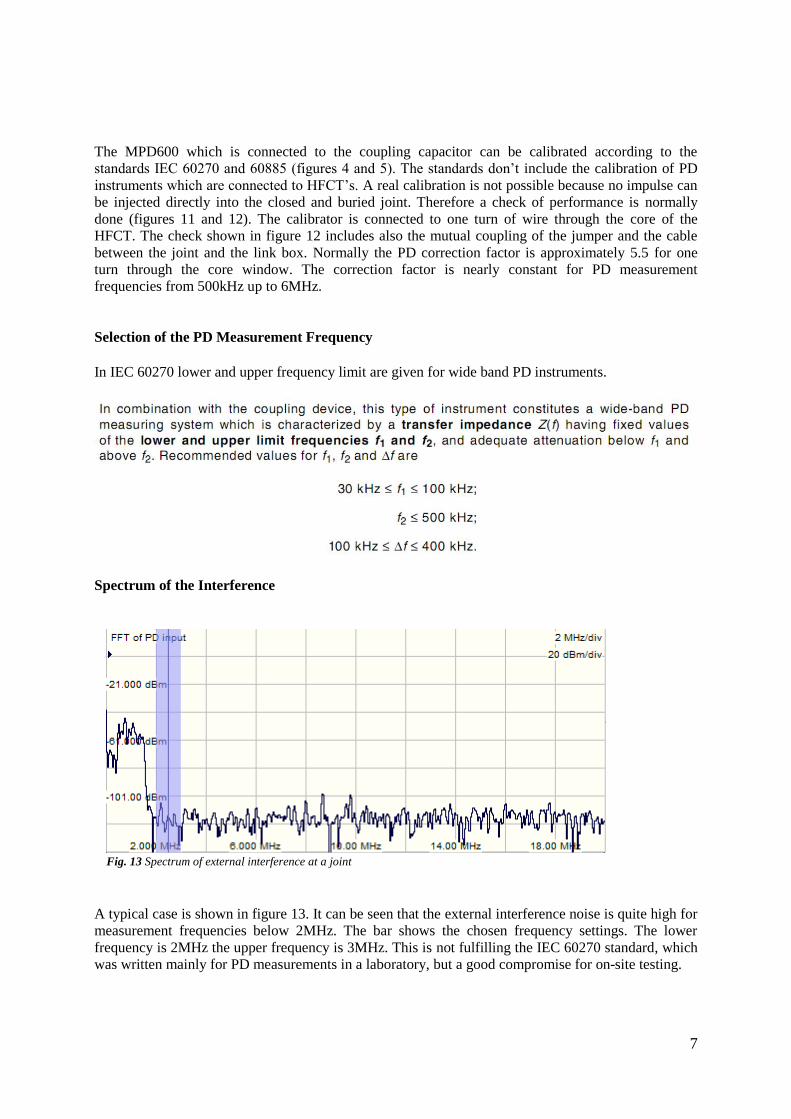
Spectrum of the Interference
A typical case is shown in figure 13. It can be seen that the external interference noise is quite high for
measurement frequencies below 2MHz. The bar shows the chosen frequency settings. The lower
frequency is 2MHz the upper frequency is 3MHz. This is not fulfilling the IEC 60270 standard, which
was written mainly for PD measurements in a laboratory, but a good compromise for on-site testing.
Fig. 13 Spectrum of external interference at a joint

8
Damping of PD Impulses along the Cable
Figure 14 shows the damping of a calibration impulse of 10nC, which is injected into the termination
of a 220kV cable. The measurement frequency range is 2MHz to 3MHz. The 10nC calibration impulse
can be seen up to the third joint. But small partial discharges can be seen at the joint of origin only.
But this is no disadvantage, because PD’s are expected at the joints and terminations mainly. So a
location of the PD fault is much easier.
Fig. 14 10nC at the coupling capacitor yellow phase
1.1 = coupling capacitor, 1.3 = joint 1-2, 1.4 = joint 2-3, 1.5 = joint 3-4
Fig. 15 Damping of PD impulses along a cable for different measurement
frequencies
coupling capacitor first joint
second joint third joint fourth joint
outdoor
termination

9
In figure 15 the damping for HF impulses on a 220kV cable is shown for centre frequencies from
500kHz up to 5MHz. This cable shows a massive damping for high frequencies. This behaviour was
reported by different authors especially for high voltage cables. The reason for this high damping is
the high influence of the semiconductive layers around the inner conductor and at the outer surface of
the main insulation.
CASE STUDY – PD TESTS ON A NEW 220kV CABLE
A 220kV cable with a total length of 8,4 km was commissioned and a partial discharge measurement
was done with a test voltage of 180 kV for one hour for each phase. Figure 16 shows the preparation
of the MPD600 with the batteries and the HFCT’s, figure 17 the resonance test set with the voltage
divider, the blocking impedance and the coupling capacitor. All HFCT’s were equipped with an air
gap of 2 x 0,2mm in the Ferrite core to prevent core saturation. The PD correction factor was found to
be k = 5,6 for each HFCT.
HFCT’s were connected to the terminations of the cable at the outdoor (figures 18 and 19) and the GIS
side (figure 20).
Fig. 16 Preparation of the MPD600 with batteries and
HFCT’s. The HFCT’s were equipped with an air gap in
the core to prevent core saturation
Fig. 17 HV resonance test set with voltage divider,
blocking impedance and coupling capacitor for PD
measurement
Fig. 18 Outdoor termination with the HV test setup
Fig. 19 HFCT at the outdoor termination
10
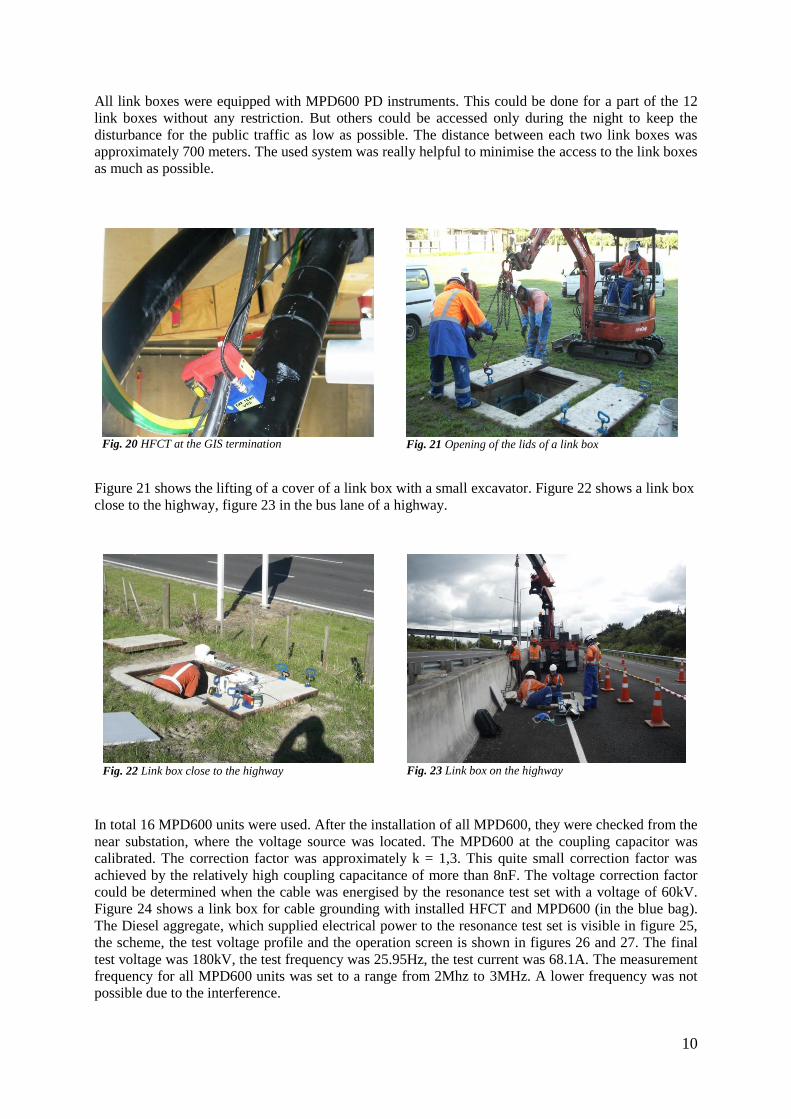
All link boxes were equipped with MPD600 PD instruments. This could be done for a part of the 12
link boxes without any restriction. But others could be accessed only during the night to keep the
disturbance for the public traffic as low as possible. The distance between each two link boxes was
approximately 700 meters. The used system was really helpful to minimise the access to the link boxes
as much as possible.
Figure 21 shows the lifting of a cover of a link box with a small excavator. Figure 22 shows a link box
close to the highway, figure 23 in the bus lane of a highway.
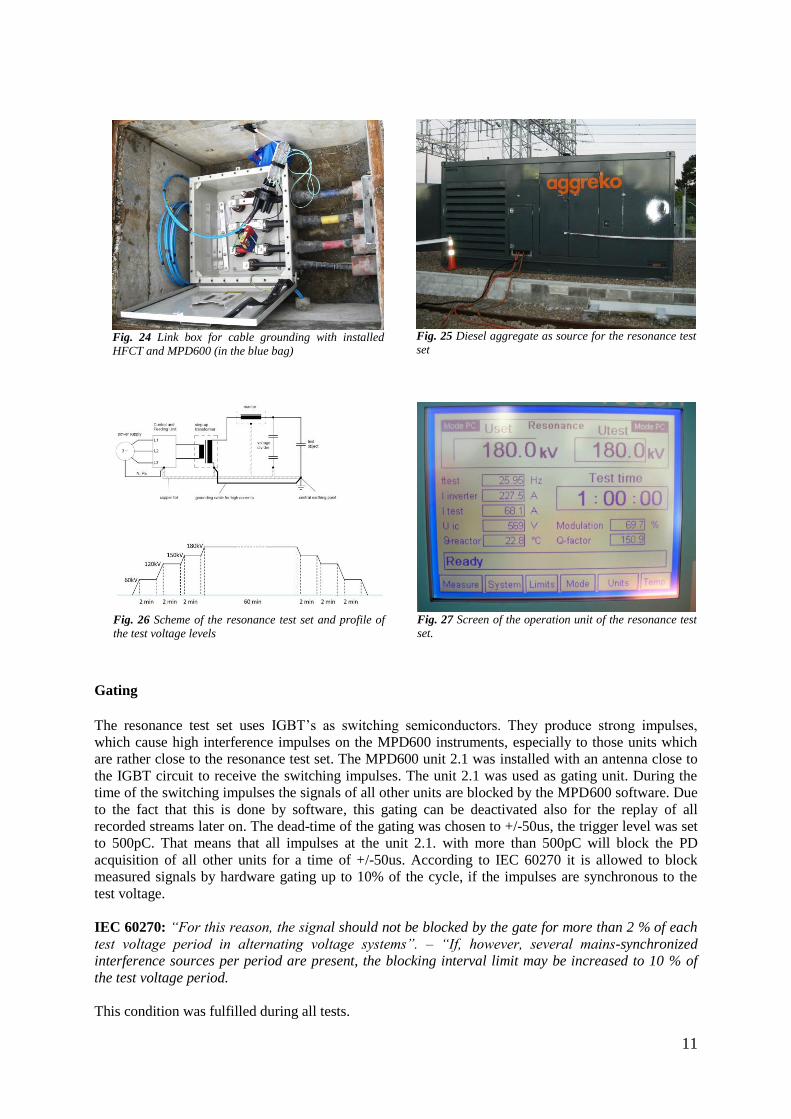
In total 16 MPD600 units were used. After the installation of all MPD600, they were checked from the
near substation, where the voltage source was located. The MPD600 at the coupling capacitor was
calibrated. The correction factor was approximately k = 1,3. This quite small correction factor was
achieved by the relatively high coupling capacitance of more than 8nF. The voltage correction factor
could be determined when the cable was energised by the resonance test set with a voltage of 60kV.
Figure 24 shows a link box for cable grounding with installed HFCT and MPD600 (in the blue bag).
The Diesel aggregate, which supplied electrical power to the resonance test set is visible in figure 25,
the scheme, the test voltage profile and the operation screen is shown in figures 26 and 27. The final
test voltage was 180kV, the test frequency was 25.95Hz, the test current was 68.1A. The measurement
frequency for all MPD600 units was set to a range from 2Mhz to 3MHz. A lower frequency was not
possible due to the interference.
Fig. 20 HFCT at the GIS termination
Fig. 21 Opening of the lids of a link box
Fig. 22 Link box close to the highway
Fig. 23 Link box on the highway
11
Gating
The resonance test set uses IGBT’s as switching semiconductors. They produce strong impulses,
which cause high interference impulses on the MPD600 instruments, especially to those units which
are rather close to the resonance test set. The MPD600 unit 2.1 was installed with an antenna close to
the IGBT circuit to receive the switching impulses. The unit 2.1 was used as gating unit. During the
time of the switching impulses the signals of all other units are blocked by the MPD600 software. Due
to the fact that this is done by software, this gating can be deactivated also for the replay of all
recorded streams later on. The dead-time of the gating was chosen to +/-50us, the trigger level was set
to 500pC. That means that all impulses at the unit 2.1. with more than 500pC will block the PD
acquisition of all other units for a time of +/-50us. According to IEC 60270 it is allowed to block
measured signals by hardware gating up to 10% of the cycle, if the impulses are synchronous to the
test voltage.
IEC 60270: “For this reason, the signal should not be blocked by the gate for more than 2 % of each
test voltage period in alternating voltage systems”. – “If, however, several mains-synchronized
interference sources per period are present, the blocking interval limit may be increased to 10 % of
the test voltage period.
This condition was fulfilled during all tests.
Fig. 24 Link box for cable grounding with installed
HFCT and MPD600 (in the blue bag)
Fig. 25 Diesel aggregate as source for the resonance test
set
Fig. 26 Scheme of the resonance test set and profile of
the test voltage levels
Fig. 27 Screen of the operation unit of the resonance test
set.
12
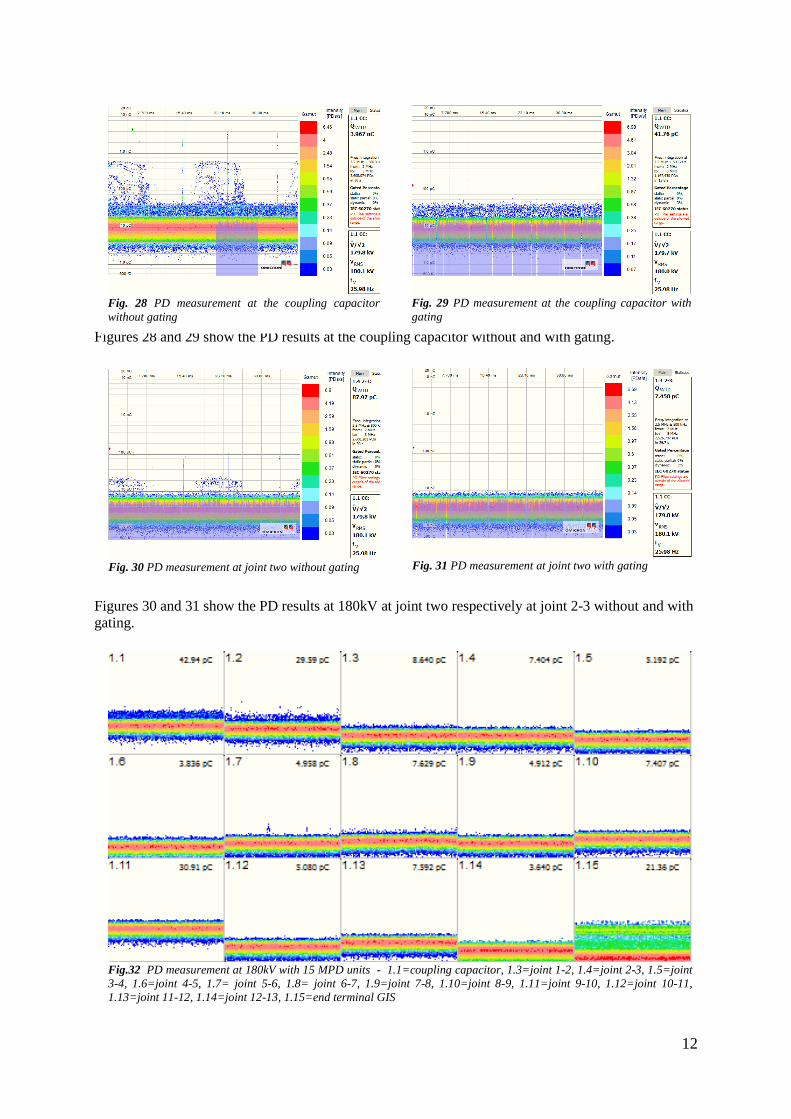
Figures 28 and 29 show the PD results at the coupling capacitor without and with gating.
Figures 30 and 31 show the PD results at 180kV at joint two respectively at joint 2-3 without and with
gating.
Fig. 28 PD measurement at the coupling capacitor
without gating
Fig. 29 PD measurement at the coupling capacitor with
gating
Fig. 30 PD measurement at joint two without gating
Fig. 31 PD measurement at joint two with gating
Fig.32 PD measurement at 180kV with 15 MPD units - 1.1=coupling capacitor, 1.3=joint 1-2, 1.4=joint 2-3, 1.5=joint
3-4, 1.6=joint 4-5, 1.7= joint 5-6, 1.8= joint 6-7, 1.9=joint 7-8, 1.10=joint 8-9, 1.11=joint 9-10, 1.12=joint 10-11,
1.13=joint 11-12, 1.14=joint 12-13, 1.15=end terminal GIS

13
The PD results at 180kV of all MPD600 units are shown in figure 32. The tests could be successfully
finished within 3 ½ days including the safety instructions, mounting of MPD600 to all link boxes and
changing the jumpers to all phases. All tests were going well. No partial discharges could be detected
above the noise level.
PD MONITORING ON HV CABLES
The concept of applied continuous monitoring system is presented in Fig. 1. The signals from different
sensors measuring partial discharges, distributed temperature, oil pressure in terminations and sheath
voltage limiters are acquired by multi-channel data acquisition units.
Fig.34 Schematic diagram of a monitoring system
Fig.33 Concept of a cable PD monitoring system
Fig.33 Concept of a cable PD monitoring system

14
The distributes sensor system at each joint is similar to the described on-site PD measurement system.
In case of PD signals, the acquisition unit performs advanced pre-processing of the raw data. The
disturbances are removed and main characteristics of the PD signal are determined. The output of the
data pre-processing is transferred to a server that enables long-term data storage. Advanced intelligent
pre-processing reduces the amount of data to adequate levels for transmission over a communication
network [5].
BIBLIOGRAPHY
[1] CIGRE WorkingGroup21-09 “After Laying Tests on High Voltage Extruded Insulation Cable
Systems”, ELECTRA No. 173 AUGUST 1997
[2] IEC 60840, Edition 3.0 2004-04 “Power cables with extruded insulation and their accessories
for rated voltages above 30 kV (Um= 36 kV) up to 150 kV (Um= 170 kV) – Test methods and
requirements”
[3] IEC 62067, Edition 1.1 2006-03 “Power cables with extruded insulation and their accessories
for rated voltages above 150 kV (Um= 170 kV) up to 500 kV (Um= 550 kV) – Test methods
and requirements”
[4] IEC 60885-3, “Electrical test methods for electric cables Part 3: Test methods for partial
discharge measurements on lengths of extruded power cable”
[5] D. Gieselbrecht, W. Koltunowicz, A. Obralic, et. al.: “Monitoring of 420 kV XLPE Cable
System in Underground Tunnel”, IEEE International Conference on Condition Monitoring and
Diagnosis 23-27 September 2012, Bali, Indonesia