Embed Size (px)
Citation preview
Sida Decentralised Evaluation
Implementation Evaluation of the Cooperation Strategy with Kenya 2009-2013
Part II: Poverty and Development Assessment
Ian ChristoplosAngela ChristieJohanna Bergman-LodinMichael Hauer
2013:35:II

Implementation Evaluation of the Cooperation Strategy with
Kenya 2009-2013
Part II: Poverty and Development Assessment
November 2013
Ian ChristoplosAngela Christie
Johanna Bergman-LodinMichael Hauer
Sida Decentralised Evaluation 2013:35:IISida
Authors: Ian Christoplos, Angela Christie, Johanna Bergman-Lodin and Michael Hauer
The views and interpretations expressed in this report are the authors’ and do not necessarily reflect those of the Swedish International Development Cooperation Agency, Sida.
Sida Decentralised Evaluation 2013:35:II
Commissioned by the Embassy of Sweden in Kenya
Copyright: Sida and the authors
Date of final report: November 2013
Published by Citat 2013
Art. no. Sida61656en
urn:nbn:se:sida-61656en
This publication can be downloaded from: http://www.sida.se/publications
SWEDISH INTERNATIONAL DEVELOPMENT COOPERATION AGENCY
Address: S-105 25 Stockholm, Sweden. Office: Valhallavägen 199, StockholmTelephone: +46 (0)8-698 50 00. Telefax: +46 (0)8-20 88 64E-mail: [email protected]. Homepage: http://www.sida.se

2
Table of Contents
Abbreviations and Acronyms ................................................................................................. 4
Preface ...................................................................................................................................... 6
Executive Summary ................................................................................................................. 7
Chapter 1: Introduction to the Poverty and Development Assessment ............................ 10
1.1 Purpose ...................................................................................................................... 10
1.2 Approach and Methodology ........................................................................................ 10
1.3 Policies Guiding the PDA ........................................................................................... 11
Chapter 2: Country Context .................................................................................................. 13
2.1 Economic Trends ........................................................................................................ 13
2.2 Social Development Trends........................................................................................ 15
2.3 Political Context .......................................................................................................... 17
Chapter 3: Poverty and Vulnerability ................................................................................... 19
3.1 Poverty Persists due to chronic vulnerability .............................................................. 19
3.2 Poverty is dynamic and related to spatial factors ........................................................ 23
Chapter 4: Opportunities for Resilience and Development ................................................ 26
4.1 Kenya’s dynamic economy ......................................................................................... 26
4.2 Improved security and reduced inequities .................................................................. 27
4.3 Agriculture and Livelihood Diversification ................................................................... 28
4.4 Human resources ....................................................................................................... 29
Chapter 5: Government Commitments and Action ............................................................. 30
5.1 Political Commitments and Institutional Change ......................................................... 30
5.2 Financial Commitments .............................................................................................. 32
5.3 Monitoring results ....................................................................................................... 33
Chapter 6: Development Cooperation and Sweden’s Role ................................................ 35
6.1 Development Partnerships ......................................................................................... 35
6.2 Aid Effectiveness ........................................................................................................ 37
6.3 Sweden’s Role............................................................................................................ 38
Chapter 7: Conclusions and Ways Forward ........................................................................ 40
7.1 Overview of findings ................................................................................................... 40
7.2 Trends, risks and opportunities................................................................................... 42
3
T A B L E O F C O N T E N T S
7.3 Points of departure for development efforts that reflect the nature of poverty in Kenya .
................................................................................................................................... 44
Annex 1 – Terms of Reference.............................................................................................. 46
Annex 2 – Inception Report .................................................................................................. 53
Annex 3 – DDA Data Source Matrix ...................................................................................... 69
Annex 4 – Key National Reporting Indicators ..................................................................... 80
Annex 5 – Development Partner Sectoral Priorities ........................................................... 81
Annex 6 – Swedish Development Cooperation with Kenya 2012 ...................................... 82
Annex 7 – Bibliography ......................................................................................................... 83
4
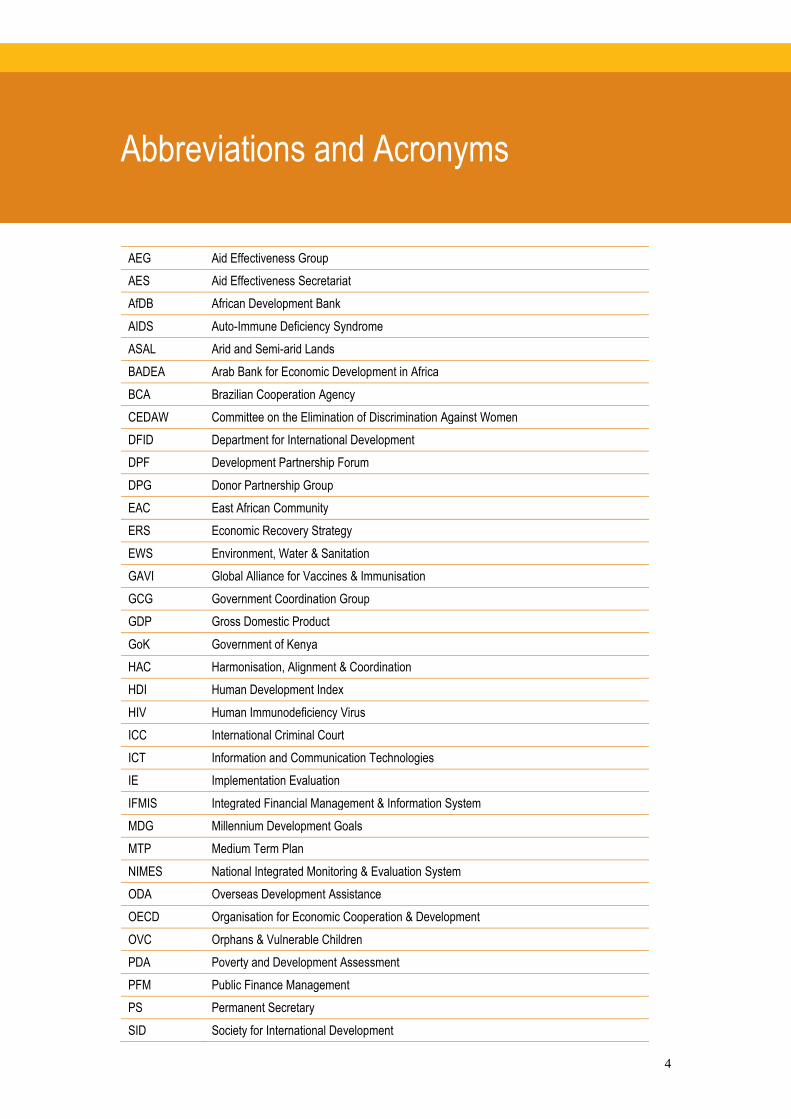
Abbreviations and Acronyms
AEG Aid Effectiveness Group
AES Aid Effectiveness Secretariat
AfDB African Development Bank
AIDS Auto-Immune Deficiency Syndrome
ASAL Arid and Semi-arid Lands
BADEA Arab Bank for Economic Development in Africa
BCA Brazilian Cooperation Agency
CEDAW Committee on the Elimination of Discrimination Against Women
DFID Department for International Development
DPF Development Partnership Forum
DPG Donor Partnership Group
EAC East African Community
ERS Economic Recovery Strategy
EWS Environment, Water & Sanitation
GAVI Global Alliance for Vaccines & Immunisation
GCG Government Coordination Group
GDP Gross Domestic Product
GoK Government of Kenya
HAC Harmonisation, Alignment & Coordination
HDI Human Development Index
HIV Human Immunodeficiency Virus
ICC International Criminal Court
ICT Information and Communication Technologies
IE Implementation Evaluation
IFMIS Integrated Financial Management & Information System
MDG Millennium Development Goals
MTP Medium Term Plan
NIMES National Integrated Monitoring & Evaluation System
ODA Overseas Development Assistance
OECD Organisation for Economic Cooperation & Development
OVC Orphans & Vulnerable Children
PDA Poverty and Development Assessment
PFM Public Finance Management
PS Permanent Secretary
SID Society for International Development
a
5
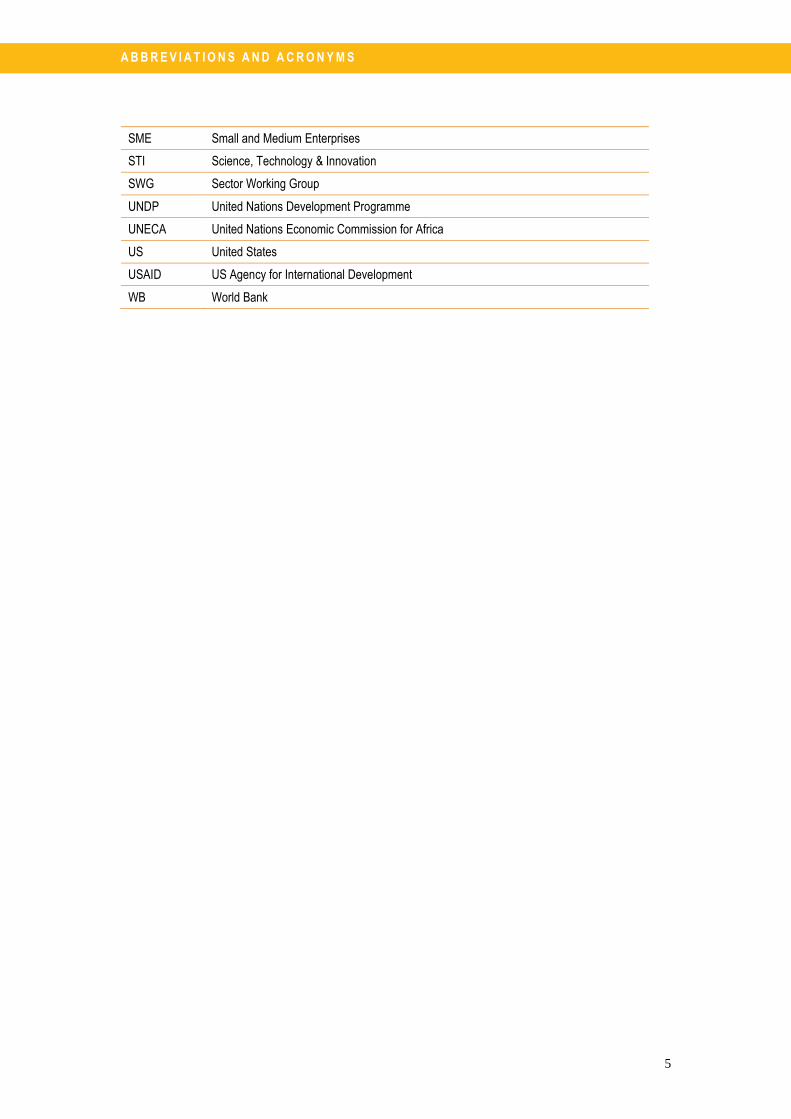
A B B R E V I A T I O N S A N D A C R O N Y M S
SME Small and Medium Enterprises
STI Science, Technology & Innovation
SWG Sector Working Group
UNDP United Nations Development Programme
UNECA United Nations Economic Commission for Africa
US United States
USAID US Agency for International Development
WB World Bank
6
Preface
This Poverty and Development Assessment (PDA) was commissioned by the Embas-
sy of Sweden in Kenya, as part of a broader assignment to evaluate the implementa-
tion of the Swedish Strategy for development cooperation with Kenya 2009-2013.
The Implementation Evaluation is published as a separate document and this PDA is
published as part II of the Implementation Evaluation.
The Poverty and Development Assessment was undertaken by Indevelop through
Sida’s framework agreement for reviews and evaluations between January-June 2013.
The independent evaluation team consisted of four members:
Angela Christie, Team Leader
Ian Christoplos, Evaluator
Johanna Bergman-Lodin, Evaluator
Michael Hauer, Evaluator
Indevelop’s Project Manager for the assignment was Anna Liljelund Hedqvist who
was responsible for coordination and management of the PDA and implementation
evaluation process. Dr Adam Pain provided external quality assurance to the reports.
Acknowledgments
The evaluation team wishes to express its sincere gratitude to the many people who
compiled and shared documentation and gave their time for interviews and open dis-
cussions. Indevelop specifically appreciates the level of engagement and useful com-
ments received from the Embassy of Sweden in Kenya that added value to the proc-
ess.
7
Executive Summary
This Poverty and Development Assessment (PDA) is the part II of the Implementa-
tion Evaluation of the Swedish Strategy for development cooperation with Kenya
2009-2013. The overall assignment was designed to contribute to the development of
the new Swedish Cooperation Framework for 2014-18. This report aims to:
provide a synthesised and overarching current perspective on poverty in
Kenya based on documented analyses and stakeholder discussion
reach conclusions on fundamental development challenges and opportunities
map the activity of development partners and against this backdrop identify
Sweden’s added value.
Kenya is one of the largest economics in Africa and, despite a number of significant
political, economic and climatic shocks and setbacks, has been able to maintain rela-
tively strong and steady growth over the past two decades. This has not led to signifi-
cant reduction of poverty. Social development performance has been lacklustre.
Wealth, power and access to resources remain highly skewed. There is a large, long-
standing and growing gap between the political/economic elite and the population in
general. New institutional reforms suggest promise for addressing these inequities,
but the political commitments for moving from proclamations to practice regarding
rights, participation, transparency and accountability remain untested.
The root causes of poverty in Kenya are complex and related to access to financial,
land and water resources, basic services, power and livelihood choice. Inequality is
pronounced and linked to geography, ethnicity and gender. Both rural and urban pov-
erty are associated with capacities to deal with converging livelihood shocks. In rural
areas these shocks may be climatic and are manifested in food insecurity. Urban pov-
erty is more linked to access to wage labour, health and sanitation and exposure to
violence. Periods of growth have made inroads into urban poverty, but have had little
positive impact in rural areas. Paths in and out of poverty are dynamic. Persistent
poverty is linked to the failure to accumulate assets and to downward spirals caused
by recurrent shocks and disasters. Escapes from entrenched poverty are primarily
associated with livelihood diversification.
Changes in the Kenyan economy are creating opportunities for such diversification.
Kenya is the gateway to East and Central Africa, a regional business hub and a major
tourist destination. Investments are attracted by Kenya’s capacities in relation to in-
novation, a relatively well-educated workforce and a growing and increasingly inclu-
sive financial market. Regional markets are growing rapidly and Kenyan entrepre-
neurs have experience in taking advantage of these opportunities. In the urban areas
young professionals are creating a dynamic climate for investment and growth. Agri-
culture is likely to remain central to Kenyan development, and areas such as horticul-
E X E C U T I V E S U M M A R Y
8
ture have grown significantly. Many households are taking advantage of new oppor-
tunities and diversifying their production. After a period of decline in the security
situation the the relatively peaceful elections give cause for optimism. Devolution and
other institutional reforms are generating a potential for enhanced public accountabil-
ity, more equitable distribution of resources, greater gender equality, and demand-
driven service provision.
The new Constitution represents a formal commitment to reform in areas that are key
to move towards enhanced respect for human rights. There is still a significant dis-
connect between people’s constitutional rights, their awareness of these rights and
public officials’ commitments and capacity to act on their new duties. Corruption is a
major concern, and new policy commitments may not overcome vested interests in
maintaining the status quo. There is a risk that poor governance and patronage politics
may continue and perhaps even be reinforced in new ways by the devolution process.
Vision 2030 is ambitious and the new Constitution includes clear principles for public
spending. Kenya’s actions to live up to existing African commitments for investing in
key sectors related to poverty alleviation have been insufficient. A robust monitoring
system will be vital to track the extent to which policies are put into action and what
this means for poverty reduction.
The landscape of development cooperation is changing; new partners with different
priorities are engaging with government; new aid modalities are also emerging, such
as guarantees and credit mechanisms; and commercial relationships are becoming
more important. The principles and practices of aid effectiveness remain critically
important in terms of ownership, transparency and accountability. Systems are in
place to monitor and promote aid effectiveness through donor coordination. Despite
stated government intentions to take greater control over the aid agenda, there are no
indications of significant moves towards budget support or related modalities.
Sweden’s country strategy 2009-13 focuses on human rights and democracy, natural
resources and urban development. Sweden and its partners perceive that Sweden has
a strong and unique role in development cooperation due to its extensive knowledge
of Kenya and strong trust and credibility with the Kenyan Government and civil soci-
ety. These factors combine to create conditions conducive to dialogue, even on diffi-
cult issues. This includes just and equitable distribution of resources, notably land,
and the human rights perspective.
The overall conclusions of the PDA are that Kenya today is characterised by a strik-
ing mix of optimism and pessimism. People are optimistic that the new Constitution
will deliver much needed reforms and there is some faith that public institutions, such
as the judiciary, will regain their intended role after years of ethnic politics and elite
capture. People are pessimistic in their views that the economy is not yet on course to
deliver gains that will result in poverty alleviation and improvement in their living
conditions. There is cause for this pessimism, as Kenya’s current performance in
terms of maintaining acceptable nutritional standards, access to clean water, control-
E X E C U T I V E S U M M A R Y
9
ling endemic violence and increasing gender equality are not reflective of a country
that is seen as a leader in African development.
Discussions about the nature of poverty when developing this PDA revealed two con-
trasting perspectives that impinge on future commitments to addressing poverty alle-
viation from a rights based perspective. First, there is a clear recognition that the GoK
must be more accountable to its citizens. The constitutional reforms, devolution proc-
ess and especially efforts to address land issues, are expected to create a new set of
stronger accountabilities between duty bearers and rights holders. The other, less
promising development, is a tendency to see an explicit focus on the poor as not be-
ing essential. The weak sustainability and waning GoK commitments to finance pro-
grammes directed towards the poor, and the failures of both development and hu-
manitarian programming to reduce the recurrent nature of shocks that generate pov-
erty, have led to cynicism. Many assume that it is impossible to fundamentally
change Kenya’s political economy. Such assumptions reinforce the power of elites
and maintain inequality. While in many respect valid, there are dangers if these atti-
tudes provide a justification to ignore the factors that create vulnerability. This can
then become an excuse for withdrawing services from difficult areas and turning a
blind eye to land dispossession if it is argued that attention to the perspectives of the
poor is a relic of a failed development model. If the poor disappear from the political
landscape, their rights will be in danger.
10
Chapter 1: Introduction to the Poverty and Development Assessment
“A Kenya where all poor women, men, girls and boys have the opportunity to im-
prove their living conditions and where their human rights are realised.”
1.1 PURPOSE
This Poverty and Development Assessment (PDA) is the part II of an assignment,
commissioned by the Embassy of Sweden in Nairobi, designed to contribute to the
development of the new Swedish Cooperation Framework for 2014-18.
There are many dimensions of Kenyan poverty, largely related to a lack of access to
resources, choice and power. These dimensions are dynamic, being affected by the
interplay of changes in the economic context, climatic conditions, political and social
conflicts and commitments by the state and international community. The many mani-
festations, drivers and dynamics of poverty present as a complex set of challenges in
identifying priorities for development cooperation. This report is intended to:
provide a synthesised and overarching current perspective on poverty in
Kenya based on documented analyses and stakeholder discussion;
reach conclusions on fundamental development challenges and opportunities;
map the activity of development partners and against this backdrop identify
Sweden’s added value.
This PDA is accompanied by an Implementation Evaluation (IE), that is published
as a separate report, which assesses:
Sweden’s progress with regard to its 2009-13 strategic and sectoral objectives,
focusing in particular on which results (planned and unplanned) have been
achieved;
the extent to which dialogue has contributed to the achievement of strategic
and sectoral objectives;
the effectiveness, efficiency and relevance of channels for aid (government,
civil society, multilateral) and aid modalities (sector programme, core contri-
bution, programme based approach);
contributions which have led to achievements that resonate with the findings
of the PDA.
1.2 APPROACH AND METHODOLOGY
Details of the approach and methodology adopted for this assignment are set out in
the Inception Report included as Annex II. The PDA involved a desk review, inter-
views with key stakeholders and workshops with Embassy staff and with key devel-
opment partners. The full bibliography for the assignment appears at the end of this
C H A P T E R 1 : I N T R O D U C T I O N T O T H E P O V E R T Y A N D D E V E L O P M E N T A S S E S S M E N T
11
report. It should be stressed that the analyses in this PDA reflect the independent find-
ings and conclusions of the evaluation team and do not necessarily reflect the views
of the Embassy.
Furthermore, one overall caveat must be mentioned in relation to the trends described
in this report. There are a number of anomalies in the trends for 2012 in sudden in-
creases in public expenditure and other economic indicators. While recognising that
the Kenyan economic situation has been volatile for some time, the team attributes
these recent anomalies to the election period together with investments in relation to
devolution and other aspects of the new Constitution, and therefore does not interpret
these as being indicative of general trends.
1.3 POLICIES GUIDING THE PDA
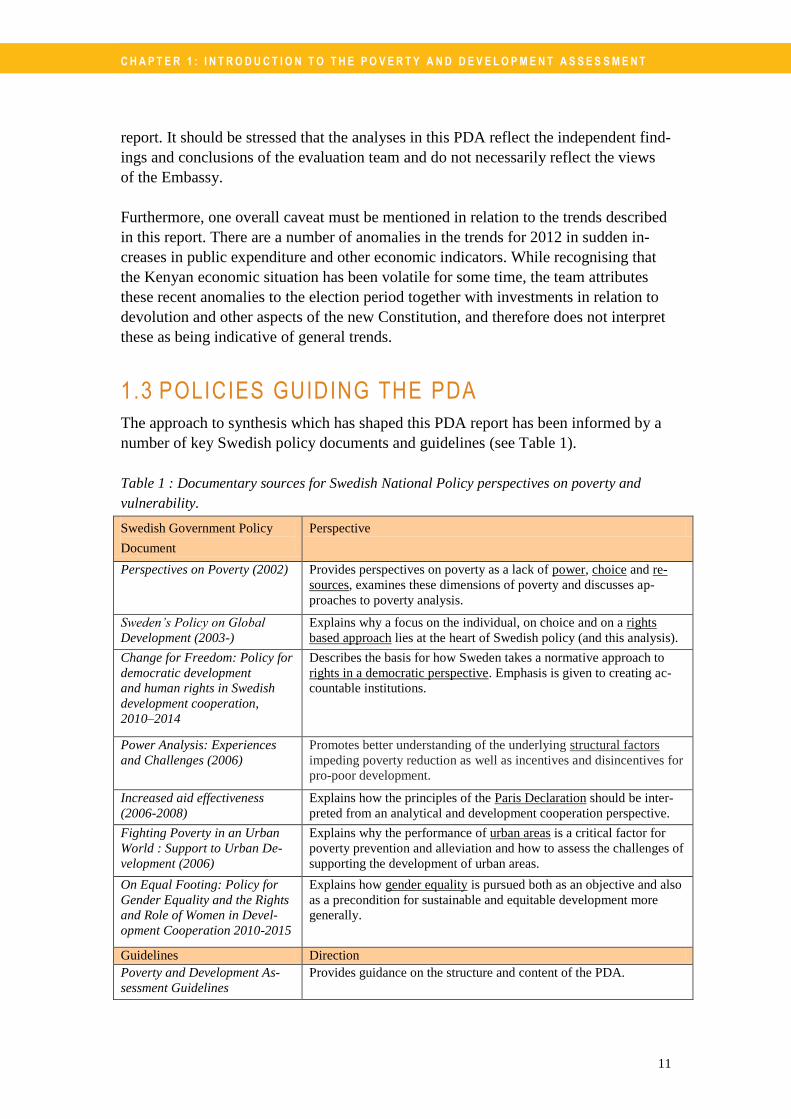
The approach to synthesis which has shaped this PDA report has been informed by a
number of key Swedish policy documents and guidelines (see Table 1).
Table 1 : Documentary sources for Swedish National Policy perspectives on poverty and
vulnerability.
Swedish Government Policy
Document
Perspective
Perspectives on Poverty (2002) Provides perspectives on poverty as a lack of power, choice and re-
sources, examines these dimensions of poverty and discusses ap-
proaches to poverty analysis.
Sweden’s Policy on Global
Development (2003-)
Explains why a focus on the individual, on choice and on a rights
based approach lies at the heart of Swedish policy (and this analysis).
Change for Freedom: Policy for
democratic development
and human rights in Swedish
development cooperation,
2010–2014
Describes the basis for how Sweden takes a normative approach to
rights in a democratic perspective. Emphasis is given to creating ac-
countable institutions.
Power Analysis: Experiences
and Challenges (2006)
Promotes better understanding of the underlying structural factors
impeding poverty reduction as well as incentives and disincentives for
pro-poor development.
Increased aid effectiveness
(2006-2008)
Explains how the principles of the Paris Declaration should be inter-
preted from an analytical and development cooperation perspective.
Fighting Poverty in an Urban
World : Support to Urban De-
velopment (2006)
Explains why the performance of urban areas is a critical factor for
poverty prevention and alleviation and how to assess the challenges of
supporting the development of urban areas.
On Equal Footing: Policy for
Gender Equality and the Rights
and Role of Women in Devel-
opment Cooperation 2010-2015
Explains how gender equality is pursued both as an objective and also
as a precondition for sustainable and equitable development more
generally.
Guidelines Direction
Poverty and Development As-
sessment Guidelines
Provides guidance on the structure and content of the PDA.
C H A P T E R 1 : I N T R O D U C T I O N T O T H E P O V E R T Y A N D D E V E L O P M E N T A S S E S S M E N T
12
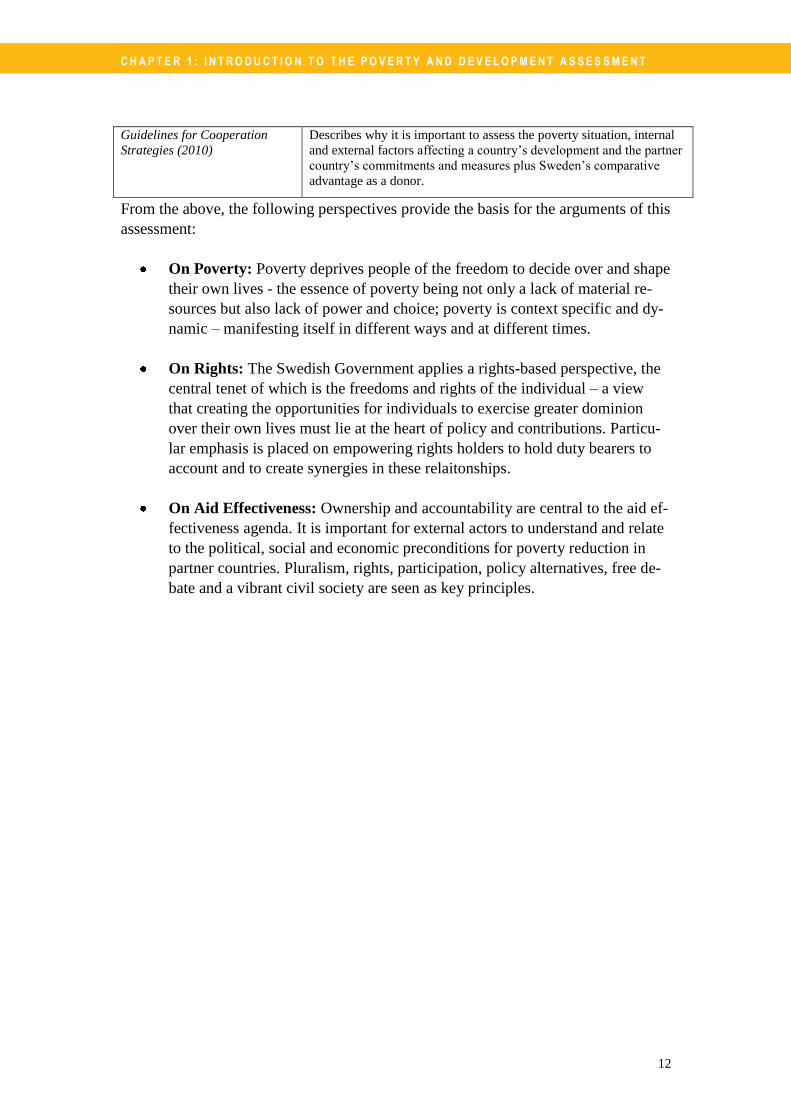
Guidelines for Cooperation
Strategies (2010)
Describes why it is important to assess the poverty situation, internal
and external factors affecting a country’s development and the partner
country’s commitments and measures plus Sweden’s comparative
advantage as a donor.
From the above, the following perspectives provide the basis for the arguments of this
assessment:
On Poverty: Poverty deprives people of the freedom to decide over and shape
their own lives - the essence of poverty being not only a lack of material re-
sources but also lack of power and choice; poverty is context specific and dy-
namic – manifesting itself in different ways and at different times.
On Rights: The Swedish Government applies a rights-based perspective, the
central tenet of which is the freedoms and rights of the individual – a view
that creating the opportunities for individuals to exercise greater dominion
over their own lives must lie at the heart of policy and contributions. Particu-
lar emphasis is placed on empowering rights holders to hold duty bearers to
account and to create synergies in these relaitonships.
On Aid Effectiveness: Ownership and accountability are central to the aid ef-
fectiveness agenda. It is important for external actors to understand and relate
to the political, social and economic preconditions for poverty reduction in
partner countries. Pluralism, rights, participation, policy alternatives, free de-
bate and a vibrant civil society are seen as key principles.
13
Chapter 2: Country Context
“Money isn’t really the problem”
2.1 ECONOMIC TRENDS
Kenya is one of the largest economies in Africa1 and, despite a number of signficiant
political, economic and climatic shocks and setbacks, has been able to maintain gen-
erally modest but positive growth over the past two decades. Kenya is recognised as a
regional hub for innovation, entrepreneurship and high quality human re-
sources. Kenya has a strategic location, largely sound macroeconomic policies, a
strong human resource base, a vibrant private sector, and is one of the most im-
portant tourist destinations of the region. Kenya is aspiring to reach middle income
status2 by 2030.3 Oil reserves could also significantly enhance Kenya’s economic
prospects in the near future.
Kenya’s current economic risks and opportunities are influenced by a convergence of
major factors. The post 2007 election violence, a severe drought in the following
years, combined with the global economic, food and fuel crises clouded the economic
outlook.4 Continued ethnic tensions, the recurrent nature of drought in the region and
uncertainties regarding the global economic recovery suggest that these risks remain,
even if the short-term outlook is generally positive. Since this period, economic
growth has begun to improve with GDP growth over 4% in 2011 and 2012. The Ken-
yan economy has thus been affected by a range of local, regional and global political,
financial and climatic hazards. Kenya is vulnerable to recurrent droughts and other
climatic hazards at home, regional security threats and reliance on trade with EU
partners that are undergoing their own uncertain paths to economic recovery. The
tourism industry is vulnerable to security issues in Kenya and the region, as well as
economic conditions in the North. At the same time, the Kenyan economy has proven
resilient due to an increasingly diversified urban and rural economic base. Growth
currently exceeds global averages. Kenyan recovery has occurred in some aspects of
the economy, just as other aspects have been buffeted by additional shocks. The ex-
tent to which this resilience can be maintained given the growing population, chronic
political and security tensions, and deteriorating climatic conditions remains to be
seen. The recurrent nature of these shocks nonetheless suggests that future economic
development will continue to be as related to ability to rely on different aspects of the
economy to rebound from a range of shocks, rather than choice of the “right” overall
development policy.
C H A P T E R 2 : C O U N T R Y C O N T E X T
14
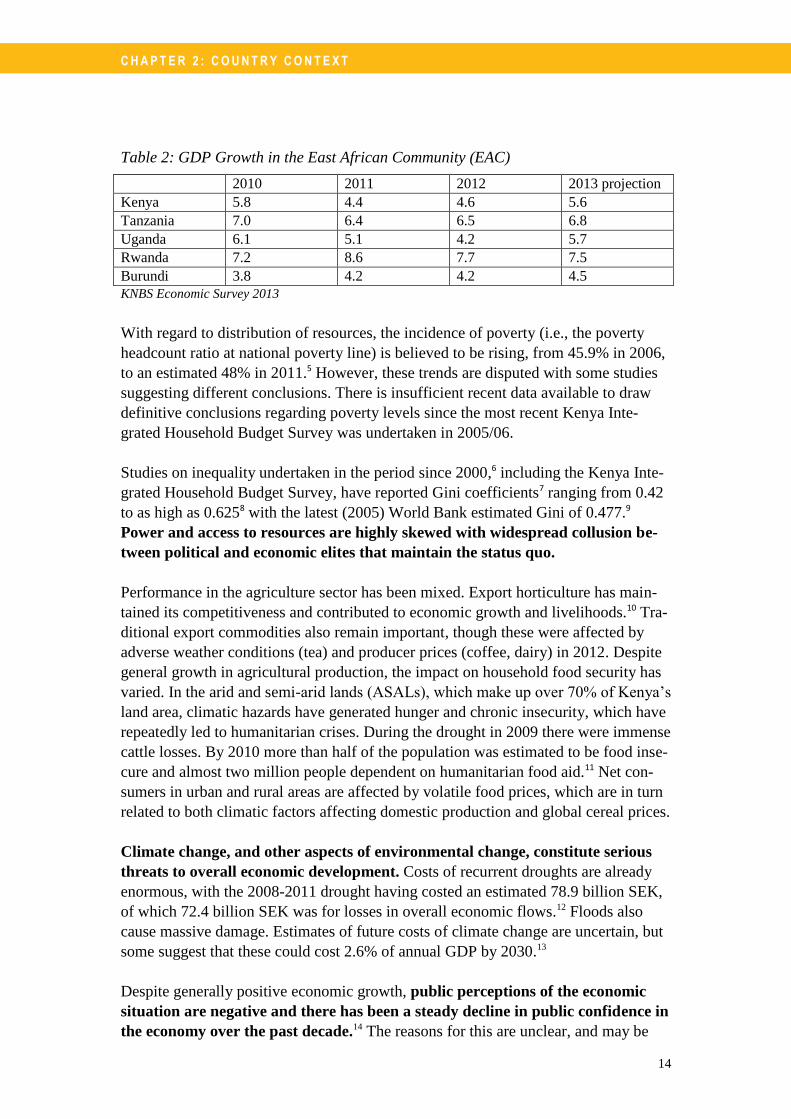
Table 2: GDP Growth in the East African Community (EAC)
2010 2011 2012 2013 projection
Kenya 5.8 4.4 4.6 5.6
Tanzania 7.0 6.4 6.5 6.8
Uganda 6.1 5.1 4.2 5.7
Rwanda 7.2 8.6 7.7 7.5
Burundi 3.8 4.2 4.2 4.5
KNBS Economic Survey 2013
With regard to distribution of resources, the incidence of poverty (i.e., the poverty
headcount ratio at national poverty line) is believed to be rising, from 45.9% in 2006,
to an estimated 48% in 2011.5 However, these trends are disputed with some studies
suggesting different conclusions. There is insufficient recent data available to draw
definitive conclusions regarding poverty levels since the most recent Kenya Inte-
grated Household Budget Survey was undertaken in 2005/06.
Studies on inequality undertaken in the period since 2000,6 including the Kenya Inte-
grated Household Budget Survey, have reported Gini coefficients7 ranging from 0.42
to as high as 0.6258 with the latest (2005) World Bank estimated Gini of 0.477.9
Power and access to resources are highly skewed with widespread collusion be-
tween political and economic elites that maintain the status quo.
Performance in the agriculture sector has been mixed. Export horticulture has main-
tained its competitiveness and contributed to economic growth and livelihoods.10 Tra-
ditional export commodities also remain important, though these were affected by
adverse weather conditions (tea) and producer prices (coffee, dairy) in 2012. Despite
general growth in agricultural production, the impact on household food security has
varied. In the arid and semi-arid lands (ASALs), which make up over 70% of Kenya’s
land area, climatic hazards have generated hunger and chronic insecurity, which have
repeatedly led to humanitarian crises. During the drought in 2009 there were immense
cattle losses. By 2010 more than half of the population was estimated to be food inse-
cure and almost two million people dependent on humanitarian food aid.11 Net con-
sumers in urban and rural areas are affected by volatile food prices, which are in turn
related to both climatic factors affecting domestic production and global cereal prices.
Climate change, and other aspects of environmental change, constitute serious
threats to overall economic development. Costs of recurrent droughts are already
enormous, with the 2008-2011 drought having costed an estimated 78.9 billion SEK,
of which 72.4 billion SEK was for losses in overall economic flows.12 Floods also
cause massive damage. Estimates of future costs of climate change are uncertain, but
some suggest that these could cost 2.6% of annual GDP by 2030.13
Despite generally positive economic growth, public perceptions of the economic
situation are negative and there has been a steady decline in public confidence in
the economy over the past decade.14 The reasons for this are unclear, and may be
C H A P T E R 2 : C O U N T R Y C O N T E X T
15
related to rising but unfulfilled expectations of a growing educated and urban popula-
tion. Also, real wages are declining due to inflation. Nonetheless, Kenyans (particu-
larly in Nairobi and the Central Region) retain significant hope that their quality of
life will improve in the future.15
In sum the Kenyan economy has been shown to be, and is likely to remain, frag-
ile. Despite a number of positive trends, government targets of double digit growth
appear highly optimistic and it is more likely that Kenya will continue to experience
erratic growth and investment trends.
2.2 SOCIAL DEVELOPMENT TRENDS
Kenya’s attainments in terms of social development are less impressive than its
relatively positive achievements in overall economic development. Between 1980
and 2012 Kenya's Human and Development Index (HDI)16 rose by 0.9% annually
from 0.424 to 0.519 today, which in 2013 gives the country a rank of 145 out of 187
countries with comparable data.17 Kenya is classified as having low human develop-
ment, but it is close to the threshold for classification as medium human development.
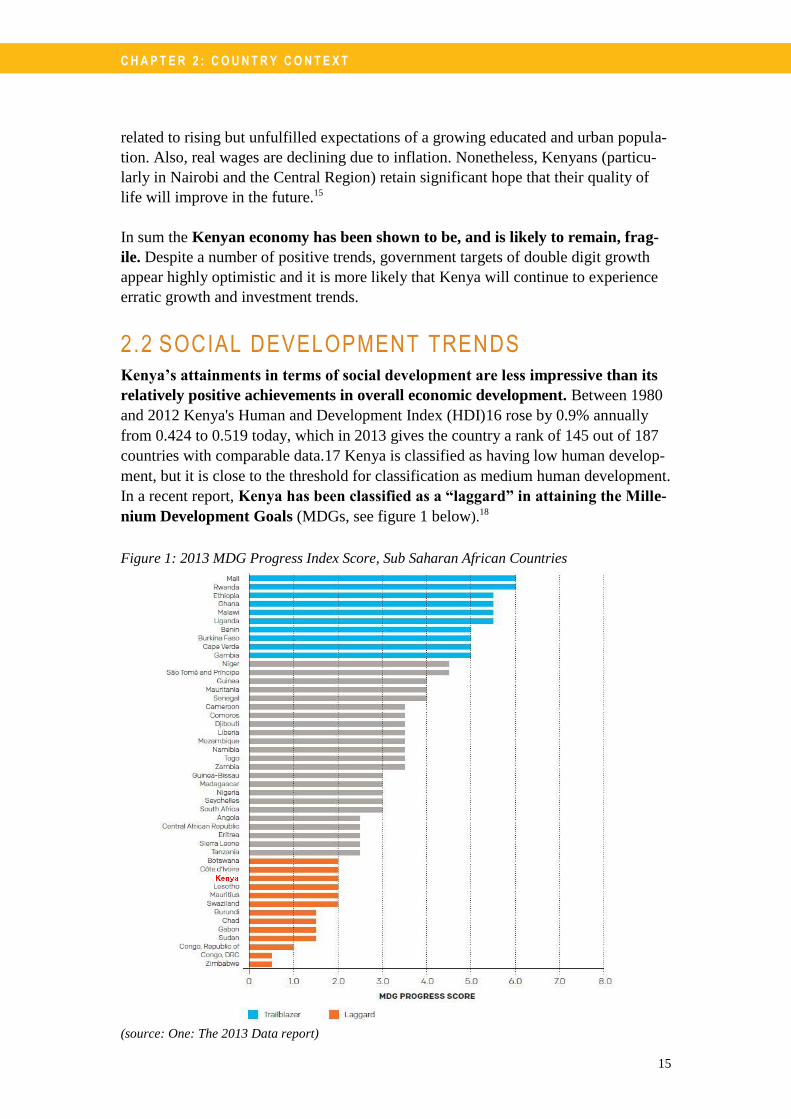
In a recent report, Kenya has been classified as a “laggard” in attaining the Mille-
nium Development Goals (MDGs, see figure 1 below).18
Figure 1: 2013 MDG Progress Index Score, Sub Saharan African Countries
(source: One: The 2013 Data report)
C H A P T E R 2 : C O U N T R Y C O N T E X T
16
Kenya’s lacklustre achievements in social development are most glaringly reflected in
the nutritional situation. Ten million people are recognised as food insecure in an av-
erage year and 35% of children are stunted.19 Public budget allocations to address
malnutrition are limited and agricultural policies do not focus strongly on implica-
tions of policies for household food security. In a country that is aspiring to be-
coming a middle income “hub for innovation”, the enduring and severe malnu-
trition situation is evidence of Kenya’s non-inclusive society and flawed devel-
opment path.
Conflict in Kenya is related to a mosaic of ethnic, religious and political factors,
which in turn are manifested in a context of growing competition over livelihoods,
land and other resources in both rural and urban areas. Ethnicity has long been the
major divisive mobilising factor in Kenyan politics, a feature that has its roots in the
colonial era.20 Regional geopolitical tensions and religious conflicts constitute
threats to both economic development and the safety of the populations in the
affected areas. Endemic violence in the vast ASALs, most notably cattle rustling, has
both economic impacts and also feeds social divisions as it reinforces negative atti-
tudes that contribute to inter-ethnic tensions and discrimination against pastoralists.
Northern Kenya has long been the “epicenter” of human rights violations in the coun-
try and the security forces have regularly carried out collective punishment of com-
munities in the affected areas.21 Urban crime and violence are also pervasive.
Another key social divide is along gender lines, manifested within the household,
community, market and the state.22 Gender norms and practices influence the oppor-
tunities and constraints women and men face in these arenas. Institutional reforms
to protect women’s rights have had little impact.23
The country has achieved MDG2: free and universal primary education, and made
important strides in secondary education. Universal primary education was introduced
in 2003 and by 2008, 93% of 6-15 year olds attended school.24 There are, however,
concerns about the quality of this education. Currently, the median number of years
of schooling completed is 6.0 years for men and 5.2 years for women.25 Kenya is also
likely to achieve MDG3 on gender parity in education.
Though investments are now being made in secondary education, dropout rates are
much higher than in primary education, especially amongst the poorer strata of soci-
ety. In 2006, the gross enrolment rate in secondary school was only 32.2%.26 This
figure masks huge regional variations. For instance, in North Eastern Province the
gross enrolment rate in secondary school was only 6.1% as compared to 47.9% in
Central Province.27 In more marginal regions girls are particularly negatively affected.
This is related to a range of factors, including long distance to school which disadvan-
tages girls due to their home care activities, cultural bias in favour of boys, and early
marriages and associated parental responsibilities. Although very few Kenyans have
completed tertiary education, the number is growing and a middle class made up of
mainly young, educated professionals is emerging.28
C H A P T E R 2 : C O U N T R Y C O N T E X T
17
Kenya has average outcomes in comparison to other countries in the region in
terms of health service delivery.29 As with education, the health status of the popula-
tion varies regionally and this is linked to access to health care and prevalence of ill-
nesses such as HIV/AIDS and malaria.30 The average life expectancy in Nyanza Prov-
ince, for example, is 16 years lower and under-five mortality four times higher than in
Central Province.31 Maternal mortality is high.32 Life expectancy stands at 57 years.
Infant mortality is high but falling, as is under-five mortality – childhood vaccination,
use of mosquito nets and antenatal care being the major drivers of these improve-
ments. However, only about 60% of households have access to safe water, and
sanitation coverage is estimated at only 50%,33
which has negative implications in
relation to infant mortality and prevalence of water and sanitation related diseases.
2.3 POLITICAL CONTEXT
There is a great and growing gap between the political/economic elite and the
population in general. This gap expanded during the Moi regime when local authori-
ties’ responsibilities and capacities for service provision were undermined due to
power being concentrated in the executive authorities. Structures for accountability
were deliberately weakened to enable accumulation of wealth by the political and
commercial elite. Illegal land dealings and gross corruption were commonplace dur-
ing the Moi regime. Current concerns about the impunity of public officials stem
from this period.34
Kenyan democracy can be seen to have begun with the first free elections in 2002, but
the path since has been problematic and in recent years concerns have been expressed
that Kenya could become a “fragile state”.35 The highly flawed 2007 elections and
subsequent violence resulted in a massive humanitarian crisis and significantly
damaged Kenya’s reputation for stability and rule of law. In more recent years,
two political events have played and will continue to play a critical part in shaping the
nature and focus of development cooperation: the 2013 elections and the adoption of
the 2010 Constitution. In March 2013, the Kenyan Supreme Court officially and
unanimously declared Uhuru Kenyatta the country’s next president, upholding the
preliminary electoral results. The acceptance of the decision by the opposition, as
much as the result itself, was a landmark achievement for Kenya. The election proc-
ess in 2013 was relatively peaceful and participation rates were high (reported at 86%
of the registered voters). However, significant segments of the population, including
much of civil society, still question the legitimacy of the elections. Furthermore, the
indictment of the newly elected President and Deputy President by the International
Criminal Court (ICC) for allegedly being involved in the 2007-8 atrocities has created
significant tensions between the new government and the international community.36
The election coincided with the implementation of another important milestone, the
2010 Constitution of Kenya which replaced the 1969 Constitution and was approved
by 67% of Kenyan voters. The key changes introduced by the new Constitution
include: separation of powers among the executive, legislature and judiciary
branches of government; a new Bill of Rights; strong commitments to account-
C H A P T E R 2 : C O U N T R Y C O N T E X T
18
able leadership and integrity, and devolution of authority from national to
county level. Devolution is widely seen as offering the potential to open up new
spaces at the local level for participation and inclusion. The international community
has praised the approach that Kenya took to constitutional reform, seeing it as a vi-
able way to address many of the development challenges facing Kenya today. It is,
however, unclear how many aspects of the new Constitution will be imple-
mented, particularly the devolution process where expectations and responsibilities
are likely to overwhelm existing institutional capacities. Development partners are
now considering how best to support the institutional development of Kenya’s 47
new county governments.
These developments suggest that Kenya may be at a turning point. The signals are
mixed. Elements are in place that may stem and perhaps reverse the deterioration in
state-society relations that in many respects began in the Moi era and culminated in
the 2007 elections and their aftermath. There are indications that the public is de-
manding accountable governance. The extent to which the new structures being cre-
ated can deliver against these demands will have profound implications for Kenya’s
future. This relates to both the political will to carry through reforms and also the ca-
pacities to do so, which are particularly limited in the new country administriations.
Political commitments for moving from proclamations to practice regarding
equality and rights, participation, transparency and accountability remain un-
tested. This is a particular concern in the informal norms of public service delivery.
Kenyans are sceptical of whether the Constitution will be implemented in full, but
retain faith that the Constition will lead to better enforcement of laws.37 A survey also
suggests that the Kenyan public is moving away from accepting the ethnic political
manipulations of the past, and are regaining faith in national institutions.38 This is
despite the fact that Kenyans still perceive that police torture is widespread, indicat-
ing distrust in the commitments of the state to protect human rights.39 Faith in the
reform of the judiciary has grown, but was shaken as a result of the process after the
recent elections.
Civil society is playing an important role in these political processes both as a watch-
dog in relation to duty bearers and as a promoter of policy reform. The role of Ken-
yan civil society in representing rights holders and strengthening their voice in the
dialogue with duty bearers is growing. However, Kenyan civil society remains reliant
on international support to fulfil these roles. Accountability to members and struc-
tures in rural areas are insufficiently developed.40 Given the limited absorptive capac-
ity of many national and local government structures, civil society has an evident role
to play in service provision as well, but their capacities for providing these services
are also limited.
19
Chapter 3: Poverty and Vulnerability
“There is a need to move beyond technocratic approaches. When the focus is on ex-
clusion we need to focus on those who are historically and structurally marginalised.”
3.1 POVERTY PERSISTS DUE TO CHRONIC VULNERABILITY
Sweden defines poverty as a lack of resources, choice and power41 and recognises that
poverty is difficult to pin down in terms of cause and symptom, measurement or solu-
tion. Poverty is understood and analysed as a multi-dimensional phenomenon related
to gender, age, ethnicity and a range of other factors. The factors that influence pov-
erty change over time and in different geographical areas.
This perspective is particularly relevant in Kenya given the context described in the
previous chapter where the well-being of the poor is constantly buffeted by a range of
hazards. To understand poverty is to understand the factors that determine
whether or not the poor have capacities to maintain some form of livelihood and
recover when crops die in the fields, when tourists stop coming to the resorts, or
when a family member falls ill. The vulnerability of the poor and their resilience
capacity are central. The myriad factors that determine vulnerability and resilience
capacity fall broadly into the following categories:
Access to resources: In Kenya today per capita income is less than SEK 5,250,42 half
the African average. More than 16 million people in 2006 could not access food to
meet their daily calorie intake requirements.43 Insecure tenure, access and in some ar-
eas availability of land and water, in both rural and urban areas, reduce people’s ability
to deal with the shocks that repeatedly impact on livelihoods. As the population grows
and environmental conditions deteriorate the scarcity of these resources is increasing.
Access to basic services: Marginalisation also stems from lack of access to basic
public services, due to duty bearers failing to uphold their social contract to serve the
poor. Donor investments in service provision for the poor have not proven sustainable
and there are indications that these may even encourage the Government of Kenya
(GoK) to shift its investments to better off areas. This is a particular concern in the
health sector, where donor involvement is greatest. Past attempts to introduce user
charges to increase the the sustainability of these services led to drastic reduction in
clinic attendance and little positive impact on government revenues.44 Subsequent
reductions in under charges have not yet led to clear increase in access to these ser-
vices due to confusion about prevailing policies.45 This could be interpreted as a
warning that devolution may lead to disorderly attempts by local authorities to cover
costs of services as occurred in earlier decentralisation efforts in Uganda.46
C H A P T E R 3 : P O V E R T Y A N D V U L N E R A B I L I T Y
20
Power: Access to resources is largely related to power relations. The lack of benefits
reaching the poor from macro-economic growth is related to pervasive elite capture of
the benefits from economic development.47 Since the colonial era, investment patterns
have been uneven and have exacerbated ethnic divides and entrenched inequality. Pa-
tronage and elitism remain at the heart of national politics and positions of authority
are largely held by men. After the 2013 elections, women hold 19% of the seats in the
National Assembly (largely due to the allocation of 47 women county representatives)
and 28% of the seats in the 67-member Senate (due to the allocation of 16 women rep-
resentatives). Both houses of parliament thereby failed to meet the one-third quota
stipulated in the 2010 Constitution. So did the county assemblies; in total fewer than
100 of the 1450 members elected nationwide were women.48 Exclusion from positions
of authority (and resource control) is also related to disability and ethnicity.
Choice: Weak access to resources and lack of power deprive individuals of the right
to shape and make choices over their own lives – particularly livelihood choices. Se-
cure land tenure (in both urban and rural areas) is required if the poor are to have the
confidence to invest their meagre resources in new livelihoods. Health status and
level of education49 and technical training50 are clear determinants of whether or not
households are able to find new ways to escape from poverty and respond to liveli-
hood shocks. This is in turn related to their access to services, clean water and and
salubrious environment. Choice is also related to migration, and many households
have recognised how “straddling” the urban-rural divide, with household members
pursing livelihoods in both, is an effective way of spreading risks and taking advan-
tage of a range of opportunities.51
Poverty creates poverty. Poverty is not only multidimensional, it is dynamic and
in some cases cumulative. In Kenya this results from the convergence of shocks,
generally relating to climate change, conflict and volatile economic conditions. A
struggle for daily survival prevents people from accumulating assets that could enable
them to absorb these shocks. Desperation can also encourage behaviour that may un-
dermine longer term livelihood diversification strategies, such as taking children out
of school52 or criminality. The causal relationships are complex. Disasters not only
generate poverty but reduce people’s ability to manage the other risks that they face
and may lead to downward spirals. As such, there is a clear link between the transient
poverty that households face when dealing with these shocks, and the reproduction of
chronic poverty.53 Moreover, poverty may also induce disasters (e.g. by contributing
to environmental degradation, conflicts over access to scarce resources, etc.). In the
poorest parts of the country (Northeast and Rift Valley) there appears to be a correla-
tion between scarce resources, powerlessness and lack of opportunities on the one
hand; and persistent violence and political insecurity on the other.54 The labelling of
certain ethnic groups or livelihoods (especially pastoralism) as “the problem” has led
to state repression and further marginalisation.55 These factors suggest that in order to
understand poverty one must understand the factors that determine how different in-
dividuals, households and communities are vulnerable to a range of hazards and how
the resulting exposure to risks vary due to temporary factors and according to where
they live.
C H A P T E R 3 : P O V E R T Y A N D V U L N E R A B I L I T Y
21
Poverty leads to food insecurity due to inability to produce food, inability to ac-
cess livelihoods that allow for the purchase of food, and weak capacity to deal
with food price fluctuations. This even includes smallholder farming households, as
most are net food buyers. Government responses to the food price crises have been
erratic and therefore ineffective.56 The temporary injections of food aid after droughts,
which dominate humanitarian response, have not had a significant impact on the fac-
tors that make people vulnerable to recurrent climatic shocks. Food security policies
currently emphasise an array of measures to prevent recurrent droughts from turning
into humanitarian food security emergencies,57 but these intentions have yet to reduce
Kenya’s dependency on food aid. Vested interests and political power struggles have
meant that, despite new policies, Kenya remains locked into food security approaches
that have proven ineffective in the past.58
The nature and structure of poverty in Kenya is changing rapidly. Rapid growth in real
GDP from 2003 to 2007 was expected to make inroads into poverty rates and, overall,
poverty did decrease from 56% in 2000 to 46% in 2006.59 However, this period of rapid
growth did not yield significant reductions in rural poverty.60 The fact that only a
minority of rural households benefitted from the 2003 - 2007 period of high macroeco-
nomic growth has been attributed to the fact that poor households face serious con-
straints to effectively use their limited assets even in such conducive times, and there-
fore fail to use economic upswings to establish a basis for more stable livelihoods.61
Urban social indicators have also stagnated and in some respects deteriorated
over the long term.62
Urban poverty is correlated to insufficient access to wage la-
bour and informal sector commercial activities. It is also affected by ill-health related
to poor sanitation and experience of chronic violence. Insecure residential tenure is
also a major issue for the poorest.
After the economic shocks of 2008 and 2009 the Kenyan economy is growing satis-
factorally again. Nonetheless, the large majority (approximately 80%) of both urban
and rural residents currently perceive that their living conditions are deteriorating, and
most are pessimistic about prospects for improvement.63
This pessimism is a reflec-
tion of how, despite economic growth, many aspects of poverty remain entrenched.
Households remain poor, even across generations, due to an inability to mobilise
resources to invest in livelihood diversification.64
While there are many people in Kenya who remain poor throughout their lives, a lar-
ger group move in and out of poverty as their circumstances change due to an array of
environmental, economic and social shocks. Poverty therefore needs to be considered
in relation to vulnerability, limits to ability to take advantage of new opportunities65
and capacity for resilience. A study based on data from the past decade showed that
while 70% of households experienced poverty at some point, only 11% were always
poor throughout the period.66 A 2010 report looking at the life histories of poor house-
holds nationwide found that people who were able to escape from poverty had main-
tained their health, were part of male headed households, had parents who had land
and were well educated.67 This suggests that poverty is related to factors such as a
household’s capacity to rebound after a family member falls ill, whether they are
C H A P T E R 3 : P O V E R T Y A N D V U L N E R A B I L I T Y
22
able to avoid having to sell productive assets during a drought and whether they
can send a child to school (or combinations of these factors).
Poverty is ultimately related to respect for human rights and people are vulnerable if
duty bearers do not acknowledge the rights of the poor. Abuse of power and failure to
live up to duties is at the core of poverty in Kenya today. As such, assumptions that
macro-economic growth alone will alleviate poverty are unfounded.
Discussions in the course of developing this PDA revealed highly contrasting per-
spectives on the role of the state in relation to chronic vulnerability and repeated live-
lihood shocks. Some observers recognised that the state has a responsibility for
social protection, whereas others saw such interpretations of the rights of the
poor as constituting a recipe for generating dependency. Many observers, in both
government and academia, do not see the current levels of inequality in Kenya as a
problem. Many development programmes have few if any indicators to monitor the
expected “trickle down effect”. Expectations that economic development alone will
ultimately alleviate poverty, even if there are no signs that this is proving justified,
have generated a degree of complacency towards focusing on the chronically poor,
and even views that explicit poverty alleviation efforts are not necessary. As will be
discussed further below, in official Kenyan policy poverty is classified as a “social”
problem, and thus implicitly divorced from economic and political policies. Some
criticised development partners for what they perceived of as an undue focus on vul-
nerability and food insecurity issues in the ASALs, whereas others noted that failures
to explicitly focus on addressing the rights of the people in these areas will allow
chronic insecurity to continue and fester. Even among those who recognise the impor-
tance of poverty alleviation, there was a common view that strategies focusing on
escapes from poverty will not reach the most destitute, and that the needs of the
chronically poor may be best served by strengthening social services.
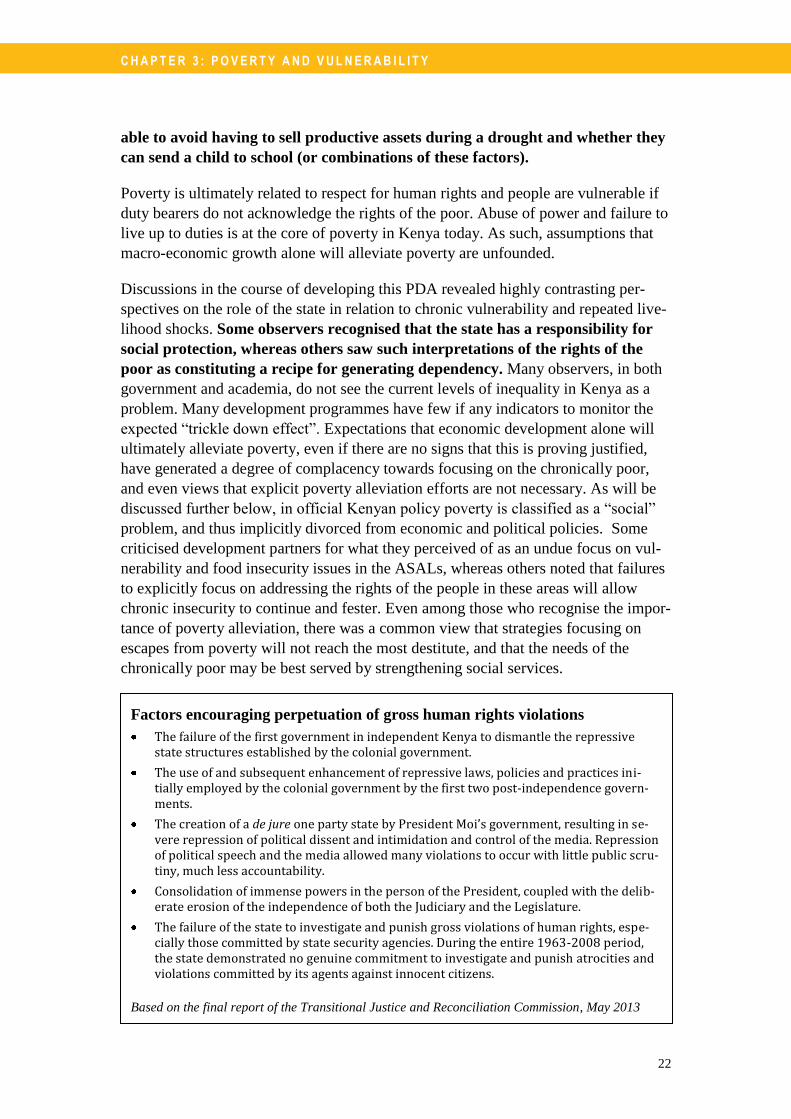
Factors encouraging perpetuation of gross human rights violations
The failure of the first government in independent Kenya to dismantle the repressive state structures established by the colonial government.
The use of and subsequent enhancement of repressive laws, policies and practices ini-tially employed by the colonial government by the first two post-independence govern-ments.
The creation of a de jure one party state by President Moi’s government, resulting in se-vere repression of political dissent and intimidation and control of the media. Repression of political speech and the media allowed many violations to occur with little public scru-tiny, much less accountability.
Consolidation of immense powers in the person of the President, coupled with the delib-erate erosion of the independence of both the Judiciary and the Legislature.
The failure of the state to investigate and punish gross violations of human rights, espe-cially those committed by state security agencies. During the entire 1963-2008 period, the state demonstrated no genuine commitment to investigate and punish atrocities and violations committed by its agents against innocent citizens.
Based on the final report of the Transitional Justice and Reconciliation Commission, May 2013
C H A P T E R 3 : P O V E R T Y A N D V U L N E R A B I L I T Y
23
3.2 POVERTY IS DYNAMIC AND RELATED TO SPATIAL FACTORS
Poverty is stark reality for millions of people in Kenya; with a poverty rate between 46-
48% and an extreme poverty rate of 20%.68 The last reliable national poverty survey in
Kenya (the Kenya Integrated Household Budget Survey) was held in 2005/06 and re-
ported an increase in the absolute number of people classified as poor from 13.4m in
1997 to 16.6m in 2006 (even though the relative poverty rates have declined).69 This
survey also reported that 49.6% of the rural population is poor against 33.1% in urban
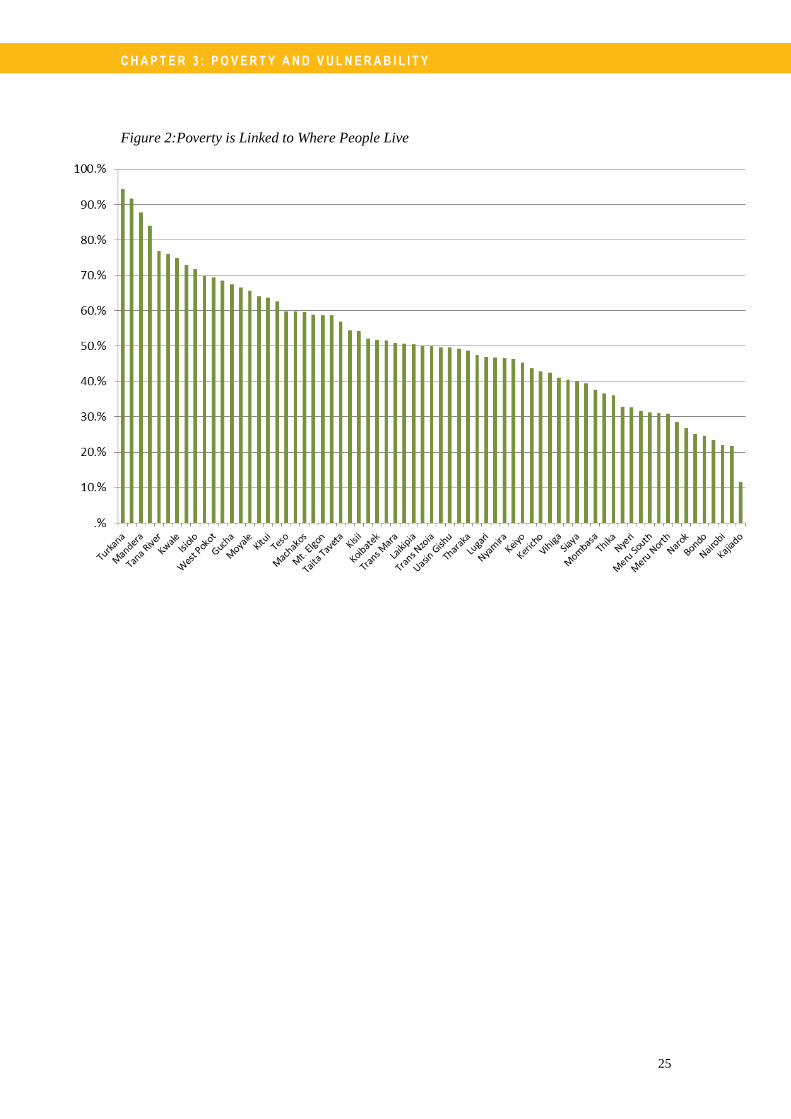
areas.70 Poverty is also unevenly spread - in some regions of the country, more than 70%
of people are poor.71 Most of the extremely poor live in the ASALs.
The intransigent nature of chronic poverty in the ASALs has led many of the those
interviewed to suggest that development partners reconsider their “bias” toward these
impoverished areas, by instead investing in higher potential areas where poverty alle-
viation gains are less expensive and where chances of success are greater. This is not
an either-or question. Permanent and temporary migration from areas where poverty
is entrenched and where people are struggling with droughts or conflict are viable
strategies, but there is no indication that the ASALs are becoming depopulated as a
result of such migration. Also, although expensive, water harvesting methods are re-
ducing vulnerability to drought among those who have access to these new technolo-
gies. As long as there are significant populations choosing to live in the ASALs, duty
bearers have a responsibility to provide basic services and ensure security.
Women are more likely to be poor than men,72 especially in urban areas (c.f. 46%
of female-headed households vis-à-vis 30% of male-headed). In rural areas, where
poverty is more persistent, it cuts across household categories (50% of female-headed
vis-à-vis 48% of male-headed).73 Female-headed households are also more likely to
be extremely poor.74 However, these conclusions are contested. A recent study sug-
gests that when adjusting for household size, observed income differentials between
female- and male-headed households in the country disappear.
Inequality in Kenya is very pronounced. In 2006 the World Bank noted that the
ratio of consumption between the top and bottom 10% stood at 20:1 and 12:1 in urban
and rural areas, respectively (compared to 5:1 in Tanzania and 3.3:1 in Ethiopia).75
There are also significant regional variations. In 2005/6 inequality was most severe in
the ASAL areas of Turkana, Mandera, Tana River, Kwale and Isiolo.76 This is linked
to geographical patterns of economic development which can be traced back to the
colonial era, when resources were channelled into the white settler areas. Uneven
investment was compounded upon Independence, when first President Kenyatta and
later Moi favoured their own respective ethnic groups and regions. An emerging elite
was able to take control over commercial agriculture and today they still retain con-
trol over much of Kenya’s resources.77 Thus both the pre- and post-Independence
eras have generated rich and poor areas in the country, with some ethnic groups
becoming much better off than others.78
C H A P T E R 3 : P O V E R T Y A N D V U L N E R A B I L I T Y
24
Poverty in Kenya is related to spatial factors of land use, elevation, soil conditions
and quality, precipitation, and market access.79 The factors that define poverty are
thus location specific.80 As earlier noted, poverty is greatest in the Rift Valley and the
Northeast,81 where for some groups conditions are even deteriorating. Pastoralists in
particular became notably poorer between 1990 and 2005.82
Poverty in rural areas correlates with geographical determinants of natural re-
source scarcity, above all with access to water and land. Particularly in Northern
Kenya, conflicts over land are said to be the main factor driving violence and human
rights violations.83 The poor in some cases shift between nomadic pastoral and seden-
tary livelihoods. Only one quarter of the land in Kenya is currently arable due largely
to water scarcity,84 and less than 1% of the land is irrigated.85 Recurrent droughts,
some resulting in humanitarian crises, particularly affect smallholders and pastoralists
who lack the capital and knowledge to make optimum use of available rainfall. In-
creasing investments in capital intensive farming in ASALs suggests that in-
creases in productivity and profitability are possible, and that drought can be
managed, but it is unclear whether these investments lead to greater resilience
for the poor. Further analysis is needed to understand whether the commercially suc-
cessful investments in these areas are generating new livelihoods or reinvestment in
the ASALs that provides improved prospects for the residents of these areas.
It should be recognised that, although poverty is not as entrenched in areas where
commercial agriculture is well established, it is still a serious problem, and due to
demographic trends may be getting worse. Land scarcity is an increasing problem in
high potential areas, and two thirds of farmers do not believe that their land is enough
for their children to make a living.86
Given the spatial nature of poverty and factors related to resource scarcity, migration
is naturally an important strategy for the poor. Among pastoral households, access to
formal sector employment in a city is a key livelihood strategy.87 Poverty is decreas-
ing in urban areas,88 which encourages such migration. Moreover, with rural-urban
migration, social networks and informal safety nets deriving from households com-
bining rural and urban livelihoods are important but may be eroding.89
C H A P T E R 3 : P O V E R T Y A N D V U L N E R A B I L I T Y
25
Figure 2:Poverty is Linked to Where People Live
26
Chapter 4: Opportunities for Resilience and Development
“How can we shift the digitalisation of the few to the ground truthing of the majority?”
4.1 KENYA ’S DYNAMIC ECONOMY
Kenya is the gateway to East and Central Africa. Mombasa Port is the second
largest in Africa, and Kenya’s transport network serves a number of landlocked coun-
tries in the region.90 Potential exists for further and deeper regional integration and
trade.91 Common markets offer huge and expanding opportunities. While Kenya is a
net importer of goods, the country is already a net exporter of services, mainly target-
ing the EAC. Small and medium size enterprises (SMEs) are very important to Kenya
in regional economic terms and Kenyans are adept at exploiting opportunities in
neighbouring countries. The growth in SME revenue can mainly be traced to the sale
of goods and services in Uganda and Tanzania.92 Kenya is one of the most important
tourist destinations in Sub-Saharan Africa, and business appears resilient despite se-
curity concerns.93
Cities are providing an important foundation for an emergent and dynamic class
of entrepreneurs, business leaders and public servants, as well as a burgeoning
civil society.94 Urban dynamism has fuelled and been fuelled by the country’s eco-
nomic performance.95 Many multinational companies and international banks and
organisations have their regional headquarters in Nairobi and this has contributed to a
strong managerial cadre.96 Kenya is at the fore in the region in relation to innovative
capacity, quality of higher education, development of financial markets and labour
market efficiency. Company spending on research and development is high, and sci-
entific research institutions commonly collaborate with the business sector. The
higher educational and training system is important in this context. Even though it
reaches a small proportion of the population, the quality is deemed good.
An ICT revolution continues apace and there were 30.7 million mobile phone sub-
scribers in the country by end-December 2012.97 Approximately 20 million individu-
als are using mobile financial services such as M-Pesa.98 By the end of 2012, there
were 9.4 million Internet subscribers (a 75% increase compared to one year earlier),
and 41% of the adult population had access to the Internet.99
Migration is an important aspect of how poor people access benefits from this
economc dynamism. Households in Kenya, as elsewhere in Africa, are taking ad-
vantage of the new opportunities in urban areas and are finding ways to manage
their vulnerability to climatic variability and uncertainty by engaging in circular
migration between urban and rural areas and by “straddling” the rural and ur-
ban economies with household members engaged in both.100
C H A P T E R 4 : O P P O R T U N I T I E S F O R D E V E L O P M E N T
27
Despite these positive signs, Kenya’s exports of goods and services could only pay
for 57% of imports in 2012; a significant drop from 87% ten years earlier.101 During
2012 inflation was curbed but the current account deficit was over 10% of GDP.102
This also makes Kenya very vulnerable to externalities, particularly increases in costs
for oil imports. Increasing public and private savings and exports are important poten-
tial remedies.103 All this points to the need for export diversification since Kenya’s
export portfolio is limited (tea, horticulture and coffee alone represent more than 45%
of exports; total agricultural exports account for 65%104). Furthermore, Kenya scores
poorly on the World Bank Doing Business Index as the relative cost of doing busi-
ness is high.105 Also the World Economic Forum Global Competitiveness Index ranks
the country poorly, 106 out of 144.106
4.2 POTENTIAL FOR IMPROVED SECURITY AND REDUCED INEQUITIES
In the past, relative security made Kenya attractive for investment compared to some of
its neighbours. Today the picture is mixed. The 2008 post-election violence revealed the
fragility of Kenya’s democracy and highlighted the inherently destabilising nature of the
socio-political system that has characterised the country since Independence. Further-
more, the situation in Somalia is creating regional insecurity. Somali pirates and the
terrorist group Al-Shabaab have increased transport and therefore trade costs for Kenya
due to cargo ships having to find alternative routes. The actions of these groups have
also had a negative impact on the tourism industry.107 Urban crime rates remain high,
with insecurity and violence primarily affecting the informal settlements.
However, there are significant positive developments. The M-Pesa mobile phone
banking system has made financial transactions safer. The March 2013 elections were
largely peaceful. New institutions are being put into place that may lead to reduced
inequities and enhanced respect for human rights. The new Constitution commits
Kenya to a redistribution of power through 47 new county governments, each with
elected Governors and County Assemblies. Integrity, anti-corruption and ethics are
high on the public agenda.
Devolution holds promise for enhanced service delivery and state-citizen accountabil-
ity. Revenue raised nationally will be shared between National and County govern-
ments, with the 47 county governments sharing a minimum of 15% of total state
revenue. This is also intended to address some of the regional inequalities created
along ethnic lines. However, there has been some concern expressed that this could
exacerbate regional inequalities and further marginalise some ethnic groups and or
fail to mitigate ethnic conflict.108 Positive impacts of devolution will rely on the de-
velopment of strong and appropriate human resource, financial and technical capaci-
ties at county level, and an electorate that demands equity and a focus on the needs of
the poor. This capacity will need to extend beyond the public administration to in-
clude a strong civil society that acts as a watchdog on the new institutions as well as
providing services.109
C H A P T E R 4 : O P P O R T U N I T I E S F O R D E V E L O P M E N T
28
The new Constitution is one of the most progressive on the continent in that it in-
cludes several provisions for enhanced gender equality and representation. Besides
the new Constitution, Kenya has over the years taken various legislative, judicial,
administrative and programmatic actions to eliminate the discrimination of women.
The Convention on the Elimination of All Forms of Discrimination Against Women
(CEDAW) and other international and regional conventions have been signed and
ratified; a Policy of Gender Equality and Development has been drafted; National
Plans of Action agreed on; laws have been passed; commissions established; funds
earmarked; projects launched; and programmes gender mainstreamed.110
Several civil
society organisations focus on gender issues and a burgeoning of women’s associa-
tions at the community level have emerged. Despite all this, progress toward chang-
ing attitudes toward gender equality has been slow. One observer interviewed stated
that “a lot has been achieved, but not much has changed.”
4.3 AGRICULTURE AND LIVELIHOOD DIVERSIFICATION
Agriculture remains an important sector in terms of its share of GDP (averaging be-
tween 20 and 25% in recent years111), contribution to export earnings (65%) and em-
ployment (45%).112 Commercial agriculture is important for economic development
and job creation, while smallholder farming remains an important source of food secu-
rity for millions of households. In addition to traditional export products (coffee and
tea) there has been notable success with the development of horticultural produce for
export. It is likely that the agricultural sector will continue to be central to both
economic performance and the livelihoods of the poor for the foreseeable future.
Vision 2030, that describes Kenya’s roadmap for the future, identifies agriculture as a
priority sector for development, and agriculture secured approximately 5% of the
budget for 2012/2013.113 The government sees possibilities to increase the productiv-
ity of smallholders by increasing access to improved technology and improving farm
management practices.114 The link between agricultural development trajectories and
poverty alleviation is complex. Some smallholders are increasing their access to mar-
kets, for example through new contracting arrangements with commercial actors,
storage investments and by taking advantage of improved market information. They
may also be able to hold new county authorities to account for service provision,
which has been uneven in the past. For much of the rural population, especially in
high potential areas, the livelihood opportunities offered on larger commercial farms,
combined with employment in agricultural processing, are likely to be increasingly
important in relation to smallholder production in the future.
In rural areas there is evidence that households with sufficient labour resources
to diversify into other rural income generation activities when agricultural con-
ditions are difficult, and to invest additional labour in additional crop produc-
tion when this is possible, are better able to cope with climate variability.115 A
study drawing on detailed interviews with households that have risen from poverty
between 1990 and 2005 noted that these households mainly attribute their success to
C H A P T E R 4 : O P P O R T U N I T I E S F O R D E V E L O P M E N T
29
having diversified their income sources, obtaining formal public or private sector em-
ployment, making changes in relation to crop and or livestock production (especially
diversifying their crop/livestock mix and or commercialising their production), re-
ceiving help from friends and family in the country, and or having few dependents.
The same study found that those who had fallen into poverty during the same time
period mainly explained this in terms of having too many dependents, suffering from
poor health, experiencing the death of a major income earner, drought, and or loss of
property due to theft or overall insecurity. From this study, health problems emerged
as the major factor driving people into poverty while non-farm incomes were cited as
most important for escaping from poverty.116
Small pilot projects in the ASALs have shown that with investments in water harvest-
ing it is possible to make more efficient use of existing rainfall and significantly re-
duce the risks that recurrent droughts turn into humanitarian emergencies. It is less
clear whether mechanisms can be found whereby these capital intensive investments
can be managed by the poor. Agricultural service provision in the ASALs is ex-
pensive, and there is a growing scepticism in Kenya over the creation of new ser-
vice provision models with donor support, as there is a poor track record of gov-
ernment being able to assume responsibility for recurrent costs. Even if a com-
parison of benefits (in terms of profitability, and also reduced conflict and reliance on
food aid) with these investment costs may show positive returns in the ASALs, it is
not clear whether the government is prepared to cover these costs. It is likely that de-
cisions regarding if and how to invest in enhancing food security in the ASALs will
become a major component of dialogue among central government, development
(and humanitarian) partners and the new county governments.
4.4 HUMAN RESOURCES
Fertility rates and hence dependency ratios are falling. Nonetheless, Kenya still has a
very young population, children making up around 42% of the population.117 Youth
(aged 15 to 35 years), accounted for 36% of the total adult population in 2009.118
Such a significant youth bulge can be both a challenge and opportunity for a coun-
try.119 An excess of young adult men, especially if unemployed, constitutes a po-
tential source of social unrest.120 Young adults are, however, a vital resource that
can contribute to Kenya’s development. UNDP notes that “channelling their en-
ergy, initiatives and resources towards tackling developmental challenges is key to
progress”.121 There are currently not enough new, well paid, modern jobs being gen-
erated for the young and educated.122 As a result, and perhaps counter-intuitively,
youth with higher education are more likely to be unemployed than youth with low
education, who usually find employment in agriculture and informal sectors.123
Access to higher educational is expanding and there are now over 20 public and pri-
vate universities in Kenya, as well as many technical training establishments. In Nai-
robi, 25.3% of all women and 31.1% of all men have more than secondary school edu-
cation (although this is far from the country mean of 4.5 and 6.1, respectively).124
These aspects of human resource development may become the most important drivers
determining Kenya’s opportunities to take advantage of Africa’s growing economy.
30
Chapter 5: Government Commitments and Action
“Participation of the poor and non-poor is in the constitution… it is no longer even
a choice. It is part of the legal environment.”
5.1 POLITICAL COMMITMENTS AND INSTITUTIONAL CHANGE
In 2010 a new Constitution was approved by 67% of Kenyan voters. This new Con-
stitution enhances (i) separation of powers between the three arms of government the
executive, legislature and judiciary, (ii) devolution of considerable public authority
from national government to 47 new county governments,125 (iii) commitment to the
basic rights of the individual, supporting an holistic and rights-based approach to so-
cial development that addresses inequality and marginalisation, and (iv) public par-
ticipation in governance by building citizen and stakeholder involvement within their
respective policy-making processes.126 The Constitution addresses many of the
issues of centralisation of power which have plagued Kenya’s past political
structures and led to marginalisation of the poor..127 Integrity and leadership are
recognised as central to realisation of the intentions of the Constitution as a whole.
County governments will have a high degree of autonomy in planning and managing
public affairs. The Constitution also contains a comprehensive chapter on land, cover-
ing a wide range of issues from land classification, regulation of land use, and estab-
lishment of a national land commission. The land reforms are expected to have par-
ticular implications for gender equality, as few women currently have formal titles to
their land.128 The commitments in the new Constitution will inevitably take time
to implement, and will require massive capacity development efforts. Civil soci-
ety may have a significant role to play in terms of driving the process forward and
ensuring that the aspirations embodied in the Constitution result in real changes in the
status quo.
Although the new Constitution is considered to be very progressive, there is still a
significant disconnect between people’s constitutional rights, their awareness of these
rights and public officials’ commitments and capacities to act on their new duties.
Informal power relations and elite capture that exclude the poor, women and opposi-
tion ethnic groups remain omnipresent,129 and may create obstacle to the implementa-
tion of formal reforms. The prevailing gap resulting from the limited voice of rights
holders and the weak accountability of duty bearers will influence how the elements
of the Constitution are perceived and acted upon. Despite these obstacles, Kenyans
overwhelmingly support the new Constitution and believe that it will lead to more
accountable government and equitable development.130
C H A P T E R 5 : G O V E R N M E N T C O M M I T M E N T A N D A C T I O N
31
Vision 2030, the National Development Strategy (which pre-dates the Constitution)
was developed through an inclusive and participatory stakeholder consultative proc-
ess. In addition to recognising the crucial role of macro-economic stability to eco-
nomic growth, the stated aim is to make Kenya globally competitive and prosperous
with a high quality of life by the year 2030.131 The strategy is implemented through
five-year medium term plans (MTPs), with the first covering the period 2008 – 2012.
The second MTP covering the period 2013-2017 is being launched mid 2013. The
strategy and MTP rely on three key pillars: an economic pillar aiming at achieving
an economic growth rate of 10% per annum driven by tourism, agriculture, manufac-
turing, ICT and business process outsourcing, wholesale and retail trade, and finance;
a social pillar aiming at achieving social development that is just, cohesive and equi-
table; and a political pillar aiming at achieving a democratic system that is issue-
based, people-centred, results-oriented and accountable. Critical foundations for
achieving these overarching goals include macroeconomic stability, continuity in
governance reforms, enhanced equity and wealth creation opportunities for the poor,
infrastructure, energy, science, technology and innovation (STI), land reform, human
resource development, security, and public sector reforms. A set of ‘flagship projects’
are to be implemented to reach the various targets. Vision 2030 also stresses the need
for continuity in governance reforms (aligned with the new Constitution), enhanced
equity and wealth creation opportunities for the poor.132 Poverty as an issue appears
under the social pillar, rather than all three, suggesting that congruence may be
lacking between poverty alleviation and economic and political development
processes. Discussions in the course of developing this PDA revealed differing views
on the implications of this implicit definition of poverty as a “social problem” rather
than an integral aspect of political and economic development. Some observers see
this as a significant flaw in Vision 2030, whereas others feel that too much attention
has been given to poverty alleviation in relation to economic and political develop-
ment, and therefore welcome this division of objectives.
The Government has made a particular and strong public commitment to tackle cor-
ruption, but the challenges remain enormous. Transparency International ranks Kenya
as 139 out of 176 countries. Implementation of the provisions of the Constitution
is likely to be influenced by corruption, and devolution may create new incen-
tives for corrupt behaviour, while weak capacities in local government may lead
to even greater impunity. The risk that this might undermine the implementation of
the Constitution and public participation in governance is real.133 An Ethics and Anti-
Corruption Commission has been established (although with no prosecutorial powers)
and a National Anti-Corruption Plan is now in place. A Public Financial Management
Act has been approved and aims to reduce corruption and increase accountability.
The Constitution addresses the separation of public and private sectors so that those
who provide public services cannot at the same time be active in the private sector.134
Vision 2030 identifies transparency and accountability as priorities.
With regard to gender equality, the GoK has signed and ratified CEDAW and other
international and regional conventions. Additional commitments include a policy of
Gender Equality and Development, as well as an associated National Plan of Action.
C H A P T E R 5 : G O V E R N M E N T C O M M I T M E N T A N D A C T I O N
32
The new Constitution includes commitments to end discrimination of women and
achieve gender equality. Vision 2030 and the first medium-term plan for 2008-12
identify and outline actions to combat gender inequalities. Many laws are gender-
responsive (but not always implemented/enforced). Prior to the constitutional re-
forms, the GoK had made a commitment to the realisation of the MDG on gender
equality and women’s empowerment by 2015. The government is also working to
ensure that gender issues are mainstreamed in all government ministries and agencies
at all levels.135 The Constitution specifically addresses gender inequalities, including
women’s right to inherit land. However, most women do not know their rights un-
der the new Bill of Rights, and there are also fears that strong cultural barriers
will stand in the way of realising such rights.
In terms of environmental sustainability, the Constitution establishes the rights of
citizens to a clean and healthy environment and also stipulates that the state shall en-
sure sustainable utilisation of environment and natural resources. A number of inter-
national conventions have been signed and a National Climate Change Response
Strategy (NCCRS) developed. Some concern has been expressed over the transpar-
ency and implementation of the NCCRS.136 The emphasis of the NCCRS is on mitiga-
tion, whereas it is in adaptation efforts that the factors which impact on poverty and
vulnerability are most likely to be addressed. Key sectoral policies and plans in ag-
riculture and water make some reference to climate change adaptation, but it
does not appear that these (generally rather vague) commitments constitute a
sufficient response given the scale of likely economic, social and humanitarian
impacts of current and future extreme climate events and gradual environ-
mental change.
5.2 FINANCIAL COMMITMENTS
To improve equity and reduce poverty, government efforts to date have included allo-
cations toward universal primary education, improved access to basic health care ser-
vices, expanded productive capacity in agriculture, development of the ASALs, and
upgrading the living conditions for urban poor.137 Between 2002/03 and 2011/12 gov-
ernment expenditure increased from SEK 28.3 billion to SEK 100.6 billion. This in-
crease is in part due to increased tax revenues, as well as increased participation in
international trade. Other resources are also increasingly flowing into the country,
such as remittances and foreign direct investments. In 2012 remittances rose to almost
SEK 3.9 billion, an increase of 46.7% over the previous year.138 Aid is a significant
part of government income; having increased from SEK 3.6 billion in 2002 to SEK
11.8 billion in 2009. Tax is the main contributor to GoK revenue, amounting to about
SEK 65,1 billion in 2012/2013 (provisional figure from KNBS Economic Survey
2013). Aid represents approximately 15% of the state budget, although it covers about
40% of the development components of that budget.139 A considerable proportion of
aid investments are not reflected in the state budget.
Agriculture is notably underfunded. The Maputo Declaration on agriculture and food
security commits governments in Africa to allocate 10% of their national budgets to
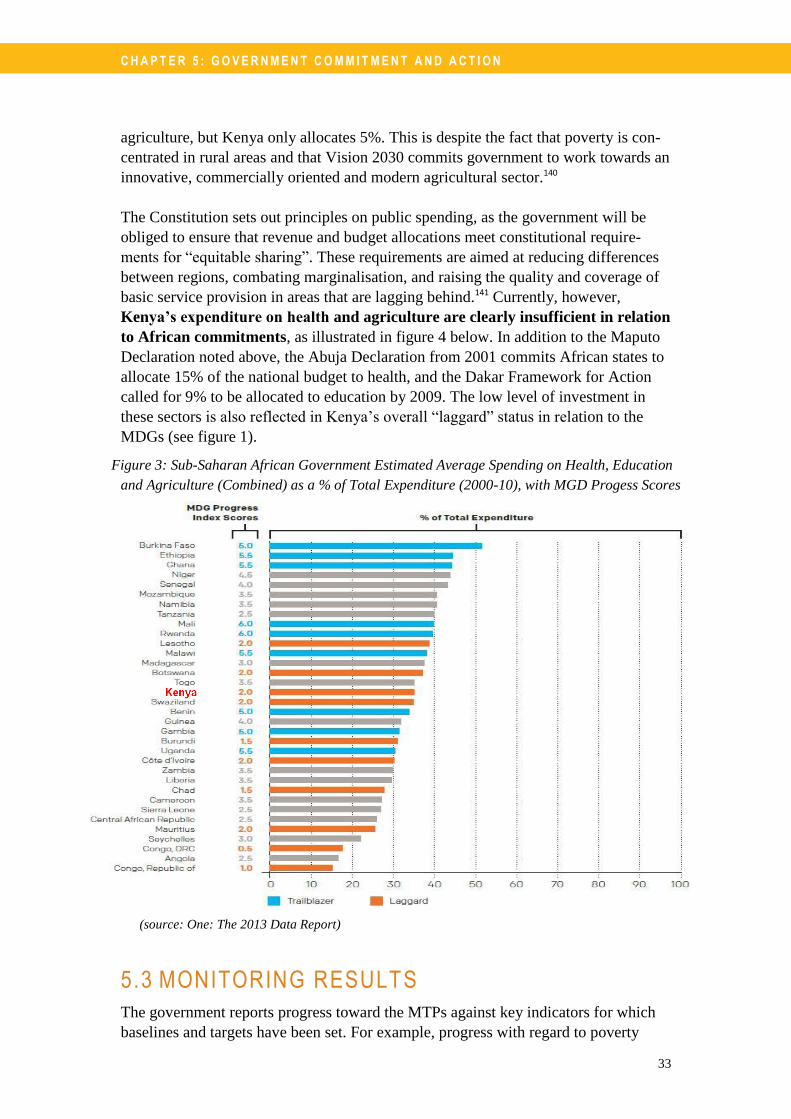
C H A P T E R 5 : G O V E R N M E N T C O M M I T M E N T A N D A C T I O N
33
agriculture, but Kenya only allocates 5%. This is despite the fact that poverty is con-
centrated in rural areas and that Vision 2030 commits government to work towards an
innovative, commercially oriented and modern agricultural sector.140
The Constitution sets out principles on public spending, as the government will be
obliged to ensure that revenue and budget allocations meet constitutional require-
ments for “equitable sharing”. These requirements are aimed at reducing differences
between regions, combating marginalisation, and raising the quality and coverage of
basic service provision in areas that are lagging behind.141 Currently, however,
Kenya’s expenditure on health and agriculture are clearly insufficient in relation
to African commitments, as illustrated in figure 4 below. In addition to the Maputo
Declaration noted above, the Abuja Declaration from 2001 commits African states to
allocate 15% of the national budget to health, and the Dakar Framework for Action
called for 9% to be allocated to education by 2009. The low level of investment in
these sectors is also reflected in Kenya’s overall “laggard” status in relation to the
MDGs (see figure 1).
Figure 3: Sub-Saharan African Government Estimated Average Spending on Health, Education
and Agriculture (Combined) as a % of Total Expenditure (2000-10), with MGD Progess Scores
(source: One: The 2013 Data Report)
5.3 MONITORING RESULTS
The government reports progress toward the MTPs against key indicators for which
baselines and targets have been set. For example, progress with regard to poverty
C H A P T E R 5 : G O V E R N M E N T C O M M I T M E N T A N D A C T I O N
34
alleviation is measured by the number of people who are considered food insecure
and by number of households with Orphans and Vulnerable Children. The most re-
cent progress report142 on the implementation of the MTP highlights that the initial
target of 10% economic growth by 2012 has not been met.
In 2011 the Government introduced a National Integrated Monitoring and Evaluation
System (NIMES) which it views as an essential component of its efforts to improve
the effectiveness and quality of government. Under NIMES, monitoring activities are
to be organised on a decentralised basis at all levels of government. Each govern-
ment institution or body which is spending public resources now has a responsi-
bility to monitor and evaluate the effectiveness of its programmes.
Kenya’s ratings for budgetary transparency have been average in relation to other
African countries, with little indication of improvement or decline.143 Monitoring
systems remain weak and there is a lack of budget and expenditure analysis.
Initiatives to enhance public financial management have been driven by both Parlia-
ment and the Auditor General. Public financial management systems are being
strengthened and in 2011 the government re-launched its Integrated Financial Man-
agement Information System (IFMIS), a nationwide accounting system. IFMIS has
thus far not been able to provide the expected benefits of integrated financial plan-
ning, implementation and control of public expenditure. A new PFM reform strategy
was also launched in 2013.
35
Chapter 6: Development Cooperation and Sweden’s Role
“Let’s create synergies regardless of modalities.”
6.1 DEVELOPMENT PARTNERSHIPS
The overseas development assistance (ODA) landscape in Kenya has changed fun-
damentally over the last decade, a trend that is likely to accelerate in the coming
years. New private players, international NGOs, foundations and philanthro-
pists, are responsible for a growing share of aid volumes. The trend in global pri-
vate philanthropy is visible in Kenya where the Global Fund to Fight AIDS, Tubercu-
losis and Malaria has emerged as a major development partner. The Global Alliance
for Vaccines and Immunisation (GAVI) is also a leading actor.144 As well as new
partners, new aid modalities are emerging including guarantees and credit mecha-
nisms for private investment.
The United States is Kenya’s largest OECD bilateral donor. In 2010, the US contrib-
uted SEK 3.7 billion, mostly allocated to HIV/AIDS support. However, the support
fell to SEK 1.5 billion in 2012. Japan, France and the UK also provide significant
bilateral aid. Sectoral priorities vary across development partners (see Annex VI).
Health receives the highest proportion of aid overall, with the US being the sector’s
largest donor (SEK 8.6 billion received from the US between 2006 and 2010). Some
observers interviewed stressed that the very high dependence on donor funding in the
health sector has negative impact on government commitment to cover the recurrent
costs of these services. The government perceives that the Environment, Water and
Sanitation (EWS) sector has adequate financing.145 A large proportion of this funding
is in the form of loans, which may therefore be targeted to more commercially viable
investments and not to the poor. EWS, along with the health and financial sector, are
the most congested sectors, leading to some fragmentation of support. In total 19 de-
velopment partners (with 72 projects) have been present in the EWS sector over the
past four years, followed by 18 development partners in health and in finance. Sectors
that the government views as being underfinanced include agriculture, land, STI, ICT
and tourism. The nature of the under-financing varies between these sectors. In agri-
culture 11 development partners are present, but this support is fragmented among a
large number of projects. Support to land as a “sector” is difficult to define, but it
appears that two development partners are dominant, Sweden and the World Bank,
with Sweden contributing 81% of the external funding. Other agencies, such as GIZ,
IFAD and UNHabitat, are providing technical support for land related issues. For STI
and ICT only three development partners are present. No development partner is sup-
porting the tourism sector.
C H A P T E R 6 : D E V E L O P M E N T C O O P E R A T I O N A N D S W E D E N ’ S R O L E
36
Focal areas for EU cooperation are agriculture and rural development, roads and trans-
port and macroeconomic support. In addition the EU has a broad range of support out-
side these areas, including education, governance and private sector development.
Some donors are moving towards directly promoting trade and private sector
investment, which involves a shift away from directly targeting the poorest and
and from support to public service provision more generally. Indeed, it is broadly
recognised among development partners that greater convergence between aid and
private investment trajectories is needed. In the course of dialogue for this PDA it
was difficult to discern a clear “theory of change” for how these private sector devel-
opment and poverty alleviation objectives were expected to converge, given the his-
tory of elite capture of the benefits of economic growth. There are, however, ways
that this could be effectively addressed. In their research, Whitfield and Therkild-
sen146 have found that awareness of potential mutual interests between entrepre-
neurs in productive sectors and politicians looking for voter support can be a
way of identifying development opportunities amid elite capture. Given the need
for newly elected county level authorities to demonstrate results for their new con-
stituents, there may be emerging opportunies for ways to achieve mutually beneficial
outcomes that also include measures that address the needs of the poor.
Despite the surprisingly limited levels of investment in agriculture, concerns are
growing about recurrent drought emergencies, high levels of acute and chronic mal-
nutrition, and disturbing levels of household food insecurity. There are growing
calls for taking a new approach to linking humanitarian and development pro-
gramming, but it does not appear that a consensus has been achieved regarding
better convergence between modalities or objectives of humanitarian and devel-
opment assistance.147
A number of new development partnerships are emerging in Kenya, characterised by
more commercial style relationships and business partnerships. Most significantly,
since the mid-1990s, China has increasingly used foreign aid to achieve broader stra-
tegic objectives, including strengthening links with resource-rich African economies.
Hence the biggest beneficiaries in Sub-Saharan Africa are Angola, Nigeria, Sudan,
and Zimbabwe, which account for the vast majority of the total Chinese aid to the
region. In Kenya, loans and grants from China became significant after 2002. Invest-
ment is mainly focused on infrastructure, equipment and technology. Major projects
include road construction, power distribution, rural electrification and water distribu-
tion. China also issues scholarships to students wishing to study in China and pro-
vides technical training. The Chinese Embassy reports that they primarily provide
loans that generally include a 35% grant component. Due to donor requirements con-
tracts are awarded to Chinese firms.
Brazil is another new development partner to Kenya, providing largely technical sup-
port. The Brazilian Cooperation Agency responds to requests from the Kenyan gov-
ernment. Only government-to-government support is offered and there is no legal
framework for cooperation with civil society, the private sector or UN organisations.
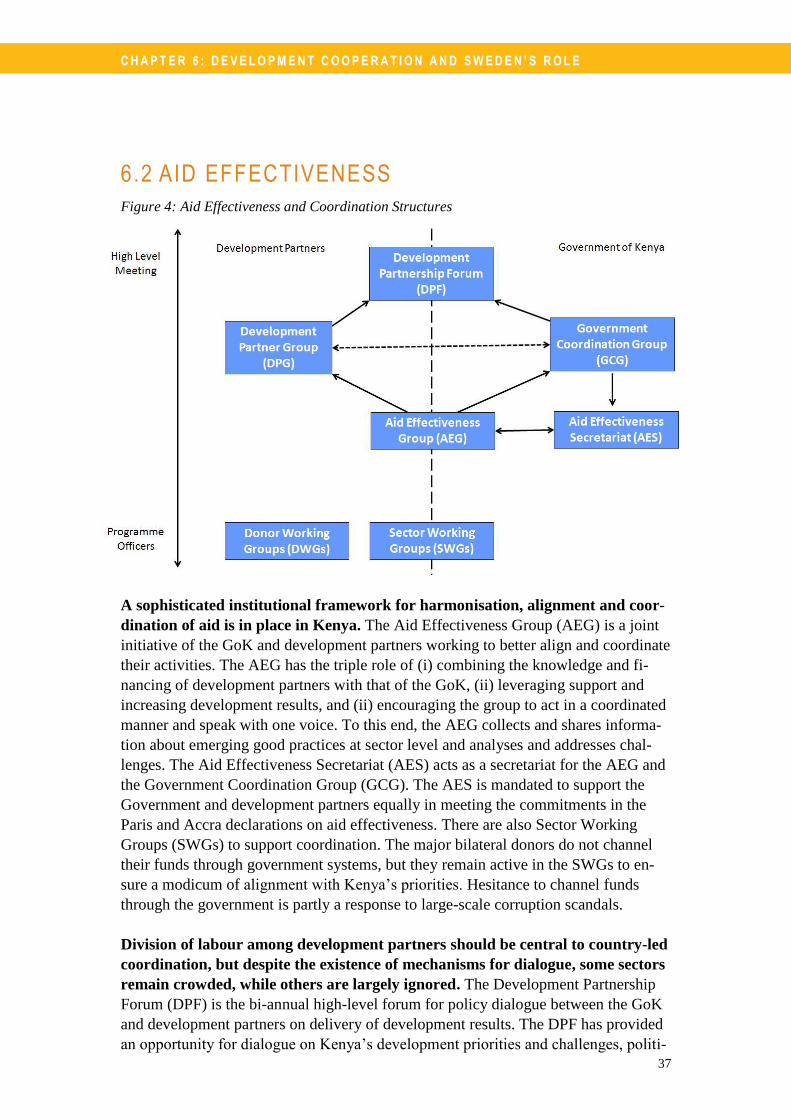
C H A P T E R 6 : D E V E L O P M E N T C O O P E R A T I O N A N D S W E D E N ’ S R O L E
37
6.2 AID EFFECTIVENESS
Figure 4: Aid Effectiveness and Coordination Structures
A sophisticated institutional framework for harmonisation, alignment and coor-
dination of aid is in place in Kenya. The Aid Effectiveness Group (AEG) is a joint
initiative of the GoK and development partners working to better align and coordinate
their activities. The AEG has the triple role of (i) combining the knowledge and fi-
nancing of development partners with that of the GoK, (ii) leveraging support and
increasing development results, and (ii) encouraging the group to act in a coordinated
manner and speak with one voice. To this end, the AEG collects and shares informa-
tion about emerging good practices at sector level and analyses and addresses chal-
lenges. The Aid Effectiveness Secretariat (AES) acts as a secretariat for the AEG and
the Government Coordination Group (GCG). The AES is mandated to support the
Government and development partners equally in meeting the commitments in the
Paris and Accra declarations on aid effectiveness. There are also Sector Working
Groups (SWGs) to support coordination. The major bilateral donors do not channel
their funds through government systems, but they remain active in the SWGs to en-
sure a modicum of alignment with Kenya’s priorities. Hesitance to channel funds
through the government is partly a response to large-scale corruption scandals.
Division of labour among development partners should be central to country-led
coordination, but despite the existence of mechanisms for dialogue, some sectors
remain crowded, while others are largely ignored. The Development Partnership
Forum (DPF) is the bi-annual high-level forum for policy dialogue between the GoK
and development partners on delivery of development results. The DPF has provided
an opportunity for dialogue on Kenya’s development priorities and challenges, politi-
C H A P T E R 6 : D E V E L O P M E N T C O O P E R A T I O N A N D S W E D E N ’ S R O L E
38
cal and economic developments, and the effective contribution of development coop-
eration. Absorption capacity is the key challenge that the government has stressed in
this dialogue over the past year.
As part of MTPII, the government is proposing to assume more control over aid in
order to conduct their own internal analysis, reduce the burden of information re-
quests on the government, better utilise their own systems and increase transparency.
6.3 SWEDEN’S ROLE The total volume of Swedish aid to Kenya provided between 1998 and 2011 amounts
to SEK 3.14 billion. Between 2002 and 2006, annual development aid tripled from
SEK 115 to 350 million. Neither the volume nor the flow of aid was affected by the
election violence in 2008. The annual country budget for 2012 was SEK 414.5 mil-
lion (see Annex VII). Levels of Swedish humanitarian support to Kenya have varied
significantly over the last five years, between SEK 49.3 million in 2008 reaching its
peak in 2011 with SEK 160 million. The peak in 2011 was due to the severe drought
in Kenya, Somalia and Ethiopia. The Swedish country strategy for development cooperation with Kenya for the period
2009-13 has focused on democratic governance and human rights, natural resources
and the environment, and urban development. The overall goal of the cooperation
strategy is “a Kenya in which all poor people have the opportunity to improve
their living conditions and where their human rights are realised.” Significant
levels of humanitarian assistance have also been provided in addition to the aid pro-
vided through the framework of the country strategy. Sweden has long been a major
humanitarian donor, for example providing extensive humanitarian aid to Kenya to
Challenges to Aid Effectiveness
The Kenyan Ministry of Finance has identified the following key challenges to enhancing aid ef-
fectiveness:
Predictability: Volatile or unpredictable aid flows inhibit good governance, coherent govern-
ment expenditure and accountability in recipient countries. Foreign aid to Kenya has been highly
volatile and only about 60% of net ODA is disbursed on an annual basis.
Coordination: There is a trend toward increasing aid volumes and shrinking project size. While
small projects can deliver benefits to isolated communities, they also increase aid fragmentation,
multiply administrative costs and complicate donor coordination by recipient governments.
Fragmentation and Division of Labour: To avoid fragmentation, a sound division of labour
among development partners is needed. In order for this division of labour to work smoothly, all
ministries are now required to ensure that the SWGs follow Vision 2030, but in practice little pro-
gress has been achieved in addressing issues of division of labour.
Fiduciary Risk: The risk of corruption is perceived as high in Kenya and most development
partners have low trust in public financial management systems. Therefore parallel accounts, audit
and procurement arrangements are often used to safeguard development funds, which is not in line
with aid effectiveness principles.
Under-reporting: In practice the government budgets for appropriations, but the funds are of-
ten utilised by the development partner directly, for instance for direct payments to contractors.
When the payments are made directly, the government often lacks information for financial follow-
up and audit.
C H A P T E R 6 : D E V E L O P M E N T C O O P E R A T I O N A N D S W E D E N ’ S R O L E
39
relieve the effects of the drought in 2010/11 (SEK 160 million in 2011 and SEK 65
million in 2013). A substantial part of civil society support is channelled through UNDP. Sweden’s
cooperation strategy with Kenya states: “[t]he current portfolio composition, with
approximately one third of aid going to Kenya’s civil society and two thirds allocated
via the Government, will be retained”. Approximately 28% of Swedish support has
gone to civil society during the period 2009-2013. Sweden has for many years played a leading role in promoting aid effectiveness
in Kenya. Sweden was the driving force in the development of the Kenya Joint Assis-
tance Strategy (KJAS) 2006. The KJAS came to an end in 2012, but the principles still
steer Swedish approaches to development cooperation. Together with the World Bank,
Sweden co-chaired the Development Partner Group (DPG, the monthly meeting of
development partners) from August 2010 to September 2012, as well as the DPF.
Sweden has worked to enhance dialogue with the government on aid effectiveness and
also played a leading coordination role in several sectors, including administrative
reform and public financial management and the governance, justice, law and order
sector (GJLOS). Sweden remains strongly committed to the principles of aid effec-
tiveness. Sweden also supports the fight against corruption in close collaboration with
partners, by establishing control mechanisms and also through education and dialogue. Sweden’s partners recognise Sweden has being particularly strong in relation to put-
ting the principles of aid effectiveness into practice. Sweden is seen to have sufficient
credibility and trust to engage in highly controversial areas, such as land, where other
countries with a colonial heritage would be suspected of having vested interests.
Even if Sweden is not a large donor, its long-term and principled engagement,
combined with a readiness to take on a leadership role in donor coordination,
have meant that it has greater influence than the scale of the portfolio would
suggest, though the scale of this influence is difficult to measure. Sweden sees that its comparative advantage (within the context of the wider devel-
opment partner community) lies in its long experience and continuity in cooperation
with Kenya since independence. Furthermore, Sweden perceives that it has strong
credibility with the GoK and civil society, which combine to create conditions
conducive to dialogue, even on difficult issues. Current overarching issues for dia-
logue include economic growth, just and equitable distribution of resources and op-
portunities, and the human rights perspective. Particular attention is being given to
political reforms to prevent recurrence of the 2008 humanitarian and political crisis.
This involves issues related to the new Constitution, new electoral legislation and
implementation of land reforms. The mid-term review of Sweden’s Cooperation Strategy 2009-13 (conducted between
February-April 2011) recommended increased support for implementation of the
Constitution (especially devolution and human rights), strengthening of dialogue on
political and humanitarian crises and corruption, and that there should be no change
in the current three focus sectors.
40
Chapter 7: Conclusions and Ways Forward
“You can’t divorce politics from development.”
7.1 OVERVIEW OF FINDINGS
This final section of the PDA draws together the key conclusions on the main oppor-
tunities for development and poverty alleviation in light of the challenges facing
Kenya today. The overall conclusions of the PDA are that despite a problematic secu-
rity situation, the relatively peaceful recent elections gives cause for cautious opti-
mism (despite considerable lingering tensions and significant concerns related to ter-
rorism). There is hope that the new Constitution will deliver much needed reforms
and that public institutions will regain their intended role after years of ethnic politics
and elite capture. People are pessimistic in their views that the economy is not yet on
course to deliver gains that will result in poverty alleviation and improvement in their
living conditions. There is cause for this pessimism, as Kenya’s current performance
in terms of maintaining acceptable nutritional standards, access to clean water, con-
trolling endemic violence and increasing gender equality are not reflective of a coun-
try that is seen as a leader in African development. Furthermore, despite commit-
ments in the new Constitution, expenditure levels on key sectors upon which poverty
alleviation is dependent are far below required levels. The transitional nature of the
current situation means that it is too early to draw even tentative conclusions about
whether Kenyans’ hopes or fears are justified.
There is cause for public uncertainty. Past experience has shown that assumptions
that macro-economic growth will automatically lead to poverty alleviation are un-
founded. Kenya’s economic policy is not strategically connected with poverty reduc-
tion, and intended growth trajectories are not linked to equity and human rights. Ken-
yan history does not show a linear path to development, and it is likely that the coun-
try, and particularly the poor, will be buffeted by recurrent crises in the future as
well. Poverty is directly related to inability to withstand a drought, an economic
downturn or a family illness. Crises at household levels tend to result in unacceptable
declines in nutritional levels, and families being forces to sell off productive re-
sources. For these reasons poverty is cumulative and paths in and out of poverty are
related to the dynamically changing landscape of risk and marginalisation. Almost
one in two Kenyans are poor and one in five are extremely poor. Inequality is pro-
nounced and linked to geography, ethnicity and gender. Poverty is also driven by po-
litical exclusion and violence. Poverty is ultimately related to the following four fac-
tors:
Access to resources: Insecure tenure, access and in some areas availability of land
and water, in both rural and urban areas, reduce people’s ability to deal with the
C H A P T E R 7 : C O N C L U S I O N S
41
shocks that repeatedly impact on livelihoods. As the population grows and environ-
mental conditions deteriorate the scarcity of these resources is increasing.
Access to basic services: Marginalisation stems from lack of access to basic public
services, due to duty bearers failing to uphold their social contract to serve the poor
and inadequate levels of government expenditure on providing these services. There
is no “silver bullet” in enhancing access and sustainability of services. There is a risk
that devolution may aggravate these problems in the future.
Power: Access to resources is largely related to power relations. The lack of benefits
reaching the poor from macro-economic growth is related to pervasive elite capture of
the benefits from economic development. Nonetheless, the power of these elites is
likely to remain, and successful poverty alleviation efforts will need to be anchored in
incentives for achieving mutually beneficial outcomes for the poor and the elites and
finding ways to foster greater investment by the elites in productive enterprises with
recognised pro-poor outcomes.
Choice: Weak access to resources and lack of power deprive individuals of the right
to shape and make choices over their own lives – particularly livelihood choices. Se-
cure land tenure (in both urban and rural areas) is required if the poor are to have the
confidence to invest their meagre resources in new livelihoods. Choice is also related
to migration, and many households have recognised how “straddling” the urban-rural
divide, with household members pursing livelihoods in both, is an effective way of
spreading risks and taking advantage of a range of opportunities.
All four of these factors are influenced by gender, generational factors, where people
live and the ethnicity that dominates Kenyan politics and power relations. Women,
men and youth experience poverty differently and have different vulnerabilities and
opportunities depending on whether they live in a city or the countryside.
Rural poverty is characterised by vulnerability to climate change, inability of the poor
to draw benefits from agricultural commercialisation and narrow reliance on produc-
tion and income sources that can safeguard household food security. Rural poverty
can only be alleviated through taking a broad perspective on how the poor benefit
from agriculture, together with a range of other rural and urban livelihood possibili-
ties. Urban poverty is linked to the access that men, women and youth have to wage
labour, their health and sanitation conditions and exposure to violence. Persistent
poverty has been linked to the failure to accumulate assets and the ratchet effects of
repeated household livelihood shocks.
But poverty is not static, and there are emerging opportunities in an economy that in
many respect is dynamic. Kenya is the gateway to East and Central Africa, a regional
business hub and a significant tourist destination. Other attractions include estab-
lished innovation capacities and entrepreneurialism, investment in research and de-
velopment, a relatively well educated workforce and a growing and increasingly in-
clusive financial market.
C H A P T E R 7 : C O N C L U S I O N S
42
The 2010 Constitution commits the state to a number of much needed reforms and
heralds huge potential for change, which will be dependent on rapid development of
capacities at county level and finding ways to implement fundamental commitments
to greater respect for human rights, enhanced public sector integrity and gender eq-
uity. The institutional changes underway in Kenya today provide opportunities to take
a more concerted approach to gender equality, to address regional/ethnic inequities,
and to create transparent and accountable institutions. However, past experience has
shown that a gap exists between formal commitments and the changes that are re-
quired in mindsets and incentives to act on these commitments. A vibrant civil soci-
ety that can act as a watchdog, holding the public sector to account for acting on its
new commitments to political and institutional reform has an important role to play in
bridging this gap. New forms of civil society organisation, such as networks, mem-
bership organisations and platforms, may offer opportunities to extend and strengthen
connections across society and deepened engagement in reform processes. This will
require efforts to strengthen the governance structures, accountability and geographic
coverage of these organisations.
7.2 TRENDS, RISKS AND OPPORTUNITIES
Discussions about the nature of poverty when developing this PDA revealed two con-
trasting perspectives that impinge on future commitments to addressing poverty alle-
viation from a rights based perspective. First, there is a clear recognition that the GoK
must be more accountable to its citizens. The constitutional reforms, devolution proc-
ess and especially efforts to address land issues, are expected to create a new set of
stronger accountabilities between duty bearers and rights holders. The other, less
promising development, is a tendency to see an explicit focus on the poor as being no
longer essential. The weak sustainability and waning GoK commitments to finance
programmes directed towards the poor, and the failures of both development and hu-
manitarian programming to reduce the recurrent nature of shocks that generate pov-
erty, have led to cynicism. Many assume that it is impossible to fundamentally
change Kenya’s political economy. Such assumptions reinforce the power of elites
and maintain inequality. While in many respect valid, there are dangers if these atti-
tudes provide a justification to ignore the factors that create vulnerability. This can
then become an excuse for withdrawing services from difficult areas and turning a
blind eye to land dispossession if it is argued that attention to the perspectives of the
poor is a relic of a failed development model. If the poor disappear from the political
landscape, their rights will be in danger. If poverty alleviation is to remain central in
Kenyan development, efforts will need to reflect the following trends, risks and op-
portunities:
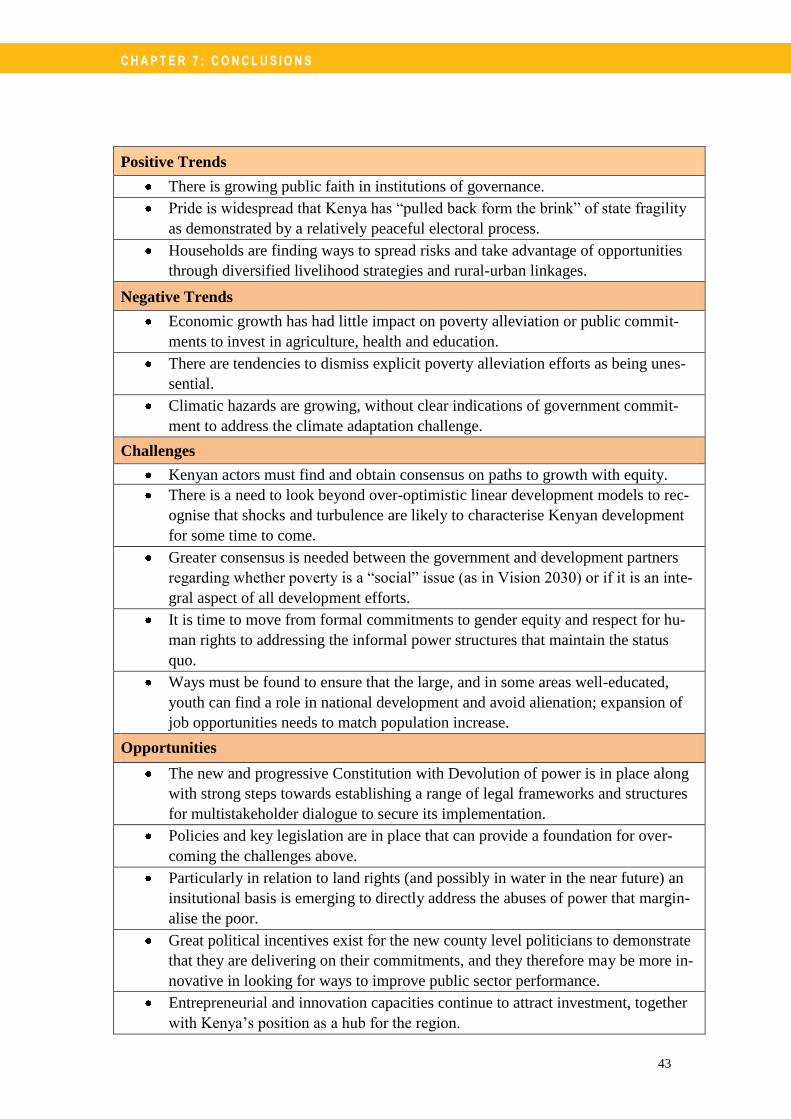
C H A P T E R 7 : C O N C L U S I O N S
43
Positive Trends
There is growing public faith in institutions of governance.
Pride is widespread that Kenya has “pulled back form the brink” of state fragility
as demonstrated by a relatively peaceful electoral process.
Households are finding ways to spread risks and take advantage of opportunities
through diversified livelihood strategies and rural-urban linkages.
Negative Trends
Economic growth has had little impact on poverty alleviation or public commit-
ments to invest in agriculture, health and education.
There are tendencies to dismiss explicit poverty alleviation efforts as being unes-
sential.
Climatic hazards are growing, without clear indications of government commit-
ment to address the climate adaptation challenge.
Challenges
Kenyan actors must find and obtain consensus on paths to growth with equity.
There is a need to look beyond over-optimistic linear development models to rec-
ognise that shocks and turbulence are likely to characterise Kenyan development
for some time to come.
Greater consensus is needed between the government and development partners
regarding whether poverty is a “social” issue (as in Vision 2030) or if it is an inte-
gral aspect of all development efforts.
It is time to move from formal commitments to gender equity and respect for hu-
man rights to addressing the informal power structures that maintain the status
quo.
Ways must be found to ensure that the large, and in some areas well-educated,
youth can find a role in national development and avoid alienation; expansion of
job opportunities needs to match population increase.
Opportunities
The new and progressive Constitution with Devolution of power is in place along
with strong steps towards establishing a range of legal frameworks and structures
for multistakeholder dialogue to secure its implementation.
Policies and key legislation are in place that can provide a foundation for over-
coming the challenges above.
Particularly in relation to land rights (and possibly in water in the near future) an
insitutional basis is emerging to directly address the abuses of power that margin-
alise the poor.
Great political incentives exist for the new county level politicians to demonstrate
that they are delivering on their commitments, and they therefore may be more in-
novative in looking for ways to improve public sector performance.
Entrepreneurial and innovation capacities continue to attract investment, together
with Kenya’s position as a hub for the region.
C H A P T E R 7 : C O N C L U S I O N S
44
7.3 POINTS OF DEPARTURE FOR DEVELOPMENT EFFORTS THAT REFLECT THE NATURE OF POVERTY IN KENYA
The evaluation that builds upon this PDA includes specific recommendations for
Swedish development cooperation. Therefore this report does not conclude with rec-
ommendations, but instead with a list of suggested points of departure for future de-
velopment cooperation in Kenya to reflect the challenges and opportunities identified.
These points of departure aims to serve as a tool for development partners to trans-
cend sectoral mindsets and focus future strategic thinking on basic issues such as hu-
man rights and human security. This PDA can only provide initial direction regarding
how to link poverty and development but key points of departure following the PDA
findings are;
1. Build on current efforts that focus on securing more equitable access to and tenure
for land and water resources.
2. Recognise that in many respects development cooperation will inevitably have
limited influence on the elite-led development trajectories; which suggests the
importance of finding ways to promote a greater modicum of equitable access to
key natural resources in the context of prevailing productive investment trends.
3. Ensure that the arguments for a focus on poverty alleviation are evidence-based
by giving priority to supporting initiatives that document the impact of changes in
political and economic structures at household level.
4. Recognise the problematic and prevailing notion within Vision 2030 that poverty
is a “social issue”, and therefore use dialogue to focus more on explicit arguments
that raise awareness of the links between entrenched poverty and the political and
economic choices facing Kenya today.
5. Closely monitor the impact of devolution on access to basic public services and
adapt approaches to the emerging new constellations of duty bearers and possible
changing fee structures as local authorities struggle to meet the expectations of
their constituents, define their roles and balance their budgets.
6. Address recurrent disasters and conflict by designing development programming
in such a way as to reflect explicit factors that reduce people’s vulnerability to
acute hazards (e.g. identifying appropriate indicators). The ASALs is an important
focus area also for future development efforts. The “business case” for not allow-
ing chronic insecurity to continue to fester in these areas given the effects on
Kenya as a whole, and the “humanitarian case” that points out the duties of the
state to provide basic security and services for all Kenya’s citizens should be clar-
ified.
7. Focus on the stable governance of (currently frail) systems to respond to and mit-
igate a range of climatic, economic and political shocks.
8. Design efforts to expand the livelihood choices available, particularly for youth
and women, by looking beyond sectors to enhance rural-urban linkages and en-
hancing financial services that provide needed capital for poor people’s own in-
vestments.
C H A P T E R 7 : C O N C L U S I O N S
45
9. Pay greater and more frank attention to the capacity of public institutions and civil
society to absorb and effectively utilise investments, and as part of this be cau-
tious regarding direct aid financing of service provision.
Together these recommendations point to the need to build further on the political
economy analysis of this PDA to understand better why growth has yielded such
meagre results for the poor, and design interventions to explicitly reflect core values
in this regard.
46
Annex 1 – Terms of Reference
Draft Terms of Reference for an Implementation Evaluation of the Cooperation
Strategy with Kenya 2009-2013
1. Background
Sweden has a history of development cooperation in Kenya that goes back half a cen-
tury. This legacy of long term engagement constitutes one of the building blocks that
the cooperation rests on. Development cooperation is governed by the Cooperation
Strategy (2009-2013) which is aligned to the Kenya Joint Assistance Strategy (KJAS)
2007–2012, signed by 17 Development Partners in collaboration with the Kenyan
Government. The objective of the KJAS is to support the government’s efforts to
achieve the Millennium Development Goals (MDGs) and the targets that the govern-
ment has set for long-term development in Kenya in its Vision 2030. In addition the
government’s Medium Term Plan (MTP) 2008-2012 is the first in a series of succes-
sive five-year medium term plans which governs implementation of the Kenya Vision
2030. The second MTP is currently being drafted by the government in consultation
with its development partners.
The overall objective of the Cooperation Strategy (2009-2013) is “a Kenya where all
poor people are given the possibilities to improve their livelihood conditions and
where their human rights are realized”. The perspectives of poor people on develop-
ment and the rights perspective are mainstreamed in the implementation of the devel-
opment cooperation. The three main sectors of cooperation are: Natural Resources
and the Environment, Urban Development and Democracy and Human Rights. The
total volume of the current Strategy was originally 350 MSEK which was later in-
creased to 400 MSEK after a Mid-term Review in 2011.
In view of the upcoming end of the current Cooperation Strategy in 2013, an imple-
mentation evaluation divided into two parts will be undertaken. The results of these
analyses will be fed into the new Cooperation Strategy (‘Results Offer’) (2014-2018).
2. Purpose
The purpose of the evaluation of the implementation of the Strategy for development
cooperation with Kenya 2009-2013 is to assess to what extent the Swedish develop-
ment cooperation during the period has been effective, efficient, relevant148
and sus-
tainable and what impact has been achieved.149
More specifically:
Part I
The purpose of the PDA is to: 1) contribute to a better understanding of poverty and
vulnerability and its causes, manifestations and consequences in Kenya, 2) identify
and draw conclusions on fundamental development challenges and opportunities,

A N N E X 1 – T E R M S O F R E F E R E N C E
47
thereby identifying needed development efforts, 3) map the main development part-
ners including identifying possible agents for change, for sustainable development
including analysing the role of development partners and cooperation in Kenya and in
particular Sweden’s role.
Part II
Building on the findings from the Poverty and Development Assessment, the purpose
of the Implementation evaluation of the Strategy for development cooperation with
Kenya is to identify what results have been achieved, and what Sweden should pro-
pose to do in the upcoming cooperation period. More specifically, the evaluation will
inform the priorities in the next cooperation period by assessing: 1) the progress to-
wards the overall Strategy objective, the sector objectives and the extent to which
contributions reached planned results and possible other outcomes and results, 2) the
main dialogue issues and to what extent dialogue contributed to achieving results
against the overall Strategy objective and the sector objectives, 3) the effectiveness,
efficiency and relevance of channels (government/civil society/multilateral) as well as
aid modalities (sector programme/project/core contribution/programme based ap-
proach) . The conclusions drawn and the main lessons learnt will serve as a basis for
the development of the future ‘Results Offer’.
3. Scope of work and methodology
The overall scope of the work will be divided into two parts:
I. Poverty and Development Assessment
II. Implementation evaluation of the Strategy for development cooperation with
Kenya 2009-2013
The PDA will be conducted first followed by the Implementation evaluation. 3.1 Poverty and Development Assessment
3.1.1 Methodology
The consultant will mainly through a desk review, synthesise and analyse relevant exist-
ing information about fundamental development challenges and opportunities facing
Kenya since its first democratic elections in 2002. The development should be described
in relation to the Economic Recovery Strategy for Wealth and Employment Creation
(ERSWEC) 2003-2007 and its successor, Vision 2030. More specifically the develop-
ment should be judged against the targets set in the first Medium-Term Plan 2008-2012
(MTP) which governs implementation of the Kenya Vision 2030. The assessment
should result in a report summarising conclusions made and give recommendations on a
way forward for Swedish development cooperation.
3.1.2 Specific tasks
1. Identify and compile the most relevant sources of information on poverty and
key development challenges facing Kenya (e.g. the Kenyan Government’s
analyses and development strategies (Annual Progress Report of MTP), World
Bank Assessments, UNDP National Human Development Reports, analyses by
A N N E X 1 – T E R M S O F R E F E R E N C E
48
other cooperating partners, academic studies etc.). Consult relevant sections at
the Embassy, Sida and key development partners to identify possibly infor-
mation sources and/or knowledge gaps.
2. Synthesise and analyse the relevant existing information identified above
about fundamental development challenges and opportunities facing Kenya
since 2002.
3. Organise a workshop for the Embassy and Sida (relevant departments/staff)
and key stakeholders in Kenya from government, civil society, cooperating
partners and universities. The purpose is to discuss and assess the reports on
poverty and the key development challenges identified under task 1 and 2, to
come to a common understanding and draw conclusions. Specific tasks for the
consultant includes:
i. Prepare background material (e.g. summarise conclusions from the re-
ports identified under scope1, prepare discussion themes, assign tasks to
relevant sections at the Embassy/Sida departments)
ii. Facilitate an open discussion and debate
iii. Document the workshop discussions and conclusions
4. Write a synthesised PDA with the conclusions from the desk study and the
workshop as a starting point. The PDA shall consist of the following six main
sections:
i. Country context. Short description of the fundamental economic, social-
cultural, environmental and peace and security context in Kenya includ-
ing basic power relations and the relevant political developments.
ii. Who are the poor and vulnerable? Assessment of key issues: “Who are
the poor and vulnerable?”, “Where do they live?” and “What are their
characteristics of their poverty?” including a special focus on gender. The
assessment should be based on a multi-dimensional understanding of
poverty150
.
iii. Opportunities for development. Internal and external factors influenc-
ing Kenya’s development. Main constraints, challenges and opportunities
to development. What are the main risks? How could these risks affect the
Swedish development cooperation? How should Sweden relate to these
risks?
iv. The Government’s commitments and actions. Assessment of the Gov-
ernment’s commitments and actions in the areas of poverty alleviation, hu-
man rights and democracy, gender equality, national strategy for develop-
ment, economic policy, public financial management system, environmental
sustainability including climate change and fight against corruption. What is
the actual budget provided? How has pro-poor budget allocations been made
and what have they resulted in?
v. Mapping of the development cooperation and its key actors in Kenya.
Analysis of key development partners (also identify and reflect on new
actors and identify “agents for change”), sectors and financial flows of
A N N E X 1 – T E R M S O F R E F E R E N C E
49
development cooperation and what have they achieved? Which develop-
ment partners are engaged in which areas? Is there over or under financ-
ing in some areas? How does the coordination work and what are the
challenges?
vi. Make an assessment of Sweden’s role. What are Sweden’s strengths,
weaknesses and possible comparative advantages (why and in what
way?). What is Sweden’s strategic role? How can Sweden act as a cata-
lyst and/or innovative?
vii. Conclusions. Summarise and draw conclusions on: i) fundamental devel-
opment challenges and opportunities on the key issues discussed in the pre-
vious chapters, ii) the strategic role of development cooperation and feasible
aid modalities including which risks exist and to what degree they affect the
overall effectiveness, iii) strategic role for Swedish support in the forthcom-
ing cooperation strategy period.
3.2 Implementation evaluation of the Strategy for development cooperation with
Kenya 2009-2013
3.2.1 Methodology
The consultant will through a desk review and case studies on specific contributions in
combination with field visits, analyse relevant existing information about results
achieved against the Strategy and sector objectives during the strategy period using the
results matrix as a support. The consultant should conduct interviews using a partici-
patory approach with the Embassy staff and with a selection of key partners in Kenya.
The results assessment should be based on the continuous follow up (such as strategy
reports and programme reports) and evaluations done during the strategy period. Ken-
ya’s own annual follow up the Vision 2030 (more specifically the MTP I) and stud-
ies/evaluations of the Millennium Development Goals, sector program reports, policy
documents and other assessments/reports done by other Development Partners, repu-
table think thanks and NGOs should be used. The evaluation should result in a report
summarising conclusions made and give recommendations on a way forward.
3.1.2 Specific tasks:
1. Prepare a sampling criteria for the case studies and identify two-three contri-
butions that best represent each sector, and if relevant, other contributions of
strategic importance. Assess the main results on the level of outcomes and in
relation to the sector objective and where possible also assess what impact has
been achieved towards the overall Strategy objective. Did the contributions
deliver as planned? Are the contributions effective, efficient, relevant and sus-
tainable?
2. Are the different sector portfolios well designed to reach the poorest, most
underserved areas (e.g. for Natural resources sector the Arid and Semi Arid
Lands (ASALs), Northern Kenya, refugee-receiving areas)? Note for example
A N N E X 1 – T E R M S O F R E F E R E N C E
50
the need for integrated interventions to improve resilience/livelihoods in rural
areas, are the current contributions equipped to help make this happen?
3. Is there a systematic approach to formulating a ‘Theory of Change’ (e.g.
community mobilisation and participation in water resource management and
water and sanitation services, increased income for small-scale farmers, public
participation in planning of urban services, advocacy for reforms in all these
sectors)? And is it achieving expected results?
4. Analyse how the rights perspective and the poor people’s perspectives of de-
velopment have been applied within the sectors. Provide concrete examples
and analyse the results of the measures. This should be done by analysing ap-
plication of the principles of non-discrimination, participation, transparency
and accountability.
5. Analyse how each thematic priority (Environment and climate, Gender equali-
ty and Democracy and human rights) has been integrated in the different sec-
tors, provide concrete examples and analyse the results of the measures.
6. Asses the main dialogue issues that were identified in the Strategy and the re-
sults achieved in relation to the sector objectives and the Strategy objective.
Have the right platforms been used? Have dialogue strengthened the results of
the contributions and/or have the contributions facilitated a more in-depth dia-
logue? Were the dialogue issues identified relevant?
7. What are the experiences and lessons learnt from policy work, actors possi-
bilities to drive change, the government’s/civil society’s/private sector’s and
the public’s role?
8. Identify challenges/successes with strengthening donor cooperation in line
with the Paris Agenda.
9. Analyse why the different sectors are using different cooperation channels and
analyse what channel is most effective and efficient (government (nation-
al/regional/local level), civil society and multilateral). Also assess the differ-
ent aid modalities (sector programme/project/core contribution/programme
based approach). Should the Swedish development cooperation strategically
limit itself to sector-based approaches, and/or allow some area-based initia-
tives or other better alternatives?
10. Aggregate the results information from the case studies in the sectors and as-
sess and draw conclusions on the collective contribution to the impact at the
overall Strategy objective level.
11. Have the prioritisations in the Swedish Strategy which builds on Vision 2030
and KJAS led to relevant, feasible, and sustainable support to improvement of
a basis for change and improved structures that can encourage and strengthen
individual’s poverty reduction including their rights?
12. Identify lessons learnt and assess what the implications will be for the upcom-
ing development of ‘Results offer’ in relation to direction, focus, dialogue and
selection of the forms of cooperation and partners? What is Sweden’s strategic
A N N E X 1 – T E R M S O F R E F E R E N C E
51
role in the upcoming strategy period? Summarise and give recommendations
on a way forward.
4. Outcome
In the start-up of the assignment an brief Inception report including a work plan for
the assignment and a description of how the chosen methods relates to the assignment
in practice should be prepared.
The expected outcome for Part I, the PDA, is an interim report including a short ex-
ecutive summary (max 2 pages) in Swedish and English. Following the completion
Part II, the Implementation evaluation, a final report in English including the main
findings from the PDA, with analysis, conclusions and recommendations and a short
executive summary (max 4 pages) in Swedish and English, should be submitted.
5. Draft Time table and reporting
1. Contract signed by end of November 2012
Part I Poverty and Development Assessment
2. Gathering and compilation of information during December/January 2012-
2013
3. Interviews and workshop in Nairobi mid January-February 2013
4. Draft report mid February 2013
5. Final interim report end of February 2013
Part II Implementation Evaluation
Timeframes for Part II will be agreed upon at a later stage, however planned to tenta-
tively start in March 2013.
6. Desk review and information gathering March 2013
7. Case studies and interviews in Kenya April 2013
8. Draft report mid May 2013
9. Final report end of May 2013
6. Qualifications
The team should consist of senior and junior experts.
The senior consultant should:
Have relevant academic background;
Have experience from organising, leading and reporting on similar assign-
ments;
Have experience from preparing and structuring interviews and preparing and
facilitating workshops;
Have experience and knowledge of development cooperation;
Have excellent knowledge of English (written and spoken)
Merits:
Experience and knowledge of development cooperation in Kenya;
A N N E X 1 – T E R M S O F R E F E R E N C E
52
The junior consultant should:
Have relevant academic background
Have experience from participating in similar assignments;
Be efficient and organised;
Have excellent knowledge of English (written and spoken)
Merits:
Experience and knowledge of development cooperation in Kenya;
References:
Poverty and Development Assessment-Guidance and Outline, Sida
Strategy for development cooperation with Kenya 2009-2013
Mid-Term Review 2011
Kenya Joint Assistance Strategy (KJAS)
Economic Recovery Strategy for Wealth and Employment Creation
(ERSWEC) 2003-2007
Vision 2030
Medium Term Plan 2008-2012 and Annual Progress reports of the MTP
Draft MTP 2013-2017
Strategy reports, 2009-2012
Portfolio Analysis 2012
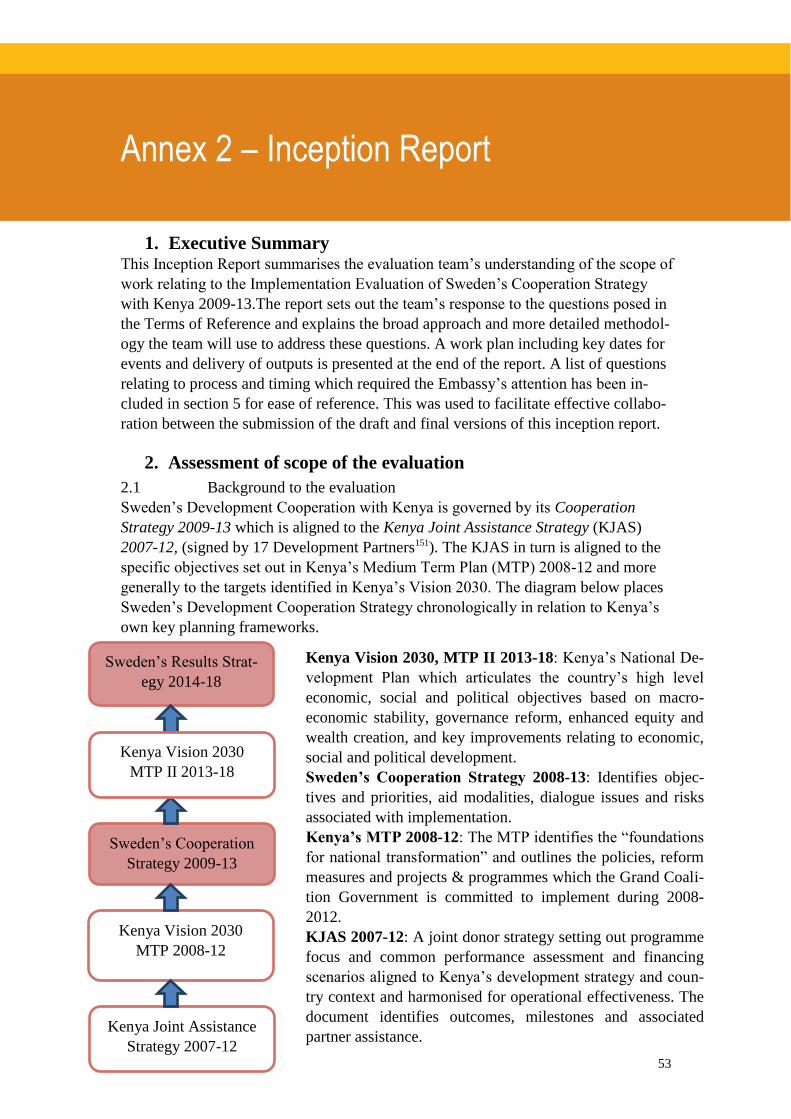
53
Kenya Vision 2030, MTP II 2013-18: Kenya’s National De-
velopment Plan which articulates the country’s high level
economic, social and political objectives based on macro-
economic stability, governance reform, enhanced equity and
wealth creation, and key improvements relating to economic,
social and political development.
Sweden’s Cooperation Strategy 2008-13: Identifies objec-
tives and priorities, aid modalities, dialogue issues and risks
associated with implementation.
Kenya’s MTP 2008-12: The MTP identifies the “foundations
for national transformation” and outlines the policies, reform
measures and projects & programmes which the Grand Coali-
tion Government is committed to implement during 2008-
2012.
KJAS 2007-12: A joint donor strategy setting out programme
focus and common performance assessment and financing
scenarios aligned to Kenya’s development strategy and coun-
try context and harmonised for operational effectiveness. The
document identifies outcomes, milestones and associated
partner assistance.
Annex 2 – Inception Report
1. Executive Summary This Inception Report summarises the evaluation team’s understanding of the scope of
work relating to the Implementation Evaluation of Sweden’s Cooperation Strategy
with Kenya 2009-13.The report sets out the team’s response to the questions posed in
the Terms of Reference and explains the broad approach and more detailed methodol-
ogy the team will use to address these questions. A work plan including key dates for
events and delivery of outputs is presented at the end of the report. A list of questions
relating to process and timing which required the Embassy’s attention has been in-
cluded in section 5 for ease of reference. This was used to facilitate effective collabo-
ration between the submission of the draft and final versions of this inception report.
2. Assessment of scope of the evaluation
2.1 Background to the evaluation
Sweden’s Development Cooperation with Kenya is governed by its Cooperation
Strategy 2009-13 which is aligned to the Kenya Joint Assistance Strategy (KJAS)
2007-12, (signed by 17 Development Partners151). The KJAS in turn is aligned to the
specific objectives set out in Kenya’s Medium Term Plan (MTP) 2008-12 and more
generally to the targets identified in Kenya’s Vision 2030. The diagram below places
Sweden’s Development Cooperation Strategy chronologically in relation to Kenya’s
own key planning frameworks.
Kenya Vision 2030
MTP 2008-12
Sweden’s Results Strat-
egy 2014-18
Sweden’s Cooperation
Strategy 2009-13
Kenya Joint Assistance
Strategy 2007-12
Kenya Vision 2030
MTP II 2013-18
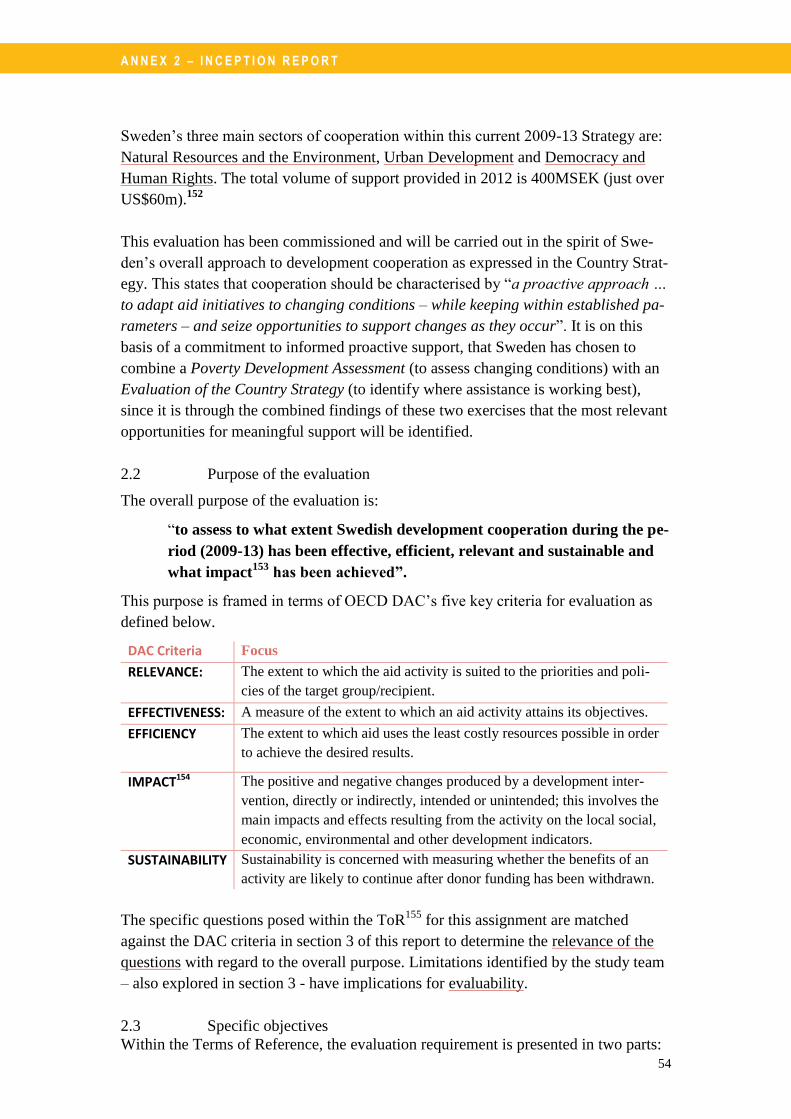
A N N E X 2 – I N C E P T I O N R E P O R T
54
Sweden’s three main sectors of cooperation within this current 2009-13 Strategy are:
Natural Resources and the Environment, Urban Development and Democracy and
Human Rights. The total volume of support provided in 2012 is 400MSEK (just over
US$60m).152
This evaluation has been commissioned and will be carried out in the spirit of Swe-
den’s overall approach to development cooperation as expressed in the Country Strat-
egy. This states that cooperation should be characterised by “a proactive approach …
to adapt aid initiatives to changing conditions – while keeping within established pa-
rameters – and seize opportunities to support changes as they occur”. It is on this
basis of a commitment to informed proactive support, that Sweden has chosen to
combine a Poverty Development Assessment (to assess changing conditions) with an
Evaluation of the Country Strategy (to identify where assistance is working best),
since it is through the combined findings of these two exercises that the most relevant
opportunities for meaningful support will be identified.
2.2 Purpose of the evaluation
The overall purpose of the evaluation is:
“to assess to what extent Swedish development cooperation during the pe-
riod (2009-13) has been effective, efficient, relevant and sustainable and
what impact153
has been achieved”.
This purpose is framed in terms of OECD DAC’s five key criteria for evaluation as
defined below.
DAC Criteria Focus
RELEVANCE:
The extent to which the aid activity is suited to the priorities and poli-
cies of the target group/recipient.
EFFECTIVENESS: A measure of the extent to which an aid activity attains its objectives.
EFFICIENCY
The extent to which aid uses the least costly resources possible in order
to achieve the desired results.
IMPACT154
The positive and negative changes produced by a development inter-
vention, directly or indirectly, intended or unintended; this involves the
main impacts and effects resulting from the activity on the local social,
economic, environmental and other development indicators.
SUSTAINABILITY
Sustainability is concerned with measuring whether the benefits of an
activity are likely to continue after donor funding has been withdrawn.
The specific questions posed within the ToR155
for this assignment are matched
against the DAC criteria in section 3 of this report to determine the relevance of the
questions with regard to the overall purpose. Limitations identified by the study team
– also explored in section 3 - have implications for evaluability.
2.3 Specific objectives
Within the Terms of Reference, the evaluation requirement is presented in two parts:
A N N E X 2 – I N C E P T I O N R E P O R T
55
1. A Poverty and Development Assessment
2. An Implementation Evaluation
It is intended that the results of both of these analyses will be fed into Sweden’s new
Results Strategy for 2014-18.
Broadly, the Poverty and Development Assessment will have succeeded if it:
Provides a basis for the country team to synthesise evidence and assume an
overarching perspective on how it intends to respond to poverty and vulner-
ability in Kenya;
Reaches conclusions on fundamental development challenges and opportuni-
ties (and in particular needed development efforts);
Maps development partners in terms of their role as agents of change;
Identifies against this backdrop, Sweden’s particular added value.
Broadly, the Implementation Evaluation will have succeeded if it assesses:
Progress towards Sweden’s overall strategic objectives, sector objectives and
the extent to which results (planned or unplanned) have been achieved;
The extent to which dialogue has contributed to the achievement of strategic
and sectoral objectives;
The effectiveness, efficiency and relevance of channels for aid (government,
civil society, multilateral) and aid modalities (sector programme, core contri-
bution, programme based approach).
Contributions which have led to achievements that align particularly with the
PDA findings and which can be built upon within the new Results Strategy.
2.4 Scope of work for the Evaluation Assignment
The overall scope of work is framed by the two parts of the assignment as described
above and each will involve four types of activity:
Synthesis of the documentation available for the PDA and for the evaluation
(results assessment);
Workshops/focus group discussions to present and expand on findings gener-
ated through the PDA desk work initially and later through the combined PDA
and evaluation/results assessment;
Case studies to explore how the sector portfolios reflect the underlying causes
of poverty analysed in the PDA, to assess the efficiencies/effectiveness of dif-
ferent modalities and channels, and to expand and deepen the findings of the
results assessment as part of the evaluation;
Report writing to produce an interim PDA report initially and later a Final Im-
plementation Evaluation Report (incorporating the main findings from the
PDA). The PDA component of the work will involve synthesis, interviews, a validation
workshop and report writing. The report will be presented following the structure set
A N N E X 2 – I N C E P T I O N R E P O R T
56
out in the Terms of Reference which appropriately draws on Sida’s Poverty and De-
velopment Assessment Guidelines and Annex I to these Guidelines: Outline of a PDA:
1 Country context.
2 Who are the poor and vulnerable and what are the factors that lead to poverty
and vulnerability?
3 Opportunities for development.
4 The Government’s commitments and actions.
5 Mapping of development cooperation and key actors in Kenya.
6 Sweden’s role.
7 Conclusions.
This will produce an overarching PDA report designed to inform the forthcoming
Swedish Results Strategy 2014-18. The focus of the PDA will not be particular sec-
tors but the underlying causes of poverty, structural obstacles to development as well
as triggers for development in Kenya (rather than a general facts and figures sum-
mary, which would tend to illustrate the symptoms of poverty). The PDA will seek to
connect these findings on underlying causes and development triggers to the overall
development partner landscape and so assist Sweden’s strategic decision making with
regard to the identification of future cooperation priorities and associated key results.
The implementation evaluation will involve synthesis, focus group discussions,
interviews with partners and stakeholders, a validation workshop and report writing.
The work will incorporate two approaches:
an analysis of results recorded against the strategic and sectoral objectives and
targets set out in the results matrix and
a closer look at selected case studies from Sweden’s sectoral portfolios in or-
der to more deeply explore specific contributions.
In line with the Country Strategy, the evaluation will focus on three sectors identified
in the current cooperation strategy: democratic governance, natural resources and the
environment, and urban development.156
The final evaluation report will provide evi-
dence related to impact, sustainability, effectiveness, efficiency, relevance and design
(including a consideration of the Theory of Change)– in line with the overall purpose
and the specific tasks outlined in the ToR. The relationship between the specific ques-
tions asked in the ToR and the overall purpose are explored more fully in section 3
below.
2.5 Work plan and timeline
A detailed work plan is provided as Annex II and highlights the following key dates
and deadlines:
15 February: Submission of Inception Report to Embassy
21-22 March: PDA Validation Workshop, Nairobi
25-27 March: Sector Focused Group Discussions/ interviews, Nairobi
19 April : Draft PDA
A N N E X 2 – I N C E P T I O N R E P O R T
57
30 April: Final PDA
w/b 13th May Case Study Interviews, Nairobi
w/b 20th May Results Validation Workshop, Nairobi
31 May: Final Draft Report
15 June: Final Report
The evaluation team recognises the need to be flexible with regard to these dates and
timings, particularly given the possibility of disruption in the period around elections
in Kenya. Furthermore, holidays and absences may well require some of the dates
proposed above to be changed. The Embassy has been invited to suggest changes in
order to find best-fit with wider commitments and circumstances (see section 5 be-
low). In order that there is appropriate time for workshop and meeting preparation,
any change to the March events should be later rather than sooner.
3. Relevance and evaluability of evaluation questions
3.1 Relevance of evaluation questions
The framework below aligns questions raised in the ToRs with the DAC criteria in-
corporated in the overall purpose statement and provides a headline on the ap-
proach/method that will be used to answer them. These approaches are explained
more fully in section 4.
DAC Criteria Questions (from ToR) Approach (Method)
Effectiveness o What are the main results achieved against
outcomes in relation to the sector objec-
tives?
o Did contributions deliver as planned?
o What is the experience and lessons learned
from policy work?
Desk review
Focus group discussions
Interviews
Validation workshop
Efficiency o Has dialogue strengthened the results of the
contributions?
o What have been the challenges and suc-
cesses with regard to donor cooperation?
o Why are different sectors using different
cooperation channels?
o What are the relative benefits of different
aid modalities?
Desk review
Interviews.
Validation workshop
Relevance o Are the different sector portfolios well-
designed to reach the poorest, most under-
served areas?
o Has the prioritisation based on Vision 2030
and KJAS led to relevant support?
Desk review
Focus group discussions
Sustainability o Are the contributions sustainable?
o Has the prioritisation based on Vision 2030
and KJAS led to sustainable support?
Desk review
Interviews
Focus group discussions
Impact o What impact has been achieved towards the
overall strategic objectives?
o What is the collective (aggregated) contribu-
tion of case studies to the strategy?
Desk review
Focus group discussions
Validation workshop
A N N E X 2 – I N C E P T I O N R E P O R T
58
Design o Is there a systematic approach to formulat-
ing a theory of change?
o How has the rights perspective been applied
within each sector?
o How have the poor people’s perspectives
been applied within each sector?
o How have thematic priorities been incorpo-
rated into each sector?
Desk review
Interviews
Focus group discussions
3.2 Evaluability of the questions
The evaluability of the questions listed above is best judged against the balance be-
tween existing secondary data sources and time available for the team to gather data
through interview.
Initial reflections on data availability suggest some possible limitations to our work.
Our response to these anticipated limitations is to balance our approach from the start
blending desk research157
with data gathering through interviews, group discussions
and workshops and case study review. In this way we intend to get as far as possible
towards providing robust answers to the questions posed while at the same time alert-
ing the Embassy to any gaps in the evidence base which could in future be filled
through enhanced reporting or recording arrangements.
However, it appears prudent to point out at this stage that despite the intent to consult
as widely as possible (through individual interviews and group discussions), time
available for new data gathering will inevitably be limited and it will be unrealistic to
expect that the team will be able to fill major data gaps through interviews and group
discussions or that significant inferences can be drawn from aggregations based on a
case study approach.
Also, the evaluation team notes that some of the issues may have a bearing on the
relations between development interventions and the humanitarian portfolio, with the
budget for the latter managed directly by Sida, Sweden. The team has sought clarifi-
cation regarding the extent to which the evaluation should follow up on these aspects
and has been guided to look at the role humanitarian assistance plays in relation to the
overall and more long term work of the development cooperation section. A number
of interviews have been suggested with key stakeholders.
The next section of the report presents the blended approach to evaluation, which we
believe provides the best match between data available and overall objectives.
4. Proposed approach and methodology
This section of the inception report explains the proposed approach to each part of the
assignment, the Poverty and Development Assessment and the Implementation Eval-
uation.
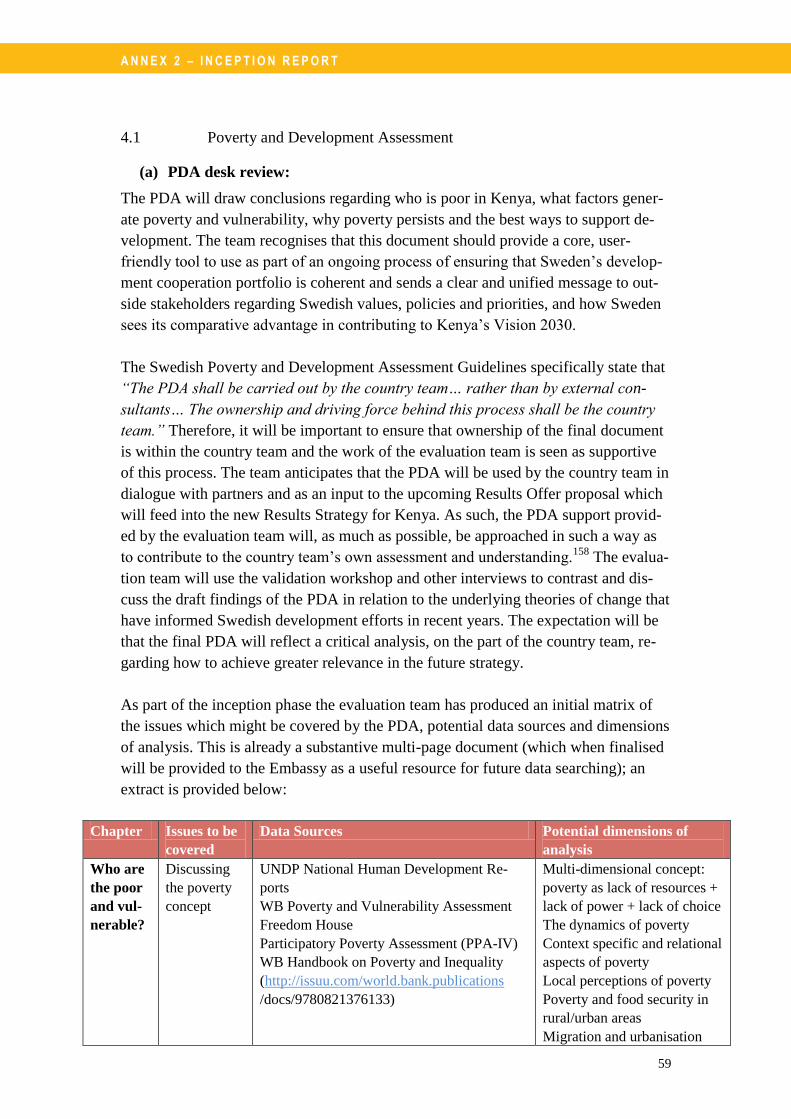
A N N E X 2 – I N C E P T I O N R E P O R T
59
4.1 Poverty and Development Assessment
(a) PDA desk review:
The PDA will draw conclusions regarding who is poor in Kenya, what factors gener-
ate poverty and vulnerability, why poverty persists and the best ways to support de-
velopment. The team recognises that this document should provide a core, user-
friendly tool to use as part of an ongoing process of ensuring that Sweden’s develop-
ment cooperation portfolio is coherent and sends a clear and unified message to out-
side stakeholders regarding Swedish values, policies and priorities, and how Sweden
sees its comparative advantage in contributing to Kenya’s Vision 2030.
The Swedish Poverty and Development Assessment Guidelines specifically state that
“The PDA shall be carried out by the country team… rather than by external con-
sultants… The ownership and driving force behind this process shall be the country
team.” Therefore, it will be important to ensure that ownership of the final document
is within the country team and the work of the evaluation team is seen as supportive
of this process. The team anticipates that the PDA will be used by the country team in
dialogue with partners and as an input to the upcoming Results Offer proposal which
will feed into the new Results Strategy for Kenya. As such, the PDA support provid-
ed by the evaluation team will, as much as possible, be approached in such a way as
to contribute to the country team’s own assessment and understanding.158
The evalua-
tion team will use the validation workshop and other interviews to contrast and dis-
cuss the draft findings of the PDA in relation to the underlying theories of change that
have informed Swedish development efforts in recent years. The expectation will be
that the final PDA will reflect a critical analysis, on the part of the country team, re-
garding how to achieve greater relevance in the future strategy.
As part of the inception phase the evaluation team has produced an initial matrix of
the issues which might be covered by the PDA, potential data sources and dimensions
of analysis. This is already a substantive multi-page document (which when finalised
will be provided to the Embassy as a useful resource for future data searching); an
extract is provided below:
Chapter Issues to be
covered
Data Sources Potential dimensions of
analysis
Who are
the poor
and vul-
nerable?
Discussing
the poverty
concept
UNDP National Human Development Re-
ports
WB Poverty and Vulnerability Assessment
Freedom House
Participatory Poverty Assessment (PPA-IV)
WB Handbook on Poverty and Inequality
(http://issuu.com/world.bank.publications
/docs/9780821376133)
Multi-dimensional concept:
poverty as lack of resources +
lack of power + lack of choice
The dynamics of poverty
Context specific and relational
aspects of poverty
Local perceptions of poverty
Poverty and food security in
rural/urban areas
Migration and urbanisation
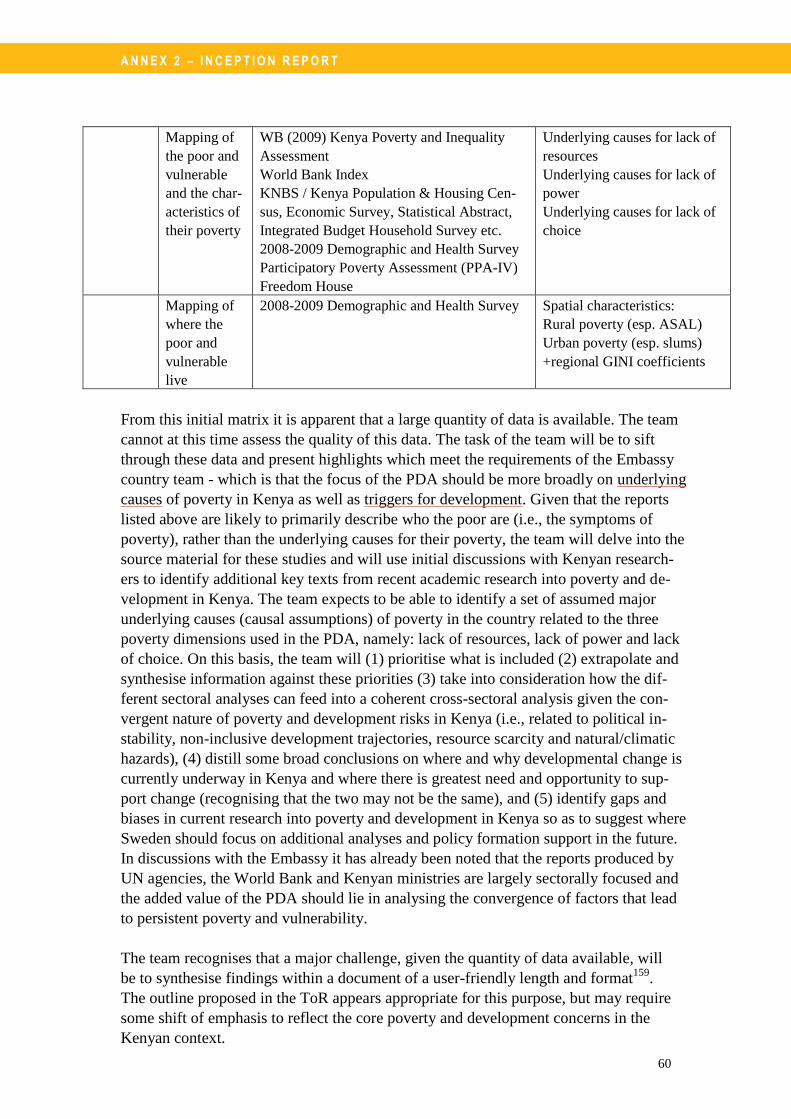
A N N E X 2 – I N C E P T I O N R E P O R T
60
Mapping of
the poor and
vulnerable
and the char-
acteristics of
their poverty
WB (2009) Kenya Poverty and Inequality
Assessment
World Bank Index
KNBS / Kenya Population & Housing Cen-
sus, Economic Survey, Statistical Abstract,
Integrated Budget Household Survey etc.
2008-2009 Demographic and Health Survey
Participatory Poverty Assessment (PPA-IV)
Freedom House
Underlying causes for lack of
resources
Underlying causes for lack of
power
Underlying causes for lack of
choice
Mapping of
where the
poor and
vulnerable
live
2008-2009 Demographic and Health Survey
Spatial characteristics:
Rural poverty (esp. ASAL)
Urban poverty (esp. slums)
+regional GINI coefficients
From this initial matrix it is apparent that a large quantity of data is available. The team
cannot at this time assess the quality of this data. The task of the team will be to sift
through these data and present highlights which meet the requirements of the Embassy
country team - which is that the focus of the PDA should be more broadly on underlying
causes of poverty in Kenya as well as triggers for development. Given that the reports
listed above are likely to primarily describe who the poor are (i.e., the symptoms of
poverty), rather than the underlying causes for their poverty, the team will delve into the
source material for these studies and will use initial discussions with Kenyan research-
ers to identify additional key texts from recent academic research into poverty and de-
velopment in Kenya. The team expects to be able to identify a set of assumed major
underlying causes (causal assumptions) of poverty in the country related to the three
poverty dimensions used in the PDA, namely: lack of resources, lack of power and lack
of choice. On this basis, the team will (1) prioritise what is included (2) extrapolate and
synthesise information against these priorities (3) take into consideration how the dif-
ferent sectoral analyses can feed into a coherent cross-sectoral analysis given the con-
vergent nature of poverty and development risks in Kenya (i.e., related to political in-
stability, non-inclusive development trajectories, resource scarcity and natural/climatic
hazards), (4) distill some broad conclusions on where and why developmental change is
currently underway in Kenya and where there is greatest need and opportunity to sup-
port change (recognising that the two may not be the same), and (5) identify gaps and
biases in current research into poverty and development in Kenya so as to suggest where
Sweden should focus on additional analyses and policy formation support in the future.
In discussions with the Embassy it has already been noted that the reports produced by
UN agencies, the World Bank and Kenyan ministries are largely sectorally focused and
the added value of the PDA should lie in analysing the convergence of factors that lead
to persistent poverty and vulnerability.
The team recognises that a major challenge, given the quantity of data available, will
be to synthesise findings within a document of a user-friendly length and format159
.
The outline proposed in the ToR appears appropriate for this purpose, but may require
some shift of emphasis to reflect the core poverty and development concerns in the
Kenyan context.
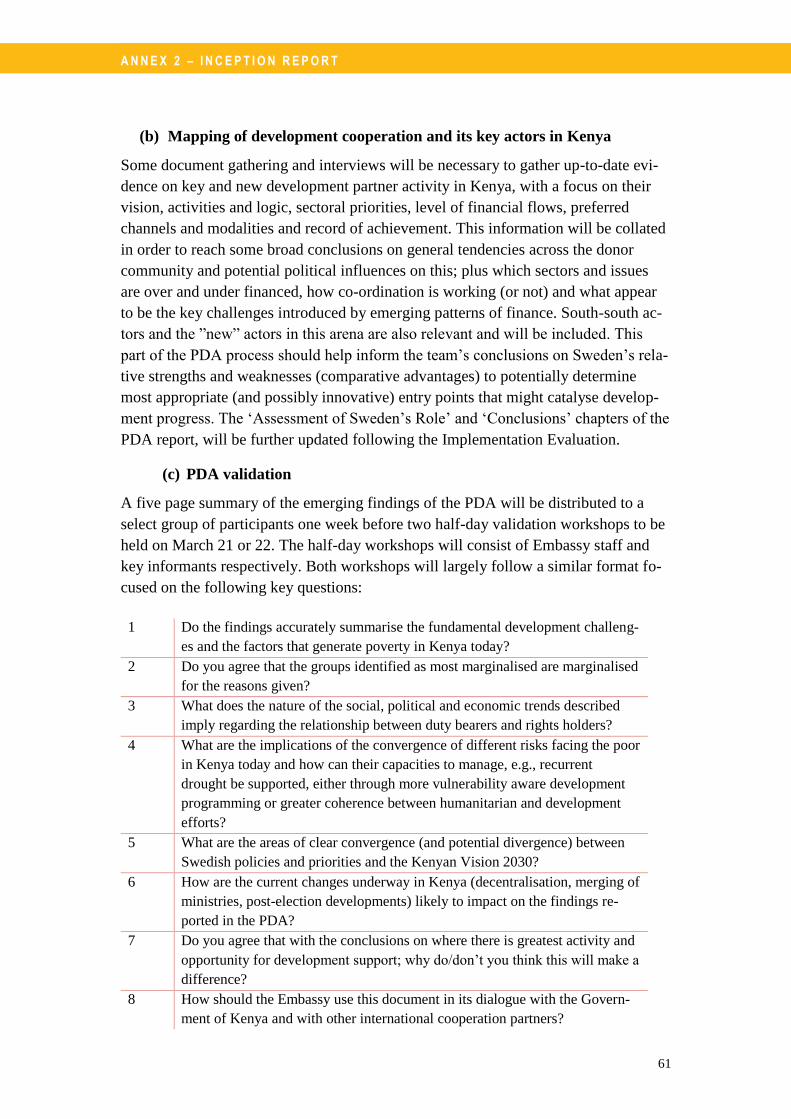
A N N E X 2 – I N C E P T I O N R E P O R T
61
(b) Mapping of development cooperation and its key actors in Kenya
Some document gathering and interviews will be necessary to gather up-to-date evi-
dence on key and new development partner activity in Kenya, with a focus on their
vision, activities and logic, sectoral priorities, level of financial flows, preferred
channels and modalities and record of achievement. This information will be collated
in order to reach some broad conclusions on general tendencies across the donor
community and potential political influences on this; plus which sectors and issues
are over and under financed, how co-ordination is working (or not) and what appear
to be the key challenges introduced by emerging patterns of finance. South-south ac-
tors and the ”new” actors in this arena are also relevant and will be included. This
part of the PDA process should help inform the team’s conclusions on Sweden’s rela-
tive strengths and weaknesses (comparative advantages) to potentially determine
most appropriate (and possibly innovative) entry points that might catalyse develop-
ment progress. The ‘Assessment of Sweden’s Role’ and ‘Conclusions’ chapters of the
PDA report, will be further updated following the Implementation Evaluation.
(c) PDA validation
A five page summary of the emerging findings of the PDA will be distributed to a
select group of participants one week before two half-day validation workshops to be
held on March 21 or 22. The half-day workshops will consist of Embassy staff and
key informants respectively. Both workshops will largely follow a similar format fo-
cused on the following key questions:
1 Do the findings accurately summarise the fundamental development challeng-
es and the factors that generate poverty in Kenya today?
2 Do you agree that the groups identified as most marginalised are marginalised
for the reasons given?
3 What does the nature of the social, political and economic trends described
imply regarding the relationship between duty bearers and rights holders?
4 What are the implications of the convergence of different risks facing the poor
in Kenya today and how can their capacities to manage, e.g., recurrent
drought be supported, either through more vulnerability aware development
programming or greater coherence between humanitarian and development
efforts?
5 What are the areas of clear convergence (and potential divergence) between
Swedish policies and priorities and the Kenyan Vision 2030?
6 How are the current changes underway in Kenya (decentralisation, merging of
ministries, post-election developments) likely to impact on the findings re-
ported in the PDA?
7 Do you agree that with the conclusions on where there is greatest activity and
opportunity for development support; why do/don’t you think this will make a
difference?
8 How should the Embassy use this document in its dialogue with the Govern-
ment of Kenya and with other international cooperation partners?

A N N E X 2 – I N C E P T I O N R E P O R T
62
(d) PDA Report
The PDA Report will be presented following the structure outlined above and in the
ToR.
4.2 Implementation Evaluation
(a) Results Matrix: desk study
Using an analysis of the alignment among the findings of the PDA, the Country Strat-
egy and the Results Matrix as the starting point, the evaluation team will assess a
broad range of available secondary data to build on the findings of the Portfolio Re-
view160
(already completed) to address the relevance and design questions presented
in the ToR. The documentation review will in particular seek to understand and com-
pare the theories of change that have emerged in the different initiatives and analyse
the extent to which these constitute an evidence based and coherent perspective by
the country team on how its portfolio is addressing key development concerns, par-
ticularly how poverty is perceived and conceptualised. The draft PDA will be used as
a tool to stimulate reflection.
To note that a working assumption of the evaluation is that, given the volatile situa-
tion in Kenya in recent years, the original country strategy may be in some respects a
‘historic artefact’ in 2013.
In order to collate evidence on effectiveness and impact, the team will (1) review se-
lected texts that have been identified during the PDA process that directly relate to the
thematic outcome objectives in the country strategy; (2) review documentation pro-
vided by the Embassy prior to the evaluation getting underway; (3) alert sector leads
to gaps in information available to identify any other possible sources.
In order to assess efficiency, the team will (1) review available recent analyses of the
role of different actors in Kenyan development cooperation, with special attention to
new donors and emergent forms of cooperation, also the role of dialogue in Kenyan
development cooperation; (2) review the findings of the PDA; (3) review documenta-
tion on Swedish development cooperation in Kenya, with an emphasis on the selected
case study projects (criteria presented below) and other reports that critically analyse
the results and challenges of using different channels and modalities; and (4) review
monitoring data collected as part of the follow-up to the results matrix.
(b) Channels and Modalities
A key area that will be explored, primarily through critical analysis of the documenta-
tion available but also through interviews, will be the modalities and channels of de-
livery for development cooperation, with a focus on the relative efficiency and effec-
tiveness of these modalities and channels and the extent to which they support owner-
ship and sustainability. It should be noted, however, that the team is unlikely to be
able to gather data to allow for a verifiable comparative analysis. However, the fol-

A N N E X 2 – I N C E P T I O N R E P O R T
63
lowing aspects will be explored in order to draw conclusions about how the Embassy
may be able to make more effective use of its resources through better selection of
channels and modalities in relation to intended purposes.
The following four issues will be explored (partly through interviews with Embassy
staff):
Partner and modality selection in relation to the purpose of the funded initia-
tive: How rigorous are the assessments of potential? Are different options
compared and valued? Are transaction costs discussed against the added value
of the intermediaries? Are strategic alliances sought? Is there a set of criteria
used for assessments? What consideration is given to selecting partners with a
focus on high risk geographic areas?
Quality/ value of services provided and the extent to which this is related to
the nature of the support channel and modality: To the extent possible, the
team will strive to discern the extent to which a given modality or channel is
more or less effective in terms of technical assistance, dialogue facilitation,
policy advice or other types of tasks.
Extent to which dialogue with and via partners has facilitated alignment with
Kenyan priorities and donor harmonisation: The team will explore how choice
of channels and modalities has reflected and buttressed Swedish commitments
to aid effectiveness and has contributed to broader aid harmonisation.
Utility of the current results matrix: Through discussions with the Embassy
staff, the evaluation team will assess the extent to which the results matrix has
been utilised and if it has been found to be a useful and relevant tool for moni-
toring and dialogue with partners, with an intention to identify ways that it
may be improved in the future.
The team will develop a semi-structured interview schedule in order to gather and
collate this information.
(c) Selection of the case studies
Contributions (projects or programmes) for case studies will be chosen from each of
the three sectors in the country strategy (three from Natural Resources and Environ-
ment, two from Urban Development and three from Democratic Governance and
Human Rights). This selection will be made during the PDA phase in dialogue with
the Embassy. The following criteria are proposed for selecting the case studies.
1. Contributions will have been decided upon161
between 2009 and 2010 to re-
flect priorities in the current strategy and will have progressed to the extent
that a significant level of outcomes has been achieved.
2. The contributions will have been evaluated and/or had MTRs conducted that
have focused on outcomes. It will also be important that a full range of other
documentation is made available to the evaluation team for the selected con-
tributions as soon as these are chosen.
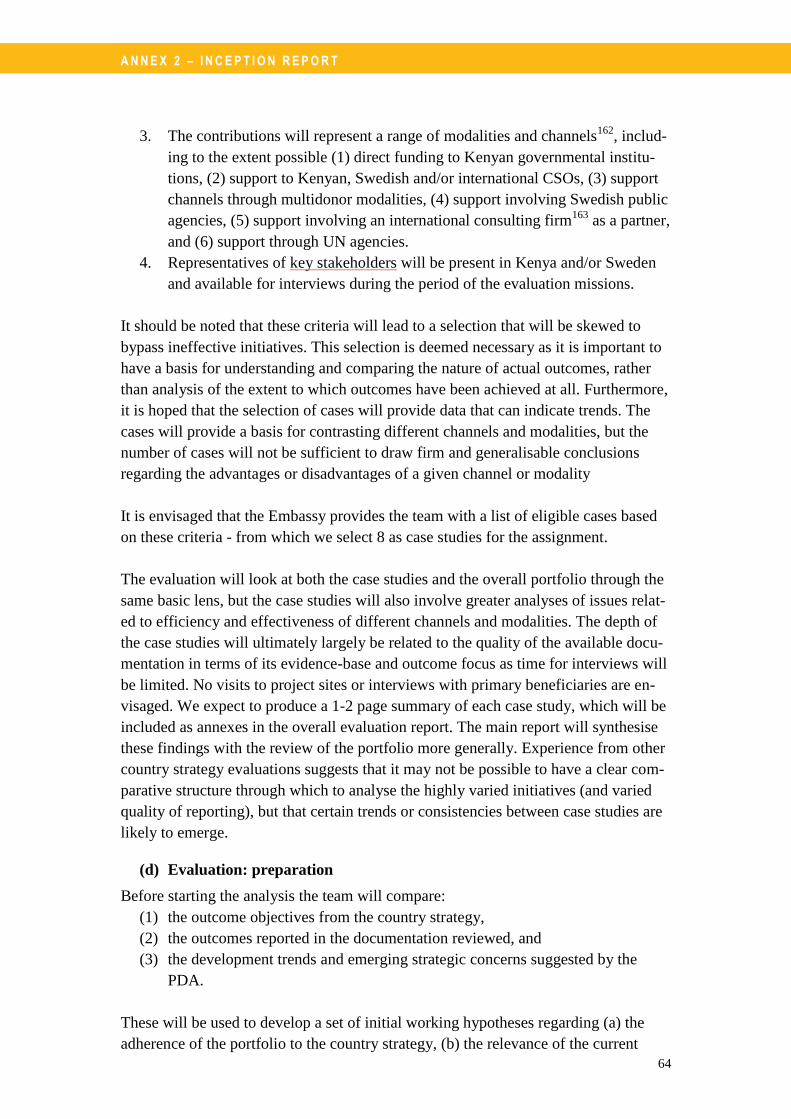
A N N E X 2 – I N C E P T I O N R E P O R T
64
3. The contributions will represent a range of modalities and channels162
, includ-
ing to the extent possible (1) direct funding to Kenyan governmental institu-
tions, (2) support to Kenyan, Swedish and/or international CSOs, (3) support
channels through multidonor modalities, (4) support involving Swedish public
agencies, (5) support involving an international consulting firm163
as a partner,
and (6) support through UN agencies.
4. Representatives of key stakeholders will be present in Kenya and/or Sweden
and available for interviews during the period of the evaluation missions.
It should be noted that these criteria will lead to a selection that will be skewed to
bypass ineffective initiatives. This selection is deemed necessary as it is important to
have a basis for understanding and comparing the nature of actual outcomes, rather
than analysis of the extent to which outcomes have been achieved at all. Furthermore,
it is hoped that the selection of cases will provide data that can indicate trends. The
cases will provide a basis for contrasting different channels and modalities, but the
number of cases will not be sufficient to draw firm and generalisable conclusions
regarding the advantages or disadvantages of a given channel or modality
It is envisaged that the Embassy provides the team with a list of eligible cases based
on these criteria - from which we select 8 as case studies for the assignment.
The evaluation will look at both the case studies and the overall portfolio through the
same basic lens, but the case studies will also involve greater analyses of issues relat-
ed to efficiency and effectiveness of different channels and modalities. The depth of
the case studies will ultimately largely be related to the quality of the available docu-
mentation in terms of its evidence-base and outcome focus as time for interviews will
be limited. No visits to project sites or interviews with primary beneficiaries are en-
visaged. We expect to produce a 1-2 page summary of each case study, which will be
included as annexes in the overall evaluation report. The main report will synthesise
these findings with the review of the portfolio more generally. Experience from other
country strategy evaluations suggests that it may not be possible to have a clear com-
parative structure through which to analyse the highly varied initiatives (and varied
quality of reporting), but that certain trends or consistencies between case studies are
likely to emerge.
(d) Evaluation: preparation
Before starting the analysis the team will compare:
(1) the outcome objectives from the country strategy,
(2) the outcomes reported in the documentation reviewed, and
(3) the development trends and emerging strategic concerns suggested by the
PDA.
These will be used to develop a set of initial working hypotheses regarding (a) the
adherence of the portfolio to the country strategy, (b) the relevance of the current
A N N E X 2 – I N C E P T I O N R E P O R T
65
strategy to Kenyan goals (Vision 2030) and needs, and (c) emerging unexpected out-
comes of Swedish support. These will be explored in relation the overall portfolio,
but with specific analysis of the selected case study initiatives. These findings will
guide the subsequent evaluation.
(e) Data collection
Data will be collected through interviews and focus group meetings with relevant
stakeholders and informed experts (i.e., non-stakeholders with an in depth under-
standing of trends in the three sectors), including partners (consulting firms, govern-
ment institutions and CSOs) and other donors. Regarding the latter, the evaluation
team includes those individuals who have been supported by Sweden in relation to
policy analysis and development. The Embassy will be asked to inform stakeholders
about the evaluation, and/or provide the evaluation team with project/programme and
other stakeholder contact details. The team will request recommendations from the
Embassy to determine participant and interview lists.
Shortly after the validation workshop for the PDA, the evaluation team will hold six
focus group meetings –three with stakeholders (one per sector) and three with in-
formed experts (again, one from each of the three sectors). The workshops will be
followed by in-depth semi-structured interviews with stakeholders from the eight se-
lected projects and other selected key informants (including Kenyan government
staff, other donor representatives, and researchers with an overview of the sectors).
Interviews will also be made with programme officers at the Embassy. Some inter-
views will be undertaken during the first team visit and others will be undertaken in
the second visit in May.
The focus group meetings and subsequent interviews will largely follow a participa-
tory outcome harvesting approach164
, whereby the evaluation team will collect and
compare ‘outcome descriptors’, i.e., the perceived outcomes and potential outcomes
of Swedish support. The stakeholders will be asked about the ‘formal’ theories of
change that have guided the initiatives and the implicit assumptions about how these
programmes have or were expected to contribute to Kenyan development. The other
key informants will be asked about their perspectives on the relevance of these theo-
ries of change in light of the broader trends in Kenyan development and in Kenyan
development cooperation.
Those involved with policy analyses on behalf of the Embassy will be encouraged to
reflect on if and how their work has contributed to better understanding of how the port-
folio can contribute to addressing core development challenges. The original outcome
objectives will be assessed in relation to three, triangulated sets of perceptions; those of
the Embassy, project/programme stakeholders and informed experts. The overall ap-
proach will be informed by current thinking on causality and contribution analysis.165
In summary, the approach will include the following steps:
The desk study of existing documentation described above.
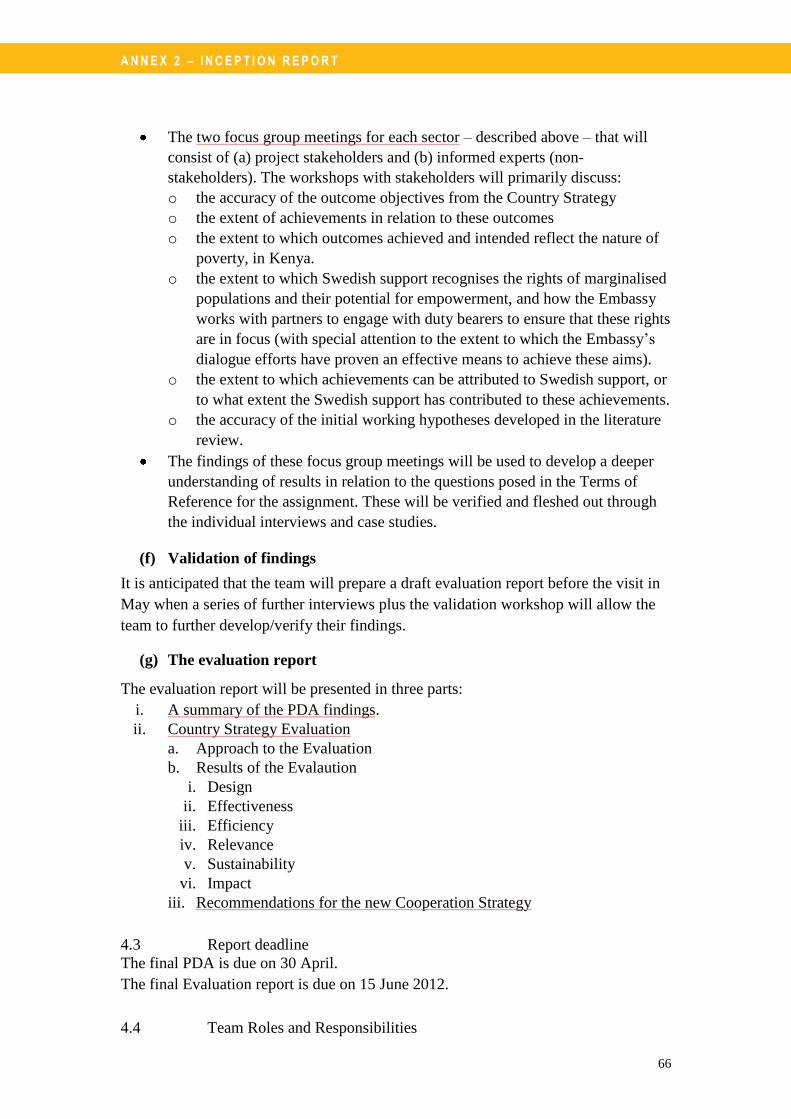
A N N E X 2 – I N C E P T I O N R E P O R T
66
The two focus group meetings for each sector – described above – that will
consist of (a) project stakeholders and (b) informed experts (non-
stakeholders). The workshops with stakeholders will primarily discuss:
o the accuracy of the outcome objectives from the Country Strategy
o the extent of achievements in relation to these outcomes
o the extent to which outcomes achieved and intended reflect the nature of
poverty, in Kenya.
o the extent to which Swedish support recognises the rights of marginalised
populations and their potential for empowerment, and how the Embassy
works with partners to engage with duty bearers to ensure that these rights
are in focus (with special attention to the extent to which the Embassy’s
dialogue efforts have proven an effective means to achieve these aims).
o the extent to which achievements can be attributed to Swedish support, or
to what extent the Swedish support has contributed to these achievements.
o the accuracy of the initial working hypotheses developed in the literature
review.
The findings of these focus group meetings will be used to develop a deeper
understanding of results in relation to the questions posed in the Terms of
Reference for the assignment. These will be verified and fleshed out through
the individual interviews and case studies.
(f) Validation of findings
It is anticipated that the team will prepare a draft evaluation report before the visit in
May when a series of further interviews plus the validation workshop will allow the
team to further develop/verify their findings.
(g) The evaluation report
The evaluation report will be presented in three parts:
i. A summary of the PDA findings.
ii. Country Strategy Evaluation
a. Approach to the Evaluation
b. Results of the Evalaution
i. Design
ii. Effectiveness
iii. Efficiency
iv. Relevance
v. Sustainability
vi. Impact
iii. Recommendations for the new Cooperation Strategy
4.3 Report deadline
The final PDA is due on 30 April.
The final Evaluation report is due on 15 June 2012.
4.4 Team Roles and Responsibilities
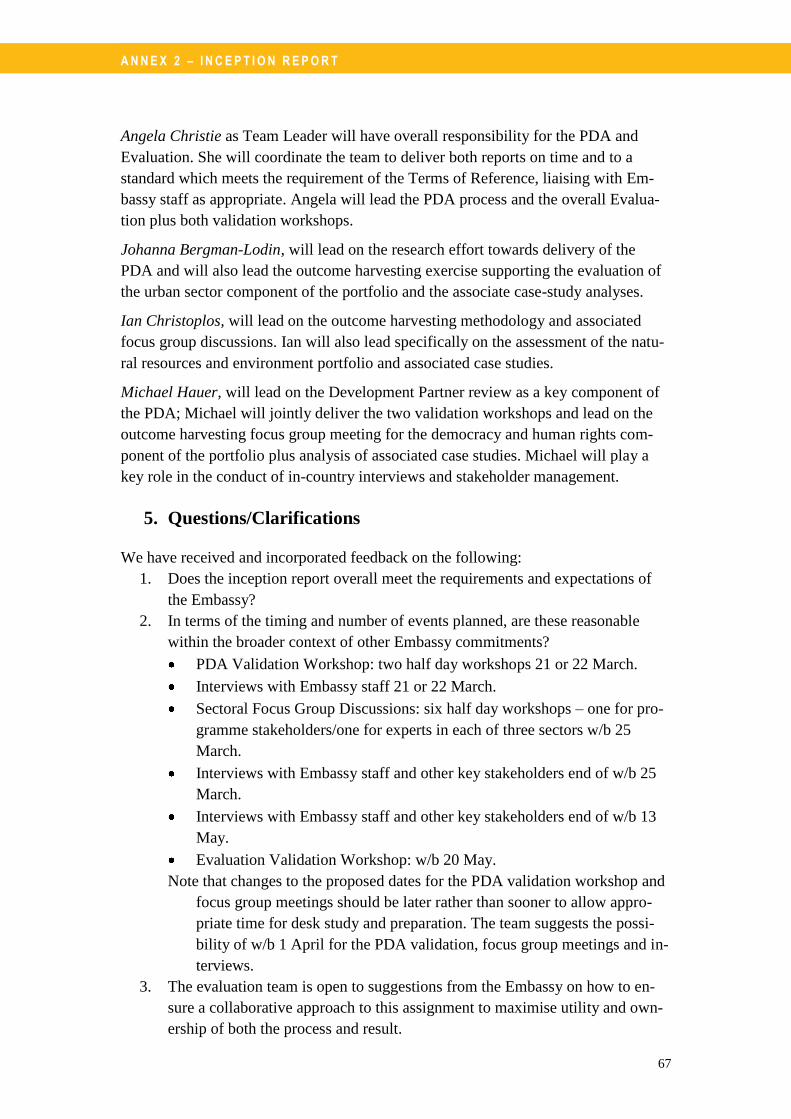
A N N E X 2 – I N C E P T I O N R E P O R T
67
Angela Christie as Team Leader will have overall responsibility for the PDA and
Evaluation. She will coordinate the team to deliver both reports on time and to a
standard which meets the requirement of the Terms of Reference, liaising with Em-
bassy staff as appropriate. Angela will lead the PDA process and the overall Evalua-
tion plus both validation workshops.
Johanna Bergman-Lodin, will lead on the research effort towards delivery of the
PDA and will also lead the outcome harvesting exercise supporting the evaluation of
the urban sector component of the portfolio and the associate case-study analyses.
Ian Christoplos, will lead on the outcome harvesting methodology and associated
focus group discussions. Ian will also lead specifically on the assessment of the natu-
ral resources and environment portfolio and associated case studies.
Michael Hauer, will lead on the Development Partner review as a key component of
the PDA; Michael will jointly deliver the two validation workshops and lead on the
outcome harvesting focus group meeting for the democracy and human rights com-
ponent of the portfolio plus analysis of associated case studies. Michael will play a
key role in the conduct of in-country interviews and stakeholder management.
5. Questions/Clarifications
We have received and incorporated feedback on the following:
1. Does the inception report overall meet the requirements and expectations of
the Embassy?
2. In terms of the timing and number of events planned, are these reasonable
within the broader context of other Embassy commitments?
PDA Validation Workshop: two half day workshops 21 or 22 March.
Interviews with Embassy staff 21 or 22 March.
Sectoral Focus Group Discussions: six half day workshops – one for pro-
gramme stakeholders/one for experts in each of three sectors w/b 25
March.
Interviews with Embassy staff and other key stakeholders end of w/b 25
March.
Interviews with Embassy staff and other key stakeholders end of w/b 13
May.
Evaluation Validation Workshop: w/b 20 May.
Note that changes to the proposed dates for the PDA validation workshop and
focus group meetings should be later rather than sooner to allow appro-
priate time for desk study and preparation. The team suggests the possi-
bility of w/b 1 April for the PDA validation, focus group meetings and in-
terviews.
3. The evaluation team is open to suggestions from the Embassy on how to en-
sure a collaborative approach to this assignment to maximise utility and own-
ership of both the process and result.
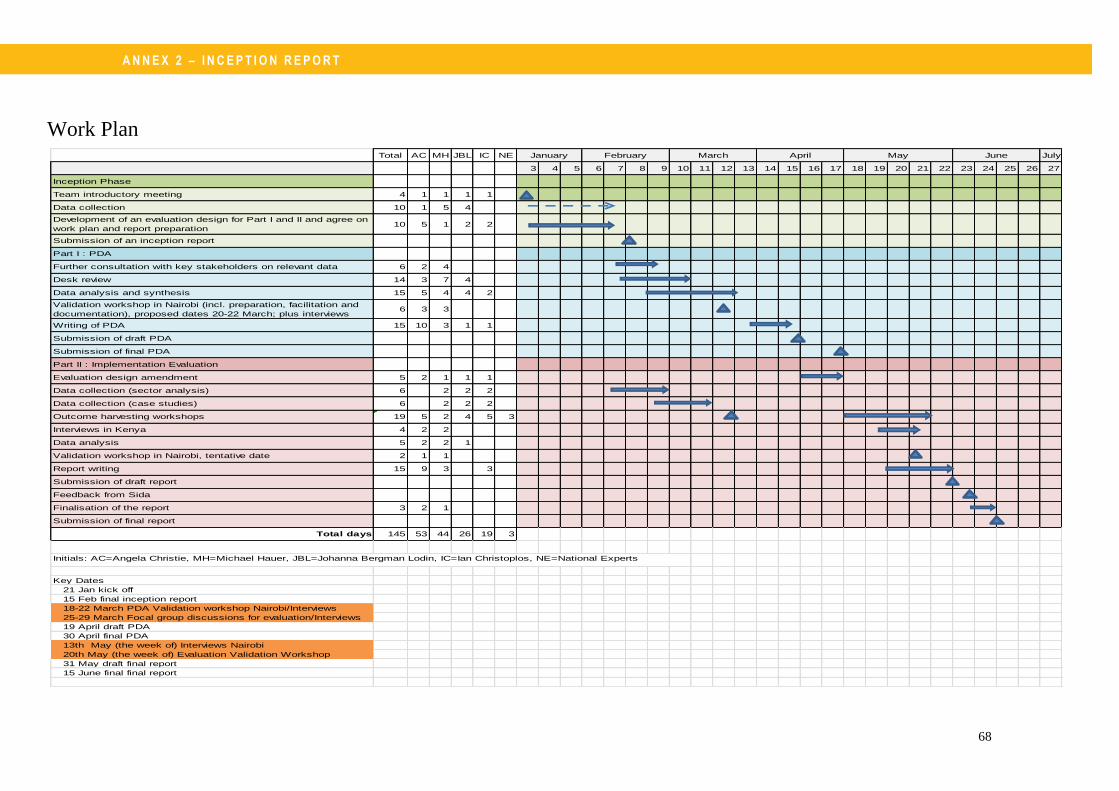
A N N E X 2 – I N C E P T I O N R E P O R T
68
Total AC MH JBL IC NE July
3 4 5 6 7 8 9 10 11 12 13 14 15 16 17 18 19 20 21 22 23 24 25 26 27
Inception Phase
Team introductory meeting 4 1 1 1 1
Data collection 10 1 5 4
Development of an evaluation design for Part I and II and agree on
work plan and report preparation10 5 1 2 2
Submission of an inception report
Part I : PDA
Further consultation with key stakeholders on relevant data 6 2 4
Desk review 14 3 7 4
Data analysis and synthesis 15 5 4 4 2
Validation workshop in Nairobi (incl. preparation, facilitation and
documentation), proposed dates 20-22 March; plus interviews6 3 3
Writing of PDA 15 10 3 1 1
Submission of draft PDA
Submission of final PDA
Part II : Implementation Evaluation
Evaluation design amendment 5 2 1 1 1
Data collection (sector analysis) 6 2 2 2
Data collection (case studies) 6 2 2 2
Outcome harvesting workshops 19 5 2 4 5 3
Interviews in Kenya 4 2 2
Data analysis 5 2 2 1
Validation workshop in Nairobi, tentative date 2 1 1
Report writing 15 9 3 3
Submission of draft report
Feedback from Sida
Finalisation of the report 3 2 1
Submission of final report
Total days 145 53 44 26 19 3
Key Dates
21 Jan kick off
15 Feb final inception report
18-22 March PDA Validation workshop Nairobi/Interviews
25-29 March Focal group discussions for evaluation/Interviews
19 April draft PDA
30 April final PDA
13th May (the week of) Interviews Nairobi
20th May (the week of) Evaluation Validation Workshop
31 May draft final report
15 June final final report
May June
Initials: AC=Angela Christie, MH=Michael Hauer, JBL=Johanna Bergman Lodin, IC=Ian Christoplos, NE=National Experts
January February March April
Work Plan
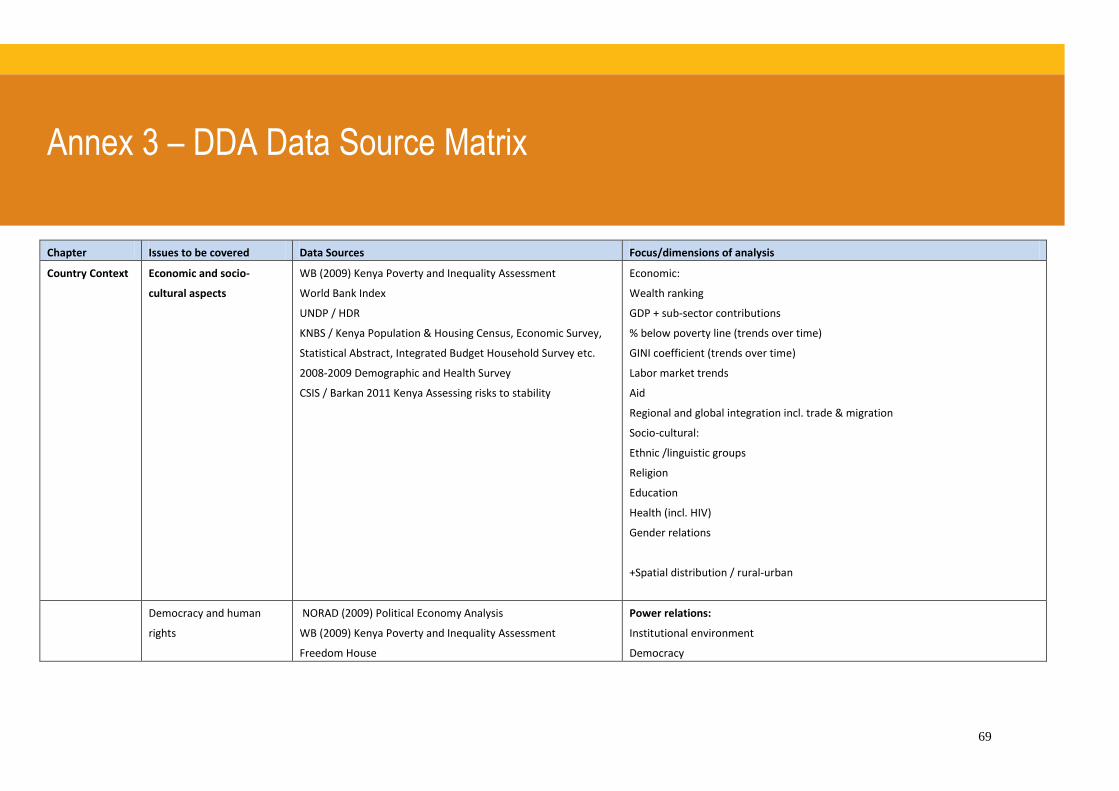
69
Annex 3 – DDA Data Source Matrix
Chapter Issues to be covered Data Sources Focus/dimensions of analysis
Country Context
Economic and socio-
cultural aspects
WB (2009) Kenya Poverty and Inequality Assessment
World Bank Index
UNDP / HDR
KNBS / Kenya Population & Housing Census, Economic Survey,
Statistical Abstract, Integrated Budget Household Survey etc.
2008-2009 Demographic and Health Survey
CSIS / Barkan 2011 Kenya Assessing risks to stability
Economic:
Wealth ranking
GDP + sub-sector contributions
% below poverty line (trends over time)
GINI coefficient (trends over time)
Labor market trends
Aid
Regional and global integration incl. trade & migration
Socio-cultural:
Ethnic /linguistic groups
Religion
Education
Health (incl. HIV)
Gender relations
+Spatial distribution / rural-urban
Democracy and human
rights
NORAD (2009) Political Economy Analysis
WB (2009) Kenya Poverty and Inequality Assessment
Freedom House
Power relations:
Institutional environment
Democracy
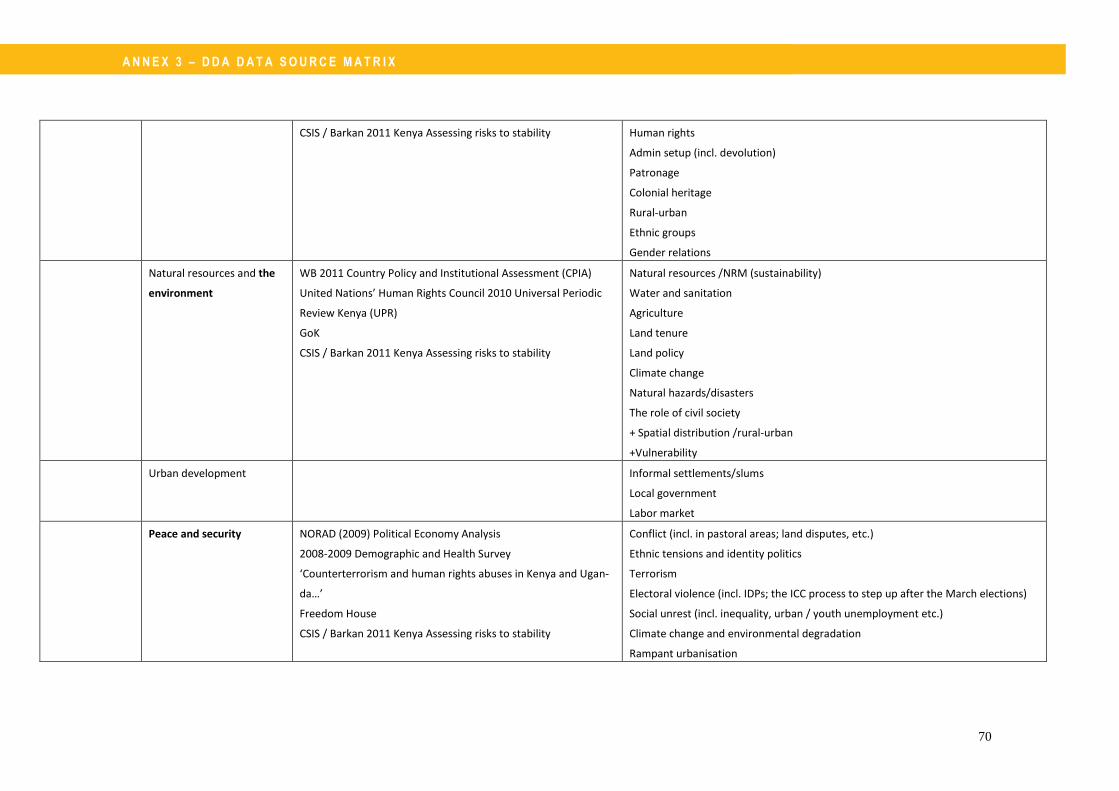
A N N E X 3 – D D A D A T A S O U R C E M A T R I X
70
CSIS / Barkan 2011 Kenya Assessing risks to stability Human rights
Admin setup (incl. devolution)
Patronage
Colonial heritage
Rural-urban
Ethnic groups
Gender relations
Natural resources and the
environment
WB 2011 Country Policy and Institutional Assessment (CPIA)
United Nations’ Human Rights Council 2010 Universal Periodic
Review Kenya (UPR)
GoK
CSIS / Barkan 2011 Kenya Assessing risks to stability
Natural resources /NRM (sustainability)
Water and sanitation
Agriculture
Land tenure
Land policy
Climate change
Natural hazards/disasters
The role of civil society
+ Spatial distribution /rural-urban
+Vulnerability
Urban development Informal settlements/slums
Local government
Labor market
Peace and security NORAD (2009) Political Economy Analysis
2008-2009 Demographic and Health Survey
‘Counterterrorism and human rights abuses in Kenya and Ugan-
da…’
Freedom House
CSIS / Barkan 2011 Kenya Assessing risks to stability
Conflict (incl. in pastoral areas; land disputes, etc.)
Ethnic tensions and identity politics
Terrorism
Electoral violence (incl. IDPs; the ICC process to step up after the March elections)
Social unrest (incl. inequality, urban / youth unemployment etc.)
Climate change and environmental degradation
Rampant urbanisation
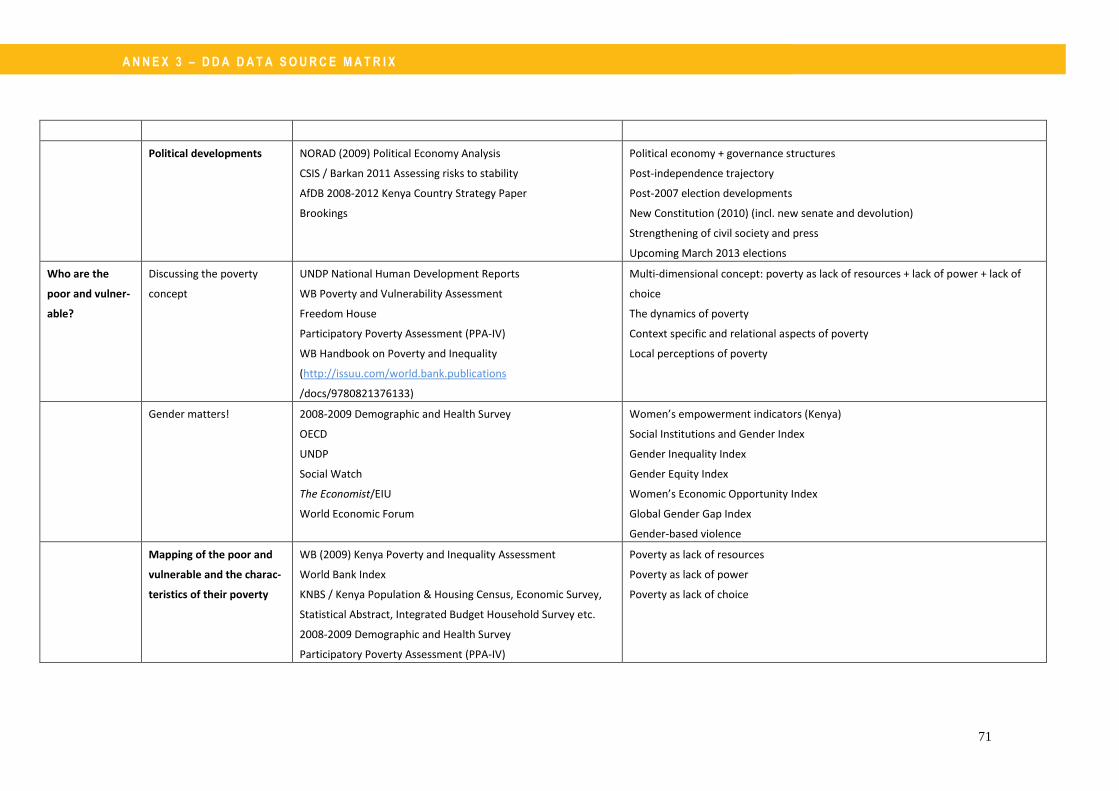
A N N E X 3 – D D A D A T A S O U R C E M A T R I X
71
Political developments NORAD (2009) Political Economy Analysis
CSIS / Barkan 2011 Assessing risks to stability
AfDB 2008-2012 Kenya Country Strategy Paper
Brookings
Political economy + governance structures
Post-independence trajectory
Post-2007 election developments
New Constitution (2010) (incl. new senate and devolution)
Strengthening of civil society and press
Upcoming March 2013 elections
Who are the
poor and vulner-
able?
Discussing the poverty
concept
UNDP National Human Development Reports
WB Poverty and Vulnerability Assessment
Freedom House
Participatory Poverty Assessment (PPA-IV)
WB Handbook on Poverty and Inequality
(http://issuu.com/world.bank.publications
/docs/9780821376133)
Multi-dimensional concept: poverty as lack of resources + lack of power + lack of
choice
The dynamics of poverty
Context specific and relational aspects of poverty
Local perceptions of poverty
Gender matters! 2008-2009 Demographic and Health Survey
OECD
UNDP
Social Watch
The Economist/EIU
World Economic Forum
Women’s empowerment indicators (Kenya)
Social Institutions and Gender Index
Gender Inequality Index
Gender Equity Index
Women’s Economic Opportunity Index
Global Gender Gap Index
Gender-based violence
Mapping of the poor and
vulnerable and the charac-
teristics of their poverty
WB (2009) Kenya Poverty and Inequality Assessment
World Bank Index
KNBS / Kenya Population & Housing Census, Economic Survey,
Statistical Abstract, Integrated Budget Household Survey etc.
2008-2009 Demographic and Health Survey
Participatory Poverty Assessment (PPA-IV)
Poverty as lack of resources
Poverty as lack of power
Poverty as lack of choice

A N N E X 3 – D D A D A T A S O U R C E M A T R I X
72
Freedom House
Mapping of where the
poor and vulnerable live
2008-2009 Demographic and Health Survey
Spatial characteristics:
Rural poverty (esp. ASAL)
Urban poverty (esp. slums)
+regional GINI coefficients
Opportunities for
Development
Major constraints and
challenges for Kenya’s
development
Brookings
Chatham House
Kenya PRSP 2012 (Update on MTP)
AfDB 2008-2012 Kenya Country Strategy Paper
AfDB 2011-2015 EA Regional Integration Strategy Paper
World Economic Forum 2012/13 Global Competitiveness Report
WB 2013 Doing Business Report
WB 2011 Country Policy and Institutional Assessment (CPIA)
WB 2012 Africa’s Pulse Vol 6
WB 2012 Kenya Economic Update 6+7
Challenges related to democracy and human rights (incl. political and social chal-
lenges)
Challenges related to economic growth (incl. income poverty and inequality)
Challenges related to natural resources and the environment
Challenges related to urban development
+ both internal and external constraints
Major opportunities for
Kenya’s development
Brookings
Chatham House
Kenya PRSP 2012 (Update on MTP)
AfDB 2008-2012 Kenya Country Strategy Paper
AfDB 2011-2015 EA Regional Integration Strategy Paper
World Economic Forum 2012/13 Global Competitiveness Report
WB 2011 Country Policy and Institutional Assessment (CPIA)
WB 2012 Africa’s Pulse Vol 6
WB 2012 Kenya Economic Update 6+7
Nordic Africa Institute
Opportunities related to democracy and human rights (incl. political and social
opportunities)
Opportunities related to economic growth
Opportunities related to natural resources and the environment
Opportunities related to urban development
+ both internal and external opportunities
Main risks Brookings
Chatham House
Presidential election 2013
ICC process
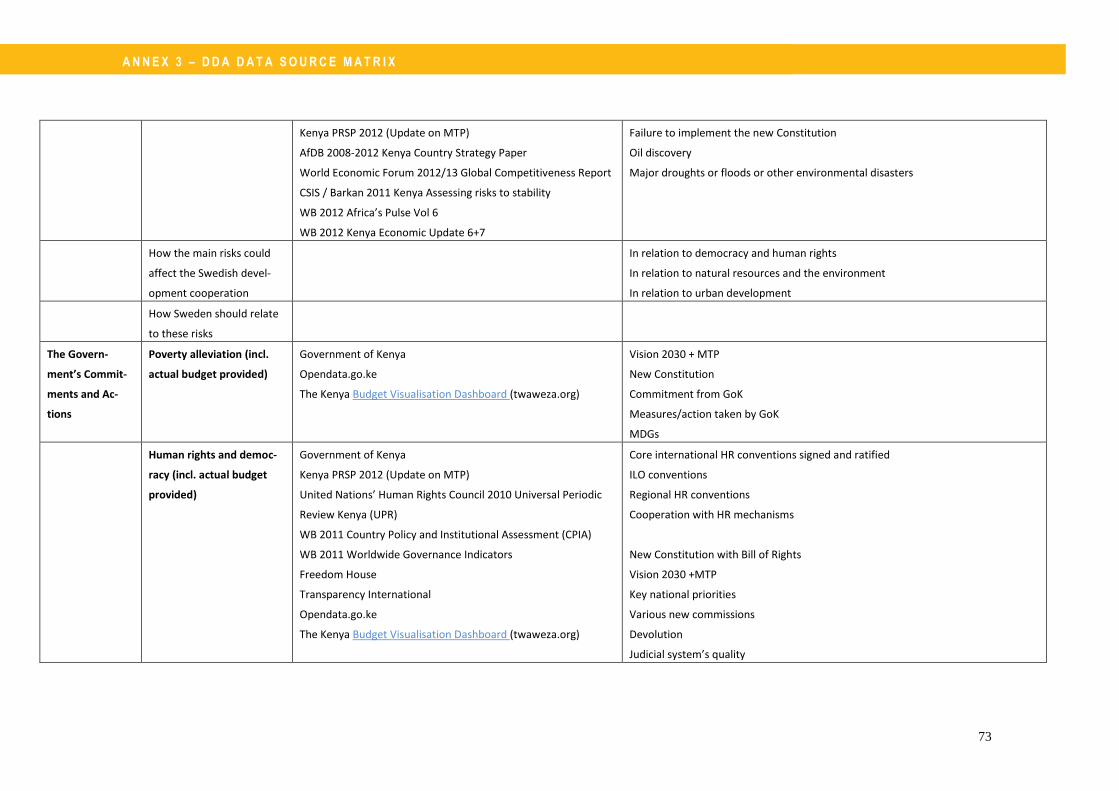
A N N E X 3 – D D A D A T A S O U R C E M A T R I X
73
Kenya PRSP 2012 (Update on MTP)
AfDB 2008-2012 Kenya Country Strategy Paper
World Economic Forum 2012/13 Global Competitiveness Report
CSIS / Barkan 2011 Kenya Assessing risks to stability
WB 2012 Africa’s Pulse Vol 6
WB 2012 Kenya Economic Update 6+7
Failure to implement the new Constitution
Oil discovery
Major droughts or floods or other environmental disasters
How the main risks could
affect the Swedish devel-
opment cooperation
In relation to democracy and human rights
In relation to natural resources and the environment
In relation to urban development
How Sweden should relate
to these risks
The Govern-
ment’s Commit-
ments and Ac-
tions
Poverty alleviation (incl.
actual budget provided)
Government of Kenya
Opendata.go.ke
The Kenya Budget Visualisation Dashboard (twaweza.org)
Vision 2030 + MTP
New Constitution
Commitment from GoK
Measures/action taken by GoK
MDGs
Human rights and democ-
racy (incl. actual budget
provided)
Government of Kenya
Kenya PRSP 2012 (Update on MTP)
United Nations’ Human Rights Council 2010 Universal Periodic
Review Kenya (UPR)
WB 2011 Country Policy and Institutional Assessment (CPIA)
WB 2011 Worldwide Governance Indicators
Freedom House
Transparency International
Opendata.go.ke
The Kenya Budget Visualisation Dashboard (twaweza.org)
Core international HR conventions signed and ratified
ILO conventions
Regional HR conventions
Cooperation with HR mechanisms
New Constitution with Bill of Rights
Vision 2030 +MTP
Key national priorities
Various new commissions
Devolution
Judicial system’s quality

A N N E X 3 – D D A D A T A S O U R C E M A T R I X
74
Opportunities to participate in democratic processes
Freedom of expression and active civil society
Women’s rights
LGBT(I) rights
Gender equality (incl.
actual budget provided)
Government of Kenya
Kenya PRSP 2012 (Update on MTP)
United Nations’ Human Rights Council 2010 Universal Periodic
Review Kenya (UPR)
WB 2011 Country Policy and Institutional Assessment (CPIA)
Opendata.go.ke
The Kenya Budget Visualisation Dashboard (twaweza.org)
New Constitution (incl. Bill of Rights)
About to meet MDG 3 for gender parity in education
CEDAW
Gender-informed policies (incl. Vision 2030 + MTP)
Gender-specific policies in place
Sexual Offences Act
The Kenya National Commission on Gender and Development (KNCGD)
Kenya National Human Rights and Equality Commission
Women’s Enterprise Fund
National strategy for de-
velopment (incl. actual
budget provided)
Government of Kenya
Kenya PRSP 2012 (Update on MTP)
United Nations’ Human Rights Council 2010 Universal Periodic
Review Kenya (UPR)
Opendata.go.ke
The Kenya Budget Visualisation Dashboard (twaweza.org)
Vision 2030 and MTP pillars
- Relevance, credibility and feasibility for democracy and human rights - Relevance, credibility and feasibility for natural resources and the envi-
ronment - Relevance, credibility and feasibility for urban development - Cross cutting issues - Poverty analysis vis-à-vis other poverty analyses made - Perspectives of the poor and vulnerable - M&E - Operationalisation in the budget - Implementation through commissions etc.
Economic policy (incl. actu-
al budget provided)
Brookings
Kenya PRSP 2012 (Update on MTP)
AfDB 2008-2012 Kenya Country Strategy Paper
World Economic Forum 2012/13 Global Competitiveness Report
WB 2013 Doing Business Report
Vision 2030 + MTP
Macroeconomic management
Fiscal policy
Debt policy
Regional integration and trade policies
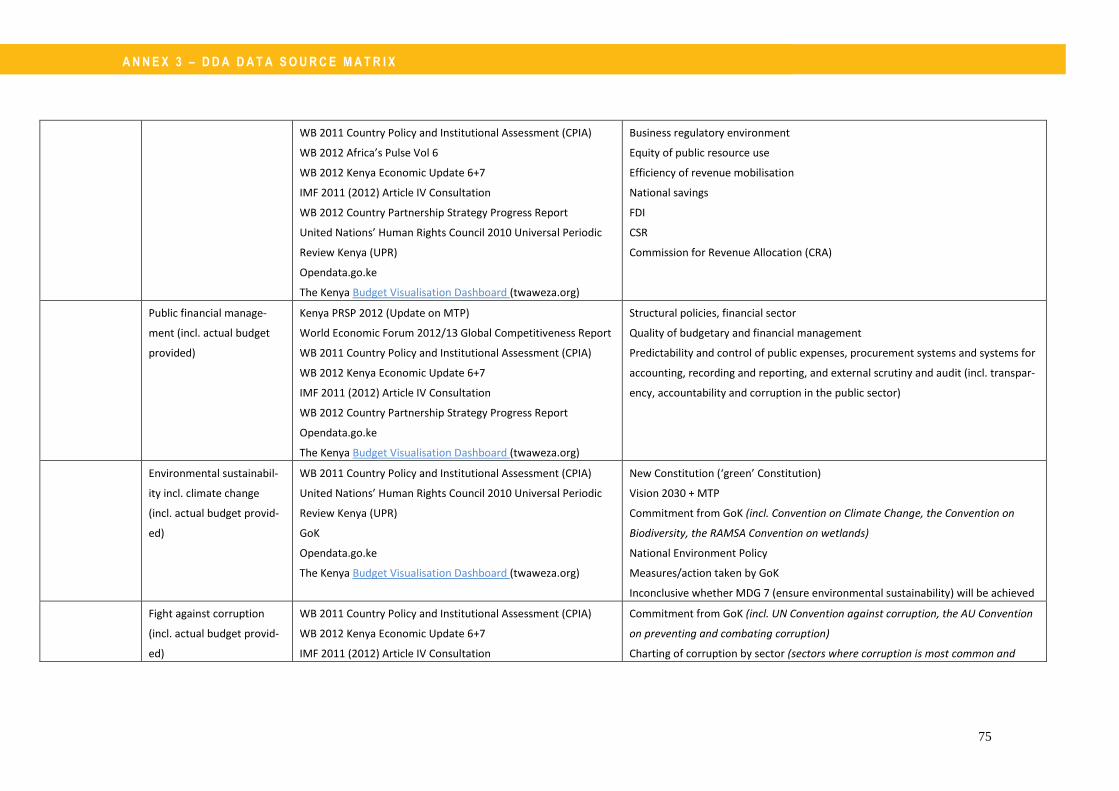
A N N E X 3 – D D A D A T A S O U R C E M A T R I X
75
WB 2011 Country Policy and Institutional Assessment (CPIA)
WB 2012 Africa’s Pulse Vol 6
WB 2012 Kenya Economic Update 6+7
IMF 2011 (2012) Article IV Consultation
WB 2012 Country Partnership Strategy Progress Report
United Nations’ Human Rights Council 2010 Universal Periodic
Review Kenya (UPR)
Opendata.go.ke
The Kenya Budget Visualisation Dashboard (twaweza.org)
Business regulatory environment
Equity of public resource use
Efficiency of revenue mobilisation
National savings
FDI
CSR
Commission for Revenue Allocation (CRA)
Public financial manage-
ment (incl. actual budget
provided)
Kenya PRSP 2012 (Update on MTP)
World Economic Forum 2012/13 Global Competitiveness Report
WB 2011 Country Policy and Institutional Assessment (CPIA)
WB 2012 Kenya Economic Update 6+7
IMF 2011 (2012) Article IV Consultation
WB 2012 Country Partnership Strategy Progress Report
Opendata.go.ke
The Kenya Budget Visualisation Dashboard (twaweza.org)
Structural policies, financial sector
Quality of budgetary and financial management
Predictability and control of public expenses, procurement systems and systems for
accounting, recording and reporting, and external scrutiny and audit (incl. transpar-
ency, accountability and corruption in the public sector)
Environmental sustainabil-
ity incl. climate change
(incl. actual budget provid-
ed)
WB 2011 Country Policy and Institutional Assessment (CPIA)
United Nations’ Human Rights Council 2010 Universal Periodic
Review Kenya (UPR)
GoK
Opendata.go.ke
The Kenya Budget Visualisation Dashboard (twaweza.org)
New Constitution (‘green’ Constitution)
Vision 2030 + MTP
Commitment from GoK (incl. Convention on Climate Change, the Convention on
Biodiversity, the RAMSA Convention on wetlands)
National Environment Policy
Measures/action taken by GoK
Inconclusive whether MDG 7 (ensure environmental sustainability) will be achieved
Fight against corruption
(incl. actual budget provid-
ed)
WB 2011 Country Policy and Institutional Assessment (CPIA)
WB 2012 Kenya Economic Update 6+7
IMF 2011 (2012) Article IV Consultation
Commitment from GoK (incl. UN Convention against corruption, the AU Convention
on preventing and combating corruption)
Charting of corruption by sector (sectors where corruption is most common and
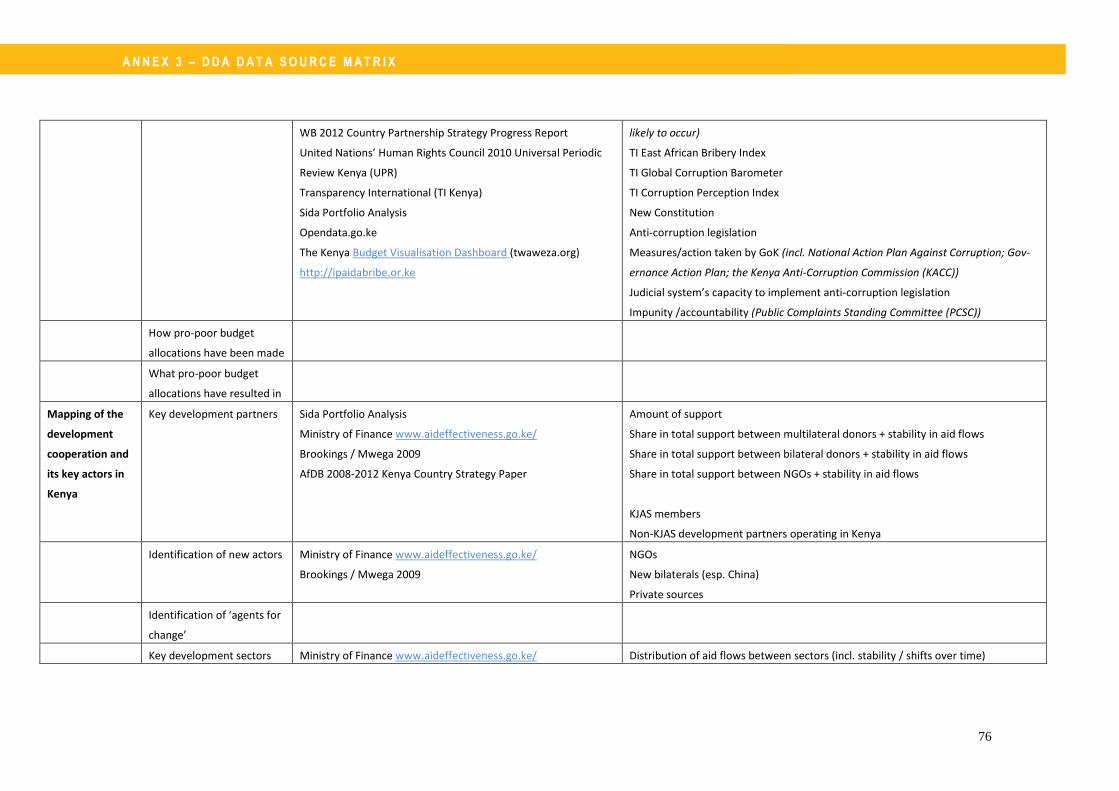
A N N E X 3 – D D A D A T A S O U R C E M A T R I X
76
WB 2012 Country Partnership Strategy Progress Report
United Nations’ Human Rights Council 2010 Universal Periodic
Review Kenya (UPR)
Transparency International (TI Kenya)
Sida Portfolio Analysis
Opendata.go.ke
The Kenya Budget Visualisation Dashboard (twaweza.org)
http://ipaidabribe.or.ke
likely to occur)
TI East African Bribery Index
TI Global Corruption Barometer
TI Corruption Perception Index
New Constitution
Anti-corruption legislation
Measures/action taken by GoK (incl. National Action Plan Against Corruption; Gov-
ernance Action Plan; the Kenya Anti-Corruption Commission (KACC))
Judicial system’s capacity to implement anti-corruption legislation
Impunity /accountability (Public Complaints Standing Committee (PCSC))
How pro-poor budget
allocations have been made
What pro-poor budget
allocations have resulted in
Mapping of the
development
cooperation and
its key actors in
Kenya
Key development partners Sida Portfolio Analysis
Ministry of Finance www.aideffectiveness.go.ke/
Brookings / Mwega 2009
AfDB 2008-2012 Kenya Country Strategy Paper
Amount of support
Share in total support between multilateral donors + stability in aid flows
Share in total support between bilateral donors + stability in aid flows
Share in total support between NGOs + stability in aid flows
KJAS members
Non-KJAS development partners operating in Kenya
Identification of new actors Ministry of Finance www.aideffectiveness.go.ke/
Brookings / Mwega 2009
NGOs
New bilaterals (esp. China)
Private sources
Identification of ‘agents for
change’
Key development sectors Ministry of Finance www.aideffectiveness.go.ke/ Distribution of aid flows between sectors (incl. stability / shifts over time)
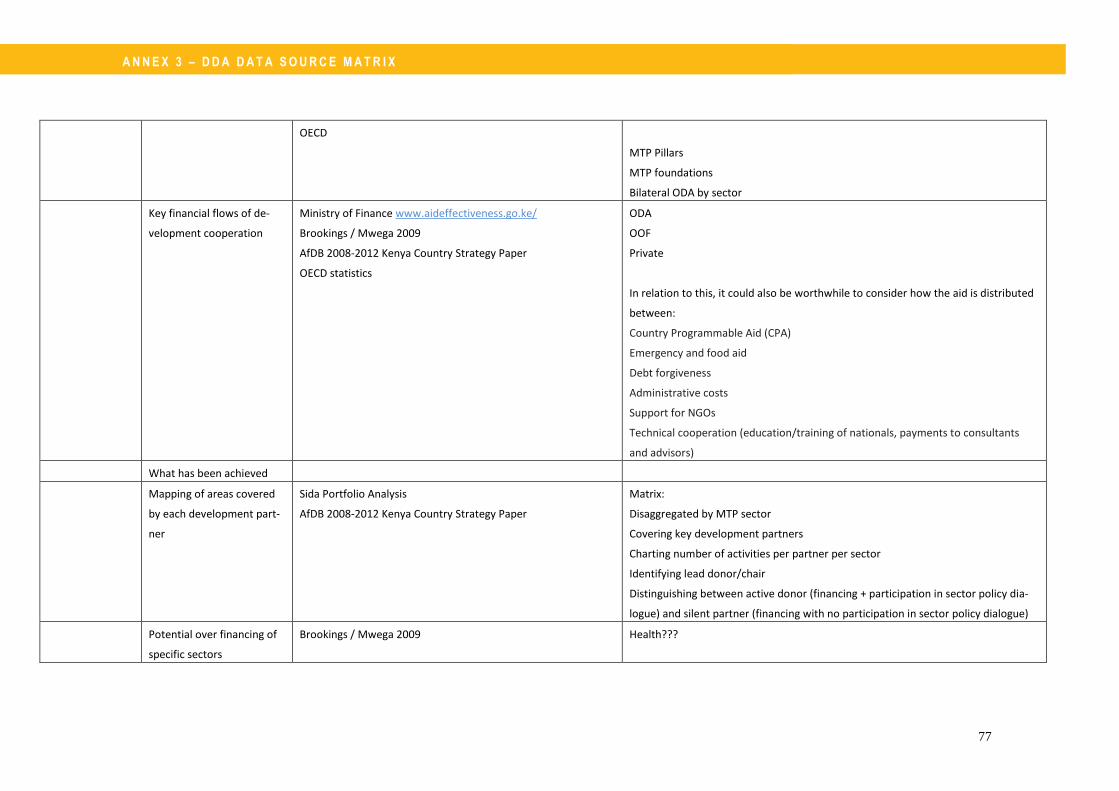
A N N E X 3 – D D A D A T A S O U R C E M A T R I X
77
OECD
MTP Pillars
MTP foundations
Bilateral ODA by sector
Key financial flows of de-
velopment cooperation
Ministry of Finance www.aideffectiveness.go.ke/
Brookings / Mwega 2009
AfDB 2008-2012 Kenya Country Strategy Paper
OECD statistics
ODA
OOF
Private
In relation to this, it could also be worthwhile to consider how the aid is distributed
between:
Country Programmable Aid (CPA)
Emergency and food aid
Debt forgiveness
Administrative costs
Support for NGOs
Technical cooperation (education/training of nationals, payments to consultants
and advisors)
What has been achieved
Mapping of areas covered
by each development part-
ner
Sida Portfolio Analysis
AfDB 2008-2012 Kenya Country Strategy Paper
Matrix:
Disaggregated by MTP sector
Covering key development partners
Charting number of activities per partner per sector
Identifying lead donor/chair
Distinguishing between active donor (financing + participation in sector policy dia-
logue) and silent partner (financing with no participation in sector policy dialogue)
Potential over financing of
specific sectors
Brookings / Mwega 2009 Health???
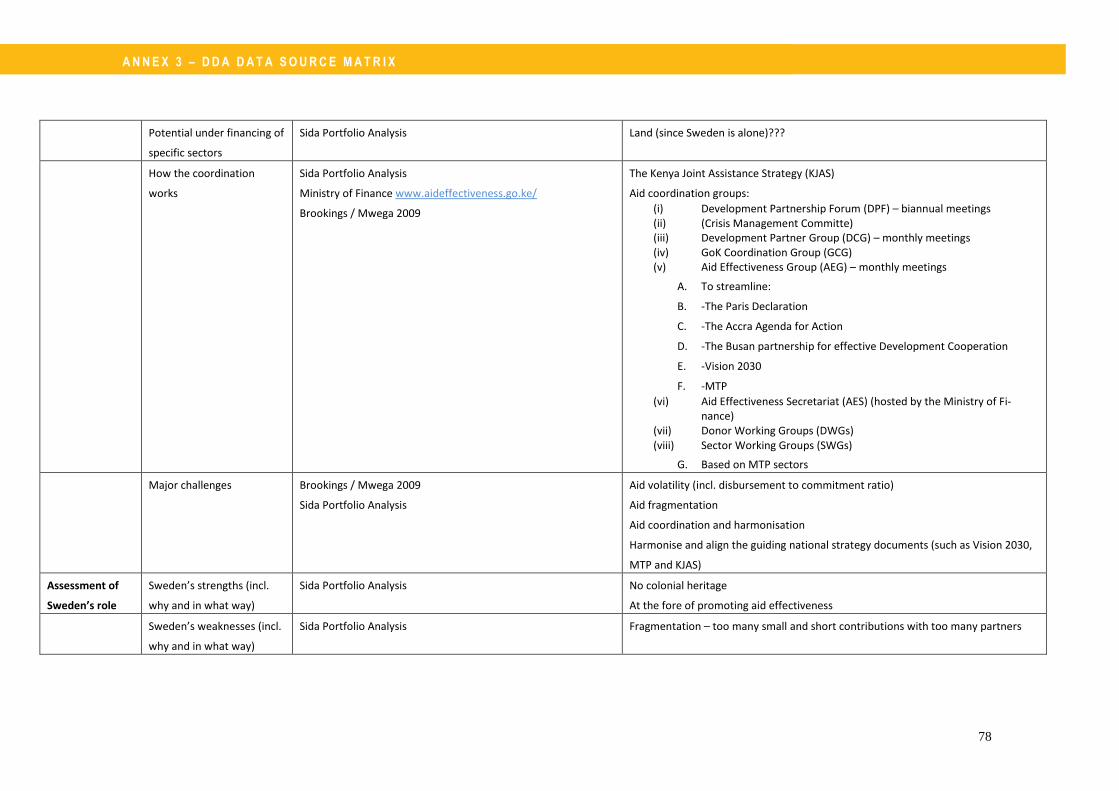
A N N E X 3 – D D A D A T A S O U R C E M A T R I X
78
Potential under financing of
specific sectors
Sida Portfolio Analysis Land (since Sweden is alone)???
How the coordination
works
Sida Portfolio Analysis
Ministry of Finance www.aideffectiveness.go.ke/
Brookings / Mwega 2009
The Kenya Joint Assistance Strategy (KJAS)
Aid coordination groups:
(i) Development Partnership Forum (DPF) – biannual meetings (ii) (Crisis Management Committe) (iii) Development Partner Group (DCG) – monthly meetings (iv) GoK Coordination Group (GCG) (v) Aid Effectiveness Group (AEG) – monthly meetings
A. To streamline:
B. -The Paris Declaration
C. -The Accra Agenda for Action
D. -The Busan partnership for effective Development Cooperation
E. -Vision 2030
F. -MTP
(vi) Aid Effectiveness Secretariat (AES) (hosted by the Ministry of Fi-nance)
(vii) Donor Working Groups (DWGs) (viii) Sector Working Groups (SWGs)
G. Based on MTP sectors
Major challenges Brookings / Mwega 2009
Sida Portfolio Analysis
Aid volatility (incl. disbursement to commitment ratio)
Aid fragmentation
Aid coordination and harmonisation
Harmonise and align the guiding national strategy documents (such as Vision 2030,
MTP and KJAS)
Assessment of
Sweden’s role
Sweden’s strengths (incl.
why and in what way)
Sida Portfolio Analysis No colonial heritage
At the fore of promoting aid effectiveness
Sweden’s weaknesses (incl.
why and in what way)
Sida Portfolio Analysis Fragmentation – too many small and short contributions with too many partners

A N N E X 3 – D D A D A T A S O U R C E M A T R I X
79
Sweden’s comparative
advantages (if any; incl.
why and in what way)
Sweden’s strategic role
How Sweden can act as a
catalyst and or innovator
Conclusions Fundamental development
challenges and opportuni-
ties
The strategic role of devel-
opment cooperation and
feasible aid modalities incl.
existing risks and the de-
gree to which they affect
the overall effectiveness
The strategic role for Swed-
ish support in forthcoming
cooperation strategy period

80
Annex 4 – Key National Reporting Indicators
Selection of Poverty related Baselines and Targets
(Ministry of State for Planning, National Development and Vision 2030)
Indicator Baseline Targets
Year Value Year Value Actual
Urban households with
access to piped water
2007/8 60 2012/13 75 Unknown
Rural households with access
to water from a protected
source
2007/8 40 2012/13 60 Unknown
Urban households with
individual or shared access to
toilet facilities
2007/8 30 2012/13 55 Unknown
Rural households with
individual or shared access to
toilet facilities
2007/8 5 2012/13 8 Unknown
Reduced poverty (Poverty
levels below poverty line)
2006 46 2012/13 28 Unknown
Reduced hunger (households
in need of food aid) Million
2006 2.5 2012/13 1.0 Unknown
For full details of:
National Reporting Framework
Flagship project Reporting Framework
District and constituency monitoring
Gender monitoring
See baselines and targets presented in ‘Handbook of National Reporting Inducators
for the Vision 2030’. MTP 2008-12. Ministry of State for Planning, National Devel-
opment and Vision.
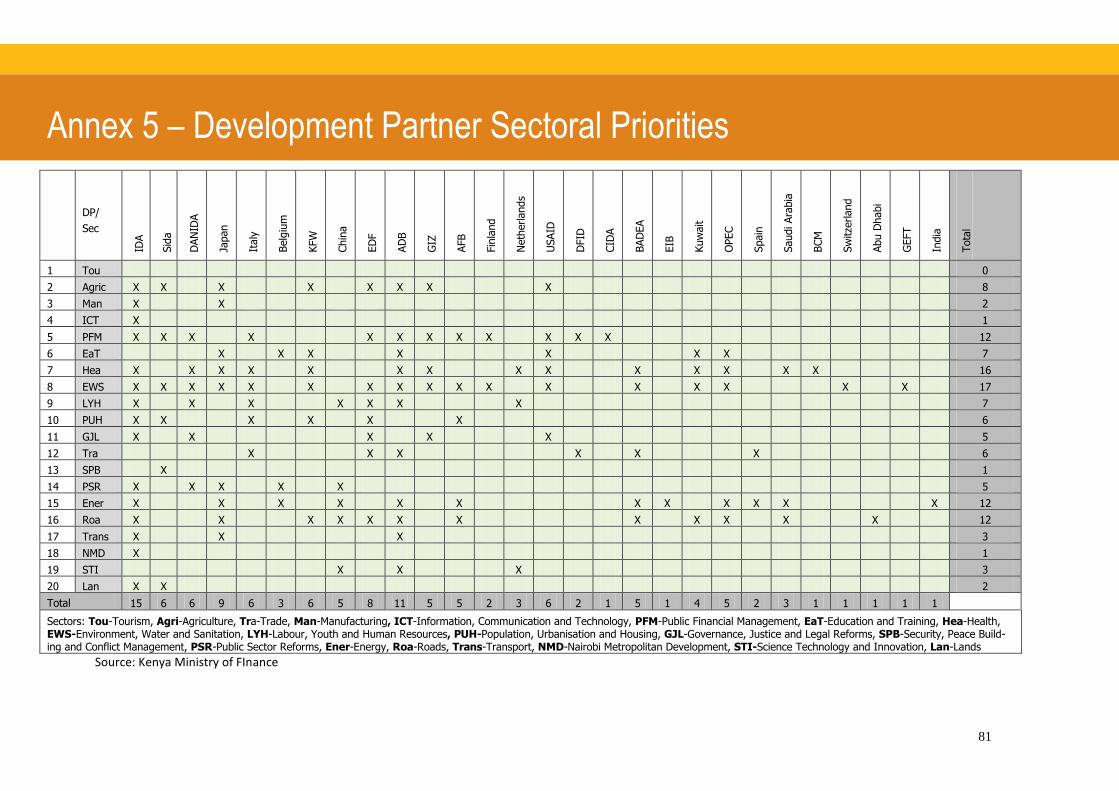
81
Annex 5 – Development Partner Sectoral Priorities
DP/
Sec
IDA
Sid
a
DAN
IDA
Japan
Italy
Belg
ium
KFW
Chin
a
ED
F
AD
B
GIZ
AFB
Fin
land
Neth
erlands
USAID
DFID
CID
A
BAD
EA
EIB
Kuw
ait
OPEC
Spain
Saudi Ara
bia
BCM
Sw
itze
rland
Abu D
habi
GEFT
India
Tota
l
1 Tou 0
2 Agric X X X X X X X X 8
3 Man X X 2
4 ICT X 1
5 PFM X X X X X X X X X X X X 12
6 EaT X X X X X X X 7
7 Hea X X X X X X X X X X X X X X 16
8 EWS X X X X X X X X X X X X X X X X X 17
9 LYH X X X X X X X 7
10 PUH X X X X X X 6
11 GJL X X X X X 5
12 Tra X X X X X X 6
13 SPB X 1
14 PSR X X X X X 5
15 Ener X X X X X X X X X X X X 12
16 Roa X X X X X X X X X X X X 12
17 Trans X X X 3
18 NMD X 1
19 STI X X X 3
20 Lan X X 2
Total 15 6 6 9 6 3 6 5 8 11 5 5 2 3 6 2 1 5 1 4 5 2 3 1 1 1 1 1
Sectors: Tou-Tourism, Agri-Agriculture, Tra-Trade, Man-Manufacturing, ICT-Information, Communication and Technology, PFM-Public Financial Management, EaT-Education and Training, Hea-Health, EWS-Environment, Water and Sanitation, LYH-Labour, Youth and Human Resources, PUH-Population, Urbanisation and Housing, GJL-Governance, Justice and Legal Reforms, SPB-Security, Peace Build-ing and Conflict Management, PSR-Public Sector Reforms, Ener-Energy, Roa-Roads, Trans-Transport, NMD-Nairobi Metropolitan Development, STI-Science Technology and Innovation, Lan-Lands
Source: Kenya Ministry of FInance
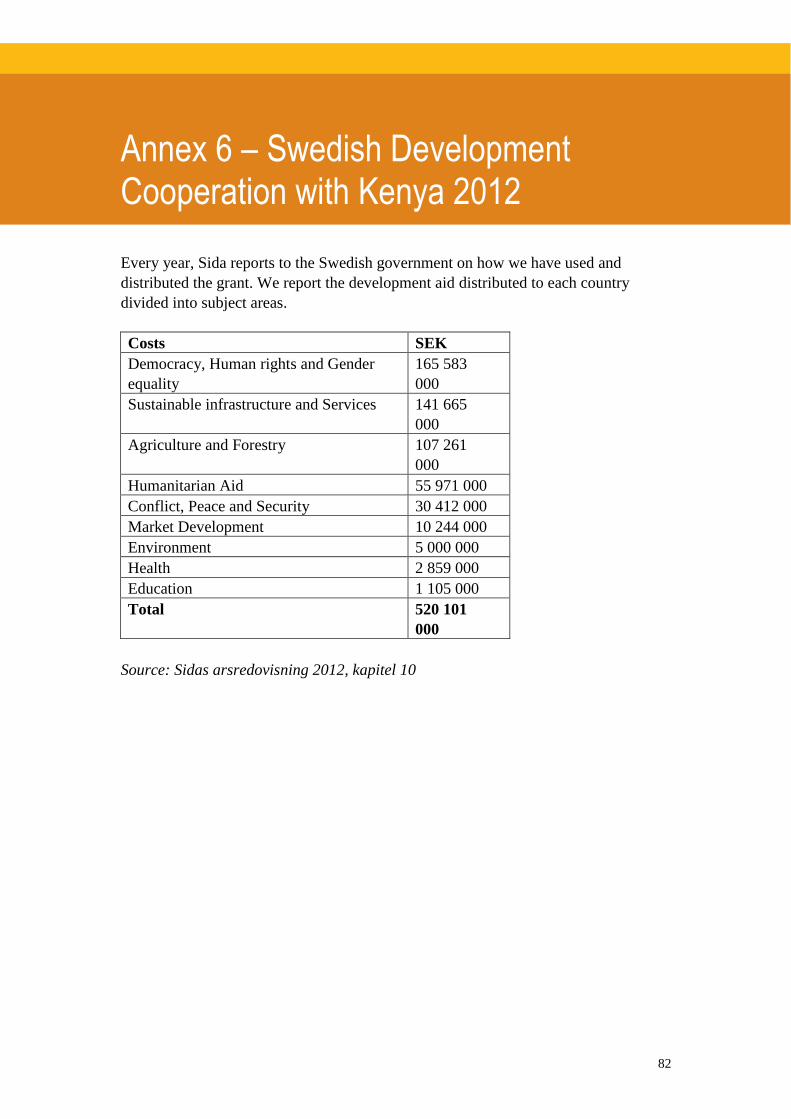
82
Annex 6 – Swedish Development Cooperation with Kenya 2012
Every year, Sida reports to the Swedish government on how we have used and
distributed the grant. We report the development aid distributed to each country
divided into subject areas.
Costs SEK
Democracy, Human rights and Gender
equality
165 583
000
Sustainable infrastructure and Services 141 665
000
Agriculture and Forestry 107 261
000
Humanitarian Aid 55 971 000
Conflict, Peace and Security 30 412 000
Market Development 10 244 000
Environment 5 000 000
Health 2 859 000
Education 1 105 000
Total 520 101
000
Source: Sidas arsredovisning 2012, kapitel 10
83
Annex 7 – Bibliography
AfDB, OECD, UNDP and UNECA. 2012. ‘African Economic Outlook 2012. Kenya.’
http://www.africaneconomicoutlook.org/fileadmin/uploads/aeo/PDF/Kenya%20Full%20PDF%20Coun
try%20Note.pdf
African Development Bank Group. 2011. ‘Eastern Africa Regional Integration Strategy Paper 2011-
2015.’ African Development Bank and African Development Fund Regional Departments East I and
East II (OREA/OREB). September 2011.
African Development Bank Group. 2007. ‘Kenya Country Gender Profile.’ Human Development De-
partment (OSHD). October 2007.
African Development Bank Group. 2008. ‘Kenya 2008 – 2012 Country Strategy Paper.’ Country and
Regional Department – East A (OREA). November 2008. Afrobarometer. 2012. Identity, Interpersonal Relations, Trust in Institutions and Citizenship: Results
from the Afrobarometer Round 5 Survey in Kenya.
http://www.afrobarometer.org/files/documents/media_briefing/ken_r5_presentation3_identity_12nov2
012.pdf Akoch, A. 2012. ’Gender Equity: Kenya at Crossroads.’ Society for International Development (SID).
Nairobi. DevelopmentPLUS Blog. November 8. http://www.sidint.net/content/gender-equity-kenya-
crossroads
Amis, Philip, Urban Poverty in East Africa: Comparative Analysis of the Trajectories of Nairobi and
Kampala (2004). Chronic Poverty Research Centre Working Paper No. 39. Available at SSRN:
http://ssrn.com/abstract=1754414 or http://dx.doi.org/10.2139/ssrn.1754414
Andersson Djurfeldt, A., Djurfeldt, G., & Bergman Lodin, J. (2013). Geography of gender gaps: Re-
gional patterns of income and farm nonfarm interaction among male- and female-headed households in
eight African countries. World Development 48: 32-47.
Barkan, J.D. 2011. Kenya. Assessing Risks to Stability. A report of the CSIS Africa Program. June
2011. Washington, D.C.: Center for Strategic and International Studies (CSIS).
CEDAW (Committee on the Elimination of Discrimination against Women). 2010. ‘Consideration of
Reports Submitted by States Parties under Article 18 of the Convention on the Elimination of All
Forms of Discrimination against Women. Seventh Periodic Report of States Parites. Kenya. The 7th
Periodic Report of the Government of the Republic of Kenya on Implementation of the International
Convention on the Elimination of All Forms of Discrimination against Women (CEDAW).’ Chemengich, M.K. 2009. ‘The Prospects of Civil Society Driven Change in Kenya’, pp. 20 – 30 in
Wanyande P. and M.A. Okebe (eds.) Discourses on Civil Society in Kenya. Nairobi: African Research
and Resource Forum (ARRF).
Christoplos, I. 2012. Resilience, Risk and Vulnerability at Sida.
CIA. 2013. ‘The World Fact Book. Kenya.’ https://www.cia.gov/library/publications/the-world-
factbook/geos/ke.html Communications Commission of Kenya. 2013. ‘Growth in Internet subscription surpasses voice’.
Posted 18 April 2013.
http://www.cck.go.ke/news/2013/Growth_Internet_subscription_surpasses_voice.html
A N N E X 7 – B I B L I O G R A P H Y
84
Chuma, J., Musimbi, J., Okungu, V., Goodman
, C. ,Molyneux
, C. 2009. Reducing user fees for primary
health care in Kenya: Policy on paper or policy in practice? International Journal for Equity in Health
2009, 8:15 doi:10.1186/1475-9276-8-15
Development Initiatives Africa Hub. 2012. Kenya: Resources for Poverty Alleviation, a Background
Paper. Development Initiatives Africa Hub. September 2012.
Dewey, C.E. ET AL. 2011. The Impact of Political Crisis on Smallholder Pig Farmers in Western
Kenya, 2006-2008. Journal of Modern African Studies. Vol. 49(3): 455-473
Economist Intelligence Unit. 2013. Country Report Kenya. Generated on February 6, 2013. London:
The Economist Intelligence Unit.
Ellis, F., Bahiigwa, G. 2001. Livelihoods and Rural Poverty Reduction in Uganda. LADDER Working
Paper 5. November 2001.
http://www.foodnet.cgiar.org/scrip/docs&databases/ifpristudies_ug_nonscrip/pdfs/more_reports/Liveli
hoods%20and%20rural%20poverty%20in%20Uganda.pdf Federation of Women Lawyers – Kenya (FIDA-K) and Centre on Housing Rights and Evictions
(COHRE). 2011. ‘Joint Submission Shadow Report to the United Nations Committee on the Elimina-
tion of Discrimination against Women. Kenya 48th Session 17 January – 4 February 2011.’
Geda, A., et al. 2005. ‘Determinants of Poverty in Kenya: A Household Level Analysis.’ Economics
Working Papers 200544, Department of Economics, University of Connecticut.
http://digitalcommons.uconn.edu/econ_wpapers/200544
Government of the Republic of Kenya. 2012. National Agribusiness Strategy. Making Kenya’s Agri-
business Sector a Competitive Driver of Growth. June 2012. Agricultural Sector Coordination Unit,
Government of Kenya.
Government of the Republic of Kenya 2007. Kenya Vision 2030. A Globally Competitive and Prosper-
ous Kenya. October 2007. Hauer, M. 2012. Portfolio Analysis of the Swedish Development Cooperation in Kenya. Hauer Con-
sulting IMLU. 2011. National Torture Prevalence Survey, 2011. Rights Journal. July 2011
Institute for War and Peace Reporting, Female Candidates Claim Discrimination in Kenyan Elections,
21 May 2013, ACR Issue 348, available at: http://www.refworld.org/docid/519b428e4.html [accessed
2 June 2013]
Institute of Economic Affairs. 2011. ‘Youth Employment in Kenya. Prospects and Policies. Confer-
ence Report.’ 15-16 November 2011. Sarova Panafric Hotel, Nairobi. International Crisis Group. 2013. Kenya’s 2013 Elections. Crisis Group Africa Report N°197, 17 Janu-
ary 2013. Kamau, P. 2012. Declining Confidence in Economic Performance in Kenya. Afrobarometer Briefing
Paper 107. October 2012. http://afrobarometer.org/publications/afrobarometer-briefing-papers/641-bp-
107 Kenya Institute of Economic Affairs 2008. Profile of Women’s Socio-Economic Status in Kenya. June
2008. Nairobi: Kenya Institute of Economic Affairs. CEDAW/C/KEN/7. 24 March 2010.
Kenya Integrated Household Budget Survey (KIHBS) 2005/6
Kenya Ministry of Finance & the World Bank. 2012. ‘Kenya: Report on the Review of Use of Country
Financial Management Systems by Donor Financed Projects.’ Period of Review: FY 2011/2012. Octo-
ber 18, 2012.
A N N E X 7 – B I B L I O G R A P H Y
85
Kenya Ministry of State for Planning, National Development and Vision 2030. 2012. ‘A Summary of
Key Investment Opportunities in Kenya.’ Prepared by Macro Planning Directorate, Office of the Prime
Minister, Ministry of State for Planning, National Development and Vision 2030, July 2012.
Kenya Ministry of State for Planning, National Development and Vision 2030 et al. 2011. ‘First Medi-
um Term Plan Update.’ November 2011.
Kenya Ministry of State for Planning, National Development and Vision 2030. 2010. ‘Millennium
Development Goals Status Report for Kenya 2009.’ Kenya Ministry of State for Planning, National Development, and Vision 2030 et al. ‘First Medium
Term Plan, 2008 – 2012. A Globally Competitive and Prosperous Kenya.’ Kenya Ministry of Youth Affairs & Sports. 2011. ‘Priority Value Chain Analysis Study in Selected
Districts, Kenya 2011/2012.’ Regional Programme for Social Cohesion and Youth Employment
(YERP). Kenya National Bureau of Statistics. 2007. Basic Report on Well-Being in Kenya. Based on the Kenya
Integrated Household Budget Survey—2005/6, Nairobi, Ministry of Planning and National Develop-
ment. Kimenyi, E.S. 2013. ‘Kenya at a Tipping Point: The 2013 Presidential Election’, pp. 10-13 in Africa
Growth Initiative at Brookings Institution. Foresight Africa. Top Priorities for the Continent in 2013.
January 2013.
http://www.brookings.edu/~/media/research/files/reports/2013/01/foresight%20africa/foresight%20afri
ca_2013
KNBS and ICF Macro 2010. Kenya Demographic and Health Survey 2008-09. June 2010. Calverton,
Maryland: Kenya National Bureau of Statistics and ICF Macro.
Kristjanson, P. et al. 2010. ‘Understanding Poverty Dynamics in Kenya.’ In Journal of International
Development, Vol. 22: 977-996. Maina, B., Chesoni A, Owiti, J. 2003. An Analysis of Power in Kenya and Implications for Pro – Poor
Policy and Swedish Support to Kenya. Policy Solutions. Nairobi.
Mango et al 2009
Masinde Wamalwa, F. 2009. ‘Youth Unemployment in Kenya: Its Nature and Covariates.’ KIPPRA
Discussion Paper No. 103. Social Sector Division, Kenya Institute for Public Policy Research and
Analysis.
McCulloch, M., Ota, M. 2002. Export Horticulture and Poverty in Kenya. IDS Working Paper 174.
Metcalfe, V. et al. 2011. Sanctuary in the City? Urban Displacement and Vulnerability in Nairobi.
HPG Working Paper. September 2011. ODI.
Miller, R. et al. 2011. Ascending Out of Poverty: An Analysis of Family Histories in Kenya. Chronic
Poverty Research Centre. Working Paper No. 219. July 2011.
Muyanga, M. et al. 2010. Pathways in and out of Poverty: A Study of Rural Household Wealth Dy-
namics in Kenya. Paper for the Centre for the Study of African Economies Conference on Economic
Development in Africa , March 20-22, 2011, St. Catherine’s College, Oxford, UK
Mwambu, G., Mwanzia, J., Liambila, W. 1995. User charges in government health facilities in Kenya:
effect on attendance and revenue. Health Policy and Planning. 10(29 164-170.
Nduru, G., Kiragu, S. 2012. Climate Variability Risks, Perceptions and Coping Mechanisms in Kenya.
In Bloemertz, L. Et al (eds) Risk and Africa: Multi-Disciplinary Approaches. Lit Verlaug, Vienna.
Nzuma, J. 2013. The Political Economy of Food Price Policy in Kenya. Policy Brief Number 5. Politi-
cal Economy of Food Price Policy. WIDER
A N N E X 7 – B I B L I O G R A P H Y
86
Oiro, M.W., et al. 2004. ’Poverty and Employment in Kenya.’ KIPPRA Discussion paper No. 33.
March 2004. Social Sector Division, Kenya Institute for Public Policy Research and Analysis.
Okwi, P.O., et al. 2007.’Spatial Determinants of Rural Poverty in Kenya.’ In PNAS (Proceedings of the
National Academy of Sciences of the United States of America) 104(43): 16769-16774 Oloo, A. 2013. The Constitution of Kenya 2010: Kenyans Give a Thumbs Up. Afrobarometer Briefing
Paper 109. January 2013
http://www.afrobarometer.org/files/documents/briefing_papers/afrobriefno109.pdf Oluoko-Odingo, A.A. 2009. ‘Determinants of Poverty: Lessons from Kenya.’ In GeoJournal 74: 311-
331.
ONE. 2013. The 2013 Data Report: Financing the Fight for Africa’s Transformation.
http://one.org.s3.amazonaws.com/pdfs/data_report_2013_en.pdf Onsomu, E.N. and B.O. Munga. 2010. ‘The Role of Education and Training in Reducing Poverty and
Unemployment in Kenya.’ KIPPRA Discussion paper No. 118. Social Sector Division, Kenya Institute
for Public Policy Research and Analysis.
Oxfam GB. 2009. Urban Poverty and Vulnerability in Kenya. Background Analysis for the Preparation
of an Oxfam GB Urban Programme focused on Nairobi. September 2009. Open Budget Survey 2012. Kenya Open Gudget Survey 212. www.internationalbudget.org
Owuor, G. et al. 2007. ‘Determinants of Rural Poverty in Africa: The Case of Small Holder Farmers in
Kenya.’ In Journal of Applied Sciences, Vol. 7(17): 2539-2543. Pain, A and Levine S, 2012 "A conceptual analysis of livelihoods and resilience: addressing the ‘inse-
curity of agency’", HPG Working Papers, November 2012
Population Reference Bureau 2011. ‘Kenya Population Data Sheet 2011.’
http://www.prb.org/pdf11/kenya-population-data-sheet-2011.pdf
The Project Advice and Training Centre. 2010. ‘Civil Society and Legitimacy in Kenya.’ Thematic
Learning Visit. Kenya October – November 2010. The Project Advice and Training Centre 2012,
Denmark
Radeny, M. et al. 2012. ‘Rural Poverty Dynamics in Kenya: Structural Declines and Stochastic Es-
capes,’ in World Development Vol. 40 (8): 1577-1593
Rao, E.J.O., Qaim, M. 2010. Supermarkets, Farm Household Income, and Poverty: Insights from Ken-
ya. World Development. Vol. 39(5): 784-796. Regeringskansliet. 2010. Change for Freedom: Policy for democratic development
and human rights in Swedish development cooperation, 2010–2014. Swedish MFA. Stockholm. Republic of Kenya. 2012. Kenya Post-Disaster Needs Assessment (PDNA) 2008-2011 Drought.
Schwab, K. (Ed.). 2012. The Global Competitiveness Report 2012-2013. Full Data Edition. Insight
Report. The Global Benchmarking Network, World Economic Forum. Geneva: World Economic Fo-
rum.
Sida. 2002. ‘Perspectives on Poverty.’ Stockholm: Sida. Stockholm Environment Institute. 2009. Economics of Climate Change Kenya. SEI. Stockholm. Sundet, G., Moen, E. 2009. Political Economy Analysis of Kenya. Norad Report 19/2009 Discussion Suri, T. et al. 2008. Rural Incomes, Inequality and Poverty Dynamics in Kenya. Tegemeo Institute of
Rural Policy and Development. Egerton University. WPS 30/2008
Theisen, O.M. 2012. Climate Clashes? Weather Variability, Land Pressure, and Organized Violence in
Kenya, 1989-2004. Journal of Peace Research. Vol. 49(1):81-96. TJRC (Transitional Justice and Reconciliation Commission) 2013
A N N E X 7 – B I B L I O G R A P H Y
87
Tortora, B. 2012. Kenya Votes 2013: Attitudes Toward the Election, Judicial System and Security.
Gallup. Tostensen, A. 2004. Rural-urban linkages in sub-Saharan Africa: Contemporary debates and
implications for Kenyan urban workers in the 21st century. Christian Michelsen Institute Working
Paper 2004:4. Bergen.
UNDP. 2011. Human Development Report 2011. Sustainability and Equity. A Better Future for All.
New York: United Nations Development Programme.
UNDP. 2010. Kenya National Human Development Report 2009. Youth and Human Development.
Tapping the Untapped Resource. June 2010. United Nations 2012. Kenya 2012+ Emergency Humanitarian Response Plan. UNOCHA
Wanyande P. and M.A. Okebe (eds.) Discourses on Civil Society in Kenya. Nairobi: African Research
and Resource Forum (ARRF).
Wanyande, P. 2009. ‘Civil Society and Transition Politics in Kenya: Historical and Contemporary
Perspectives,’ pp. 8 – 19 in Wanyande P. and M.A. Okebe (eds.) Discourses on Civil Society in Kenya.
Nairobi: African Research and Resource Forum (ARRF). Whitfied, L., Therkildsen, O. 2011. What Drives States to Support the Development of Productive
Sectors. DIIS Working Paper 2011:15
September 2011, 34 p. World Bank. 2008. Kenya Poverty and Inequality Assessment. Executive Summary and Synthesis Re-
port. Poverty Reduction and Economic Management Unit, Africa Region. Report No. 44190-KE.
World Bank. 2012a.Walking on a Tightrope. Rebalancing Kenya’s Economy with a Special Focus on
Regional Integration. Kenya Economic Update. June 2012. Edition No. 6.
World Bank. 2012b. Kenya at Work. Energizing the Economy and Creating Jobs. Kenya Economic
Update. December 2012. Edition No. 7.
World Bank. 2012c. ‘Africa’s Pulse. An analysis of issues shaping Africa’s economic future.’ October
2012, Vol. 6. The Office of the Chief Economist for the Africa region, the World Bank.
World Bank. 2013a. ‘Gini Index’. http://data.worldbank.org/indicator/SI.POV.GINI?page=1
World Bank. 2013b. Doing Business 2013. Smarter Regulations for Small and Medium Size Enterpris-
es. Comparing Business Regulations for Domestic Firms in 185 Economies. 10th Edition. Washington,
D.C.: the World Bank.
F O O T N O T E S
1 African Development Bank Group, 2008
2 With a per capita income above 1000 USD.
3 African Development Bank Group 2008; World Bank 2012a, 2012b). This is expected to be
achieved (World Bank 2012c) 4 Kenya Ministry of State for Planning, National Development, and Vision 2030 et al. 2011;
World Bank 2009 5 Kenya Ministry of State for Planning, National Development, and Vision 2030 et al. 2011.
The national poverty line is defined as total expenditure (food + nonfood) for households whose food expenditure is close to the food poverty line at the cost of 2250 kCal per day. In relation to the latest poverty survey in Kenya, the Kenya Integrated Household Budget Sur-vey 2005/06, the poverty line was set at KSh52.08 per day in rural areas and KSh98.73 in urban (where the latter is slightly above 1 dollar a day). From this follows that the rural pov-erty rate was 49.6% and the urban 33.1%. The aggregate national headcount poverty rate was 45.9% (see Kenya National Bureau of Statistics 2007). The government’s target is to reduce the share of Kenyans living below the national poverty line to 28% by 2015 (Kenya Ministry of State for Planning, National Development, and Vision 2030 et al. 2008). 6 Githinji (2000), UNDP (2001) and SID (2004,6)
7 A measurement of the income distribution of a country's residents. This number, which
ranges between 0 and 1 and is based on residents' net income, helps define the gap between the rich and the poor, with 0 representing perfect equality (where all citizens have the same income) and 1 representing perfect inequality (where one person accounts for 100% of national expenditure). 8 Society for International Development: Growing Unequally: An audit of the impact of
Kenya’s Vision 2030 growth on equality, 2010. 9 World Bank 2013a
10 World Bank 2012b
11 Ministry of State for Planning, National Development and Vision 2030 2010
12 Republic of Kenya 2012
13 Stockholm Environment Institute 2009
14 Kamau 2012
15 Tortora 2012
16 The Human Development Index (HDI) is a composite statistic of life expectancy, education,
and income indices to rank countries into four tiers of human development. 17
UNDP 2013 (http://hdrstats.undp.org/en/countries/profiles/ken.html) 18
ONE 2013 19
Transform Nutrition 2012 20
TJRC 2013 21
TRJC 2013 22
Kenya Institute of Economic Affairs 2008 23
See for example: Federation of Women Lawyers – Kenya & Centre on Housing Rights and Evictions 2011. 24
KNBS & ICF MACRO 2010 25
Ibid. 26
Kenya Institute of Economic Affairs 2008 27
Kenya Institute of Economic Affairs 2008 28
World Bank 2012b; AfDB, OECD, UNDP and UNECA 2012 29
http://www.afro.who.int/en/kenya/country-health-profile.html 30
World Bank 2008; KNBS & ICF MACRO 2010 31
World Bank 20 32
488 per 100,000 live births 33
Ministry of State for Planning, National Development and Vision 2030 2010 34
Sundet and Moen 2009; TRJC 2013 35
International Crisis Group 2013 36
Kimenyi 2013; International Crisis Group 2013
F O O T N O T E S
37
Tortora 2012 38
Afrobarometer 2012 39
IMLU 2011 40
Sundet and Moen 2009 41
Perspectives on Poverty (2002), Sida 42
World Bank 2012a, 2012b 43
World Bank 2009 44
Mwanbu et al 1995 45
Chuma et al 2009 46
Ellis 2001 47
Sundet and Moen 2009, Maina et al 2003 48
Institute for War and Peace 2013 49
Geda et al. 2005 50
Onsomu & Munga 2010 51
Tostensen 2004 52
Suri et al 2008 53
Suri et al 2008; Radeny et al 2012 54
Thiesen 2010; Opiyo et al 2012 55
TRJC 2013 56
Nzuma 2013 57
Christoplos 2012 58
Nzuma 2013 59
Suri et al 2008 60
Radeny et al 2012; Kristjanson et al 2010 61
Radeny et al. 2012 62
Amis 2004 63
Kamau 2012 64
Ade Freeman et al 2004 65
Pain, A and Levine S, 2012 66
Radeny et al. 2012 67
Muyanga et al 2010:iii 68
Kenya Ministry of State for Planning, National Development, and Vision 2030 et al. 2011; Kenya Bureau of Statistics 2007 69
Radeny et al. 2012 70
Kenya National Bureau of Statistics 2007 71
Kenya Ministry of State for Planning, National Development and Vision 2030, 2010 72
Owuor et al. 2007 73
CEDAW 2010 74
Onsomu & Munga 2010 75 World Bank 2009 76
United Nations 2012 77
Maina et al 2003 79
Okwi et al. 2007; Kristjanson et al. 2010 80
Okwi et al. 2007 81 McCulloch & Ota 2002; Rao & Qaim 2011 82 Kristjanson et al. 2010 83
TRJC 2013 84
African Development Bank Group 2008 85
Government of the Republic of Kenya 2007 86
Population Reference Bureau 2011 87
Kristjanson et al. 2010 88 Urban poverty decreased by 23.8% between 1997 and 2005/6 according to the World Bank (2009). However, another household survey suggested that only a marginal poverty reduction of 1% was achieved in Nairobi and Mombasa between 1990 and 2005 (Kristjanson et al. 2010). 89
C.f. Oluko-Odingo 2011

F O O T N O T E S
90
African Development Bank Group 2008 91
AfDB, OECD, UNDP and UNECA 2012; African Development Bank Group 2011 92
AfDB, OECD, UNDP and UNECA 2012 93
African Development Bank Group 2008 94
However, a notable problem regarding civil society is that it is based within the urban elite (Sundet and Moen 2009). 95
Barkan 2011 96
ibid 97
Communications Commission of Kenya 2013 98
The World Bank 2012b 99
Communications Commission of Kenya 2013 100
Tostensen 2004 101
World Bank 2012b 102
World Bank 2012a, 2012b 103
World Bank 2012a 104
AfDB, OECD, UNDP & UNECA 2012 105
The country ranks 126 out of 185 countries, World Bank 2013b 106
Schwab 2012 107
Møller 2012; World Bank 2012b. However, as just noted in the previous section, it has simultaneously been reported that the tourism subsector earnings grew with 32.8 per cent and that Kenya in fact recorded the best performance to date in 2011 (AfDB, OECD, UNDP and UNECA 2012). 108
Kimenyi 2013; Kenya Ministry of Finance & the World Bank 2012; Barkan 2011 109
Møller 2012; see the various contributions in Wanyande & Okebe 2009, esp. Chemengich 2009 and Wanyande 2009 110
CEDAW 2010 111
http://knbs.or.ke/downloads/pdf/Kenyafacts2012.pdf 112
AfDB, OECD, UNDP & UNECA 2012; World Bank 2012b; Government of the Republic of Kenya 2007 113
http://www.pwc.com/ke/en/pdf/kenya-budget-2012-revenue-and-expenditure-highlights.pdf 114
Government of the Republic of Kenya 2007 115
Oluko-Odingo 2011 116
Kristjanson et al. 2010, see also Mango et al 2009 117
KNBS & ICF MACRO 2010 118
UNDP 2010; Institute of Economic Affairs 2011; Kenya Ministry of Youth Affairs & Sports 2011 119
Kenya Ministry of Youth Affairs & Sports 2011; UNDP 2010 120
UNDP 2010 121
UNDP 2010, p. 4 122
World Bank 2012b 123
Masinde Wamalwa 2009 124
KNBS & ICF MACRO 2010 125
It is not fully clear how city management will align with county management, in particular how this will translate into division of power between county and urban authorities. 126
Social Watch, 2012; African Peer Review Mechanism 2011 127
See Maina et al 2003 128
Maina et al 2003 129
Maina et al 2003; Sundet and Moen 2009 130
Oloo 2013 131
Government of the Republic of Kenya 2007 132
Kenya Vision 2030 133
African Peer Review Mechanism 2011 134
Social Watch, 2012 135
Millennium Development Goals, Status Report for Kenya 2009 136
Stakeholder consultation workshop,PDA 2013 137
UN HR Council 2010
F O O T N O T E S
138
Development Initiatives Africa Hub, 2012 139
http://blogs.worldbank.org/africacan/three-myths-about-aid-to-kenya 140
Development Initiative, 2012 141
Watkins and Alemayehu, 2012 142
Third Annual Progress Report on the Implementation of the First Medium Term Plan 2008-2012 143
Open Budget Survey 2012 144
Ministry of Finance, 2012 145
Interview with Ministry of Finance 146
Whitfield and Therkildsen 2011 147
Christoplos 2012 148
The relevance of the Strategy for development cooperation with Kenya has been reviewed in a Mid Term Evaluation (2011) and a Portfolio analysis (2012), which both concluded that the composition on the portfolio is relevant. 149
OECD/DAC recommended evaluation criteria. 150
Perspectives on Poverty, 2002, Sida. 151
Governments of: Canada, Denmark. Finland, France, Germany, Italy, Japan, Netherlands, Norway, Spain, Sweden, United Kingdom, United States, African Development Bank, Euro-pean Commission Delegation to Kenya, United Nations, World Bank Group. 152
Increased from the original MSEK350 after a mid-term review in 2011. 153
Given the 5 year time period it’s probably a bit ambitious to focus on Impact and so the focus will be mostly on Results, although impact will be included whenever possible. 154
See footnote 3. 155
Attached as Annex I 156
Even though the Country cooperation strategy outlines three main sectors of development cooperation, it should be noted that according to OECD DACs sector definitions the Embas-sy’s development cooperation engagement rather spans across 8-9 sectors. 157
Which will include the findings of the portfolio analysis conducted in 2012. 158
By contrast, the evaluation will present the evaluation team’s own independent assess-ment. 159
The Embassy has suggested that the PDA Interim Report should be a max 25 pages in length with an Executive Summary of 2-3 pages; the full Final report (which will include the evaluation) should be a max of 50 pages in length with an Executive Summary of 2-3 pages. Additional information should be places in appendices. 160
Portfolio Analysis of the Development Cooperation with Kenya, Michael Hauer. 2012 161
That is does not need to be a new contribution but could also be a decision to continue and existing one. 162
We understand that the Embassy is using three main channels: 1) Government, 2) Multi-lateral organisations and 3) Civil society, plus two additional, less used, channels: 4) Private firms and 5) Swedish institutions (twinning projects). According to the contribution manage-ment system PLUS, the Embassy is using mainly three modalities namely: 1) Specific pro-gramme managed by an organisation, 2) Sector programme pooled funding, and 3) Project support (twinning is classified as expert cooperation). 163
This would apply in very few cases. 164
See 2012. Ricardo Wilson-Grau and Heather Britt. Outcome Harvesting, Ford Foundation. 165
See for example ILAC Briefing 26 (Oct 2012): Making Causal Claims, John Mayne

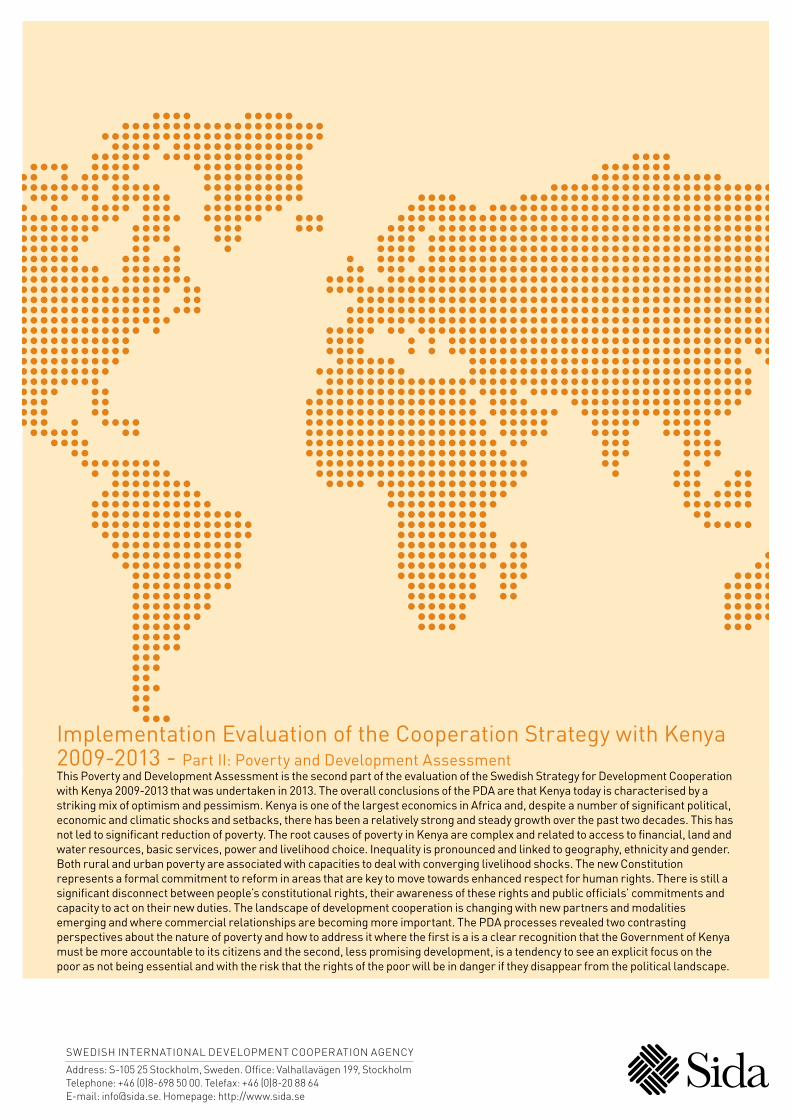
SWEDISH INTERNATIONAL DEVELOPMENT COOPERATION AGENCY
Address: S-105 25 Stockholm, Sweden. Office: Valhallavägen 199, StockholmTelephone: +46 (0)8-698 50 00. Telefax: +46 (0)8-20 88 64E-mail: [email protected]. Homepage: http://www.sida.se
Implementation Evaluation of the Cooperation Strategy with Kenya 2009-2013 - Part II: Poverty and Development Assessment This Poverty and Development Assessment is the second part of the evaluation of the Swedish Strategy for Development Cooperation with Kenya 2009-2013 that was undertaken in 2013. The overall conclusions of the PDA are that Kenya today is characterised by a striking mix of optimism and pessimism. Kenya is one of the largest economics in Africa and, despite a number of significant political, economic and climatic shocks and setbacks, there has been a relatively strong and steady growth over the past two decades. This has not led to significant reduction of poverty. The root causes of poverty in Kenya are complex and related to access to financial, land and water resources, basic services, power and livelihood choice. Inequality is pronounced and linked to geography, ethnicity and gender. Both rural and urban poverty are associated with capacities to deal with converging livelihood shocks. The new Constitution represents a formal commitment to reform in areas that are key to move towards enhanced respect for human rights. There is still a significant disconnect between people’s constitutional rights, their awareness of these rights and public officials’ commitments and capacity to act on their new duties. The landscape of development cooperation is changing with new partners and modalities emerging and where commercial relationships are becoming more important. The PDA processes revealed two contrasting perspectives about the nature of poverty and how to address it where the first is a is a clear recognition that the Government of Kenya must be more accountable to its citizens and the second, less promising development, is a tendency to see an explicit focus on the poor as not being essential and with the risk that the rights of the poor will be in danger if they disappear from the political landscape.