Embed Size (px)
Citation preview
2013 FORECAST: A LOOK AHEADPuget Sound Economic Forecast
Michael DuekerChief Economist
Russell Investments

V810
2013 Economic Outlook: Will we avoid over-exuberant near-term budget slashing?
Michael Dueker, Chief Economist
January 10, 2013
V308
Important Information and Disclosures
Nothing contained in this material is intended to constitute legal, tax, securities, or investment advice, nor an opinion regarding the appropriateness of any investment, nor a solicitation of any type. The general information contained in this publication should not be acted upon without obtaining specific legal, tax, and investment advice from a licensed professional.
Please remember that all investments carry some level of risk, including the potential loss of principal invested. They do not typically grow at an even rate of return and may experience negative growth. As with any type of portfolio structuring, attempting to reduce risk and increase return could, at certain times, unintentionally reduce returns.
Diversification and strategic asset allocation do not assure profit or protect against loss in declining markets.
Forecasting represents predictions of market prices and/or volume patterns utilizing varying analytical data. It is not representative of a projection of the stock market, or of any specific investment.
Bond investors should carefully consider risks such as interest rate, credit, repurchase and reverse purchase transaction risks. Greater risk, such as increased volatility, limited liquidity, prepayment, non-payment and increased default risk, is inherent in portfolios that invest in high yield (“junk”) bonds or mortgage backed securities, especially mortgage backed securities with exposure to sub-prime mortgages.
Indexes are unmanaged and cannot be invested in directly. Past performance is not indicative of future results.
Copyright© Russell Investments 2011. All rights reserved. This material is proprietary and may not be reproduced, transferred, or distributed in any form without prior written permission from Russell Investments. It is delivered on an “as is” basis without warranty.
Russell Investment Group is a Washington, USA corporation, which operates through subsidiaries worldwide, including Russell Investments, and is a subsidiary of The Northwestern Mutual Life Insurance Company.
The Russell logo is a trademark and service mark of Russell Investments.Date of first use: January 2013CORP-7323
3
This presentation was created for informational purposes only and is not meant for further distribution.
V308
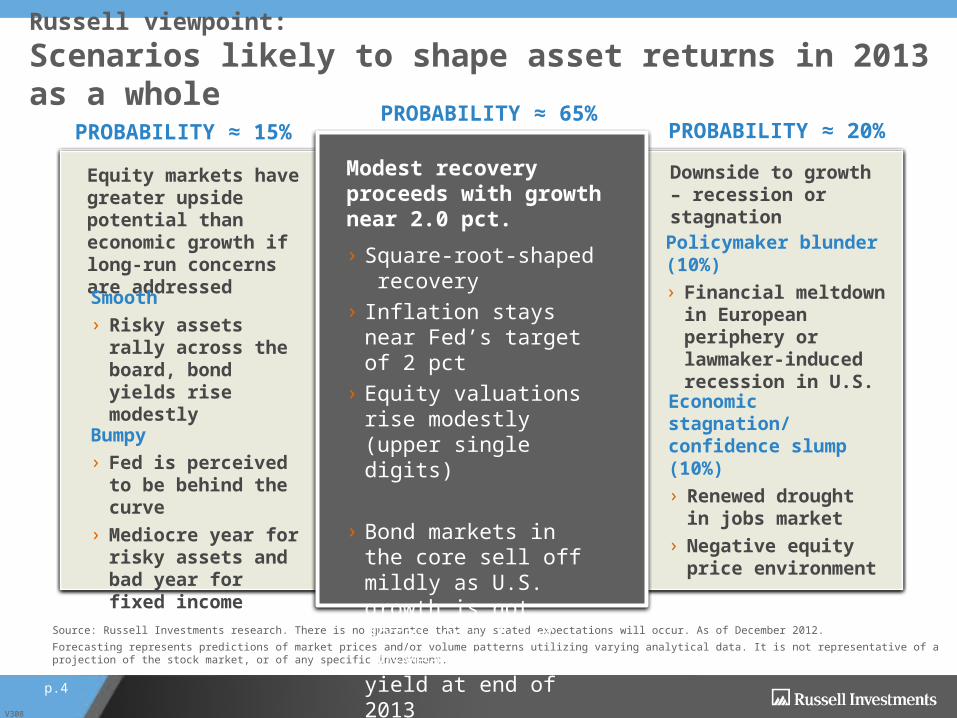
Russell viewpoint:Scenarios likely to shape asset returns in 2013 as a whole
Source: Russell Investments research. There is no guarantee that any stated expectations will occur. As of December 2012.Forecasting represents predictions of market prices and/or volume patterns utilizing varying analytical data. It is not representative of a projection of the stock market, or of any specific investment.
› Square-root-shaped recovery
› Inflation stays near Fed’s target of 2 pct
› Equity valuations rise modestly (upper single digits)
› Bond markets in the core sell off mildly as U.S. growth is not derailed; 2.15% 10-year Treasury yield at end of 2013
Modest recovery proceeds with growth near 2.0 pct.
Downside to growth – recession or stagnation
Equity markets have greater upside potential than economic growth if long-run concerns are addressed
Smooth› Risky assets rally
across the board, bond yields rise modestly
Bumpy › Fed is perceived to be
behind the curve› Mediocre year for
risky assets and bad year for fixed income
PROBABILITY ≈ 15%PROBABILITY ≈ 65%
PROBABILITY ≈ 20%
Policymaker blunder (10%)› Financial meltdown in
European periphery or lawmaker-induced recession in U.S.
Economic stagnation/confidence slump (10%)› Renewed drought in
jobs market› Negative equity price
environment
p.4
V810
5
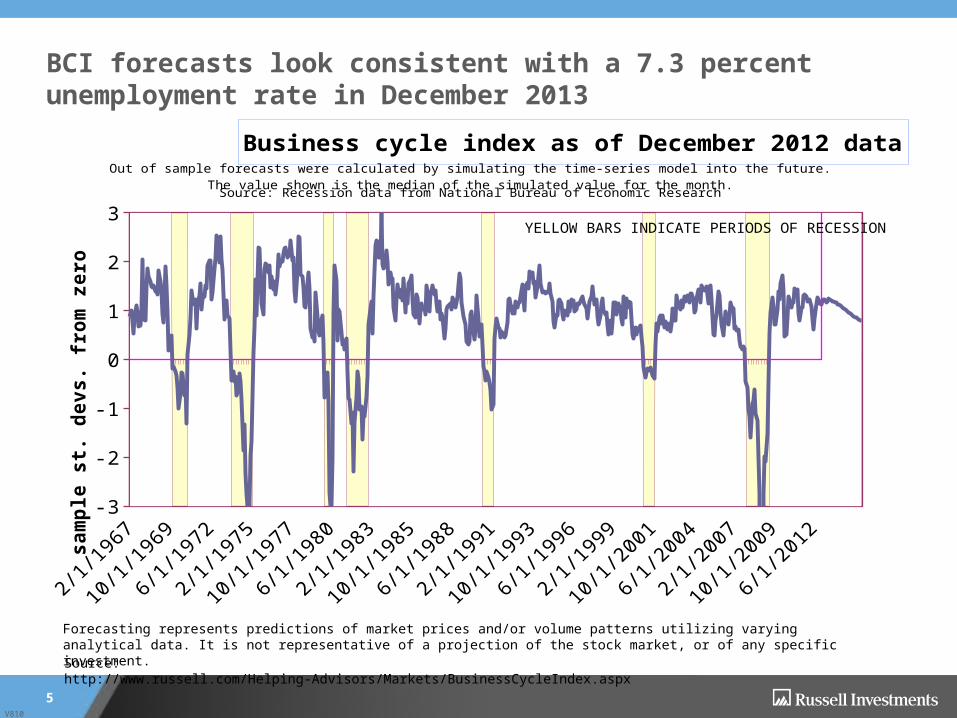
BCI forecasts look consistent with a 7.3 percent unemployment rate in December 2013
Source: http://www.russell.com/Helping-Advisors/Markets/BusinessCycleIndex.aspx
Forecasting represents predictions of market prices and/or volume patterns utilizing varying analytical data. It is not representative of a projection of the stock market, or of any specific investment.
-3
-2
-1
0
1
2
3
Business cycle index as of December 2012 data
sam
ple
st. d
evs.
from
zer
o
YELLOW BARS INDICATE PERIODS OF RECESSION
Out of sample forecasts were calculated by simulating the time-series model into the future.The value shown is the median of the simulated value for the month.Source: Recession data from National Bureau of Economic Research
V810
6
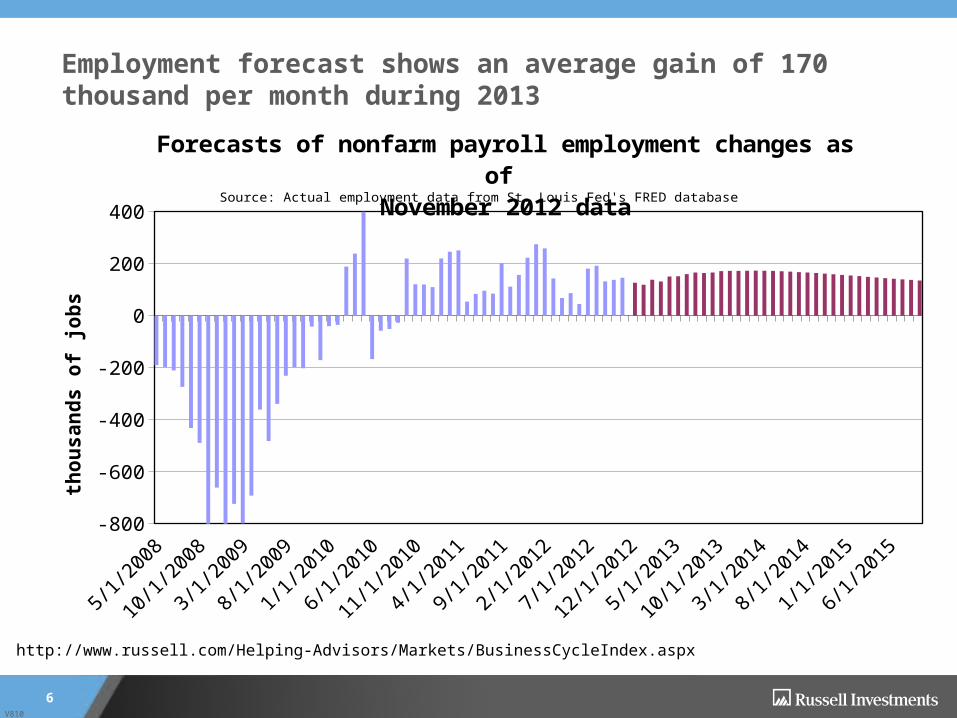
Employment forecast shows an average gain of 170 thousand per month during 2013
http://www.russell.com/Helping-Advisors/Markets/BusinessCycleIndex.aspx
May '0
8
Nov '0
8
May '0
9
Nov '0
9
May '1
0
Nov '1
0
May '1
1
Nov '1
1
May '1
2
Nov '1
2
May '1
3
Nov '1
3
May '1
4
Nov '1
4
May '1
5-800
-600
-400
-200
0
200
400
Forecasts of nonfarm payroll employment changes as of November 2012 data
thou
sand
s of
jobs
Source: Actual employment data from St. Louis Fed's FRED database
V810
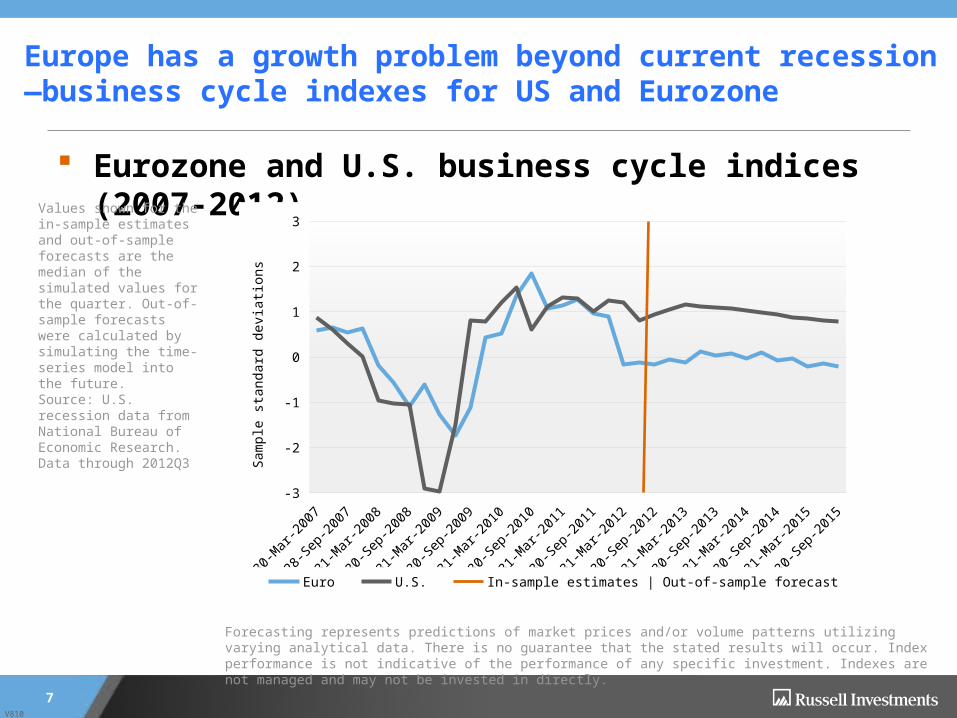
Europe has a growth problem beyond current recession—business cycle indexes for US and Eurozone
7
Eurozone and U.S. business cycle indices (2007-2012)Values shown for the in-sample estimates and out-of-sample forecasts are the median of the simulated values for the quarter. Out-of-sample forecasts were calculated by simulating the time-series model into the future.Source: U.S. recession data from National Bureau of Economic Research. Data through 2012Q3
Forecasting represents predictions of market prices and/or volume patterns utilizing varying analytical data. There is no guarantee that the stated results will occur. Index performance is not indicative of the performance of any specific investment. Indexes are not managed and may not be invested in directly.
2007
2008
2009
2010
2011
2012
2013
2014
2015
-3
-2
-1
0
1
2
3
Euro U.S. In-sample estimates | Out-of-sample forecast
Sam
ple
stan
dard
dev
iatio
ns
V810
8
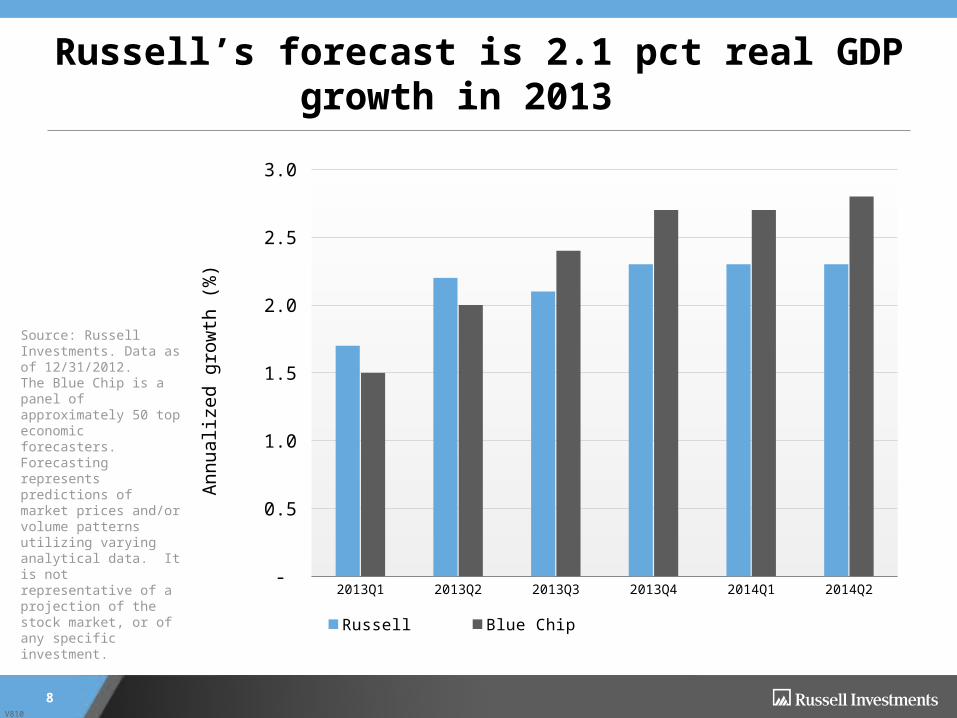
Russell’s forecast is 2.1 pct real GDP growth in 2013
Source: Russell Investments. Data as of 12/31/2012.The Blue Chip is a panel of approximately 50 top economic forecasters.Forecasting represents predictions of market prices and/or volume patterns utilizing varying analytical data. It is not representative of a projection of the stock market, or of any specific investment.
2013Q1 2013Q2 2013Q3 2013Q4 2014Q1 2014Q2 -
0.5
1.0
1.5
2.0
2.5
3.0
Russell Blue Chip
Ann
ualiz
ed g
row
th (%
)
V810
9
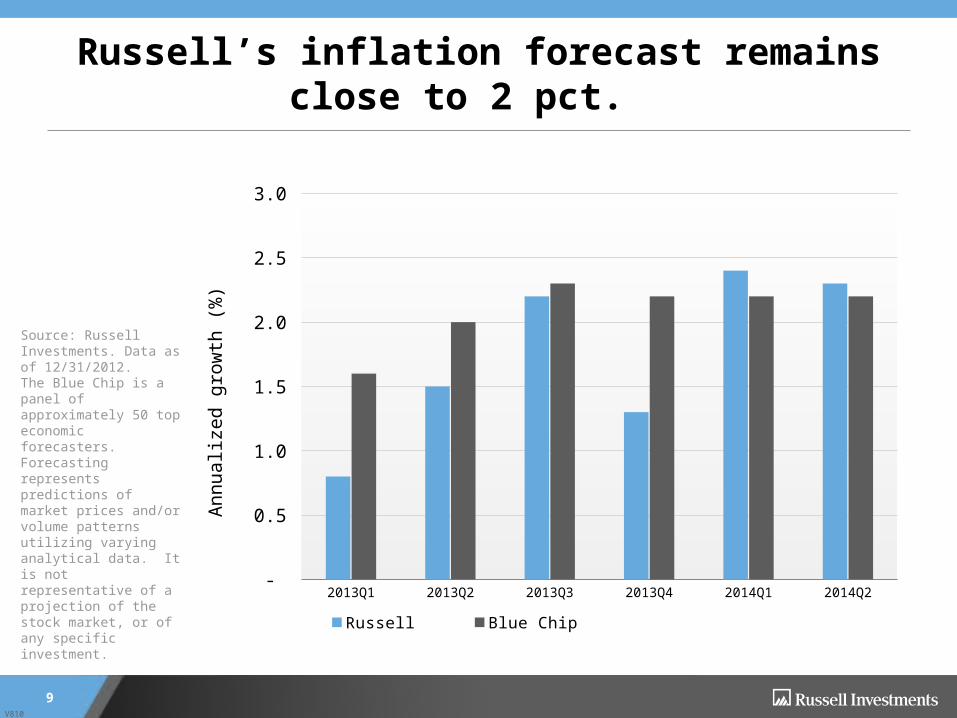
Russell’s inflation forecast remains close to 2 pct.
Source: Russell Investments. Data as of 12/31/2012.The Blue Chip is a panel of approximately 50 top economic forecasters.Forecasting represents predictions of market prices and/or volume patterns utilizing varying analytical data. It is not representative of a projection of the stock market, or of any specific investment.
2013Q1 2013Q2 2013Q3 2013Q4 2014Q1 2014Q2 -
0.5
1.0
1.5
2.0
2.5
3.0
Russell Blue Chip
Ann
ualiz
ed g
row
th (%
)

V810
Investor complaint:
p.10FINANCIAL PROFESSIONAL USE ONLY
For how long do we have to live in a world in which
Greece not getting its next installment of bailout money
could set off a financial crisis? We’re not supposed to be like an emerging-market
economy with recurrent crises? Include additional Greece-like political risk factors on
the list, such as our own fiscal cliff
Answer: for the indefinite future
V810
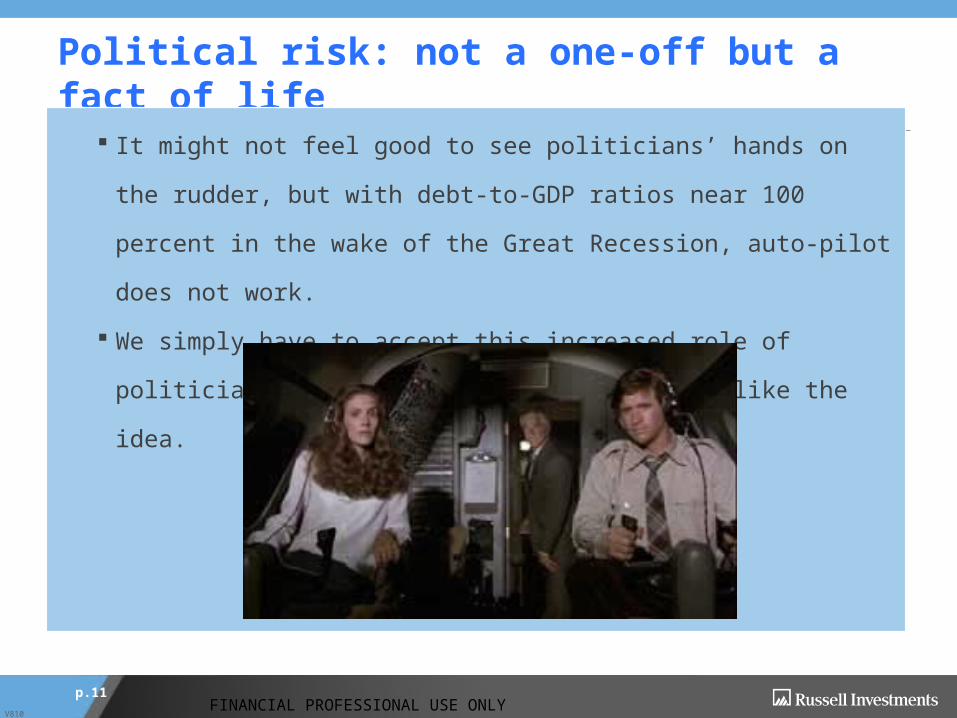
Political risk: not a one-off but a fact of life
p.11FINANCIAL PROFESSIONAL USE ONLY
It might not feel good to see politicians’ hands on the rudder, but with
debt-to-GDP ratios near 100 percent in the wake of the Great Recession,
auto-pilot does not work. We simply have to accept this increased role of politicians in our lives, as
much as we dislike the idea.

V810
Why QEternity? Nominal GDP growth has not made the grade
p.12
2006
-04-01
2006
-07-01
2006
-10-01
2007
-01-01
2007
-04-01
2007
-07-01
2007
-10-01
2008
-01-01
2008
-04-01
2008
-07-01
2008
-10-01
2009
-01-01
2009
-04-01
2009
-07-01
2009
-10-01
2010
-01-01
2010
-04-01
2010
-07-01
2010
-10-01
2011
-01-01
2011
-04-01
2011
-07-01
2011
-10-01
2012
-01-01
2012
-04-01
-4
-2
0
2
4
6
8
4 qtr nominal GDP growth
4 qtr nominal GDP growth
V81013
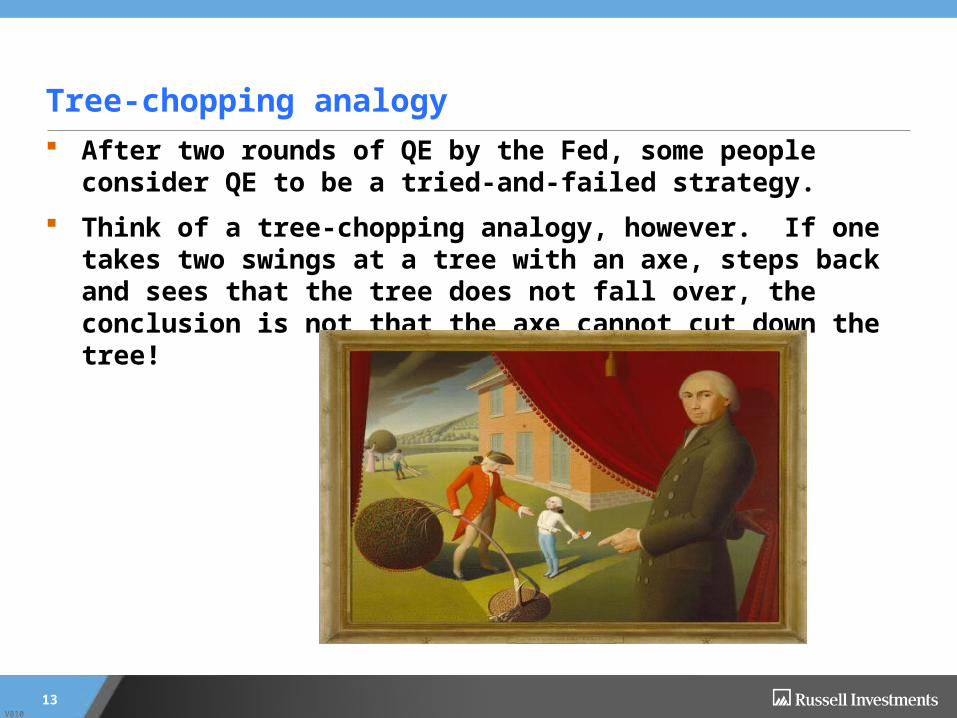
Tree-chopping analogy After two rounds of QE by the Fed, some people consider QE to
be a tried-and-failed strategy. Think of a tree-chopping analogy, however. If one takes two
swings at a tree with an axe, steps back and sees that the tree does not fall over, the conclusion is not that the axe cannot cut down the tree!

V810
The Fed’s ‘scary’ balance sheet: Will the Fed be caught holding the bag?
p.14

V810
How the Fed will shrink its balance sheet (when the time comes)
p.15 Illustration only for future 3-month T-bill yield

V810
V810
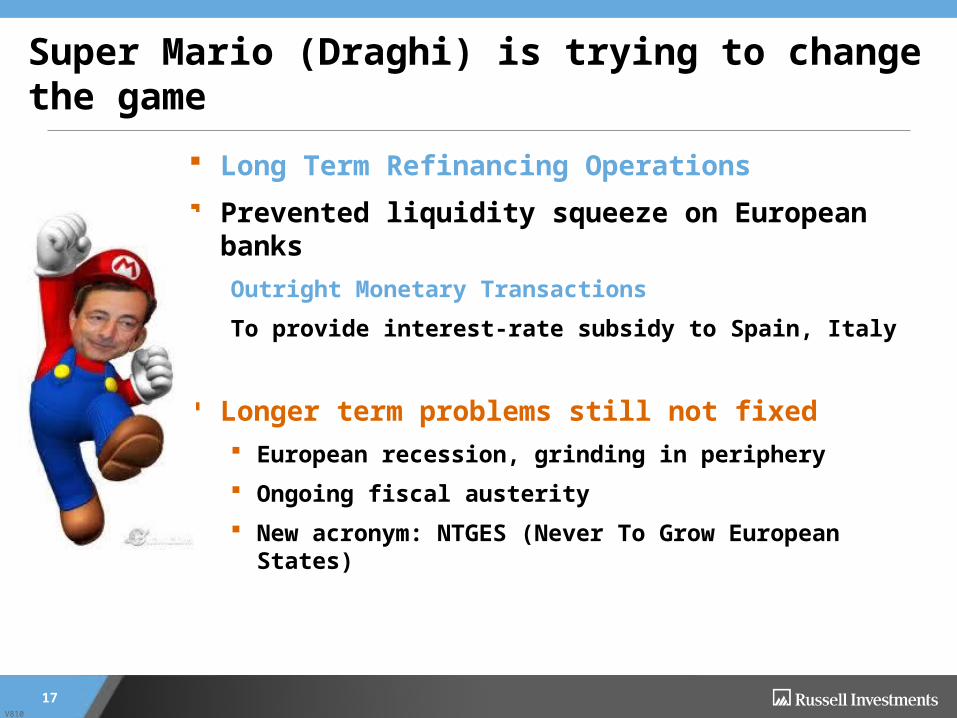
Super Mario (Draghi) is trying to change the game
Long Term Refinancing Operations Prevented liquidity squeeze on European banks
Outright Monetary TransactionsTo provide interest-rate subsidy to Spain, Italy
Longer term problems still not fixed European recession, grinding in periphery Ongoing fiscal austerity New acronym: NTGES (Never To Grow European
States)
17

V810
Greece is the Corvair of Europe:Insolvent at any interest rate
ECB bond purchases may solve Spain and Italy funding needs
Potential crisis solution: stronger growth, banking union, subsidized interest rates
p.18

V810
p.19
The pain in Spain....
0
5
10
15
20
25
30
Germany Italy France Ireland Portugal Greece Spain
%
Source: Datastream
Unemployment Rates
Latest 2007
V810
“You can always count on Americans to do the right thing—after they’ve tried everything else”
—Winston Churchill
20
V810
“You can always count on Americans to do the right thing—after they’ve tried everything else”
—Winston Churchill.
21
With respect to the current situation in Europe, try substituting Germans for Americans in the quote above and see how it looks.
V810
p.22
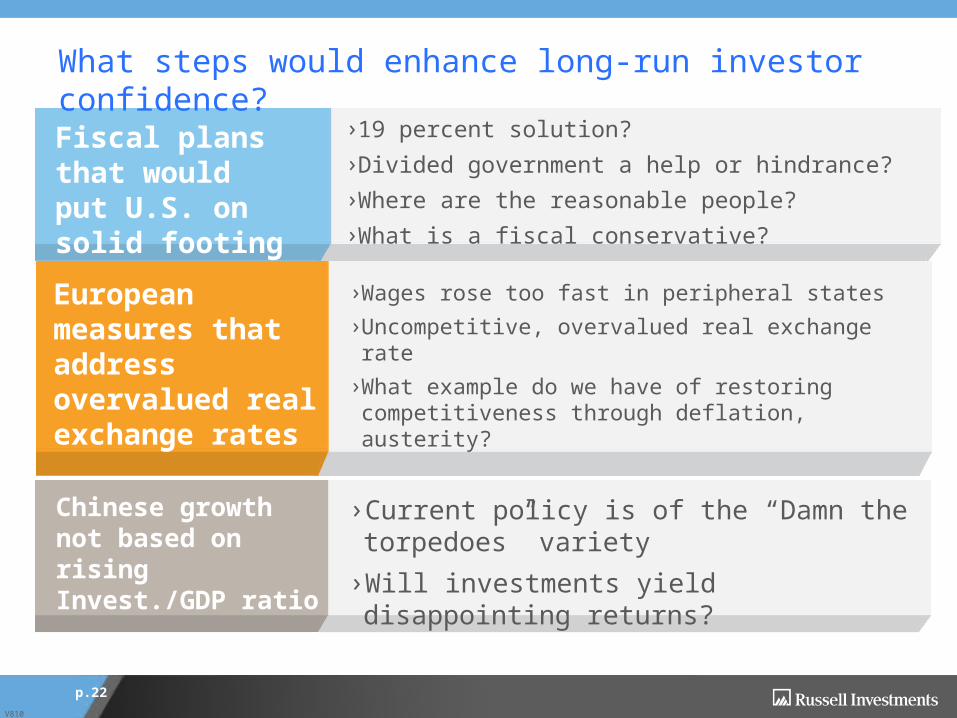
Fiscal plans that would put U.S. on solid footing
› 19 percent solution?›Divided government a help or hindrance?›Where are the reasonable people?›What is a fiscal conservative?
European measures that address overvalued real exchange rates
›Wages rose too fast in peripheral states›Uncompetitive, overvalued real exchange rate›What example do we have of restoring competitiveness through deflation, austerity?
Chinese growth not based on rising Invest./GDP ratio
›Current policy is of the “Damn the torpedoes” variety›Will investments yield disappointing returns?
What steps would enhance long-run investor confidence?

V810
p.23
China’s unbalanced economy
20
25
30
35
40
45
50
55
1980 1985 1990 1995 2000 2005 2010
% of GDP
Source: Datastream
China: Consumption & Investment % of GDP
Fixed Investment Consumption

V810
If you build it, will they come?
Austria in Guangdong The ghost city of Ordos

www.russell.com