Embed Size (px)
Citation preview

79
Chapter 5
Micellar Structure of BlockCopolymers in an LC Solvent
Much of the work in this chapter represents the combined efforts both of myself and of Neal Scruggs.
We acknowledge the support of Dr. Jyotsana Lal and Ed Lang in designing and conducting the neu-
tron scattering experiments. In addition, Dr. Michael Kempe and Zuleikha Kurji provided assistance
in carrying out the neutron scattering experiments during separate trips to Argonne National Labo-
ratory. Finally, the work in this chapter could not have been done without materials obtained from
Dr. David Uhrig of the Macromolecular Complex Systems group at Oak Ridge National Laboratory.
They provided most of the polystyrene-polybutadiene diblock copolymers used for this study.
5.1 Abstract
Block copolymers comprised of polystyrene (PS) segments and side-group liquid crystal polymer
(SGLCP) segments self-assemble when mixed in a nematic liquid crystal (LC) solvent to form LC
gels. We investigate a series of diblock PS-SGLCP and triblock PS-SGLCP-PS copolymer gels by
small-angle neutron scattering (SANS) and rheometry. These studies show that the LC order of the
host solvent imparts unique properties to the micellar gels. The micelles and intermicellar network
inherit the anisotropy of the host solvent, and dramatic structural and rheological changes occur
across the TNI , due to a changing solvent selectivity. SANS shows that the micelles are disordered,
and the micelles decrease in size with temperature. The microphase separation temperature TMST

80
can be coincident with or higher than the TNI depending on the copolymer block lengths. Rheom-
etry reveals that both diblock and triblock copolymer mixtures can exhibit solid-like properties,
depending on the PS and SGLCP block lengths. Both SANS and rheometry show that the driving
force for self-assembly is increased with the PS block size: a larger PS block size results in a higher
TMST and a higher sol-gel transition temperature. The block copolymer micelles have a “hairy”
structure with extended SGLCP coronas, small PS cores swollen with 5CB, and a soft intermicellar
potential.
5.2 Introduction
Block copolymers are comprised of chemically distinct polymers covalently linked together. When a
block copolymer is dissolved in a solvent that preferentially solvates one block, the block copolymers
oftentimes assemble into aggregates known as micelles, and this dramatically alters the rheological
properties of the solution. Unlike liquids, a micellar suspension can have a finite yield stress, but
it can also coat a surface or fill a container. This type of behavior that is neither purely liquid-like
or purely solid-like is termed viscoelastic, and these types of materials have wide-ranging practical
interest. Block copolymer additives are used regularly in the cosmetics industry, and potential uses
include their addition to jet fuels to prevent droplet formation [1] and as hydrogels to form scaffolds
for tissue regeneration [2].
Block copolymers can also be combined with LC order for use in functional materials. We
have demonstrated that triblock copolymers composed of a side-group LC polymer (SGLCP) mid-
block and non-mesomorphic polystyrene (PS) endblocks can form LC gels when mixed with a small
molecule liquid crystal (Chapter 2). In this study, we investigate the structure of the LC copolymers
in the small molecule LC 4-pentyl-4′-cyanobiphenyl (5CB). PS is insoluble in nematic 5CB due to
the entropic penalty of dissolving an isotropic polymer in a liquid crystal phase [3], resulting in
self-assembly of the triblock copolymers to form an LC gel. We study a series of SGLCP-PS di-
block and PS-SGLCP-PS triblock copolymers with different block lengths by SANS and rheometry.
An interesting property of the gels is that they undergo a nematic-to-isotropic transition near 35

81
oC. Therefore, the nematic-to-isotropic transition of the solvent is expected to result in significant
changes to the self-assembled micellar structure. Both SANS and rheometry reveal significant struc-
tural changes with temperature across the TNI . Also, the PS block length is a significant parameter
for the phase behavior of the gels, and samples with large (> 100 kg/mol) PS blocks form gels even
above the TNI .
5.3 Experimental
5.3.1 Preparation of nematic gels
The synthesis and characterization of the LC homopolymers and copolymers and the preparation
of the LC gels was carried out as described in Chapter 2. The diblock and triblock PS-SGLCP
copolymers are named by the size of the SGLCP block, the size of the PS block, and the polymer ar-
chitecture ( “AB” for diblock, “ABA” for triblock, and “LCP” for SGLCP homopolymer), as shown
in Table 5.1. The homopolymers, triblock prepolymers, and diblock prepolymer for 890(70)AB and
840(190) AB were purchased and used as received from Polymer Source. All the other diblock pre-
polymers were obtained from the Macromolecular Complex Systems group from Oak Ridge National
Labs and used as received.
5.3.2 LC phase identification
The transition temperatures of the LC gels were determined using a Zeiss polarized optical micro-
scope (POM) with a Mettler FP82 hot stage. The temperature was slowly raised at 1 oC/min, and
the phases were identified along with the temperature at which phase transitions began. Some sam-
ples exhibited a biphasic region in between single-phase isotropic and single-phase nematic mixtures.
The TNI was taken to be the onset temperature of the biphasic region.

82
5.3.3 Rheometry
Rheometry was performed on a TA Instruments ARES-RFS rheometer equipped with a 25 mm
diameter titanium shear cell. Except where otherwise noted, rheometry was performed in a cone-
and-plate geometry having a 0.0202 radian cone angle. All experiments were performed in the linear
regime as verified by dynamic strain sweeps.
5.3.4 SANS
SANS experiments were performed on the small-angle scattering instrument (SASI) at the Intense
Pulsed Neutron Source at Argonne National Laboratory. Diblock and triblock copolymer samples
were mixed with perdeuterated 5CB (D5CB) [4] at concentrations of 5 and 10 wt %. The samples
were loaded into 1 mm-thick quartz cells, except where otherwise noted, and the cells were placed in
a temperature-controlled sample holder. The scattering experiments were performed on polydomain
samples at temperatures ranging between 25 oC and 60 oC. Polydomain samples can be azimuthally
averaged and therefore have a much better signal to noise ratio compared to monodomain sam-
ples. Only selected samples were aligned to form monodomains for investigation under SANS. The
scattering trace for pure 5CB was used as a background.
5.4 Results
5.4.1 Polymer characteristics and phase behavior
A series of LC diblock copolymer samples were prepared in addition to an LC triblock copolymer
(Table 5.1). The diblock copolymers were designed to investigate a series of block copolymers
with varying PS block size, LC block size, and overall molecular weight. The diblock copolymers
590(40)AB, 530(60)AB, and 620(80)AB have similar LC block Mn but different PS block Mn. The
diblocks 620(80)AB and 890(70)AB have similar PS block sizes with different LC block sizes. Finally,
450(120)AB and 840(190)AB have similar ratios of PS block Mn to LC block Mn with different
overall Mn. These diblock copolymers can be compared to triblock copolymers 1320(60)ABA and

83
800(20)ABA which can form “bridges” where one polymer strand associates with two different
micelles.
Table 5.1: Polymer characteristics
LC BLock Composition
Polymer PDI LC Block Mn PS Block Mn 1,2 Content 1,4 Content Mesogen Content
(kgmol
) (kgmol
) (mol %) (mol %) (mol %)
710LCP 1.08 713 0 8 3 89
500LCP 1.15 497 0 7 11 82
590(40)AB 1.37 592 40 21 1 78
530(60)AB 1.09 534 60 24 3 73
890(70)AB 1.11 886 70 18 12 70
620(80)AB 1.13 620 80 9 5 86
450(120)AB 1.65 445 120 31 1 68
840(190)AB 2.06 839 190 11 23 66
1320(60)ABA 1.40 1321 67,57 16 14 70
800(20)ABA 1.20 799 14,24 8 10 82
The phase behavior of PS [3] in 5CB and the present SGLCP [5] in 5CB has previously been
studied. PS is insoluble in nematic 5CB, and the SGLCP was found to be soluble at all concentrations
tested, up to concentrations of 20 wt %. Therefore, micelles formed by PS-SGLCP block copolymers
in 5CB will consist of a PS core and an SGLCP corona.
All polymers were soluble in 5CB in both the nematic and isotropic phases at concentrations
up to 10 wt %. Mixtures of 710LCP, 590(40)AB, 620(80)AB, 840(190)AB, and 800(20)ABA with
5CB had a biphasic region between the nematic and isotropic phases. The TNI was taken to be the
onset of this biphasic transition, observed under polarized optical microscopy. Pure 5CB has a TNI
of approximately 35.2 oC, and D5CB has a slightly lower TNI of 33.5 oC.
Single phase mixtures of block copolymer in 5CB showed a homogenous nematic texture under
the microscope. This agrees with previous studies [6], which found that LC diblock copolymers with
large LC block fractions (greater than 90%) formed uniform nematic solutions, as observed under
optical microscopy. In contrast, Finkelmann and coworkers observed that block copolymers with
smaller LC block fractions can form micrometer-thick, phase-separated threads when mixed with a
small molecule nematic LC [6].

84
5.4.2 Neutron scattering
SANS experiments give information about structure present on various length scales. Information
at larger length scales is reflected at smaller scattering angles, and the characteristic length scale is
inversely related to the scattering vector q = (4π/λ) sin(θ/2). We performed SANS experiments with
q ranging between 0.0067 A−1 and 1.0 A−1. Scattering at low q (< 0.03 A−1) reveals information
about micellar ordering and structure. The mid-q region of the scattering pattern (0.03 A−1 <
q < 0.10 A−1) reflects intrachain correlations, and the high q region gives information about the
concentration of scattering centers in the sample and reflects incoherent background scattering.
Scattering experiments were performed on monodomain SGLCP homopolymer 710LCP in D5CB
to investigate the conformation of the SGLCP in solution. The scattering pattern for SGLCP
homopolymer 710LCP shows much stronger scattering in the direction perpendicular rather than
parallel to the director (Fig. 5.1), indicating that the polymer backbone conformation is anisotropic
and preferentially extended along the nematic director. The bow-tie shape observed in the scattering
pattern has previously been observed in highly extended side-on side-group LC polymers [7, 8] and
main-chain LC polymers [9] and suggests a highly extended polymer conformation. A Debye model
fit gives an approximate anisotropy R‖/R⊥ of 5 [5]. Neutron scattering patterns for shear-aligned
triblock gels show that the anisotropy observed for SGLCP homopolymer in solution is also present
in the physically associated polymer network (Fig. 5.2). The scattering patterns for the gels exhibit
a smaller anisotropy compared to the SGLCP homopolymer. For both 710LCP and 1320(60)ABA,
the scattering patterns are isotropic for temperatures higher than the TNI .
SANS experiments on polydomain diblock and triblock polymers in D5CB reveal the micellar
structure present (all SANS data is given at the end of the chapter in Section 5.6). For samples at
a given concentration, the data converge onto a single curve in the mid-q region of the spectrum,
overlapping with the SANS data for an SGLCP homopolymer of a similar concentration (Fig. 5.3).
Therefore, the mid-q region is dominated by single chain contributions. Micellar structure is reflected
at lower q, and, relative to homopolymers, diblock and triblock copolymers have significant low-q
scattering in the nematic phase (Fig. 5.3). While block copolymer micelles in selective isotropic

85
-0.10 -0.05 0.00 0.05 0.10-0.2
-0.1
0.0
0.1
0.2
log (I)
o
o
qy (A-1)
q y (A
-1)
-5.0
-4.0
-3.0
-2.0
-1.0
-0.0
Figure 5.1: Neutron scattering pattern for a monodomain solution of 710LCP in perdeuterated5CB. Uniform alignment was achieved by coating the cell surface with a rubbed polyimide layer.The double-headed arrow denotes the director, and qx and qy denote components of the scatteringvector.
-0.3 -0.2 -0.1 0.0 0.1 0.2 0.3-0.3
-0.2
-0.1
0.0
0.1
0.2
0.3
log (I)
o
o
q y (
A-1)
qx (A-1)
-5.0
-4.0
-3.0
-2.0
-1.0
-0.0
-0.3 -0.2 -0.1 0.0 0.1 0.2 0.3-0.3
-0.2
-0.1
0.0
0.1
0.2
0.3
log (I)
o
o
q y (
A-1)
qx (A-1)
-5.0
-4.0
-3.0
-2.0
-1.0
-0.0
Figure 5.2: Neutron scattering pattern for shear-aligned 1320(60)ABA in D5CB at 5 wt % (left), and10 wt % (right). The double-headed arrow denotes the director, and qx and qy denote componentsof the scattering vector. The samples were shear aligned by hand.

86
10-2 10-1 10010-3
10-2
10-1
100
101
102
103
10 wt %5 wt %
oo
I (a.
u.)
q (A-1)10-2 10-1 100
10-3
10-2
10-1
100
101
102
103
I (a.
u.)
q (A-1)
590(40)AB 530(60)AB 620(80)AB 450(120)AB 890(70)AB 840(190)AB 1320(60)ABA 500LCP
Figure 5.3: Neutron scattering pattern for LC polymers in D5CB. All data are for polydomainsamples at 25 oC, with the exception of 890(70)AB and 1320(60)ABA. The scattering pattern for890(70)AB was collected at 29 oC. 1320(60)ABA was aligned by shear, and the data shown wereaveraged over a 15o wedge region oriented along the direction parallel to the director.
solvents oftentimes assemble into hexagonally ordered phases [10, 11, 12, 13], the block copolymer
micelles in the present system are disordered, as evidenced by the absence of Bragg lattice peaks.
In principle, we would like to fit the scattering patterns with an appropriate model that includes
the form factor of the micelle along with a structure factor that accounts for micelle-micelle cor-
relations [14, 15]. A proper fit could provide quantitative data about the size of the micelle core,
the micelle corona, and the intermicellar distance [12, 16]. However, several difficulties impeded
useful fitting of the data. The solvent is not matched to either block of the copolymer samples, and
therefore the form factor must account for scattering from both the micellar cores and the corona.
The cores may be highly swollen with solvent, and the aggregation number of the micelles is un-
known. Therefore, fitting requires a large number of parameters that have not been independently
measured. We therefore chose to rely on the qualitative features of the neutron scattering patterns
to gain insight into the block copolymer structure and, in particular, its temperature dependence.
Diblock and triblock gels show one or more peaks in the scattering pattern at low q (Section 5.6).
Most samples have a peak near q = 0.008 A−1, and data for 530(60)AB and 620(80)AB show a second
peak near q = 0.02 A−1 (Figs. 5.5 and 5.7). The position of the first peak changes with temperature
and concentration, and it depends on the polystyrene block length (Table 5.2). The position of

87
Table 5.2: Peak positions in 10−3 A−1 for block copolymer-D5CB mixtures at 25 oC, TNI - 2 oC,and TNI + 2 oC. The lowest q probed is 6.7 10−3 A. “NP” means “no peak”.
25 oC TNI - 2 oC TNI + 2 oC
Polymer 5 wt % 10 wt % 5 wt % 10 wt % 5 wt % 10 wt %
560(40)AB 9.8 9.8 10.8 10.8 NP NP540(60)AB 8.1 8.1 8.1 7.7 NP NP850(70)AB 8.1 8.9 N/A N/A N/A N/A600(80)AB ≤ 6.7 ≤ 6.7 ≤ 6.7 ≤ 6.7 NP NP410(120)AB ≤ 6.7 ≤ 6.7 7.0 7.4 7.0 7.4910(190)AB 7.0 7.0 7.0 7.0 7.0 7.0
1340(60)ABA ≤ 8.7 ≤ 8.7 N/A N/A NP NP
the peak is qualitatively correlated with the size of the micelles. In most mixtures, the peak shifts
to higher q with increasing polymer composition and temperature. For example, at 25 oC, three
diblock samples have peaks below 0.067 A−1, but above the TNI two of these peaks shift to higher
q and only the 600(80) gels retain peaks below 0.067 A−1. The PS block length also affects the
peak position, as can be seen by comparing the diblock series 564(40)AB, 540(60)AB, 600(80)AB,
and 410(120)AB (see the data for TNI + 2). The peak shifts to lower q with increasing PS block
length. These results show that smaller micelles are formed at higher polymer concentrations, higher
temperatures, and with copolymers with smaller PS block lengths.
Increasing the temperature across the TNI significantly diminishes the low-q scattering for most
but not all mixtures (Section 5.6). The loss of low-q scattering is associated with the loss of mi-
crophase separated structure, and the temperature above which the copolymers exist as free chains
in solution is known as the microphase separation temperature TMST . We use the expression mi-
crophase separation temperature to distinguish the present samples from block copolymer micelles
which are ordered on a periodic lattice and show order-disorder transitions [17], although the terms
are oftentimes used interchangeably [18]. Diblock and triblock copolymers with PS block smaller
than 80 kg/mol show a TMST coincident with the TNI of the gel (Figs. 5.4, 5.5, 5.6, and 5.10). This
is clearly shown by a dramatic drop in low-q intensity and loss of features in the data at low q. The
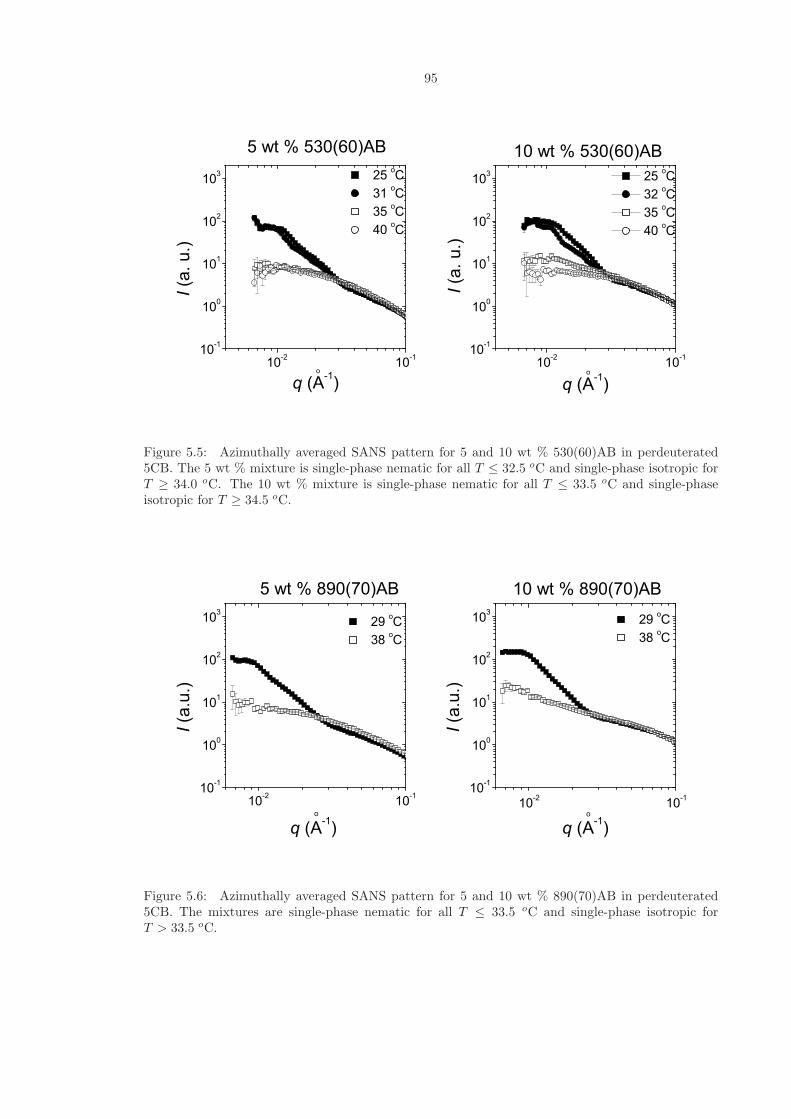
diffuse excess scattering observed for 530(60)AB (Fig. 5.5) is likely due to compositional fluctuations

88
in the vicinity of the TMST [17]. By contrast, diblock copolymers with larger PS blocks show low-q
scattering above the TNI for some concentrations. In the case of 530(60)AB, a 5 wt % mixture has
a TMST coincident with the TNI , but a 10 wt % mixture shows significant low-q scattering with
discernable features up to 40 oC (Fig. 5.7). 450(120)AB mixtures with 5CB show micellar structure
above the TNI for both 5 wt % and 10 wt % mixtures. The TMST is approximately 50 oC for 10
wt % 450(120)AB (Fig. 5.8). In the case of 840(190)AB, 5 and 10 wt% gels show significant low-q
scattering at all temperatures tested, up to 60 oC (Fig. 5.9).
Increasing the temperature within the nematic phase also results in decreased scattering at low q.
A decreased volume fraction of micelles due to an increasing number of free chains is unlikely given
the low solubility of PS in nematic 5CB [3]. If the concentration of associated chains is independent
of temperature in the nematic phase and micelles are assumed to be non-overlapping particles, then
decreased scattering at low q is correlated with a smaller aggregation number [19].
5.4.3 Rheometry
Dynamic mechanical rheological measurements at low strains give information about the equilibrium
mechanical properties of the diblock and triblock copolymer mixtures with 5CB. The data from
dynamic rheological measurements for all the diblock and triblock copolymer mixtures in 5CB is
given in Section 5.7. The various samples with different PS and SGLCP block lengths and polymer
architecture (diblock vs. triblock) share many characteristics in their rheological behavior. All the
systems show solid-like behavior at sufficiently high polymer concentrations, with G′ >> G′′ and a
plateau modulus over a wide range of frequencies. These properties are characteristic of crosslinked
rubbers [20]. For the purposes of this study, the term “gel” will refer to a mixture that exhibits solid-
like behavior over a wide range of frequencies [21]. The mixtures that do not show solid-like behavior
in the nematic phase (e.g., 5 wt % 530(60)AB at 25 oC, Fig. 5.13), do show viscoelastic behavior in
the nematic phase – their rheological behavior is not like that of an elastic solid (G′ >> G′′, and G′
frequency independent) nor a like that of a liquid (G′′ >> G′ , G′ ∼ ω2 , G′′ ∼ ω).
Both diblock and triblock LC copolymers can form gels in 5CB, as evidenced by the rheological

89
behavior of 5 wt % 850(70)AB (Fig. 5.15) and 5 wt % 1340(6)ABA (Fig. 5.23). Bridging between
micelles, where one polymer strand has its end associated in two different micelle cores, is only
possible in triblock copolymer mixtures. The fact that diblock LC copolymers can form gels indicates
that micellar repulsion plays an important role in gelation. These diblock and triblock gels share
characteristics with the “soft” gel phases [11, 13, 22], which are disordered and have a modulus
significantly lower than that for ordered micellar phases, typically 104 Pa [13].
In all mixtures studied, significant changes to the rheological behavior were observed with tem-
perature, in particular near the TNI (e.g., Figs. 5.24 and 5.22). Many mixtures transition from
viscoelastic behavior below the TNI to terminal behavior (G′ << G′′, G′′ ∼ ω) above the TNI (e.g.,
Fig. 5.15). All the mixtures exhibited liquid-like behavior at sufficiently high temperatures, but
recovered their viscoelastic behavior on cooling (e.g., Figs. 5.24 and 5.22). In addition, increasing
the temperature within the nematic phase results in a decreased storage modulus for all diblock and
triblock mixtures.
The rheological behavior of the SGLCP block copolymer – 5CB mixtures depends on the PS
and SGLCP block lengths. Diblock copolymers with larger PS blocks have higher storage moduli
at a particular concentration, as shown in the series 590(40)AB, 530(60)AB, and 620(80)AB at a
concentration of 10 wt % (Table 5.3). Furthermore, diblock copolymers with larger PS block lengths
more readily show gel-like behavior. For example, the dynamic rheometry measurements show that
5 wt % 620(80)AB is a gel (Fig. 5.17), while 5 wt % 590(40)AB and 530(60)AB are viscoelastic
liquids (Figs. 5.11 and 5.13). Diblock copolymers with longer SGLCP blocks also have a higher
storage modulus, as can be seen by comparing 890(70)AB to 530(60)AB (Table 5.3).
The sol-gel transition temperature, which marks the transition from solid-like behavior to liquid-
like behavior, also depends on the PS block length of the copolymer in the mixture. The sol-gel
transition is taken to be the temperature above which the loss modulus exceeds the storage modulus
(G′′ > G′) at a frequency of 1 rad/s. Almost all the samples studied have a sol-gel transition
coincident with the TNI (Table 5.4). Two notable exceptions are gels formed by the copolymers
with the largest PS blocks, 840(190)AB and 450(120)AB. In the case of 5 wt % 840(190)AB, the
90
Table 5.3: Gel storage modulus (Pa) at 20 oC and 1 rad/s
Polymer 5 wt % 10 wt %
590(40)AB 4.52 53.3530(60)AB 2.93 99.4890(70)AB 28.8 202620(80)AB 29.1 201450(120)AB 14.9 142840(190)AB 48.5 100
1320(60)ABA 68.6 192800(20)ABA 70.3 196
sol-gel transition occurs well above the TNI of the gel, at approximately 42 oC (Fig. 5.22). Also, 10
wt % 450(120)AB exhibits a significant range of temperatures above the TNI , up to 40 oC, where it
exhibits viscoelastic behavior with G′ ∼ G′′ (Figs. 5.35 and 5.36).
This temperature-dependent and frequency-dependent behavior suggest that the PS aggregates
are not glassy (even though Tg for PS is ∼ 105 oC). Polymers linked together with glassy crosslinks
exhibit solid-like behavior at all frequencies [23]. For the present samples, we observe liquid like
behavior at low frequencies, especially near the TNI . For example, 5 wt % 1320(60)ABA shows
liquid-like behavior at 34 oC for frequencies lower than 0.1 rad/s (Fig. 5.23). We conclude that the
PS endblocks are swollen with LC solvent and that PS endblocks can disengage from the physical
crosslinks on finite time scales. This is consistent with the “slow” dynamic relaxation processes
observed in dynamic light scattering studies (Chapter 4).
A comparison between the rheological behavior of triblock and diblock samples shows that bridg-
ing does take place in triblock gels and increases the modulus relative to diblock gels. Diblock
530(60)AB has a matching PS endblock and the same mass ratio of PS to SGLCP as that of triblock
1320(60)ABA. Triblock 1320(60)ABA forms a gel at 5 wt % (Fig. 5.23), but a 5 wt % mixture of
530(60)AB does not (Fig. 5.13). A comparison of 590(40)AB and 800(20)ABA, which has a shorter
PS block, provides further evidence of bridging. While 5 wt % 800(20)ABA exhibits a plateau
modulus at low temperatures (Fig. 5.25), 5 wt % 590(40)AB does not (Fig. 5.11).
We can gain insight into the relationship between micelle formation and the gels’ rheological

91
Table 5.4: The reduced temperature T − TNI for the sol-gel transition measured by rheology andthe TMST measured by SANS. The rheological measurement is the temperature (while heating) atwhich the storage modulus drops below the loss modulus, and the SANS measurement is the lowesttemperature at which the low-q scattered intensity is significantly diminished (overlapping or nearlyoverlapping with the SANS data for 710LCP) and lacks features characteristic of micellar structure.
Rheology (oC) SANS (oC)Polymer 5 wt % 10 wt % 5 wt % 10 wt %
590(40)AB no gel -1.0 3.0 2.0530(60)AB no gel -0.5 7.5 6.5890(70)AB 0.0 0.0 4.5 4.5620(80)AB 1.5 1.5 7.5 3.5450(120)AB -1.0 2.5 >17.0 16.5840(190)AB 6.0 17 >27.5 >27.5
1320(60)ABA 0.0 0.0 6.5 6.5
properties by comparing the temperatures at which micellar structure vanishes in the SANS experi-
ments to the sol-gel transition measured by rheology (Table 5.4). The neutron scattering experiments
are performed at much larger temperature intervals, and therefore they necessarily have a greater
uncertainty in temperature. Nevertheless, the comparison shows an interesting correlation between
micelle formation and rheology. First, the data suggest that micelles can persist well above the
sol-gel transition measured by rheology. In the most extreme case, 910(190)AB gels display a sol-gel
transition at 45 oC, but micelles persist up to at least 60 oC. The data also show that the location of
the sol-gel transition is correlated with micelle formation. Diblocks that gel in 5CB above the TNI
(600(80)AB, 410(120)AB, and 910(190)AB) also show low-q scattering far into the isotropic phase
(Table 5.4).
5.5 Discussion
LC gels formed by diblock and triblock LC copolymers represent a novel example of block copolymer
self-assembly for two distinct reasons. First, the gel structure inherits the anisotropy of the host
solvent. Micelles are anisotropic, as is the interconnected micellar network present in triblock gels.
This anisotropy in the gel structure has significance for texture transitions and dynamic properties

92
of the gels, as discussed in Chapters 3 and 4. A second reason arises from the existence of a nematic-
to-isotropic phase transition of the solvent. The solvent quality for the isotropic PS blocks changes
drastically across the TNI , resulting in significant structural changes in a small temperature window.
This can result in useful properties, such as a thermoreversible gelation, and is also interesting for
the potentially novel phase transitions that may arise [24].
The SANS and rheometry results establish several trends for the diblock and triblock copolymer
micelle structure with temperature, concentration, and block sizes. SANS revels smaller micelles at
higher polymer concentrations and higher temperatures, and the aggregation number decreases with
temperature in the nematic phase. SANS also reveals that a larger PS block length is correlated
with an increase in the TMST . Rheometry reveals a decreased storage modulus with temperature
in the nematic phase and an increased sol-gel transition temperature for copolymers with larger PS
blocks.
The neutron scattering and rheometry studies establish a relationship between micelle formation
and the mechanical properties of the gel. Micelle formation drives gel formation through inter-
micellar interactions, namely micelle-micelle repulsion and bridging between micelles. These inter-
actions are temperature dependent. Increasing the temperature within the nematic phase decreases
the size of the micelles, which corresponds with a decreasing storage modulus. Heating the sample
above the TNI oftentimes results in loss of physical associations, resulting in a drop in the modulus
and a transition to a sol state. In some cases, the TMST is significantly higher than the sol-gel
transition temperature (see 10 wt % 620(80)AB, Figs. 5.7 and 5.33). In this case, micelles may
exist in a “gas-like” state of non-interacting micelles above the sol-gel transition temperature [11].
The positional correlations of the micelles has a finite lifetime even in triblock gels, demonstrating
that the PS endblocks are not glassy but plasticized by LS solvent. Furthermore, the strength of
self-assembly that drives gel formation can be controlled by increasing the size of the PS blocks,
which increases the driving force for self assembly and results in stiffer gels, higher sol-gel transition
temperatures, and a higher TMST .
Based on the relative sizes of the PS and SGLCP blocks of the copolymers, we expect the micelles

93
to have a “hairy” structure, with an extended corona and a much smaller core [25]. Scaling arguments
by Halperin et al. for “hairy” micelles predict that the aggregation number is strongly dependent
on the PS-core block size [25]. The SANS data show an increasing micelle size with increasing
PS block size (Table 5.2), consistent with this prediction. The physical picture of “hairy” micelles
suggests that coronal repulsions may play an equal or dominant role to bridging in determining
intermicellar interaction, which can explain the comparable dynamic rheological behavior observed
for 1320(60)ABA (Fig. 5.23) and 870(70)AB (Fig. 5.15). Also, this may explain the lack of ordering
observed for the diblock mixtures, which in a separate study were investigated to concentrations as
high as 20 wt % [24]. “Hairy” micelles are expected to have a softer intermicellar potential, reducing
the tendency for long-range lattice ordering, although few experimental studies exist to corroborate
this [13, 22].
In summary, SANS experiments and rheometry found that the micellar structure of LC block
copolymer gels changes significantly across the TNI . The loss of orientational order of the LC solvent
is associated with a decreased selectivity for the isotropic PS block and an associated loss of micellar
structure in many cases. The size of the PS block is an important variable determining the driving
force for self-assembly, with larger PS blocks associated with gelation even above the TNI . No long-
range lattice order was exhibited by the copolymer micellar gels, and this may be related to the
“hairy” structure of the block copolymer micelles.

94
5.6 SANS of diblock and triblock gels
10-2 10-110-1
100
101
102
103 25 oC 31 oC 35 oC 40 oC
10 wt % 590(40)AB5 wt % 590(40)AB
oo
I (a.
u.)
q (A-1)10-2 10-1
10-1
100
101
102
103
I (a.
u.)
q (A-1)
25 oC 31 oC 35 oC 40 oC
Figure 5.4: Azimuthally averaged SANS pattern for 5 and 10 wt % 590(40)AB in perdeuterated5CB. The 5 wt % mixture is single-phase nematic for all T ≤ 32.1 oC and single-phase isotropic forT ≥ 34.0 oC. The 10 wt % mixture is single-phase nematic for all T ≤ 33.0 oC and single-phaseisotropic for T ≥ 36.0 oC.
95
10-2 10-110-1
100
101
102
103
10 wt % 530(60)AB5 wt % 530(60)AB 25 oC 31 oC 35 oC 40 oC
oo
I (a.
u.)
q (A-1)10-2 10-1
10-1
100
101
102
103
I (a.
u.)
q (A-1)
25 oC 32 oC 35 oC 40 oC
Figure 5.5: Azimuthally averaged SANS pattern for 5 and 10 wt % 530(60)AB in perdeuterated5CB. The 5 wt % mixture is single-phase nematic for all T ≤ 32.5 oC and single-phase isotropic forT ≥ 34.0 oC. The 10 wt % mixture is single-phase nematic for all T ≤ 33.5 oC and single-phaseisotropic for T ≥ 34.5 oC.
10-2 10-110-1
100
101
102
103
29 oC 38 oC
29 oC 38 oC
oo
I (a.
u.)
q (A-1)10-2 10-1
10-1
100
101
102
103
5 wt % 890(70)AB 10 wt % 890(70)AB
I (a.
u.)
q (A-1)
Figure 5.6: Azimuthally averaged SANS pattern for 5 and 10 wt % 890(70)AB in perdeuterated5CB. The mixtures are single-phase nematic for all T ≤ 33.5 oC and single-phase isotropic forT > 33.5 oC.

96
10-2 10-110-1
100
101
102
103
10 wt % 620(80)AB5 wt % 620(80)AB
25 oC 31 oC 40 oC
oo
I (a.
u.)
q (A-1)10-2 10-1
10-1
100
101
102
103
I (a.
u.)
q (A-1)
25 oC 32 oC 37 oC 40 oC 50 oC
Figure 5.7: Azimuthally averaged SANS pattern for 5 and 10 wt % 620(80)AB in perdeuterated5CB. The 5 wt % mixture is single-phase nematic for all T ≤ 32.5 oC and single-phase isotropic forT ≥ 39.0 oC. The 10 wt % mixture is single-phase nematic for all T ≤ 33.5 oC and single-phaseisotropic for T ≥ 38.5 oC.
10-2 10-110-1
100
101
102
103
10 wt % 450(120)AB5 wt % 450(120)AB
25 oC 32 oC 35 oC 40 oC
oo
I (a.
u.)
q (A-1)10-2 10-1
10-1
100
101
102
103
I (a.
u.)
q (A-1)
25 oC 32 oC 35 oC 40 oC 50 oC 60 oC
Figure 5.8: Azimuthally averaged SANS pattern for 5 and 10 wt % 450(120)AB in perdeuterated5CB. The 5 wt % mixture is single-phase nematic for all T ≤ 33.0 oC and single-phase isotropic forT ≥ 34.0 oC. The 10 wt % mixture is single-phase nematic for all T ≤ 33.5 oC and single-phaseisotropic for T ≥ 34.0 oC.

97
10-2 10-110-1
100
101
102
103
10 wt % 840(190)AB5 wt % 840(190)AB 25 oC 27 oC 29 oC 31 oC 37 oC 60 oC
oo
I (a.
u.)
q (A-1)10-2 10-1
10-1
100
101
102
103
I (a.
u.)
q (A-1)
25 oC 27 oC 29 oC 31 oC 37 oC 60 oC
Figure 5.9: Azimuthally averaged SANS pattern for 5 and 10 wt % 840(190)AB in perdeuterated5CB. The 5 wt % mixture is single-phase nematic for all T ≤ 32.9 oC and single-phase isotropicfor T > 32.9 oC. The 10 wt % mixture is single-phase nematic for all T ≤ 31.5 oCand single-phaseisotropic for T ≥ 34.7 oC.
10-2 10-110-1
100
101
102
103
10 wt % 1320(60)AB5 wt % 1320(60)AB
25 oC 31 oC 38 oC
oo
I (a.
u.)
q (A)10-2 10-1
10-1
100
101
102
103
I (a.
u.)
q (A)
25 oC 31 oC 38 oC
Figure 5.10: SANS pattern for 5 and 10 wt % 1320(60)ABA in D5CB. The data shown is averagedover a 15o wedge oriented along the nematic director. Both the 5 and 10 wt % mixtures are single-phase nematic for all T ≤ 33.5 oC and single-phase isotropic for T > 33.5 oC.

98
5.7 Rheometry of diblock and triblock mixtures
1E-3 0.01 0.1 1 10 100 10000.01
0.1
1
10
100G
' (Pa
)
Frequency (rad/s)
10 oC 20 oC 30 oC 32 oC 34 oC 35 oC 38 oC 40 oC 50 oC 60 oC
1E-3 0.01 0.1 1 10 100 10000.01
0.1
1
10
100
G'' (
Pa)
Frequency (rad/s)
Figure 5.11: Dynamic storage modulus (G′) and loss modulus (G′′) of 5 wt % 590(40) AB diblockin 5CB. The mixture is single-phase nematic for all T ≤ 35.5 oC (closed symbols) and single-phaseisotropic for T ≥ 37.5 oC (open symbols).
10 20 30 40 50 601E-3
0.01
0.1
1
10
100 TNI = 35.5 oC
G' (
Pa)
Temperature (oC)
Temperature increasing Temperature decreasing
10 20 30 40 50 601E-3
0.01
0.1
1
10
100 Temperature increasing Temperature decreasing T
NI = 35.5 oC
G'' (
Pa)
Temperature (oC)
Figure 5.12: Dynamic storage modulus (G′) and loss modulus (G′′) of 5 wt % 590(40) AB diblockin 5CB while heating (closed symbols) and cooling (open symbols) at 0.5 oC/min

99
0.1 1 10 1001E-3
0.01
0.1
1
10
100G
' (Pa
)
Frequency (rad/s)
10 oC 20 oC 30 oC 32 oC 34 oC 35 oC 36 oC 38 oC 40 oC 50 oC 60 oC
0.1 1 10 1001E-3
0.01
0.1
1
10
100
G'' (
Pa)
Frequency (rad/s)
Figure 5.13: Dynamic storage modulus(G′) and loss modulus (G′′) of 5 wt % 530(60) AB diblockin 5CB. The mixture is single-phase nematic for all T ≤ 36.0 oC (closed symbols) and single-phaseisotropic for T > 36.0 oC (open symbols).
10 20 30 40 50 601E-3
0.01
0.1
1
10
100 TNI = 36.0 oC
G' (
Pa)
Temperature (oC)
Temperature increasing Temperature decreasing
10 20 30 40 50 601E-3
0.01
0.1
1
10
100 Temperature increasing Temperature decreasing T
NI = 36.0 oC
G'' (
Pa)
Temperature (oC)
Figure 5.14: Dynamic storage modulus (G′) and loss modulus (G′′) of 5 wt % 530(60) AB diblockin 5CB while heating (closed symbols) and cooling (open symbols) at 0.5 oC/min

100
1E-3 0.01 0.1 1 10 1000.01
0.1
1
10
100G
' (Pa
)
Frequency (rad/s)
10 oC 20 oC 30 oC 32 oC 34 oC 36 oC 36 oC 40 oC 50 oC
1E-3 0.01 0.1 1 10 1000.01
0.1
1
10
100
G'' (
Pa)
Frequency (rad/s)
Figure 5.15: Dynamic storage modulus(G′) and loss modulus (G′′) of 5 wt % 890(70) AB diblockin 5CB. The mixture is single-phase nematic for all T ≤ 35.9 oC (closed symbols) and single-phaseisotropic for T > 35.9 oC (open symbols).
10 20 30 40 50 601E-3
0.01
0.1
1
10
100 TNI = 35.9 oC
G' (
Pa)
Temperature (oC)
Temperature increasing Temperature decreasing
10 20 30 40 50 601E-3
0.01
0.1
1
10
100 Temperature increasing Temperature decreasing T
NI = 35.9 oC
G'' (
Pa)
Temperature (oC)
Figure 5.16: Dynamic storage modulus (G′) and loss modulus (G′′) of 5 wt % 890(70) AB diblockin 5CB while heating (closed symbols) and cooling (open symbols) at 0.5 oC/min

101
1E-3 0.01 0.1 1 10 1000.01
0.1
1
10
100G
' (Pa
)
Frequency (rad/s)
10 oC 20 oC 30 oC 32 oC 34 oC 35 oC 40 oC 50 oC 60 oC
1E-3 0.01 0.1 1 10 100
0.1
1
10
100
G'' (
Pa)
Frequency (rad/s)
Figure 5.17: Dynamic storage modulus (G′) and loss modulus (G′′) of 5 wt % 620(80)AB diblockin 5CB. The mixture is single-phase nematic for all T ≤ 35.5 oC (closed symbols) and single-phaseisotropic for T ≥ 40.0 oC (open symbols).
10 20 30 40 50 601E-3
0.01
0.1
1
10
100TNI = 35.5 oC
G' (
Pa)
Temperature (oC)
Temperature increasing Temperature decreasing
10 20 30 40 50 601E-3
0.01
0.1
1
10
100
Temperature increasing Temperature decreasing T
NI = 35.5 oC
G'' (
Pa)
Temperature (oC)
Figure 5.18: Dynamic storage modulus (G′) and loss modulus (G′′) of 5 wt % 620(80) AB diblockin 5CB while heating (closed symbols) and cooling (open symbols) at 0.5 oC/min

102
1E-3 0.01 0.1 1 10 1000.01
0.1
1
10
100G
' (Pa
)
Frequency (rad/s)
10 oC 20 oC 30 oC 32 oC 34 oC 35 oC 36 oC 38 oC 40 oC 50 oC 60 oC
1E-3 0.01 0.1 1 10 1000.01
0.1
1
10
100
G'' (
Pa)
Frequency (rad/s)
Figure 5.19: Dynamic storage modulus (G′) and loss modulus (G′′) of 5 wt % 450(120) AB diblockin 5CB. The mixture is single-phase nematic for all T ≤ 35.8 oC (closed symbols) and single-phaseisotropic for T > 35.8 oC (open symbols).
10 20 30 40 50 601E-3
0.01
0.1
1
10
100 TNI = 35.8 oC
G' (
Pa)
Temperature (oC)
Temperature increasing Temperature decreasing
10 20 30 40 50 601E-3
0.01
0.1
1
10
100 Temperature increasing Temperature decreasing
TNI = 35.8 oC
G'' (
Pa)
Temperature (oC)
Figure 5.20: Dynamic storage modulus (G′) and loss modulus (G′′) of 5 wt % 450(120) AB diblockin 5CB while heating (closed symbols) and cooling (open symbols) at 0.5 oC/min

103
1E-3 0.01 0.1 1 10 1000.01
0.1
1
10
100
G' (
Pa)
Frequency (rad/s)1E-3 0.01 0.1 1 10 100
0.01
0.1
1
10
100
10 oC 20 oC 25 oC 30 oC 31 oC 32 oC 35 oC 36 oC 37 oC 38 oC 39 oC 40 oC 50 oC 60 oC
G'' (
Pa)
Frequency (rad/s)
Figure 5.21: Dynamic storage modulus (G′) and loss modulus (G′′) of 5 wt % 840(190) AB diblockin 5CB. The mixture is single-phase nematic for all T ≤ 32.0 oC (closed symbols) and single-phaseisotropic for T ≥ 35.0 oC (open symbols).
10 20 30 40 50 601E-3
0.01
0.1
1
10
100
TNI = 32.0 oC
G' (
Pa)
Temperature (oC)
Temperature increasing Temperature decreasing
10 20 30 40 50 601E-3
0.01
0.1
1
10
100 Temperature increasing Temperature decreasing
TNI = 32.0 oC
G'' (
Pa)
Temperature (oC)
Figure 5.22: Dynamic storage modulus (G′) and loss modulus (G′′) of 5 wt % 840(190) AB diblockin 5CB while heating (closed symbols) and cooling (open symbols) at 0.5 oC/min

104
1E-3 0.01 0.1 1 10 100
0.01
0.1
1
10
100
G' (
Pa)
Frequency (rad/s)
10 oC 20 oC 30 oC 32 oC 33 oC 34 oC 35 oC 36 oC 37 oC 40 oC 50 oC 60 oC 70 oC
1E-3 0.01 0.1 1 10 100
0.1
1
10
100
G'' (
Pa)
Frequency (rad/s)
Figure 5.23: Dynamic storage modulus (G′) and loss modulus (G′′) of 5 wt % 1320(60)ABA in5CB. The mixture is single-phase nematic for all T ≤ 35.2 oC (closed symbols) and single-phaseisotropic for T > 35.2 oC (open symbols).
10 20 30 40 50 601E-3
0.01
0.1
1
10
100 TNI = 35.2 oC
G' (
Pa)
Temperature (oC)
Temperature increasing Temperature decreasing
10 20 30 40 50 601E-3
0.01
0.1
1
10
100 Temperature increasing Temperature decreasing T
NI = 35.2 oC
G'' (
Pa)
Temperature (oC)
Figure 5.24: Dynamic storage modulus (G′) and loss modulus (G′′) of 5 wt % 1320(60) ABA triblockin 5CB while heating (closed symbols) and cooling (open symbols) at 5.0 oC/min

105
1E-3 0.01 0.1 1 10 100
0.1
1
10
100
G' (
Pa)
Frequency (rad/s)
10 oC 20 oC 30 oC 36 oC 38 oC 40 oC
1E-3 0.01 0.1 1 10 1000.1
1
10
100
G'' (
Pa)
Frequency (rad/s)
Figure 5.25: Dynamic storage modulus (G′) and loss modulus (G′′) of 5 wt % 800(20)ABA in 5CB.The mixture is single-phase nematic for all T ≤ 31.7 oC (closed symbols) and single-phase isotropicfor T ≥ 34.5 oC (open symbols).
10 20 30 40 501E-3
0.01
0.1
1
10
100
TNI = 31.7 oC
G' (
Pa)
Temperature (oC)
Temperature increasing Temperature decreasing
10 20 30 40 501E-3
0.01
0.1
1
10
100 Temperature increasing Temperature decreasing
TNI = 31.7 oC
G'' (
Pa)
Temperature (oC)
Figure 5.26: Dynamic storage modulus (G′) and loss modulus (G′′) of 5 wt % 800(20)ABA in 5CBwhile heating (closed symbols) and cooling (open symbols) at 0.5 oC/min

106
0.01 0.1 1 10 1001E-3
0.01
0.1
1
10
100
G' (
Pa)
Frequency (rad/s)
10 oC 20 oC 30 oC 32 oC 34 oC 35 oC 38 oC 40 oC 50 oC 60 oC
0.01 0.1 1 10 100
0.01
0.1
1
10
100
G'' (
Pa)
Frequency (rad/s)
Figure 5.27: Dynamic storage modulus (G′) and loss modulus (G′′) of 10 wt % 590(40) AB diblockin 5CB. The mixture is single-phase nematic for all T ≤ 35.5 oC (closed symbols) and single-phaseisotropic for T ≥ 37.5 oC (open symbols).
10 20 30 40 50 601E-3
0.01
0.1
1
10
100 TNI = 35.5 oC
G' (
Pa)
Temperature (oC)
Temperature increasing Temperature decreasing
10 20 30 40 50 601E-3
0.01
0.1
1
10
100
Temperature increasing Temperature decreasing T
NI = 35.5 oC
G'' (
Pa)
Temperature (oC)
Figure 5.28: Dynamic storage modulus (G′) and loss modulus (G′′) of 10 wt % 590(40) AB diblockin 5CB while heating (closed symbols) and cooling (open symbols) at 0.5 oC/min

107
1E-3 0.01 0.1 1 10 1001E-3
0.01
0.1
1
10
100
1000G
' (Pa
)
Frequency (rad/s)
10 oC 20 oC 30 oC 32 oC 34 oC 35 oC 36 oC 38 oC 40 oC 50 oC 60 oC
1E-3 0.01 0.1 1 10 1001E-3
0.01
0.1
1
10
100
1000
G'' (
Pa)
Frequency (rad/s)
Figure 5.29: Dynamic storage modulus (G′) and loss modulus (G′′) of 10 wt % 530(60) AB diblockin 5CB. The mixture is single-phase nematic for all T ≤ 36.2 oC (closed symbols) and single-phaseisotropic for T > 36.2 oC (open symbols).
10 20 30 40 50 601E-3
0.01
0.1
1
10
100
1000TNI = 36.2 oC
G' (
Pa)
Temperature (oC)
Temperature increasing Temperature decreasing
10 20 30 40 50 601E-3
0.01
0.1
1
10
100
1000 Temperature increasing Temperature decreasing T
NI = 36.2 oC
G'' (
Pa)
Temperature (oC)
Figure 5.30: Dynamic storage modulus (G′) and loss modulus (G′′) of 10 wt % 530(60) AB diblockin 5CB while heating (closed symbols) and cooling (open symbols) at 0.5 oC/min

108
1E-3 0.01 0.1 1 10 1001E-3
0.01
0.1
1
10
100
1000G
' (Pa
)
Frequency (rad/s)
10 oC 20 oC 30 oC 32 oC 34 oC 35 oC 36 oC 38 oC 40 oC 50 oC 60 oC
1E-3 0.01 0.1 1 10 1001E-3
0.01
0.1
1
10
100
1000
G'' (
Pa)
Frequency (rad/s)
Figure 5.31: Dynamic storage modulus (G′) and loss modulus (G′′) of 10 wt % 890(70) AB diblockin 5CB. The mixture is single-phase nematic for all T ≤ 36.1 oC (closed symbols) and single-phaseisotropic for T > 36.1 oC (open symbols).
10 20 30 40 501E-3
0.01
0.1
1
10
100
1000
TNI = 36.1 oC
G' (
Pa)
Temperature (oC)
Temperature increasing Temperature decreasing
10 20 30 40 501E-3
0.01
0.1
1
10
100
1000 Temperature increasing Temperature decreasing
TNI = 36.1 oC
G'' (
Pa)
Temperature (oC)
Figure 5.32: Dynamic storage modulus (G′) and loss modulus (G′′) of 10 wt % 890(70) AB diblockin 5CB while heating (closed symbols) and cooling (open symbols) at 0.5 oC/min

109
0.01 0.1 1 10 1001E-3
0.01
0.1
1
10
100
1000G
' (Pa
)
Frequency (rad/s)
10 oC 20 oC 30 oC 32 oC 34 oC 35 oC 40 oC 50 oC 60 oC
0.01 0.1 1 10 1001E-3
0.01
0.1
1
10
100
1000
G'' (
Pa)
Frequency (rad/s)
Figure 5.33: Dynamic storage modulus (G′) and loss modulus (G′′) of 10 wt % 620(80)AB diblockin 5CB. The mixture is single-phase nematic for all T ≤ 35.5 oC (closed symbols) and single-phaseisotropic for T ≥ 40.0 oC (open symbols).
10 20 30 40 50 601E-3
0.01
0.1
1
10
100
1000 TNI = 35.5 oC
G' (
Pa)
Temperature (oC)
Temperature increasing Temperature decreasing
10 20 30 40 50 601E-3
0.01
0.1
1
10
100
1000 Temperature increasing Temperature decreasing T
NI = 35.5 oC
G'' (
Pa)
Temperature (oC)
Figure 5.34: Dynamic storage modulus (G′) and loss modulus (G′′) of 10 wt % 620(80) AB diblockin 5CB while heating (closed symbols) and cooling (open symbols) at 0.5 oC/min

110
0.01 0.1 1 10 1001E-3
0.01
0.1
1
10
100
1000G
' (Pa
)
Frequency (rad/s)
10 oC 20 oC 30 oC 32 oC 34 oC 35 oC 36 oC 38 oC 40 oC 50 oC 60 oC
0.01 0.1 1 10 1001E-3
0.01
0.1
1
10
100
1000
G'' (
Pa)
Frequency (rad/s)
Figure 5.35: Dynamic storage modulus (G′) and loss modulus (G′′) of 10 wt % 450(120) AB diblockin 5CB. The mixture is single-phase nematic for all T < 36.0 oC (closed symbols) and single-phaseisotropic for T ≥ 36.0 oC (open symbols).
10 20 30 40 50 601E-3
0.01
0.1
1
10
100
1000 TNI = 36.0 oC
G' (
Pa)
Temperature (oC)
Temperature increasing Temperature decreasing
10 20 30 40 50 601E-3
0.01
0.1
1
10
100
1000 Temperature increasing Temperature decreasing
TNI = 36.0 oC
G'' (
Pa)
Temperature (oC)
Figure 5.36: Dynamic storage modulus (G′) and loss modulus (G′′) of 10 wt % 450(120) AB diblockin 5CB while heating (closed symbols) and cooling (open symbols) at 0.5 oC/min

111
0.01 0.1 1 10 1000.01
0.1
1
10
100
G' (
Pa)
Frequency (rad/s)
20 oC 30 oC 32 oC 35 oC 36 oC 38 oC 40 oC 50 oC 60 oC
0.01 0.1 1 10 1000.01
0.1
1
10
100
G'' (
Pa)
Frequency (rad/s)
Figure 5.37: Dynamic storage modulus (G′) and loss modulus (G′′) of 10 wt % 840(190) AB diblockin 5CB. The mixture is single-phase nematic for all T ≤ 31.8 oC (closed symbols) and single-phaseisotropic for T ≥ 34.0 oC (open symbols).
20 30 40 50 600.1
1
10
100
TNI = 31.8 oC
G' (
Pa)
Temperature (oC)
Temperature increasing Temperature decreasing
20 30 40 50 600.1
1
10
100 Temperature increasing Temperature decreasing
TNI = 31.8 oC
G'' (
Pa)
Temperature (oC)
Figure 5.38: Dynamic storage modulus (G′) and loss modulus (G′′) of 10 wt % 840(190) AB diblockin 5CB while heating (closed symbols) and cooling (open symbols) at 0.5 oC/min

112
0.01 0.1 1 10 1001E-3
0.01
0.1
1
10
100
G' (
Pa)
Frequency (rad/s)
10 oC 20 oC 30 oC 32 oC 34 oC 36 oC 38 oC 40 oC 50 oC
0.01 0.1 1 10 1001E-3
0.01
0.1
1
10
100
G'' (
Pa)
Frequency (rad/s)
Figure 5.39: Dynamic storage modulus (G′) and loss modulus (G′′) of 10 wt % 1320(60)ABAtriblock in 5CB. The mixture is single-phase nematic for all T ≤ 37.0 oC (closed symbols) andsingle-phase isotropic for T > 37.0 oC (open symbols). The experiments were performed with aparallel-plate fixture with a gap of 500 µm.
10 20 30 40 50 601E-3
0.01
0.1
1
10
100TNI = 37.0 oC
G' (
Pa)
Temperature (oC)
Temperature increasing Temperature decreasing
10 20 30 40 50 601E-3
0.01
0.1
1
10
100
Temperature increasing Temperature decreasing T
NI = 37.0 oC
G'' (
Pa)
Temperature (oC)
Figure 5.40: Dynamic storage modulus(G′) and loss modulus (G′′) of 10 wt % 1320(60) ABAtriblock in 5CB while heating (closed symbols) and cooling (open symbols) at 0.5 oC/min. Theexperiments were performed with a parallel-plate fixture with a gap of 500 µm.

113
1E-3 0.01 0.1 1 10 100
0.01
0.1
1
10
100
G' (
Pa)
Frequency (rad/s)
10 oC 20 oC 30 oC 32 oC 36 oC 38 oC 40 oC 50 oC 60 oC
1E-3 0.01 0.1 1 10 100
0.01
0.1
1
10
100
G'' (
Pa)
Frequency (rad/s)
Figure 5.41: Dynamic storage modulus (G′) and loss modulus (G′′) of 10 wt % 800(20)ABA triblockin 5CB. The mixture is single-phase nematic for all T ≤ 32.0 oC (closed symbols) and single-phaseisotropic for T ≥ 35.7 oC (open symbols).
10 20 30 40 501E-3
0.01
0.1
1
10
100
1000TNI = 32.0 oC
G' (
Pa)
Temperature (oC)
Temperature increasing Temperature decreasing
10 20 30 40 501E-3
0.01
0.1
1
10
100
1000 Temperature increasing Temperature decreasing T
NI = 32.0 oC
G'' (
Pa)
Temperature (oC)
Figure 5.42: Dynamic storage modulus (G′) and loss modulus (G′′) of 10 wt % 800(20) ABA triblockin 5CB while heating (closed symbols) and cooling (open symbols) at 0.5 oC/min

114
Bibliography
[1] Z. Ergundor, C. W. Manke, and E. Gulari. Atomization and elongational viscosity of associating
triblock copolymer solutions. J. Non-Newtonian Fluid Mech., 97(2-3):159–167, 2001.
[2] W. Shen, R. G. H. Lammertink, J. K. Sakata, J. A. Kornfield, and D. A. Tirrell. Assembly of
an artificial protein hydrogel through leucine zipper aggregation and disulfide bond formation.
Macromolecules, 38(9):3909–3916, 2005.
[3] H. Hori, O. Urakawa, and K. Adachi. Dielectric relaxation in phase-segregated mixtures of
polystyrene and liquid crystal 5cb. Macromolecules, 37:1583–1590, 2004.
[4] S. T. Wu, Q. H. Wang, M. D. Kempe, and J. A. Kornfield. Perdeuterated cyanobiphenyl liquid
crystals for infrared applications. J. Appl. Phys., 92(12):7146–7148, 2002.
[5] M. D. Kempe, N. R. Scruggs, R. Verduzco, J. Lal, and J. A. Kornfield. Self-assembled liquid-
crystalline gels designed from the bottom up. Nat. Mater., 3(3):177–182, 2004.
[6] M. Walther, H. Faulhammer, and H. Finkelmann. On the thread-like morphology of lc/i block
copolymers in nematic solvents. Macromol. Chem. Phys., 199:223–237, 1998.
[7] N. Leroux, P. Keller, M. F. Achard, L. Noirez, and F. Hardouin. Small angle neutron scattering
experiments on “side-on fixed” liquid crystal polyacrylates. J. Phys. II France, 3:1289–1296,
1993.
[8] S. Lecommandoux, M. F. Achard, F. Hardouin, A. Brulet, and J. P. Cotton. Are nematic
side-on polymers totally extended? a sans study. Liq. Cryst., 22(5):549–555, 1997.

115
[9] M. H. Li, A. Brulet, P. Davidson, P. Keller, and J. P. Cotton. Observation of hairpin defects
in a nematic main-chain polyester. Phys. Rev. Lett., 70(15):2297–2300, 1993.
[10] G. A. McConnell, A. P. Gast, J. S. Huang, and S. D. Smith. Disorder-order transitions in soft
sphere polymer micelles. Phys. Rev. Lett., 71(13):2102–2105, 1993.
[11] I. W. Hamley, J. P. A. Fairclough, A. J. Ryan, C. Y. Ryu, T. P. Lodge, A. J. Gleeson, and
J. S. Pedersen. Micellar ordering in concentrated solutions of di- and triblock copolymers in a
slightly selective solvent. Macromolecules, 31:1188–1196, 1998.
[12] J. S. Higgins, S. Blake, P. E. Tomlins, S. B. Ross-Murphy, E. Staples, J. Penfold, and J. V.
Dawkins. Comparison of the structural and rheological consequences of micelle formation in
solutions of a model di-block copolymer. Polymer, 29:1968–1978, 1988.
[13] I. W. Hamley. Amphiphilic diblock copolymer gels: the relationship between structure and
rheology. Phil. Trans. R. Soc. Lon. A, 359:1017–1044, 2001.
[14] J. S. Pedersen. Analysis of small-angle scattering data from colloids and polymer solutions:
modeling and least-squares fitting. Adv. Colloid Interface Sci., 70:171–210, 1997.
[15] Kell Mortensen. Structural studies of aqueous solutions of peo-ppo-peo triblock copolymers,
their micellar aggregates and mesophases; a small-angle neutron scattering study. J. Phys.:
Condens. Matter, 8:A103–A124, 1996.
[16] T. P. Lodge, Joona Bang, Moon Jeong Park, and Kookheon Char. Origin of the thermoreversible
fcc-bcc transition in block copolymer solutions. Phys. Rev. Lett., 92(14):145501, 2004.
[17] T. P. Lodge, X. Xu, C. Y. Ryu, I. W. Hamley, J. P. A. Fairclough, A. J. Ryan, and J. S.
Pedersen. Structure and dynamics of concentrated solutions of asymmetric block copolymers
in slightly selective solvents. Macromolecules, 29:5955–5964, 1996.
[18] F. S. Bates, J. H. Rosedale, and G. H. Frekrickson. Fluctuation effects in a symmetric diblock
copolymer near the order-disorder transition. Macromolecules, 92(10):6255–6270, 1990.

116
[19] N. R. Scruggs. PhD thesis, California Institute of Technology, 2007.
[20] G. Holden, E. T. Bishop, and N. R. Legge. Thermoplastic elastomers. J. Polym. Sci., Part C:
Polym. Sym., page 37, 1969.
[21] K. Almdal, J. Dyre, S. Hvidt, and O. Kramer. What is a gel? Makromol. Chem., Macromol.
Sym., 76:49–51, 1993.
[22] H. Li, G.-E. Yu, C. Price, and C. Booth. Concentrated aqueous micellar solutions of diblock
copoly(oxyethylene/oxybutylene) e41b8: A study of phase behavior. Macromolecules, 30:1347–
1354, 1997.
[23] H. Watanabe, S. Kuwahara, and T. Kotaka. Rheology of styrene-butadiene-styrene triblock
copolymer in n-tetradecane systems. J. Rheol., 28(4):393–409, 1984.
[24] N. R. Scruggs, J. A. Kornfield, and J. Lal. Using the “switchable” quality of liquid crystal
solvents to mediate segregation between coil and liquid crystalline polymers. Macromolecules,
39(11):3921–3926, 2006.
[25] A. Halperin, M. Tirrell, and T. P. Lodge. Tethered chains in polymer microstructures. Adv.
Polym. Sci., 100:31–71, 1992.