Embed Size (px)
Citation preview

Economic Impacts of Oil Spills:
Spill Unit Costs for Tankers, Pipelines,
Refineries, and Offshore Facilities
Prepared for:
U.S. Department of EnergyOffice of Domestic and International Energy Policy
Contract No. DE-AC01-93EP79129
Task Assignment No. 1
Prepared by:Advanced Resources International, Inc.
October 15, 1993
DISCLAIMER
This report was prepared as an account of work sponsored by an agency of the United States
Government. Neither the United States Government nor any agency thereof, nor any of their
employees, makes any warranty, express or implied, or assumes any legal liability or responsi-
bility for the accuracy, completeness, or usefulness of any information, apparatus, product, or
process disclosed, or represents that its use would not infringe privately owned rights. Refer-ence herein to any specific commercial product, process, or service by trade name, trademark,
manufacturer, or otherwise does not necessarily constitute or imply its endorsement, recom- _ _,lraendation, or favoring by the United States Government or any agency thereof. The views _ -_
an.'_ cpiJilons of authors expressed herein do not necessarily state or reflect those of the _':_,. _United States Government or any agency thereof.
_t_'_mltortOMOFrefS.00CU_F_rt_ UNLIM_TEO

Table of Contents
Executive Stlmnlary .......................................... iv
1. Introduction ........................................... 1
1.1 Overview and Purpose of Study ............................ 11.2 Sources of Data ...................................... 2
1.3 Methodology ........................................ 2
2. Natural Resource Damage Assessment Methodologies ................. 62.1 Introduction ........................................ 62.2 Market-Based Methods ................................. 62.3 Revealed Preference Methods ............................. 6
2.4 Contingent Valuation ................................... 9
3. Development of Natural Resource Damage Assessment Regulations ......... 163.1 Overview ........................................ 163.2 CERCLA ........................................ 18
_' 3.3 DOI Natural Resource Damage Regulations ................... 183.4 State of Ohio v. Department of Interior (1989) ................. 243,5 Oil Pollution Act of 1990 .............................. 25
3.6 NOAA Regulations (Proposed) ........................... 29; 3.7 State of Washington Oil Spill Compensation Schedule ............. 31: 3.8 Florida Natural Resource Damage Compensation Schedule .......... 35
4. Critical Analysis of Natural Resource Damage Assessments .............. 374.1 Overview ........................................ 37
4.2 Tanker Spills ...................................... 404.2.1 Exxon Valdez (Prince William Sound, Alaska) ............. 404.2.2 S.S. Glacier Bay Oil Spill .......................... 564.2.3 Amazon Venture ................................ 65
4.2.4 Mercer Statistical Data Base of Tanker Spill Costs ........... 704.3 Pipeline Spills . .................................... 71
4.3.1 Exxon Arthur Kill Oil Spill ......................... 724.3.2 Texaco Anacortes Refinery Spill ...................... 83
4.4 Offshore Platform Spills ............................... 854.4.1 Union/Texaco Platform (Santa Barbara, California) .......... 854.4.2 Ixtoc Platform (Gulf of Mexico) ...................... 89
5. Conclusions ........................................... 95
References ............................................... 102
Appendix 1 - Oil Spills in U.S. Waters 1973 - 1990
JAF000911 -i-
I1

List of Exhibits
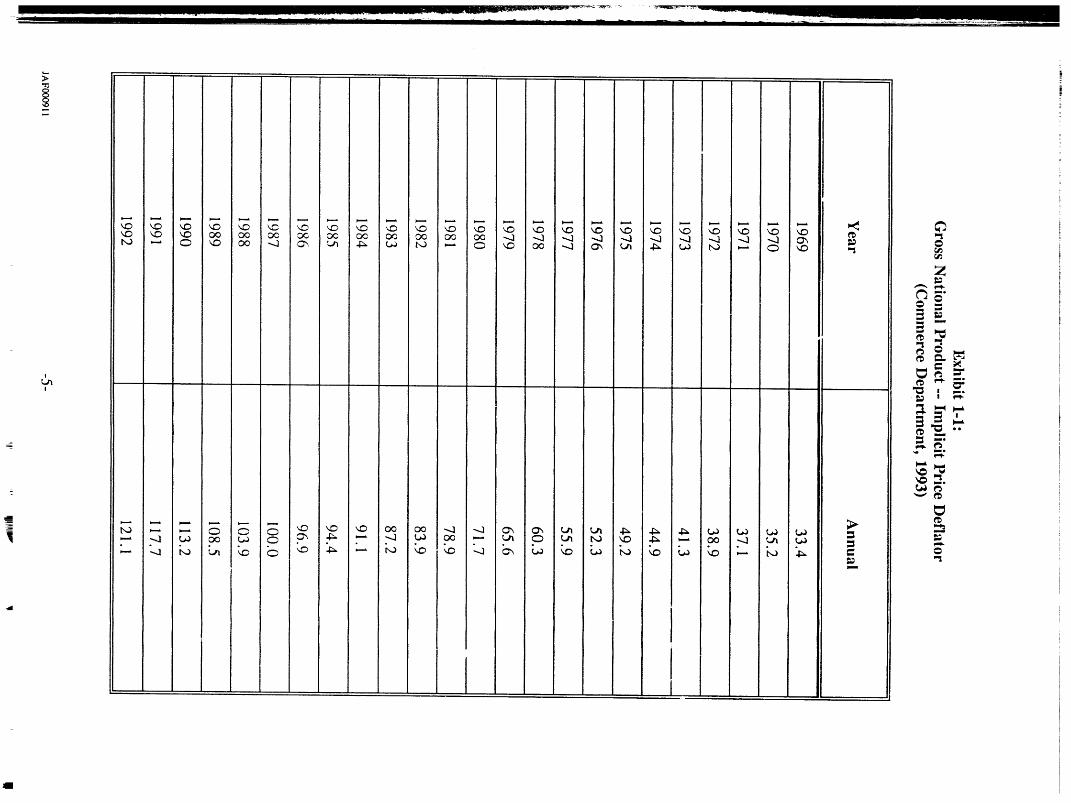
Exhibit 1-1 Gross national product -- implicit price deflator .................. 5
Exhibit 2-1a Examples of travel cost model (TCM), spatial recreation market ....... 8
Exhibit 2-1b Examples of travel cost model (TCM), demand curve .............. 8
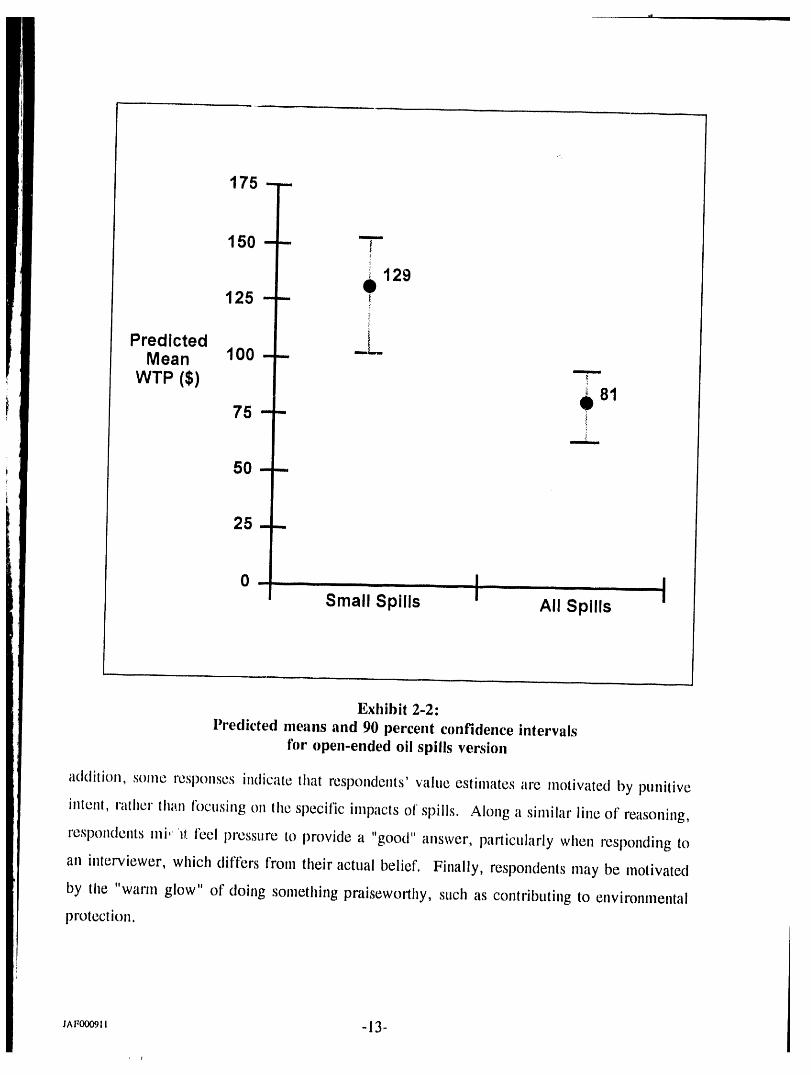
Exhibit 2-2 Predicted means and 90 percent confidence intervals foropen-ended oil spills versions ............................ 13
Exhibit 3-1 Development of natural resource damage assessmentregulations: 1980- 1993 ............................... 17
Exhibit 3-2 DOI NRDA regulations under CERCLA ..................... 20
Exhibit 3-3 Time profile of a generic one-time oil spill .................... 23
Exhibit 3-4 Oil Pollution Act of 1990 - natural resource
damage assessment .................................. 27
Exhibit 3-5 Oil effects rankings under State of Washingtondamage schedule .................................... 32
Exhibit 4-1 Overview of oil spills analyzed ........................... 39
Exhibit 4-2 Map of the Er.xon Valdez oil spill area ...................... 41
Exhibit 4-3 Summary of estimated costs and damages (top) and actualsettlement due to the Exxon Valdez oil spill ................... 43
Exhibit 4-4 Sport fishing effort for the Exxon Valdez oil spill area,1984 - 1989 ...................................... 46
Exilibit 4-5 Estimates of damages to recreational fishing due to theEx.ron Valdez oil spill ................................ 47
Exhibit 4-6 ARI's estimate of wildlife damages due to Exxon Valdez oil spill ..... 50
Exhibit 4-7 Program cost by version and question for the Exxon Voldez CV survey . . 52
Exhibit 4-8 Statistical distributions of WTP for Exxon Valdez oil spill ........... 53
Exhibit 4-9 WTP to prevent another oil spill in Prince William Sound .......... 54
jA_0oo911 -ii-
rl ' ' II m II "

List of Exhibits
(Cont.)
Exhibit 4-10 S.S. Glacier Bay spill study area ............................ 57
Exhibit 4-11 Cleanup costs and natural resoui'ce damages for theS.S. Glacier Bay oil spill .............................. 61
Exhibit 4-12 Map of the impact area for the Amazon Venture oil spill ........... 66
Exhibit 4-13 Natural resource damages for the Amazon Venture oil spill .......... 68
Exhibit 4-14 Actual settlements of natural resource damages for twotanker spills ....................................... 70
Exhibit 4-15 Location of Exxon's Arthur Kill oil spill ..................... 73
Exhibit 4-16 Components of Exxon's settlement for the 1993 Arthur Kill oil spill .... 75
Exhibit 4-17 RTI's estimated range of potential damage from Exxon'sArthur Kill oil spill .................................. 77
Exhibit 4-18 Estimates of natural resource damages related to ExxonArthur Kill oil spill .................................. 82
Exhibit 4-19 Major components of Texaco's settlement from the 1991 Anacortes,Washington refinery spill ............................... 84
Exhibit 4-20 Area contaminated with oil from Union Oil Co. Platform A
by March 30, 1969 .................................. 86
Exhibit 4-21 Location of the Ixtoc I blowout site in the western Gulf of Mexico ..... 90
Exhibit 4-21 Summary of damages from the Ixtoc I blowout ................. 94
Exhibit 5-1 Summary of per-bbl costs and damages from marine oil spills ........ 98
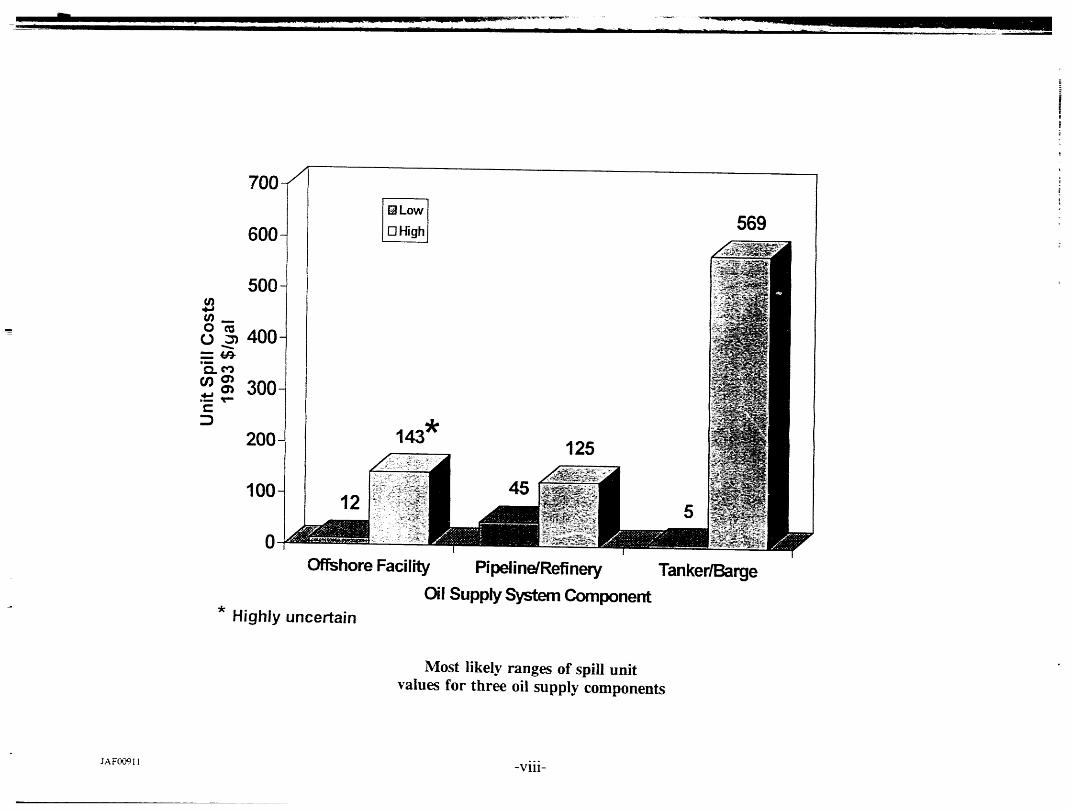
Exhibit 5-2 Most likely ranges of spill unit values for three oil supply components . . . 99
Exhibit 5-3 Oil spilled in U.S. waters 1973 - 1990 ..................... 100
Exhibit 5-4 ARI's calculated damages due to oil spilled in U.S. watersbased on average spill unit cost ($283/gal) ................... 101
JAF000911 -iii-

Executive Summary
The impacts of oil spills -- ranging from tile large, widely publicized Exxon Valdez tanker
incident to smaller pipeline and refinery spills -- have been costly to both the oil industry and ,
the public. For example, the estimated costs to Exxon of the Valdez tanker spill are on the order
of $4 billion, including $2.8 billion (in 1993 dollars) for direct cleanup costs and $1.125 billion
(in 1992 dollars) for settlement of damages claims caused by the spill. Application of contingent
valuation costs and civil lawsuits pending in the State of Alaska could raise these costs
appreciably. Even the costs of the much smaller 1991 oil spill at Texaco's refinery near
Anacortes, Washington led to costs of $8 to 9 million. As a result, inexpensive warning,
response and remediation technologies could lower oil spill costs, helping both the oil industry,
the associated marine industries, and the environment.
One means for reducing the impact and costs of oil spills is to undertake research and
development on key aspects of the oil r,pill prevention, warning, and response and remediation
systems. To target these funds to their best use, it is important to have sound data on the nature
and size of spills, their likely occurrence and their unit costs. This infornmtion could then allow
scarce R&D dollars to be spent on areas and activities having the largest impact.
This report, prepared on behalf of the Office of Domestic and International Energy
Policy, U.S. DOE, is intended to provide the "unit cost" portion of this crucial infornmtion.
The report examines the three key components of the U.S. oil supply system, namely, tankers
and barges; pipelines and refineries; and offshore production facilities. The specific purpose of
the study was to establish the unit costs of oil spills. By manipulating this key infonuation into
a larger matrix that includes the _ize and frequency of occurrence of oil spills, it will be possible
to estimate the likely future impacts, costs, and sources of oil spills.
Analysis of damage assessments conducted on tanker spills, including the E_on Valdez,
S.S. Glacier Bay, Amazon Ventllre, and several other tanker spills indicates that overall spill unit
values vary widely, from approximately $5 to $570 per gallon (19935). All components of
tanker spill costs can vary, depending primarily on location of the spill. Response and cleanup
costs varied from less than $5 to as much as $257 per gallon. Direct use natural resource
JAF0009,, -iv-
damages varied from less than $5 to $363 per gallon. Non-use damages measured using
contingent valuation can be equally volatile, ranging from an estimated $5 to $284 per gallon.
This cost variability reflects the mobility of tankers: tanker spills in open marine environments
result in relatively low cleanup costs and natural resource damages, whereas tanker spills in
sensitive coastal areas can cause extensive damages and require costly cleanup. Based on the
case studies selected, there is no apparent correlation between unit costs and spill size. Although
larger spills may benefit from economies of scale in cleanup, they are equally likely to result
in disproportionately high costs due to more easily measured natural resource damages and larger
non-use damages due to heightened publicity.
Oil spills from pipelines and refineries tend to cause lower spill unit costs with less
variability than tanker spills. Analysis of Exxon's Arthur Kill pipeline spill and Texaco's
Anacortes refinery spi_l revealed that total spill unit values ranged from $45 to $125 per gallon,
of which the response and cleanup cost component showed little variation at $34 to $39 per
gallon. Pipeline and refinery spills tend to occur in industrialized wetlands or coastal areas,
where potential direct use and non-use damages are less than in non-industrialized areas.
Prevention costs for monitoring equipment and training tend to be an important component of
natural resource damage settlements for pipeline/refinery spills, reflecting their efficacy in
preventing oil spills at these non-mobile facilities.
Spill unit values for offshore production facilities are very poorly defined, due largely
to the excellent safety record of these facilities in the U.S. over the past two decades. Published
damage assessment studies for the Santa Barbara and Ixtoc platform spills pre-dated CERCLA
and OPA legislation and are relatively unsophisticated. Oil spills from offshore filcilities may
be capable of a wide range of natural resource damages, similar to tanker spills, depending
primarily upon spill environment. Unit cost values for platform spills in an open marine setting
(such as the Gulf of Mexico) tend to be low, reflecting the diminished sensitivity and higher
dilution capability of this environment. However, an oil spill in a sensitive coastal area,
comparable to the 1969 Santa Barbara oil spill, would probably lead to significant cleanup and
direct use damages, and extremely high spill unit costs for non-use natural resource damages.
JAF000911 -V-

.......... _lii ._ll_ _ ,LI .-_,l L _ v ................................................................
Coast Guard data indicate that tanker spills have accounted for the overwhelming
proportion of oil spills in U.S. waters since 1973, measured by both number of incidents and
volumes spilled. Oil spilled in major (> 100,000 gal) tanker incidents has averaged about 5
million gallons per year during this time period. Applying an average spill unit cost of $283 per
gallon, determined in this study, tanker spills in U.S. waters on average are estimated to have
caused in excess of $1 billion (19935) in cleanup costs and damages annually, for an estimated
total cost to the economy of over $25 billion during this period. Although oil spills cleanup
operations can generate significant economic activity, cleanup costs and damages may be
considered net losses to the economy and particularly to the oil supply system. This is because
cleanup expenditures directly reduce the funds available for productive investment in petroleum
exploration, development, and processing, such as in the case of the E_on Valdez or other
major oil company spills.
The results of this study provides a framework for DOE oil spill R&D priorities.
However, in addition to spill unit values of economic damages from oil spills, it is also
necessary to consider the risks of an oil spill actually occurring. Coast Guard records indicate
that tanker spills occur most frequently in U.S. waters, with pipeline/refinery spills less frequent,
and offshore facility spills quite rare (international data on spill frequency are not available).
Oil spill research and development focused on tanker spills could be the most cost-effective in
reducing spill costs and impacts. Pipeline/refinery research would be the next most important
oil supply component to be targeted for oil spill R&D, because spill unit values for these
f'_cilities are moderately high and because these accidents are next most frequent following
tanker spills. OtTshore facilities have the potential to generate large non-use damages, but are
inl'rcquent; thus offshore facilities are not strongly recommended for oil spill R&D.
JAF0009_t -vi-
i i i i, i

Summa_' of per-bbl costs and damages from marine oil spills. (All values in 19935/gal)
Cleanup Capital Prevention NqRDA Direct Use Non-Use Total* ActualCosts Losses* Costs Costs Damages Damages Settlement
and Costs
Tanker.............
Glacier Bay 18.58 0.43 .... 363.51 5.46 _ 390 --
Exxon Valdez 257.00 0.40 -- 9.9I - 19.81 13.67 283.99 564 - 574 370.00
Amazon Venture 2.75* 0,35 -- 0.26 0.86 1.71 5.93 3,00
Mercer Data .............. 4.15- 37.90Base
Pipeline/Refinery,,,
Exxon Arthur 33.97 0.38 47.17 I - 5* 0.09 10.43 - 38.72 93 - 125 109.35Kill
38.69 0.08 3.81 -- 2.38 -- 45 44.88TexacoAnacortes
Offshore PlatformI
- Ixtoc 3.25 1.43 .... 0.21 6.5- 12.9" 11 - 18" --
Santa Barbara 43.16 0.30 ...... 50 - > 100" 93 - > 143" --
: *ARI Estimate
JAF_X_ -vii-
I'TI!IIJ.... I IIII IIIIIII IlI , i, , , -- ,- .r " _" " --_ - - " ........ "_ .............. I I _
100- 4512 5
0-
Offshore Facility Pipeline/Refinery Tanker/BargeOilSupplySystemComponent
* Highly uncertain
Most likely ranges of spill unitvalues for three oil supply components
JAF_ -viii-

-XT-
(PaEnD _s_oD "S'D_) "066I - £L6I sa_u_ "S'YI m. P_II!.ds HO

-X-

1. Introduction
1.1 Overview and Purpose of Study
The enactment of the Oil Pollution Act of 1990 (OPA 90) followed a series of damaging
oil spills in the U.S., including the 11-million gallon Exxon Valdez spill in 1989 and a series of!
three subsequent smaller spills which occurred within a 24-hour period in coastal U.S. waters.
These highly publicized events focused the issue of compensation for cleanup and economic
damages resulting from oil spills and helped to shape the provisions of the Act. OPA 90 set
forth with unprecedented clarity the nlethods and penalty guidelines to be used for assessing_,
i natural resource damages that resulted from oil spills. While some of these methods remaincontroversial, and damage regulations still remain to be finalized three years after enactment,
a consensus on damage assessment theory and application is slowly taking shape within the
_' economic research community. Sufficient data is now also becoming available on the economic
impacts of oil spills, helping to target the components of the oil supply system most responsible
for costly natural resource damages.
In addition to specifying natural resource damage procedures, OPA 90 authorized
research and development expenditures in oil spill mitigation and remediation. The direction,
funding, and organizational control of this research remains to be formulated. The U.S.
Department of Energy, which is charged with oversight of the energy supply of the United
States, is one of many agencies jointly authorized to pei-form oil spill R&D under the Act.
However, nlore specific infonuation on the nature and costs of oil spills as well as the oil spill
prevention, response and remediation system is needed for developing a cost-effective oil spill
R&D program. Assembling a portion of this essential information is the purpose of this study.
This report was prepared on behalf of the Office of Domestic and Intenmtional Energy
Policy, U.S. Department of Energy (DOE), in response to a Task Assignment entitled "Oil Spill
Costs: Estimates and Methods of Measure." The report provides a survey and analysis of the
economic impacts of various types of oil spills, based on a critical review of published
assessments performed on representative oil spills in different regions of the United States.
Using this information, ARI has developed a likely range of costs and damages caused by oil
JA F000911 - 1 -

spills to major industry, government, and other groups and has used these cost data to quantify
and characterize the economic costs of oil spills. This information is intended to assist cost-
benefit analysis to be performed by DOE for determining the most effective investment program
in oil spill research and development.
1.2 Sources of Data
Information on the economic costs of oil spills was obtained from published studies. In
some cases, study authors were contacted for clarification and additional information. It should
be noted that, with the exception of the Exxon Arthur Kill study discussed in Section 4, all
natural resource damage assessments discussed in this report were funded by trustees charged
with protecting these resources on behalf of the public and authorized to levy damages from
responsible parties for cleanup and restoration costs. The petroleum industry's point of view,
or even the opinion of independent observers, is rarely set forth in these published studies.
Nearly every natural resource damage case that has been resolved to date has led to an out-of-
court settlement considerably lower than originally assessed damages. Consequently, it is
possible that some of the published reports may reflect larger assessments of damages than
would be determined in an adjudicated process reflecting the views of all parties.
Nevertheless, the studies reviewed in this report appeared to have taken a reasonable
approach to valuing natural resource damages. For example, contingent valuation studies, which
remain controversial but have been endorsed by NOAA as primary natural resource trustee under
OPA 90, have invariably selected the willingness-to-pay mechanism and other conservative
safeguards in estimating passive use values.
1.3 Methodology
As an introduction to the case studies analyzed in Section 4 of this report, some basic
economic and regulatory background is first provided in this report. Section 2 provides an
overview of the economic concepts used in natural resource damage assessments. Section 3
discusses in detail the development of natural resource damage assessment regulations and
JAF000911 -Z,-
_q

methodologies. After the discussion of the case studies in Section 4, which contain the bulk of
the assessment data, the major conclusions of this study are presented in Section 5.
Three primary oil supply systems were identified as potential sources of oil spills and
possible candidates for future DOE research on oil spill prevention, response and remediation.
Tankers and barges have accounted for the large majority of oil spills, and thus were given
primary emphasis in Section 4 of this report. Four tanker case studies were selected for analysis
of the economic impacts of oil spills: the S.S. Glacier Bay, the Exxon Valdez, the Amazon
Venture, and a series of four tanker spills which appear in a proprietary oil spill data base. Oil
spills resulting from barges, which are towed tankage vessels that operate in coastal waters with
oil spill risks similar to those facing tankers, were categorized along with tanker spills, but no
case studies were selected for analysis.
The second oil supply system analyzed was the combined pipeline/refine_ category.
Pipelines and refineries were grouped because they are both stationary sources with similar risks
and characteristics of oil spills. Pipeline and refinery spills frequently occur in environmentally
sensitive wetlands or other protected coastal locations and thus can benefit appreciably from
early warning and spill control technology. (However, some pipeline and refinery spill locations
are industrialized settings with relatively limited recreational value.) Extensive information on
natural resource damages is available for two pipeline/refinery case studies: the Exxon Arthur
Kill pipeline spill and the Texaco Anacortes refinery spill.
The third oil supply system is the offshore petroleum facility, including oil production
platforms and drilling rigs. Offshore petroleum facilities have not experienced any major
(> 1,000 bbls or 42,000 gals) oil spills during the past decade and a half in the United States
(Opaluch and Grigahmas, 1989), demonstrating an excellent safety record in both gross and per-
bbl terms. However, owing to this superior safety record, only co|nparatively unsophisticated
or fragmentary information is available on the economic impacts of oil spills from offshore
production facilities. The Santa Barbara and Ixtoc oil spills are the only platform spills for
which data are available, and consequently were relied on extensively for this analysis.
Nevertheless, offshore petroleum facilities remain capable of generating very large natural
resource damages under the OPA 90 regulatory framework if a major oil spill should occur.
JAF000911 -3-

Costs cited in this report are presented in both nominal dollars and adjusted 1993 dollars.
To permit direct comparison between oil spills and court settlements that occurred at differeht
times, nominal costs were adjusted to January 1, 1993 levels using the GNP Implicit Price
Deflator prepared by the Bureau of Economic Analysis, Department of Commerce (Exhibit 1-1).
To provide a mechanism for comparing costs from different sized oil spills, economic
impacts were normalized to a spill unit value (per-gallon) basis. Because limited information
was available, the volume of oil spilled was not adjusted for evaporation, fire consumption (with
the exception of Ixtoc), rapidity and efficacy of cleanup operations, or other factors that may
have affected the actual volume of oil causing the impacts.
JAF000911 -4-
7
L

2. Natural Resource Damage Assessment Methodolo_,ies
2.1 Introduction
A number of alternative methods are available for evaluating natural resource damages.
Market-based methods -- such as market price and appraisal -- are generally the most reliable,
assuming that efficient markets for natural resource services exist. However, markets for many
natural resource services are often flawed or non-existent. Such market failures lead to
externalities, where the action of one economic agent affects the well-being or production
possibilities of another in a way that is not reflected in the marketplace.I
tWhere market failures occur, related markets may be used to reveal natural resource
values. Related marke,t methodologies include the factor income, travel cost, and hedonic
pricing methods. Finally, hypothetical markets, such as contingent valuation surveys, need to
be developed to reveal non-use values for natural resource services, for which markets are
completely non-existent.
2.2 Market-Based Methods
The market price method simply relies on the existing market for the resource to
measure diminution in market price due to injury. An example of the market price method
would be to apply the market price of sahnon in assessing fishery damages caused by an oil
spill. The appraisal method can be used where a market exists for existing or similar resources,
such as coastal real estate values affected by a nearby oil spill. Natural resource damages are
measured as the difference in price between injured and non-injured appraised values.
2.3 Revealed Preference Methods
Revealed preference measures have been developed to estimate natural resource values
when market prices are not available. These methods rely on observed behavior or market data
JAF000911 -6-

(that reveal preferences) to infer values for nonmarket resources. Three general types of
revealed preference approaches are currently in use: travel cost, hedonic pricing, and factor
income methods. Each method uses a different type of linkage between a marketed commodity
and a non-marketed resource. Although current DOI and proposed NOAA regulations call
specifically for the use of these three methods, only the travel cost method has been extensively
used to date for determining natural resource damages from oil spills.
The travel cost method is used for valuing the recreational use of sites where travel is
essential to access to the resource. The travel cost approach relies on the relationship between
marketed travel services and a non-marketed resource such as recreational fishing. Often, access
to a recreational site is free or requires only a nominal fee. However, there may be significant
costs associated with visiting the site, frequently many times greater than the cost of access,
which may be interpreted as an implicit price cf the visit. A demand relationship can be
constructed by examining the number of visitor_, traveling from a variety of distances to the site,
which tends to diminish as distance from the site increases (Exhibit 2-1).
The travel cost approach to measuring natural resource services is widely accepted in the
economics profession and has been incorporated into the DOI and NOAA natural resource
damage assessment regulations. Travel cost methodology was used by many of the damage
assessments discussed in Section 4 of this report (e.g., Carson and Hanemann, 1992), primarily
to n,easure the value of lost hunting and fishing and nonconsumptive wildlife viewing due to oil
spills.
The fitctor income method may be used if an injured resource is an input to a production
process that generates a product with a well-defined market price. The resources best suited to
the factor income approach include surface and ground water resources (as inputs to irrigated
agriculture), forests (as inputs to manufactured goods), and commercial fisheries. For example,
an oil spill may reduce non-commercial fish stocks, increasing production costs for a commercial
fish which feeds upon the damaged fish and leading to a decrease in producer surplus or
economic rent.
JA F000911 -7-

!L
Recreation Market Area
"_ s5o ....i illll =
N i Substitute I_ I Site I
10 Trips $40 A
i
$20 _ _ B/ 6Tripslg_ " /k $30 ;
i i
Cost $10 ---:I:
1$0
1 3 6 10
Trips per City
: DemandCurve
Exhibit 2-1a: Examples of travel cost model (TCM), Exhibit 2-1b: Examples of travel cost model (TCM),
Spatial Recreation Market. Demand Curve.
IAFO09 ! I -8-

I
Factor income methodology, although identified as an allowable approach in the DOI and
proposed NOAA damage assessment regulations, is not as well establislled as the hedonic pricing
and travel cost methods. Furthermore, to perform factor income analysis, it is necessary to
develop an engineering-economic model relating production costs to output levels, and also a
model of how changes in resource quality affect production costs. This level of information is
seldom available for oil spill related natural resource datnages. None of the studies discussed
in Section 4 relied on factor income methodology.
Hedonic pricing uses the linkage between the market price of real estate and the quality
of the stirrounding environment to infer values for natural resource damages. This method
disaggregates the individual components that determine the market price for real estate to
detennine the effect of natural resource services on the value of the commodiiy. Hedonic
pricing is based on the assumption that the benefits of an environmental service, such as clean
shoreli,les, is capitalized into property values.
Tire hedonic price method is useful for environmental changes, such as air pollution, that
are long lasting enough to affect property values. However, individual oil spills generally have
not been found to cause long-term damage to property values, although toxic spills over time
have affected prices in parts of the U.S.; one study of the neigilborhood adjacent to New
Bedford harbor determined that PCB contamination led to a decline of up to 8% in property
values, for a total natural resource damage of $20.6 million paid under CERCLA regulations
(Mendelsohn, 1986). Another weakness is that the method does not work well where land is
publicaily held and market sales transactions are limited. Consequently, hedonic pricing,
although certil'ied as an accepted valuation method under the DOI and proposed NOAA
regttlations, has not been cited to date in the literature as an imlx)rtant method R)r measttring
possible injuries to real estate from oil spills.
2.4 Contingent Valuation
The most controversial approach to valuation of natural resource damages is contingent
valuation (CV). CV methodology develops values for non-traded goods and services simply by
JA F000911 -9-
_11_
asking people how much they believe tile goods and services are worth. In this way, CV
attempts to construct a theoretical market to assign values to certain non-use public goods which
have recently been recognized as valid economic entities. Examples of such non-use public
goods include the future option to visit a recreation site, or the desire to have the resource
available for use by others of either the present or fi_ture generations. CV methodology is
widely recognized in the eco_lomic community as the only existing approach for valuing non-use
natural resource services.
Critical Components of a CV Survey
Despite the sound theoretical basis of contingent valuation, actual implementation of this
method remains highly controversial. Some of the critical components of CV survey design
which have been debated include:
1) Definition of Affected Population. One of the most important and controversial
aspects of CV design is definition of the size and location of the population
which, while not currently users of the injured resource, may still hold some non-
use value of the resource. Some studies have argued tha,t the entire population
under the government agency that is assessing the resource as trustee should be
counted. Others argue that the study size should be restricted to a much smaller
base of population directly affected by the oil spill. Population size in CV studies
has varied l'rom several thousand for a local town affected by a small spill, up to
the entire U.S. population for the Exxon Valdez spill. Since average per-person
or per-h_lsehold non-use values are multiplied directly by the selected population
group, CV valuations are highly sensitive to this factor.
2) Definition of the Injured Resource. For the results of the CV survey to be
valid, the injury to the natural resource must be presented in a detailed yet
understandable manner. People need enough data and context to develop a
realistic concept of what they are wduing, without being led to adopt a higher
value than they actually hold for the resource.
3) Definition of Payment V_:hicle. A specific mechanism is necessary for
respondents to express their non-use value. For best results, this payment vehicleshould be both realistic and neutral. For CV studies of non-use values related to
oil slJills, the payment vehicle usually involves the respondent paying higher
JAF0009_I 10- i- I
i , i

income or gasoline taxes to pay for programs to avoid or clean up fl_ture spills.
Taxes are a realistic payment vehicle, but values may be biased downward if
respondents convert the CV question into an expression of dissatisfaction with
taxes, n_ther than a value for the resource.
4) Willingne_,_sto Pay Versus Willingness to Accept. Ntlmerous CV studies have
detennined that Willingness to Accept values for natural resource services are
generally 3 to 5 times larger than Willingness to Pay values. For example, a
study of the value of goose hunting permits in Wisconsin showed that hunters
were willing to pay an average of $21 for a permit, but demanded an average
$101 to give up a permit they already owned (Bishop and Heberlein, 1992). No
data are available comparing WTP and WTA for natural resource damages due
to oil spills. Administrators of oil spill CV surveys have generally taken tile
relatively conservative approach of eliciting only WTP measures.
5) l)etection of Bias. CV answers are highly dependent upon tile way tile central
question is phrased and on suggested answers. Bias can result because of:
Hypothetical bias. The respondent likely has never considered valuing the
resource, and has no experience in exploring the market for substitutes or other
intbrmation. Consequently, it is common for the respondent to use suggested
answers as a starting point about how much their values ought to be.
Intentional misleading. Strategic behavior can occur if tile respondent realizes
that the CV question is purely hypothetical and that stating a very high value will
promote supply of a desired public good.
Criticism ot' CV Methodology
Contingent valuation remains a highly controversial method for determining non-use
natural resource values and damages. A number of specific objections have been raisc_l to CV
methodology and empirical studies have frequently identified inconsistent survey results. It has
been argued in the economic literature that the results of CV studies are variable, sensitive to
details in the survey questionnaire, and vulnerable to upward bias. Some economists go so far
JAFO00911 -II-

as to suggest that there can be no usefifl infomlation content to CV results. Some of the most
serious criticisms of CV methodology include'
Public has exaggerated perceptions of oil spills. Biases caused by respondent
misperceptions are among the most important sources of error in CV surveys. It is well known
that due to :nedia attention, the public has highly exaggerated perceptions of the environmental
hazards of oil spills. "Oil spills are now thought (by the public) to be the fifth most serious of
the 29 environmental problems Roper asked about, despite expert agreement that they pose
relatively low risks to the environment and human health" (Grigahmas and Opaluch, 1993).
Moreover, the highly controversial nature of oil spills risks the respondents sending emotional
symbolic responses based on moral or ethical judgments of blame, rather than specifically
valuing the injuries described in the survey questions.
CV answers can be inconsiste_.t with rational choice. For example, one constructed
CV survey found respondents willing to pay $129 in higher gasoline taxes to control small spills
through the establishment of le'_al response centers, but only $81 to control all spills (including
large _ott VaMez-sized spills) through the establishment of local and regional response centers
(Exhibit 2-2; Dunford et al., 1993). These results indicate that people may have fixed-sized
non-use values, regardless ot' the actual physical damage of the spill (same for Arthur Kill as for
Exxon Valdez). Alternatively, people may have size-sensitive preferences but CV is not suitable
tbr da_nage assessment.
Reported WTP often exceeds actual WTP. Direct tests of the "reality" of CV in
estimating direct use values have been perlbrmed using ordinary market goods. The CV
approach has tended to systematically overestimate the quantity demanded at each price, by as
much as 50 percent in one study of demand lbr strawberries (Diamond et al., 1992). It is likely
that CV methods will produce even higher errors when used to estimate indirect passive use
values such as existence or bequeath value, for which no market exists and respondcnls are
correspondingly less informed.
Re_spondents do not understand or fail to take the questions seriously. Respondents
may not take the questions seriously because the results of the survey are not binding. In
JAY000911 -12-
175 - -
150 - - "7129
@125 - - i
i
PredictedMean 100 --- I
($)WTP ,0 81
75-- ;!
50 '-' -",
25 ----,
o......... I ....... ISmall Spills All Spills
Exhibit 2-2:Predicted means and 90 percent confidence intervals
for open-ended oil spills version
addition, some responses indicate that respondents' value estimates are motivated by punitive
intent, rather than focusing on the specific impacts of spills. Along a similar line of reasoning,
respondents mi, 'it feel pressure to provide a "good" answer, particularly when responding to
an interviewer, which differs from their actual belief. Finally, respondents may be motivated
by the "warm glow" of doing something praiseworthy, such as contributing to environmental
protection.
JAr,000911 -13-

Respondents cannot calculate NPV for multi-year damages. Passive use damages may
be spread out over many years. Therefore, respondents would need to make complex
discounting calctllations to compute a single value.
NOAA Contingent Valuation Panel
Recognizing the controversy surrounding the use of contingent valuation to assess non-use
natural resource damages, NOAA convened a panel of prominent ecoHomists during 1992 to
evaluate the use of this methodology. NOAA intended that reliance upon a presumably
independent academic panel would permit an unbiased analysis of CV methodology. The 6-
member panel was co-chaired by Nobel economists' Kenneth Arrow, who has written
extensively on CV methodology during the past decade; and Robert Solow, an economist with
no particular specialization in CV.
Kenneth Arrow (co-chair) Professor of Economics, Stanford University (Nobel Laureate)
Robert Solow (co-chair) Professor of Economics, MIT (Nobel Laureate)
Paul Portney VP and Senior Fellow, Resources for tile Future
_lward Learner Professor of Econometrics, UCLA
Roy Randner Economist, Bell Laboratories
Howard Schuman Sociologist, Univ. of Michigan
Tile NOAA CV panel admitted that the previously mentioned criticisms of CV
methodology have validity. However, the panel concluded that CV is the only currently
available method for measuring passive use damages, and that error can be reduced through
careful survey design. The panel recommended the following steps be taken to improve CV
survey results:
1) The Willingness to Pay design in practice is more conservative than Willingness
to Accept, despite their theoretical equivalence, and should be employed
exclusively.
2) The valuation question should be posed as a vote on a referendum to enhancerealism.
JA_000911 -14-
3) Adequate information should be provided to respondents about the environmental
damage that occurred. Respondents should also be reminded of their budget
limits constraining their WTP, and about the existence of comparable naturalresources as substitutes, both of which tend toward lower valuations.
4) An adequate tithe lapse should occur between the oil spill and the survey, so that
the scenario of complete restoration appears plausible.
5) The survey should include a variety of other questions that can help to interpret
the validity of the primary response questions. Checks on understanding and
acceptance of the primary survey question should be provided.
JAF000911 - 1 5-

3. Development of Natural Resource Damage Assessment Regulations
3.1 Overview
During the past 13 years, several laws have been enacted which provide for the recovery
of natural resource damages from oil spills. Under these laws, various federal agencies have
been charged with developing guidelines (regulations) governing the assessment and collection
of natural resource damages, but promulgation of the enacting regulations has been a slow and
controversial process. To help summarize this complex history, discussed in more detail below,
a timetable of the major post-1980 NRDA initiatives and regulatory milestones is presented in
Exhibit 3-1.
The legal basis for recovery of natural resource damages was first explicitly established
with the passage of the Comprehensive Environmental Response, Compensation, and Liability
Act (CERCLA, or Superfund Act) in December 1980. CERCLA specified that these regulations
should include both "direct and indirect injury," and required that the "replacement value" and
the ability of the resource "to recover" should be included in the damage assessment. In
response to this act, and following a several year delay, the U.S. Department of Interior (DOI)
issued their natural resource assessment regulations in 1986-7.
However, the DOI regulations were challenged soon after publication by several states,
environmental organizations, and industry groups. In a landmark nding in July 1989, the D.C.
Circuit Court of Appeals struck down the DOI regulations, ordering that non-use damages be
given equal value to direct use damages (State of Ohio v. Department of Interior, 1989). In
response to this ruling, DOI proposed revisions to their assessment regulations in 1992, with
final regulations expected to be published in 1993.
As DOI continues to refine regulations pursuant to CERCLA, the National Oceanic and
Atmospheric Administration (NOAA) is developing natural resource damage regulations pursuant
to the Oil Pollution Act of 1990 (OPA). These regulations will govern assessments for
discharges of oil occurring after August 18, 1990. NOAA has distributed these regulations to
affected federal agencies and is expected to provide them for public review in the Fall of 1993.

1980 1981 1982 ! 1983 1984 ! 1985 ! 1986 1987 1988 i 1989 1990 1991 1992 1993
CERCLA: DO! Oil Spill Assessment Requlations _ _!
CERCLA Enacted i _
ie DOI Advance Notice of:...Proposed Rulerhaking(ANOPR)I_: _ • Second DOi ANOP_R
elProposed type B regulations issued
i • Prol_osedty:peA re_ulation_ issued! :
_ _ • Final type!B regulations issued_ • Final _ypeA regulatiohs issued
I• Final amendments, to iconforrr to SARA
ANOPR of proposed revisions, to Conform :.toOhio ._ourt ruling •
Notice of Proposed Rulemaking, draft type B revisiofis, to cohform to Ohio court ruling •l 1
_ _ Final rev,sed typeI B assessment 'anticipa_d •i Damage assessment modeilfor the Great Lakes environment (NRDAM/GLE) anticipated •
Revised type Aiassessment model for coastal ai_dmarin_eenvironmentsi(aROAM/CiE) ahticipated •
{ :
Oil Pollution Act: NOAA Oil Spill Assessment Requlations_ _ OP;AEnacti_d
NOAh.issues ANOPR for input On development Of regulations•! i : ,:
ANOPR isgued to solicit commentsi• ,.
ANOPR issued summarizing comments reCeived and. soliciting, additional comments•: i
Report!of NOAA panel Oncontingent valuation •Notice of proposed ruiemakin_]anticipated •i " r . ;
: i !
Exhibit 3-1:
Development of natural rosource damage assessment regulations: 1980 - 1993
.IAFO0911 - 17-
3.2 CERCLA
The CERCLA regulations were the first to specifically address natural resource damage
assessment. Under CERCLA, regulations were required to be developed to identify "the best "
available procedures" for determining natural resource damages, whether from oil spills or other
pollutants. The Department of Interior (DOI), by Executive Order, was given responsibility for
developing the CERCLA regulations, but failed to do so within the specified time period of
December, 1982. Following a larger suit by several states, DOI issued "Type B" regulations,
which provide for a relatively sophisticated assessment methodology, in September 1986. DOI's
"Type A" regulations, which provide for simplified assessment of damages using a computer
model, became effective in April 1987. Both procedures are being revised based on a federal
court ruling which successfully challenged portions of the regulations. These two approaches
are discussed below in detail.
3.3 DOI Natural Resource Damage Regulations
DOI developed two methodological approaches for conducting natural resource damage
assessments. A Type A Model was developed for relatively rapid and low-cost assessment of
small- to medium-sized spills in coastal and marine waters. The Type B Method specified a
much more detailed and rigorous assessment for larger, more complex spills.
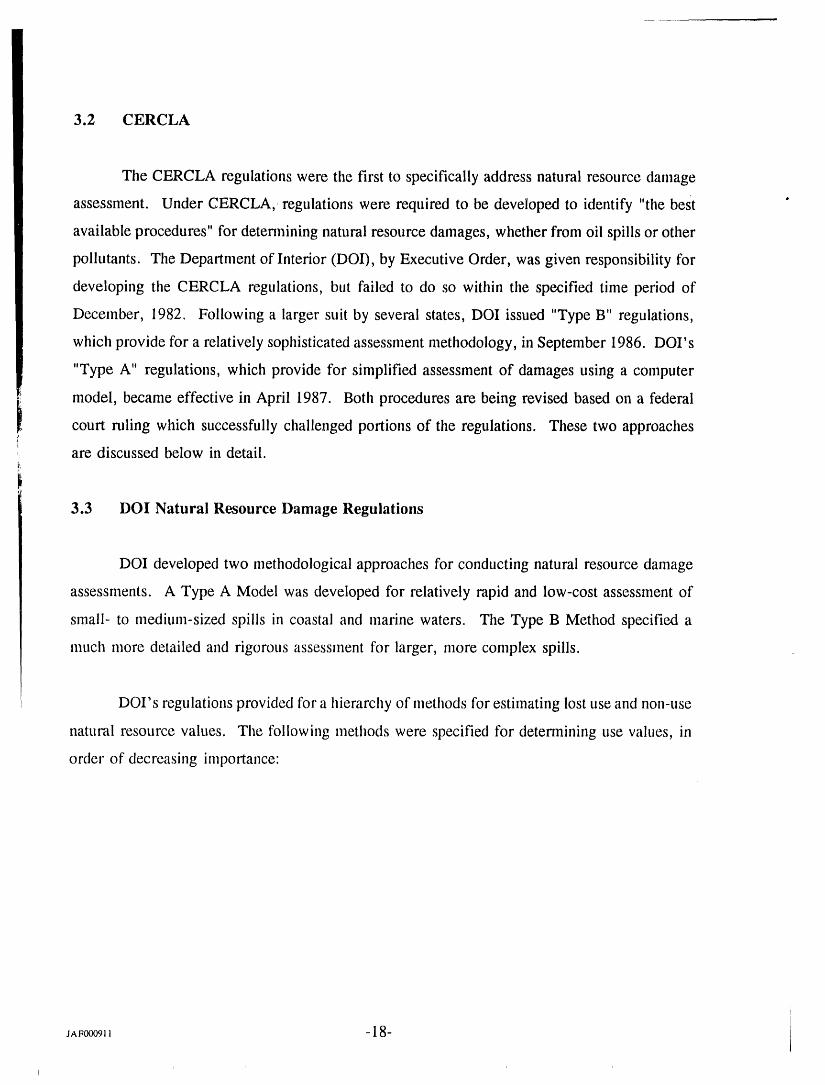
DOI's regulations provided for a hierarchy of methods for estimating lost use and non-use
natural resource values. The following methods were specified for deternlining use values, in
order of decreasing importance:
JAF000911 - 1 8-
i iI
Market Characteristics Methodology
For Reasonably Competitive Market Diminution in Market PriceAppraisal Methodology Based on "UniformAppraisal Standards for Federal LandAcquisition."
For Inefficient/Nonexistent Market Factor IncomeTravel Cost
Hedonic PricingUnit Values
To Be Used If Use Values Cannot Contingent valuationBe Determined
Type A Assessment. The Type A model is considered a pragmatic and cost-effective
assessment technique for relatively minor oil spills. The purpose for Type A cost assessments
is to avoid the high costs of fllll-scale assessments, which can be unreasonably high in the case
of small- to mediunl-sized oil spills. For example, natural resource damages resulting from the
5,700-bbl Arco Anchorage oil spill in 1985 were determined to be $32,930, yet assessment costs
incurred were over seven times larger, totaling about $245,000 (Grigalunas and Opaluch, 1988).
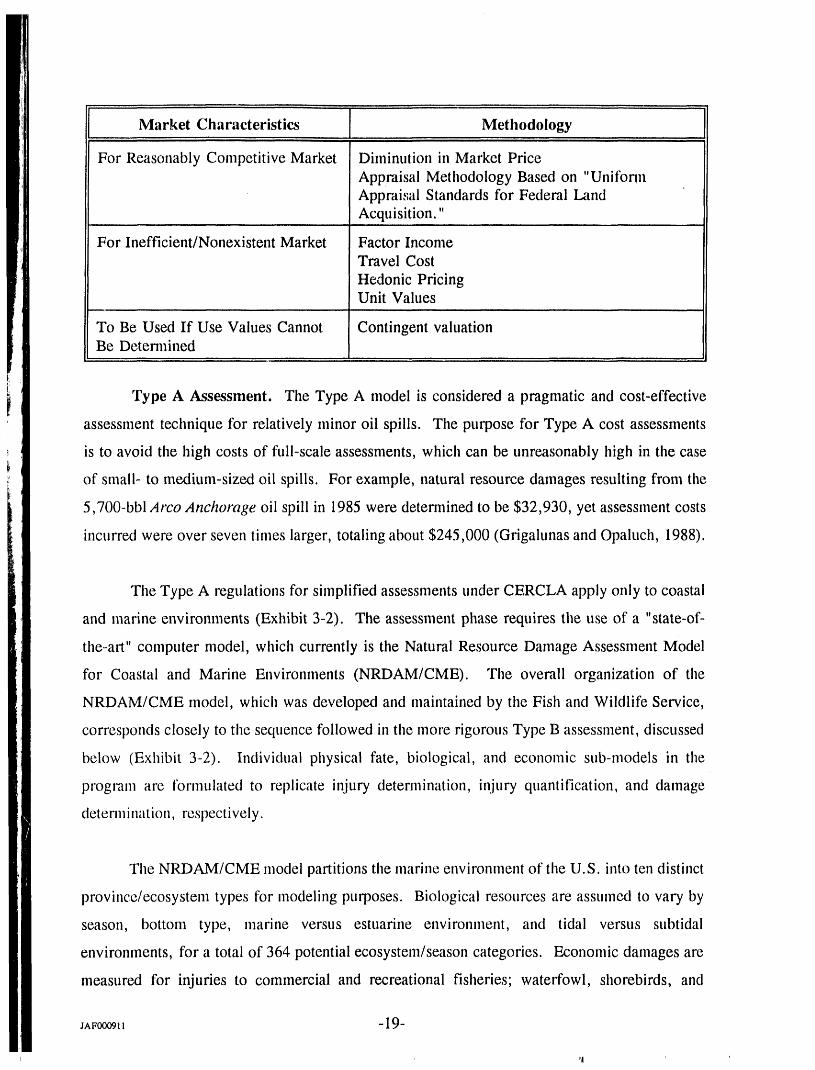
The Type A regulations for simplified assessments under CERCLA apply only to coastal
and marine environments (Exhibit 3-2). The assessment phase requires the use of a "state-of-
the-art" computer model, which currently is the Natural Resource Damage Assessment Model
for Coastal and Marine Environments (NRDAM/CME). The overall organization of the
NRDAM/CME model, which was developed and maintained by the Fish and Wildlife Service,
corresponds closely to the sequence followed in the more rigorous Type B assessment, discussed
below (Exhibit 3-2). Individual physical fate, biological, and economic sub-models in the
program are t'onntllated to replicate injury determination, injury quantification, and damage
determination, respectively.
The NRDAM/CME model partitions the marine environment of the U.S. into ten distinct
province/ecosystem types for modeling purposes. Biological resources are assumexl to vary by
season, bottom type, marine versus estuarine environment, and tidal versus subtidal
environments, for a total of 364 potential ecosystem/season categories. Economic damages are
measured for injuries to commercial and recreational fisheries; waterfowl, shorebirds, and
JAF000911 -19-
,!

Assessment Plan• Coordination• Notification• ContentsandDevelopment• DecidingBetweenType A or B
Type B Type A
IConfirmation
of Exposure!
EconomicMethodology
Determination
t(Subpart E) (Subpart D)
INRDAM/CME
InjuryPathways _ Injury
i,
Testing/Sampling'_1 Determination Pathways
ServicesBaseline InjuryServicesRecoverability Quantification Baseline
RecoverabilityMethodologies• UseValues Damage Methodologies• Restoration Determination • UseValues
II
Post-Assessment• Nepod• Demand• Restoration Account• Restoration Plan
Exhibit 3-2:
DOI NRDA regulations under CERCLA
JAF000911 -20-
seabirds; fur seals; and public beaches. All damages are present values computed over the
period of resource recovery.
Despite this level of sophistication, there are several significant limitations to tile
NRDAlVl/CME model. The model is restricted to providing estimates of lost direct-use values,
such as from tourism or fishing. The model does not currently develop an estimate of
restoration costs, and it does not address non-use values. An attempt to validate the Type A
model with a more detailed Type B assessment on the same scenario determined that the two
approaches yielded results that differed by an order-of-magnitude, providing an indication of the
relative precision of the two procedures (Grigahmas et al., 1992).
The DOI Type B Assessment usually consists of three steps: injury determination, injury
quantification, and damages determination (Exhibit 3-2). ("Injury" generally means the physical
destruction or impairment of a natural resource; "damage" refers to the monetary compensation
for the injury). The injury definitions provide that an injury has resulted from the oil spill if a
specified change in the physical or chemical quality of tile resource is measured, based on
standards established pursuant to earlier laws such as the Safe Drinking Water Act, Federal
Water Pollution Control Act, and other laws. Thus, the regulations broadened past practice,
under which many assessments relied primarily on the more conservative approach involving
body counts of dead organisms as evidence of biological injury.
Injury quantification, the second step of a Type B assessment, provides the linkage
between the injury and the economic measurement of damages. Natural resource "services" are
defined as any function that one resource performs for humans or for another resource.
Consequently, services under CERCLA include not only direct provision of food and recreation,
but also flood control, ground water recharge and other indirect functions. Injury quantification
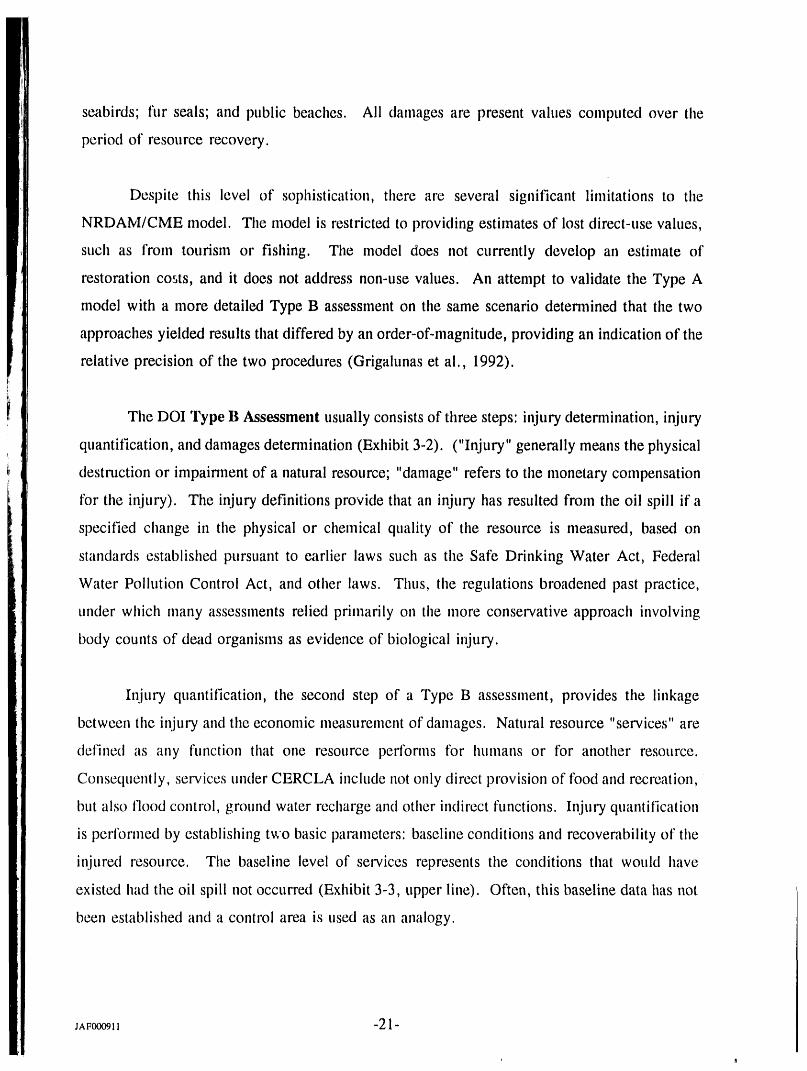
is performed by establishing two basic parameters: baseline conditions and recoverability of the
injured resource. The baseline level of services represents the conditions that would have
existed had the oil spill not occurred (Exhibit 3-3, upper line). Often, this baseline data has not
been established and a control area is used as an analogy.
JAF000911 -21-

The second important procedure in injury quantification is determi_ling the recovery
profile of the resource over time (Exhibit 3-3 lower line). Remediation may accelerate natural
recovery of the resource, setting the tbundation for later restoration recovery, which again is
more rapid than a purely natural recovery pace. The efficacy and justifiable cost of cleanup
efforts to remediate injury caused by oil spills remains a highly controversial topic.
Damage determination, the third step of a Type B assessment, involves the estimation of
the amount of money to be sought as compensation for the injury to the natural resources
resulting from an oil spill. The economic methodologies under this assessment include
restoration, the costs to restore or replace an injured resource to its baseline condition. In
addition, several use-values methodologies are specified to measure the diminution of use values
due to an oil spill. These include diminution in the market price of the resource where a
reasonably competitive market exists. Alternative non-market methods contained in the Type
B assessment methodology include factor income, travel cost, hedonic pricing, and contingent
valuation methodologies (discussed in Section 2).
.IAFO00911 -22-
I I i
Lost Service Flow Lost Service FlowsPrior to Remediation After Remediation Begins
Baseline Service
!U'J
cJ"_: i Restoration¢n_ I Recovery,
_ ! Naturalo ! Recovery
I¢v
I RemediationL_.
I0
z I NaturalI Recovery
Release _ Monthor Year
Exhibit 3-3:
Time profile of a generic one-time oil spill
JAF00911 -23-

3.4 State of Ohio v. Department of htterior (1989)
Tile DOI damage assessment regulations were appealed by several states, environmental
organizations and industry groups. The court specifically targeted two elements of the DOI
regulations for revision' tile "lesser of" rule, defining the measure of damages, and the hierarchy
of valuation methods which ranked non-use damages below damages to direct use resources.
The DOI "lesser of" rule had limited liability for damages to the _ of a resource,
which is often less than the cost to restore or replace the resource. For example, an oil spill that
kills an entire seal rookery would under DOI regulations create damages of only $15 per pelt,
far less than the cost to restore or replace the rookery. DOI argued that economic efficiency
supported the "lesser of" rule, because filll restoration would be wastefi_l if the cost exceeds the
value of the resource -- much as an insurance company would not pay $8,000 to repair damage
to a car worth $5,000 prior to collision (State of Ohio v. DOI, 1989). However, the court
detennined that "Congress established a distinct preference for restoration costs as the measure
of recovery in natural resources damage cases." Furthennore, the court ruled that Congress was
skeptical of the possibility of measuring the true value of a natural resource, particularly if
resources are not directly traded.
'Fhe second court objection was the hierarchy of valuation specit'ied in the DOI
regulations, p:micularly the either/or approach to use and nonuse values. The court noted that
markets t'or most natural resource services are flawed or non-existent, and particularly objected
that the use of contingent valuation (CV) was restricted only to damage assessments where no
direct use wllues could be tbtmd. Whereas DOI had determined that CV is the least reliable
methodology when used to measure non-use or the combination of use and non-use values, the
court nlled thal "DOI could just as easily said that CV was the most reliable," because it is the
only such method presently available.
In response to the State of Ohio v. DOI nding, the DOI is currently modifying its Type
A and Type B damage assessment regulations. The primary changes will involve shifting from
the "lessor of" rule to fllll restoration costs in determining damages, and an increased importance
JAF0009tt -24-

of contingent valuation for measuring non-use values. Final versions of the DOI regulations are
expected to be published in late 1993.
3.5 Oil Pollution Act of 1990
Tile Oil Pollution Act of 1990 (OPA 90) expands the federal statutory liability for
damages resulting from a discharge of oil into navigable waters, and is intended to provide
compensation for a wider range of injuries than provided under CERCLA and CWA initiatives
(Public Law 101-380, 1990). Momentum for passage of OPA 90 was largely generated by the
1l-million gallon F_jxon VaMez oil spill in Alaska, and three subsequent smaller oil spills which
occurred within a 24-hour period in the coastal waters of Rhode Island, the Delaware River, and
the Houston Ship Channel.
OPA 90 builds on the experience gained in the implementation of the Water Pollution
Control Act (WPCA) and CERCLA, with which it shares similar provisions. OPA 90 applies
to eligible oil spills which occurred after August 18, 1990. The essential provisions of OPA 90
which relate specifically to natural resource damage assessment are discussed in the following
sections.
OPA 90 also covered regulations and research and development for oil spill prevention
and remediation, which is a separate topic outside the focus of this report, Title VII of the Act
established an Interagency Coordinating Committee on Oil Pollution Research, consisting of
representatives of major government agencies concerned wit!_ oil pollution R&D. The Act
provides for research and development in innovative oil pollution technology, including:
improved vessel design and operational practices; improved methods tbr recovery, removal, and
disposal of spilled oil; improved environmental baseline data to help gauge the impacts of oil
spills; and new methods ibr restoration and rehabilitation of natural resources damaged by oil
discharges. In addition, OPA provides for research in economic methods of assessing natural
resource damages due to oil spills, recognizing the imprecision and controversy which still
surrounds most of the methods described in this report.
JAF00091t -25-

Natural Resource Trustees
Under OPA 90, tile President, or authorized representative of any State, Indian tribe or
foreign government oil behalf of the public, is the assigned tmst_ of natural resources to present
a claim and recover damages (Exhibit 3-4). The National Oceanic and Atmospheric
Administration (NOAA) is vested through the Under Secretary of Commerce for Oceans and
Atmosphere with responsibility of promulgating natural resource damage assessment regulations,
which are discussed in Section 3.6. NOAA is required to consult with other "affected" agencies,
such as DOE, in formulating these regulations.
Liability
Liability under OPA 90 involves two primary categories: removal costs and damages.
Removal costs are the direct costs of containing and cleaning tip the oil spill, whether incurred
by tribal, local, State, or Federal government or by the operator. Removal costs are relatively
straightfiJrward to compute. The second type of liability is damage resulting from the oil spill,
which can be much more diverse and controversial to determine.
Removal costs include any costs incurred by Federal and State governments or
individuals consistent with the contingency plan drafted by the resource trustee. Response costs
to contain and control an oil spill are not specifically identified in the Act as a covered removal
cost or damage, but _nay be reasonably considered as a legitimate removal cost.
l)amage Costs, not to be cot|iiised with i_tmitive fines for negligence, are set ibrth in the
()PA [section i()()2(b)(2)1:
1) Natural resources: Damages tbr destruction to natural resources are recoverableby a U.S. or other govermnent trustee. The measure of natural resourcesdamages will be [section 1002(b)(2)(A)]:
A) The cost of restoring, rehabilitating, • ' "replacing, or acquiring the equivalentof the damaged natural resources.
B) The diminution in value of those natural resources pending restoration;plus
JAFCX_Oglt -26-
i

Trustee of Natural Resources
Indian ForeignPresident States Tribes Claimant
National Oceanic andAtmospheric Administration
(NOAh,)
Under Secretary of State for Oceans and Atmosphere
I,. "IDO!- Fish & Wildlife P
Other affected agencies
Natural ResourceDamage Assessment
Regulations
NOAA Damage AssessmentRegulations Team
(DART)
Exhibit 3-4:
Oil Pollution Act of 1990 - Natural resource damage assessment
.1A_:o_1t -27-

C) The reasonable cost of assessing those damages.
2) Real or personal property: Damages for economic losses resulting fromdestruction of real or personal property are recoverable by the owner of thatproperty.
3) Subsistence use: Damages for the loss of subsistence use of natural resourcesare recoverable by any claimant reliant upon then1, regardless of ownership ofthese resources.
4) Revenues: Damages are also recoverable by the federal or other government forthe net loss of taxes, royalties, rents, fees, or net profits due to the destructionor injury to real or personal property, or to natural resources.
5) Profits and earning capacity: Damages equal to the loss of profits orimpairment of earning capacity due to the injury or loss of real or personalproperty, or natural resources may be recoverable by any claimant.
6) Public services: Damages for costs of providing additional public services, suchprotection from safety hazards, caused by an oil spill are recoverable by a Stateor local government.
Measure of Damages
Under OPA 90, trustees are required to conduct necessary assessments to estimate the
cost of implementing the remediation plans, and to calculate the diminution in lost use and other
injury pending restoration. The principle cost components ot' the remediation plan include
restoration of the damaged natural resources, diminution in value of those natural resources
pending restoration, and the reasonable costs of assessing the damages.
l,imits on Liability
()PA 90 set the following limits on liability for lbur types of operations prone to oil
spills. Note that these liabilities are linked to gross ton for vessels, rather than in actual w)lumes
of oil spilled.
1) $1,200 per gross ton for a tanker.
2) $600 per gross ton for any other vessel.
3) $75 million for an offshore facility, plus all removal costs.
4) $350 million for any onshore facility and deepwater port.
JA_0(_lz -28-

The President was required to report to Congress on the desirability of adjusting these
limits of liability within 6 months following enactment of OPA 90, and from time to time
thereafter. However, no changes in liability limits have been suggested to date. In addition,
these initial liability limits are required to be adjusted not less often than every three years to
reflect "significant" increases in the Consumer Price Index.
Period of Limitations for Claimants
OPA 90 established a period of limitations for claims resulting from an oil spill.
Separate time constraints were established for removal cost claims and damage claims. All
claims considered under the Act must be filed within these time limitations to be considered
valid:
1) Removal Costs: Claims must be presented within 6 years following the date ofcompletion of all removal (cleanup) actions for the oil spill.
2) Damages: Claims must be presented within 3 years following the linkagebetweeta the oil spill and the injury, such as by the natural resources damageassessment. This period is shorter than the removal cost limitations, probablybecause of uncertainty in linking natural resource damages to particular oil spills.
3.6 NOAA Regulations (Proposed)
Under OPA 90, NOAA was given two years to promulgate regulations for the assessment
of natural resource damages from oil spills. Earlier regulations developed by DOI were
specifically prohibited for calculating damage assessment. NOAA released the proposed
regulations for review by other affected agencies in August 1993. Publication tbr public
comment is expected to take place during the Fall of 1993, three years after enactment.
NOAA's proposed regulations, as provided to DOE, allow four alternative procedures
which trustees may follow in assessing natural resource damages, depending on spill size and
severity and type of damage. These methods include: the use of compensation formulae for
small spills to calculate damages while incurring minimum assessment costs; a Type A model
JAFO00911 -29-

similar to DOI's Coastal and Marine Environments Model; an expedited damage assessment;
and, a comprehensive damage assessment similar to but more sophisticated than DOI's Type B
assessment.
Compensation formulae can be used if the oil discharge is 10 to 50,000 gallons and no
significant loss in passive use values has occurred. Two separate formulae and accompanying
schedules were developed: one for estuarine and marine environments, and one for inland
(freshwater) waters. The formulae are available for use where the accurate quantification of
injury and damages would not be cost-effective in the determination of the trustee.
Type A Model, developed originally by the U.S. Fish and Wildlife Service for
Coastal/Marine Environments, may be used if judged to be compatible by the trustee, and if
compensation formulas alone are not sufficient.
Expedited Damage Assessment (EDA) is to be used primarily for significant spills
(50,000 to 1,000,000 gallons) that do not affect highly sensitive resources or do not result in
major losses of natural resource services (apart from these general guidelines, no specific
examples of EDA application were provided in the proposed regulations). NOAA recommends
the EDA procedure where neither compensation formulae nor the Type A Model are sufficient,
where infonnation on the nature of the discharge and its effect on natural resources and/or
services is readily available, and where damages can be calculated by conducting limited
analysis. The EDA should be considered where the costs of conducting a comprehensive
damage assessment greatly exceeds the anticipated damages. The ED-A approach falls between
the DOI Type A and Type B models in sophistication, and is expected [o be completed within
two years from the date of discharge. Recreational, commercial, and ecologically important
resource services are assessed, but passive use damages are not specifically addressed by the
EDA methodology.
Comprehensive Damage Assessment (CDA) is to be used if the trustee determines that
injury and damages resulting from the discharge can best be detennined through a complex,
prolonged process, involving a b_0ad scope of injury determination and compensable values
studies. A CDA is recommended for oil spills exceeding 1,000,000 gallons. In addition, a
,,.._•
JAF000911 -30-

CDA should be conducted where potential restoration actions cannot be determined or
implemented without determination of injury and compensable values. All damage determination
methods listed in DOI Type B assessments are permitted, including contingent valuation.
3.7 State of Washington Oil Spill Compensation Schedule
In May 1992, the State of Washington implemented a simplified natural resource damage
procedure for small- to moderate-sized oil spills in state waters (Geselbracht and Logan, 1993).
Under these procedures, the damage assessment for qualifying spills is performed using a
compensation schedule, which is based on formulae intended to capture both the vulnerability
of the resource and the toxicity/longevity of the oil spill. As mandated by the state's Resource
Damage Assessment Act, the per-barrel fines range from $1 to $50. Although the state's
Department of Natural Resources has identified a total of 16 oil spills which are eligible for
assessment using the new schedule, all these cases remain under judicial review and no data are
publically available.
The purpose of Washington State's compensation schedules (much as for the NOAA
compensation formulae) is to reduce the costs of the assessment, which for some oil spills have
exceeded actual injuries by an order of magnitude. The schedule does not specify size lin',l,s for
determining the applicability of oil spills: highly damaging oil spills may still be assessed using
more thorough and costly methods.
The Washington State compensation tables are based on two primary factors: resource
vulnerability rankings and an oil effects ranking. Resource vulnerability rankings were
developed for seven types of important resources potentially affected by an oil spill. The "oil
effects" rankings rate the potential for the oil spill to actually lead to injury of the resource,
based on the chemistry and physical properties of the type of oil spilled.
JAF000911 -31-

Resource Vulnerability
The resource vulnerability ranking is a measure of tile susceptibility of various marine
resources to damage from an oil spill. The ranking is a composite of individual ratings
developed for seven categories of marine resources: 35 types of marine and estuarine habitats,
marine bird populations, 61 species of commerciaUy or recreationally harvested marine fish, 38
species of harvested shellfish, salmon species and ages, 15 marine mammal species, and various
recreational attributes. Seasonality also affects each of the individual resource vulnerability
rankings. Finally, damages are directly proportional to the area of impact for each individual
resource class. Vulnerability of each resource is ranked, with 1 indicating the least vulnerable
condition and 5 representing the most vulnerable.
Each type of resource vulnerability ranking was developed by the state in consultation
with an advisory committee comprising resource experts from state and federal agencies,
academia, consulting firms, Indian tribes, and environmental organizations. Industry input was
limited to public comment on the proposed rule. The schedules do not consider passive non-use
natural resource values, such as option and existence values.
Oil Effects Rankings
The oil effects rankings rate the relative potential of spilled oil to cause three types of
harmful impacts on natural resources: acute toxicity, mechanical injury, and environmental
persistence. These three effects were rated fer five types of crude oil or products which account
for 90 % of the oil shipped through state ccastal waters. The rankings rate the relative severity
of damage caused by the oils, with 1 representing a potential for the least injury, and 5
representing a potential for maximum injury (Exhibit 3-5).
Toxicity was based on sohlbility and weight-fraction of i-ring aromatic hydrocarbons inthe spilled oil, rather than any empirical evidence of oil toxicity.
Mechanical injury, caused primarily by coating and smothering, was assumed to varyinversely with API gravity, based on empirical evidence. Therefore, higher density oilswere ascribed a higher (more severe) rating.
JAF000911 -32-
i i
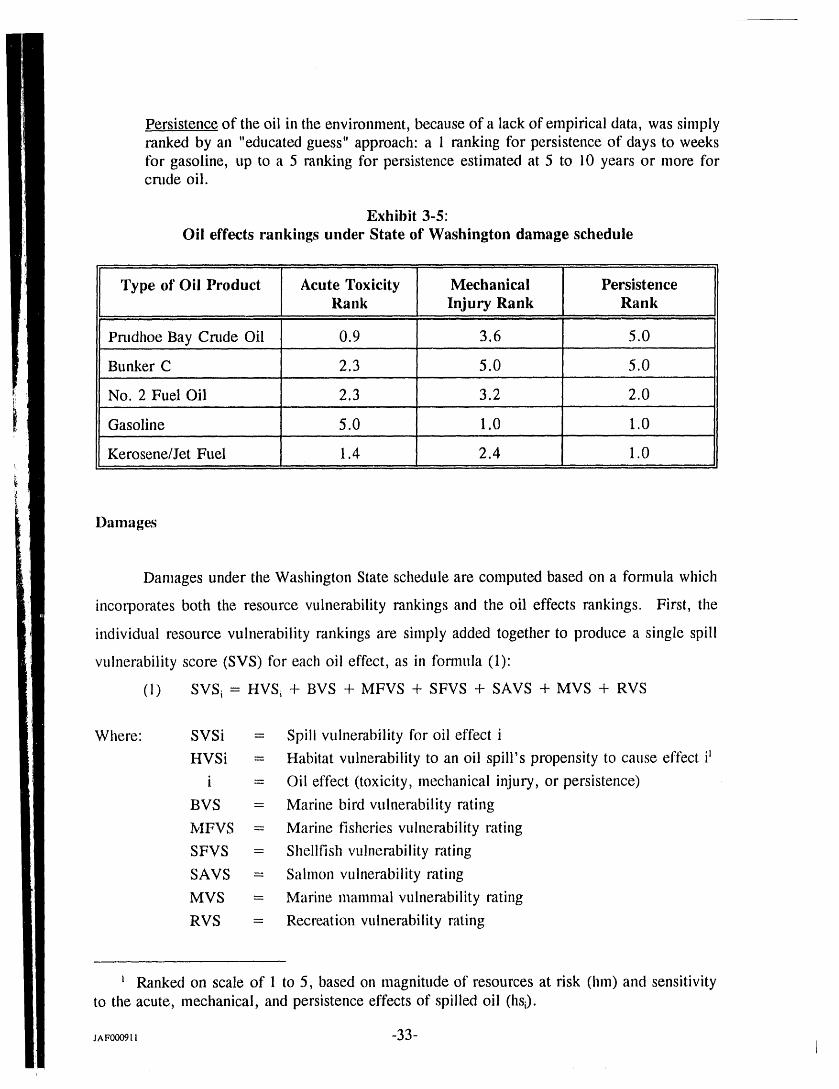
Persistence of tile oil ill tile environment, because of a lack of empirical data, was simplyranked by an "educated guess" approach: a 1 ranking for persistence of days to weeksfor gasoline, up to a 5 ranking for persistence estimated at 5 to 10 years or more forcrude oil.
Exhibit 3-5:
Oil effects rankings under State of Washington damage schedule
Type of Oil Product Acute Toxicity Mechanical PersistenceRank Injury Rank Rank
....... _.... , i ill i IIIIIHI ii_ii ii,l,l i ,llll i
Prudhoe Bay Crude Oil 0.9 3.6 5.0................................
Bunker C 2.3 5.0 5.0................
No. 2 Fuel Oil 2.3 3.2 2.0....
Gasoline 5.0 1.0 1.0......... i i i i ii i
Kerosene/Jet Fuel 1,4 2.4 1.0..............
Damages
Damages under the Washington State schedule are computed based on a formula which
incorporates both the resource vulnerability rankings and the oil effects rankings. First, the
individual resource vulnerability rankings are simply added together to produce a single spill
vulnerability score (SVS) for each oil effect, as in formula (1):
(1) SVS_ = HVS_ + BVS + MFVS + SFVS + SAVS + MVS + RVS
Where: SVSi = Spill vulnerability for oil effect i
HVSi = Habitat vulnerability to an oil spill's propensity to cause effect i_
i = Oil effect (toxicity, mechanical injury, or persistence)
BVS = Marine bird vulnerability rating
/vIFVS = Marine fisheries vulnerability rating
SFVS = Shellfish vulnerability rating
SAVS = Salmon vulnerability rating
MVS = Marine mammal vulnerability rating
RVS = Recreation vulnerability rating
Ranked on scale of 1 to 5, based on magnitude of resources at risk (hm) and sensitivityto the acute, mechanical, and persistence effects of spilled oil (hsi).
JAF000911 -33-I
i
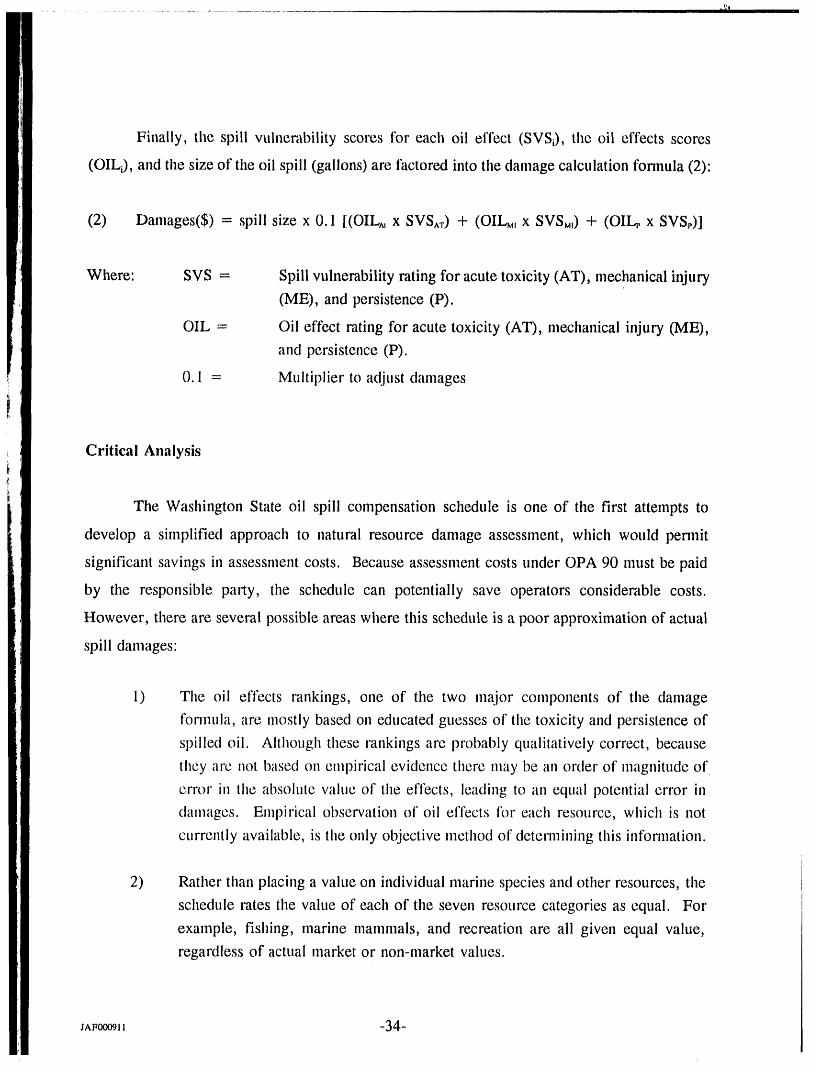
Finally, tile spill vulnerability scores for each oil effect (SVS_), tile oil effects scores
(OIL_), and the size of the oil spill (gallons) are factored into the damage calculation formula (2):
(2) Damages(S) = spill size x 0.1 [(OIL^_x SVS^T) + (OILM,x SVSM,) + (OIL. x SVS,)]
Where: SVS = Spill vulnerability rating for acute toxicity (AT), mechanical injury)
(ME), and persistence (P).
OIL = Oil effect rating for acute toxicity (AT), mechanical injury (ME),
and persistence (P).
0. I = Multiplier to adjust damages
Critical Analysis
The Washington State oil spill compensation schedule is one of the first attempts to
develop a simplified approach to natural resource damage assessment, which would pennit
significant savings in assessment costs. Because assessment costs under OPA 90 must be paid
by the responsible party, the schedule can potentially save operators considerable costs.
However, there are several possible areas where this schedule is a poor approximation of actual
spill damages:
1) The oil effects rankings, one of the two major components of the damage
fonnula, are mostly based on educated guesses of the toxicity and persistence of
spilled oil. Although these rankings are probably qualitatively correct, because
they are not based on empirical evidence there may be an order of magnitude of
error in the absolute value of the effects, leading to an equal potential error in
damages. Empirical observation of oil effects for each resource, which is not
currently available, is the only objective method of determining this information.
2) Rather than placing a value on individual marine species and other resources, the
schedule rates the value of each of the seven resource categories as equal. For
example, fishing, marine mammals, and recreation are all given equal value,
regardless of actual market or non-market values.
JAFO0_11 -34-

3.8 Florida Natural Resource Damage Compensation Schedule
In 1992, the same year as the Washington State regulations were published, Florida
enacted a similar approach to formulaic compensation of natural resource damages from oil spills
(Plante et al., 1993). Like Washington's law, the Florida schedule sets out a formula for
calculating damages based on the atnount and type of spill, the spill's location and areal extent,
and tile type of resource affected. The schedule may be used to determine damages from oil
spills of up to 30,000 gallons. The formula for compensation was based on the cost of restoring
resources to their pre-spill condition and on the value of lost use of damaged resources between
injury and restoration.
Oil effects rankings were developed for various oil products based on toxicity,
persistence, and other characteristics, similar to the Washington State approach.
Resource vulnerability was determined for a variety of habitats in state waters, again
generally similar to the Washington State schedule.
Damages were determined according to the following formula, which involves both oil
effects and resource vulnerability rankings:
Damage = {B x Vx LxSMA + A} xPC + ETS + AC
Where: B = Base rate of $1 per gallon
V = Volume of pollutant in gallons
L = Location factor -- 8 for inshore, 5 for nearshore, and 1 for offshore
SMA = Special management area factor -- 2 for state parks, wildlife refuges and
other protected areas.
A = Additive dollar amount for impacted habitat, times the SMA factor
($10/ft 2 for coral reef, $1/fi_ lbr mangroves, $0.05/ft 2 for sandy bottom.
PC = Pollutant characteristic factor-- 8, 4, or I depending on toxicity,
solubility, persistence, and dispersibility.
ETS = Damage compensation for death of endangered species -- $10,000 each
AC = Administrative costs of conducting damage assessment.
JAF00oglt -35-

Florida's approach differs from that of Washington State in several important ways:
1) The Florida trustee is allowed somewhat greater latitude in assigning oil effects
rankings.
2) Florida's resource vulnerability range is more circtlmscribed than Washington's,
with an 8-fold potential variation in damages, compared with a 35-fold potential
variation tinder the Washington schedule (which has 7 resource categories, each
tanked 1 to 5).
3) Administrative costs, not counted in Washington's schedule, are included under
Florida's assessment approach. This generates a potential disincentive to
minimize assessment costs, the primary purpose of the schedule.
Sections 2 and 3 of this report provide an overview of the methodologies and regulatory
framework, respectively, for natural resource damage assessment. The remainder of this report
focuses on specific case studies of natural resource damages resulting from oil spills.
JAF00091_ -36-"

4. Critical Analysis of Natural Resource Damage Assessments
4.1 Overview
To deternline the economic impacts of oil spills, eight case studies from three spill-
prone components of the oil supply system were examined: tankers/barges, pipelines/refineries,
and offshore production facilities (Exhibit 4-1). For each case study, all publicaily available
assessments quantifying response and cleanup costs and natural resource damages resulting from
the oil spill were compiled. Where available, information on indirect, non-use damages caused
by oil spills was integrated with more plentifld data on direct use impacts. The methodology
and results of these assessments were critically reviewed to develop a most likely range in oil
spill impacts. Where information was available, impacts were characterized by affected
industry, government, or other group. Finally, economic impacts were normalized to spill size,
to develop spill unit values to permit comparison among cases.
Due to the mobility of tankers, tankers spills can cause the highest spill unit cost values
(as well as the widest range), depending on cleanup conditions and the environmental
characteristics of the spill location. Pipeline and refinery spills caused the next highest (and
more unifonn) spill unit cost values, primarily because they frequently are located in sensitive
wetland environments where cleanup is costly and natural resource damages are significant.
Spills from offshore production filcilities were determined to cause the lowest spill unit cost
values, although information from this type of spill is limited and out of date.
A total of four tanker spill case studies are analyzed in Section 4.2. Tanker spills
caused widely varying unit spill costs. The S.S. Glacier Bay spill in Cook Inlet, Alaska resulted
in very high damages to commercial fishing, but relatively modest other use and non-use costs.
The Ex.xon Valdez spill, in contrast, created the highest non-_ ._e natural resource damages on
record, with relatively modest spill unit cost values for direct use damages. The Amazon
Venture oil spill in the Savannah River caused very low unit cleanup and natural resource
damages. The Mercer data base of four tanker spill settlements showed natural resource
damages ranging from $4.15 to $35.71 per gallon.
JAF000911 -3"7-

Two pipeline/refinery spills are discussed in Section 4.3, Tile Exxon Arthur Kill
pipeline spill in Staten Isbnd, and the Texaco Anacortes refinery spill near tile Puget Sound,
Washington. Finally, the 1969 Santa Barbara oil spill and tile 1979 Ixtoc spill are analyzed to
provide information on offshore production facilities in Section 4.4. Although these offshore
platform spills predate significant oil spill legislation and occurred prior to the development of
many natural resource damage estimation methods, they are the only significant offshore spills
for which cost data are available.
JAF(K)0911 "38-
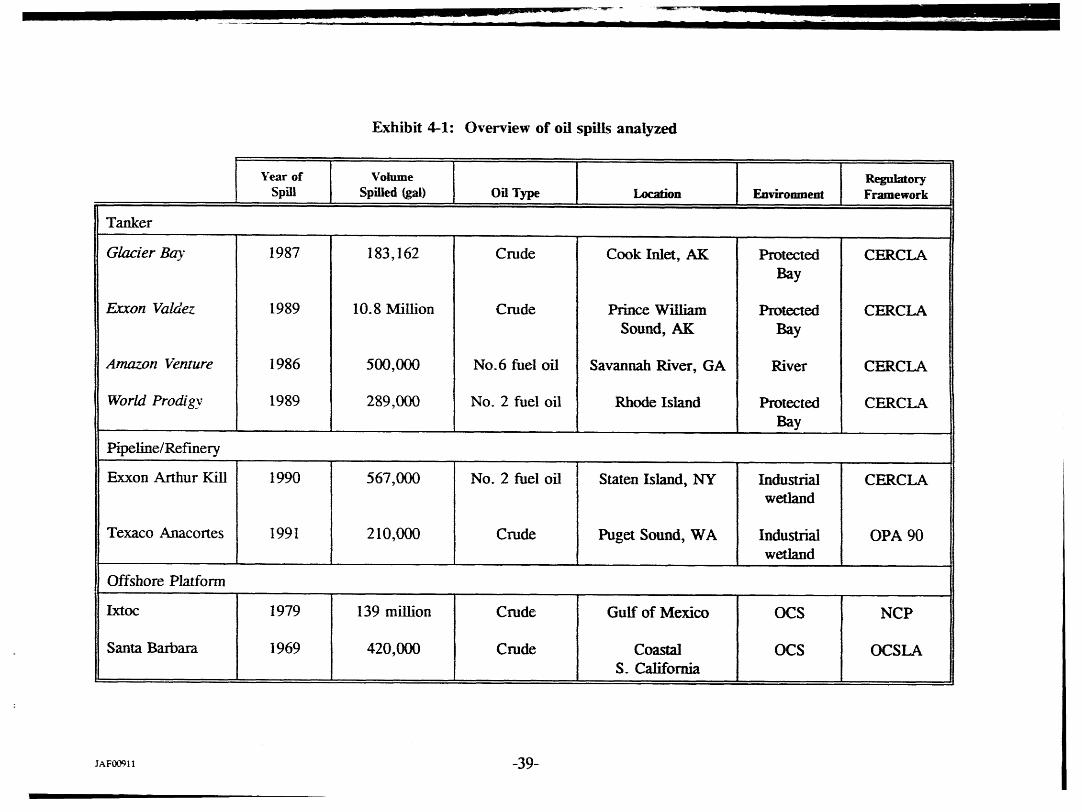
TN fl" II I[A m_il I mmlNII _" _ _" -- "
Exhibit 4-1: Overview of oil spills analyzed
I..................
Year of Volume RegulatorySpill Spilled (gal) Oil Type Location Environment Framework
Tanker
Glacier Bag" 1987 183,162 Crude Cook Inlet, AK Protected CERCLABay
Exxon Valdez 1989 10.8 Million Crude Prince W'dliam Protected CERCLA
Sound, ._,_ Bay
Amazon Venture 1986 500,000 No.6 fuel oil Savannah River, GA River CERCI_
World Prodigy 1989 289,000 No. 2 fuel oil Rhode Island Protected CERCLA
Bay
Pipeline/Refinery
Exxon Arthur Kill 1990 567,000 No. 2 fuel oil Staten Island, NY Industrial CERCLAwetland
Texaco Anacortes 1991 210,000 Crude Puget Sound, WA Industrial OPA 90wetland
Offshore Platform
Ixtoc 1979 139 million Crude Gulf of Mexico OCS NCP
Santa Barbara 1969 420,000 Crude Coastal OCS OCSLAS. California
JAF00911 -39-
I
4.2 Tanker Spills
4.2.1 Exxon Valdez (Prince William Sound, Alaska)
Introduction
On March 24, 1989, the tanker Exxon Valdez ran aground about 25 miles south of Valdez
in Alaska's Prince William Sound, spilling an estitnated 10.8 million gallons of North Slope
cntde oil. This catastrophe was one of the largest and most damaging spills on record, affecting
a wide range of industries, such as tourism and fishing, and causing considerable impacts on
subsistence uses, wildlife, and (according to one study) passive use damages affecting the entire
U.S. population,
Approximately 350 miles of shoreline within Prince William Sound, a protected and
environmentally sensitive body of water, were oiled to varying extents during the spill, of which
40 to 50 miles could be classified as moderately to heavily oiled (Dean et al., 1993). The extent
of shoreline affected by the oil spill amounted to 15% of the total Prince William Sound
shoreline, with 3 % of the total shoreline moderately to heavily oiled (Exhibit 4-2).
i A number of studies are available quantifying cleanup and natural resource damages
' c ted this section wereresulting from the Exxon Valdez oil spill. Most of tile studies i in
performed on behalf of the Alaska Attorney General's Office to determine damages related to
the state and federal case against Exxon Corp., Exxon Shipping Co., and the Alyeska Pipeline
Service Co. and its owners. Some of these studies are preliminary or do not take the final step
of assessing the dollar value of physical injuries. Consequently, although the Exxon Valdez case
study contains more detail than for any other case analyzed, the analysis remains only a
preliminary assessment of the complex natural resource damages resulting from the Exxon VaMez
oil spill.
Ill January 1992, Exxon agreed to a repolled $1. 125 billion settlement with Alaska and
federal government trustees for damage claims caused by the spill (Ward and Duffield, 1992),
the largest single environmental settlement in history. The magnitude of this settlement, far
-40-J

I*
BristolBay
Island
_ _ Gulf of Alaska
Exhibit 4-2:
Map of the Exxon Valdez oil spill area (spill impacts not u,flt'orm).
higher than calculated direct use damages, indicates that passive non-use values were implicitly
agreed to by Exxon. Some private civil claims remain in litigation, which has slowed the release
o1'spill cost and damage inlbrmation to tile public.
Response and Cleanup Costs
Under OPA 90, trustees are permitted to recover all costs of responding to and cleaning
up an oil spill. Only general information on response and cleanup costs was available for the
Exxon Valdez oil spill. Exxon, other industry groups, and government together are estimated
JAf_009tt.tt -41-
'11 '

to have spent a total of about $2.8 billion (19935) on direct cleanup of the oil spill (calculated
from Mercer, 1992). Cleanup costs amounted to approximately $260 per gallon spilled, the
largest single cost category related to the spill (69 % of combined costs and damage settlement),
and exceeding settled natural resource damages paid to governmem trustees (exhibit 4-3). Unit
costs for cleanup operations greatly exc_ded those from other oil spills, which generally ranged
from $20 to $40 per bbl. Exxon's cleanup costs were so high because of the environmental
sensitivity of the spill location and the high mobilization and labor costs encountered in the
remote cleanup site.
Capital Losses
The Exxon VaMez spill resulted in sizeable direct capital losses, mainly lost oil and
damage to the ship. However, these losses account for only a very small proportion of total
damages caused by the spill. The estimated 10.8 million gallons of oil lost in the accident was
worth approximately $0.36/gal at the time and location of the loss, for a total damage of $3.86
million (Exhibit 4-3). Ship repair costs, and the opportunity costs of ship downtime during
repair, have not been publically reported but were probably substantial.
Natural Re.source Damages
The E,,:ron Valdez oil spill adversely impacted a wide range of natural resource services
in south-central Alaska. Information was available on natural resource damage assessment costs,
and damages to commercial and sport fisheries, tourism, and wildlife. In addition, a contingent
valuation survey of non-use natural resource damages caused by the oil spill was available. All
of these assessments were peribnued on behalf of government resource trustees; no damage
assessments funded by Exxon or independent groups have been publicly released.
l^F,_lt tt -42-I

Exhibit 4-3:
Summary of estimated costs and damages (top) and actual settlement due to the Exxon Valdez oil spill(Brown, 1992; Carson & Hanemann, 1992; Carson et al., 1992; Harrison, 1991; MeDowell Group, 1990; Mercer, 1992).
1
Direct Use Damages Non-use DamagesCleanup Lost Oil NRDA ................
Costs Value Assessment Commrc'l Tourism/ Wildlife Existence
Costs Fishing Sport Rehabilitation* Option, Etc. Total*Vtshing
_ Estimated Damages
TOTAL
(Millions $) 2,300 3.86 100 - 200 76.0 50.0 48.2 2,800 5,378 - 5,478Various Years
.
TOTAL
Million (1993 $) 2,780 4.31 107 - 214 91.9 55.8 53.9 3,000 6,093 - 6,200,., ,,,, ,, ,, _,, ,,, , .,, , ,,, , , i
PER GALLON
(1993 $) 257 0.40 9.91 - 19.81 8.51 5.16 4.99 278.00 564 - 574,= ,, __'. ., ,, ,
Actual Settlement NRD Settlement Wildlife
& Expenditures Rehabilitation....
TOTAL
Million $ 2,300 3.86 1,125 45 3,474Various Years
.....
TOTAL
Million (1993 $) 2,780 4.31 I, 158 50.2 3,993
PER GALLON 257 0.40 107 4.6" 370
(1993$)...... . .........
* ARI Estimates
JAF00911 -43-

NRDA Assessment Costs
Under OPA 90, in addition to response/cleanup costs and natural resource damages,
trustees are also permitted to recover reasonable costs of assessing natural resource damages.
Because the Exxon Valdez spill occurred prior to passage of OPA, the costs incurred by
government trustees to assess natural resource damages related to the spill have not yet been
rigorously examined. A published NOAA estimate placed total damage assessment costs
incurred by government at approximately $100 million, and speculated that Exxon had spent a
comparable amount in developing its defense case (Luthi et al., 1993; Exhibit 4-3).
Commercial Fishing
A comprehensive study of losses to the commercial fishing industry is still in progress
by the State of Alaska Attorney General's office. Claims to July 1, 1993 for lost or damaged
catch, gear and boats fouled by oil, have totaled $76 million (Exhibit 4-3; personal
communication, Alaska Attorney General's Office, October 11, 1993).
Sport Fishing
As with other oil spill impacts, recreational uses -- particularly sport fishing -- provide
the best opportunity for rigorous damage assessment. The Alaska Department of Fish and Game
(ADFG), which for many years had collected detailed baseline data on economic benefits of
recreational fishing, issued a report documenting changes in recreational fishing patterns due to
the Exxon Valdez oil spill (Mills, 1992). Based on these changes in recreational fishing
behavior, Carson and Hanemann (1992) conducted a study assessing the cost of these changes
using travel cost methodology.
The ADFG study utilized questionnaires mailed to random purchasers of fishing licenses.
ADFG had been performing similar surveys annually since 1979, establishing a standardized
sampling system; thus a good baseline of data was available for comparison with post-spill
impacts. ADFG defined a baseline as the period 1984 to 1988, during which recreational fishing
increased annually by about 10% (Exhibit 4-4).
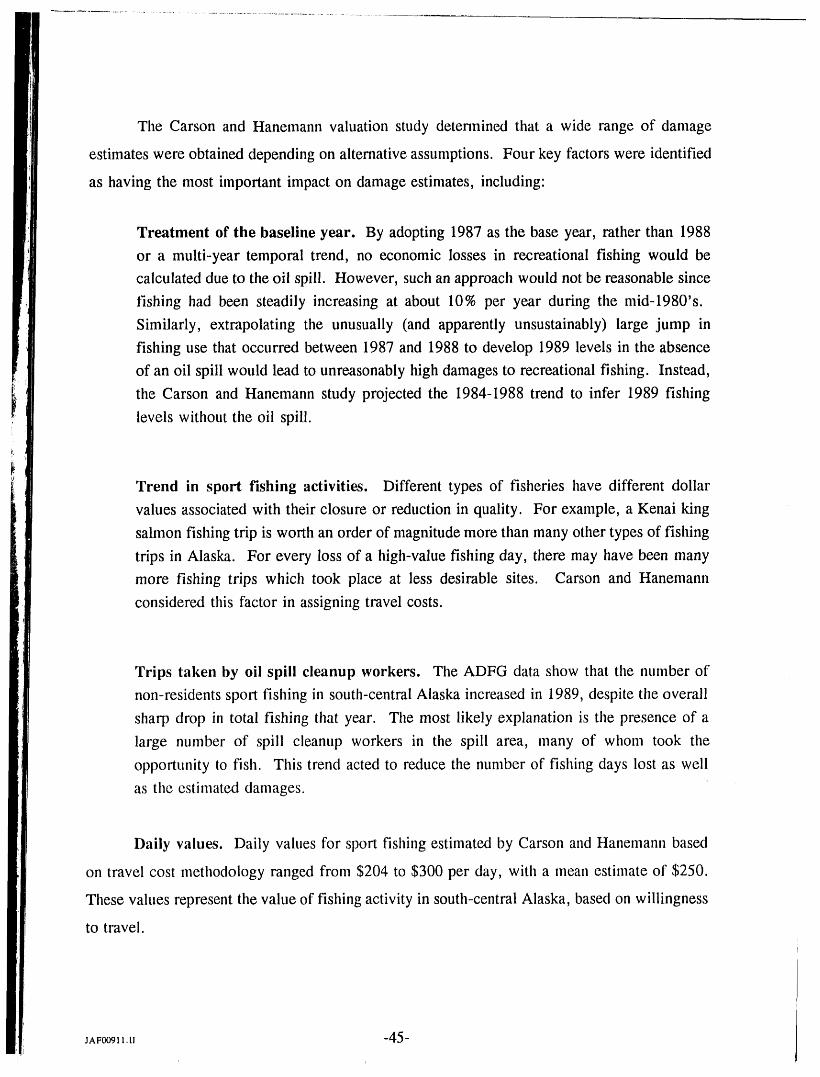
The Carson and Hanemann valuation study determined that a wide range of damage
estimates were obtained depending on alternative assumptions. Four key factors were identified
as having the most important impact on damage estimates, including:
Treatment of the baseline year. By adopting 1987 as the base year, rather than 1988
or a multi-year temporal trend, no economic losses in recreational fishing would be
calculated due to the oil spill. However, such an approach would not be reasonable since
fishing had been steadily increasing at about 10% per year during the mid-1980's.
Similarly, extrapolating the unusually (and apparently unsustainably) large jump in
fishing use that occurred between 1987 and 1988 to develop 1989 levels in the absence
of an oil spill would lead to unreasonably high damages to recreational fishing. Instead,
the Carson and Hanemann study projected the 1984-1988 trend to infer 1989 fishing
levels without the oil spill.
Trend in sport fishing activities. Different types of fisheries have different dollar
values associated with their closure or reduction in quality. For example, a Kenai king
salmon fishing trip is worth an order of magnitude more than many other types of fishing
trips in Alaska. For every loss of a high-value fishing day, there may have been many
more fishing trips which took place at less desirable sites. Carson and Hanemann
considered this factor in assigning travel costs.
Trips taken by oil spill cleanup workers. The ADFG data show that the number of
non-residents sport fishing in south-central Alaska increased in 1989, despite the overall
sharp drop in total fishing that year. The most likely explanation is the presence of a
large number of spill cleanup workers in the spill area, many of whom took the
opportunity to fish. This trend acted to reduce the number of fishing days lost as well
as the estimated damages.
Daily values. Daily values for sport fishing estimated by Carson and Hanemann based
on travel cost methodology ranged from $204 to $300 per day, with a mean estimate of $250.
These values represent the value of fishing activity in south-central Alaska, based on willingness
to travel.
JAF00911.U -45-I

'_" ...... ' "=" ; ......... --11 I- I"I-_l -IT-I-T II : Firfll ii r_ i _ _ -__ ----II]1il Ill II III " I--_ _1_F _l_--
350. , 294.598
u_ 300 _ ----'- 1,"0
2so _-iI
,. 150 = 104.739
-_ 100 73.037 _....---eE - -:3z 50
0 I ! I !
1984 1985 1986 1987 1988 1989
Year
--e-Anglers ---e- Trips -" Days Fished I
Exhibit 4-4:
Sport fishing effort for the Exxon Valdez oil spill area,1984- 1990 (Mills, 1992).
IAF00911 -46-

Carson and Hanemann developed three alternative estimates for damages to recreational
fishing due to the Exxon Valdez oil spill (Exhibit 4-5).
1) A low estimate was developed assuming 1988 as a base year, with no temporal
increase in fishing; ignoring whether households participated in the oil spill
cleanup; and valuing days lost due to the Exxon Valdez oil spill at a conservative
$204 per day, which ignores the large fraction of high-value halibut and silver
salmon fish days. This calculation yields a lower bound damage of $3.7 million.
2) A high estimate was developed assuming a simple trend regression using pre-1989
' data to quantify lost fishing days; and using a higher $300 per day rate to reflect
the loss of higher valued salmon and saltwater fisheries. This calculation
determined an upper bound damage to sport fishing of $50.5 million.
3) A central estimate of recreational fishing damages was determined using a
regression of pre-1989, but with half of fishing performed by cleanup households
and half by visitors from outside south-central Alaska; and using an intermediate
$250 per day lost value. This intermediate calculation produced a damageestimate of $31 million.
Exhibit 4-5:
Estimates of damages to recreational fishing due to the Exxon Valdez oil spill(Mills, 1992; Carson and Hanemann, 1992)
Reduction in Daily Travel Damages 1993 $Fishing Days Cost Value
ill,ll i i i,,o i illll ili i i i ii i i iilll
Lower Bound 17,923 $204 $3.7 million $4.1 million......
Central Case 124,185 $250 $31.0 million $34.6 million.............
Upper Bound 168,196 $300 $50.5 million $56.4 million......
Tourism
A very preliminary assessment of the impact of the Exxon Valdez oil spill on the Alaskan
tourism industry, dati_g to August 1990, was performed for the State of Alaska by the Juneau-
based consulting firm McDowell Group. This study showed that visitor spending during the
summer of 1989 decreased 8% in south-central Alaska and 35% in southwestern Alaska
JAF0091 l.ll -47-
, i i i ,i i i

(including the lightly visited Aleutian Islands) from 1986 levels, resulting in a loss of $19 million
in visitor spending. Visitor spending in other parts of the state did not increase enough to make
up for this regional decline. This study may have understated tnle losses in simply comparing
1989 to 1986 levels, rather than to a projected multi-year baseline. In addition, the study
reported only Summer visitor data; visitor losses during the Fall and Winter of 1989 were not
included, but are likely to have been small.
Other qualitative market research showed that the oil spill had left a lasting negative
impression on potential visitors. In addition, shortages of labor appeared in the tourism industry
due to temporary higher-paying cleanup jobs following the spill, which led to higher costs to
consumers and to the tourist industry. Nevertheless, normal visitor patterns resumed during
1990 following cleanup of the oil spill and no permanent damage to the tourism industry appears
to have occurred.
Wildlife
No comprehensive study is publicly available documenting the economic impacts of the
Exxon Valdez oil spill on non-commercially harvested wildlife. However, ARI has developed
a preliminary estimate of wildlife damages based on two separate studies of wildlife injuries,
which provide the major components for computing damages. In a study for the Alaska
Attorney General, a University of Washington biologist estimated unit replacement values for
birds and mammals affected by the Exxon Valdez oil spill (Brown, 1992). These unit values
were then multiplied by the estimate of wildlife killed cited in Carson et al., 1992, which was
assumed to be representative of the widely ranging estimates that have been made of wildlife
killed by the spill. This simple computation yielded an estimate of $53.9 million for total
wildlife damages (Exhibit 4-6). (In comparison, Exxon reported spending over $45 million for
rescue and rehabilitation of sea otters and birds (Harrison, 1991)).
The estimated unit values for wildlife were based on the costs of relocation, replacement,
and rehabilitation for some of the shorebirds, seabirds, and marine and terrestrial mammals that
suffered injury or were killed (Brown, 1992). Infonnation on animal costs came primarily from
JAF00911.I1 -48-

professional animal-locating firms that work for zoos and private individuals, primarily because
most of these animals are not the source of large direct-use values, such as hunting.
Because the Exxon Valdez spill was not subject to OPA 90, it is not likely that Exxon
would be responsible for replacing all the animals killed by the oil spill. However, this number
was estimated for the purposes of the present study to determine total costs under OPA, because
the new law specifically requires the replacement of damaged resources.
1) Sea otters. The largest numerical loss of marine mammals due to the E_on
Valdez spill occurred to the sea otter population. Market prices for sea otters
delivered to zoos range from $40,000 to $50,000, although in situ values would
likely be lower because capture and preparation services are not required.
However, the market for otters is very thin, since few permits for capture havebeen issued since the 1972 Marine Mammal Protection Act. A more relevant
price may be the cost of relocating otters, which range from $1,500 to 20,000 per
otter, depending on numbers relocated. Brown's best estimate of unit costs for
relocating sea otters was $11,500 ($12,800 in 1993 dollars). By comparison,
Exxon reported spending $90,000 per released otter rescued in Prince WilliamSound.
2) Seals are generally more abundant than sea otters, and can be replaced for an
estimated $700 each. However, the market for seals is also extremely thin andthis value is uncertain.
I 3) Eagles. A total of 200 to 500 eagles were estimated to have been killed or
injured during the oil spill. Exxon reported spending $1.5 million in 1989 to
rehabilitate 15 eagles, or $100,000 per eagle. Brown's best estimate of
replacement cost was $22,000 a piece.
4) Seabirds, shorebirds, and murres accounted tbr most of the animals killed in the
oil spill. Because of their strong homing instincts, birds cannot be relocated, but
must instead be bred. Unit costs were estimated to range from $274 for murres
to about $300 for most other seabirds and shorebirds.

It is difficult to critically assess tile validity of methods used by Brown for determining
unit values for animals affected by the Exxon Valdez oil spill. The largest source of error is that
the market for most of the animals affected by the oil spill is extremely thin; limited demand and
supply makes prices difficult to determine.
Exhibit 4-6:
ARI's estimate of wildlife damages due to Exxon Valdez oil spill(Based on Brown, 1992; Carson et al., 1992)
..............
Replacement Damage DamageAnimal Deaths Value Million Million
($1989) ($1993)
Mu rres 112,500 $274 $30.8 $34.4.... ill i i i i ill
Other birds 2 8,000 $300 $8.4 $9.4ii i
Bald eagles 100 $22,000 $2.2 $2.5....... i ii i i
Sea otters 580 $11,500 $6.7 $7.5..... , i ....
Seals 100 $700 $0.1 $0.1................ i
Total $48.2 $53.9................. _..... i .... .......
Non-Use l)amages
The final category of natural resources damages resulting from the Exxon Valdez oil spill
to be analyzed is the potential injury to non-use values. Non-use values, defined in Section 2
of this report, encompass option, existence, bequest and other values which do not involve active
user participation. Most economists recognize as valid, for example, that a person's option to
visit an environmentally unspoiled area may have monetary value. Both the DOI regulations
promulgated under CERCLA and the proposed NOAA regulations for OPA call for non-use
values to be determined in the case of large, destructive spills such as the Exxon Valdez. At
present, the only available methodology for measuring these values is contingent valuation (CV),
which attempts to create a hypothetical market for non-use natural resource services by providing
respondents with the opportunity to buy or sell the services in question.
JAF00911.tl -50-

The Attorney General of Alaska commissioned a contingent survey designed to measure
damages to potential non-use values resulting from the Exxon Valdez oil spill (Carson et al.,
1992). The developers of this study were researchers in CV and surveying methodology from
UC, San Diego and Berkeley, Clark University, University of Maryland, and Resources for the
Future. The survey was implemented by Westat, Inc., a survey research finn that was cited by
the study as one of the mc_._trespected in the country.
The developers of the (..'V survey sought to follow a conservative approach in framing
the survey. The willingness to pay (WTP) format was selected for the CV study, rather than
the less conservative willingness to accept (WTA) format, which is theoretically more correct
for this oil spill situation. Demographic and other questions were included to develop valuation
flmctions which could provide a check with theory and intuition.
The design of the CV survey began with development of the valuation scenario, based
i on information gained from six focus groups conducted in Washington state, Alaska, Maryland,t Virginia, Missouri, and Calitbrnia. The draft survey was flirther refined through testing in a
series of four pilot surveys in different parts of the country. Following finalization of the
surveys, a random sample of 1,423 households from throughout the U.S. was drawn.
Professional interviewers administered the face-to-face survey, which averaged 42 minutes in
length, achieving a reportedly very high response rate of 75 percent.
During the survey, respondents were provided considerable information on the
environmental impacts of the Exxon VaMez oil spill. Respondents were shown maps and
photographs of the spill site, and representational photographs of a range of wildlife impacted
by the spill (but no dead or injured animals), and of actual cleanup activities following the spill.
Numbers of dead animals were presented, along with total populations and estimated recovery
periods to allow comparison.
Following this lengthy introduction, which included collecting background and
demographic information about the respondent, the issue of valuation was raised. The central
question posed to respondents in the CV study was essentially: "How much would you be willing
to pay in higher federal income taxes to prevent another oil spill in Prince William Sound
JAF00911.H -51-

comparable to that caused by tile Exxon Valdez?" Respondents were told as a premise that if
no action is taken over the next 10 years, scientists anticipate that such a spill would ahnost
certainly reoccur.
Respondents were infonned that their contribution, along with a matching fee paid by oil
companies using the Valdez terminal, would pay for a realistic program that would prevent with
certainty the injuries which would be cause by such a spill. This program would involve the
escort of each tanker through Prince William Sound by two Coast Guard cutters, which would
not only help preclude further grounding incidents, but would also carry spill containment
equipment to ensure rapid response in the event of a spill. This program would continue for i0
years until the tanker fleet had convened to double-hull design. This plausible scenario was
designed to ensure that respondents would have confidence that their contribution would be
effective in achieving their intended goals.
A schedule of suggested per-household costs, selected based on the results of the pilot
surveys, was shown to each respondent, rather than soliciting an open-ended answer. Three
versions of these program cost answers were used, as shown in Exhibit 4-7 (versions A-15, A-
16, and A-17). The use of suggested tax categories tended to produce a tigl_ter, tnore robust
median, albeit at the risk of potential bias in affecting responses. For example, people tend to
select answers close to the center of a suggested range, rather than the extremes.
Exhibit 4-7:
Program cost by version and question for the Exxon Valdez CV survey.(Carson et al., 1992)
'.'-'._;, ...... _, _, , , '," , , - ,,,I,,, ..... ,............. !" ,, _ .... ,,, "'", ,'' ....... I ,,...i,...,
Version A-15 A-16 A-17
h,',, , - _'," ,,,_'!; = ,"_,__ _ ....... _ : j,,,,....... __ " ' hhl,'i;.... " ...... ' , _I ,,,,
A $10 $30 $5i i, ii i ..... i i i . ,ll
B $30 $60 $ I0i i= ...., i i ill i,iii , .
C $60 $120 $30i i i i ,
D .... $,!.20' $250 $60..... , ,,

Coniplementing these quantitative answers, the CV survey also elicited qualitative
responses from the survey, which provided several indications of tile magnitude of passive use
losses resulting from the Exxon Valdez oil spill. For example, over 90 percent of respondents
said that they were aware of the oil spill, and over half agreed with a description of the spill as
one of the largest environmental accidents caused by humans anywhere in the world.
Willingness-to-pay responses were analyz_ using four methods of statistical distribution,
including Weibuli, exponential, log-normal, and log-logistic (Exhibit 4-8). The median
househokl WTP tbr the spill prevention plan was chosen as the best indicator, because it was
found to vary over a much narrower range than mean WTP. The median estimates of all four
distributions are similar and their 95 percent confidence intervals overlap. All four estimates
of the median are consistent with respect to the $30-$60 interval. The Weibull distribution is
the most frequently used by statisticians for survival data and was chosen as the best single
indicator of WTP.
Exhibit 4-8:
Statlstieal distributions of WTP for Exxon Valdez oil spill,(Carson et al., 1992)
95% 95%Distribution Median Confidence Mean Confidence
Interval IntervalII I _m_l I " I II?1_11 17 I IIII I I i rl W[ I I/I I IISI I I I I I IIIII fl.... I I I" I IIIIII II I I IIIIJI] ! I I liil I/Jill ill i rt I .I_L. ]_ I I ___
Weibull 30.91 26.85- 35.59 94,47 83,45- 105.19..... I ill,ill ii,ii i, ii......... , ......
Exponential 46.29 43.07 - 49.75 66,78 62.73 - 70.83= -- ii,l.i, .......... i ii.lit .... i i i,ili i ,i,
Log-Normal 27.32 23.67- 31,52 220.4 113.3i - 327.55i _ ill ..........
Log-Logistic 28,74 24.91 - 33.16 Infin.• ,....... _ .... i ................. ............ , i ii i _ , i i,
The final step ot" tht_ CV study in quantifying the non-use natural resource damages
caused by the E,._'on Valdez oil spill was to determine the size of the population affected by the
spill. The study assumed that the entire U.S. population sutTered non-use damages from lhe
spill, based primarily on the similarity in survey response throughout all regions of the country.
Multiplying this by the number of U.S. households, adjusted for non-English speakers, yielded
a non-use damage estimate of $2.8 billion (Exhibit 4-9).
JAFO091 l,ll -53-
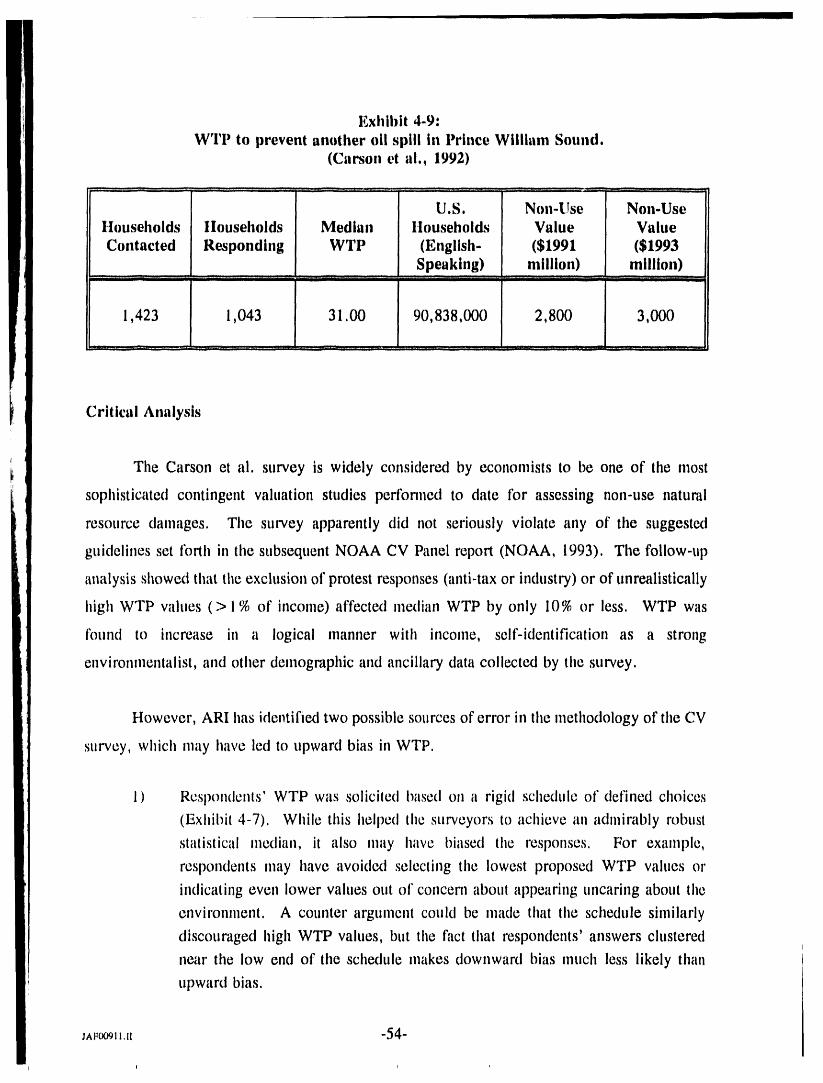
Exhibit 4-9:
WTP to prevent another oll spill in Prince William Sound.(Carson et al., 1992)
:::- , : :_= _,,., !!, -= . ::r::: .._ ::::-: ._:, : :::.: _'_,' :- ,L',"I"' n",,',,''' _':': ............... _'_ ' ,,' ' '_ ,r,I, _ ::_ _L ':'_''_ '_!'_ "_''::..... ,,' 'r-
U.S. Non-Use Non-Useltouseholds ltouseholds Median Households Value Value
Contacted Responding WTP (English- ($1991 ($1993Speaking) million) million)
!I[T_] _:-_ j.... _llilllllll _,!!,_!, ir: ,, i , " ii_llllll_lrl '_l'zzl__-IIIIilJ I u!_...... 7=: !,.._!,. ...... [!t :.,.. Jl IIIIIIIIII 1 [ ......... I
1,423 1,043 31.00 90,838,000 2,800 3,000
Critical Analysis
The Carson et al. survey is widely considered by economists to be one of the most
sophisticated contingent valuation studies perfonned to date for assessing non-use natural
resource damages. The survey apparently did not seriously violate any of the suggested
guidelines set tbrth in the subsequent NOAA CV Panel report (NOAA, 1993). The follow-up
analysis showed that the exclusion of protest responses (anti-tax or industry) or of unrealistically
high WTP values (>1% of income) affected median WTP by only 10% or less. WTP was
f(mnd to increase in a logical manner with income, self-identification as a strong
environmentalist, and other demographic and ancillary data collected by the survey.
However, ARI has identified two possible sources of error in the methodology of the CV
survey, which may have led to upward bias in WTP.
1) Respondents' WTP was solicited based on a rigid schedule of defined choices
(Exhibit 4-7). While this helped the surveyors to achieve an admirably robusl
statistical median, it also may have biased the responses. For example,
respondents may have avoided selecting the lowest proposed WTP values or
indicating even lower values out of concern about appearing uncaring about the
environment. A counter argument could be made that the schedule similarly
discouraged high WTP values, but the fact that respondents' answers clustered
near the low end of the scilexlule makes downward bias much less likely than
upward bias.
JAFO0911,11 -54-
i i i ,

2) No information was supplied regarding tile average number of people per
interviewed household. In calculating national WTP, the CV study made tile
implicit assumption that tile average size of tile interviewed household was
identical to national household size (about 2.7 persons per household). In
practice, households where one member is home during daytime hours to respond
to the survey are likely to be larger than average. Deviations from this national
avenlge would directly affect estimated non-use values.

4.2.2 S.S. Glacier Bay Oil Spill
lntrodtictlon
On July 2, 1987, an oil spill occurred in Cook Inlet, Alaska, when the 81,000-dwt S.S.
Glacier Bay hit an uncharted submerged rock (t_xhibit 4-10). The tanker was carrying 380,000
bbls of North Slope crude oil from the Alyeska Pipeline Service Co.'s Valdez terminal to the
Kenai Pipeline Co. 's facilities at Nikishka to offload oil. The total volume of oil spilled has not
been precisely determined; estimates range from 158,760 to 207,564 gallons, out of a total load
of nearly 16 million gallons, creating the largest oil spill in the state of Alaska prior to the Exxon
VaMez spill.
Natural resource damages due to tile Glacier Bay oil spill were considerable, primarily
because the spill coincided with the month-long peak of the prolific salmon run on the Kenai
River, The total ex-vessel value of commercially harvested Cook Inlet sahnon averages
approximately $95 million during this 4-week period, and the 1987 oil spill resulted in the loss
of about half of the catch in that year, as well as significant damage to vessels and nets.
Three years following the Glacier Bay oil spill, the Minerals Management Service
(MMS) commissioned an econotnic assessment by Northern Economics, a consulting finn based
in Anchorage (Burden et al., 1990). Because of the substantial time lapse, Northern Economics
reported difficulty in obtaining certain data, particularly after the subsequent Exxon Valdez oil
spill placed extraordinary demands on agency and industry staff. Additional studies on natural
resources damages were conducted by NOAA and the Alaska Attorney General's office, but are
not yet available because of ongoing litigation.
The MMS study of the Glacier Bay spill was select_ for analysis because it provides
particularly valuable intbnnation on the public costs of oil cleanup and on the distributional
effects of the oil spill on commercial fishing, recreation, subsistence, government entities, and
property values, Cleanup costs were determined in considerable detail based on accounts of
manpower, vessels, vehicles, equipment, materials, and expenditures involved in the spill
response, cleanup, and compensation.
_^F00911.H -56-
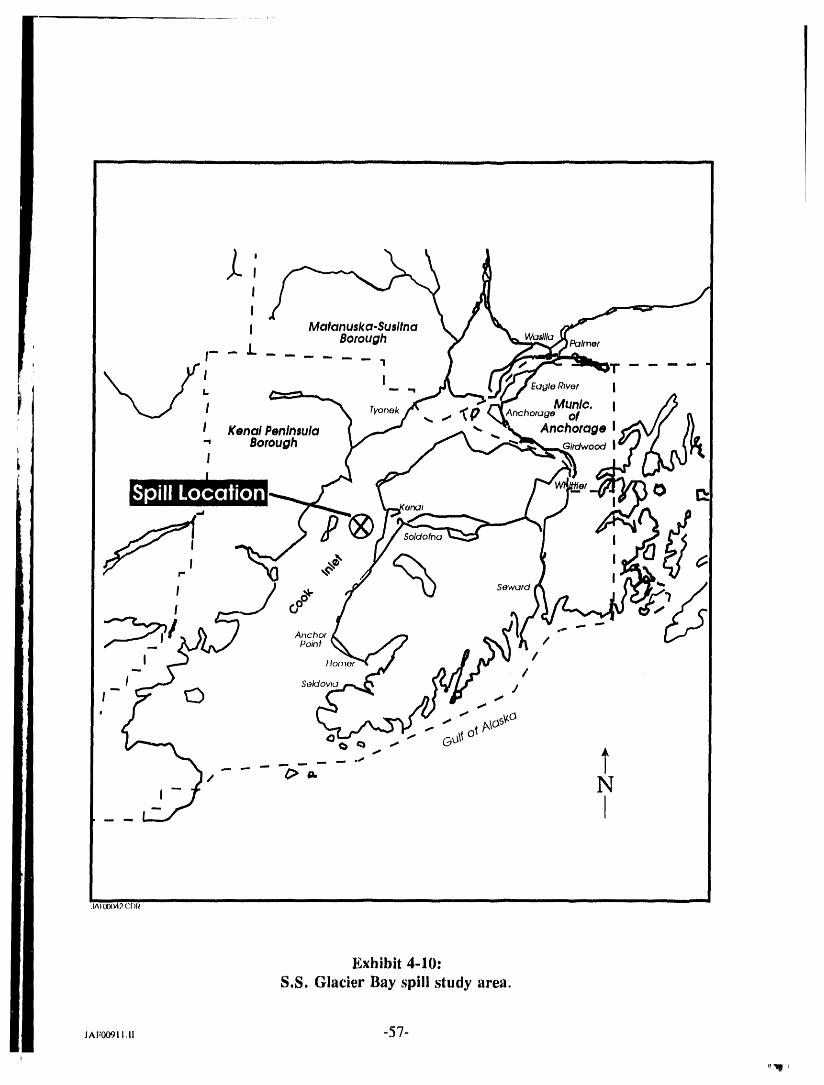
i iii1[ I iiii i [lln iii [ ill i ii illl iii ill i rill ................ I I
IIi
I Matanuska-SusltnaBorough ,liner
I--L__
_J I I Eoglo Rivor IMunlc. I
i Kenal Penlnsula Anchorage I-, Borough iI
t)
," @®" I
I _'% SowurdI
Anchor ""Point /
I Z/
Seldoviu ]
,. "" ._OsV.O
A
IIIII i i i i I ill i -- i i ill _ illll ill I illll i i ii,iAI O0_ll 2,C(ii_
Exhibit 4-10:S.S. Glacier Bay spill study area.
JA_00911.. -57-}

Another important aspect of the MMS study is that it quantifies oil spill cleanup and
damage costs in the Cook Inlet, which since 1957 has been an important offshore petroleum
producing province. Consequently, the study also may provide an indication of costs for
potential spills from offshore production platforms, for which recent (post-1979) data are not
available. However, Cook Inlet cleanup costs are likely to be higher than those in the Lower
48 states due to limited infrastructure and seasonal factors such as winter icing (though ice was
not a factor in the Glacier Bay spill).
As with all cost information in this report, costs from the MMS study were adjusted to
1993 dollars using the U.S. Department of Commerce's GNP implicit price deflator (Exhibit 1-
1). All costs developed in the MMS study were multiplied by 1.211 to yield costs corrected to
January 1, 1993 dollars. Cost information is summarized in Exhibit 4-11, disaggregated by
cleanup and damages categories.
Response and Cleanup Costs
The MMS study documented direct response and cleanup costs incurred by several
groups, including the owners of the S.S. Glacier Bay, the U.S. Coast Guard, the U.S.
Departments of Commerce and Interior, and state and local governmental agencies. Costs
recorded were those associated with the spill event and response actions taken; they do not
include costs associated with litigation. The period of costs covered for the cleanup was July
2, the day of the spill, to August 15, 1987, when cleanup activities ceased. Ongoing litigation
caused several participants to withhold information on cleanup costs; the MMS study estimated
these costs based on available data.
Based on analysis of a detailed chronology reconstructing the actions of industry and
government agencies during the response to the Glacier Bay oil spill, the MMS study determined
that significant inefficiencies resulted in unreasonably high cleanup costs (which is likely to
occur in any large, poorly planned cleanup effort). For example, the large number of parties
involved in the oil spill led to lack of initial coordination and ineffective response measures.
Efficient cleanup was also hampered by concerns over liability and the lack of a formal set of
agreements governing duties of industry participants and response resources. Significant time

was wasted determining that available equipment was not working and in arranging for
procurement of additional e,quipment. As commonly is the case, future cleanup costs for an oil
spill in the same region are expected to be considerable lower.
Cleanup costs for each affected firm or government agency are summarized in Exhibit
4-11 and discussed in detail in the following paragraphs.
S.S. Glacier Bay owners incurred direct costs of $615,661 in payment to subcontractors
for cleanup services due to the oil spill. Subcontractor costs included ship rental, purchase of
specialized cleanup equipment and chemicals, and labor. Total costs amounted to $745,565 in
adjusted 1993 dollars (Exhibit 4-11).
The U.S. Coast Guard, as the Federal On-Scene Coordinator (FOSC), incurred expenses
for response and cleanup activities during the spill. Although these amounts remain the subject
of litigation and the actual amount which will be paid is uncertain, the MMS study reported the
Coast Guard claimed total response and cleanup related costs of $1,722,860. The largest share
of these costs, $1,012,647 or 59% of total costs, was incurred to hire spill response
subcontractors. Coast Guard salaries, which amounted to only $46,363 or 2.7 % of total outlays
during the cleanup period, were included for the purpose of the present study, since time spent
on the oil spill is lost to other duties. Coast Guard total cleanup cost amounted to $2,086,384
in 1993 dollars (Exhibit 4-11).
U.S. Departments of Commerce and Interior have submitted claims of $399,000 for
costs incurred during the cleanup. These costs included NOAA's help in environmental
assessment and the establishment of a consistent monitoring program. Salary costs for full-tinle
personnel were not separately reported. Adjusted to 1993 dollars, these costs totaled $483,189
(Exhibit 4-11 ).
Alaska Department of Environmental Conservation was the primary state agency
providing direction on spill response. Activities included monitoring the spill, providing
technical assistance to the spiller and the Coast Guard during cleanup, documenting spill
impacts, approving the efficacy of cleanup operations, and inspecting commercially harvested
JAF00911.II -59-

salmon for possible oil contamination. Total cleanup-related costs amounted to $226,595, of
which salaries again was the largest single component (68% of total). Total agency cleanup
costs adjusted to 1993 dollars was $274,407 (Exhibit 4-11).
Alaska Department of Fish and Game assisted in assessing the size, extent, and impacts
of the spill to commercial and recreational fisheries in the area, and assessed impacts of the spill
on fish and game resources and habitats. These costs totaled $62,770 for the cleanup period.
The largest single cost component was for salaries, accounting for 46 % of total costs. The next
largest expense (37 %) went to conducting a special test fishery, to determine oil contamination
of fish and the need to adjust openings and closures for area fisheries. Total agency costs
adjusted to 1993 dollars was $76,014 (Exhibit 4-11).
Alaska Attorney General's Office was responsible for aggregating state costs associated
with the oil spill and pursuing litigation to recover those costs. Due to ongoing litigation, these
costs were not available for this study.
Alaska Department of Natural Resources was involved in beach monitoring of oil spill
impacts, but did not report any incurred costs.
Cleanup Contractors. In response to rapidly changing events surrounding the oil spill,
contractors reported receiving verbal directives above and beyond contracted tasks, which
sometimes were not reimbursed. For some contractors, non-reimbursed expenses ranged from
20 to 30 percent of total invoice amounts submitted. However, these additional costs were not
consideled in this analysis.
Damages
Direct use damages due to the Glacier Bay oil spill were determined based on interviews
with randomly selected target groups for each potentially injured industry. The commercial and
recreational fishing and fish processing industries were the only groups determined to have
suffered damages. However, these damages were quite large, because the oil spill coincided
JAF00911.1| -60-

- .
] i .... i ill i illi ..... I'l- "T I [liTll_ I ..... _" II II .... I| Jill[ ! ......... _ i i i_ i iIi i ilii I i i i ' i
Exhibit 4-11:
Cleanup costs and natural resource damages for the S.S. Glacier Bay oil spill (Burden et al., 1990)
Direct Cleanup Costs Direct Use Damages Non-Use Total*Damages*
Impacted Group 1987 $ 1993 $ 1993 S/gad 1987 $ 1993 $ 1993 S/gad 1993 $/gal 1993 $ 1993 S/gad
Government Sector
U.S. Coast Guard 1,722,860 2,086,384 11.39 ..... 2,086,384 11.39
Commerce/NOAA 399,000 483,189 2.64 .... 483,189 2.64
Alaska Dept. of 226,595 274,407 1.50 ..... 274,407 1.50Environ. Conser.
AK Dept. of Fish & 62,770 76,014 0.42 ..... 76,014 0.42Game
AK Attorney General ...... 11,197 13,560 0.07 13,560 0.07
TOTAL GOV'T 2,411,225 2,919,994 15.94 11,197 13,560 0.07 2,931,191 16.00SECTOR
Indust_
S.S. Glacier Bay 615,661 745,565 4.07 89,550 108,445 0.59 854,010 4.66
Drift Net Fisheries ...... 41,600,000 50,400,000 275.17 50,400,000 275.17Set Net Fisheries
...... 12,100,000 14,700,000 80.26 14,700,000 80.26
Fish Processing ..... 1,123,230 1,360,000 7.43 1,360,000 7.43
Sport Fishing .......
Subsistence Fishing ......
TOTAL INDUSTRY 615,661 745,565 4.07 54,912,780 66,568,445 363.44 5.46 68,314,075 372.97SECTOR
TOTAL (Average) 3,026,886 3,665,559 20.01 54,923,977 66,582,005 363.51 5.46 71,245,266 388.97
* ARI Estimate
JAF00911 -61-

with tile peak of the prolific sahnon run up the Kenai River. Recreational and subsistence
fisheries were not adversely affected by the spill, according to interviews conducted with
recreational fishing representatives and with village council presidents for the three subsistence
fisheries in Cook Inlet (Port Graham, English Bay, and Tyonek). Damages incurred by bird
watching and other non-extractive recreation was not investigated by the MMS study, nor were
existence and other non-use values. The following is a summary of damages by industry and
government agency caused by the Glacier Bay oil spill. These costs are summarized in Exhibit
4-11.
S.S. Glacier Bay owners reported costs totaling $22,650 to repair damage to the ship due
to the grounding which caused tile oil spill. Oil spilled during the incident was estimated to be
3,780 to 4,942 bbls, for an average estimate of 4,341 bbls. Assuming an average delivered
price of $15.41 per bbl at Nikiski term'_,,lal,cargo losses totaled $66,900. Therefore, losses due
to the oil spill totaled $89,550, or $108,445 adjusted to 1993 dollars (Exhibit 4-11). Additional
potential losses may have included the opportunity cost of use of the ship dtlring repairs, but this
factor was not considered in the MMS study.
Alaska Attorney General's Office estimated the value of fish tax revenue foregone due
to discard of contaminated fish, and fish not caught due to closures. These lost tax revenues
totaled $11,197, or $13,560 in 1993 dollars (Exhibit 4-11).
Drift net fishermen suffered one of the largest damages due to the Glacier Bay spill.
Based on interviews with 26 randomly selected fishermen, the MMS study determined that fish
losses, gear damage, and oiled vessels averaged $69,318 per fisherman. Total industry losses
were calculated to be about $41.6 million, which adjusted to 1993 dollars totals approximately
$50.4 million (Exhibit 4-11). Fish unit prices also dropped from $1.73 per pound just prior to
the spill to $1.40 during the oil spill period, but appeared to be due primarily to a record catch
(in spite of the spill) rather than reduced demand due to the oil spill.
Set net fishermen accounted for the second largest losses from the oil spill. Interviews
with 58 randomly selected fishermen determined that average damages for lost fish revenues,
JAF00911.H -62-

gear damage, and oiled vessels amounted to $33,050 per fisherman. Industry losses totaled
$12.1 million, or $14.7 million in adjusted 1993 dollars (Exhibit 4-11).
Fish processors estimated the total value of the 261,000 lbs of documented sahnon that
had to be discarded due to contamination to be $373,230. However, the actual loss reportedly
was higher due to additional labor required to find, isolate and discard contaminated sahnon,
particularly since oil moved unpredictably throughout the drift fishing areas. This additional
handling cost was estimated to be $0.20 to $0.30/1b, an additional cost of about $750,000, for
a total loss of approximately $1,123,000. Adjusted to 1993 dollars, losses totaled $1.36 million
(Exhibit 4-11).
Recreation and sport fishing were not adversely affected by the Glacier Bay oil spill.
Cook Inlet waters account for a large proportion (56%) of the total 1,212,704 angler days of
sport fishing days in Alaska. However, recreational fishing in Cook Inlet takes place primarily
in fresh water tributaries and is much more dispersed throughout the year; consequently damage
due to the oil spill was limited or did not occur. With few exceptions, sport fishing groups
indicated they did not experience negative impacts from the oil spill, because they operate
primarily in fresh waters upstream of the oil spill location. Recreational fishing may even have
inadvertently benefitted from the spill, in that restriction of fishing downstream led to increased
runs in the Kenai River (Burden et al., 1990, p. 79).
Subsistence and personal use fisheries, including three Cook Inlet villages, were
contacted but reported no impacts due to the oil spill. All three villages are located outside the
geographic range of the spill.
Critical Analysis
The MMS study of the economic impacts of the Glacier Bay oil spill provided valuable
information on cleanup and direct use natural resource damages in a commercially sensitive area.
Particularly instructive is the detail describing cleanup costs by group, as well as the potential
for excess costs due to poor coordination among agencies and the private sector.
However, there were several weaknesses with the MMS report which should be
considered:
1) The MMS study did not value non-use damages, such as existence and option
values, which are expressly permitted under CERCLA and OPA 90. The city of
Anchorage, with a metropolitan area population of approximately 200,000, lies
less than 100 miles from the spill. The population whose non-use values were
adversely affected by the Glacier Bay spill may be expected to include the
Anchorage metropolitan area. Modest WTP values for preventing a comparable
oil spill, perhaps $2 per person (an order of magnitude less than that determined
for the Exxon Valdez spill) would be expected to generate on the order of $2
million in non-use damages relating to this spill. If the affected population
included sports fishermen and recreational users in the Lower 48, WTP values
could be significantly higher.
2) Due to litigation, information was incomplete or not available for a number of
potentially affected groups. These included government agencies such as the Fish
and Wildlife Service and the Alaska Attorney General's office. A more serious
potential flaw in the study methodology is that damage estimates for commercial
fishing were based on interviews with a small subset of fisherman, yielding cost
estimates that varied ten-fold. A more accurate estimate of lost fishing damages
might be obtained by valuing the reduced catch.
JAF0091 l.ll -64-

4.2.3 Amazon Venture (Savannah River, Georgia and South Carolina)
Between December 4 and 8, 1986, the tanker Amazon Venture spilled approximately
500,000 gals of No. 6 fi_el oil into the Savannah River between Georgia and South Carolina
(Michel, 1989). The spill affected natural resources managed by the states of South Carolina
and Georgia, and three federal agencies: the U.S. Fish and Wildlife Service (FWS), the National
Park Service, and the National Oceanic and Atlnospheric Administration (NOAA). These
agencies joined together as co-trustees in conducting cleanup and natural resource damage
assessment. At the time of the spill, only the CERCLA Type B damage assessment rule was
in effect, however, the trustees opted to conduct a more limited pre-assessment damage study
because of the anticipated expense of a fidl Type B assessment.
The Amazon Venture oil spill caused heavy to medium contamination of about 650 acres
of marshland along the banks of the Savannah River, while an additional 690 acres were lightly
oiled (Exhibit 4-12). The trustees pursued two methods for estimating natural resource damages
to wetlands caused by the spill. First, for the wetlands that were moderately damaged and
expected to recover, the lost direct-use services provided by the injured resources were
quantified. Second, for the wetlands that were essentially permanently damaged, the
replacement cost of constructing a substitute marsh was estimated. Additional damages were
quantified for injuries to fish and wildlife, using physical and toxicological models to estimate
the numbers of organisms affected. Finally, assessment costs and other costs due to the oil spill
were quantified. Potential non-use damages due to the spill were not addressed.
A damage assessment published for the Amazon Venture spill documented a total of
$2.37 million in cleanup costs and natural resource damages due to the spill (Michel, 1989).
In comparison, the owners of the Amazon Venture settled out of court for a reported $1.2
million. This settlement, amounting to only $3.00 per gallon in 1993 dollars, was the lowest
unit damage value for any ot' the oil spills assessed in this report.
JAF0091t.tt -65-i

. SavannahRiver
NationalWildlife
Refuge SOUTHCAROLINA
St.AugustlneCreek
GEORGIA
Distributionof Shoreline Oilas of 17 December 1986 I
I AtlanticI Heavy/Medium I Ocean
_ Light I 2...... u ___ _1_ c J __ I I __ II iii ii ii
,JAFfJ(1064,CDR
Exhibit 4-12:Map of impact area from the Ama_m Venture oil spill.
Response and Cleanup Costs
A total of 150,000 gallons out of the estimated 500,000 gallons of oil spilled was
eventually recovered during cleanup operations. No published estimates of response and cleanup
costs are available. However, based on the duration of the cleanup operation (one month), and
JAr_00911., -66-
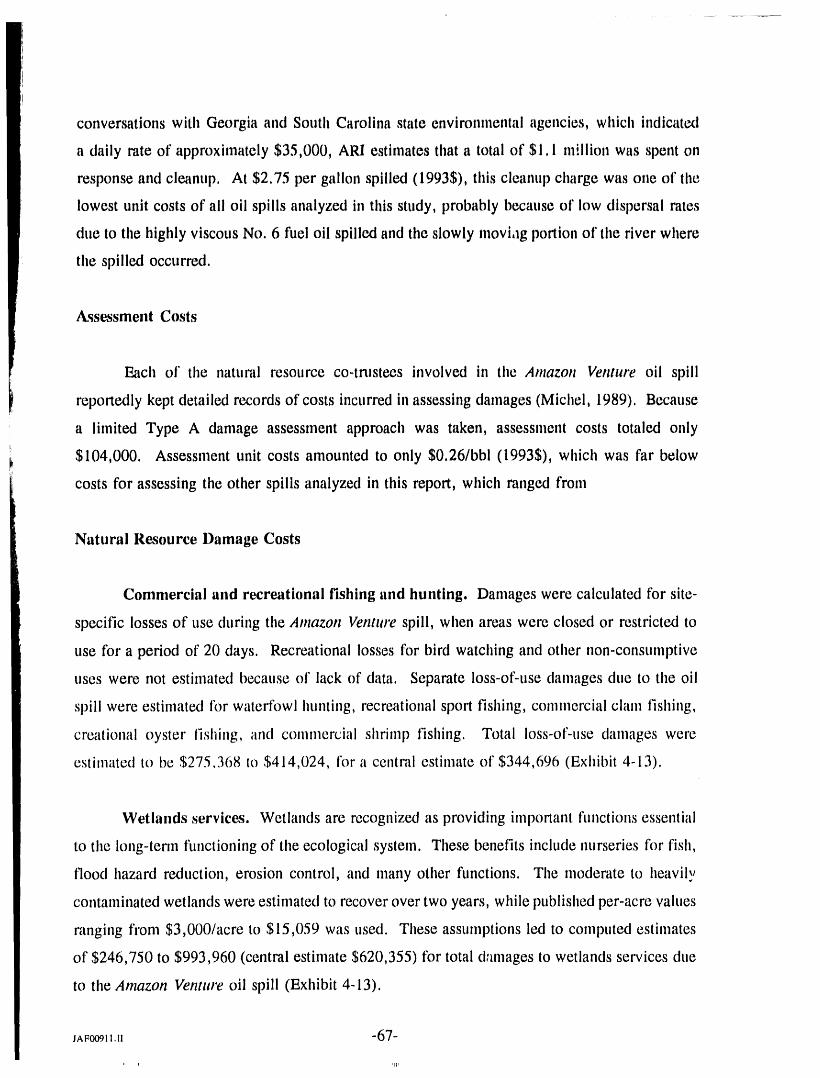
conversations with Georgia and South Carolina state environmental agencies, which indicat_
a daily rate of approximately $35,000, ARI estimates that a total of $1.1 million was spent on
response and cleanup. At $2,75 per gallon spilled (19935), this cleanup charge was one of tl_e
lowest unit costs of all oil spills analyzed in this study, probably because of low dispersal rates
due to the highly viscous No. 6 fuel oil spilled and the slowly moviag portion of the river where
the spilled occurred.
Assessment Costs
E,ach of the natural resource co-trustees involved in the Amazon Venture oil spill
reportedly kept detailed records of costs incurred in assessing damages (Michel, 1989). Because
a limited Type A damage assessment approach was taken, assessment costs totaled only
$104,000. Assessment unit costs amounted to only $0.26/bbl (19935), which was far below
costs for assessing the other spills analyzed in this report, which ranged from
Natural Re,source Damage Costs
Commercial and recreational fishing and hunting. Damages were calculated for site-
specific losses of use during the Amazon Ventltre spill, when areas were closed or restricted to
use tbr a period of 20 days. Recreational losses for bird watching and other non-consumptive
uses were not estimated because of lack of data. Separate loss-of-use damages due to the oil
spill were estinlated tbr watertbwl hunting, recreational sport fishing, commercial clam fishing,
creational oyster fishing, and commercial shrimp fishing. Total loss-of-use damages were
estimated to be $275.368 to $414,024, for a central estimate of $344,696 (Exhibit 4-13).
Wetlands services. Wetlands are recognized as providing important fllnctions essential
to the long-tenn flmctioning of the ecological system. These benefits include nurseries for fish,
flood hazard reduction, erosion control, and many other fimctions. The moderate to heavily
contaminated wetlands were estimated to recover over two years, while published per-acre values
ranging from $3,000/acre to $15,059 was used. These assumptions led to computed estimates
of $246,750 to $993,960 (central estimate $620,355) for total damages to wetlands services due
to the Amazon Venture oil spill (Exhibit 4-13).
JAFOOgI1,H -67-
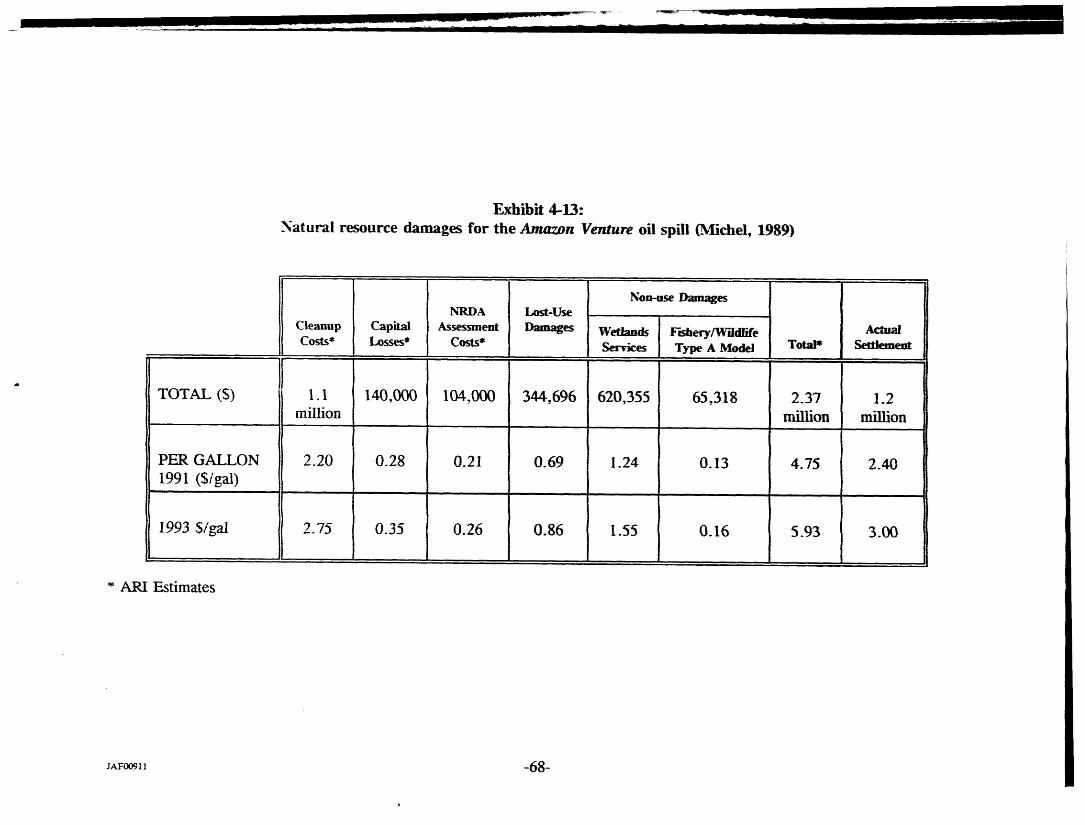
Exhibit 4-13:
Natural resource damages for the Amazon Venture oil spill (_ichel, 1989)
!Non-useDamages
E
NRDA Lost-Use
Cleanup Capital Asses..qnent Dmnages Wetlands F'tshery/Wildlife ActualCosts* Losses* Costs* Services Type A Model T°tm'_ Settlement
m
TOTAL (S) 1.1 140,000 104,000 344,696 620,355 65,318 2.37 1.2million _on million
PER GALLON 2.20 0.28 0.21 0.69 1.24 0.13 4.75 2.401991 ($/gal)
1993 $/ga/ 2.75 0.35 0.26 0.86 1.55 0.16 5.93 3.00
* ARI Estimates

Fishery and wildlife losses, Damages to tish and wildlife were assessed using a Dnd'_
Type A natural resource damage assessment computer model, developed by the U.S. Fish and
Wildlife Service (described in Section 3.3 of this report). This model measured impacts due to
the lethal effects of oil on larvae and adult fish and waterfowl, and the indirect and long-tenn
effects involving eventual losses throughout the food chain. Although the CERCLA Type A
damage assessment role was not yet effective on tile date of the spill, a draft computer model
was used to carry out simplified assessments of damages to coastal and marine natural resources.
Total losses quantified by tile model amounted to $65,318 (Exhibit 4-13).
Critical Analysis
The unit cleanup and damage costs documented in the Amazon Venture oil spill study are
far less than those detennined for the more-publicized Exxon Valdez and Glacier Bay tanker
spills. Total assessed costs amounted to just $5.93 per gallon spilled (19935), compared with
$390 and $556 per gallon for the Glacier Bay and Exxon Valdez spills, respectively. However,
the actual settlement for the Atnazon Venture spill amounted to $3.00 per gallon, which indicates
that natural resource damage estimates were considered credible by all involved parties.
Damages may have been limited by the winter weather conditions, which probably mitigated
wildlife injuries, and the highly viscous nature of No. 6 fuel oil, which slowed the spread of the
oil and kept cleanup costs relatively low.
The Michel (1989) study did not consider non-use natural resource damages, such as
existence and option value. However, there is no reason to believe that the Amazon Vetltttre
spill was ot' national importance comparable to the /_r.xon VaMez spill, and it is likely that
contingent valuation would have detennined only limited non-use damages.
JA.Oog!I.U -69-
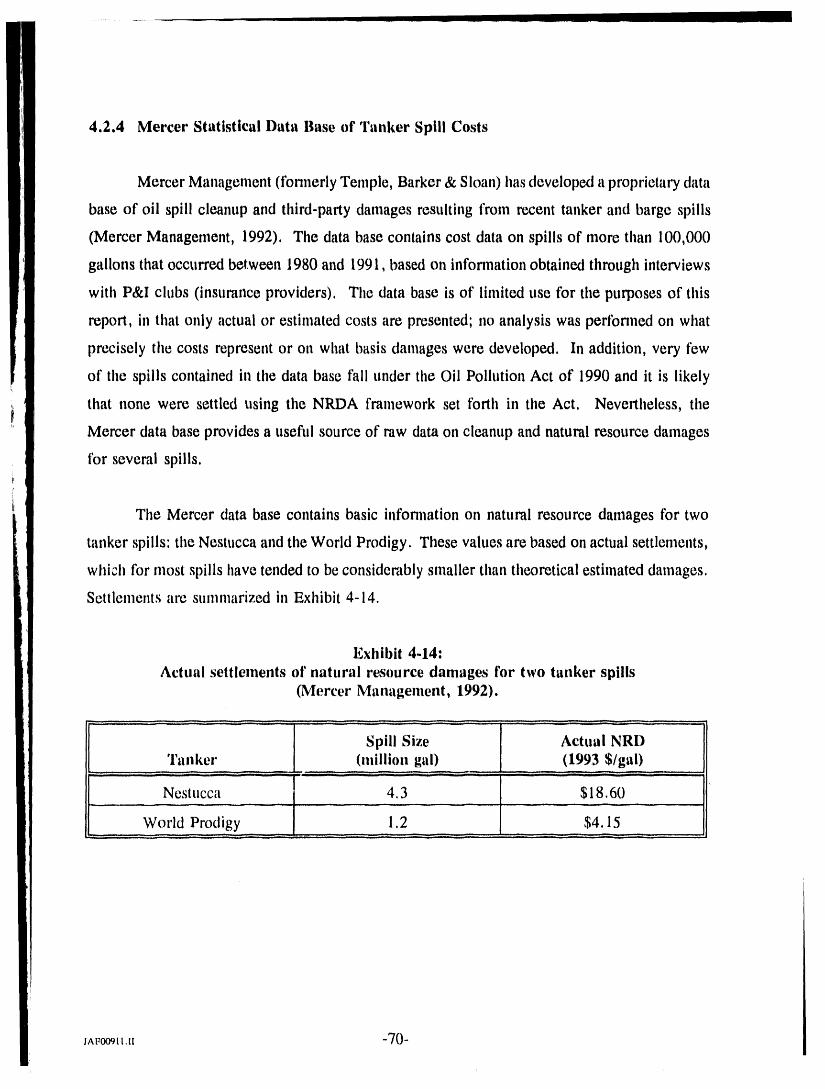
4.2.4 Mercer Statistical Data Base of Tanker Spill Costs
Mercer Management (tbnnerly Temple, Barker & Sloan) has developed a proprietary data
base of oil spill cleanup and third-party damages resulting from recent tanker and barge spills
(Mercer Management, 1992). The data base contains cost data on spills of more than 100,000
gallons that occurred between 1980 and 1991, based on information obtained through interviews
with P&I clubs (insurance providers). The data base is of limited use for the purposes of this
report, in that only actual or estimated costs are presented; no analysis was performed on what
precisely tile costs represent or on what basis damages were developed. In addition, very few
of the spills contained in the data base fall under the Oil Pollution Act of 1990 and it is likely
that none were settled using the NRDA framework set forth in the Act. Nevertheless, the
Mercer data base provides a usefid source of raw data on cleanup and natural resource damages
for several spills.
The Mercer data base contains basic information on natural resource damages for two
tanker spills: the Nestucca and the World Prodigy. These values are based on actual settlements,
which for most spills have tended to be considerably smaller than theoretical estimated damages.
Settlements are summarized in Exhibit 4-14.
Exhibit 4.14:Actual settlements of natural resource damages for two tanker spills
(Mercer Management, 1992).
_ __ :: _:: L:_,! _ z: Iii r_ [2'El " !,[[i, iii , , =__ [llllllli!i illJlll :_. :__: j ,,
4.3 Pipeline Spills
Overview
In contrast to the nu_:_rous publicly available natural resource damage assesstnents
conducted on tanker oil spills, much less information is available on oil spill costs from pipelines
and refineries. The only publicly available natural resource damage assessment for tllis category
is a study conducted on Exxon's Arthur Kill pipeline spill in New Jersey. This study was
augmented with useful but less detailed cost information from Texaco's Anacortes refinery spill
in Washington state, which led to the first settlement with natural resource trustees under the Oil
Pollution Act of 1990. The Exxon and Texaco spills provide a comparison of two widely
different environmental and regulatory settings: Whereas the Arthur Kill oil spill occurred in
an intensively industrialized setting, with only minor recreational damages, the Texaco spill
occurred in an environmentaUy more sensitive setting. Despite the paucity of data, these two
case studies, which occurred in different settings and were prosecuted under different laws,
provide an indication of the range in cleanup costs and natural resource damages due to pipeline
and refinery spills under OPA 90.
Response and cleanup costs for the two pipeline/refinery case studies were relatively
high, at approximately $30 to $40 per gallon in 1993 dollars, but still considerably lower than
for most tanker spills. Damages to natural resources were more varied, ranging from $4 to $40
per gallon, with non-use values accounting for the largest and least well-defined component.
These significant cost,; reflect the often sensitive environmental location of pipelines and
refineries. Oil spills in biologically rich, shallow coastal waters or wethmds, where dilution and
physical degradation due to wave action is slow, tend to cause considerable damage to natural
resources. In contrast, production platform and most tanker oil spills frequently occur in the
open marine environment, where rapid dissipation of the spill due to dilution and wave action
usually leads to less serious damages.
Civil penalties relating to pipeline and refinery spills, based on discussi(-ns with
participants of the Texaco and Exxon oil spill damage assessments, tend to require substantial
costs for pollution monitoring and prevention equipment and training. For example, prevention

costs following Exxon's Arthur Kill pipeline oil spill amounted to $44.09 per gallon, while
Texaco was required to invest $3.81 per gallon in prevention equipment and training due to its
Anacortes refinery spill. Prevention costs vary significantly depending on existing equipment
and procedures. Specific prevention costs tend to be much smaller or non-existent in damage
settlements for tanker or barge oil spills due to their mobility; efforts at tanker spill prevention
have generally focused on redesign, for example, the expensive double hull design and spill
contingency plans required under OPA.
4.3.1 Exxon Arthur Kill Oil Spill
Introduction
On January 1, 1990, just seven months prior to the passage of OPA 90, an Exxon USA
pipeline ruptured in the New York metropolitan area, spilling a total of 567,000 gallons of No.
2 fuel oil into a waterway between Staten Island and New Jersey. Although this spill was not
covered by OPA 90, the previously enacted Clean Water Act (CWA) and Comprehensive
Eovironmental Response, Compensation, and Liability Act of 1980 (CERCLA) permitted
government agencies to claim damages for injuries to natural resources.
The estuary damaged by the Exxon pipeline spill was the Arthur Kill, a 15-mile-long by
1,000-ft-wide waterway which connects the Atlantic Ocean and New York Harbor (Exhibit 4-
15). The Arthur Kill is used as an access channel by local recreational boaters and fisherman,
and contains a variety of wetland habitats supporting an abundance of herons and other wildlife.
The Arthur Kill is an intensively developed industrial waterway. Directly adjacent to the
largest landfill in the United States, the Arthur Kill is lined with a variety of chemical
manufacturing and oil refining installations. Its water quality has been reported to be the poorest
in the New York Harbor area. Consequently, the Arthur Kill spill provides an instructive case
study of natural resource danlages in an industrialized area, where pipeline and refinery spills
are most likely to occur. The subsequent case study on Texaco's Washington State oil spill
JAF0091_iIl -72-
II

JAF00911 -73-

(Section 4.3.2) provides a contrasting example of a refinery spill in an environmentally sensitive
a rea.
As with all cost information in this report, costs related to the Arthur Kill oil spill were
adjusted to 1993 levels using the U.S. Department of Commerce's GNP price inflator (Exhibit
1-1). Exxon's 1991 settlement costs were multiplied by 1.07 to yield costs corrected to January
1, 1993 levels.
Cleanup and Prevention Costs
Exxon settled damages for the Arthur Kill spill in 1991 outside of court, paying a total
of $58 million in settlement costs. As part of this agreement, the NRDA performed by the
government which provided the basis for the settlement is not publicly available. Only a NRDA
performed on behalf of Exxon by Research Triangle Institute is available. The major
components of the settlement, shown in Exhibit 4-16, included $18 million for direct cleanup
costs, $25 million for the installation of advance monitoring and operational integrity assurance
equipment and procedures to avoid fi_ttlre spills in the area, and $15 million for restoration and
remediation of natural resource damages (Exxon USA, 1991).
No additional infornlation is available on Exxon's actual clean up and prevention costs.
As to be expected with a fixed refinery/pipeline site, substantial prevention costs were included
in the settlement, far more than levied in tanker spills cases. However, considerable infonnation
is available on natural resource damages resulting from the Arthur Kill oil spill, as discussed in
the following section.
Natural Resource Damages
Exxon funded a separate NRDA of the Arthur Kill oil spill perfonned by Research
Triangle Institute (RTI), which indicated a much lower extent of damages than that provided
under its settlement with the government (Desvousges et al., 1993). RTI's economic study used
JAFO091 l.II -74-
$62 millionTotal Settlement Costs
$26.7:millionSpill Preventionand Monitoring
EquipmentX
Exhibit 4-16:
Components of Exxon's settlement for the Arthur Kill oil spill,adjusted to 1993 dollars
(Source Exxon Co., 1991). *Not including damage assessment costs.
as a starting point the technical assessment of damage area and severity of the oil spill, which
had been jointly conducted by Exxon and the local government authorities (B-Laing Associates,
1990). Two primary categories of potential damages were investigated: direct use (such as
water-based recreation); and indirect non-use (such as existence values). RTI's study was
limited in budget; to conserve resources it utilized the following "transfer" methodology, which
relies on the monetary value for similar resource services from more extensive NRDA studies:
JAF00911.II -75-

Step 1 Obtain technical assessment of the change in water quality resulting from
the oil spill.
Step 2 Collect basic socio-economic, recreation, and water quality informationfor the Arthur Kill area.
Step 3 Estimate per-household WTP to avoid losing access to the resource
services, based on analogy to the previous NRDA study.
Step 4 Estimate the number of households who use the damaged resource to
compute the aggregate value of damages.
RTI's damage estimates, broken down into use and non-use categories, are summarized
in Exhibit 4-17. Damages to specific resources are discussed below.
Recreation (Use) Damages
Because the Arthur Kill is highly industrialized, no fishing or other commercial activity
and very limited recreational activity takes place in the Kill itself. However, the Arthur Kill is
an important access waterway to reach surrounding areas where recreational opportunities are
more abundant. In addition, bird watching and picnicking take place along the shore of Arthur
Kill, although these activities were very restricted during the winter timing of the spill. Boating
and bird watching were the only direct uses of Arthur Kill which RTI identified as potentially
impacted by the Exxon oil spill.
Boating. RTI contacted the operators of four marinas within one mile of Arthur Kill
which provide services for local boaters. RTI asked these operators, who were presumed to be
familiar with their customers' recreational activities in the area, for activity data for peak and
off-peak periods. Boating activity during the winter period of the spill was at a minimum level.
The possibility that non-local boaters may have wished to use the Arthur Kill for access
was not investigated. The following were the primary assumptions for RTI's computation of
boating recreation damages:
JAF00911.II -76-
I
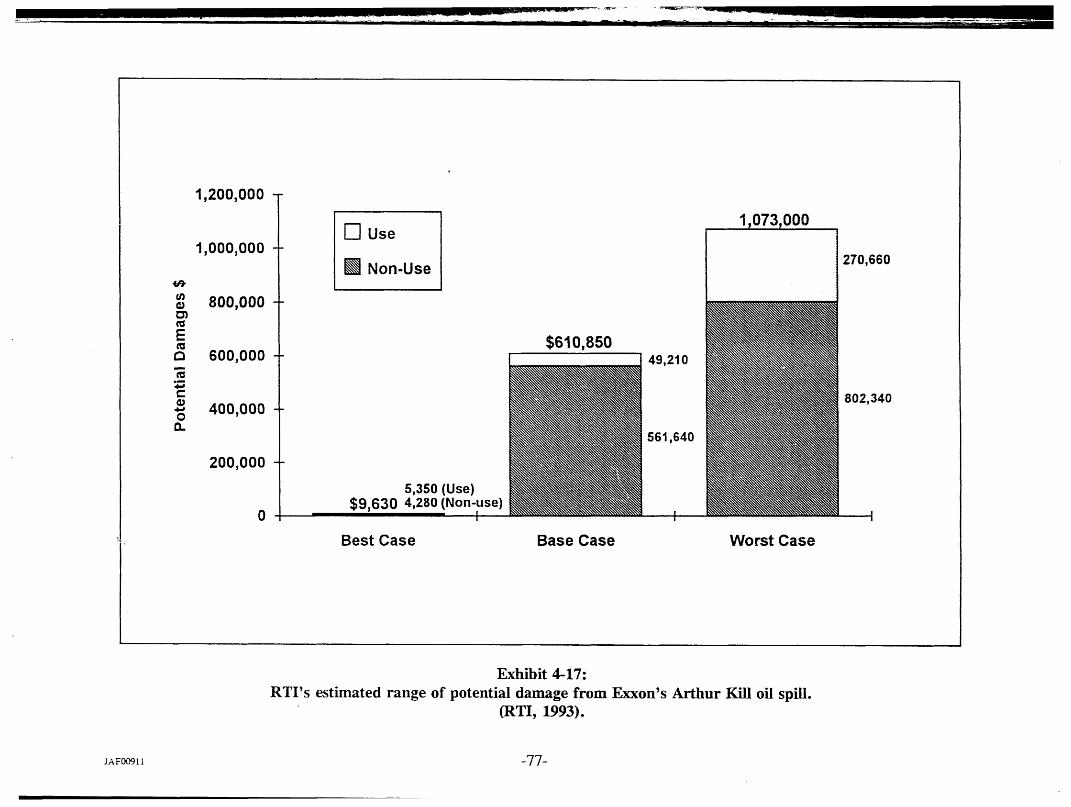
" " - • -- - " li_rl- i _ ......... _ ___ 111 I I 1I ...... ,,_ , ffi i t t t Jt t " _ _T
1,200,000
1,073,000
1,000,000 1"-]Use i
Non-Use 270,660
_= _ $610,850c_ 600,000 -.__
802,340400,000 -O
O.
561,640
200,0OO -
5,350(Use) /0 $9,630 4,280(Non-use)! ! !
Best Case Base Case Worst Case
Exhibit 4-17:
RTI's estimated range of potential damage from Exxon's Arthur Kill oil spill.(RTI, 1993).
JAFO0911 -77-

1) Only local boaters were affected; boaters wishing to pass through Arthur Kill
were not analyzed.
2) Lost boating time due to the oil spill was fixed at 70 days, the actual period theKill was shut down.
3) Boaters numbered 6 to 23 per day, based on number of local slips, and occupancy
and participation rates.
4) Boating values ranged from $10 to $70 per day based on a published study on
Colorado (presumably the only comparable study available to RTI).
Based on these assumptions, total boating-related damages were computed to range from $3,955
to $221,480, with a base case estimate of $31,640 (Exhibit 4-17).
Bird Watching. RTI contacted officials at six area parks for data on bird watching
during the period affected by the oil spill. The Arthur Kill area is surrounded by salt marshes
and estuaries that serve as nurseries for more than 145 different species of fish and birds.
Harbor herons and other large waterfowl are relatively abundant and the primary focus of bird
watching activity in the area. RTI made the following assumptions to quantify damages to bird
watching caused by the oil spill:
1) Only bird watchers visiting the six local parks were included.
2) A total of 1 to 10 bird watchers (out of 14 total users) were affected by the spill.
3) Lost bird watching time was fixed at 70 days.
4) Bird watching valuation ranged from $15 to $45 per day, with no independent
analysis based on travel costs or analogous published reference cited.
Using these assumptions, RTI estimated bird watching damages caused by the Exxon oil
spill to range from $1,425 to $32,063, with a base case estimate of $14,250. Total direct use
damages, which RTI assumed to involve only bird watching and boating, are summarized in
Exhibit 4-17. These damages range from $5,000 to $1,003,000, with a mean estimate of
$46,000.
JAF00911,H -78-
I

Non-Use Damages
In addition to the direct use damages discussed above, RTI estimated tile injury to non-
use services which the oil spill caused. Wetlands generally provide a wide array of non-use
services, including flood hazard reduction, support of ecosystems through purification of waste,
providing habitats for non-recreational birds and fish, etc. To assess the impacts of the Exxon
oil spill oil the Arthur Kill wetland, RTI relied on a Wetland Evaluation Technique (WET) study
performed by the New York City Audobon Society on the affected area. WET is a standardized
procedure which analyzes eleven components of wetland services, including groundwater
discharge/recharge, wildlife diversity/abundance, recreation, and heritage. RTI then reviewed
five published valuations of U.S. wetlands to obtain per-acre value estimates, selecting a study
on a Louisiana wetland as the best analog. The following were the primary assumptions used
in RTI's estimate of non-use resource damages:
1) The area of wetlands affected by the oil spill was estimated to range from 10 to
25 acres, based on Exxon's oil impact maps which show the extent of oiling.
This is a small portion of the total 127 acres affected, most of which werechannel areas rather than wetlands.
2) The length of time that the wetlands were impaired was estimated by RTI to
range from 2 to 10 years; the analysis made the conservative assumption that
gradual healing of the wetland would not occur, but did not cite independent
analysis.
3) The non-use value of the wetland was estimated to range from $198 to $3,000 per
acre, based on analogy to the Louisiana WET study. These values assume that
the Artht|r Kill was already seriously impaired in performing most non-use
services, as indicated in a New York City Audobon Society report.
J3ased on these assumptions, RTI estimated total non-use damages to range from $3,960
to $750,000, with a base case estimate of $525,000 (Exhibit 4-17). RTI's estimates of non-use
damages accounted for the bulk of total damages, ranging from 44% to 92% of total estimated
injury.
JAF00911.11 -79-
Critical Analysis
Exxon's settlement of $15 million for natural resources damages related to the Arthur Kill
oil spill is to 15 to 1,500 times larger than the injury range quantified by RTI. However, there
are several reasons why RTI's assessment may understate total natural resources damages caused
by this oil spill. Two of the primary concerns with the methodology followed in RTI assessment
include:
1) The use of a Louisiana wetland analog for Arthur Kill may have accurately captured non-
use services such as flood control and hydrologic stabilization. However, existence,
option, and other difficult to quantify non-use values were also likely to have been
damaged by the oil spill, but were not specifically addressed by the study. OPA 90 calls
for the inclusion of these potential injuries to non-use resources in the case of major oil
spills.
Despite the serious pollution of the Arthur Kill waterway, its location in the densely
populated New York metropolitan area and the presence of sizeable heron and other large
waterbird populations suggests that the oil spill caus_ a significant level of non-use
damage. Currently, these non-use values are measurable only using the controversial
contingent valuation method. Considering the potentially affected local population of
several million people, and per-household damages averaging several tens of dollars in
other CV studies of oil spills, these damages could easily have accounted for the balanceof Exxon's settlement.
2) The costs of assessing natural resource damages were not included in tile RTI study.
These costs, reimbursement of which is provided under OPA 90, have been estimated
to range from about $1 per gallon to a staggering $25 per gallon for the Exxon Valdez
spill (Luthi et al., 1993), depending on coordination of priwlte and public efforts and on
the complexity of the damaged resource. Based on these unit assessment costs, this
implies an additional cost of $567,000 to $14 million for assessment of the Arthur Kill
oil spill, with the most likely estimate in the lower range.
Based on the reported actual costs incurred by Exxon for clean-up and prevention, the
RTI estimates of use and non-use natural resource damages, and ARI's estimate of other non-use
damages, total damages from the Exxon Arthur Kill oil spill are summarized in Exhibit 4-18.

Total costs are estimated to range from $49 million, |br a relatively modest $5.5 million in non-
use damages and $0.6 million assesstnent costs, up to $66 million or more using a more realistic
$20.5 million non-use damage estimate and $2.8 million in assessment costs. Per-gallon
estimates of total costs include $31.75/gal for clean-up, $44.09/gal for prevention, $1 to $5/gal
for NRDA assessment costs, and $9.75 to $36.20/gal for non-use damages.
J^F00911li -81-

Exhibit 4-18:
Estimates of natural resource damages related to Exxon Arthur Kill oil spill (Desvouges et al., 1993).
Dir_t Use Damages Non-useNRDA Damages
Cleanup Capital Prevention AssessmentCosts Losses* Costs Costs* Boating Bird Wetlands Existence Total*
Watching Services Option, Etc.*
TOTAL 18.0 0.2 25.0 0.6 - 2.8 0.032 0.014 0.525 5 - 20 49 - 66
(Millions $).....
PER GALLON 31.75 0.36 44.09 1 - 5 0.06 0.03 0.93 8.82 - 35.27 87,04 - 117.5I
1_i ($/gal)
1993 $/gal 33.97 0.38 47.17 1 - 5 0.06 0.03 0.99 9.44- 37,73 93.04- 125.35
* ARI Estimates
JAF00911 -82-
I
4.3.2 Texaco Anacortes Refinery Spill
Introduction
In the first judicial settlement for oil spill damages under OPA 90, Texaco agreed to
resolve cleanup and damage costs related to a February 1991 oil spill at its refinery near
Anacortes, Washington (Oil and Gas Journal, 1993). In February 1993, Texaco agreed to
consent decrees in U.S. District Court at Seattle to settle suits brought by the Department of
Justice, the EPA, and the Coast Guard. Although the still-proposed NOAA regulations
governing oil spill damage assessment were not in place at the time of the spill or settlement,
damage estimates by the state and NOAA reportedly followed these proposed procedures.
Therefore, this case study provides an early indication of damage assessments under OPA 90.
The Texaco spill occurred when a refinery pump failed, causing about 210,000 gallons
(5,000 bbls) of crude oil to be spilled into Fidalgo Bay, which is part of Puget Sound. The
Justice Department's case also referred to, but did not quantify, subsequent smaller releases of
oil from the Anacortes refinery.
Cleanup costs and damages related to tile Texaco Anacortes refinery spill, although not
publicly released in complete detail, provide an additional case study complementing the Exxon
Arthur Kill spill for the costs resulting from pipeline and refinery spills. In general, unit costs
were considerably higher for the Texaco spill, due to its environmentally more sensitive location
and, very likely, to the application of the new OPA 90 provisions.
Cleanup Costs
Under the U.S. District Court decree, Texaco was assessed cleanup costs of about $8.125
million. In addition, the company is required to invest an additional $800,000 in state-of-the-art
spill prevention equipment.

Natural Resource Damages
The methodology and detailed results from the assessment of natm,'al resource damages
are not available for the Texaco Anacortes spill. Texaco was assessed $480,000 in civil
penalties to the U.S. as natural resource trustee for unspecified damages. In addition, Texaco
paid a $20,000 penalty to Washington, under the state's newly promulgated Marine Oil Spill
Compensation Schedule (see Section 3). Cleanup, prevention, and damage costs relating to the
Texaco spill are summarized below, in 1993 dollars.
Exhibit 4-19:
Major components of Texaco's settlement from the 1991 Anacortes, Washingtonrelinery spill (Oil and Gas Journal, 1993). i
I
Natural
Cleanup Costs Prevention Resource Total CostsCosts Damages
-inl ii rl i:ili -i ...... ": i i i I: ilili i ii i:l .L 'r,l""" t i! '"' i:li sL ::::: : i i lil I' ' i '1 i '1 ' i'l iliHtl _ I 't"l '!: .llii,/llJ_ i::
Total $8,125,000 $800,000 $500,000 $9,425,000(million)
Per Gallon $38.69 $3.81 $2.38 $44.88
(per gal)

4.4 Offshore Platform Spills
4.4.1 Union/Texaco Platform (Santa Barbara, California)
011 January 28, 1969, a blowout occurred at Union Oil Company's Platform A in the
Santa Barbara Channel, California during the drilling of a routine oil development well. Union's
Plattbnn A had been drilling in federal waters (Lease 402) about 5.5 miles offshore of Santa
Barbara, when crude oil enlpted from the sea floor around the wellhead (Exhibit 4-20). During
the following three weeks, the well released an estimated 21,000 gallons (500 bbls) per day,
creating a 25-mi _ slick of some 441,000 gallons of crude oil.
iThe Santa Barbara oil spill, while comparable in size to hundreds of other tanker spills
that have occurred in the U.S. over the past several decades (see. Appendix 1), proved to be a
significant tunling point in heightening awareness of the environmental effects of oil spills.
Cleanup and Prevention Costs
From the outset of the Santa Barbara oil spill, it was apparent that Union Oil was
unprepared to handle a spill that large. Because the company's production personnel were busy
trying to plug the well, needed personnel were brought in from other divisions within the
company, particularly the refining division. Neither these personnel nor the contractors hired
to assist in clean-up operations had been properly trained in oil spill prevention and containment.
Cleanup operations began with the application of 10,000 gallons of dispersant to break tip the
slick before it reached the coastline. Inflatable plastic booms were also employed, but were"
relatively ineffective because of heavy seas and breaches in the booms. Wooden booms were
then constructed for containment, but they broke apart in heavy seas.
The Santa Barbara blowout posed a unique containment problem. Oil was not only
gushing from the wellbore, but from natural fractures connecting the. oil reservoir with the
surface as well. Natural oil seeps are common within the Santa Barbara area (most notably Coal
JAFOOgil.tl -85-
, $

m ' ":'" ............. --1]- -_ _" .... _"_ ........................ IIIlNIll] "_ - Ill......... ,,
/
,' Contamination/
/ Pt. Arguello Light,--. Moderate
"., Heavyck
_ _- _ -_ __apitanPt. Conception -- -"_._ Santa Barbara
Santa Barbara Channel
',Port Hueneme
"-, Pt. Mugu
San Miguel . _,._ . -"-,-- _"-.," __----- Anacapa Pt. Dume '"lslond ' ._-J Santa Cruz_-, -" Island__ Island
Santa RosaIsland
JA F0[]043.CDR
Exhibit 4-20:
Area contaminated with oil from Union Oil Co. Platform A by March 30, 1969.(Source: U.S. Coast Guard)
Oil Point), created as oil migrates up through fractures in the rock. Some of the natural seeps
in the area reportedly produce oil at nearly twice the estimated 500 barrels per day rate of the
Union Oil blowout (Gaines, 1969). An innovative system of underwater hoods or tents was
installed on the ocean floor to collect the seeping oil and carried via flexible tubing to storage
tanks on the platform. This underwater collection system covered approximately 40,000 square
feet of the ocean floor.
Total cleanup costs for the Santa Barbara spill were estimated to be $5 million ($18.1
million in 1993 dollars; Gaines, 1969).
Capital Losses
The major capital loss as a result of the Santa Barbara spill was the value of the spilled
oil. Based on Union Oil's estimate of 10,000 barrels of spilled oil, and contemporary oil prices
of $3.50/barrel, the value of the lost oil was $35,000 in 1969, or $127,000 in 1993 dollars.
Resource Damages
Prior to the Santa Barbara spill, there were no federal statutes in effect for assessing
resource damages from oil spills. At the time, the Federal Water Polhltion Control
Administration (FWPCA) was the only agency empowered to deal with oil spills, but assessment
of natural resource damages was not within its charter. It is likely that non-use damages
resulting from the Santa Barbara oil spill would have been substantial, had a damage assessment
been performed under present day CERCLA and OPA 90 regulations.
The media coverage of the damage caused by the Santa Barbara spill was extensive and
the pictures of oiled birds and tar on the beaches were familiar to most everyone at the time.
Given the widespread public awareness of the spill, and the actual amount of oil spill and natural
resource damages, it is plausible that non-use damages would have been perhaps one-third of
those assessed for the Exxon Valdez spill. In the Valdez assessment, it was detem_ined that each
household would be willing to pay $31.00; therefore, the Santa Barbara household WTP may
arguably be in the range of $10. Based on 90,000,000 U.S. households, the Santa Barbara oil

spill may have caused a total of $900 million in non-use damages. On a per-gallon basis, this
would make Santa Barbara the most costly spill for non-use damages, at some $2,143.00/gallon.
Critical Analysis
The cleanup costs of the Santa Barbara oil spill were relatively high, $43.16/gallon
(19935), based on the size and location of the spill. The bulk of the cleanup costs at Santa
Barbara were spent on high-impact methods such as steam cleaning, hydroblasting, bulldozing,
and scraping to clean beaches, rocky areas, and harbors and marinas. Subsequent research into
oil spill cleanup methods has demonstrated that these aggressive, high-impact techniques can
actually exacerbate oil spill damages and further degrade the environment.
Cleanup at Santa Barbara was also made more difficult by local oceanographic and
geographic factors. The waters in the Santa Barbara Channel are relatively cold, which tends
to retard the natural degradation of oil by bacteria. Furthermore, the Santa Barbara area
presents a diverse set of environments, including islands, coastal wetlands, rocky beaches, sandy
beaches, salt marshes, tidal flats and harbors.

4.4.2 Ixtoc Platform (Gulf of Mexico)
The IXTOC 1 well suffered a blowout on June 3, 1979, resulting in the largest
documented oil spill into the marine environment to date. Over the nine-month period which
lasted until March 23, 1980, when the well was finally plugged, the IXTOC 1 well released an
estimated 125 to 2i0 million galloi:s (3 to 5 million barrels) of crude oil into the Gulf of
Mexico. It is estimated that one-half of the oil released was burned and one-half spilled into the
Gulf. Of the 60 to 105 million gallons which escaped into the sea, approximately 1 million to
3 million gallons impacted the south coast of Texas.
The IXTOC 1 well was drilled by Petroleos Mexicanos (PEMEX), the Mexican state-
owned oil company, 50 miles off of the Yucatan Peninsula in the Bay of Campeche, about 500
miles souti_ of Texas (Exhibit 4-21). Fortunately, because of extensive previous oceanographic
research of the currents in the Gulf of Mexico, it was possible to accurately predict the path of
the drifting oil slick. Computer simulations predicted that the slick would move northward, well
off the nearest Mexican shores, with the heaviest concentrations of oil expected to wash ashore
along the Texas coast.
Despite being the largest oil spill in history, natural resource damages caused by the
IXTOC 1 spill were surprisingly small. This relatively light damage was due largely to a
combination of favorable oceanographic conditions, which kept the bulk of the oil from washing
ashore, and to subtropical climatic conditions which promoted the rapid natural degradation of
the oil.
Cleanup and Prevention Costs
Immediately following the blowout, several oil well control specialists were brought in,
but were unable to bring the well under control. The only method considered to be effective to
stem the blowout was to drill two relief wells, the IXTOC IA and IXTOC 1B, but it would
require several months before they could be drilled and put into operation. In the interim, more
than 4.5 million barrels of fluids and gels were injected into the well along with over 100,000,
3-inch diameter steel and lead balls. By the time the last of the cement plugs were rammed into

UnitedStatesMexico
Western Gulf of Mexico
Caba Rojo
I Pe_,insulaVera Cruz IXTOC 1 Blowout SiteI
i
JAFO0044.CDR
Exhibit 4-21Location of the Ixtoc I blowout site in the western Gulf of Mexico.
tile IXTOC I through the two relief wells, PEMEX had spent an estimated $82 million on
capping lhe well and $50 million on cleanup and containment.
Because the majority of the spill was predicted to come ashore on U.S. coastal areas, the
U.S. Coast Guard was activated on June 9, under authority of the National Oil and Hazardous
Waste Materials Contingency Plan (NCP). The Coast Guard estimated its cleanup operations
cost $75,000 per day, for a total cost of $8 million to $10 million. At the state level, Texas
spent just over $330,000 on cleanup operations.

Capital Losses
The semi-submersible platform which had drilled the IXTOC 1 well ignited soon after
the blowout and was scuttled, for a capital loss of $21 million. In addition, the value of the
estimated 3 to 5 million barrels of spilled oil was approximately $87 million (Waldichuk, 1980).
Therefore, capital losses due to the IXTOC 1 oil spill amounted to about $108 million ($199.4
million in 19935).
Economic Impact Study
Tile U.S. Bureau of Land Management funded a damage assessment study performed by
an E1 Paso, Texas based consulting finn (Restrepo et al., 1982). The report analyzed both the
direct and indirect ecoxaomic impacts of the spill on tourism, recreation, and commercial
fisheries in Texas coastal counties. Due to contract specifications and budget limitations, a non-
survey "output" approach was employed.
Under the survey, the economic impact of the oil spill was assumed to be limited to (1)
the current direct economic impacts on tourism, recreation, and commercial fisheries; and, (2)
the current indirect or "induced by" economic effects of the supportive or related economic
activities located in the study region. Direct economic impacts were measured by the
development of a density gradient model for each of the economic sectors studied as classified
by the Standard Industrial Classification (SIC). The composition of each industry is:
Recreation' recreation services, other retail trade.
Tourism: Eating and drinking establishments, automobile services, lodging.
Commercial fishing: Finfish, shellfish, miscellaneous fish.
Using this method, a density gradient of 100 percent indicates that the economic
establishments suffered a total loss of business activity, whereas a relative density gradient of
0 percent indicates no loss. The relative density gradient models were constructed through
qualitative assessments of direct economic impacts via on-site interviews and resulting
quantitative impact assessments.
JAF00911.11 -91-

Indirect economic effects were assessed using an input-output model based on a
transactions table, which is a system of accounts of inter-industry transactions. A direct
requirements table is also calculated from information contained within the producing sector's
purchases. Economic impacts are then measured by change in regional sales to final demand,
presented on a third table, the total requirements table.
Tourism. Gross receipts data for SIC-coded tourist establishments were obtained from the
Texas Comptroller's office and the Department of Highways and Public Transportation. In
addition, interview data were collected from 38 businesses and tourist agencies. Total estimated
direct losses to the tourism industry in Texas from the Ixtoc I spill were estimated to range from
$3.9 million to $4.4 million. The South Padre Island area accounted for an estimated 50 percent
of total estimated direct tourism losses. Indirect tourism losses were estimated to be about one-
fourth of direct losses, for an additional loss of $950,000 to $1.1 million.
Recreation. Data relative to sales in SIC-coded recreation-related categories were secured from
the Texas Comptroller's office and used to generate a trend line for each recreation sector.
Owners of recreation establishments were interviewed to obtain information on the extent of
losses; these interviews were used to adjust the estimated percentage of lost income, since nearly
all of the losses were incurred in Gttlf-front communities. Lost sales repolls were discounted
based on a ratio of general retail sales at the county level and the Gulf-front commtmities.
Calculated losses, in tenus of gross receipts, indicate a total direct economic loss to the
recreation industry of $3.1 million. Indirect losses were estimated to be approximately one-third
the value of direct losses, for an additional $855,000.
Commercial Fishing. The Gull' of Mexico is a rich source of many varieties of fish,
representing one of the largest commercial industries in this region of the U.S. Total dockside
value of shell and finfish landed in Texas in 1978 was $125.5 million dollars (Woods and
Hannah, 1981). Consequently, the Ixtoc I blowout created concern within the commercial
fishing industry about potential fishing losses.
Data were obtained on landing, etTort, and value for the commercial fishing industry
from the National Marine Fisheries Service and the Texas Parks and Wildlife Department.
JA_0091tIl -92-

Additional data were obtained through survey interviews of fishemlen, dealer, biologists, marine
advisory agents, and local businesses. These data indicated that the comme,rcial fishing industry
of Texas did not suffer measurable direct or indirect economic effects as :l result of the IXTOC
1 spill.
Critical Analysis
The Restrepo and Associates study was performed prior to the enactment of CERCLA
and OPA statutes and therefore does not quantify non-use damages to coastal areas. It is likely
that non-use damages would have been limited, particularly considering the size of the spill,
given that only subtle changes in the bird a_:d infaunal populations were detected (less than 10
percent of wading and shore birds observed in affected coastal areas were oiled) and there was
no apparent damage to estuarine areas (Woods and Hannah, 1981). ARI estimates that had the
spill been assessed under OPA 90 regulations, non-use damages would have been 10 to 20
percent of the value placed on the Valdez assessment, or $280 to $560 million.
Reported actual costs for capping the well, clean-up and containment, and direct and
indirect damages from the IXTOC 1 blowout are summarized in Exhibit 4-22. Total estimated
costs for clean-up and containment range from $140 million to $142 million, while direct use
damages were assessed at between $8.8 million and 9.5 million. Per gallon estimates of
dmmges include $3.23/gal to $3.28/gal for clean-up, $0.11/gal to $0.13/gal lbr direct use
damages, and $2.49/gal for capital losses, including the drilling platform and the value of the
lost oil.
The magnitude of the IXTOC 1 blowout focused attention to offshore drilling operations
and the likelihood of another major blowout occurring. A study performed in wake of the Ixtoc
I incident indicated that the risks of blowouts on offshore platforms were very low (Waldichuk,
1980). The study demonstrated that out of 19,000 production wells in operation in the OCS
during 1973, fewer than 0.25 percent blew out during their lifetimes. Furthem_ore, gas wells
accounted for 87% of OCS blowouts, with less than 13 percent of blowouts involving oil wells.
JA_00911.11 -93-
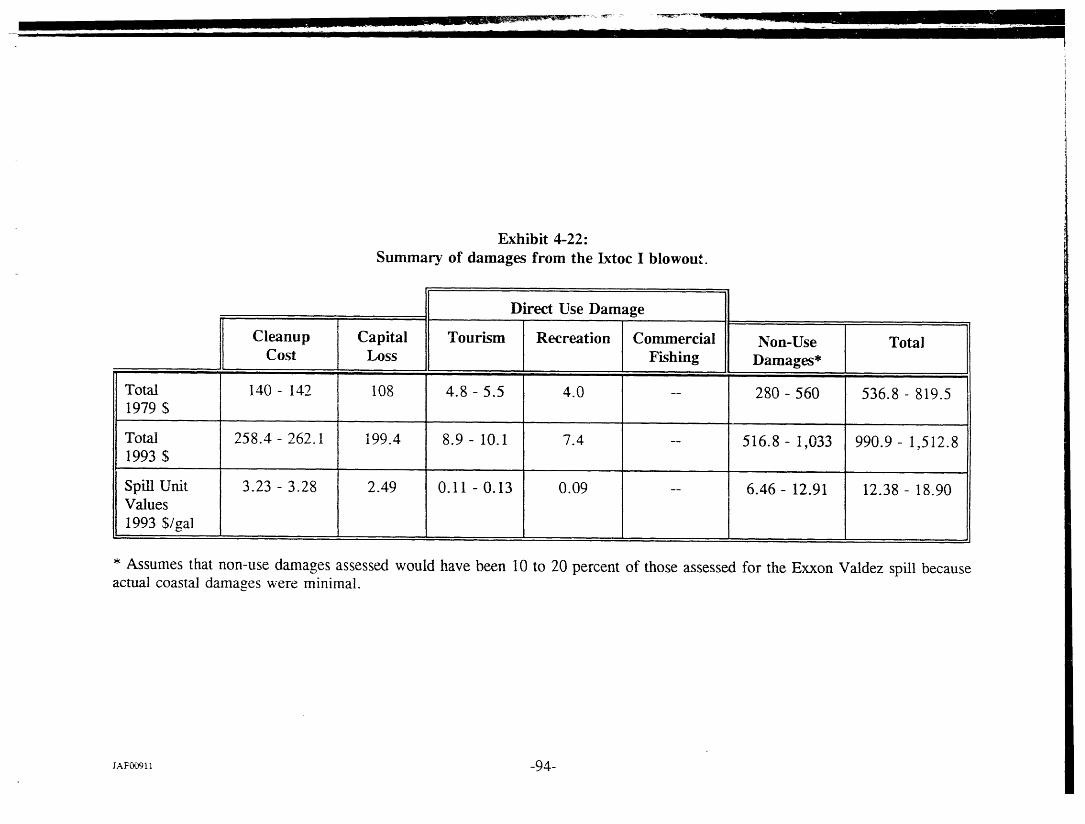
Exhibit 4-22:
Summary of damages from the Ixtoc I blowout.
Direct Use Damage.......
Cleanup Capital Tourism Recreation Commercial Non-Use TotalCost Loss Fishing Damages*
ii llll ii i i "ll i
Total 140 - 142 108 4.8- 5.5 4.0 -- 280- 560 536.8 - 819.51979 $
.,
Total 258.4- 262.1 199.4 8.9- 10.1 7.4 -- 516.8- 1,033 990.9- 1,512.81993 $
......
Spill Unit 3.23 - 3.28 2.49 0.11 -0.13 0.09 -- 6.46- 12.91 12.38- 18.90Values
1993 $/gal::,,
* Assumes that non-use damages assessed would have been 10 to 20 percent of those assessed for the Exxon Valdez spill becauseactual coastal damages were minimal.
JAF_11 -94-

5. Conclusions
This analysis of oil spill damage assessment methodology, regulations, and published case_.
studies of oil spill costs has generated five primary conclusions, summarized as follows:
1) Analysis of natural resource damage assessment methodology indicates that the methods
suggested for use in OPA 90 and the proposed NOAA regulations generally are
theoretically robust and widely accepted by the economic research community, indicating
that these regulation are likely to be promulgated largely as proposed. However, the
implementation of contingent valuation surveys remains highly controversial. The most
important sources of potential error in CV studies is the definition of the affected
population, the use of schedules to guide valuation responses, embedding, "warm glow"
effects, and a number of other aspects concenfing implementation.
2) Tanker spills have the highest range in total spill unit cost values. Tanker spill costs
ranged from a low average of about $5 per gallon spilled for the Amazon Venture and
the four Mercer tanker settlements, to a high of about $569 per gallo_ for the Exxon
VaMez spill (Exhibit 5-1 and Exhibit 5-2). Large variations were observed in all cost
categories, particularly cleanup costs, and direct use and non-use natural resource
damages. For the two large and well documented Alaskan tanker spills, cleanup costs
varied from $18.58 to $257.00 per gallon, direct use damages varied from $5.16 to $363
per gallon, and non-use damages varied from an estimated $5.46 to $283.99 per gallon.
This extreme variation occurred despite the l'act that the E_on Valdez and the S.S.
Glacier Bay occurred in comparably sensitive environmental locations and were both
prosecuted under the CERCLA regulatory framework.
3) Pipeline and refinery spills tend to cause lower and more uniform natural resource
damages than do tanker spills. Cleanup costs for the two case studies were of moderate
size and similar at $33.97 and $38.69 per gallon, reflecting the wetland environments
that these installations tend to affect. Direct use damages were relatively minor, due to
the typically industrialized setting of these facilities. Non-use damages due to
JA_00911.U -95-
ql

pipeline/refinery spills have not been rigorously analyzed but, bas_ on their
industrialized location, may be much less than for tankers.
4) Offshore facilities spills have been rare in recent years due to improved operational
safety, but the scarce dat/i available indicate that spill unit values can vary widely, similar
to those for tanker spills. Cleanup costs varied ten-fold for the two spills examined,
Ixtoc and Santa Barbara. Direct use damages in the typically open marine environment
of OCS platforms are anticipated to be lower than for pipeline/refinery facilities or for
tanker spills in sensitive coastal areas. Non-use values, such as option and existence
values, are the major unknown factors in quantifying the economic impacts of offshore
facilities spills. A major oil spill in coastal California could generate non-use spill cost
unit values comparable to those measured for the Exxon Valdez. Spill unit values for
platforms are estimated to range from $12 to $143 per gallon (or conceivably an order
of magnitude higher), with non-use values measured using contingent valuation the major
unknown.
5) In addition to spill unit cost values of economic damages from oil spills, it is also
necessary to consider spill risk in designing effective oil ':pill research and
development. Coast Guard records indicate that tanker spills occur most frequently,
with pipeline/refinery spills less frequent, and offshore facility spills quite rare. Analysis
of the spill impact data indicates that R&D focused on tanker spills would be the most
cost-effective in reducing spill costs and impacts. Pipeline/refinery research would be
the next most important oil supply component to be targeted for oil spill R&D, because
spill unit values for these facilities are moderately high at $45 to $125 per gallon and
because these accidents are next most frequent following tanker spills. Offshore facilities
have the potential to generate large non-use damages, but are infrequent; thus oft\shore
facilities are not strongly recommended for oil spill R&D.
To gauge the overall impacts of oil spills on the economy, it is instructive to estimate the
total dollar losses which have occurred during the past two decades. Physical data concerning
tanker oil spills in U.S. waters are maintained by the U.S. Coast Guard; Appendix 1 lists all
JAF00911.11 -96-

major (> 100,000) spills that took place during the period 1973 through 1990. During this
period, tankers accounted for the overwhehning proportion of oil spills. Exhibit 5-3 summarizes
the volume of oil spilled annually in major incidents during this period, amounting to a
cumulative total of some 88 million gallons.
The spill unit cost ranges developed by this study can provide an approximation of the
economic impacts inflicted by these oil spills. Based on the U.S. Coast Guard oil spill volumes,
and the per-gallon cost range developed from the analysis of tanker spills (Exhibit 5-2), ARI
estimated the total annual cost of cleanup and natural resource damages due to oil spills in the
U.S. (Exhibit 5-4). Using an average value of $287 per gallon spilled for total cleanup and
damages, calculated by averaging the tanker spill cost range of $5 and $569 per gallon, the
estimated annual losses due to oil spills ranged from under $1 billion per year to as much as
$3.26 billion in 1989 (19935). Total costs over the period 1973 to 1990 due to U.S. oil spills
amounted to an estimated $25 billion dollars in i%3 dollars (adjusted for inflation, but not
compounded to reflect alternative investment value of money). This value reflects a staggering
loss to the U.S. economy and underscores the need for developing effective oil spill prevention,
response, and cleanup technology.
JAF00911.II -97-
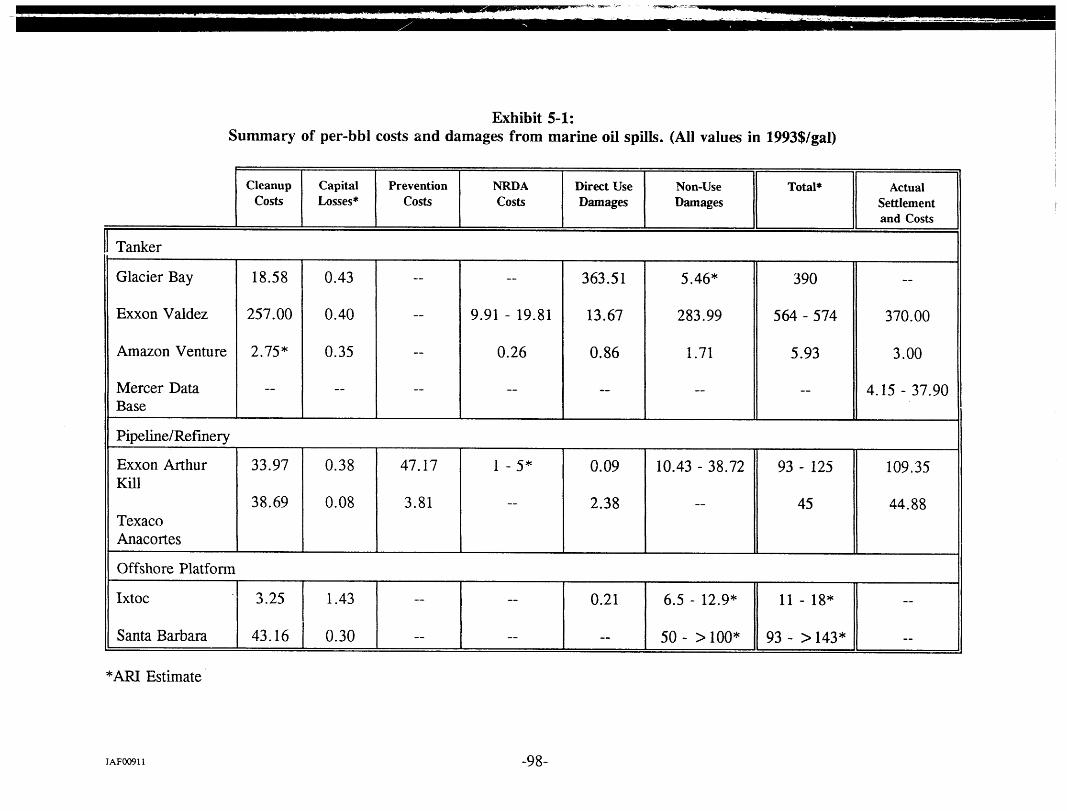
Exhibit 5-1:
Summary of per-bbi costs and damages from marine oil spills. (All values in 19935/gal)
Cleanup Capital Prevention NRDA Direct Use Non-Use Total* Actual
Costs Losses* Costs Costs Damages Damages Settlementand Costs
l] Tanker
Glacier Bay 18.58 0.43 .... 363.51 5.46* 390 --
Exxon Valdez 257.00 0.40 -- 9.91 - 19.81 13.67 283.99 564- 574 370.00
Amazon Venture 2.75* 0.35 -- 0.26 0.86 1.71 5.93 3.00
Mercer Data .............. 4.15- 37.90Base
Pipeline/Ref'mery
Exxon Arthur 33.97 0.38 47.17 1 - 5* 0.09 10.43 - 38.72 93 - 125 109.35Kill
38.69 0.08 3.81 -- 2.38 -- 45 44.88Texaco
Anacortes
Offshore Platform
Ixtoc [I 3.25 111"43 .... 0.21 6.5-12.9" ][ 11-18" II --Santa Barbara I 43.16 ! 0.30 ...... 50 - > 100" 93 - > 143" --
*ARI Estimate
JAF00911 -98-

I I Ill Ill Ill I -I1 ......... _l II IIl-_ _- I ............. I I .........
!
i
700-2 t_'°wl 569600 I [] Highl
1 4512 5
Offshore Facility Pipeline/Refinery Tanker/Barge
Oil Supply System Component
* Highly uncertain .
Exhibit 5-2:
Most likely ranges of spill unit costs for three oil supply components.
s_soo9,l -99-

(Pa_nD ;s_oD "S'D_) "066! - £/.6! sJa;_ "STI u! PalI!ds I!O:£-_ _!qIqx_I

Exhibit 5-4:
ARrs calculated damages due to oil spilled in U.S. watersbased on average spill unit cost ($283/gal).
J,_:_ -101-
L_ • _:-_:_r_ ........ _iiii"I II III • I -- - 1 ilF II I II _ III] II i_ ............................... , ,, , @

References
B-Laing Associates, 1990. "Arthur Kill, Kill van Kull, and Tributaries: General WetlandSttmmary," final draft report, prepared for Exxon USA, August.
Bishop, R.C. and Heberlein, T.A., 1992. "The Contingent Valuation Method," in K.W. Wardand J.W. Duffield, eds., Natural Resource Damages: Law and Economics, John Wiley,New York, p. 281-309.
Boehm, P.D., Fiest, D.L., Kaplan, I., Mankiewicz, P., and Lewbel, G.S., 1983. "A NaturalResources Damage Assessment Study: The IXTOC 1 Blowout," 1983 Oil SpillConference, San Antonio, Texas, February 28-March 3, p. 507-515.
Brown, G., 1992, "Replacement Costs of Birds and Mammals," Report prepared for AlaskaAttorney General, December, 16 p.
Burden, P., Isaacs, J., Richardson, J., Braund, S., Witten, E., and Moorehead, L., 1990.Economic Impacts of the S.S. Glacier Bay Oil Spill," Report prepared for MineralsManagement Service, Alaska Outer Continental Shelf Region, November, 91 p.
Carson, R.T. and Hanemann, W.M., 1992, "A Preliminary Economic Analysis of RecreationalFishing Losses Related to the Exxon Valdez Oil Spill," Report prepared for AlaskaAttorney General, December, 14 p.
Carson, R.T., Mitchell, R.C., Hanemann, W.M., Kopp, R.J., Presser, S., and Ruud, P.A.,1992. "A Contingent Valuation Study of Lost Passive Use Values Resulting from theEx_ron Valdez Oil Spill," Report prepared for Alaska Attorney General, November, 312p.
Dean, T.A., McDonald, L., Stekoll, M.S., and Rosenthal, R.R., 1993. "Damage Asses_;':,entin Coastal Habitats: Lessons Learned from Exxon Valdez," Proceedings of the 1_93Intenmtional Oil Spill Conference, Tampa, Florida, p. 695-697
Desvousges, W.H., Dunford, R.W., Mathews, K.E., Banzhaf, H.S., 1993. "NRDA CaseStudy: The Arthur Kill Oil Spill," Proceedings of the 1993 International Oil SpillConference, Tampa, Florida, March 29-April I, p. 711-716.
Diamond, P.A., Hausman, J.A., Leonard, G.K., and Denning, M.A., 1992. "Does ContingentValuation Measure Preferences?," Paper presented at the Cambridge Economics, Inc.Symposium, Contingent Valuation: A Critical Assessment, Washington, D.C., April.
Dunford, R.W., Hudson, S.P., Desvousges, W.H., 1993. "Experimental Contingent Values forReducing Environmental Damage from Oil Spills," Proceedings of the 1993 InternationalOil Spill Conference, Tampa, Florida, p. 699-703.
Energy Resources Co., Inc., 1982. "IXTOC Oil Spill Assessment," report prepared for U.S.Bureau of Land Management, April, 37 p.
JAF_tI.H -102- i
!

Exxon USA, 1991. Civil Consent Order, June 14.
Gaines, T.H., 1969. "Pollution Control at a Major Oil Spill," Joint Conference on Preventionand Control of Oil Spills, Proceedings, New York, December 15-17, p. 271-280.
Geselbracht, L. and Logan, R., 1993. "Washington's Marine Oil Spill Compensation Schedule -- Simplified Resource Damage Assessment," Proceedings of the 1993 International OilSpill Conference, Tampa, Florida, March 29-April 1, 1993, p. 705-709.
Grigahmas, T.A. and Opaluch, J.J., 1993. "Non-Use Value in Natural Resource DamageAssessments: The Nestucca Oil Spill," Proceedings of the 1993 International Oil SpillConference, Tampa, Florida, p. 689-693.
Grigahmas, T.A. and Opaluch, J.J., French, D.P., and Reed, M. 1992. "Validating a Type AAssessment Model," in K.M. Ward and J.W. Duffield, eds., Natural Resource Damages:Law and Economics, John Wiley & Sons, Inc., New York, p. 471-491.
Grigahmas, T.A. and Opaluch, J.J., 1988. "Assessing Liability Danlages Under CERCLA: ANew Approach for Providing Incentives for Pollution Avoidance?" Natural ResourcesJournal, v. 28, p. 509-533.
Harrison, O.R., 1991. "An Overview of the Exxon Valdez Oil Spill," Proceedings of the 1991Oil Spill Conference, San Diego, March 4-7, p. 313-319.
Lindstedt-Siva, J., 1979. "Resources Sensitive to Oil Spills (Case Study of the Santa BarbaraChannel)," Proceedings of the 1979 U.S. Fish and Wildlife Service Pollution ResponseWorkshop, St. Petersburg, Florida, May 8-10, p. 79-90.
Luthi, R.B., Burlington, L.B., Reinharz, E., and Shutler, S.K., 1993. "The Second Generationof Natural Resource Damage Assessments: Lessons Learned?," Proceedings of the 1993International Oil Spill Conference, Tampa, Florida, March 29-April 1, p. 727-731.
Mazzotta, M.J., Opahlch, J.J., and Grigalunas, T.A., Restoration and Natural Resource DamageAssessment," Proceedings of the 1993 International Oil Spill Conference, Tampa,Florida, March 29-April 1, 1993, p. 721-725.
McDowell Group, 1990, "An Assessment of the hnpact of the Exxon VaMez Oil Spill on theAlaska Tourism Industry," Report prepared for Preston, Thorgrimson, Shidler, Gates,and Ellis, August, 96 p.
Mendelsohn, R., 1986. "Assessment of Damages by PCB Contamination to New BedtbrdHarbor Amenities Using Residential Property Values," Draft Report for NOAA.
Mercer Management Consulting, 1992. "OPA 90: Regulatory hnpact Analysis Review," InterimReport for U.S. Coast Guard, September 15.
Michel, J., 1989, "Natural Resource Damage Assessment of the Amazon Venture Oil Spill,"1989 Oil Spill Conference, San Antonio, Texas, Febnmry, p. 303-306.
JAF00911.11 -103-

Mills, M.J., 1992, "Alaska Sport Fishing in the Aftex'math of tile Era'on Valdez Oil Spill,"Alaska Department of Fish and Game, Special Publication No. 92-5, 172 p.
NOAA (National Ocear_ic and Atmospheric Administl,'ation), 1993. "Natural Resource DamageAssessments Under the Oil Pollution Act of 1990," Advance Notice of ProposedRtdemaking, Federal Register, v. 58, no. I0, January 15, p. 4601-4614.
O'Brien, J.L., 1981. "National Strike Force Response IXTOC 1 Blowout -- Bay of Campeche,"1981 Oil Spill Conference Proceedings, Atlanta, Georgia, March 2-5, p. 125-130.
Oil and Gas Journal, 1993. "First Penalties Levied Under U.S. Oil Pollution Act," February22, p. 44.
Plante, K.J., Barnett, E.L., Preble, D.J., and Price, L.M., 1993, "Florida's Pollutant DischargeNatural Resource Damage Assessment Compensation Schedule -- A Rational Approachto the Recovery of Natural Resource Damages," Proceedings of the 1993 InternationalOil Spill Conference, Tampa, Florida, March 29-April 1, 1993, p. 717-720.
Public Law 101-380, 1990. "Oil Pollution Act of 1990," 101st Congress, 104 Stat. 484.
Restrepo and Associates, 1982. "IXTOC 1 Oil Spill Economic Impact Study," report preparedfor U.S. Bureau of Land Management, 16 p.
Robilliard, G.A., Fischei, M., Desvousges, W.H., Dunford, R.W., and Mathews, K., 1993,"Evaluation of Compensation Formulae to Measure Natural Resource Damages,"Proceedings of the 1993 International Oil Spill Conference, Tampa, Florida, March 29-April 1, 1993, p. 739-743.
Sauer T. and Boehm, P., 1991, "The Use of Defensible Analytical Chemical Measurements forOil Spill Natural Resource Damage Assessment," Proceedings of the 1991 Oil SpillConference, San Diego, March 4-7, p. 363-369.
State of Ohio v. Department oflnterior, 1989. D.C. Circuit Court, 880 F.2d at 442 n.4.
Straughan, D., ;:q69. "The Santa Barbara Study," Joint Coilfercnce on Prevention and Controlof Oil Sl,,_lls, Proceedings, New York, December 15-17, p. 309-311.
Trustee Council, I, 1991. "The 1991 Slate/Federal Natural Resource Damage Assessment andRestoration Plan for the Exxon Valdez Oil Spill," April.
Waldichuk, M., 1980. "Retrospect of the IXTOC 1 Blowout," Marine Pollution Bulletin, w_l.11, p. 184-186.
Woods, E.G. and Hannah, R.P., 1981. "IXTOC 1 Oil Spill-- The Damage AssessmentProgram and Ecological Impact," 1981 Oil Spill Conference Proceedings, Atlanta,Georgia, March 2-5, p. 439-443.
JAr.'0ogll.H -104-

Appendix 1
Oil Spills ill U.S. Waters 1973 - 1990

PRIMARY VOLUMEDATE V_SSELNAME TYPE STATE OILTYPE CAUSE (GALLONS)
.....................
07 MAR 73 H1LLYER BROWN TNKS AK OOD GRI) 196,18209 MAR 73 PC 2901 TNKB TX OIL COL 420,00018 MAR 73 ZOE COLOCOTRONi TNKS PR OIL GRD 1,505,910
09 APR 73 PENNANT TNKS RI GAV GRD 250,00003 JUN 73 TNKS NY OSX COL 840,00010 JUL 83 TNKB LA OIL COL 210,000
01 I)EC 73 TNKB KY OTW COL 153,69024 DEC 73 TNKB MS OSX COL 105,00026 DEC 73 TNKS PA OIL GRD 126,00015 JAN 74 TNKB LA O11., COL 157,50019 FEB 74 TNKS NJ OSX COL 285,00015 APR 74 IMPERIAL SORNEA TNKS NY OIL GPD 147,00022 JUN 74 TNKB LA OIL COL 1,008,00008 JUL 74 TM 10 TNKB TX OSX COL 378,00019 JUL 74 HYGRADE TNKB NY GAV GRD 130,000
06 OCT 74 TNKS CT OSX GRD 105,00009 OCT 74 TNKS TX OIL UNK 306,00022 OCT 74 TNKS LA OSX GRD 103,02622 JAN 75 MICHAEl., C. LEMOS TNKS VI OIL GRD 376,00031 JAN 75 CORINTHOS TNKS PA OIL COL 500,000
03 MAR 75 IOT-I05 TNKB MS GAT COL 840,00005 MAR 75 TNKB MS OIL COL 744,69705 MAR 75 B-421 TNKB MS OIL COl_, I 1!,88104 APR 75 POLAR PARAGUAY TNKS OSX WTH 6,000,00025 APR 75 TNKB LA OIL COL 210,00015 AUG 75 TNKS OIL COL 840,00007 OCT 75 B.NO. 115 'FNKB NY OFR GRD 102,00009 DEC 75 Z-102 TNKB PR OSX GRD 322,51802 FEB 76 STC-IO1 TNKB VA OSX FI)P 251,53808 I:I_B 76 FI.ORll)A TNKB II_ JPO GRD 225,0(X)24 I:EB 76 SJT 4 TNKB LA OII.. COl.. 159,768
t)4 MAY 76 N.M.S.NO. 3105 TNKS TX OSX UNK 210,0(X)19 MAY 76 1717 TNKB OH OSX GRD 126,00023 JUN 76 NEPCO 140 'FNKB NY OSX GRD 307,00005 OCT 76 SEALII--"TPACIIHC TNKS AK JPV GRD 395,67029 OCT 76 TNKB NJ OIL COL 277,20029 OCT 76 RICHARD SAUER TNKS PA OIL GRD 255,00015 DEC 76 ARGO MERCHANT "r'NKS MA OSX GRD 7,500,00017 DEC 76 TNKS CA OSX CNC 1,000,00028 I)EC 76 OLYMPIC GAMES TNKS PA OIL GRD 133,(X)017 JAN 77 IRENE'S C'HAI_IA,.'NGi7 TNKS HI OIL FI)R 9,600,(XX)Ol i:I,_B77 B.NO. 105 TNKB NJ OSX GRD 100,00004 l:liB 77 IzTHEI. tt TNKB NY OSX (;RD 420,0(X)
. ..... --: _ ,...........................
JAFOOgll.Al A-I
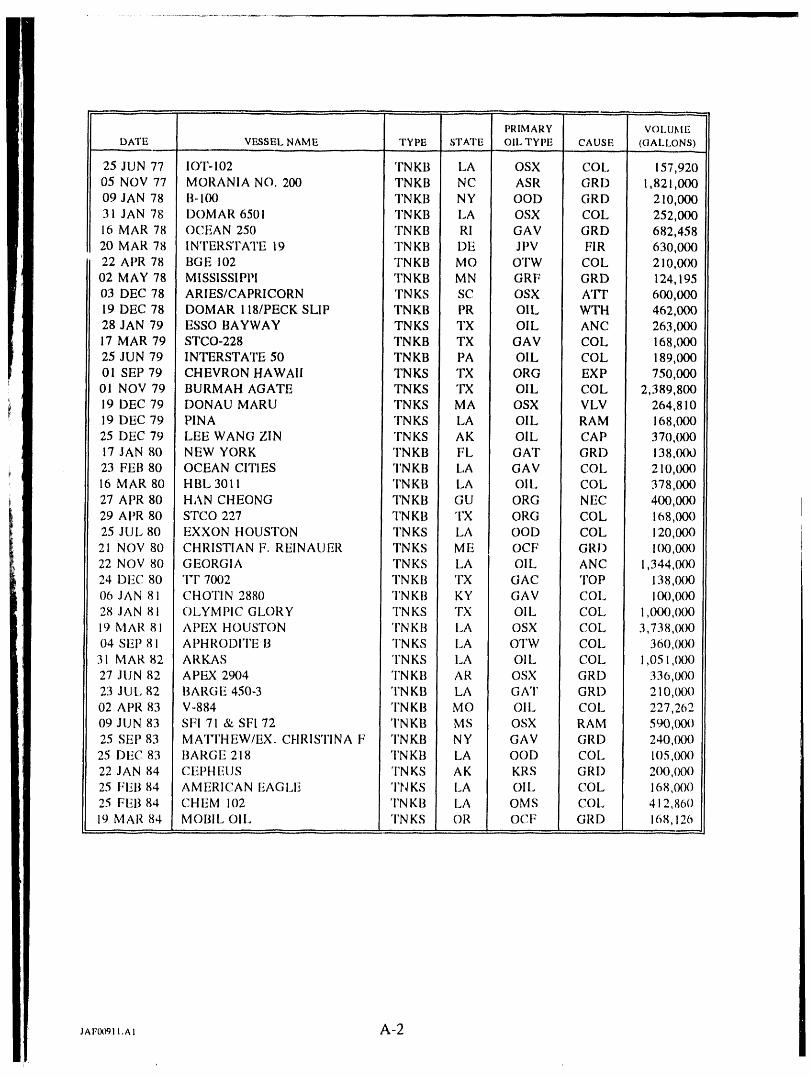
PRIMARY VOI.UMEDATE VF.,SSELNAME TYPE STATE OILTYPE CAUSE (GALLONS)
..................
25 JUN 77 lOT-102 TNKB LA OSX COl.. 157,92005 NOV 77 MORANIA NO. 200 TNKB NC ASR GRD 1,82i,00009 JAN 78 I3-100 TNKB NY OOD GRD 210,00031 JAN 78 DOMAR 6501 TNKB LA OSX COL 252,00016 MAR 78 OCEAN 250 TNKB RI GAV GRD 682,45820 MAR 78 INTERSTATE 19 TNKB DE JPV FIR 630,00(122 APR 78 BGE 102 TNKB MO OTW COL 210,00002 MAY 78 MISSISSIPPI TNKB MN GRF GRD 124,19503 DEC 78 ARIES/CAPRICORN TNKS SC OSX ATT 600,00019 DEC 78 DOMAR 118/PECK SLIP TNKB PR OIL WTH 462,00028 JAN 79 ESSO BAYWAY TNKS TX OIL ANC 263,00017 MAR 79 STCO-228 TNKB TX GAV COL 168,00025 JUN 79 INTERSTATE 50 TNKB PA OIL COL 189,00001 SEP 79 CHEVRON HAWAII TNKS TX ORG EXP 750,000
01 NOV 79 BURMAH AGATE TNKS TX OIL COL 2,389,80019 DEC 79 DONAU MARU TNKS MA OSX VLV 264,81019 DEC 79 PINA TNKS LA OIL RAM 168,00025 DEC 79 LEE WANG ZIN TNKS AK OIL CAP 370,00017 JAN 80 NEW YORK TNKB FL GAT GRD 138,00023 FEB 80 OCEAN CITIES TNKB LA GAV COL 210,00016 MAR 80 HBL 3011 TNKB LA OIL COL 378,00027 APR 80 HAN CHEONG TNKB GU ORG NEC 400,00029 APR 80 STCO 227 TNKB TX ORG COL 168,00025 JUL 80 EXXON HOUSTON TNKS LA OOD COL 120,00021 NOV 80 CHRISTIAN F. REINAUER TNKS ME OCF GRD 100,00022 NOV 80 GEORGIA TNKS LA OIL ANC 1,344,0OO24 DEC 80 T'F 7(KI2 TNKB TX GAC TOP 138,(X)006 JAN 81 CHOTIN 2880 TNKB KY GAV COL I(X),00028 JAN 81 OLYMPIC GLORY TNKS TX OIL COL 1,000,(YO019 MAR 81 APEX HOUSTON TNKB I_A OSX COL 3,738,(X)004 SEP 81 APHRODITE B TNKS LA OTW COL 360,00031 MAll 82 ARKAS TNKS LA OIL COl. 1,051,00027 JUN 82 APEX 2904 TNKB AR OSX GRD 336,00023 JUL 82 BARGE 450-3 TNKB LA GAT GRD 210,00t)02 APR 83 V-884 TNKB MO OIL COl. 227,26209 JUN 83 SH 71 & SFI 72 TNKB MS OSX RAM 590,(X)025 SEP 83 MAqT"HEW/EX. CHRISTINA F TNKB NY GAV GRD 240,00025 DEC 83 BARGE 218 TNKB LA OOD COL 105,00022 JAN 84 CEPHEtJS TNKS AK KRS GRD 200,0tN)25 FEll 84 AMERICAN EAGLE TNKS LA OIL COL 168,0(X)25 FEB 84 CHEM 102 TNKB LA OMS COL 412,86019 MAil 84 MOBIL OIL TNKS OR OCF Gill) 168,126
'" _ ............... ,;, ,,", .... z ,

PRIMARY VOI.UMEDATF. VESSELNAME TYPE STATE O|1.TYPE CAUSE ((JALLONS)
02 MAY 84 OFFSHORE 2403 TNKI3 CA JPV UNK 119,95230 JUL 84 ALVENUS TNKS LA OIL GRD 2,757,25820 OCT 84 CHEM 13 TNKI3 MO O'FW GRD ! 10,00031 OCT 84 PUERTO RICAN TNKS CA OCF EXP 1,250,00016 DEC 84 TNKB TX GAV UNK 229,000
12 FEB 85 BW 1933 TNKB TN jPV COL 168,00023 MAY 85 CHOTIN 1451 TNKB LA NSW RAM 109,20018 AUG 85 EXXON I3ARGE NO. 32 TNKI3 VA OTW UNK !,260,00029 SEP 85 AMERSHAM/GRAND EAGLE TNKS PA OIL GRD 435,00024 NOV 85 SFI-41 TNKI3 OSX COL 705,60016 DEC 85 B,NO. 145 TNKI3 TX GSR MNT 115,50017 DEC 85 DXE 3(X)6 TNKB IL OIL COL 180,60021 DEC 85 ARC() ANCHORAGE TNKS WA OIL GRD 238,98007 MAR 86 TEXAS TNKB IL OIL GRD 716,31021 MAR 86 INTERMAR AIJ.IANCE TNKS PA OIL COl. 105,00031 JUL 86 TIT 103 TNKI3 OTW EXP 622,44010 SEP 86 VIKING OSPREY TNKS NJ OIL GRD 264,60017 SEP 86 S.T. 85 TNKI3 MA GAT GRD 119,762
27 OCT 86 IB 2(K)3 L TNKB MO GAT COL 122,05216 NOV 86 AMAZON VENTURE TNKS NY OSX VLV 105,70604 DEC 86 AMAZON VENTURE TNKS GA OSX VLV 500,00015 JAN 87 STUYVESANT TNKS OIL WTH 588,33617 FEB 87 TEXACO 807 TNKB NY OTD NEC 301,770
04 OCT 87 STUYVESANT TNKS AK OIL WTH 914,92817 JAN 88 DOMAR 115 TNKB MS GAT GRD 294,00013 JUL 88 NORD PACIFIC TNKS TX OIL RAM 644,700
24 AUG 88 565 TNKB VA ODS WTH 211,974
05 SEP 88 EXXON BARGi_ 503 TNKB FL O'FD UNK 126,16823 I)EC 88 NES'I'UCCA TNKI3 WA OSX COl. 227,30426 DEC 88 UMTI] 283 TNKB AK OTD UNK 2,041,662
24 MAR 89 EXXON VAIJ)EZ TNKS AK OIL GRD 10,500,00023 JUN 89 COASTAl. 2514 TNKI3 TX OSX COL 252,000
23 JUN 89 WORLD PROI)IC;Y TNKS Ri OTW GRI) 292,00024 JUN 89 i_i_,ESIDI_NTE RIVH_A TNKS PA OSX GRI) 307,00007 FEI3 90 AMERICAN TRADER TNKS CA OIt. ANC 397,23606 MAR 90 CII3RO SAVANNAH TNKB NJ OTW COl. 126,00007 JUN 90 13'I'NAU'I'II_US TNKS NJ OSX GRI) 250,00009 JUN 90 MEGA I3()R(; TNKS OIL EXP 400,00028 JUI. 90 APEX 3417 TNKI3 TX OFV COI_ 654,86419 AUG 90 OCEAN 192 TNKB DE GAT COL 152,000IC_SEP 90 JlJi_l'l'l_l_ TNKS M! (;A'I' EXP 316,68020 OCT 90 HYGRAi)E 42 TNKI3 NY KRS COL 164,000
_--. ,, ...... , ......... - ,,
JAFO0911,A| A-3

pr