Embed Size (px)
Citation preview
Southeast Florida Coral Reef Initiative
Benthic Habitat Mapping of Miami-Dade County: Visual Interpretation of LADS Bathymetry and Aerial
Photography
Southeast Florida Coral Reef Initiative Land Based Sources of Pollution Local Action Strategy Project 8
Southeast Florida Coral Reef Initiative
Benthic Habitat Mapping of Miami-Dade County: Visual Interpretation of LADS Bathymetry and Aerial
Photography
Final Report
Prepared By:
Brian K. Walker
Nova Southeastern University Oceanographic Center
June 30, 2009
Completed in Fulfillment of Contract RM69 for
Southeast Florida Coral Reef Initiative Land Based Sources of Pollution Local Action Strategy Project 8
and
Florida Department of Environmental Protection Coral Reef Conservation Program
1277 N.E. 79th Street Causeway Miami, FL 33138
This report should be cited as follows: Walker, B.K. 2009. Benthic Habitat Mapping of Miami-Dade County: Visual Interpretation of LADS Bathymetry and Aerial Photography. Florida DEP report #RM069. Miami Beach, FL. Pp. 47.
Southeast Florida Coral Reef Initiative
Under DEP contract RM069 executed December 19, 2007, an extension of NOAA Award# NA06NOS4190100, Nova Southeastern University is required to map the coral reefs and other benthic habitats found off Miami-Dade County from Fowey Rocks to the northern county line.
This project and the preparation of this report were funded by a Coastal Zone Management grant from the National Oceanic and Atmospheric Administration through a contract with the Office of Coastal and Aquatic Managed Areas of the Florida Department of Environmental Protection.
Southeast Florida Coral Reef Initiative
Land Based Sources of Pollution 4 Project 8 Final Report June 2009
Table of Contents Introduction ..................................................................................................................................... 6
Methodology ................................................................................................................................... 7
LiDAR Bathymetry ..................................................................................................................... 7
FWC Aerial Photography ........................................................................................................... 8
Groundtruthing ............................................................................................................................ 8
Accuracy Assessment ................................................................................................................. 9
Data Collection ....................................................................................................................... 9
Data Evaluation ..................................................................................................................... 10
Classification Scheme ............................................................................................................... 10
RESULTS & DISCUSSION ........................................................................................................ 31
Sea Floor Morphology .............................................................................................................. 31
Accuracy Assessment ............................................................................................................... 33
Literature Cited ............................................................................................................................. 34
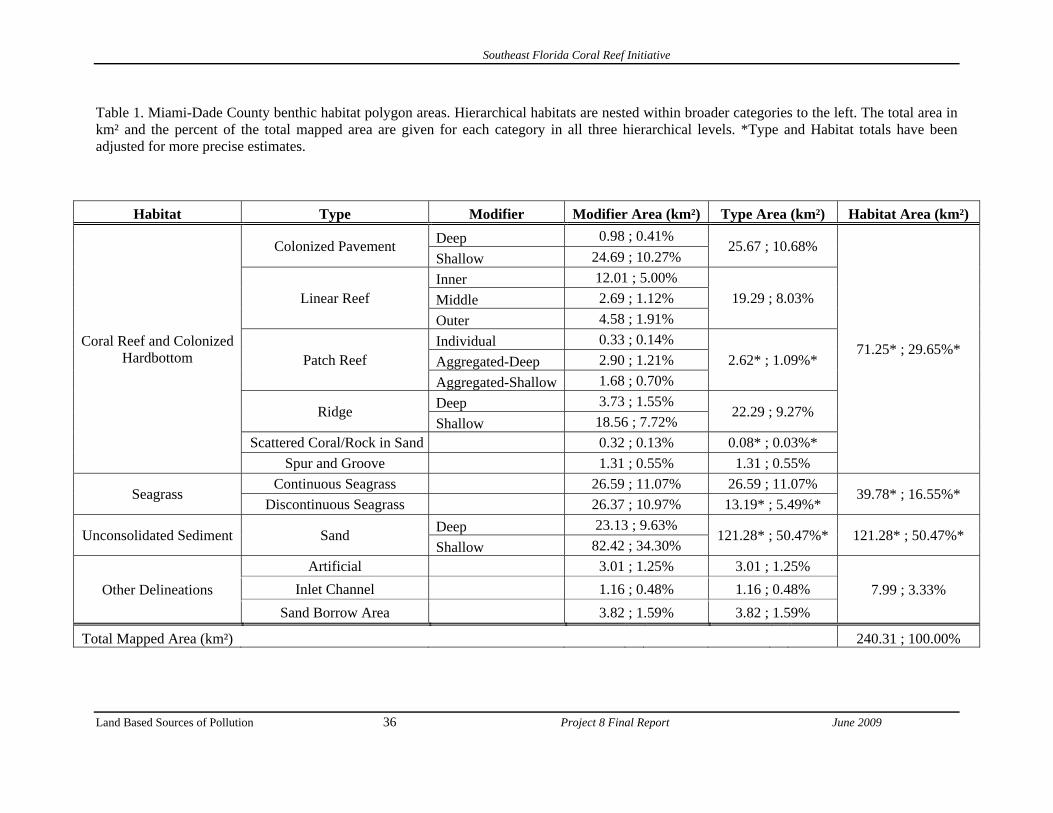
List of Tables Table 1. Miami-Dade County benthic habitat polygon areas. Hierarchical habitats are nested within broader categories to the left. The total area in km² and the percent of the total mapped area are given for each category in all three hierarchical levels. *Type and Habitat totals have been adjusted for more precise estimates. ..................................................................................... 36
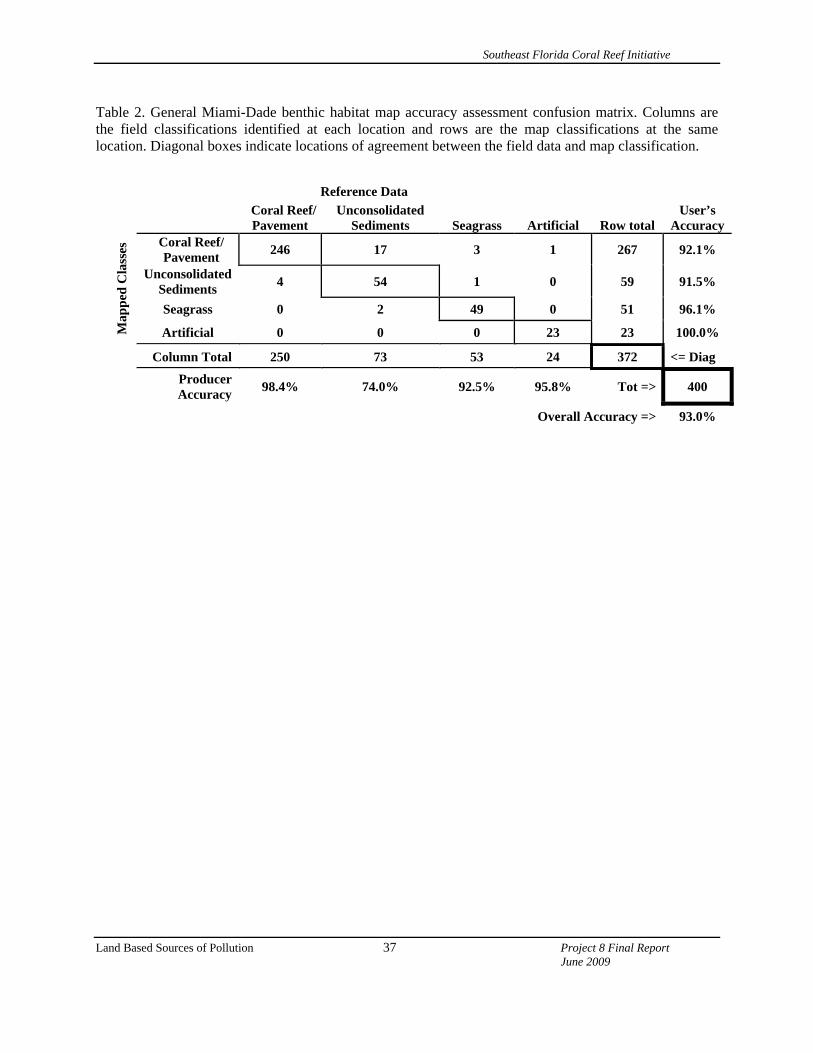
Table 2. General Miami-Dade benthic habitat map accuracy assessment confusion matrix. Columns are the field classifications identified at each location and rows are the map classifications at the same location. Diagonal boxes indicate locations of agreement between the field data and map classification. .................................................................................................. 37
Table 3. Detailed Miami-Dade benthic habitat map accuracy assessment confusion matrix. Columns are the field classifications identified at each location and rows are the map classifications at the same location. Diagonal boxes indicate locations of agreement between the field data and map classification. .................................................................................................. 38
Southeast Florida Coral Reef Initiative
Land Based Sources of Pollution 5 Project 8 Final Report June 2009
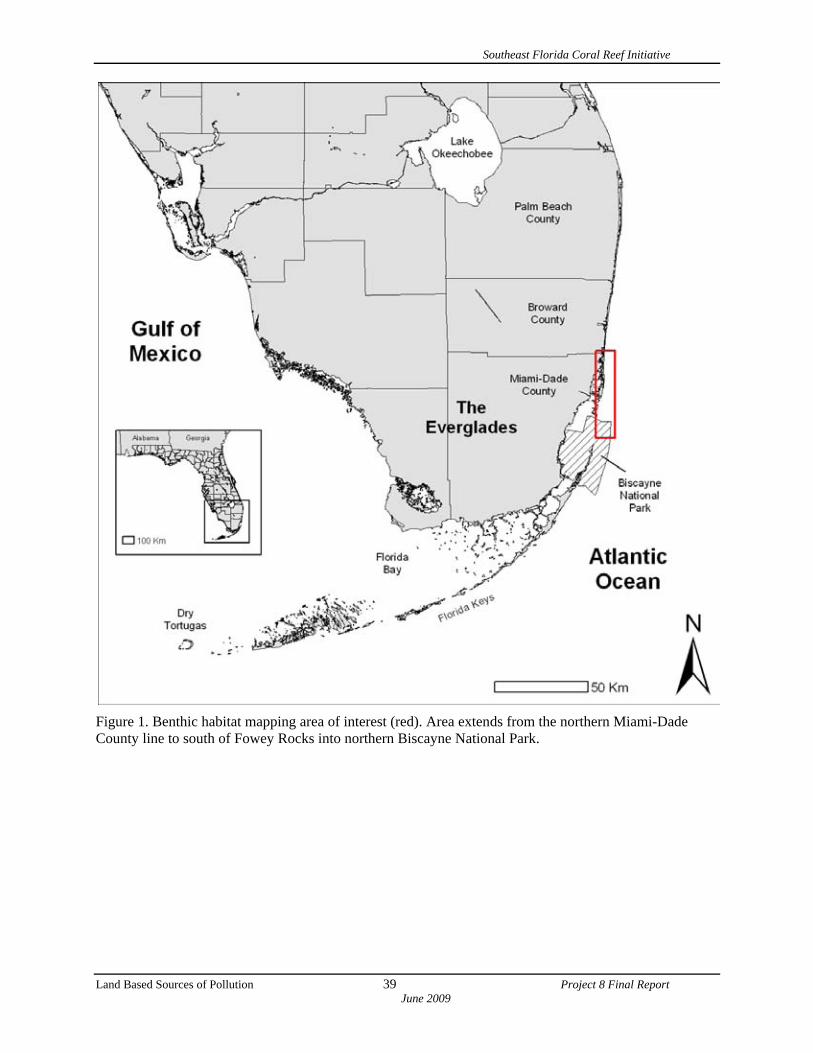
List of Figures Figure 1. Benthic habitat mapping area of interest (red). Area extends from the northern Miami-Dade County line to south of Fowey Rocks into northern Biscayne National Park. .................... 39
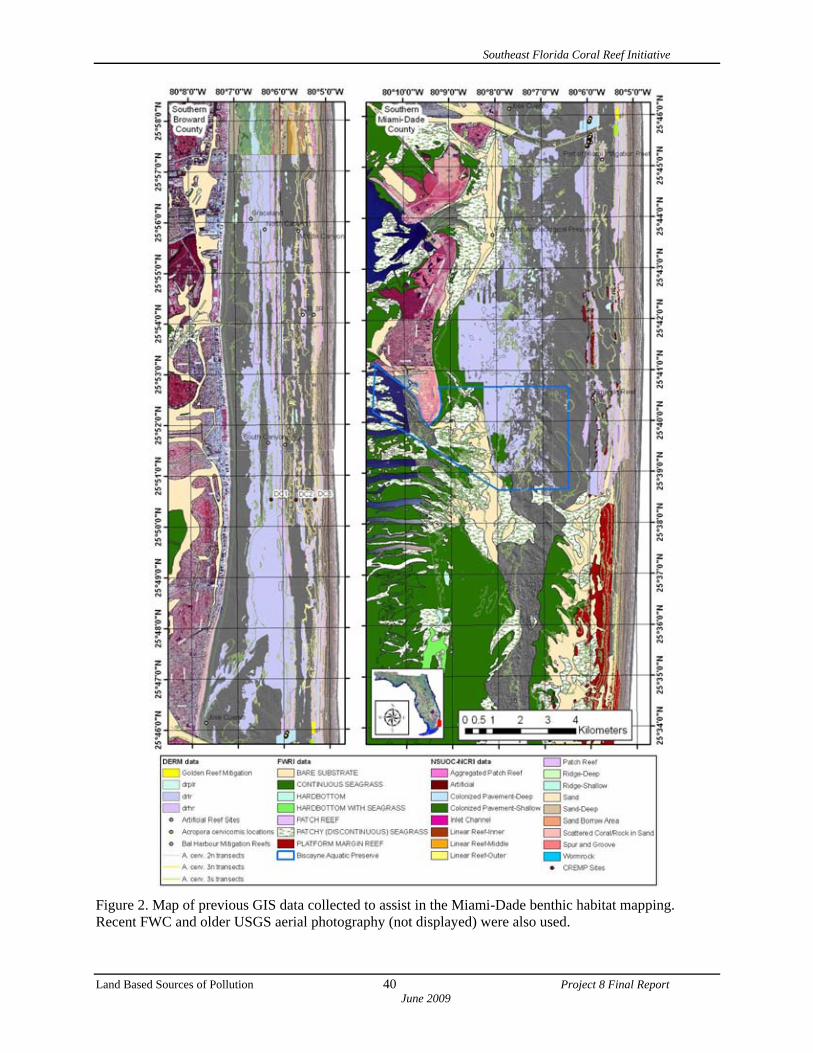
Figure 2. Map of previous GIS data collected to assist in the Miami-Dade benthic habitat mapping. Recent FWC and older USGS aerial photography (not displayed) were also used. ..... 40
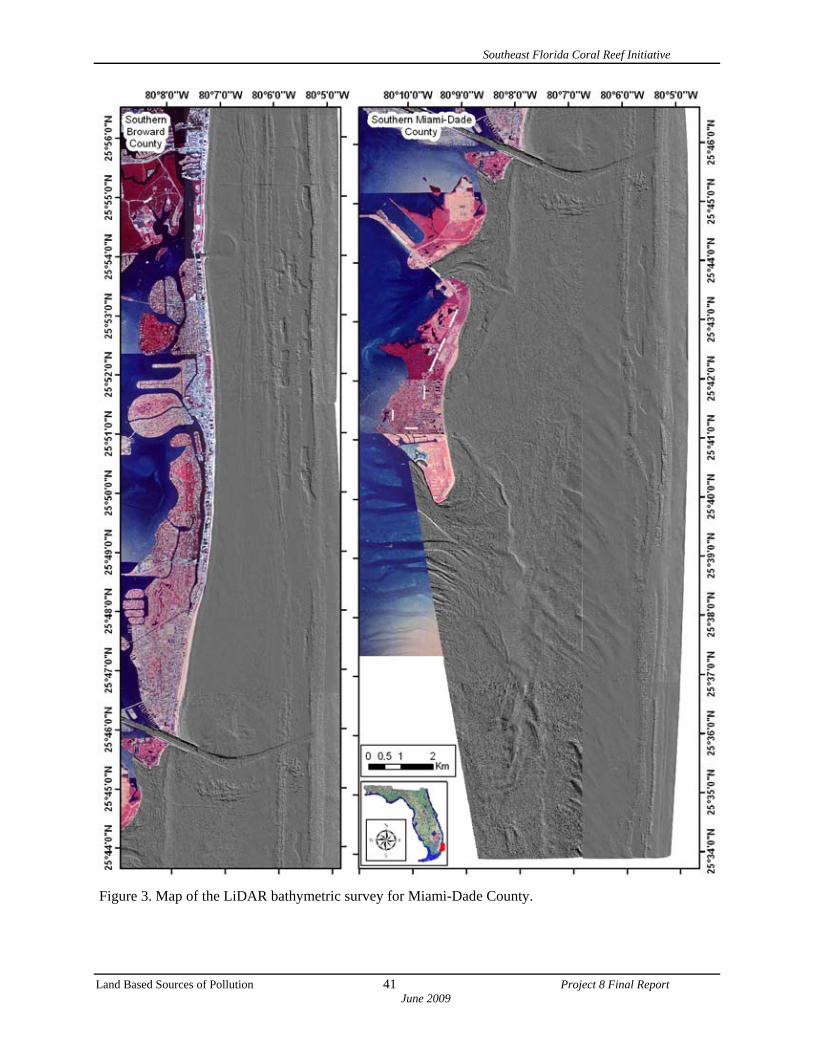
Figure 3. Map of the LiDAR bathymetric survey for Miami-Dade County. ................................ 41
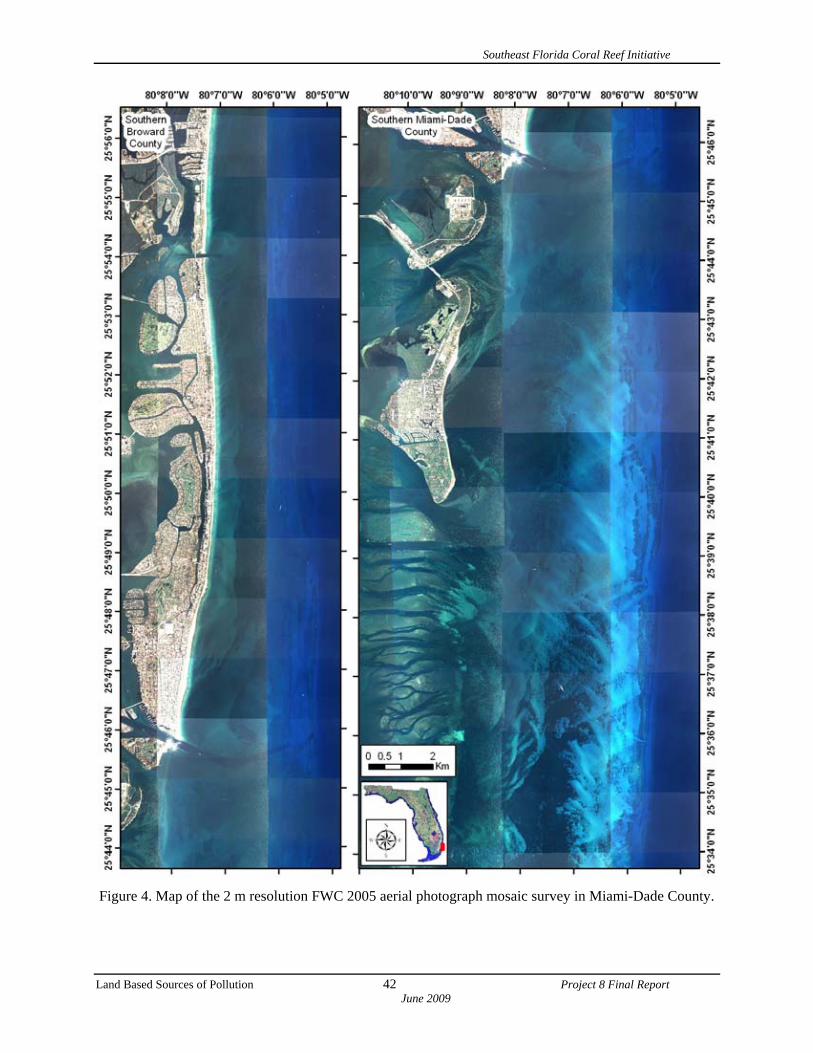
Figure 4. Map of the 2 m resolution FWC 2005 aerial photograph mosaic survey in Miami-Dade County. .......................................................................................................................................... 42
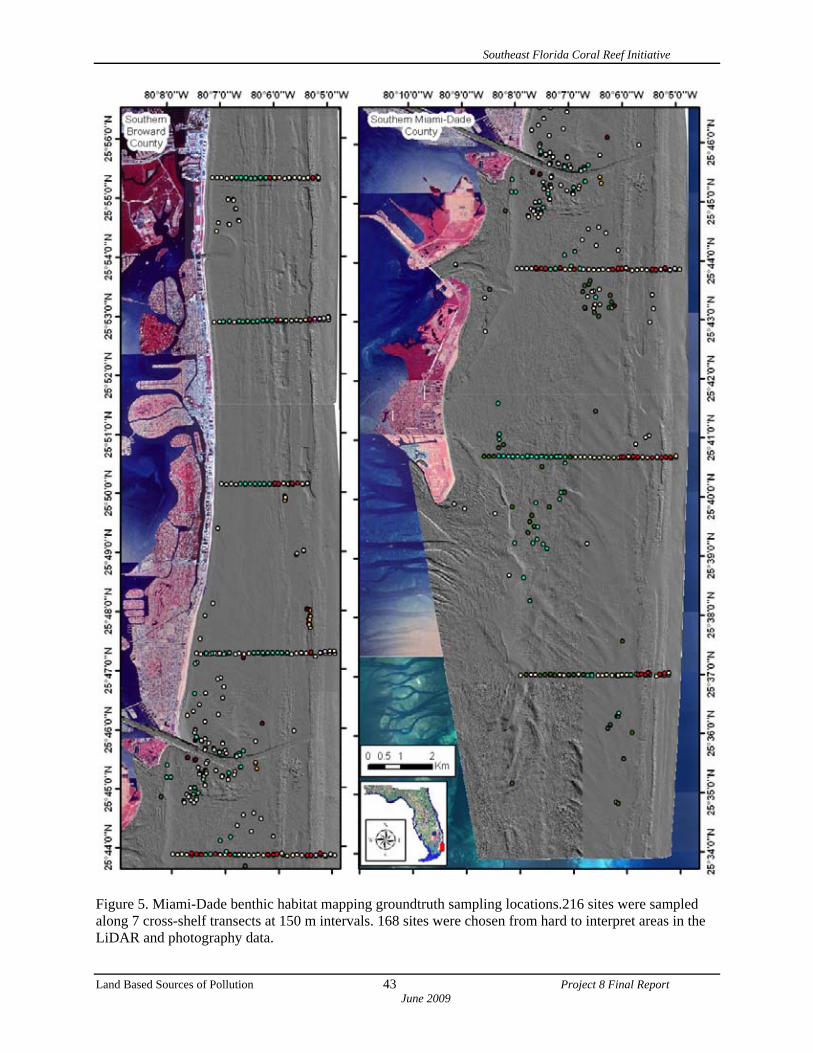
Figure 5. Miami-Dade benthic habitat mapping groundtruth sampling locations.216 sites were sampled along 7 cross-shelf transects at 150 m intervals. 168 sites were chosen from hard to interpret areas in the LiDAR and photography data. .................................................................... 43
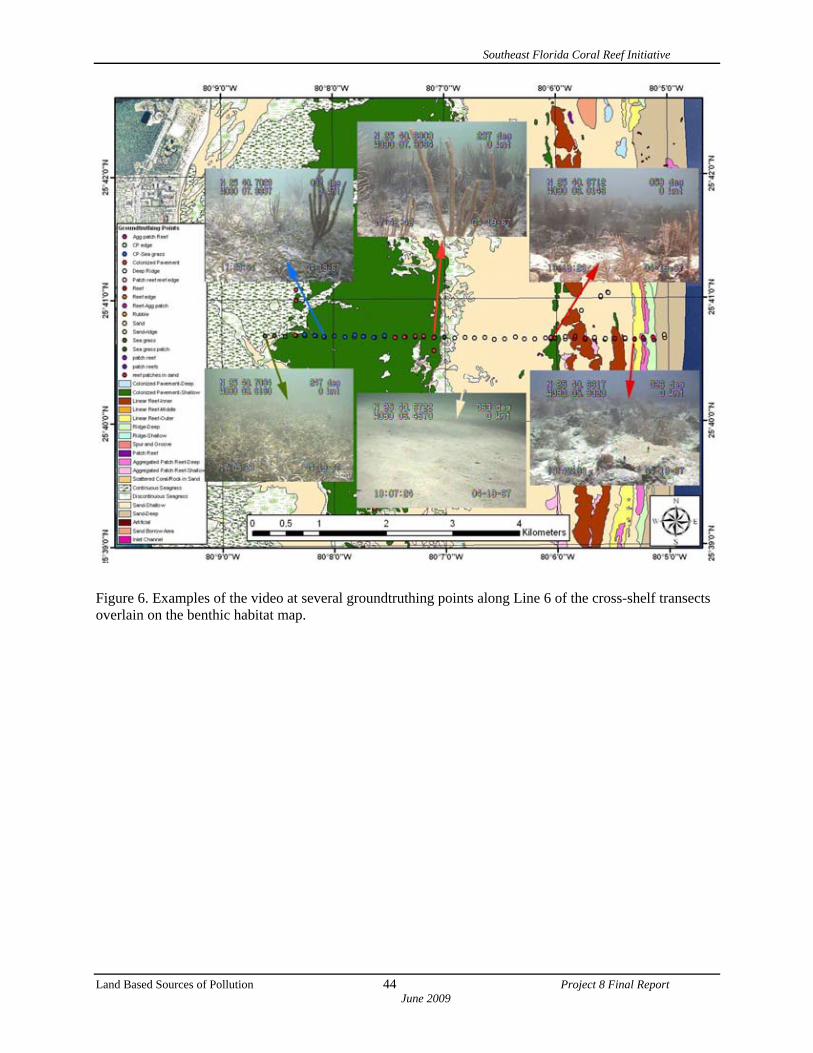
Figure 6. Examples of the video at several groundtruthing points along Line 6 of the cross-shelf transects overlain on the benthic habitat map. .............................................................................. 44
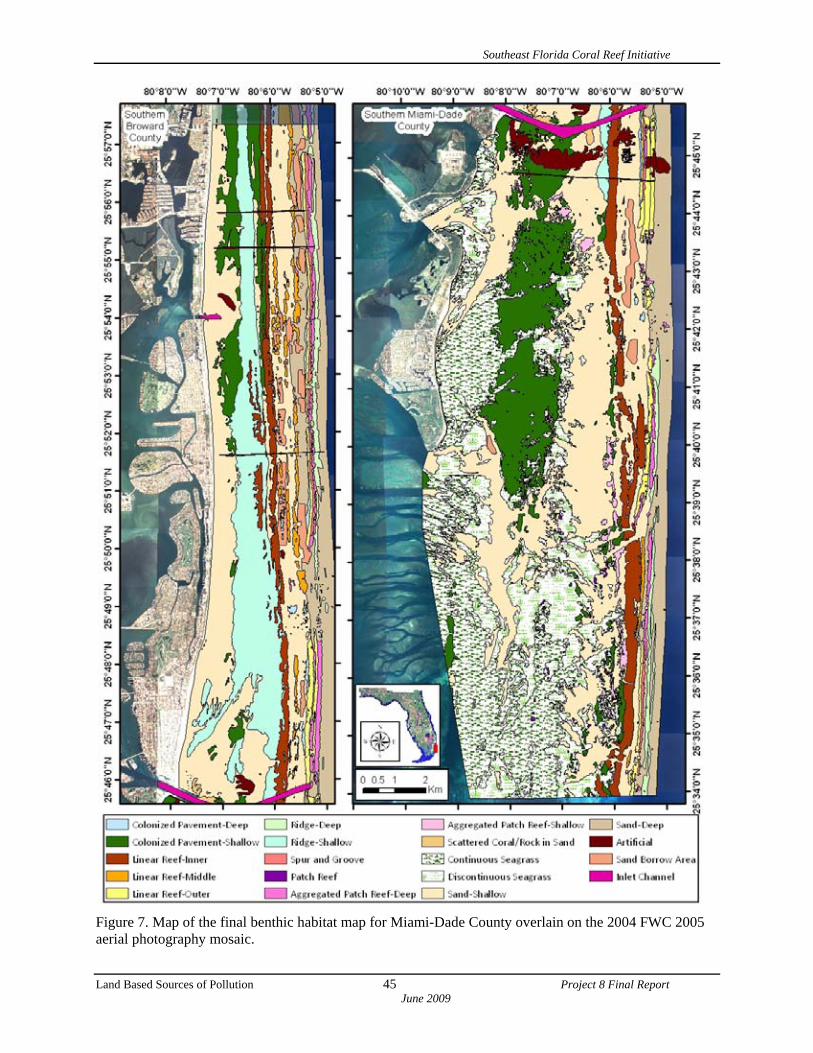
Figure 7. Map of the final benthic habitat map for Miami-Dade County overlain on the 2004 FWC 2005 aerial photography mosaic. ........................................................................................ 45
Figure 8. Stratified random accuracy assessment (AA) video locations (red dots) overlain on the draft benthic habitat map for Miami-Dade County. ...................................................................... 46
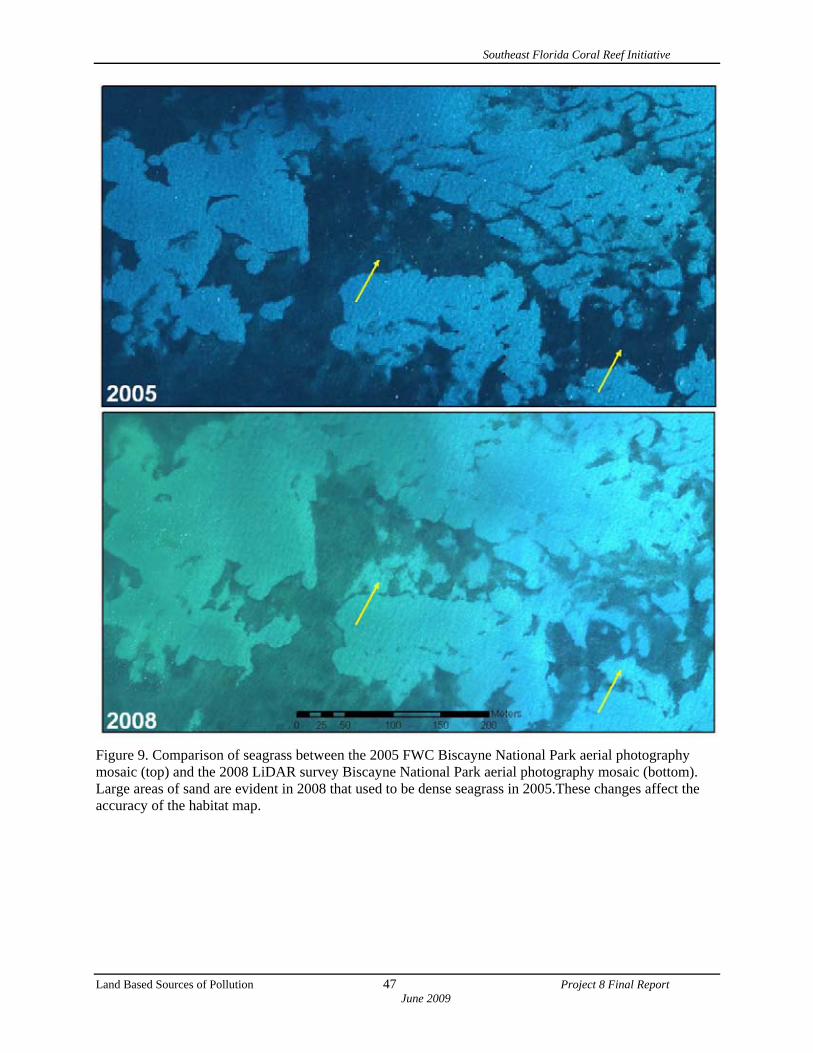
Figure 9. Comparison of seagrass between the 2005 FWC Biscayne National Park aerial photography mosaic (top) and the 2008 LiDAR survey Biscayne National Park aerial photography mosaic (bottom). Large areas of sand are evident in 2008 that used to be dense seagrass in 2005.These changes affect the accuracy of the habitat map. ......................................47
Southeast Florida Coral Reef Initiative
Land Based Sources of Pollution 6 Project 8 Final Report June 2009
INTRODUCTION
Mapping activities in Southeast Florida have progressed substantially in the last few years (Banks et al., 2008; Collier et al., 2008; Walker et al., 2008). High resolution laser bathymetry has been acquired for the nearshore seafloor (<30 m depth) from Fowey Rocks in south Miami-Dade county to Jupiter Inlet in north Palm Beach county. In addition to bathymetry, the benthic habitats have been mapped for all of Broward and Palm Beach counties. The benthic habitat mapping efforts employed a combined-technique approach incorporating laser bathymetry, aerial photography, acoustic ground discrimination (AGD), video groundtruthing, limited subbottom profiling, and expert knowledge (Walker et al., 2008). Nova Southeastern University’s Oceanographic Center (NSUOC) and the National Coral Reef Institute (NCRI) led this effort with interagency funding by National Oceanic and Atmospheric Administration (NOAA), Florida Department of Environmental Protection (FDEP), and Florida Fish and Wildlife Research Institute (FWRI). The maps were produced by outlining the features in the high resolution bathymetric data and classifying the features based on their geomorphology and benthic fauna. In situ data, video camera groundtruthing, and acoustic ground discrimination were used to help substantiate the classification of the habitats using aerial photography and geomorphology. Accuracy assessment of the maps have shown high levels of accuracy comparable to that of using aerial photographs in clear water (Walker et al., 2008).
The Broward and Palm Beach mapping efforts were accomplished using a two phased approach. The first phase was an expert driven visual interpretation of high resolution bathymetry to outline the geomorphological features at a 1:6000 scale with a one acre minimum mapping unit (mmu). The second phase was the analyses of an acoustic ground discrimination survey which was used to further discriminate the sea floor based on the density of organisms. The AGD provided an additional map layer of relative estimated benthic cover density, including benthic cover density of specific groups- gorgonians and macroalgae. These data supplemented the geomorphology-based layer to include not only mapping between features, but also the variability of habitat within features.
This report describes the phase one mapping of the benthic habitats of Miami-Dade County using similar methodologies as the previous benthic habitat maps in Palm Beach and Broward. After the competition of the phase one mapping (this effort), phase two (AGD) can be initiated.
Southeast Florida Coral Reef Initiative
Land Based Sources of Pollution 7 Project 8 Final Report June 2009
METHODOLOGY
The entire subtidal seafloor from 0 to 35 m depth was classified for Miami-Dade County in southeastern Florida (Figure 1). Several data products were integrated for the production of benthic habitat maps. A comprehensive dataset from previous work at the local, state, and federal level was assembled in ArcGIS 9.2 to aid in the seafloor feature identification (Figure 2). Nova Southeastern University Oceanographic Center and the National Coral Reef Institute’s (NSUOC-NCRI) high-resolution hillshaded images of the seafloor using Laser Airborne Depth Sounder (LADS) bathymetry acquired by Miami-Dade County were imported into a GIS. These data were accompanied by many datasets from multiple agencies including US Geological Survey (USGS) and South Florida Water Management District aerial photography, FWRI contour data, FWRI south Florida benthic habitat mapping data, NSUOC-NCRI Broward County benthic habitat data, Southeast Florida Coral Reef Evaluation and Monitoring Program monitoring data, and FWRI artificial reef location data. Miami-Dade County Environmental Resource Management supplied several datasets of point data that were helpful in identifying/confirming reefal areas in several locations. FWRI also fulfilled data requests for imagery. Recent (2005) very high resolution aerial photography for the entire south half of Miami-Dade County was shared by FWRI for habitat mapping. These data were collected by Florida Fish and Wildlife Conservation Commission to complete benthic habitat mapping of Biscayne National Park. The United State Army Corps of Engineers supplied a DVD of GIS data pertaining to their activities with the Government Cut expansion project. Finally, reports, maps, and vibracore were downloaded from the Reconnaissance Offshore Sand Search Oracle database (http://ross.urs-tally.com/database.asp) to help identify sand areas.
Polygons were drawn to previous NOAA-mapping criteria of a 1:6000 scale and a minimum mapping unit of 1 acre (KENDALL et al., 2002) to match the Broward and Palm Beach maps. The final map polygons conformed to the NOAA hierarchical classification scheme used in Puerto Rico and the U.S. Virgin Islands NOAA Technical Memorandum National Ocean Service (NOS) National Centers for Coastal Ocean Science (NCCOS) Center for Coastal Monitoring & Assessment CCMA 152 (KENDALL et al., 2002, 2003) with some modification. The criteria for habitat classification were defined by their location, geomorphologic characteristics, and biologic communities. A high resolution, hill-shaded, raster image of the LADS bathymetry data was used to map feature location and geomorphology of visible features. Aerial photography was used in shallow water to depict the edges of hard grounds, patch reefs, and sea grass extents. Conflicts between data types were resolved by expert-driven interpretation based on the agreement of the majority of data types with an emphasis on the most recent data.
LiDAR Bathymetry
A bathymetric survey was conducted in 2002 by Tenix LADS Corporation of Australia, using the LADS system with a sounding rate of 900 Hz (3.24 million soundings per hour), a position accuracy of 95% at 5-m circular error probable, a horizontal sounding density of 4 m X 4 m, a swath width of 240 m, area coverage of 64 km²h-1, and a depth range of 70 m, depending on water clarity. This survey encompassed all of Miami-Dade County, approximately 44 km linear
Southeast Florida Coral Reef Initiative
Land Based Sources of Pollution 8 Project 8 Final Report June 2009
north-south distance, and from the shore eastward to depths of 40 m, approximately 4 km offshore in the north and 8 km in the south (Figure 3). The entire survey area covered approximately 240 km² of marine habitat. The bathymetric data were gridded by triangulation with linear interpolation, sun shaded at a 45° angle and azimuth, and fused with aerial photography of the land. This final image was used as the foundation for the creation of the benthic habitat maps for Miami Dade County.
FWC Aerial Photography
Aerial photography was flown by PhotoScience Inc. to cover Biscayne Bay in May of 2005. Funding was provided to FWC by South Florida Water Management District (SFWMD) to acquire and process the data. Imagery from the Digital Mapping Camera (DMC) consisted of 316 individual scenes on 9 flight lines at a spatial resolution of 0.3048 m and 5 spectral bands (R,G,B,NIR,Pan). The data were delivered to FWRI to undergo othorectification and mosaicking. Orthorectification and georeferencing was completed to the North American Datum (NAD83) Universal Transverse Mercator (UTM) Zone 17 meters coordinate reference system. Mosaicking was completed at three spatial resolutions (2 m, 10 m and 50 m) with varying color balancing/enhancements, as well as the addition of a 30 m Landsat satellite image. Also, 54 digital orthophoto quarter-quadrangles (DOQQs) were produced at the full 0.3048 m resolution. The 2 m mosaic was used in this mapping effort (Figure 4).
Groundtruthing
A Sea Viewer 950 underwater color video drop camera with a Sea-trak global positioning system (GPS) video overlay connected to a Garmin Wide Area Augmentation System (WAAS) GPS (~3 m accuracy) was used to collect groundtruthing video data. Groundtruthing target locations were chosen every 150 m in GIS along 7 cross-shelf transects spaced 4.5 to 6 km apart throughout Miami-Dade County for a total of 216 sample sites (Figure 5). Color video was taken at each target location by dropping the camera over the side of a stationary/slowly drifting vessel approximately 0.5-2 m from the bottom. Fifteen second to two minute video clips were recording directly to an 80 GB digital video recorder in MPEG4 video format at 720x480 resolution and 30fps. Video length depended on the habitat type and vessel drift. Videos of large expansive sand habitats were generally short while reef habitats, especially edges, were longer.
The GPS location at the start of each video, at the end of most videos longer than 30 seconds, and at the middle where distinct habitat changes occurred were entered into a database and plotted in GIS. These data were also categorized according to major habitat type at each location (Figure 6). This resulted in a GIS point layer of 380 locations along the 7 cross-shelf transects with the video name and habitat description of each point. These data were then used to correct any false categorizations in the polygonal habitat layer and to determine how to map the nearshore habitats, especially in the southern part of the county.
Southeast Florida Coral Reef Initiative
Land Based Sources of Pollution 9 Project 8 Final Report June 2009
Following the initial groundtruthing, a draft GIS polygon layer was produced by visual interpretation of Light Detection and Ranging (LiDAR) bathymetry, National Park Service (NPS) aerial photography, and the input of supplementary data. The classification scheme was based on original habitat definitions by the NOAA biogeography program as previously adapted for the Broward County habitat mapping (Walker et al., 2008). Then an additional 168 groundtruthing sites were visited to help better understand some areas difficult to resolve from the imagery and LiDAR data giving a total of 607 GPS points at 384 groundtruthing sites throughout Miami-Dade County. After the inclusion of these points, the draft map was fully characterized, meaning no polygons remained without a classification. The draft benthic habitat polygon layer was then rigorously checked for errors and adjacent polygons of the same habitat type and finalized (Figure 7). Polygons that were adjacent to one another of the same type were merged into one seamless polygon with the exception of several features that were purposely left unmerged to indicate a distinction from one another. Finally, the area for each benthic habitat type in the polygon layer was calculated using Hawth’s tools and summarized (Table 1).
Evaluation of the groundtruthing data and the FWRI aerial photography allowed for confident polygons to be drawn in the shallow water habitats. In the southern area of Miami-Dade County, the linear reefs occur further offshore and there was a significant area of sand, sea grass, and low-relief colonized pavement. This area was very difficult to map solely using the LADS bathymetry and relied heavily upon the 2005 FWRI aerial photography.
The area around Government Cut was problematic due to a wide area of mobile rubble and sand near the channel on both sides that was very difficult to define the boundaries. This substrate is also difficult to fit into the classification scheme because it is likely artificial substrate (dredge spoil) that partially or fully covers the surrounding natural hardbottom.
Accuracy Assessment
DATA COLLECTION
Accuracy assessment target locations were determined in ArcGIS 9.2 after the entire draft habitat map was complete. Target locations for the accuracy assessment procedure were determined by a GIS-based, stratified random sampling technique used in other regional mapping efforts (Walker and Foster 2009). The final draft benthic habitat polygons were merged by benthic habitat class so that there was one polygon group per detailed class. 25 points were randomly placed within each detailed class using Hawth’s tools v.3.27 in ArcGIS at a minimum distance of 60 m apart. The analysis was also kept to areas deeper than 2 m to ensure safe navigation and shallower than 45 m. This yielded 400 stratified random accuracy assessment target locations to be analyzed by confusion matrix approach (Figure 8).
Underwater video from a drop camera was taken at each AA target location. This procedure involved the boat positioning itself within 5 m of the target. Then a Sea Viewer 950 underwater color video drop camera with a Sea-trak GPS video overlay connected to a Garmin 76CSx GPS
Southeast Florida Coral Reef Initiative
Land Based Sources of Pollution 10 Project 8 Final Report June 2009
with WAAS correction (<3 m accuracy) was lowered to the bottom. Color video was recorded over the side of the stationary/drifting vessel approximately 0.5-2 m from the seafloor. Fifteen second to two minute video clips were recorded directly to an 80 GB digital video recorder in MPEG4 video format at 720x480 resolution and 30fps. Video length depended on the habitat type and vessel drift. Videos of large expansive sand habitats were generally short while reef habitats, especially edges, were longer. While the video was being recorded, an observer categorized each site according to the video and surrounding area into a database.
A few underwater targets were not accessible by boat or were too deep for the camera to reach the bottom. In these cases, the sites were moved to a more easily accessible area within the same polygon where possible or to another polygon of the same category. This was a rare occurrence.
DATA EVALUATION
The GPS location at the start and end of each video was entered into a database along with the field notes and plotted in GIS resulting in a point layer of approximately 800 locations. These data were then spatially joined to the benthic habitat layer to identify the map classification for each point. Sites that differed between field notes and map classification were evaluated both in GIS and from video to determine possible sources of disagreement.
Statistical analyses to determine the thematic accuracy were derived from Congalton (1991), Hudson and Ramm (1987), and Ma and Redmond (1995). Matrices of user and producer map accuracy error, overall map accuracy error, and the Tau coefficient were generated. The Producer’s error matrix indicates how well the map producer can classify a given habitat type; the User’s error matrix indicates how often map polygons of a certain type are classified correctly; and the Tau Statistic is a measure of the probability that a feature is correctly mapped compared to chance alone. A sampling station was considered correctly classified if the habitat type identified in the field matched the habitat type mapped by the map producer. Overall map accuracy was determined by dividing the total of the correctly classified sampling locations in the error matrix by the total number of sampling locations.
Two benthic habitat classes found in the draft benthic habitat map were excluded from the accuracy analysis; the Inlet Channels and the Sand Borrow Areas. Both are unnatural habitats distinguished by their dredged morphology more than their habitat type.
Classification Scheme
The NOAA hierarchical classification scheme for structure described in NOAA Coral Reef Conservation Program’s (NOAACRCP) “classification scheme for mapping the shallow-water coral ecosystems of southern Florida” (Rohmann, 2008) served as a basis upon which to characterize the specific benthic habitats mapped in Miami-Dade County. NOAA’s classification contains nine reef zones according to the feature’s relationship along the shore (i.e. lagoon, back
Southeast Florida Coral Reef Initiative
Land Based Sources of Pollution 11 Project 8 Final Report June 2009
reef, fore reef, bank/shelf, etc.); however, many of these mapped zones did not apply in the mapped area. The absence of an emergent reef in Southeast Florida precluded mapping zones such as lagoon, back reef, and reef crest. Also our effort was confined to depths between 0 m and 35 m, which excluded the land. The intertidal zone was not distinguished in this project. Thus, all features mapped in this project reside within the Bank/Shelf, Fore Reef, or Bank/Shelf Escarpment zones. Changes to the NOAA scheme included the addition of ridge and sand borrow area categories, the inclusion of “Linear Reef “category in lieu of “Aggregate Reef”, the inclusion and modification of two seagrass categories, and the inclusion of a depth component for many classes. “Linear Reef” was a previous NOAA classifier that was adopted in the Broward and Palm Beach mapping. Its definition fits well with the reef system in southeast Florida and was therefore retained instead of using the more recent NOAA descriptor “Aggregate Reef”. Miami-Dade contained significant areas of mappable seagrass not present in Broward or Palm Beach, therefore two categories of Seagrass were added to the scheme: Continuous and Discontinuous. Acoustic ground discrimination results from Broward and Palm Beach substantiated including a depth component to the colonized pavement, ridge, aggregated patch reef, and sand classes to indicate that habitat on these features varied with water depth in those areas. Furthermore, the acoustic distinction of the linear reefs into different acoustic classes substantiated splitting the “Linear Reef” class into the following three subclasses- Linear Reef-Inner, Linear Reef-Middle, and Linear Reef-Outer. These same classes were used in the Miami-Dade classification scheme. Distinctions on the outer reef between linear reef, spur and groove, and colonized pavement were based on benthic cover as suggested by acoustic seafloor discrimination and geomorphology in the Broward benthic habitat mapping study (Walker et al., 2008). The Linear Reef-Outer was subdivided into four habitats: Aggregated Patch Reef, Spur and Groove, Linear Reef and Colonized Pavement-Deep. The area east of the outer linear reef consisted of a very patchy environment with large patches of reef interspersed amongst the deep sand. These were more prevalent close to the reef and tapered off eastward, becoming sandier. The definition of patch reef was problematic. Research on other definitions revealed that the term is generally not well defined. The main problems were (1) at what size does a patch reef become something else (e.g. Linear Reef) and (2) what is the difference between a small patch of colonized pavement and a patch reef? Brock et al. (2008) recently reported a GIS analysis of 1034 patch reefs east of southern Biscayne Bay. They reported that the planar area of these patch reefs was a mean of 1,111.33 m² ranging from 92.65 m² to 13,678.65 m² and the mean relative relief was 3.48 m ranging from 1.00 m to 11.17m. These criteria were used to guide mapping decisions on whether a feature was a patch reef or colonized pavement. In general, if it had some relief and was small, it was considered an Individual Patch Reef. Coral Reef and Hardbottom: Hardened substrate of unspecified relief formed by the deposition of calcium carbonate by reef building corals and other organisms (relict or ongoing) or existing as exposed bedrock.
Southeast Florida Coral Reef Initiative
Coral Reef and Colonized Hardbottom: Substrates formed by the deposition of calcium carbonate by reef building corals and other organisms. Habitats within this category have some colonization by live coral.
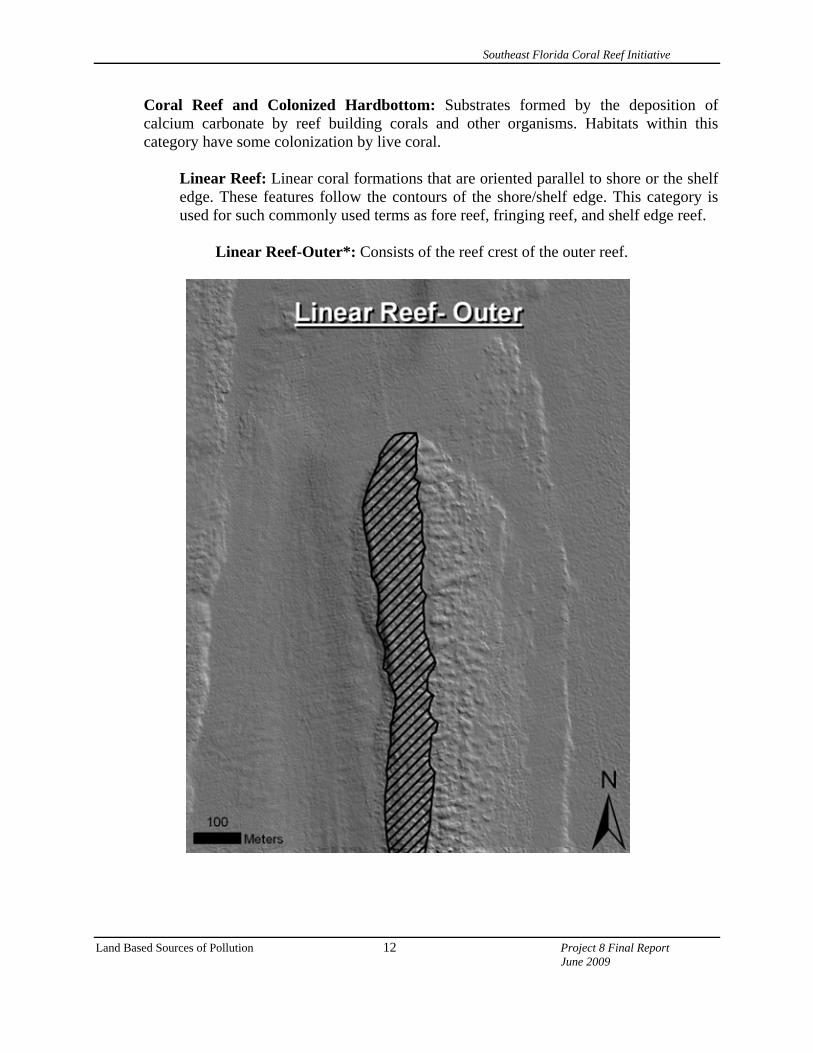
Linear Reef: Linear coral formations that are oriented parallel to shore or the shelf edge. These features follow the contours of the shore/shelf edge. This category is used for such commonly used terms as fore reef, fringing reef, and shelf edge reef.
Linear Reef-Outer*: Consists of the reef crest of the outer reef.
Land Based Sources of Pollution 12 Project 8 Final Report June 2009
Southeast Florida Coral Reef Initiative
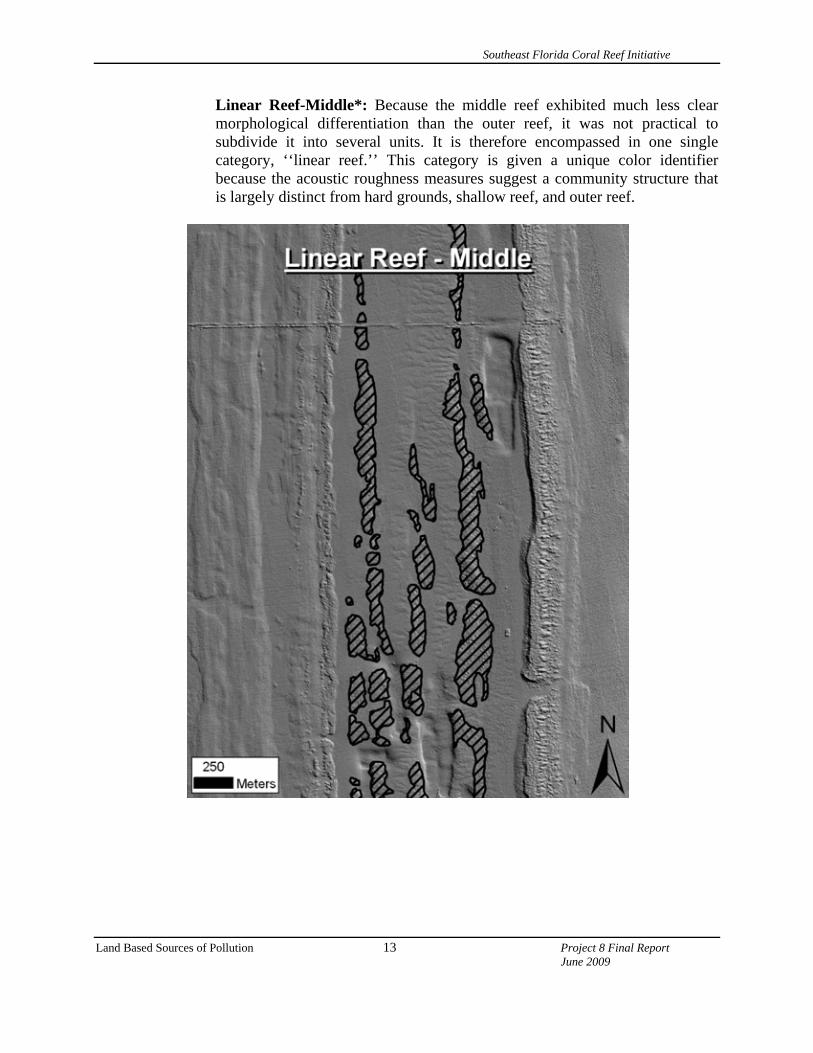
Linear Reef-Middle*: Because the middle reef exhibited much less clear morphological differentiation than the outer reef, it was not practical to subdivide it into several units. It is therefore encompassed in one single category, ‘‘linear reef.’’ This category is given a unique color identifier because the acoustic roughness measures suggest a community structure that is largely distinct from hard grounds, shallow reef, and outer reef.
Land Based Sources of Pollution 13 Project 8 Final Report June 2009
Southeast Florida Coral Reef Initiative
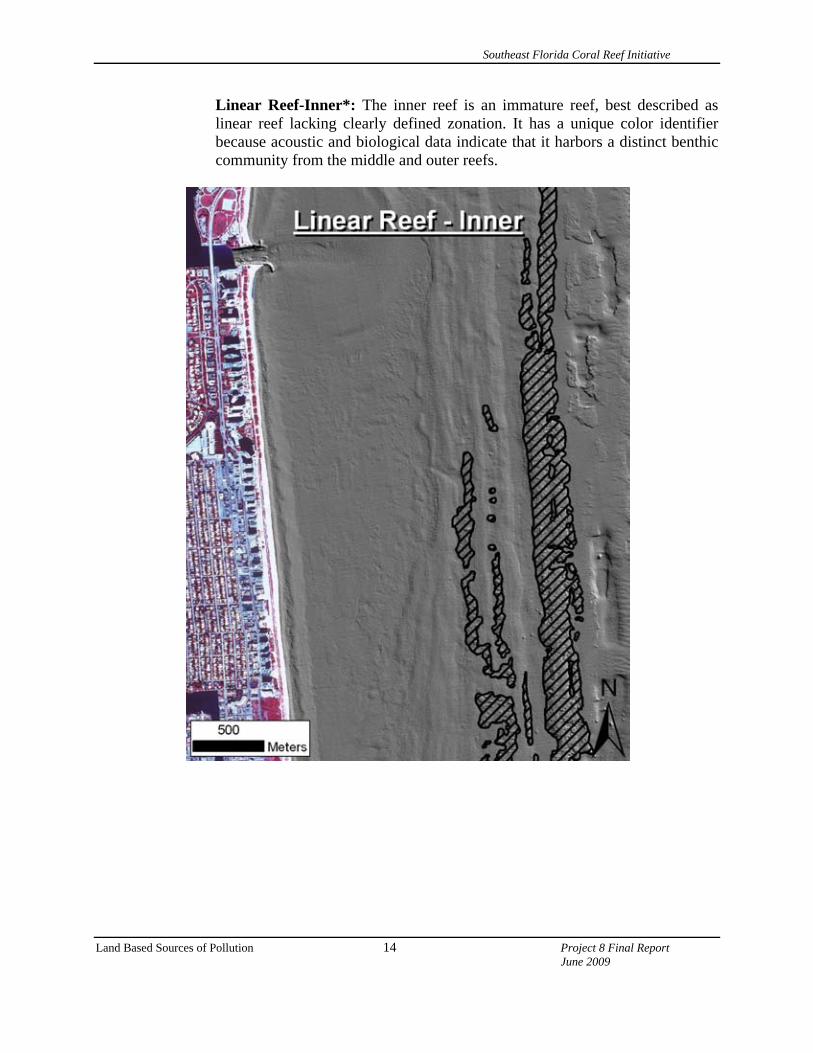
Linear Reef-Inner*: The inner reef is an immature reef, best described as linear reef lacking clearly defined zonation. It has a unique color identifier because acoustic and biological data indicate that it harbors a distinct benthic community from the middle and outer reefs.
Land Based Sources of Pollution 14 Project 8 Final Report June 2009
Southeast Florida Coral Reef Initiative
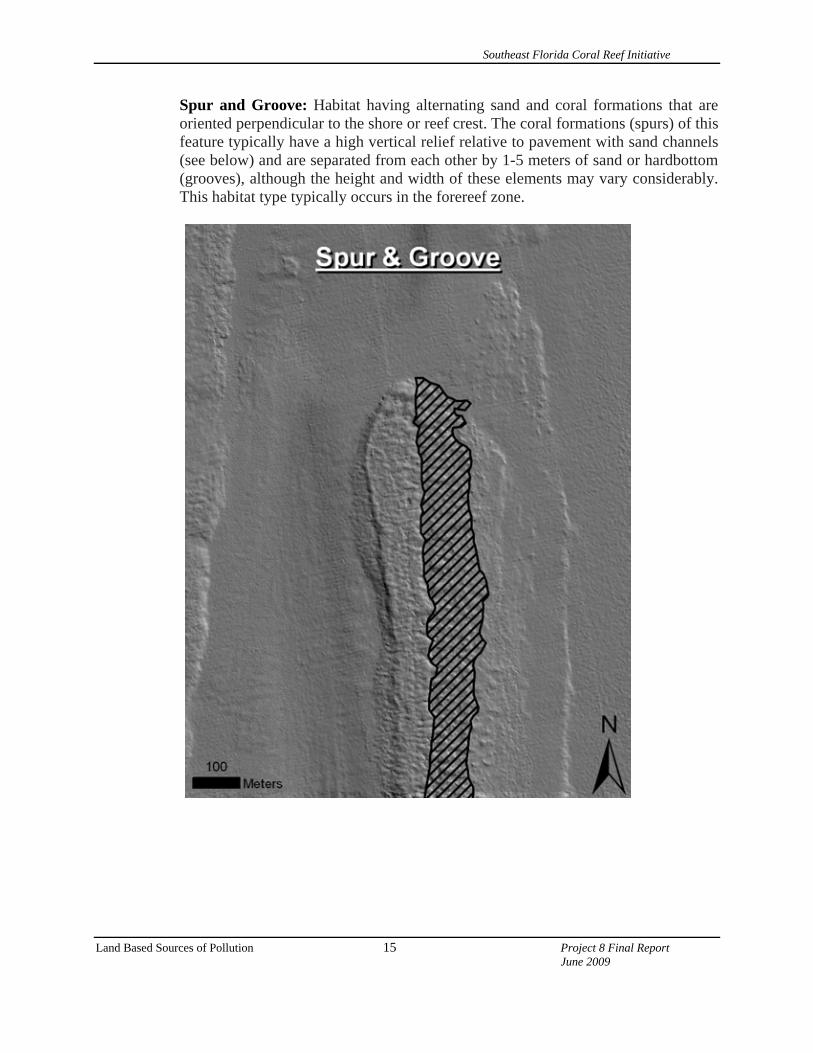
Spur and Groove: Habitat having alternating sand and coral formations that are oriented perpendicular to the shore or reef crest. The coral formations (spurs) of this feature typically have a high vertical relief relative to pavement with sand channels (see below) and are separated from each other by 1-5 meters of sand or hardbottom (grooves), although the height and width of these elements may vary considerably. This habitat type typically occurs in the forereef zone.
Land Based Sources of Pollution 15 Project 8 Final Report June 2009
Southeast Florida Coral Reef Initiative
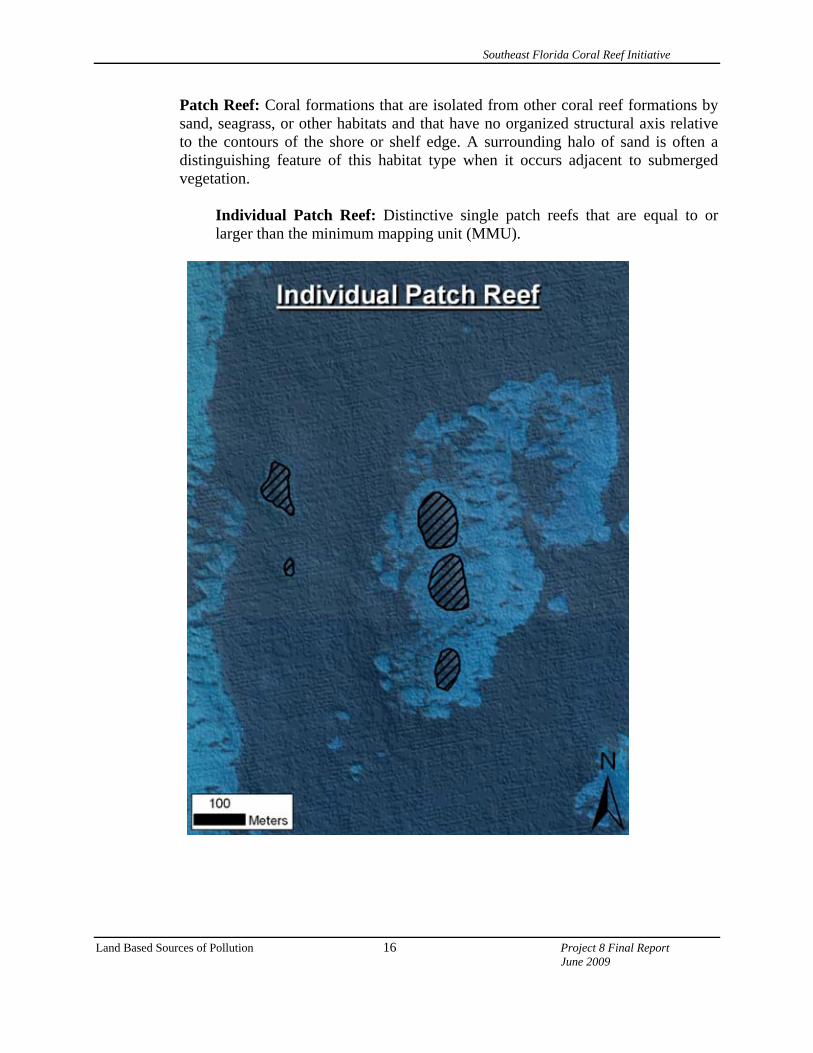
Patch Reef: Coral formations that are isolated from other coral reef formations by sand, seagrass, or other habitats and that have no organized structural axis relative to the contours of the shore or shelf edge. A surrounding halo of sand is often a distinguishing feature of this habitat type when it occurs adjacent to submerged vegetation.
Individual Patch Reef: Distinctive single patch reefs that are equal to or larger than the minimum mapping unit (MMU).
Land Based Sources of Pollution 16 Project 8 Final Report June 2009
Southeast Florida Coral Reef Initiative
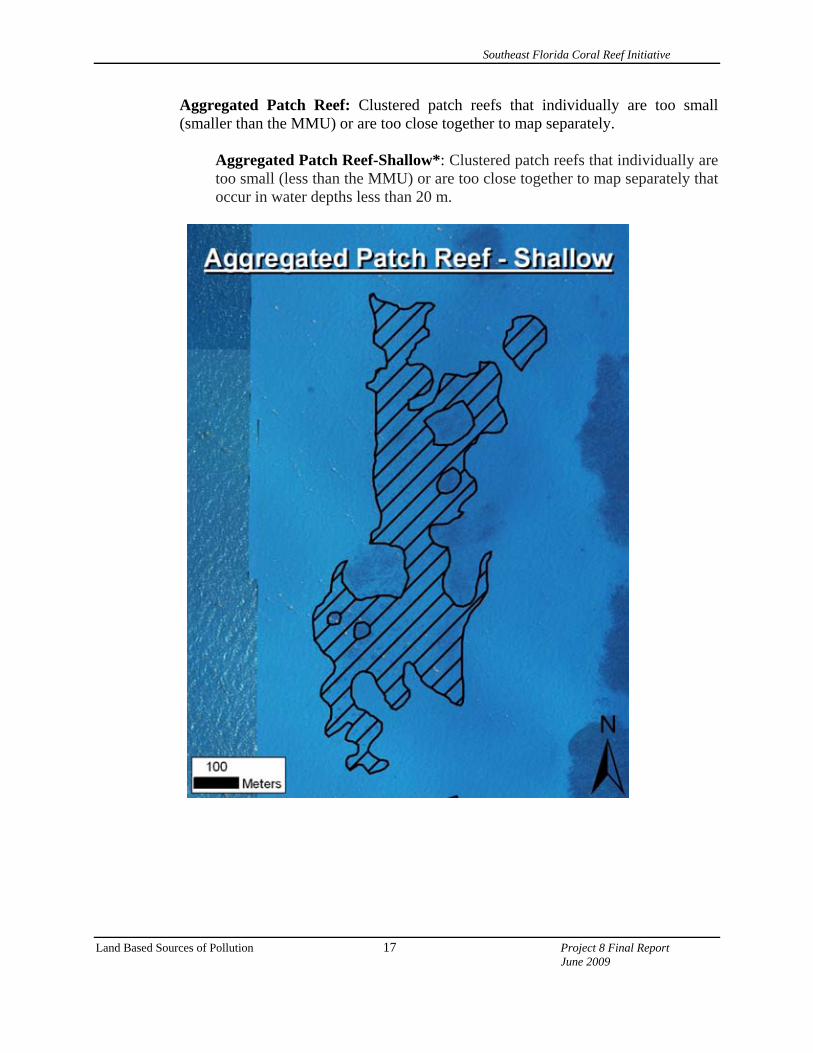
Aggregated Patch Reef: Clustered patch reefs that individually are too small (smaller than the MMU) or are too close together to map separately.
Aggregated Patch Reef-Shallow*: Clustered patch reefs that individually are too small (less than the MMU) or are too close together to map separately that occur in water depths less than 20 m.
Land Based Sources of Pollution 17 Project 8 Final Report June 2009
Southeast Florida Coral Reef Initiative
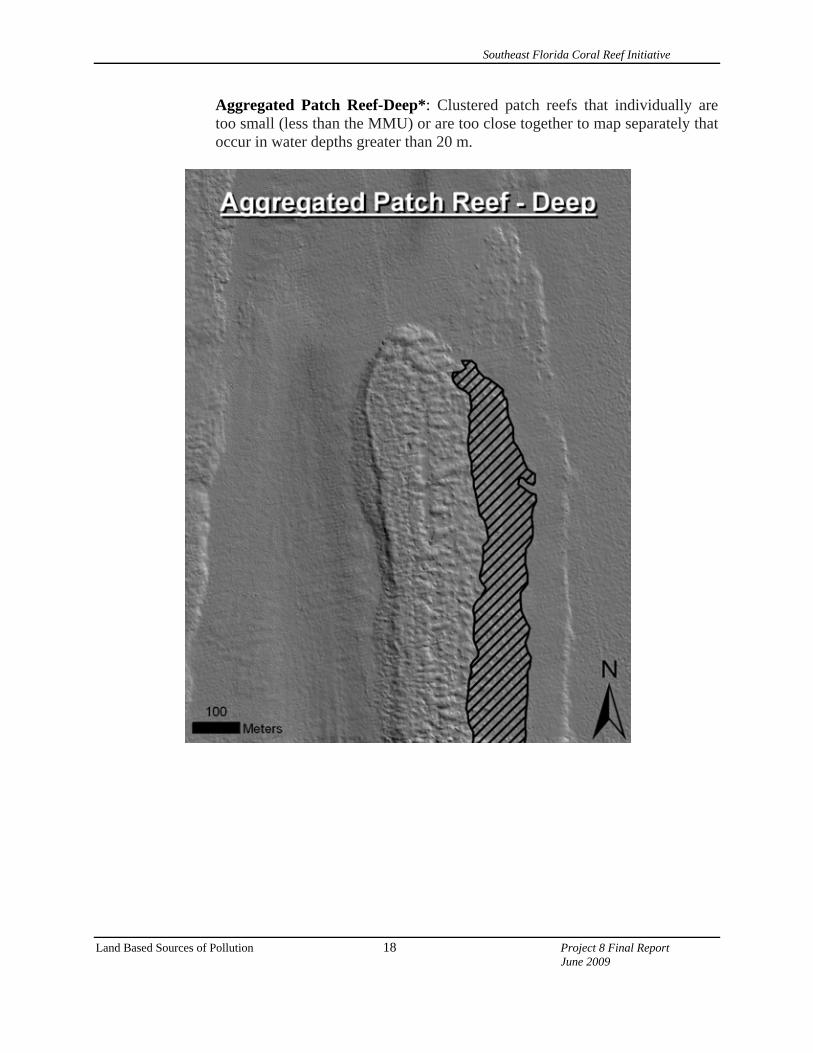
Aggregated Patch Reef-Deep*: Clustered patch reefs that individually are too small (less than the MMU) or are too close together to map separately that occur in water depths greater than 20 m.
Land Based Sources of Pollution 18 Project 8 Final Report June 2009
Southeast Florida Coral Reef Initiative
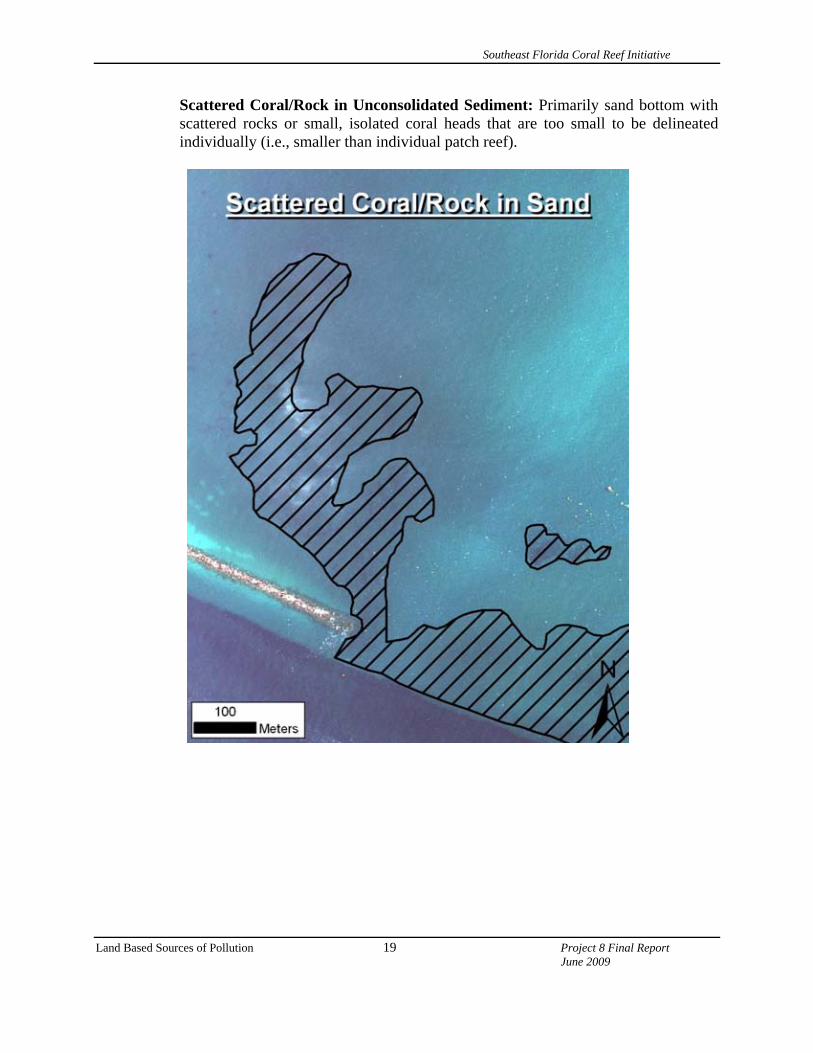
Scattered Coral/Rock in Unconsolidated Sediment: Primarily sand bottom with scattered rocks or small, isolated coral heads that are too small to be delineated individually (i.e., smaller than individual patch reef).
Land Based Sources of Pollution 19 Project 8 Final Report June 2009
Southeast Florida Coral Reef Initiative
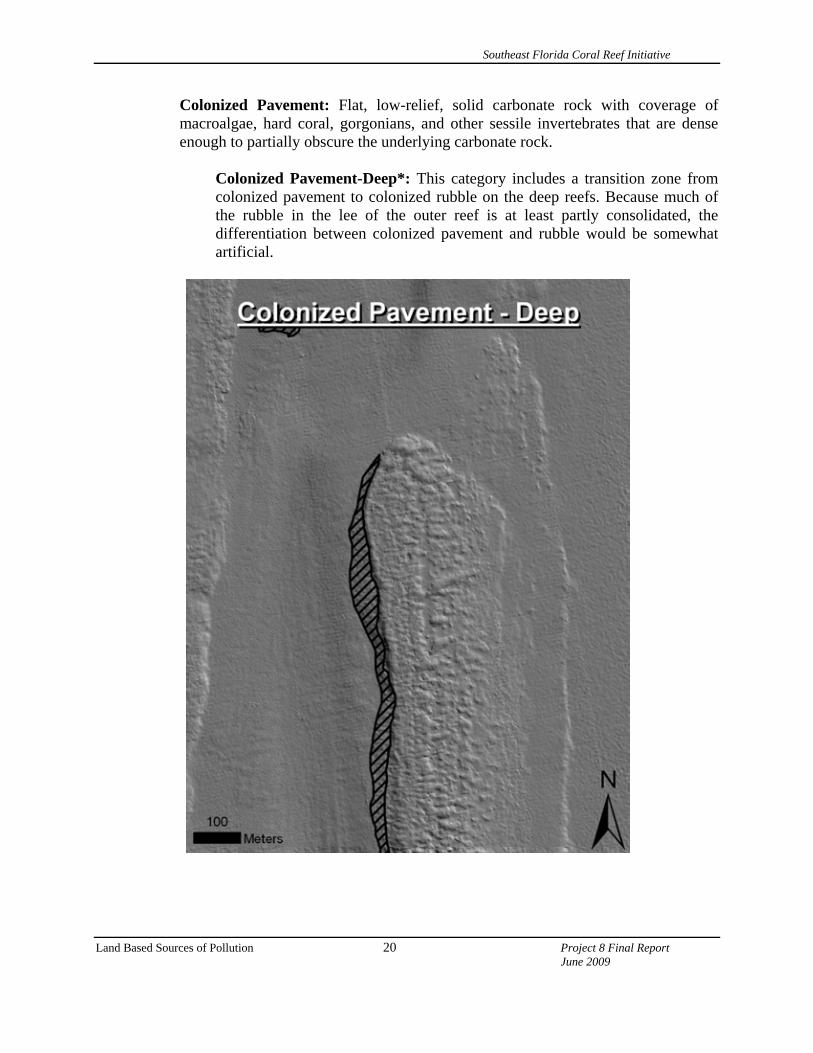
Colonized Pavement: Flat, low-relief, solid carbonate rock with coverage of macroalgae, hard coral, gorgonians, and other sessile invertebrates that are dense enough to partially obscure the underlying carbonate rock.
Colonized Pavement-Deep*: This category includes a transition zone from colonized pavement to colonized rubble on the deep reefs. Because much of the rubble in the lee of the outer reef is at least partly consolidated, the differentiation between colonized pavement and rubble would be somewhat artificial.
Land Based Sources of Pollution 20 Project 8 Final Report June 2009
Southeast Florida Coral Reef Initiative
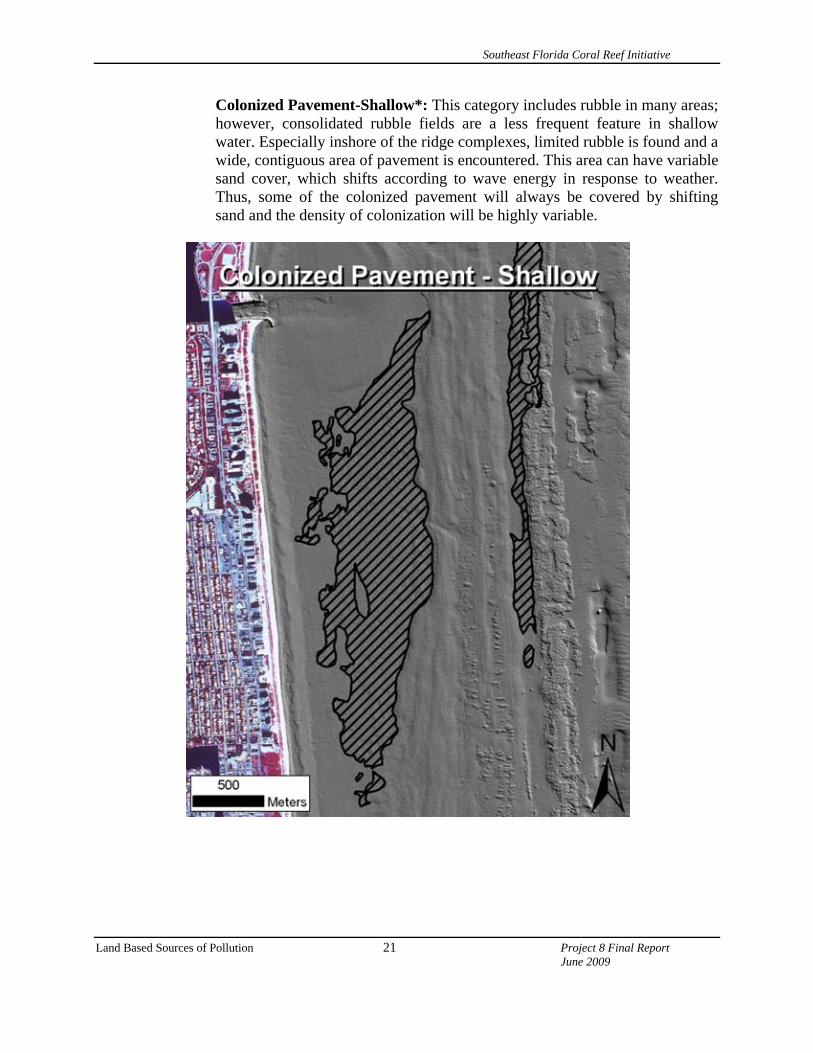
Colonized Pavement-Shallow*: This category includes rubble in many areas; however, consolidated rubble fields are a less frequent feature in shallow water. Especially inshore of the ridge complexes, limited rubble is found and a wide, contiguous area of pavement is encountered. This area can have variable sand cover, which shifts according to wave energy in response to weather. Thus, some of the colonized pavement will always be covered by shifting sand and the density of colonization will be highly variable.
Land Based Sources of Pollution 21 Project 8 Final Report June 2009
Southeast Florida Coral Reef Initiative
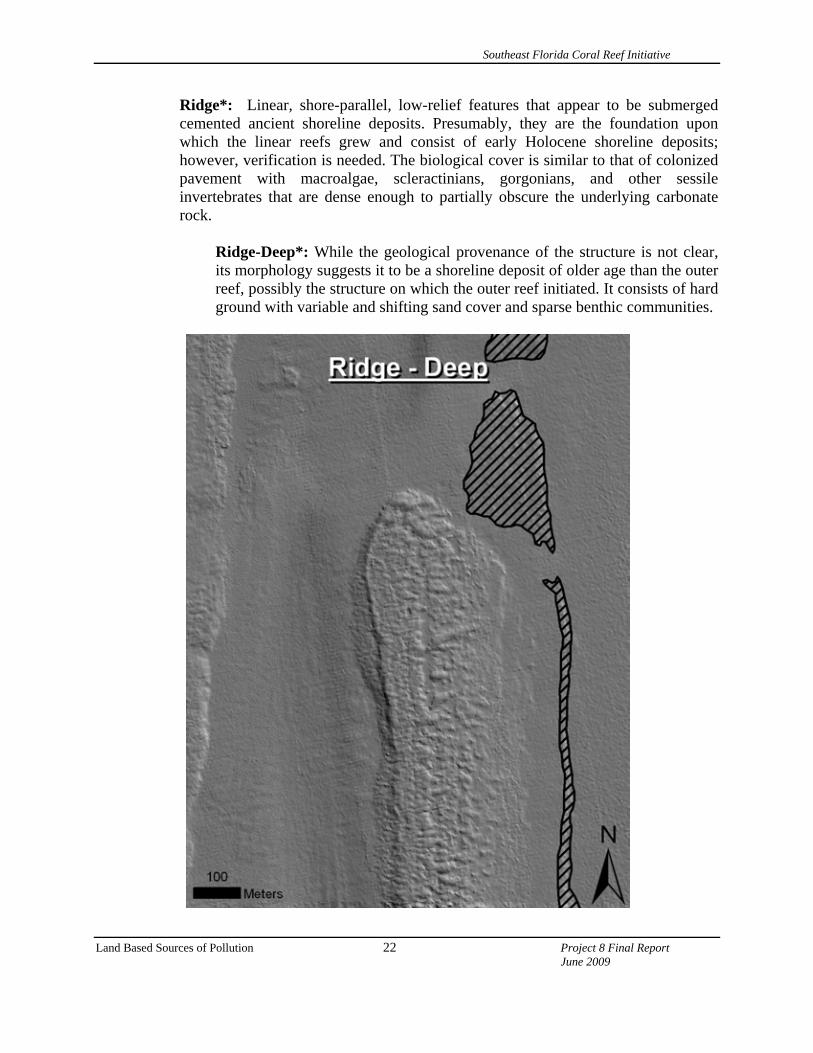
Ridge*: Linear, shore-parallel, low-relief features that appear to be submerged cemented ancient shoreline deposits. Presumably, they are the foundation upon which the linear reefs grew and consist of early Holocene shoreline deposits; however, verification is needed. The biological cover is similar to that of colonized pavement with macroalgae, scleractinians, gorgonians, and other sessile invertebrates that are dense enough to partially obscure the underlying carbonate rock.
Ridge-Deep*: While the geological provenance of the structure is not clear, its morphology suggests it to be a shoreline deposit of older age than the outer reef, possibly the structure on which the outer reef initiated. It consists of hard ground with variable and shifting sand cover and sparse benthic communities.
Land Based Sources of Pollution 22 Project 8 Final Report June 2009
Southeast Florida Coral Reef Initiative
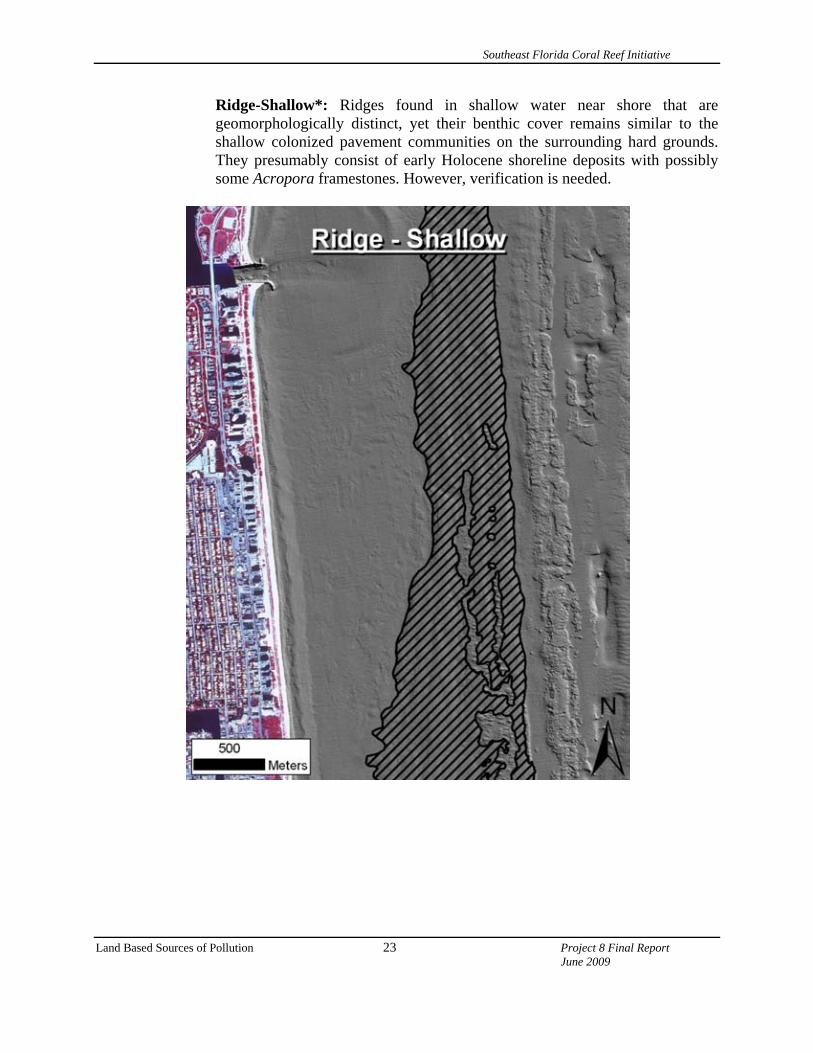
Ridge-Shallow*: Ridges found in shallow water near shore that are geomorphologically distinct, yet their benthic cover remains similar to the shallow colonized pavement communities on the surrounding hard grounds. They presumably consist of early Holocene shoreline deposits with possibly some Acropora framestones. However, verification is needed.
Land Based Sources of Pollution 23 Project 8 Final Report June 2009
Southeast Florida Coral Reef Initiative
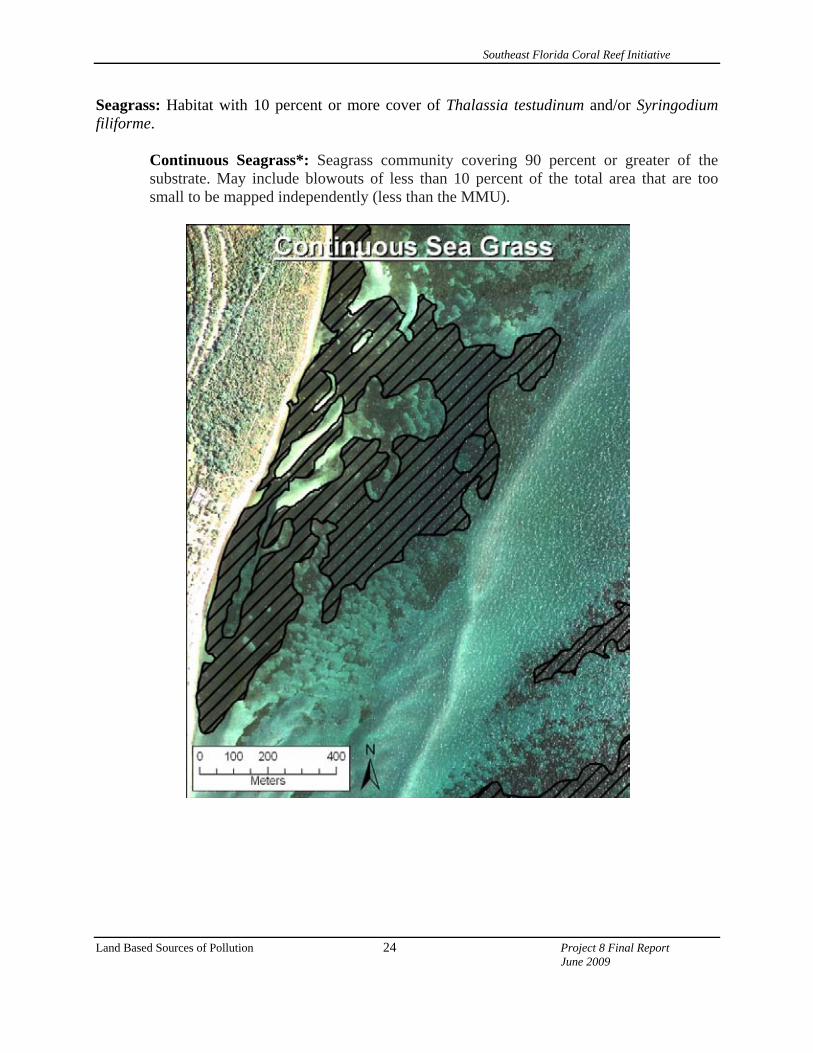
Seagrass: Habitat with 10 percent or more cover of Thalassia testudinum and/or Syringodium filiforme.
Continuous Seagrass*: Seagrass community covering 90 percent or greater of the substrate. May include blowouts of less than 10 percent of the total area that are too small to be mapped independently (less than the MMU).
Land Based Sources of Pollution 24 Project 8 Final Report June 2009
Southeast Florida Coral Reef Initiative
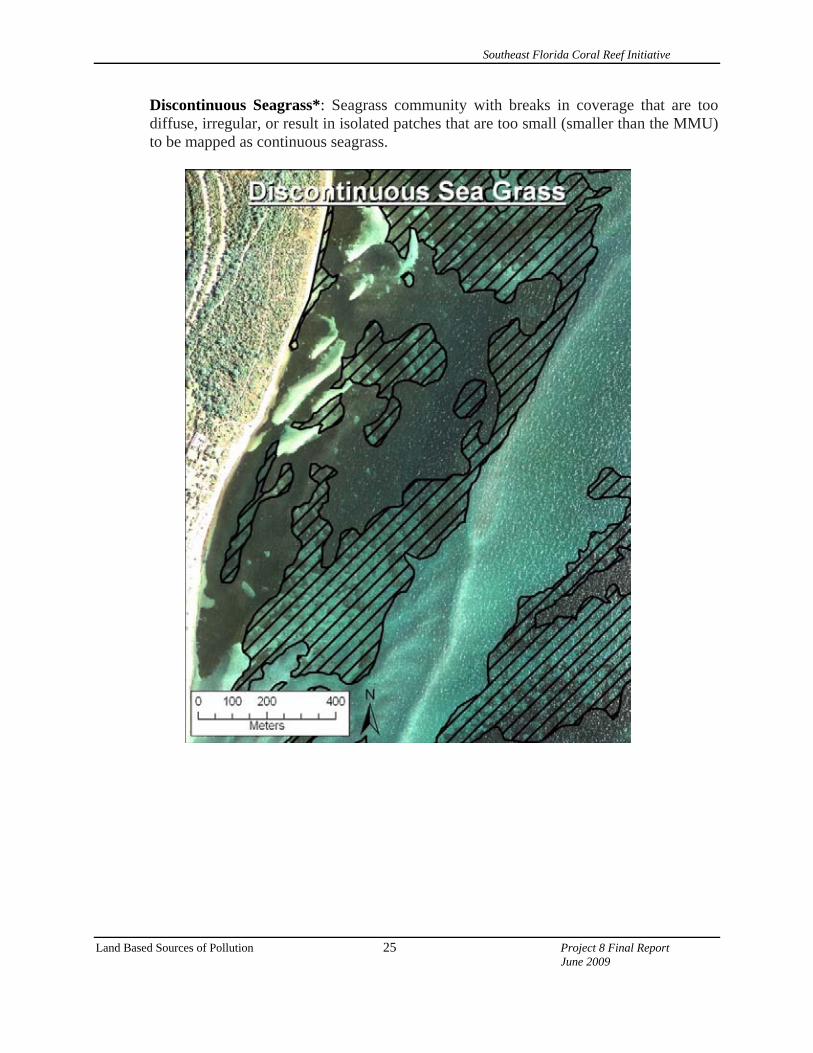
Discontinuous Seagrass*: Seagrass community with breaks in coverage that are too diffuse, irregular, or result in isolated patches that are too small (smaller than the MMU) to be mapped as continuous seagrass.
Land Based Sources of Pollution 25 Project 8 Final Report June 2009
Southeast Florida Coral Reef Initiative
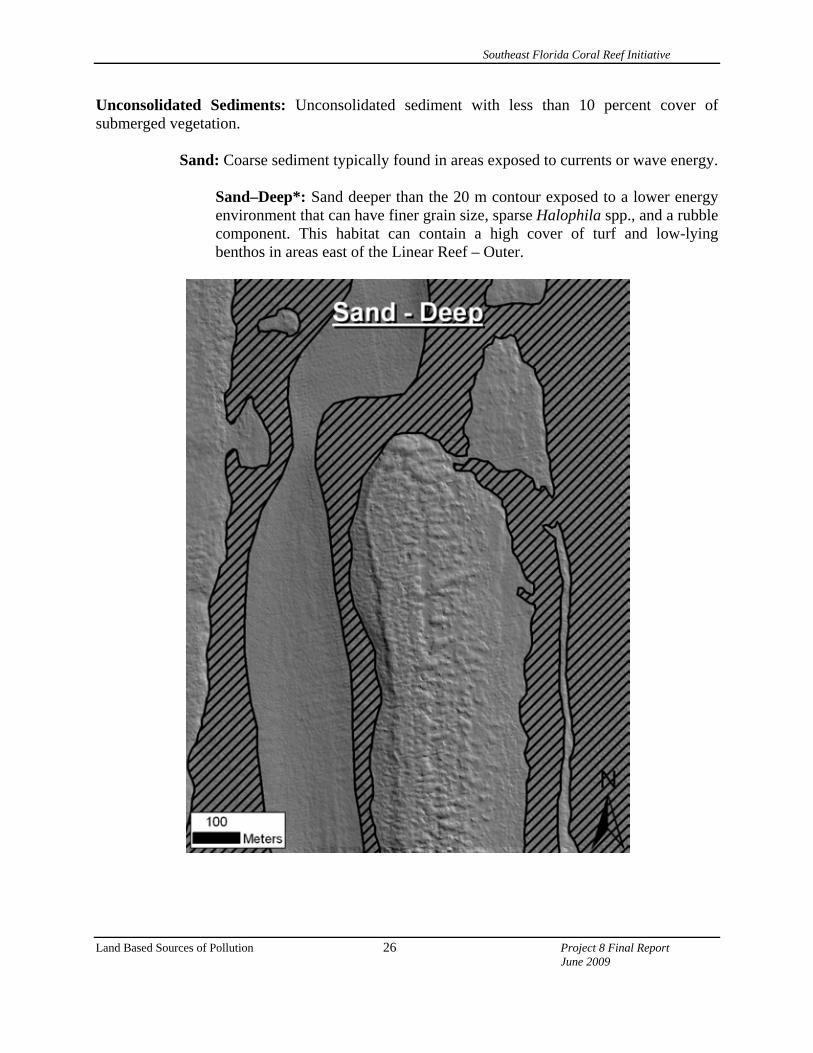
Unconsolidated Sediments: Unconsolidated sediment with less than 10 percent cover of submerged vegetation.
Sand: Coarse sediment typically found in areas exposed to currents or wave energy.
Sand–Deep*: Sand deeper than the 20 m contour exposed to a lower energy environment that can have finer grain size, sparse Halophila spp., and a rubble component. This habitat can contain a high cover of turf and low-lying benthos in areas east of the Linear Reef – Outer.
Land Based Sources of Pollution 26 Project 8 Final Report June 2009
Southeast Florida Coral Reef Initiative
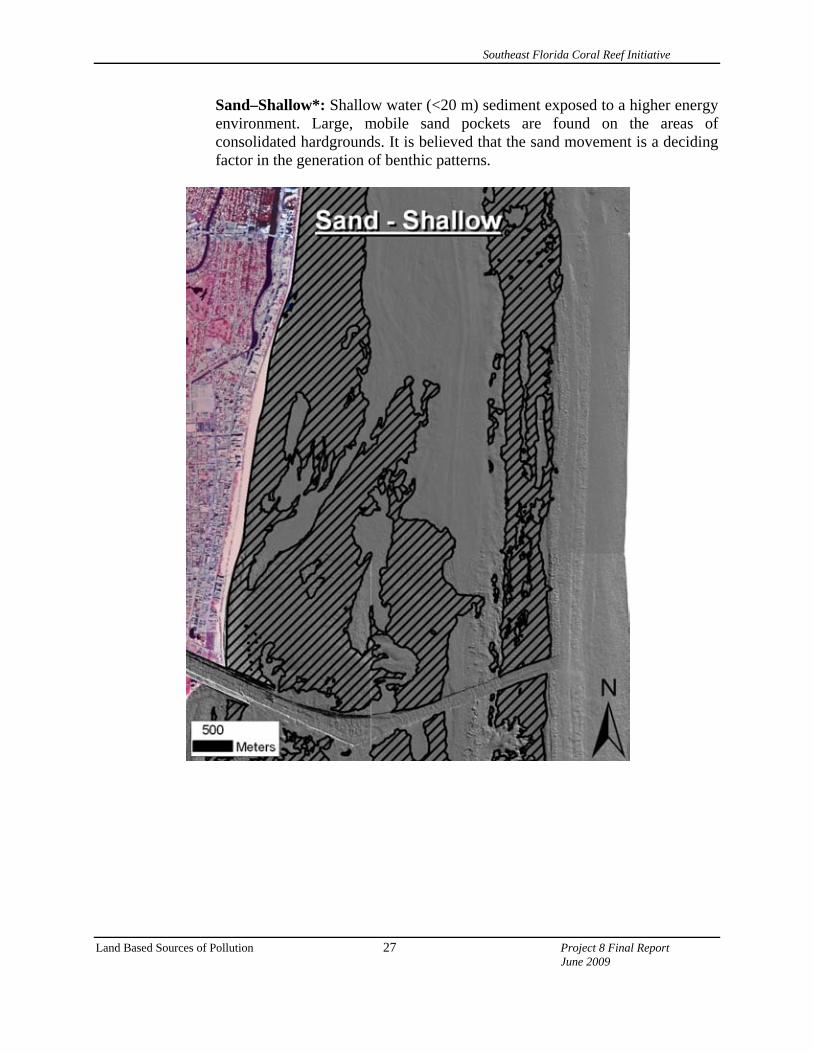
Sand–Shallow*: Shallow water (<20 m) sediment exposed to a higher energy environment. Large, mobile sand pockets are found on the areas of consolidated hardgrounds. It is believed that the sand movement is a deciding factor in the generation of benthic patterns.
Land Based Sources of Pollution 27 Project 8 Final Report June 2009
Southeast Florida Coral Reef Initiative
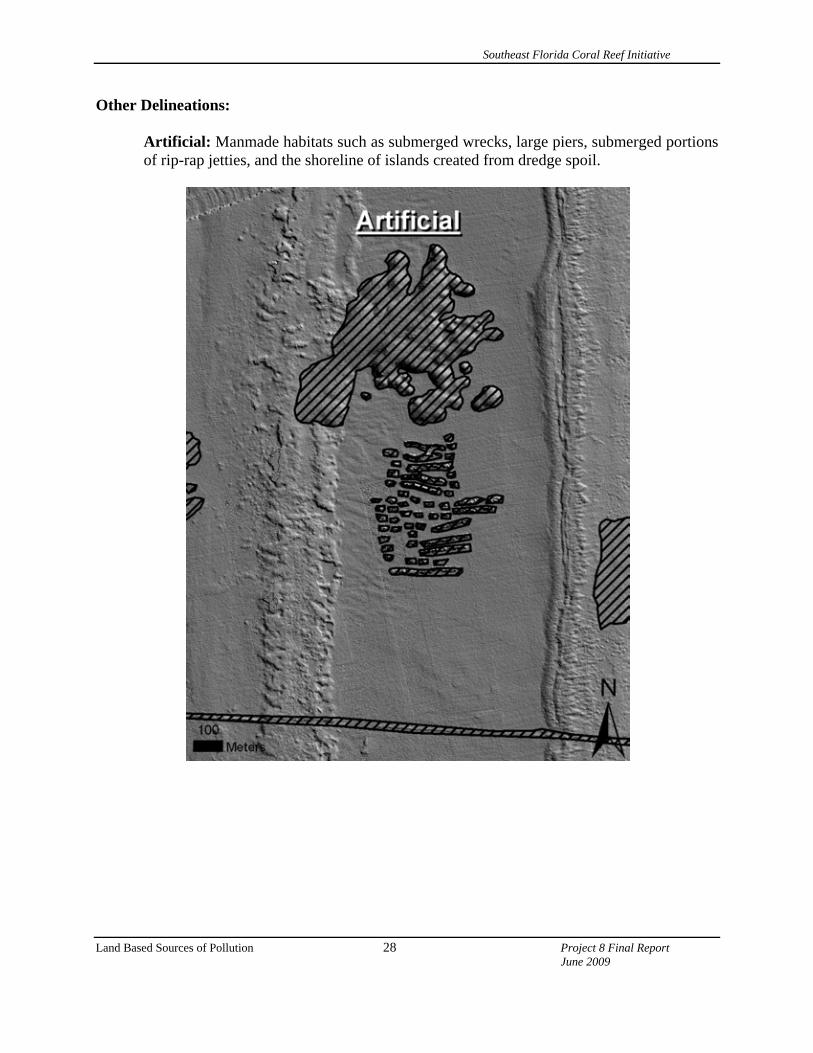
Other Delineations:
Artificial: Manmade habitats such as submerged wrecks, large piers, submerged portions of rip-rap jetties, and the shoreline of islands created from dredge spoil.
Land Based Sources of Pollution 28 Project 8 Final Report June 2009
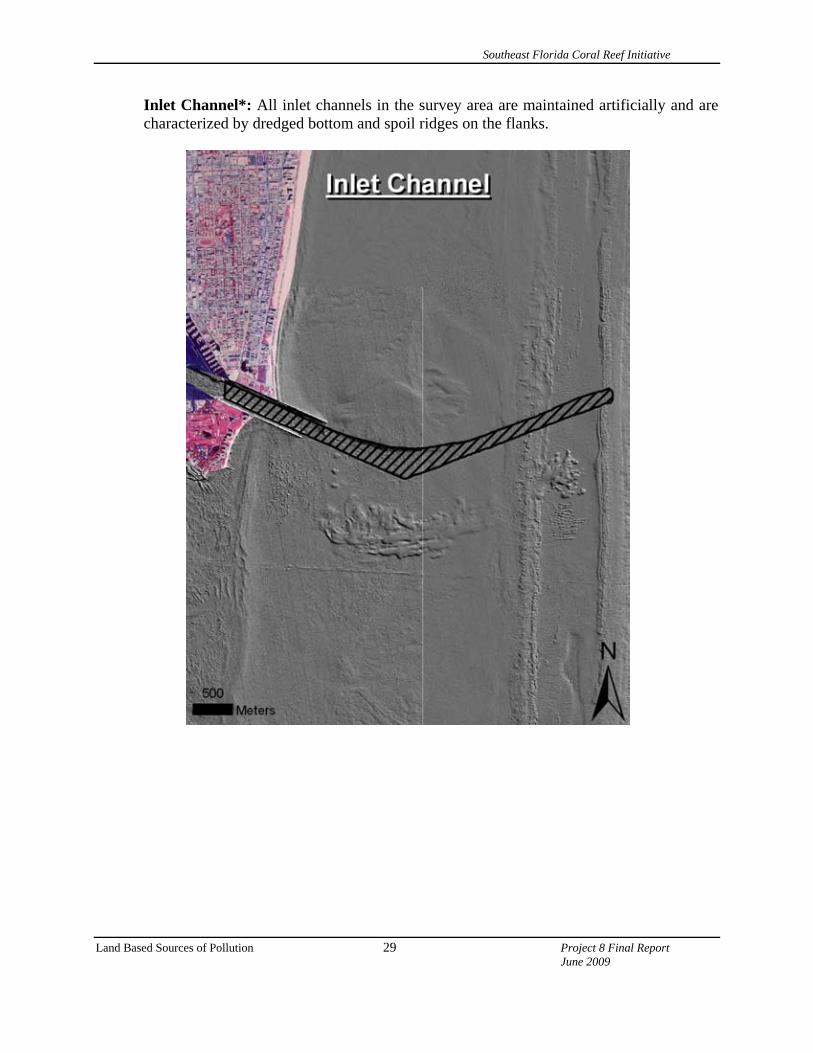
Southeast Florida Coral Reef Initiative
Inlet Channel*: All inlet channels in the survey area are maintained artificially and are characterized by dredged bottom and spoil ridges on the flanks.
Land Based Sources of Pollution 29 Project 8 Final Report June 2009
Southeast Florida Coral Reef Initiative
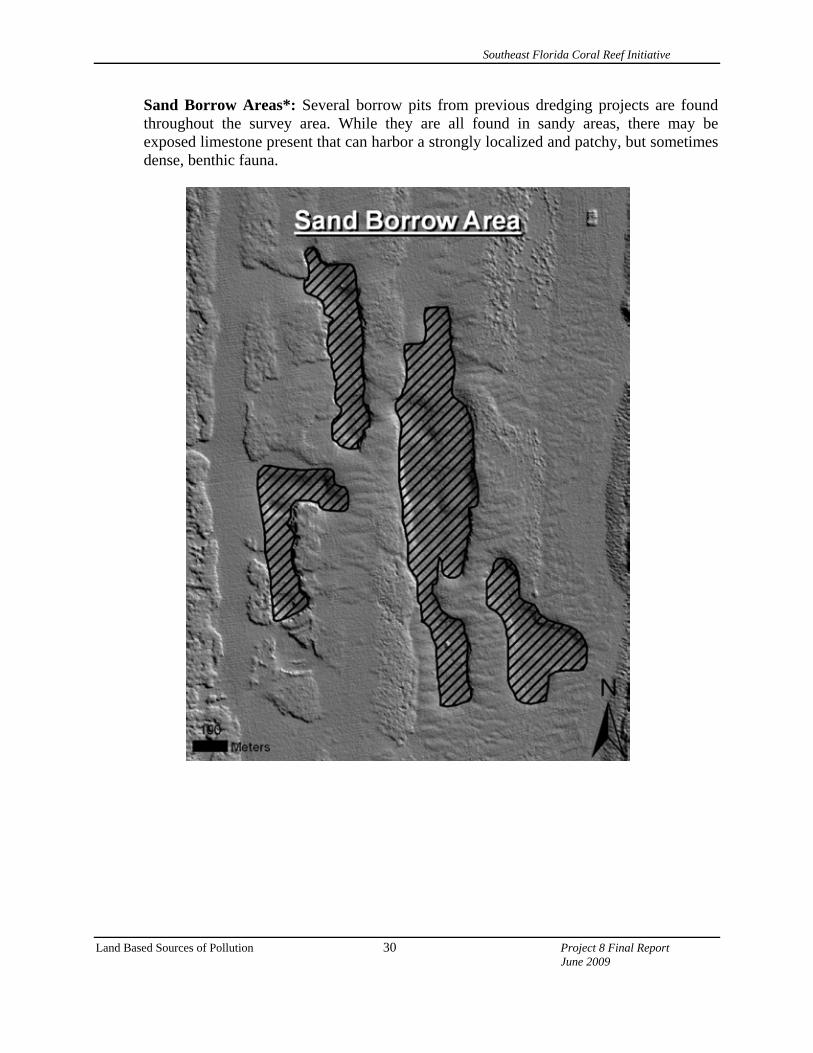
Sand Borrow Areas*: Several borrow pits from previous dredging projects are found throughout the survey area. While they are all found in sandy areas, there may be exposed limestone present that can harbor a strongly localized and patchy, but sometimes dense, benthic fauna.
Land Based Sources of Pollution 30 Project 8 Final Report June 2009
Southeast Florida Coral Reef Initiative
Land Based Sources of Pollution 31 Project 8 Final Report June 2009
RESULTS & DISCUSSION
Sea Floor Morphology In northern Miami-Dade County, the LiDAR bathymetry showed the continuation of three conspicuous shore-parallel linear reef complexes of the Inner, Middle, and Outer reefs extending southward from Broward County (Walker et al., 2008) as well as a wide area (1 km) of Colonized Pavement-Shallow and Ridge-Shallow habitats. The Linear Reef-Outer extended the entire length of the mapped area, however there were significant breaks in some parts including a 3 km gap east of Miami Beach and two 1 km gaps east of Key Biscayne. This was the most well-developed reef along the coast with clear zonation acquired from its ancient history, yet there are portions that were not as developed as others presumably from sand and freshwater inputs from Biscayne Bay (Banks et al., 2008). This was especially evident 2 km south of Key Biscayne where a 3.7 km section was an aggregation of patch reefs that did not develop into a solid single structure. This portion was mapped as Aggregated Patch Reef-Deep and lacked the typical Spur & Groove, Linear Reef-Outer, and Colonized Pavement-Deep zonation of the well-developed sections. The Linear Reef-Middle was a less conspicuous feature in Miami-Dade County than in Broward. In the north, the Linear Reef-Middle was a thin (~100 m) shore-parallel strip that bifurcated a wide sandy plane between the inner and outer reefs. The Linear Reef-Middle became patchier and more spread out east of Haulover inlet and further south. A 2 km gap of absent Linear Reef-Middle was noted east of Miami Beach coincident with the Linear Reef-Outer gap and it was essentially absent south of Government Cut except for a small exposed strip south of Key Biscayne. The Linear Reef-Inner extended the entire length of the mapped area (45.5 km) without any significant natural gaps, the largest of which was 180 m located east of Key Biscayne. This absence of large gaps on the Linear Reef-Inner could be used to infer that significant coastline changes may have occurred between the Linear Reef-Outer and Middle formation and growth and that of the Linear Reef-Inner. Banks et al. (2007) speculated that many reef gaps were likely caused by the location of coastal river outlets. Although it is currently unknown if the large gaps in the middle and outer reefs east of Miami Beach were the result of river effluent or lack of antecedent topography, coastal conditions during the Linear Reef-Inner formation did not appear to significantly interfere with its linear development. The Miami-Dade County coastline contains many latitudinal transition areas along the southeast Florida Reef Tract (SE FRT). Coral reef habitat gets progressively lower from south to north along the SE FRT. The northern terminus of the Linear Reef-Outer is located just south of Palm Beach harbor (Finkl & Andrews, 2008; Banks et al., 2007; Riegl et al., 2005). As one travels south from there, coral reef habitat becomes more abundant with the antecedent topography providing more exposed areas for coral growth. South of Boca inlet the Linear Reef-Middle becomes exposed and south of Hillsboro inlet the Linear Reef-Inner and nearshore ridge
Southeast Florida Coral Reef Initiative
Land Based Sources of Pollution 32 Project 8 Final Report June 2009
complex (Moyer et al., 2003) (a combination of Colonized Pavement-Shallow and Ridge-Shallow) provide extensive nearshore coral reef habitat. From Hillsboro Inlet to 55th street, Miami Beach, approximately 47 km, the shelf remains consistent. However, east of 55th street on Miami Beach, the outer and middle reefs terminate for ~2 km south and all three reefs begin to extend further from shore. South of this point, the shoreline angles more westerly and the shelf and the area of nearshore ridge complex widens. Examination of pre-developed shoreline maps shows this was the site of a previous natural river outlet named Boca Ratones mapped by DeBrahm in 1770 that closed pre-1887 (Cantillo et al., 2000; Chardon, 1982 & 1978; Austin & McJunkin, 1981). There was confusion on the name of this inlet as several maps name it Boca Ratones, White Inlet, and Bear Cut (Austin & McJunkin, 1981). The next transition occurs at Government Cut, south of which the Ridge-Shallow gives way to a wide area of Colonized Pavement-Shallow and the start of extensive seagrass beds dominated by Thalassia testudinum. Interestingly, the distance between the Linear Reef-Inner and Linear Reef-Outer changes at these transitions. North of 55th street (old Boca Ratones oulet), the distance between the reefs averages about 1 km, but south of 55th street it averages about 0.5 km. The Linear Reef-Inner and Linear Reef-Outer reefs get progressively closer until they are converge east of the southern tip of Key Biscayne. This area begins another transition where the Linear Reef-Outer terminates for 3.7 km and only Aggregated Patch Reef-Deep remains. This area also marks the termination of the Colonized Pavement-Shallow and the beginning of numerous shallow Individual Patch Reefs. Here the Linear Reef-Middle becomes evident along with a series of ridges upon which recent corals grow, although reefs in this area do not appear as developed as they are further north. This could be due to high sediment inputs from northern Biscayne Bay (Banks et al., 2007). The Linear Reef-Outer initiates 3.7 km south approximately 85 m east of the Linear Reef-Inner where it retains its mature reef morphology and continuous past Fowey Rocks and throughout the remainder of the mapped area. In this area, the Inner Reef is the most prominent feature and westward of the Inner Reef is dominated by seagrass and unconsolidated sediment. Of the 240.31 km² mapped, the polygon totals indicated 30.7% was Coral Reef and Colonized Pavement, 22.04% was Seagrass, 43.93% was Sand, and 3.33% was Other Delineations; However, these totals were inaccurate due to some habitats having a large mix of sand within. For example, the Discontinuous Seagrass category which comprised 10.97% of the 22.04% seagrass category contained varying ratios of sand to seagrass. Some polygons were mostly seagrass whereas some polygons were mostly sand. In general, the Discontinuous Seagrass class was estimated to contain about 50% seagrass and 50% sand. Therefore, the areas and percentages for the Type and Habitat totals have been adjusted to reflect this. The Discontinuous Seagrass total area was halved and the remainder was added to the Sand-Shallow category. The same adjustment was also made for the Aggregated Patch Reef-Shallow and Deep, except that the Aggregated Patch Reef-Deep remainder was added to Sand-Deep. For Scattered Coral/Rock in Sand, 75% or the area was removed and added to Sand-Shallow. The adjusted percentages are reported in Table 1 as follows: 29.65% Coral Reef and Colonized Pavement, 16.55% Seagrass, 50.47% Sand, and 3.33% Other Delineations.
Southeast Florida Coral Reef Initiative
Land Based Sources of Pollution 33 Project 8 Final Report June 2009
Accuracy Assessment The Miami-Dade accuracy assessment yielded a high level of accuracy (Table 2). Total map accuracy was 93.0%, surpassing the total map accuracy for the Broward (Walker et al., 2008) and Palm Beach maps (Riegl et al., 2005). These results were consistent with other regional accuracy assessments. Kendall et al. (2002) reported a total map accuracy (Kappa) of 93.6% for the NOAA Puerto Rico and Virgin Island mapping effort; only 0.6% higher than the Miami-Dade results. The total map accuracy for Broward County was 89.6% (Walker et al., 2008) and Palm Beach County was 89.2% (Riegl et al., 2005); both over 3% lower than the Miami-Dade results. Finally, the NOAA benthic habitat maps of the lower Florida Keys have recently been assessed at 93.9% total map accuracy for general structure (similar to general habitats) (Walker and Foster, 2009); only 0.9% greater than the Miami-Dade results. Miami-Dade accuracy assessment for the detailed habitat categories showed good user’s and producer’s accuracies with most >90%. Most user’s and producer’s general habitat accuracies were higher as well, all >90% with one exception. The lowest general habitat accuracy was noted in the producer’s accuracy for Unconsolidated Sediments (74.0%). Although the user’s accuracy was quite high (91.5%) with 54 of the 59 reference data locations mapped as Unconsolidated Sediments correct, there were 19 Unconsolidated Sediment reference data locations that were mapped as something else (e.g. Agg. Patch Reef-Shallow). Several factors contributed to this low producer’s accuracy. First, mixed habitat classes (Aggregated Patch Reef-Shallow and Discontinuous Seagrass) contributed to 5 of these 19 errors. These habitats are composed different levels of patchiness between sand and other substrate types. Even though these were mixed classes, the reference data were classified according to the video, notes, and GIS review. If the two substrates were not present in the video, they were regarded as whichever substrate was present. Since the scale of the reference data was smaller than the minimum mapping unit, the reference data didn’t always sample enough area to capture the small patches of other substrate within. Thus 5 reference data locations were regarded as Unconsolidated Sediment, yet they may have been correctly mapped. Another contributing factor for these producer’s errors was depth and lack of feature relief. Nine of the 19 errors occurred in deep habitats where visibility was limited and the only reliable data source was the LiDAR bathymetry. LiDAR bathymetry was very useful in detecting the edges of features with relief; however low relief features such as Colonized Pavement-Deep and Ridge-Deep were problematic. The Ridge-Deep was the most difficult habitat to map and this was reflected in its relatively low user (77.8%) and producer (84.0%) accuracies. Finally, the ephemeral nature of the system, especially in low relief pavement and seagrass habitats, likely contributed to some of the map errors. These habitats can often be covered and uncovered by sand movement during large storm events (Walker et al., 2008; Gilliam 2007). The area in southern Miami-Dade is very dynamic showing large changes over the last few years. Changes are evident when comparing the same area from several years ago in southern Miami-Dade County (Figure 9). The top image is the aerial photograph mosaic acquired by Biscayne National Park in 2005 and the bottom is a mosaic of aerial photography taken in December 2008.
Southeast Florida Coral Reef Initiative
Land Based Sources of Pollution 34 Project 8 Final Report June 2009
In the 3 year period between images, large areas of sand on the order of several thousand square meters are evident that used to be dense seagrass. These types of changes throughout the region can affect the benthic habitat map accuracy and may degrade it over time. LITERATURE CITED AUSTIN, D. F. & MCJUNKIN, D. M. (1981) The Legends of Boca Ratones. The Spanish River
Papers, 9, 11. BANKS, K. W., RIEGL, B. M., RICHARDS, V. P., WALKER, B. K., HELMLE, K. P.,
JORDAN, L. K. B., PHIPPS, J., SHIVJI, M. S., SPIELER, R. E. & DODGE, R. E. (2008) The Reef Tract of Continental Southeast Florida (Miami-Dade, Broward and Palm Beach Counties, USA). Coral Reefs of the USA.
BROCK, J., PALASEANU-LOVEJOY, M., WRIGHT, C. & NAYEGANDHI, A. (2008) Patch-
reef morphology as a proxy for Holocene sea-level variability, Northern Florida Keys, USA. Coral Reefs, 27, 555-568.
CANTILLO, A. Y., HALE, K., COLLINS, E., PIKULA, L. & CABALLERO, R. (2000)
Biscayne Bay: Environmental History and Annotated Bibliography. NOAA Technical Memorandum NOS NCCOS CCMA 145. Silver Spring, Maryland, Pp. 128.
CHARDON, R. E. (1978) Coastal barrier changes, 1779-1867, Biscayne Bay area, Florida.
Geology, 6, 333-336. CHARDON, R. (1982) A Best-Fit Evaluation of DeBrahm's 1770 Chart of Northern Biscayne
Bay, Florida. Cartography and Geographic Information Science, 9, 47-67. COLLIER, C., RUZICKA, R., BANKS, K., BARBIERI, L., BEAL, B., BINGHAM, D.,
BOHNSACK, J., BROOKE, S., CRAIG, N., DODGE, R., FISHER, L., GADBOIS, N., GILLIAM, D., GREGG, L., KELLISON, T., KOSMYNIN, V., LAPOINTE, B., MCDEVITT, E., PHIPPS, J., POULOS, N., PRONI, J., QUINN, P., RIEGL, B., SPIELER, R., WALCZAK, J., WALKER, B. & WARRICK, D. (2008) The State of Coral Reef Ecosystems of Southeast Florida. IN WADDELL, J. E. & CLARKE, A. M. (Eds.) The State of Coral Reef Ecosystems of the United States and Pacific Freely Associated States: 2008. Silver Spring, MD, NOAA Technical Memorandum NOS NCCOS 73. NOAA/NCCOS Center for Coastal Monitoring and Assessment’s Biogeography Team.
CONGALTON, R. G. (1991) A review of assessing accuracy of classifications of remotely
sensed data. Remote Sensing of Environment, 37, 35-46.
Southeast Florida Coral Reef Initiative
Land Based Sources of Pollution 35 Project 8 Final Report June 2009
FINKL, C. W. & ANDREWS, J. L. (2008) Shelf Geomorphology along the Southeast Florida Atlantic Continental Platform: Barrier Coral Reefs, Nearshore Bedrock, and Morphosedimentary Features. Journal of Coastal Research, 24, 823-849.
GILLIAM, D. S. (2007) Southeast Florida Coral Reef Evaluation and Monitoring Project 2007
Year 5 Final Report. Prepared for: Florida Fish and Wildlife Conservation Commission, Fish and Wildlife Research Institute, Florida Department of Environmental Protection. 36 pp. http://www.floridadep.org/coastal/programs/ coral/reports/.
HUDSON, W. D. & RAMM, C. W. (1987) Correct formation of the kappa coefficient of
agreement. Photogrammetric Engineering and Remote Sensing, 53: 421-422. KENDALL, M. S., KRUER, C. R., BUJA, K. R., CHRISTENSEN, J. D., FINKBEINER, M.,
WARNER, R. A. & MONACO, M. E. (2002) Methods used to map the benthic habitats of Puerto Rico and the U.S. Virgin Islands. Silver Spring, MD, NOAA, NOS, NCCOS.
KENDALL, M. S., CHRISTENSEN, J. D. & HILLIS-STARR, Z. (2003) Multi-scale Data Used
to Analyze the Spatial Distribution of French Grunts, Haemulon Flavolineatum, Relative to Hard and Soft Bottom in a Benthic Landscape. Environmental Biology of Fishes, 66, 19-26.
MA, Z. & REDMOND, R. L. (1995) Tau Coefficients for Accuracy Assessment of Classification
of Remote Sensing Data. PHOTOGRAMMETRIC ENGINEERING AND REMOTE SENSING, 61, 435
MOYER, R. P., RIEGL, B., BANKS, K. & DODGE, R. E. (2003) Spatial patterns and ecology
of benthic communities on a high-latitude South Florida (Broward County, USA) reef system. Coral Reefs, 22, 447-464.
RIEGL, B., WALKER, B., FOSTER, G., & FOSTER, K. (2005) Development of GIS maps for
Southeast Florida Coral Reefs. Florida Department of Environmental Protection. Report DEP AGREEMENT NO. G0098; NOAA Award NA03NOS4190209.
ROHMANN, S. O. (2008) A Classification Scheme for Mapping the Shallow-water Coral
Ecosystems of Southern Florida, Version 3.2, 20 June 2008. NOAA CRCP. WALKER, B. K., RIEGL, B., & DODGE, R. E. (2008) Mapping coral reef habitats in southeast
Florida using a combined technique approach. Journal of Coastal Research, 24, 1138-1150.
WALKER, B. K. & FOSTER, G. (2009) Accuracy Assessment and Monitoring for NOAA Florida Keys mapping AA ROI-1 (Hawk Channel near American Shoal). Silver Spring, MD, Prepared for the Office of National Marine Sanctuaries NOS/NOAA.
Southeast Florida Coral Reef Initiative
Table 1. Miami-Dade County benthic habitat polygon areas. Hierarchical habitats are nested within broader categories to the left. The total area in km² and the percent of the total mapped area are given for each category in all three hierarchical levels. *Type and Habitat totals have been adjusted for more precise estimates.
Habitat Type Modifier Modifier Area (km²) Type Area (km²) Habitat Area (km²)
Coral Reef and Colonized Hardbottom
Colonized Pavement Deep 0.98 ; 0.41% 25.67 ; 10.68%
71.25* ; 29.65%*
Shallow 24.69 ; 10.27%
Linear Reef Inner 12.01 ; 5.00%
19.29 ; 8.03% Middle 2.69 ; 1.12% Outer 4.58 ; 1.91%
Patch Reef Individual 0.33 ; 0.14%
2.62* ; 1.09%* Aggregated-Deep 2.90 ; 1.21% Aggregated-Shallow 1.68 ; 0.70%
Ridge Deep 3.73 ; 1.55% 22.29 ; 9.27%
Shallow 18.56 ; 7.72% Scattered Coral/Rock in Sand 0.32 ; 0.13% 0.08* ; 0.03%*
Spur and Groove 1.31 ; 0.55% 1.31 ; 0.55%
Seagrass Continuous Seagrass 26.59 ; 11.07% 26.59 ; 11.07%
39.78* ; 16.55%* Discontinuous Seagrass 26.37 ; 10.97% 13.19* ; 5.49%*
Unconsolidated Sediment Sand Deep 23.13 ; 9.63% 121.28* ; 50.47%* 121.28* ; 50.47%*
Shallow 82.42 ; 34.30%
Other Delineations Artificial 3.01 ; 1.25% 3.01 ; 1.25%
7.99 ; 3.33% Inlet Channel 1.16 ; 0.48% 1.16 ; 0.48% Sand Borrow Area 3.82 ; 1.59% 3.82 ; 1.59%
Total Mapped Area (km²) 240.31 ; 100.00%
Land Based Sources of Pollution 36 Project 8 Final Report June 2009
Southeast Florida Coral Reef Initiative
Land Based Sources of Pollution 37 Project 8 Final Report June 2009
Table 2. General Miami-Dade benthic habitat map accuracy assessment confusion matrix. Columns are the field classifications identified at each location and rows are the map classifications at the same location. Diagonal boxes indicate locations of agreement between the field data and map classification.
Reference Data
Coral Reef/ Pavement
Unconsolidated Sediments Seagrass Artificial Row total
User’s Accuracy
Map
ped
Cla
sses
Coral Reef/ Pavement 246 17 3 1 267 92.1%
Unconsolidated Sediments 4 54 1 0 59 91.5%
Seagrass 0 2 49 0 51 96.1%
Artificial 0 0 0 23 23 100.0%
Column Total 250 73 53 24 372 <= Diag
Producer Accuracy 98.4% 74.0% 92.5% 95.8% Tot => 400
Overall Accuracy => 93.0%
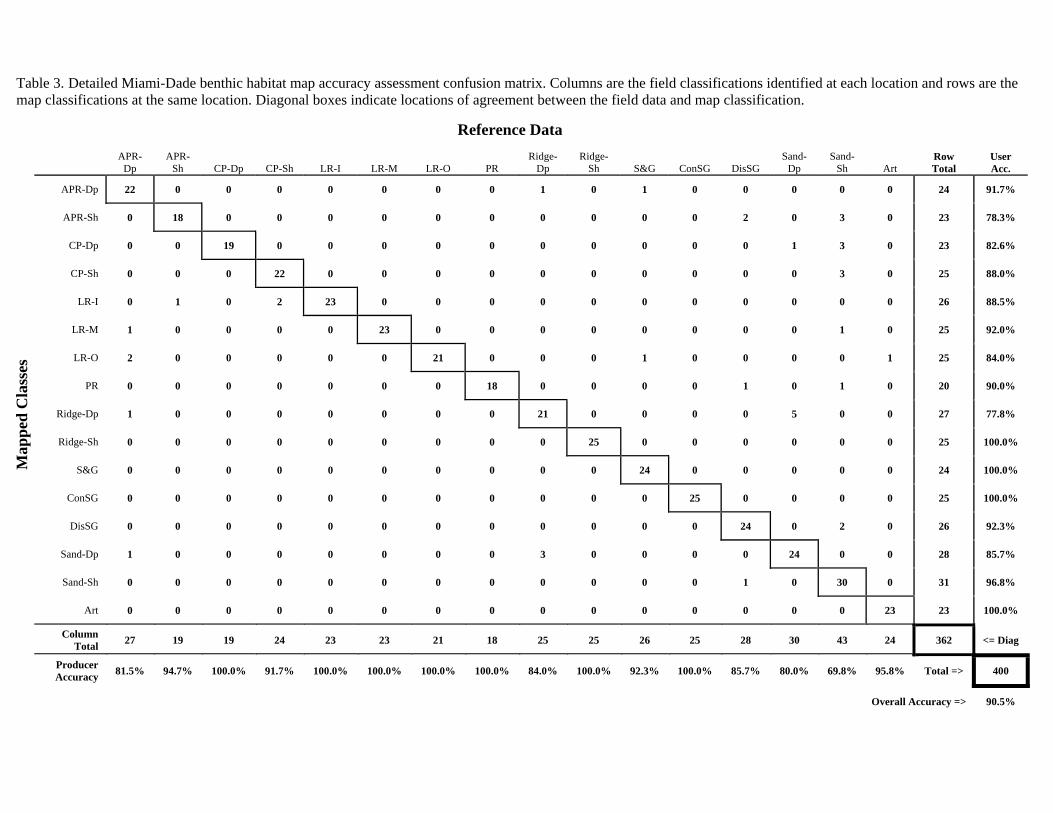
Table 3. Detailed Miami-Dade benthic habitat map accuracy assessment confusion matrix. Columns are the field classifications identified at each location and rows are the map classifications at the same location. Diagonal boxes indicate locations of agreement between the field data and map classification.
Reference Data
APR-
Dp APR-
Sh CP-Dp CP-Sh LR-I LR-M LR-O PR Ridge-
Dp Ridge-
Sh S&G ConSG DisSG Sand-
Dp Sand-
Sh Art Row Total
User Acc.
Map
ped
Cla
sses
APR-Dp 22 0 0 0 0 0 0 0 1 0 1 0 0 0 0 0 24 91.7%
APR-Sh 0 18 0 0 0 0 0 0 0 0 0 0 2 0 3 0 23 78.3%
CP-Dp 0 0 19 0 0 0 0 0 0 0 0 0 0 1 3 0 23 82.6%
CP-Sh 0 0 0 22 0 0 0 0 0 0 0 0 0 0 3 0 25 88.0%
LR-I 0 1 0 2 23 0 0 0 0 0 0 0 0 0 0 0 26 88.5%
LR-M 1 0 0 0 0 23 0 0 0 0 0 0 0 0 1 0 25 92.0%
LR-O 2 0 0 0 0 0 21 0 0 0 1 0 0 0 0 1 25 84.0%
PR 0 0 0 0 0 0 0 18 0 0 0 0 1 0 1 0 20 90.0%
Ridge-Dp 1 0 0 0 0 0 0 0 21 0 0 0 0 5 0 0 27 77.8%
Ridge-Sh 0 0 0 0 0 0 0 0 0 25 0 0 0 0 0 0 25 100.0%
S&G 0 0 0 0 0 0 0 0 0 0 24 0 0 0 0 0 24 100.0%
ConSG 0 0 0 0 0 0 0 0 0 0 0 25 0 0 0 0 25 100.0%
DisSG 0 0 0 0 0 0 0 0 0 0 0 0 24 0 2 0 26 92.3%
Sand-Dp 1 0 0 0 0 0 0 0 3 0 0 0 0 24 0 0 28 85.7%
Sand-Sh 0 0 0 0 0 0 0 0 0 0 0 0 1 0 30 0 31 96.8%
Art 0 0 0 0 0 0 0 0 0 0 0 0 0 0 0 23 23 100.0%
Column Total 27 19 19 24 23 23 21 18 25 25 26 25 28 30 43 24 362 <= Diag
Producer Accuracy 81.5% 94.7% 100.0% 91.7% 100.0% 100.0% 100.0% 100.0% 84.0% 100.0% 92.3% 100.0% 85.7% 80.0% 69.8% 95.8% Total => 400
Overall Accuracy => 90.5%
Southeast Florida Coral Reef Initiative
Land Based Sources of Pollution 39 Project 8 Final Report
Figure 1. Benthic habitat mapping area of interest (red). Area extends from the northern Miami-Dade County line to south of Fowey Rocks into northern Biscayne National Park.
June 2009
Southeast Florida Coral Reef Initiative
Land Based Sources of Pollution 40 Project 8 Final Report
Figure 2. Map of previous GIS data collected to assist in the Miami-Dade benthic habitat mapping. Recent FWC and older USGS aerial photography (not displayed) were also used.
June 2009
Southeast Florida Coral Reef Initiative
Land Based Sources of Pollution 41 Project 8 Final Report
Figure 3. Map of the LiDAR bathymetric survey for Miami-Dade County.
June 2009
Southeast Florida Coral Reef Initiative
Land Based Sources of Pollution 42 Project 8 Final Report
Figure 4. Map of the 2 m resolution FWC 2005 aerial photograph mosaic survey in Miami-Dade County.
June 2009
Southeast Florida Coral Reef Initiative
Land Based Sources of Pollution 43 Project 8 Final Report
Figure 5. Miami-Dade benthic habitat mapping groundtruth sampling locations.216 sites were sampled along 7 cross-shelf transects at 150 m intervals. 168 sites were chosen from hard to interpret areas in the LiDAR and photography data.
June 2009
Southeast Florida Coral Reef Initiative
Land Based Sources of Pollution 44 Project 8 Final Report June 2009
Figure 6. Examples of the video at several groundtruthing points along Line 6 of the cross-shelf transects overlain on the benthic habitat map.
Southeast Florida Coral Reef Initiative
Land Based Sources of Pollution 45 Project 8 Final Report
Figure 7. Map of the final benthic habitat map for Miami-Dade County overlain on the 2004 FWC 2005 aerial photography mosaic.
June 2009

Southeast Florida Coral Reef Initiative
Land Based Sources of Pollution 46 Project 8 Final Report
Figure 8. Stratified random accuracy assessment (AA) video locations (red dots) overlain on the draft benthic habitat map for Miami-Dade County.
June 2009
Southeast Florida Coral Reef Initiative
Land Based Sources of Pollution 47 Project 8 Final Report
Figure 9. Comparison of seagrass between the 2005 FWC Biscayne National Park aerial photography mosaic (top) and the 2008 LiDAR survey Biscayne National Park aerial photography mosaic (bottom). Large areas of sand are evident in 2008 that used to be dense seagrass in 2005.These changes affect the accuracy of the habitat map.
June 2009