Embed Size (px)
Citation preview

Findings Report‐ Weighted Results
…helping organizations make better decisions since 1982
Submitted to the City of Miami Beach, Florida by: ETC Institute 725 W. Frontier Lane Olathe, Kansas 66061
July 2019
City of Miami Beach 2019 Business Survey

Contents
Executive Summary: ............................................................................................... i
Section 1: Charts and Graphs ................................................................................ 1
Section 2: Trend Analysis .................................................................................... 22
Section 3: Importance-Satisfaction Analysis ...................................................... 29
Section 4: Tabular Data ....................................................................................... 35
Section 5: Survey Instrument............................................................................ 107
2019 City of Miami Beach Business Survey: Findings Report
ETC Institute (2019) i
EX
ECU
TIV
E SU
MM
AR
Y
2019 City of Miami Beach Business Survey
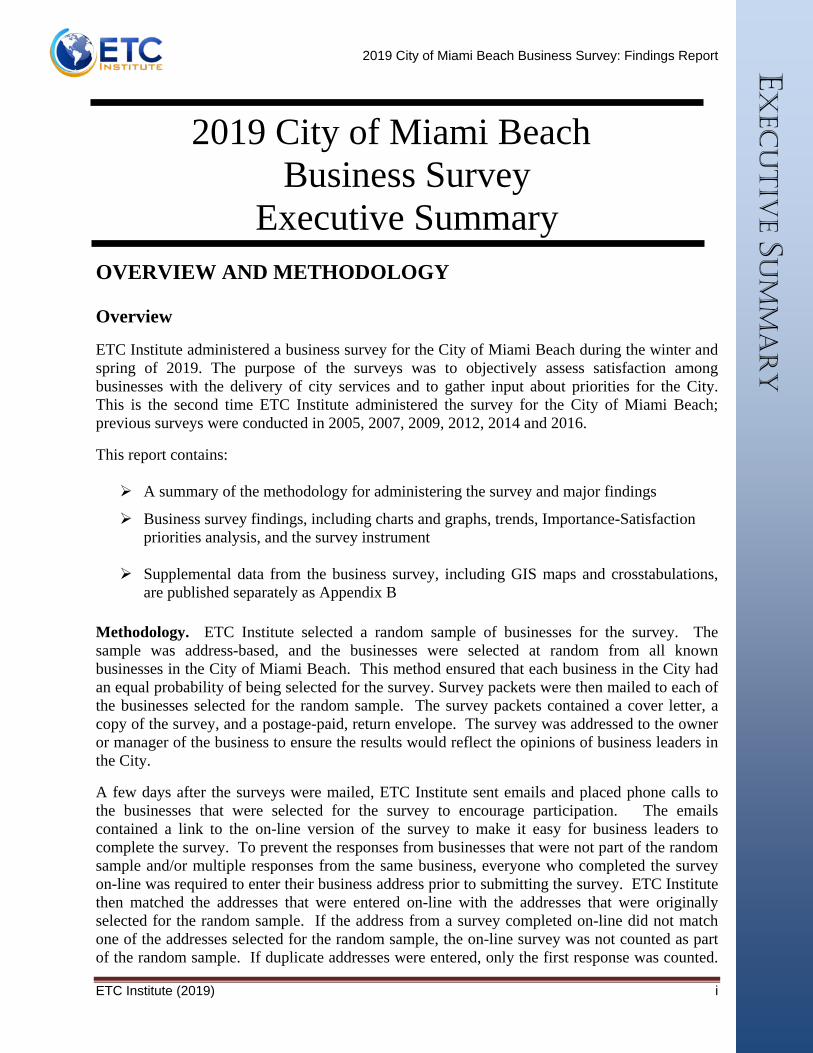
Executive Summary OVERVIEW AND METHODOLOGY Overview
ETC Institute administered a business survey for the City of Miami Beach during the winter and spring of 2019. The purpose of the surveys was to objectively assess satisfaction among businesses with the delivery of city services and to gather input about priorities for the City. This is the second time ETC Institute administered the survey for the City of Miami Beach; previous surveys were conducted in 2005, 2007, 2009, 2012, 2014 and 2016.
This report contains: A summary of the methodology for administering the survey and major findings
Business survey findings, including charts and graphs, trends, Importance-Satisfaction priorities analysis, and the survey instrument Supplemental data from the business survey, including GIS maps and crosstabulations,
are published separately as Appendix B Methodology. ETC Institute selected a random sample of businesses for the survey. The sample was address-based, and the businesses were selected at random from all known businesses in the City of Miami Beach. This method ensured that each business in the City had an equal probability of being selected for the survey. Survey packets were then mailed to each of the businesses selected for the random sample. The survey packets contained a cover letter, a copy of the survey, and a postage-paid, return envelope. The survey was addressed to the owner or manager of the business to ensure the results would reflect the opinions of business leaders in the City.
A few days after the surveys were mailed, ETC Institute sent emails and placed phone calls to the businesses that were selected for the survey to encourage participation. The emails contained a link to the on-line version of the survey to make it easy for business leaders to complete the survey. To prevent the responses from businesses that were not part of the random sample and/or multiple responses from the same business, everyone who completed the survey on-line was required to enter their business address prior to submitting the survey. ETC Institute then matched the addresses that were entered on-line with the addresses that were originally selected for the random sample. If the address from a survey completed on-line did not match one of the addresses selected for the random sample, the on-line survey was not counted as part of the random sample. If duplicate addresses were entered, only the first response was counted.

2019 City of Miami Beach Business Survey: Findings Report
ETC Institute (2019) ii
EX
ECU
TIV
E SU
MM
AR
Y
A total of 604 businesses from the random sample completed the survey: 74 were completed by mail, 207 on-line, and 323 by phone. The results for the random sample of 604 businesses have a 95% level of confidence with a precision rate of at least +/- 4.0%.
Location of Respondents
To better understand how well services are being delivered in different parts of the City, the business addresses of the respondents to the survey were geocoded.
Business Survey Map. The dots on the map below show the distribution of business survey respondents based on the location of their business. Appendix B-1 of the report contains maps that show how respondents in different areas rated a wide range of City services.
MAJOR FINDINGS
Businesses Rate Most of Their Perceptions of the City Higher Than Residents. Sixty-seven percent (67%) of businesses were satisfied with the City’s efforts to prepare for disasters, compared to 62% of residents. Fifty-three percent (53%) of businesses were satisfied with the City’s efforts to be a “green” or sustainable city, compared to 44% of residents. Fifty-three percent (53%) of businesses were satisfied with the City’s efforts to prevent crime, compared to 49% of residents.

2019 City of Miami Beach Business Survey: Findings Report
ETC Institute (2019) iii
EX
ECU
TIV
E SU
MM
AR
Y
Businesses Have a Very High Level of Satisfaction With City Services. More than 90% of businesses rated the City’s fire, emergency medical, and ocean rescue/lifeguard/beach patrol services as “excellent” or “good.” With the exception of addressing homelessness, no more than 17% of businesses indicated the City was doing a poor job in any category of service.

2019 City of Miami Beach Business Survey: Findings Report
ETC Institute (2019) iv
EX
ECU
TIV
E SU
MM
AR
Y
Trends Since 2016. The charts below show trends in all major service categories assessed between 2009 and 2019. Six (6) of the 15 categories stayed the same or showed an increase in ratings between 2016 and 2019.

2019 City of Miami Beach Business Survey: Findings Report
ETC Institute (2019) v
EX
ECU
TIV
E SU
MM
AR
Y
OPPORTUNITIES FOR IMPROVEMENT In order to help the City identify opportunities for improvement, ETC Institute conducted an Importance-Satisfaction (I-S) Priorities Analysis. This analysis examined the importance that businesses placed on each City service and the level of satisfaction with each service. By identifying services of high importance and low satisfaction, the analysis identified which services will have the most impact on overall satisfaction with City services in the future. If the City wants to improve its overall satisfaction rating, the City should prioritize improvements in services with the highest Importance-Satisfaction (I-S) ratings. Details regarding the methodology for the analysis are provided in the Importance-Satisfaction section of this report.
Based on the results of the Importance-Satisfaction (I-S) Priorities Analysis, ETC Institute recommends the following:
• Overall Priorities for the City. This analysis reviewed the importance of and satisfaction with major categories of City services, and was conducted to help set the overall priorities for the City. Based on the results of this analysis, the major services that are recommended by businesses as the top opportunities for improvement in order to raise the City’s overall satisfaction rating are listed below and on the following page in descending order of the Importance-Satisfaction rating:
Efforts to address homelessness Cleanliness of streets near business City’s efforts to manage stormwater

2019 City of Miami Beach Business Survey: Findings Report
ETC Institute (2019) vi
EX
ECU
TIV
E SU
MM
AR
Y
Services That Are Most Important for the City to Provide. When businesses were asked to name the City services that were most important to provide, the sum of their top five choices included:
o Police services o Efforts to address homelessness o Cleanliness of streets near businesses o Efforts to manage stormwater draining/flooding o Garbage/trash collection
For a more detailed analysis of specific departments, please refer to full report. Conclusion Despite some declines in satisfaction since 2016, the overall ratings for Miami Beach remain high among the business community. Ratings increased or stayed the same in 6 of the 15 major services that were assessed in 2016 and 2019. By emphasizing improvements in the areas listed above, the City of Miami Beach should be able to continue to improve levels of customer satisfaction in future years and increase satisfaction in areas where improvements are needed.
Section 1: Charts and Graphs
2019 City of Miami Beach Business Survey: Findings Report (WEIGHTED RESULTS)
ETC Institute (2019) Page 1

Q1. Overall Ratings for the City of Miami Beach by percentage of businesses (excluding “don't know”)
Source: ETC Institute (2019 - Miami Beach Business Survey)
71%70%
64%54%
44%37%
50%53%
35%40%
36%37%36%
30%30%
37%30%31%30%
25%24%25%
15%
24%24%
29%32%
40%44%
30%26%
44%34%
37%36%
34%36%35%26%
32%30%31%
33%34%31%
19%
4%
5%
5%11%
13%17%
12%12%13%
16%19%
15%18%24%
23%26%
24%23%22%
24%29%
28%29%
1%
1%
2%
3%
3%
3%
8%9%8%9%8%
12%12%10%
12%11%
13%16%17%18%
14%17%
37%
Fire services Emergency medical services
Ocean rescue/lifeguard/beach patrol City's emergency/hurricane preparedness
Maintenance of parks Appearance/maintenance of City's public bldgs
Miami Beach trolley systemPolice services
Overall quality of the beaches Reliability of potable (drinking) water
Landscape maintenance in right of way Reliability of sewer (wastewater) services
Street lightingGarbage/trash collection
Condition of streetsMiami Dade County's bus service
Cleanliness of streets near your business Overall quality of customer service
City efforts to keep businesses informed Cleanliness of canals/waterways
Condition of sidewalks (few or no cracks) City's efforts to manage stormwater
Efforts to address homelessness
0% 20% 40% 60% 80% 100%
Excellent (4) Good (3) Fair (2) Poor (1)
Q2. Services That Are Most Important for the City to Provide
41%41%
36%24%
21%19%
19%18%
17%17%17%
15%13%13%
12%10%10%
8%8%
6%5%5%
4%
Police services Efforts to address homelessness
Cleanliness of streets near your business City's efforts to manage stormwater
Garbage/trash collection Condition of sidewalks (few or no cracks)
Condition of streetsStreet lightingFire services
Emergency medical services Overall quality of the beaches
Cleanliness of canals/waterways City efforts to keep businesses informed
Overall quality of customer service Reliability of potable (drinking) water
City's emergency/hurricane preparedness Reliability of sewer (wastewater) services
Miami Beach trolley systemLandscape maintenance in right of way
Miami Dade County's bus serviceOcean rescue/lifeguard/beach patrol
Appearance/maintenance of City's public bldgs Maintenance of parks
0% 10% 20% 30% 40% 50%
Sum of Choices
by percentage of businesses that selected the item as one of its top five choices
Source: ETC Institute (2019 - Miami Beach Business Survey)
2019 City of Miami Beach Business Survey: Findings Report (WEIGHTED RESULTS)
ETC Institute (2019) Page 2
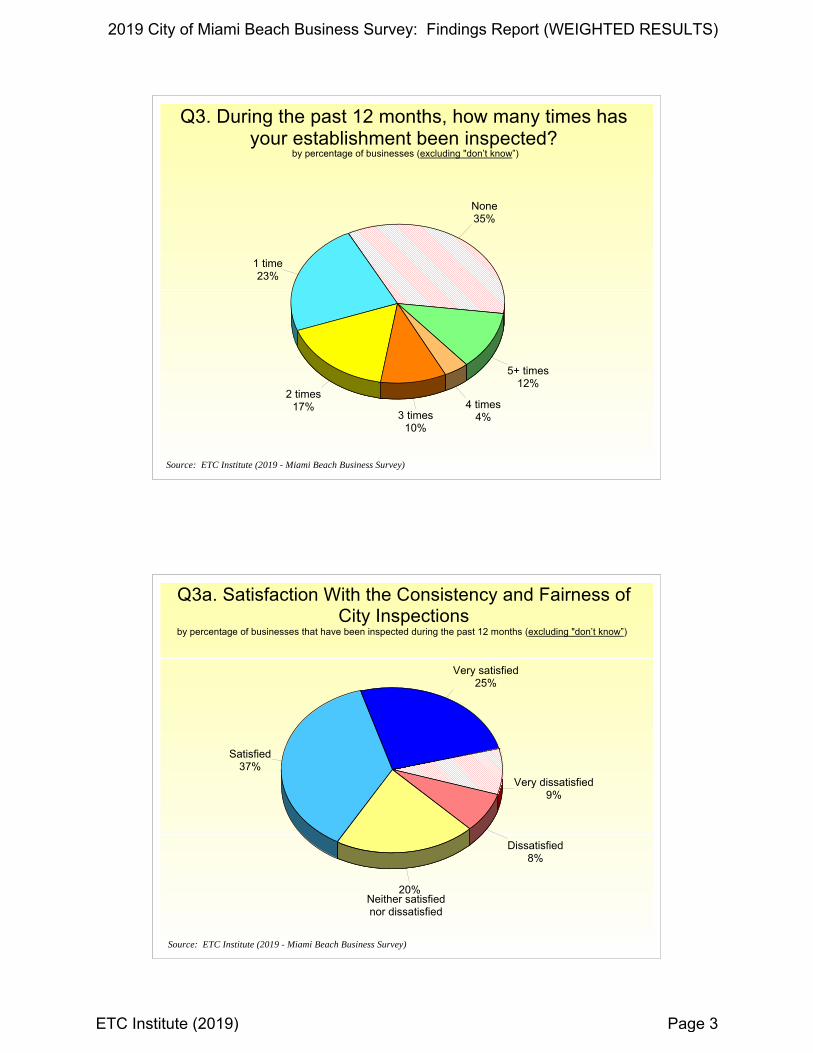
Q3. During the past 12 months, how many times has your establishment been inspected?
by percentage of businesses (excluding "don’t know”)
Source: ETC Institute (2019 - Miami Beach Business Survey)
None35%
1 time23%
2 times17%
3 times10%
4 times4%
5+ times12%
Q3a. Satisfaction With the Consistency and Fairness of City Inspections
Very satisfied25%
Satisfied37%
20%
Dissatisfied8%
Very dissatisfied9%
by percentage of businesses that have been inspected during the past 12 months (excluding "don’t know”)
Source: ETC Institute (2019 - Miami Beach Business Survey)
Neither satisfied nor dissatisfied
2019 City of Miami Beach Business Survey: Findings Report (WEIGHTED RESULTS)
ETC Institute (2019) Page 3

Q4. During the past 3 years, how many times have you contacted or had any direct experience with the
Miami Beach Fire Department?by percentage of businesses (excluding "don’t know”)
Source: ETC Institute (2019 - Miami Beach Business Survey)
None53%
1 time11%
2 times10%
3 times16% 4 times
2%
5 times2%
6+ times7%
Q4a. Level of Agreement With the Following Statements Regarding the Fire Department
64%
64%
60%
60%
60%
51%
51%
21%
25%
25%
27%
27%
21%
29%
24%
44%
8%
9%
9%
8%
7%
14%
17%
19%
4%
3%
4%
6%
12%
6%
7%
16%
Overall experience with City Fire Dept. was good
Fire Dept. employees possess proper knowledge
Easy to contact someone in Fire Dept.
Inspections by Fire Dept. are consistent
The State Fire Code is fair
0% 20% 40% 60% 80% 100%
Strongly Agree (5) Agree (4) Neutral (3) Disagree (2,1)
Employees who assisted me were courteous/professional
Fire Dept. is open & interested in hearing concerns/issues
by percentage of businesses that have been in contact with the Fire Department during the past 3 years (excluding "don’t know”)
Source: ETC Institute (2019 - Miami Beach Business Survey)
Professionalism of Fire Dept. staff conducting State fire code inspections
2019 City of Miami Beach Business Survey: Findings Report (WEIGHTED RESULTS)
ETC Institute (2019) Page 4

Q5. Level of Agreement With the Following Statements Regarding Culture in Miami Beach
44%
34%
38%
32%
36%
37%
36%
26%
28%
23%
13%
20%
16%
17%
16%
6%
11%
21%
22%
24%Major events help my business succeed
0% 20% 40% 60% 80% 100%
Strongly Agree (5) Agree (4) Neutral (3) Disagree (2,1)
by percentage of businesses (excluding "don’t know”)
Source: ETC Institute (2019 - Miami Beach Business Survey)
Cultural activities are family friendly & age appropriate
Museum exhibits/cultural organizations provide enough diverse art & cultural activities
Cultural activities contribute to the success of my business
Free or City sponsored art & cultural activities contribute to the success of my business
Q6. Do you think the Miami Beach Convention Center contributes positively to the overall value of doing
business in Miami Beach?by percentage of businesses (excluding "don’t know”)
Yes84%
No16%
Source: ETC Institute (2019 - Miami Beach Business Survey)
2019 City of Miami Beach Business Survey: Findings Report (WEIGHTED RESULTS)
ETC Institute (2019) Page 5

Q7. Do you think the level of Miami Beach tourism adds value to the business community?
by percentage of businesses (excluding "don’t know”)
Yes89%
No11%
Source: ETC Institute (2019 - Miami Beach Business Survey)
Q8. Feeling of Safety in Miami Beachby percentage of respondents (excluding “don't know”)
55%
31%
29%
28%
31%
23%
13%
23%
23%
5%
15%
24%
In/around place of business during daytime
During special events
In/around place of business during evening/night
0% 20% 40% 60% 80% 100%
Very Safe (5) Safe (4) Somewhat Safe (3) Unsafe (2,1)
Source: ETC Institute (2019 - Miami Beach Business Survey)
2019 City of Miami Beach Business Survey: Findings Report (WEIGHTED RESULTS)
ETC Institute (2019) Page 6

Q9. Do you think the amount of street lighting near your business is:
Too much/too bright4%
About right60%
Too little/too dark36%
by percentage of businesses (excluding “don’t know”)
Source: ETC Institute (2019 - Miami Beach Business Survey)
Q10. Satisfaction With Various Perceptions of the Cityby percentage of businesses (excluding “don't know”)
28%
29%
27%
22%
23%
19%
20%
23%
19%
20%
23%
18%
16%
17%
42%
38%
39%
43%
30%
34%
33%
29%
32%
31%
28%
30%
29%
27%
18%
21%
22%
25%
26%
24%
28%
24%
27%
25%
23%
26%
27%
25%
12%
12%
12%
10%
21%
23%
20%
24%
22%
24%
26%
27%
28%
31%
Overall image of the City
City efforts to prepare for disasters
Quality of life
Overall quality of City services
City efforts to be a "green" or sustainable city
City efforts to prevent crime
Quality of public schools
City efforts to prepare for the future
Leadership provided by the City's elected official
City efforts to plan for growth
City regulation of residential development
Value you receive for the City taxes your business
City regulation of commercial development
0% 20% 40% 60% 80% 100%
Very Satisfied (5) Satisfied (4) Neutral (3) Dissatisfied (2,1)
Source: ETC Institute (2019 - Miami Beach Business Survey)
City efforts to reduce risk from rainfall and sea-level rise
2019 City of Miami Beach Business Survey: Findings Report (WEIGHTED RESULTS)
ETC Institute (2019) Page 7

Q11. Level of Agreement With the Following Statements Regarding Sustainability and Resiliency
44%
44%
34%
32%
31%
33%
24%
20%
25%
36%
34%
38%
38%
38%
35%
31%
32%
25%
14%
15%
17%
21%
21%
19%
22%
25%
22%
6%
7%
12%
10%
10%
13%
23%
24%
28%
I have taken steps to reduce solid waste
I am informed about local climate change issues
Tree canopy is sufficient adjacent to my business
I have observed increased flooding
0% 20% 40% 60% 80% 100%
Strongly Agree (5) Agree (4) Neutral (3) Disagree (2,1)
Sustainability/resiliency are important to my business
by percentage of businesses (excluding "don’t know”)
Source: ETC Institute (2019 - Miami Beach Business Survey)
I have taken steps to make my business more energy efficient
I have taken steps to make my business more water efficient
My business has a continuity of operations plan in the event of a disaster
I'm satisfied with my building(s) flood risk protections
Q12. What can the City do to improve your business sustainability practices?
40%
39%
36%
28%
28%
23%
0% 10% 20% 30% 40% 50%
by percentage of businesses (multiple selections could be made)
Source: ETC Institute (2019 - Miami Beach Business Survey)
Provide an incentive program for installation of energy efficiency & renewable energy upgrades
Provide financial incentives to assist businesses tobuild sustainable practices
Provide better information & guidance on sustainability& resiliency practices
Recognize businesses that build sustainability into their operations, including reducing energy consumption
Recognize businesses that reduce single-use plastics
Provide procurement platform to assist businesses in purchasing more sustainable products
2019 City of Miami Beach Business Survey: Findings Report (WEIGHTED RESULTS)
ETC Institute (2019) Page 8

Q13. How supportive are you of the City of Miami Beach spending tax dollars to address sea-level rise?
Very supportive44%
Supportive28%
Neutral18%
Not supportive6%
Not at all supportive5%
by percentage of businesses (excluding “don’t know”)
Source: ETC Institute (2019 - Miami Beach Business Survey)
Q14. How willing would you be to pay more taxes to fund maintenance of assets such as buildings, roads,
streets, sidewalks, and vehicles?
Very willing9%
Willing23%
Neutral26%
Not willing20%
Not at all willing22%
by percentage of businesses (excluding “don’t know”)
Source: ETC Institute (2019 - Miami Beach Business Survey)
2019 City of Miami Beach Business Survey: Findings Report (WEIGHTED RESULTS)
ETC Institute (2019) Page 9
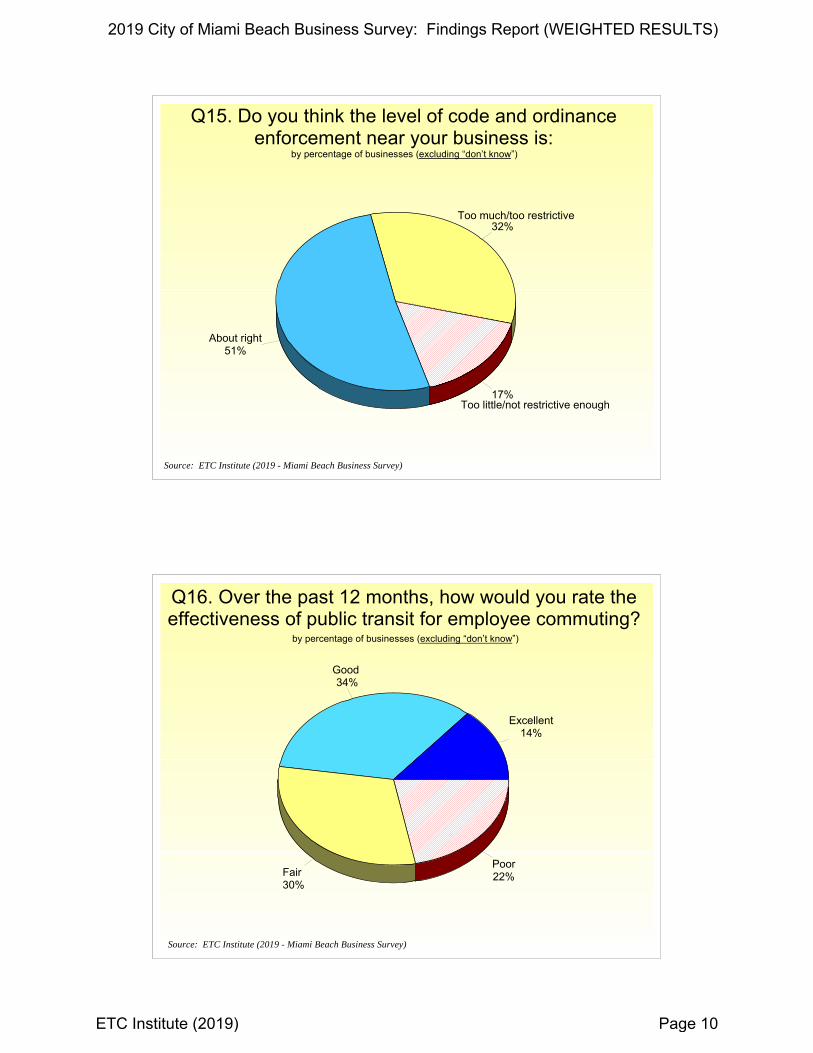
Q15. Do you think the level of code and ordinance enforcement near your business is:
32%
About right51%
17%
by percentage of businesses (excluding “don’t know”)
Source: ETC Institute (2019 - Miami Beach Business Survey)
Too much/too restrictive
Too little/not restrictive enough
Q16. Over the past 12 months, how would you rate the effectiveness of public transit for employee commuting?
Excellent14%
Good 34%
Fair 30%
Poor22%
Source: ETC Institute (2019 - Miami Beach Business Survey)
by percentage of businesses (excluding “don’t know”)
2019 City of Miami Beach Business Survey: Findings Report (WEIGHTED RESULTS)
ETC Institute (2019) Page 10
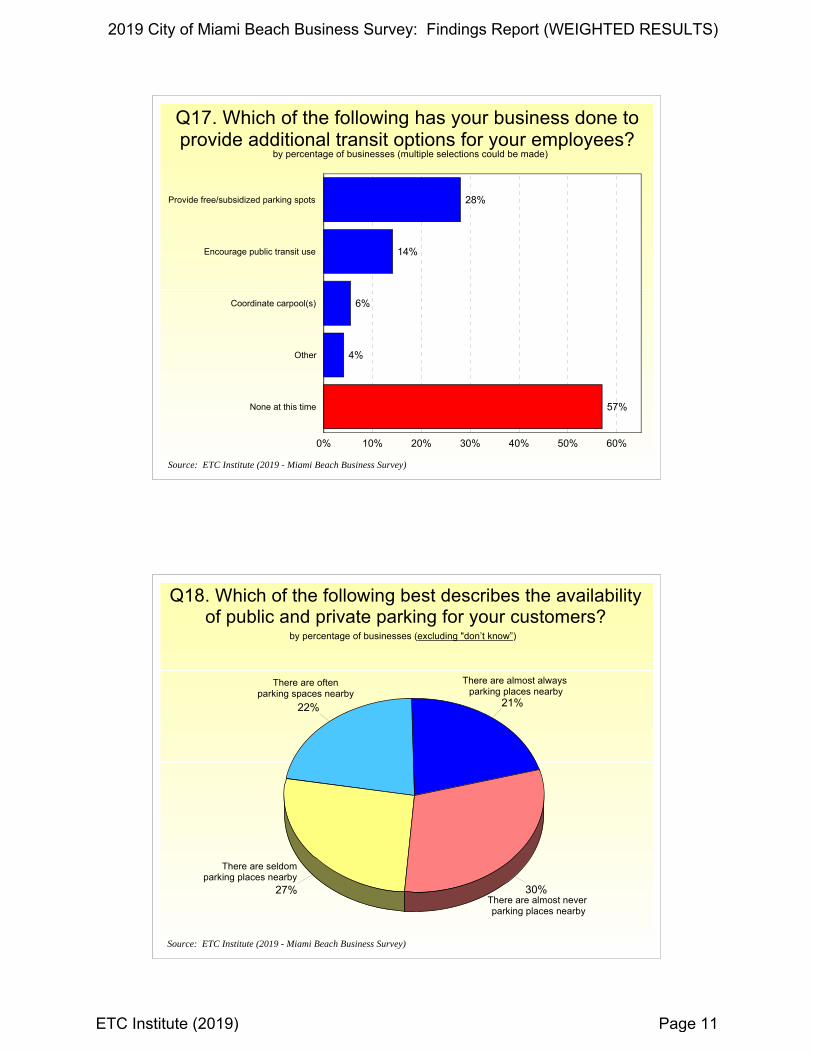
Q17. Which of the following has your business done to provide additional transit options for your employees?
28%
14%
6%
4%
57%
Provide free/subsidized parking spots
Encourage public transit use
Coordinate carpool(s)
Other
None at this time
0% 10% 20% 30% 40% 50% 60%
by percentage of businesses (multiple selections could be made)
Source: ETC Institute (2019 - Miami Beach Business Survey)
Q18. Which of the following best describes the availability of public and private parking for your customers?
21%22%
27% 30%
by percentage of businesses (excluding "don’t know”)
Source: ETC Institute (2019 - Miami Beach Business Survey)
There are almost always parking places nearby
There are almost never parking places nearby
There are seldom parking places nearby
There are often parking spaces nearby
2019 City of Miami Beach Business Survey: Findings Report (WEIGHTED RESULTS)
ETC Institute (2019) Page 11

Q19. Which sources do you utilize to obtain information about City government, issues, and events?
51%
41%
29%
18%
11%
9%
8%
7%
6%
6%
5%
5%
4%
4%
City Website (www.miamibeachfl.gov)
City e-mail news
MB Magazine
MBTV (City's TV Government channel)
Other news media
Text messages
Forums/workshops/meetings
City's E-Gov app
Nextdoor app
HOA's or other civic groups
Police Dept's social media platforms
Radio (1670 AM)
0% 10% 20% 30% 40% 50% 60%
by percentage of businesses (multiple selections could be made)
Source: ETC Institute (2019 - Miami Beach Business Survey)
Q19a. Which THREE of the communication channels do you prefer?
45%
43%
24%
15%
11%
9%
8%
6%
4%
3%
3%
3%
3%
2%
City Website (www.miamibeachfl.gov)
City e-mail news
MB Magazine
Text messages
Other news media
MBTV (City's TV Government channel)
Forums/workshops/meetings
City's E-Gov app
HOA's or other civic groups
Radio (1670 AM)
Nextdoor app
Police Dept's social media platforms
0% 10% 20% 30% 40% 50% 60%
Sum of Choices
by percentage of businesses that selected the item as one of its top three choices
Source: ETC Institute (2019 - Miami Beach Business Survey)
2019 City of Miami Beach Business Survey: Findings Report (WEIGHTED RESULTS)
ETC Institute (2019) Page 12

Q20. In the last 12 months, how many times have you personally contacted the City of Miami Beach government
with a question, service request or complaint?
Source: ETC Institute (2019 - Miami Beach Business Survey)
0 to 5 times81%
6 to 10 times10%
More than 10 times9%
by percentage of businesses (excluding "not provided”)
Q20a. Reasons for Most Recent Contact With the Cityby percentage of businesses that contacted the City in the last 12 months
Pay a bill13%3%
Research an issue17%
20%
Attend a program/event2%
File a complaint14%
Other 27%
Not provided5%
Visit an elected official
Pull a building permit/plan review
Source: ETC Institute (2019 - Miami Beach Business Survey)
2019 City of Miami Beach Business Survey: Findings Report (WEIGHTED RESULTS)
ETC Institute (2019) Page 13

Q20b. Level of Agreement With Statements Regarding Interaction With City Employees
by percentage of businesses (excluding "don’t know”)
Source: ETC Institute (2019 - Miami Beach Business Survey)
32%
22%
22%
22%
22%
23%
21%
38%
36%
29%
29%
28%
27%
28%
20%
20%
24%
21%
20%
19%
19%
10%
22%
25%
29%
30%
31%
33%
City employees are courteous/professional
City employees possess proper knowledge
Requests made were processed in a timely manner
Easy to get a hold of someone at the City
0% 20% 40% 60% 80% 100%
Strongly Agree (5) Agree (4) Neutral (3) Disagree (2,1)
The City is open & interested in hearing concerns/issues
Overall I was satisfied with experience I had contacting the City
I found process to be user-friendly/easy to understand
Q22. Compared to operating a business in other cities, how would you rate Miami Beach as a place to run a
business?
Better32%
About the same40%
Worse28%
by percentage of businesses (excluding “don’t know”)
Source: ETC Institute (2019 - Miami Beach Business Survey)
2019 City of Miami Beach Business Survey: Findings Report (WEIGHTED RESULTS)
ETC Institute (2019) Page 14

Q23. Compared to previous years, how would you currently rate the City of Miami Beach as a place to do
business?
Gotten better30%
About the same37%
Gotten worse33%
by percentage of businesses (excluding “don’t know”)
Source: ETC Institute (2019 - Miami Beach Business Survey)
Q24. Likelihood of Recommending the City of Miami Beach to Others as a Place to Run a Business
Definitely recommend26%
Probably recommend34%
Probably not recommend27%
13%
by percentage of businesses (excluding "don’t know”)
Source: ETC Institute (2019 - Miami Beach Business Survey)
Definitely not recommend
2019 City of Miami Beach Business Survey: Findings Report (WEIGHTED RESULTS)
ETC Institute (2019) Page 15

Q25. What are the THREE most significant challenges to the future growth and stability of your business?
52%
41%
25%
17%
16%
16%
11%
8%
17%
Finding good employees
Taxes
Transportation
Marketing/promotion
Employee benefits (e.g. healthcare)
Lack of available capital
Cost of technology
Other
0% 10% 20% 30% 40% 50% 60%
Sum of Choices
by percentage of businesses that selected the item as one of its top three choices (excluding "don’t know”)
Source: ETC Institute (2019 - Miami Beach Business Survey)
Cost of leasing or purchasing retail/commercial space
Q26. Which THREE of the following items have been a barrier to establishing your business in Miami Beach?
47%
42%
33%
27%
17%
13%
7%
Parking
Permitting
License application process
Taxes
Zoning
Other
0% 10% 20% 30% 40% 50% 60%
Sum of Choices
by percentage of businesses that selected the item as one of its top three choices (excluding "don’t know”)
Source: ETC Institute (2019 - Miami Beach Business Survey)
Cost of leasing or purchasing retail/commercial space
2019 City of Miami Beach Business Survey: Findings Report (WEIGHTED RESULTS)
ETC Institute (2019) Page 16

Q27. If you could receive support in an area to help advance your business, which ONE of the following items
would you choose?
Access to capital27%4%
6%
Marketing & branding24%
Operations7%
16%
Technology & training7%
Other10%
by percentage of businesses (excluding "don’t know”)
Source: ETC Institute (2019 - Miami Beach Business Survey)
Access to research & development
Financial literacy & planning
Social media optimization
DEMOGRAPHICS
2019 City of Miami Beach Business Survey: Findings Report (WEIGHTED RESULTS)
ETC Institute (2019) Page 17

Q28. Are you an owner or manager at your business?by percentage of businesses (excluding “not provided”)
Yes98%
No2%
Source: ETC Institute (2019 - Miami Beach Business Survey)
Q29. How long has your business been in the City of Miami Beach?
5 years or less22%
6 to 10 years18%
11 to 15 years13%
16 to 20 years17%
21 to 30 years16%
31+ years14%
by percentage of businesses
Source: ETC Institute (2019 - Miami Beach Business Survey)
2019 City of Miami Beach Business Survey: Findings Report (WEIGHTED RESULTS)
ETC Institute (2019) Page 18

Q30. Approximately how many full-time employees does your business currently have?
Less than 558%
5 to 1017% 11 to 24
13%
25 to 496%
50+5%
by percentage of businesses (excluding "not provided”)
Source: ETC Institute (2019 - Miami Beach Business Survey)
Q31. Approximately how many part-time employees does your business currently have?
Less than 580%
5 to 1011%
11 to 245%
25 to 493%
50+1%
by percentage of businesses (excluding "not provided”)
Source: ETC Institute (2019 - Miami Beach Business Survey)
2019 City of Miami Beach Business Survey: Findings Report (WEIGHTED RESULTS)
ETC Institute (2019) Page 19

Q32. On average, what is the annual gross sales/revenue of your business?
Under $500,00046%
$500K-$999,99913%
$1million-$1,999,99920% $2 million-$4,999,999
9%
$5 million-$9,999,9995%
$10 million or more8%
by percentage of businesses (excluding "not provided”)
Source: ETC Institute (2019 - Miami Beach Business Survey)
Q33. How many locations do you have inside the City of Miami Beach?
One85%
Two8%
Three or more5%
Not provided2%
by percentage of businesses
Source: ETC Institute (2019 - Miami Beach Business Survey)
2019 City of Miami Beach Business Survey: Findings Report (WEIGHTED RESULTS)
ETC Institute (2019) Page 20

Q34. How many locations do you have outside the City of Miami Beach?
None53%
One14%
Two5% Three or more
11%
Not provided18%
by percentage of businesses
Source: ETC Institute (2019 - Miami Beach Business Survey)
Q35. What type of business is your establishment?by percentage of respondents
Source: ETC Institute (2019 - Miami Beach Business Survey)
Finance/insurance3%
1%
Wholesaler/distributor2%
Retail trade21%
17%
9%
1%
8%
21%
Other10%
Not provided8%
Admin. & support services
Accommodation & food services
Health care/medical/social services
Transportation/warehousing
Professional, scientific/tech services
Real estate, rentals & leasing
2019 City of Miami Beach Business Survey: Findings Report (WEIGHTED RESULTS)
ETC Institute (2019) Page 21

Section 2:
Trend Analysis
2019 City of Miami Beach Business Survey: Findings Report (WEIGHTED RESULTS)
ETC Institute (2019) Page 22

Trends
Overall Ratings for the City of Miami Beach 2009 to 2019
95%
94%
93%
86%
84%
81%
79%
79%
95%
91%
90%
88%
87%
87%
82%
79%
93%
92%
89%
88%
83%
79%
82%
77%
93%
93%
88%
86%
86%
83%
86%
71%
95%
93%
95%
91%
85%
85%
85%
81%
Fire services
Emergency medical services
Ocean rescue/lifeguard/beach patrol
City's emergency/hurricane preparedness
Maintenance of parks
Appearance/maintenance of City's public bldgs
Overall quality of the beaches
Police services
0% 20% 40% 60% 80% 100%
2019 2016 2014 2012 2009
by percentage of businesses that rated the item as “excellent" or "good” (excluding “don't know”)
Source: ETC Institute (2019 - Miami Beach Business Survey)
Trends
Overall Ratings for the City of Miami Beach (cont.) 2009 to 2019
73%
66%
62%
58%
58%
56%
34%
80%
71%
68%
62%
57%
54%
35%
74%
72%
63%
61%
59%
31%
39%
80%
71%
62%
64%
59%
37%
31%
81%
75%
66%
66%
61%
45%
32%
Landscape maintenance in right of way
Garbage/trash collection
Cleanliness of streets near your business
Condition of sidewalks (few or no cracks)
Cleanliness of canals/waterways
City's efforts to manage stormwater
Efforts to address homelessness
0% 20% 40% 60% 80% 100%
2019 2016 2014 2012 2009
by percentage of businesses that rated the item as “excellent" or "good” (excluding “don't know”)
Source: ETC Institute (2019 - Miami Beach Business Survey)
2019 City of Miami Beach Business Survey: Findings Report (WEIGHTED RESULTS)
ETC Institute (2019) Page 23
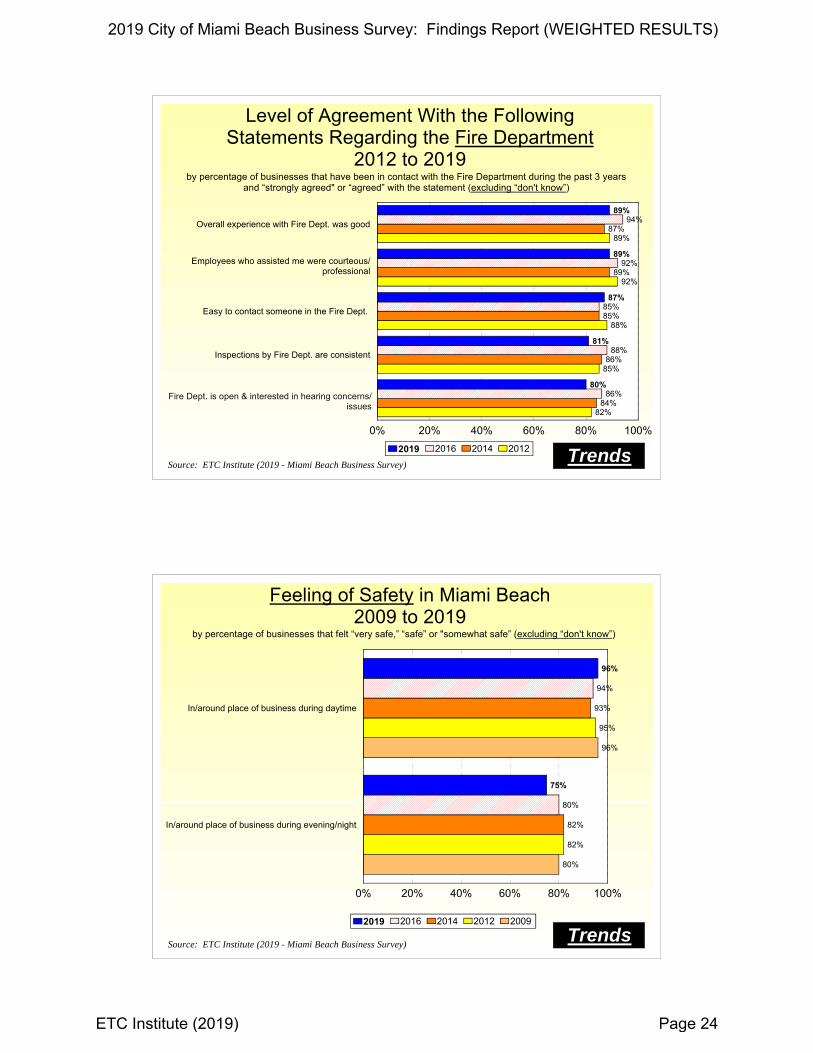
Trends
Level of Agreement With the Following Statements Regarding the Fire Department
2012 to 2019
89%
89%
87%
81%
80%
94%
92%
85%
88%
86%
87%
89%
85%
86%
84%
89%
92%
88%
85%
82%
Overall experience with Fire Dept. was good
Easy to contact someone in the Fire Dept.
Inspections by Fire Dept. are consistent
0% 20% 40% 60% 80% 100%
2019 2016 2014 2012
by percentage of businesses that have been in contact with the Fire Department during the past 3 years and “strongly agreed" or “agreed” with the statement (excluding “don't know”)
Source: ETC Institute (2019 - Miami Beach Business Survey)
Employees who assisted me were courteous/professional
Fire Dept. is open & interested in hearing concerns/issues
Trends
Feeling of Safety in Miami Beach 2009 to 2019
96%
75%
94%
80%
93%
82%
95%
82%
96%
80%
In/around place of business during daytime
In/around place of business during evening/night
0% 20% 40% 60% 80% 100%
2019 2016 2014 2012 2009
by percentage of businesses that felt “very safe,” “safe” or "somewhat safe” (excluding “don't know”)
Source: ETC Institute (2019 - Miami Beach Business Survey)
2019 City of Miami Beach Business Survey: Findings Report (WEIGHTED RESULTS)
ETC Institute (2019) Page 24

Perceived Amount of Street Lighting Near Business 2009 to 2019
75%
68%72%
69%
60%
2009 2012 2014 2016 20190%
20%
40%
60%
80%
Trends
by percentage of businesses that felt the amount was “about right” (excluding “don't know”)
Source: ETC Institute (2019 - Miami Beach Business Survey)
Trends
Satisfaction With Various Perceptions of the City2009 to 2019
53%
45%
58%
44%
66%
54%
52%
0%
55%
City efforts to be a "green" or sustainable City
Value received for City taxes paid
0% 20% 40% 60% 80% 100%
2019 2016 2014 2012 2009
by percentage of businesses that were “very satisfied" or "satisfied” (excluding “don't know”)
Not asked before 2014
Source: ETC Institute (2019 - Miami Beach Business Survey)
2019 City of Miami Beach Business Survey: Findings Report (WEIGHTED RESULTS)
ETC Institute (2019) Page 25

by percentage of businesses that rated the level "about right” (excluding “don't know”)
68%
61%
69%
59%
51%
2009 2012 2014 2016 20190%
20%
40%
60%
Trends
Perceived Level of Code and Ordinance Enforcement Near Business - 2009 to 2019
Source: ETC Institute (2019 - Miami Beach Business Survey)
by percentage of businesses that support the issue (excluding “don't know”)
87% 89%
72%
2014 2016 20190%
20%
40%
60%
80%
100%
Trends
Support for Spending Tax Dollars to Address Sea-Level Rise - 2014 to 2019
Source: ETC Institute (2019 - Miami Beach Business Survey)
2019 City of Miami Beach Business Survey: Findings Report (WEIGHTED RESULTS)
ETC Institute (2019) Page 26

by percentage of businesses that responded that there are “almost always” or “often” parking spaces nearby (excluding “don't know”)
28%
40%
31%33%
43%
2009 2012 2014 2016 20190%
10%
20%
30%
40%
50%
Trends
Perceived Availability of Public and Private Parking for Customers - 2009 to 2019
Source: ETC Institute (2019 - Miami Beach Business Survey)
Trends
Agreement With Various Statements About Most Recent Interaction With City Employees - 2009 to 2019
70%
51%
51%
50%
50%
49%
65%
55%
53%
60%
56%
47%
82%
69%
61%
66%
64%
64%
81%
66%
59%
63%
61%
61%
83%
72%
61%
70%
67%
68%
Requests made were processed in a timely manner
It is easy to get a hold of someone at the City
0% 20% 40% 60% 80% 100%
2019 2016 2014 2012 2009
by percentage of businesses that contacted the City during the last 12 months and “strongly agreed” or "agreed” with the statement (excluding “don't know”)
City govt. is open & interested in hearing concerns/issues of residents
City employees are courteous & professional
Overall I was satisfied with experience I had contactingthe City
I found process to be user-friendly/easy to understand
Source: ETC Institute (2019 - Miami Beach Business Survey)
2019 City of Miami Beach Business Survey: Findings Report (WEIGHTED RESULTS)
ETC Institute (2019) Page 27

How Businesses Rate the City of Miami Beach as a Place to do Business Compared to Previous Years
2009 to 2019
25%
43%40%
29% 30%
2009 2012 2014 2016 20190%
10%
20%
30%
40%
50%
Trends
by percentage of businesses that indicated it has "gotten better” (excluding “don't know”)
Source: ETC Institute (2019 - Miami Beach Business Survey)
Likelihood of Recommending the City of Miami Beach to Others as a Place to Run a Business - 2009 to 2019
67%70%
82%
72%
60%
2009 2012 2014 2016 20190%
20%
40%
60%
80%
100%
Trends
by percentage of businesses that responded “definitely recommend" or “probably recommend” (excluding “don't know”)
Source: ETC Institute (2019 - Miami Beach Business Survey)
2019 City of Miami Beach Business Survey: Findings Report (WEIGHTED RESULTS)
ETC Institute (2019) Page 28

Section 3: Importance-Satisfaction
Analysis
2019 City of Miami Beach Business Survey: Findings Report (WEIGHTED RESULTS)
ETC Institute (2019) Page 29

Importan
ce‐Satisfaction Analysis
Importance‐Satisfaction Analysis Miami Beach, Florida
Overview Today, city officials have limited resources which need to be targeted to activities that are of the most benefit to their citizens. Two of the most important criteria for decision making are (1) to target resources toward services of the highest importance to citizens; and (2) to target resources toward those services where citizens are the least satisfied. The Importance‐Satisfaction (IS) rating is a unique tool that allows public officials to better understand both of these highly important decision making criteria for each of the services they are providing. The Importance‐Satisfaction rating is based on the concept that cities will maximize overall citizen satisfaction by emphasizing improvements in those service categories where the level of satisfaction is relatively low and the perceived importance of the service is relatively high.
Methodology The rating is calculated by summing the percentage of responses for items selected as the first, second, third, fourth, and fifth most important services for the City to provide. This sum is then multiplied by 1 minus the percentage of respondents that indicated they were positively satisfied with the City's performance in the related area (the sum of the ratings of 3 and 4 on a 4‐point scale excluding “don't know” responses). “Don't know” responses are excluded from the calculation to ensure that the satisfaction ratings among service categories are comparable. [IS=Importance x (1‐Satisfaction)]. Example of the Calculation. Respondents were asked to identify the major City services they thought were the most important for the City to provide. Approximately twenty‐four percent (24.2%) selected “City’s efforts to manage stormwater” as one of the most important major services for the City to provide.
2019 City of Miami Beach Business Survey: Findings Report (WEIGHTED RESULTS)
ETC Institute (2019) Page 30

Importan
ce‐Satisfaction Analysis
With regard to satisfaction, 56% of the businesses surveyed rated their overall satisfaction with “City’s efforts to manage stormwater” as a “3” or a “4” on a 4‐point scale (where “4” means “excellent”). The I‐S rating for “City’s efforts to manage stormwater” was calculated by multiplying the sum of the most important percentages by 1 minus the sum of the satisfaction percentages. In this example, 24.2% was multiplied by 44% (1‐0.56). This calculation yielded an I‐S rating of 0.1065, which ranked third out of twenty‐three major City services. The maximum rating is 1.00 and would be achieved when 100% of the respondents select an item as one of their top three choices to emphasize over the next two years and 0% indicate that they are positively satisfied with the delivery of the service. The lowest rating is 0.00 and could be achieved under either one of the following two situations:
if 100% of the respondents were positively satisfied with the delivery of the service
if none (0%) of the respondents selected the service as one of the three most important areas for the City to emphasize over the next two years.
Interpreting the Ratings Ratings that are greater than or equal to 0.20 identify areas that should receive significantly more emphasis over the next two years. Ratings from .10 to .20 identify service areas that should receive increased emphasis. Ratings less than .10 should continue to receive the current level of emphasis.
Definitely Increase Emphasis (IS>=0.20)
Increase Current Emphasis (0.10<=IS<0.20)
Maintain Current Emphasis (IS<0.10) The results for the City of Miami Beach are provided on the following page.
2019 City of Miami Beach Business Survey: Findings Report (WEIGHTED RESULTS)
ETC Institute (2019) Page 31

Importance-Satisfaction RatingCity of Miami Beach Business Survey
OVERALL
Category of Service
Most Important
%
Most Important
RankSatisfaction
%Satisfaction
Rank
Importance-Satisfaction
RatingI-S Rating
Rank
Very High Priority (IS >.20)
The job City is doing to address homelessness 41% 2 34% 23 0.2699 1
High Priority (IS .10-.20)
Cleanliness of streets near your business 36% 3 62% 17 0.1360 2City's efforts to manage stormwater 24% 4 56% 22 0.1065 3
Medium Priority (IS <.10)
Police services 41% 1 79% 8 0.0865 4Condition of sidewalks (few or no cracks) 19% 6 58% 21 0.0806 5Garbage/trash collection 21% 5 66% 14 0.0704 6Condition of streets 19% 7 65% 15 0.0648 7Cleanliness of canals/waterways 15% 12 58% 20 0.0626 8Street lighting 18% 8 70% 13 0.0540 9City efforts to keep businesses informed 13% 13 61% 19 0.0515 10Overall quality of customer service 13% 14 61% 18 0.0495 11Overall quality of the beaches 17% 11 79% 9 0.0349 12Reliability of potable (drinking) water 12% 15 74% 10 0.0309 13Reliability of sewer (wastewater) services 10% 17 73% 12 0.0267 14Miami Dade County's bus service 6% 20 63% 16 0.0233 15Landscape maintenance in right of way 8% 19 73% 11 0.0213 16Miami Beach trolley system 8% 18 80% 7 0.0158 17City's emergency/hurricane preparedness 10% 16 86% 4 0.0139 18
Emergency medical services 17% 10 94% 2 0.0100 19Appearance/maintenance of City's public bldgs 5% 22 81% 6 0.0091 20Fire services 17% 9 95% 1 0.0084 21Maintenance of parks 4% 23 84% 5 0.0064 22Ocean rescue/lifeguard/beach patrol 5% 21 93% 3 0.0036 23
Note: The I-S Rating is calculated by multiplying the "Most Important" % by (1-'Satisfaction' %)
Most Important %: The "Most Important" percentage represents the sum of the first, second, third, fourth,
and fifth most important responses for each item. Respondents were asked to identify
the items they thought were most important for the City to provide.
Satisfaction %: The rating percentage represents the sum of the ratings "3" and "4" excluding 'don't knows.'Respondents ranked their level of satisfaction with the each of the items on a scaleof 1 to 4 with "4" being "excellent" and "1" being "poor."
© 2019 DirectionFinder by ETC Institute
2019 City of Miami Beach Business Survey: Findings Report (WEIGHTED RESULTS)
ETC Institute (2019) Page 32

Importan
ce‐Satisfaction Analysis
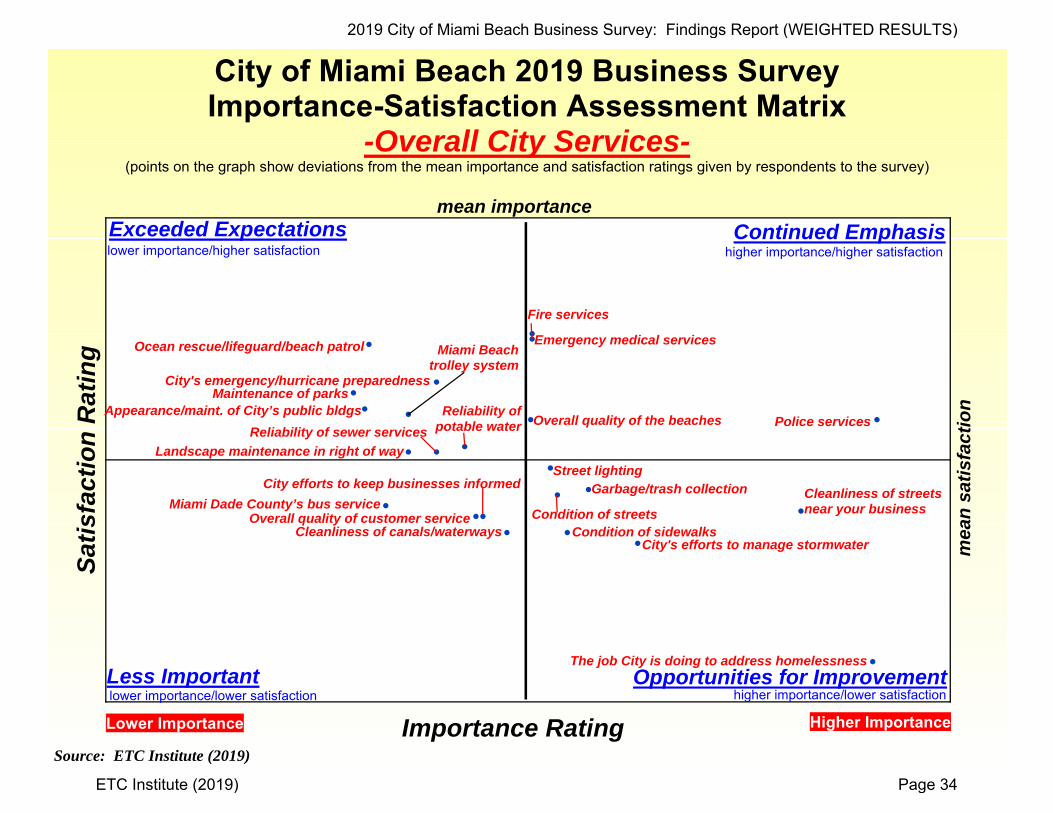
Importance‐Satisfaction Matrix Analysis The Importance‐Satisfaction rating is based on the concept that public agencies will maximize overall customer satisfaction by emphasizing improvements in those areas where the level of satisfaction is relatively low and the perceived importance of the service is relatively high. ETC Institute developed an Importance‐Satisfaction Matrix to display the perceived importance of major services that were assessed on the survey against the perceived quality of service delivery. The two axes on the matrix represent Satisfaction (vertical) and relative Importance (horizontal). The I‐S (Importance‐Satisfaction) matrix should be interpreted as follows.
Continued Emphasis (above average importance and above average satisfaction). This area shows where the City is meeting customer expectations. Items in this area have a significant impact on the customer’s overall level of satisfaction. The City should maintain (or slightly increase) emphasis on items in this area.
Exceeding Expectations (below average importance and above average
satisfaction). This area shows where the City is performing significantly better than customers expect the City to perform. Items in this area do not significantly affect the overall level of satisfaction that businesses have with City services. The City should maintain (or slightly decrease) emphasis on items in this area.
Opportunities for Improvement (above average importance and below average
satisfaction). This area shows where the City is not performing as well as businesses expect the City to perform. This area has a significant impact on customer satisfaction, and the City should DEFINITELY increase emphasis on items in this area.
Less Important (below average importance and below average satisfaction).
This area shows where the City is not performing well relative to the City’s performance in other areas; however, this area is generally considered to be less important to businesses. This area does not significantly affect overall satisfaction with City services because the items are less important to businesses. The agency should maintain current levels of emphasis on items in this area.
A matrix showing the results for the City of Miami Beach is provided on the following page.
2019 City of Miami Beach Business Survey: Findings Report (WEIGHTED RESULTS)
ETC Institute (2019) Page 33
Sa t
isf a
ctio
n R
atin
g
!
!
!!
!!! ! !!
!! !!
!!! !!!
! !! m
e an
sa t
isfa
c tio
n
Opportunities for Improvement
City of Miami Beach 2019 Business Survey Importance-Satisfaction Assessment Matrix
-Overall City Services-(points on the graph show deviations from the mean importance and satisfaction ratings given by respondents to the survey)
mean importance
Importance RatingLower Importance Higher Importance
lower importance/higher satisfaction higher importance/higher satisfaction
lower importance/lower satisfaction higher importance/lower satisfaction
Exceeded Expectations
Less Important
Continued Emphasis
Source: ETC Institute (2019)
Fire services
Emergency medical services Ocean rescue/lifeguard/beach patrol
City's emergency/hurricane preparedness Maintenance of parks
Appearance/maint. of City’s public bldgs Overall quality of the beaches
Landscape maintenance in right of way
Police services
Overall quality of customer service
Garbage/trash collection Cleanliness of streetsnear your business
City efforts to keep businesses informed
Condition of sidewalksCleanliness of canals/waterways City's efforts to manage stormwater
Condition of streets
The job City is doing to address homelessness
Miami Beach trolley system
Reliability of potable waterReliability of sewer services
Street lighting
Miami Dade County’s bus service
2019 City of Miami Beach Business Survey: Findings Report (WEIGHTED RESULTS)
ETC Institute (2019) Page 34

Section 4: Tabular Data
2019 City of Miami Beach Business Survey: Findings Report (WEIGHTED RESULTS)
ETC Institute (2019) Page 35
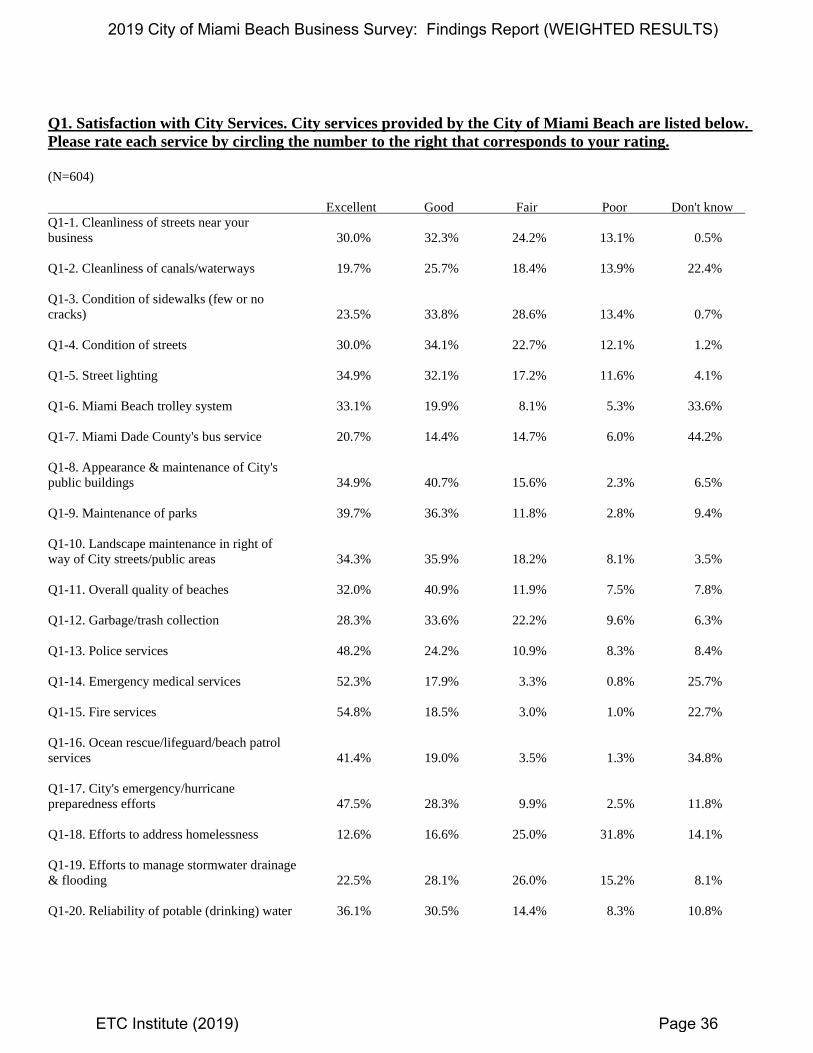
Q1. Satisfaction with City Services. City services provided by the City of Miami Beach are listed below. Please rate each service by circling the number to the right that corresponds to your rating. (N=604) Excellent Good Fair Poor Don't know Q1-1. Cleanliness of streets near your business 30.0% 32.3% 24.2% 13.1% 0.5% Q1-2. Cleanliness of canals/waterways 19.7% 25.7% 18.4% 13.9% 22.4% Q1-3. Condition of sidewalks (few or no cracks) 23.5% 33.8% 28.6% 13.4% 0.7% Q1-4. Condition of streets 30.0% 34.1% 22.7% 12.1% 1.2% Q1-5. Street lighting 34.9% 32.1% 17.2% 11.6% 4.1% Q1-6. Miami Beach trolley system 33.1% 19.9% 8.1% 5.3% 33.6% Q1-7. Miami Dade County's bus service 20.7% 14.4% 14.7% 6.0% 44.2% Q1-8. Appearance & maintenance of City's public buildings 34.9% 40.7% 15.6% 2.3% 6.5% Q1-9. Maintenance of parks 39.7% 36.3% 11.8% 2.8% 9.4% Q1-10. Landscape maintenance in right of way of City streets/public areas 34.3% 35.9% 18.2% 8.1% 3.5% Q1-11. Overall quality of beaches 32.0% 40.9% 11.9% 7.5% 7.8% Q1-12. Garbage/trash collection 28.3% 33.6% 22.2% 9.6% 6.3% Q1-13. Police services 48.2% 24.2% 10.9% 8.3% 8.4% Q1-14. Emergency medical services 52.3% 17.9% 3.3% 0.8% 25.7% Q1-15. Fire services 54.8% 18.5% 3.0% 1.0% 22.7% Q1-16. Ocean rescue/lifeguard/beach patrol services 41.4% 19.0% 3.5% 1.3% 34.8% Q1-17. City's emergency/hurricane preparedness efforts 47.5% 28.3% 9.9% 2.5% 11.8% Q1-18. Efforts to address homelessness 12.6% 16.6% 25.0% 31.8% 14.1% Q1-19. Efforts to manage stormwater drainage & flooding 22.5% 28.1% 26.0% 15.2% 8.1% Q1-20. Reliability of potable (drinking) water 36.1% 30.5% 14.4% 8.3% 10.8%
2019 City of Miami Beach Business Survey: Findings Report (WEIGHTED RESULTS)
ETC Institute (2019) Page 36

Q1. Satisfaction with City Services. City services provided by the City of Miami Beach are listed below. Please rate each service by circling the number to the right that corresponds to your rating. Excellent Good Fair Poor Don't know Q1-21. Reliability of sewer (wastewater) services 31.3% 30.8% 12.9% 10.4% 14.6% Q1-22. Quality of customer service 28.1% 26.7% 20.7% 14.1% 10.4% Q1-23. City efforts to keep businesses informed 27.6% 29.3% 20.7% 15.9% 6.5%
2019 City of Miami Beach Business Survey: Findings Report (WEIGHTED RESULTS)
ETC Institute (2019) Page 37

WITHOUT “DON’T KNOW” Q1. Satisfaction with City Services. City services provided by the City of Miami Beach are listed below. Please rate each service by circling the number to the right that corresponds to your rating. (without "don't know") (N=604) Excellent Good Fair Poor Q1-1. Cleanliness of streets near your business 30.1% 32.4% 24.3% 13.1% Q1-2. Cleanliness of canals/waterways 25.4% 33.0% 23.7% 17.9% Q1-3. Condition of sidewalks (few or no cracks) 23.7% 34.0% 28.8% 13.5% Q1-4. Condition of streets 30.3% 34.5% 22.9% 12.2% Q1-5. Street lighting 36.4% 33.5% 18.0% 12.1% Q1-6. Miami Beach trolley system 49.9% 29.9% 12.2% 8.0% Q1-7. Miami Dade County's bus service 37.1% 25.8% 26.4% 10.7% Q1-8. Appearance & maintenance of City's public buildings 37.3% 43.5% 16.6% 2.5% Q1-9. Maintenance of parks 43.9% 40.0% 13.0% 3.1% Q1-10. Landscape maintenance in right of way of City streets/public areas 35.5% 37.2% 18.9% 8.4% Q1-11. Overall quality of beaches 34.6% 44.3% 12.9% 8.1% Q1-12. Garbage/trash collection 30.2% 35.9% 23.7% 10.2% Q1-13. Police services 52.6% 26.4% 11.9% 9.0% Q1-14. Emergency medical services 70.4% 24.1% 4.5% 1.1% Q1-15. Fire services 70.9% 24.0% 3.9% 1.3% Q1-16. Ocean rescue/lifeguard/beach patrol services 63.5% 29.2% 5.3% 2.0% Q1-17. City's emergency/hurricane preparedness efforts 53.8% 32.1% 11.3% 2.8% Q1-18. Efforts to address homelessness 14.6% 19.3% 29.1% 37.0% Q1-19. Efforts to manage stormwater drainage & flooding 24.5% 30.6% 28.3% 16.6% Q1-20. Reliability of potable (drinking) water 40.4% 34.1% 16.1% 9.3%
2019 City of Miami Beach Business Survey: Findings Report (WEIGHTED RESULTS)
ETC Institute (2019) Page 38

WITHOUT “DON’T KNOW” Q1. Satisfaction with City Services. City services provided by the City of Miami Beach are listed below. Please rate each service by circling the number to the right that corresponds to your rating. (without "don't know") Excellent Good Fair Poor Q1-21. Reliability of sewer (wastewater) services 36.6% 36.0% 15.1% 12.2% Q1-22. Quality of customer service 31.4% 29.8% 23.1% 15.7% Q1-23. City efforts to keep businesses informed 29.6% 31.3% 22.1% 17.0%
2019 City of Miami Beach Business Survey: Findings Report (WEIGHTED RESULTS)
ETC Institute (2019) Page 39

Q2. Which FIVE of the City services listed in Question 1 do you think are most important for the City to provide? Q2. Top choice Number Percent Cleanliness of streets near your business 74 12.3 % Cleanliness of canals/waterways 18 3.0 % Condition of sidewalks (few or no cracks) 29 4.8 % Condition of streets 26 4.3 % Street lighting 14 2.3 % Miami Beach trolley system 14 2.3 % Miami Dade County's bus service 8 1.3 % Appearance & maintenance of City's public buildings 2 0.3 % Maintenance of parks 2 0.3 % Landscape maintenance in right of way of City streets/public areas 9 1.5 % Overall quality of beaches 11 1.8 % Garbage/trash collection 15 2.5 % Police services 104 17.2 % Emergency medical services 14 2.3 % Fire services 6 1.0 % Ocean rescue/lifeguard/beach patrol services 1 0.2 % City's emergency/hurricane preparedness efforts 10 1.7 % Efforts to address homelessness 76 12.6 % Efforts to manage stormwater drainage & flooding 35 5.8 % Reliability of potable (drinking) water 21 3.5 % Reliability of sewer (wastewater) services 15 2.5 % Quality of customer service 11 1.8 % City efforts to keep businesses informed 27 4.5 % None chosen 62 10.3 % Total 604 100.0 %
2019 City of Miami Beach Business Survey: Findings Report (WEIGHTED RESULTS)
ETC Institute (2019) Page 40

Q2. Which FIVE of the City services listed in Question 1 do you think are most important for the City to provide? Q2. 2nd choice Number Percent Cleanliness of streets near your business 57 9.4 % Cleanliness of canals/waterways 28 4.6 % Condition of sidewalks (few or no cracks) 39 6.5 % Condition of streets 22 3.6 % Street lighting 20 3.3 % Miami Beach trolley system 10 1.7 % Miami Dade County's bus service 12 2.0 % Appearance & maintenance of City's public buildings 5 0.8 % Maintenance of parks 5 0.8 % Landscape maintenance in right of way of City streets/public areas 9 1.5 % Overall quality of beaches 16 2.6 % Garbage/trash collection 15 2.5 % Police services 51 8.4 % Emergency medical services 36 6.0 % Fire services 27 4.5 % Ocean rescue/lifeguard/beach patrol services 6 1.0 % City's emergency/hurricane preparedness efforts 9 1.5 % Efforts to address homelessness 57 9.4 % Efforts to manage stormwater drainage & flooding 16 2.6 % Reliability of potable (drinking) water 17 2.8 % Reliability of sewer (wastewater) services 18 3.0 % Quality of customer service 15 2.5 % City efforts to keep businesses informed 19 3.1 % None chosen 95 15.7 % Total 604 100.0 %
2019 City of Miami Beach Business Survey: Findings Report (WEIGHTED RESULTS)
ETC Institute (2019) Page 41
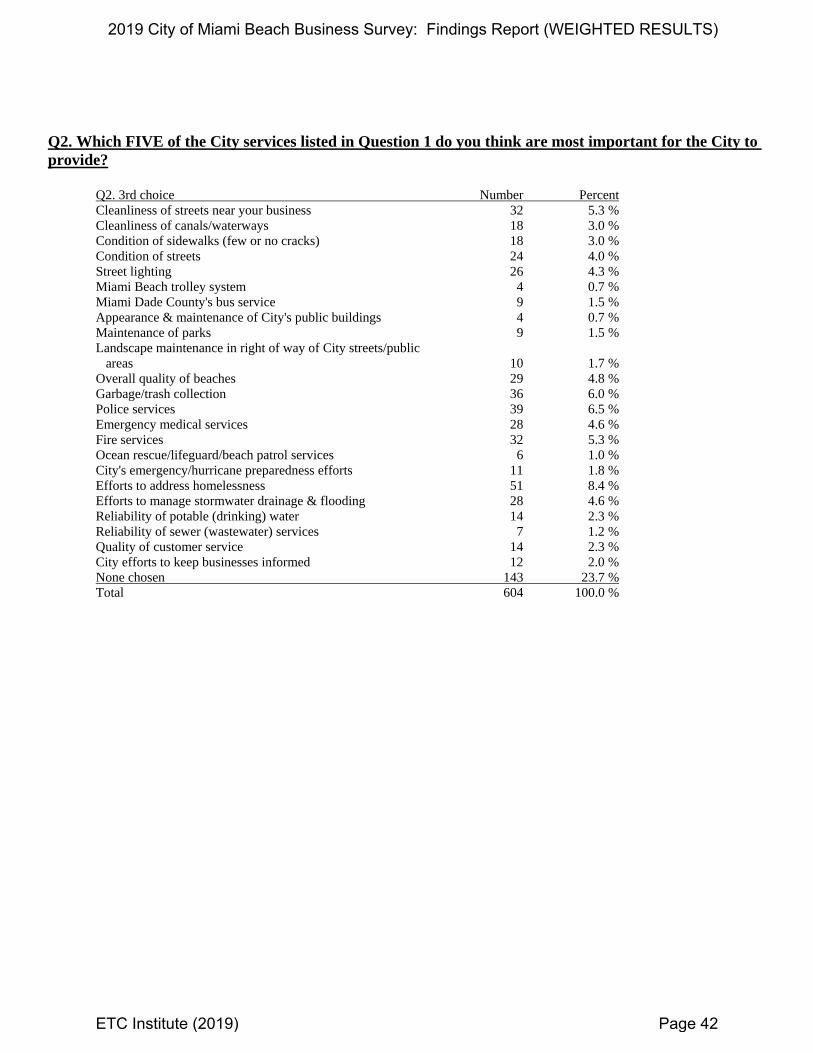
Q2. Which FIVE of the City services listed in Question 1 do you think are most important for the City to provide? Q2. 3rd choice Number Percent Cleanliness of streets near your business 32 5.3 % Cleanliness of canals/waterways 18 3.0 % Condition of sidewalks (few or no cracks) 18 3.0 % Condition of streets 24 4.0 % Street lighting 26 4.3 % Miami Beach trolley system 4 0.7 % Miami Dade County's bus service 9 1.5 % Appearance & maintenance of City's public buildings 4 0.7 % Maintenance of parks 9 1.5 % Landscape maintenance in right of way of City streets/public areas 10 1.7 % Overall quality of beaches 29 4.8 % Garbage/trash collection 36 6.0 % Police services 39 6.5 % Emergency medical services 28 4.6 % Fire services 32 5.3 % Ocean rescue/lifeguard/beach patrol services 6 1.0 % City's emergency/hurricane preparedness efforts 11 1.8 % Efforts to address homelessness 51 8.4 % Efforts to manage stormwater drainage & flooding 28 4.6 % Reliability of potable (drinking) water 14 2.3 % Reliability of sewer (wastewater) services 7 1.2 % Quality of customer service 14 2.3 % City efforts to keep businesses informed 12 2.0 % None chosen 143 23.7 % Total 604 100.0 %
2019 City of Miami Beach Business Survey: Findings Report (WEIGHTED RESULTS)
ETC Institute (2019) Page 42

Q2. Which FIVE of the City services listed in Question 1 do you think are most important for the City to provide? Q2. 4th choice Number Percent Cleanliness of streets near your business 38 6.3 % Cleanliness of canals/waterways 10 1.7 % Condition of sidewalks (few or no cracks) 19 3.1 % Condition of streets 22 3.6 % Street lighting 27 4.5 % Miami Beach trolley system 10 1.7 % Miami Dade County's bus service 4 0.7 % Appearance & maintenance of City's public buildings 10 1.7 % Maintenance of parks 3 0.5 % Landscape maintenance in right of way of City streets/public areas 11 1.8 % Overall quality of beaches 25 4.1 % Garbage/trash collection 30 5.0 % Police services 36 6.0 % Emergency medical services 15 2.5 % Fire services 10 1.7 % Ocean rescue/lifeguard/beach patrol services 9 1.5 % City's emergency/hurricane preparedness efforts 10 1.7 % Efforts to address homelessness 41 6.8 % Efforts to manage stormwater drainage & flooding 38 6.3 % Reliability of potable (drinking) water 11 1.8 % Reliability of sewer (wastewater) services 8 1.3 % Quality of customer service 18 3.0 % City efforts to keep businesses informed 11 1.8 % None chosen 188 31.1 % Total 604 100.0 %
2019 City of Miami Beach Business Survey: Findings Report (WEIGHTED RESULTS)
ETC Institute (2019) Page 43

Q2. Which FIVE of the City services listed in Question 1 do you think are most important for the City to provide? Q2. 5th choice Number Percent Cleanliness of streets near your business 15 2.5 % Cleanliness of canals/waterways 16 2.6 % Condition of sidewalks (few or no cracks) 11 1.8 % Condition of streets 18 3.0 % Street lighting 22 3.6 % Miami Beach trolley system 10 1.7 % Miami Dade County's bus service 5 0.8 % Appearance & maintenance of City's public buildings 8 1.3 % Maintenance of parks 5 0.8 % Landscape maintenance in right of way of City streets/public areas 9 1.5 % Overall quality of beaches 19 3.1 % Garbage/trash collection 29 4.8 % Police services 19 3.1 % Emergency medical services 8 1.3 % Fire services 26 4.3 % Ocean rescue/lifeguard/beach patrol services 9 1.5 % City's emergency/hurricane preparedness efforts 20 3.3 % Efforts to address homelessness 22 3.6 % Efforts to manage stormwater drainage & flooding 29 4.8 % Reliability of potable (drinking) water 9 1.5 % Reliability of sewer (wastewater) services 12 2.0 % Quality of customer service 19 3.1 % City efforts to keep businesses informed 11 1.8 % None chosen 253 41.9 % Total 604 100.0 %
2019 City of Miami Beach Business Survey: Findings Report (WEIGHTED RESULTS)
ETC Institute (2019) Page 44
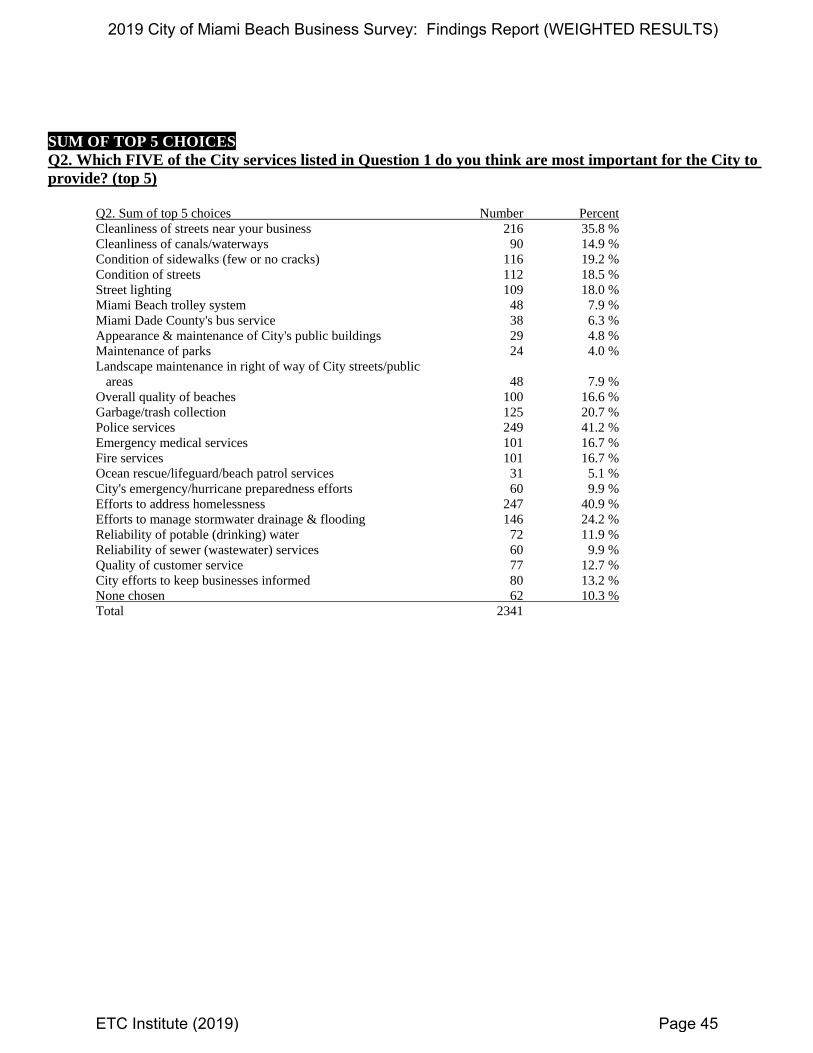
SUM OF TOP 5 CHOICES Q2. Which FIVE of the City services listed in Question 1 do you think are most important for the City to provide? (top 5) Q2. Sum of top 5 choices Number Percent Cleanliness of streets near your business 216 35.8 % Cleanliness of canals/waterways 90 14.9 % Condition of sidewalks (few or no cracks) 116 19.2 % Condition of streets 112 18.5 % Street lighting 109 18.0 % Miami Beach trolley system 48 7.9 % Miami Dade County's bus service 38 6.3 % Appearance & maintenance of City's public buildings 29 4.8 % Maintenance of parks 24 4.0 % Landscape maintenance in right of way of City streets/public areas 48 7.9 % Overall quality of beaches 100 16.6 % Garbage/trash collection 125 20.7 % Police services 249 41.2 % Emergency medical services 101 16.7 % Fire services 101 16.7 % Ocean rescue/lifeguard/beach patrol services 31 5.1 % City's emergency/hurricane preparedness efforts 60 9.9 % Efforts to address homelessness 247 40.9 % Efforts to manage stormwater drainage & flooding 146 24.2 % Reliability of potable (drinking) water 72 11.9 % Reliability of sewer (wastewater) services 60 9.9 % Quality of customer service 77 12.7 % City efforts to keep businesses informed 80 13.2 % None chosen 62 10.3 % Total 2341
2019 City of Miami Beach Business Survey: Findings Report (WEIGHTED RESULTS)
ETC Institute (2019) Page 45

Q3. During the past 12 months, how many times has your establishment been inspected? (e.g. for site plans, license, solicitation, signage, sanitation, property maintenance, zoning, noise.) Q3. How many times has your establishment been inspected Number Percent 0 209 34.6 % 1 137 22.7 % 2 104 17.2 % 3 59 9.8 % 4 23 3.8 % 5 18 3.0 % 6 12 2.0 % 7+ 42 7.0 % Total 604 100.0 % Q3a. How satisfied are you with the consistency and fairness of City inspections? Q3a. How satisfied are you with consistency & fairness of City inspections Number Percent Very satisfied 97 24.6 % Satisfied 143 36.2 % Neutral 78 19.7 % Dissatisfied 30 7.6 % Very dissatisfied 34 8.6 % Don't know 13 3.3 % Total 395 100.0 % WITHOUT “DON’T KNOW” Q3a. How satisfied are you with the consistency and fairness of City inspections? (without "don't know") Q3a. How satisfied are you with consistency & fairness of City inspections Number Percent Very satisfied 97 25.4 % Satisfied 143 37.4 % Neutral 78 20.4 % Dissatisfied 30 7.9 % Very dissatisfied 34 8.9 % Total 382 100.0 %
2019 City of Miami Beach Business Survey: Findings Report (WEIGHTED RESULTS)
ETC Institute (2019) Page 46
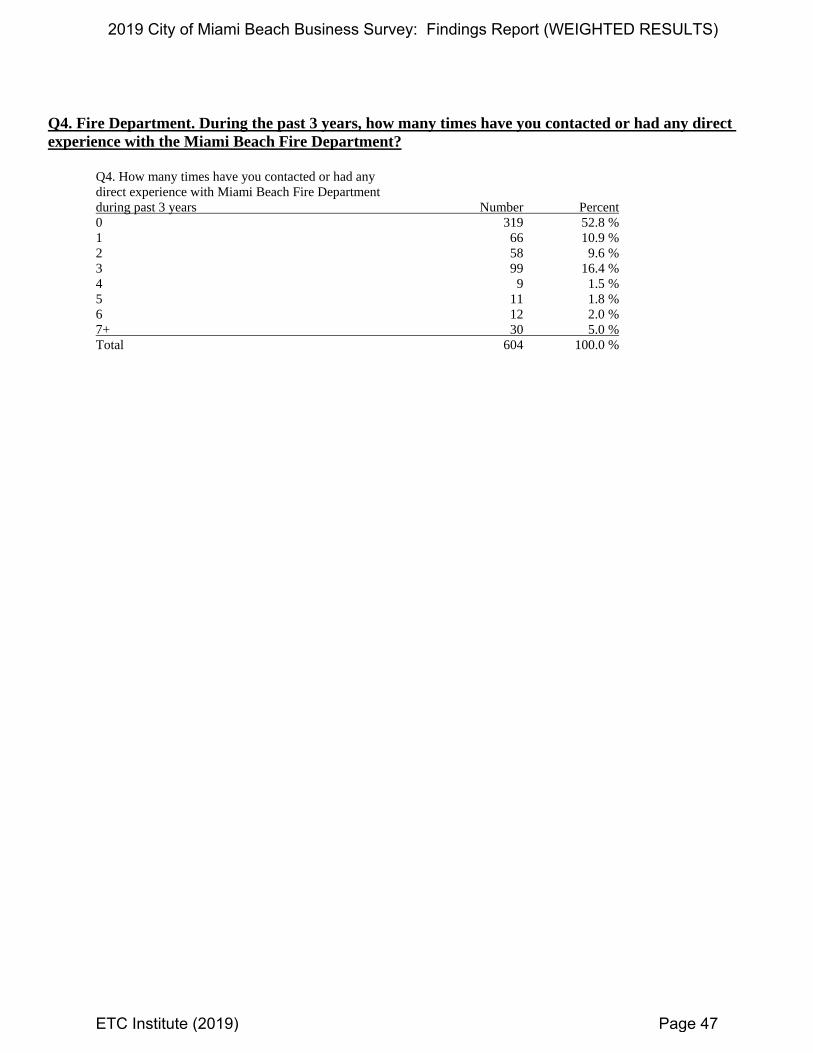
Q4. Fire Department. During the past 3 years, how many times have you contacted or had any direct experience with the Miami Beach Fire Department? Q4. How many times have you contacted or had any direct experience with Miami Beach Fire Department during past 3 years Number Percent 0 319 52.8 % 1 66 10.9 % 2 58 9.6 % 3 99 16.4 % 4 9 1.5 % 5 11 1.8 % 6 12 2.0 % 7+ 30 5.0 % Total 604 100.0 %
2019 City of Miami Beach Business Survey: Findings Report (WEIGHTED RESULTS)
ETC Institute (2019) Page 47

Q4a. Please rate your agreement with the following statements using a scale of 1 to 5, where 5 means "strongly agree" and 1 means "strongly disagree" based on your experience interacting with the Fire Department over the past THREE years. (N=285) Strongly Strongly agree Agree Neutral Disagree disagree Don't know Q4a-1. It was easy to contact someone who could help you in Fire Department 52.6% 23.5% 7.0% 2.5% 2.5% 11.9% Q4a-2. The employees who assisted me were courteous & professional 61.4% 23.5% 8.8% 1.8% 0.7% 3.9% Q4a-3. Fire Department employees possess the proper knowledge 57.2% 25.3% 8.1% 4.2% 0.0% 5.3% Q4a-4. Overall experience I had with City Fire Department was good 61.1% 23.5% 7.4% 2.8% 0.7% 4.6% Q4a-5. The inspections by Fire Department are consistent from one inspection to the next 54.4% 18.9% 6.3% 6.3% 4.9% 9.1% Q4a-6. The State Fire Code is fair 46.3% 21.8% 15.4% 3.5% 3.2% 9.8% Q4a-7. The professionalism of Fire Department staff conducting State fire code inspections 59.6% 25.6% 5.6% 1.1% 1.8% 6.3% Q4a-8. The Fire Department is open & interested in hearing the concerns or issues of businesses 45.3% 25.3% 12.3% 1.8% 3.9% 11.6%
2019 City of Miami Beach Business Survey: Findings Report (WEIGHTED RESULTS)
ETC Institute (2019) Page 48

WITHOUT “DON’T KNOW” Q4a. Please rate your agreement with the following statements using a scale of 1 to 5, where 5 means "strongly agree" and 1 means "strongly disagree" based on your experience interacting with the Fire Department over the past THREE years. (without "don't know") (N=285) Strongly Strongly agree Agree Neutral Disagree disagree Q4a-1. It was easy to contact someone who could help you in Fire Department 59.8% 26.7% 8.0% 2.8% 2.8% Q4a-2. The employees who assisted me were courteous & professional 63.9% 24.5% 9.1% 1.8% 0.7% Q4a-3. Fire Department employees possess the proper knowledge 60.4% 26.7% 8.5% 4.4% 0.0% Q4a-4. Overall experience I had with City Fire Department was good 64.0% 24.6% 7.7% 2.9% 0.7% Q4a-5. The inspections by Fire Department are consistent from one inspection to the next 59.8% 20.8% 6.9% 6.9% 5.4% Q4a-6. The State Fire Code is fair 51.4% 24.1% 17.1% 3.9% 3.5% Q4a-7. The professionalism of Fire Department staff conducting State fire code inspections 63.7% 27.3% 6.0% 1.1% 1.9% Q4a-8. The Fire Department is open & interested in hearing the concerns or issues of businesses 51.2% 28.6% 13.9% 2.0% 4.4%
2019 City of Miami Beach Business Survey: Findings Report (WEIGHTED RESULTS)
ETC Institute (2019) Page 49
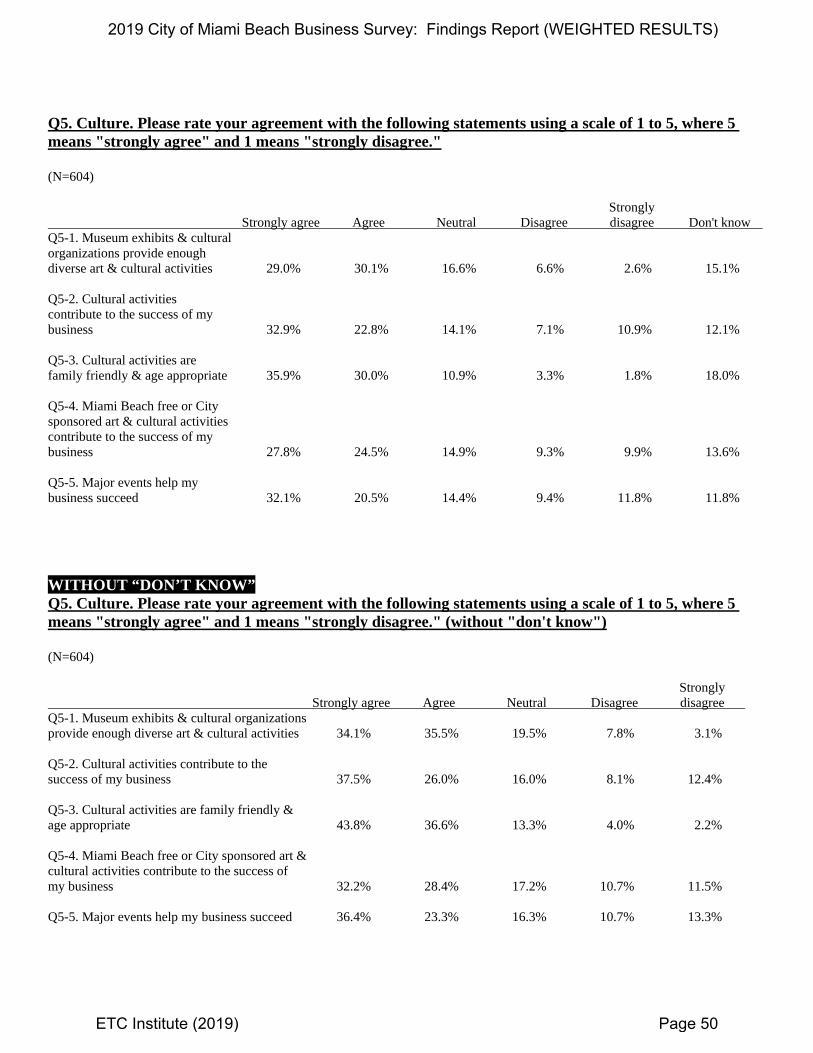
Q5. Culture. Please rate your agreement with the following statements using a scale of 1 to 5, where 5 means "strongly agree" and 1 means "strongly disagree." (N=604) Strongly Strongly agree Agree Neutral Disagree disagree Don't know Q5-1. Museum exhibits & cultural organizations provide enough diverse art & cultural activities 29.0% 30.1% 16.6% 6.6% 2.6% 15.1% Q5-2. Cultural activities contribute to the success of my business 32.9% 22.8% 14.1% 7.1% 10.9% 12.1% Q5-3. Cultural activities are family friendly & age appropriate 35.9% 30.0% 10.9% 3.3% 1.8% 18.0% Q5-4. Miami Beach free or City sponsored art & cultural activities contribute to the success of my business 27.8% 24.5% 14.9% 9.3% 9.9% 13.6% Q5-5. Major events help my business succeed 32.1% 20.5% 14.4% 9.4% 11.8% 11.8%
WITHOUT “DON’T KNOW” Q5. Culture. Please rate your agreement with the following statements using a scale of 1 to 5, where 5 means "strongly agree" and 1 means "strongly disagree." (without "don't know") (N=604) Strongly Strongly agree Agree Neutral Disagree disagree Q5-1. Museum exhibits & cultural organizations provide enough diverse art & cultural activities 34.1% 35.5% 19.5% 7.8% 3.1% Q5-2. Cultural activities contribute to the success of my business 37.5% 26.0% 16.0% 8.1% 12.4% Q5-3. Cultural activities are family friendly & age appropriate 43.8% 36.6% 13.3% 4.0% 2.2% Q5-4. Miami Beach free or City sponsored art & cultural activities contribute to the success of my business 32.2% 28.4% 17.2% 10.7% 11.5% Q5-5. Major events help my business succeed 36.4% 23.3% 16.3% 10.7% 13.3%
2019 City of Miami Beach Business Survey: Findings Report (WEIGHTED RESULTS)
ETC Institute (2019) Page 50

Q6. Do you think the Miami Beach Convention Center contributes positively to the overall value of doing business in Miami Beach? Q6. Does Miami Beach Convention Center contribute positively to overall value of doing business in Miami Beach Number Percent Yes 441 73.0 % No 81 13.4 % Don't know 82 13.6 % Total 604 100.0 %
WITHOUT “DON’T KNOW” Q6. Do you think the Miami Beach Convention Center contributes positively to the overall value of doing business in Miami Beach? (without "don't know") Q6. Does Miami Beach Convention Center contribute positively to overall value of doing business in Miami Beach Number Percent Yes 441 84.5 % No 81 15.5 % Total 522 100.0 %
Q7. Do you think the level of Miami Beach tourism adds value to the business community? Q7. Does level of Miami Beach tourism add value to the business community Number Percent Yes 494 81.8 % No 58 9.6 % Don't know 52 8.6 % Total 604 100.0 %
WITHOUT “DON’T KNOW” Q7. Do you think the level of Miami Beach tourism adds value to the business community? (without "don't know") Q7. Does level of Miami Beach tourism add value to the business community Number Percent Yes 494 89.5 % No 58 10.5 % Total 552 100.0 %
2019 City of Miami Beach Business Survey: Findings Report (WEIGHTED RESULTS)
ETC Institute (2019) Page 51
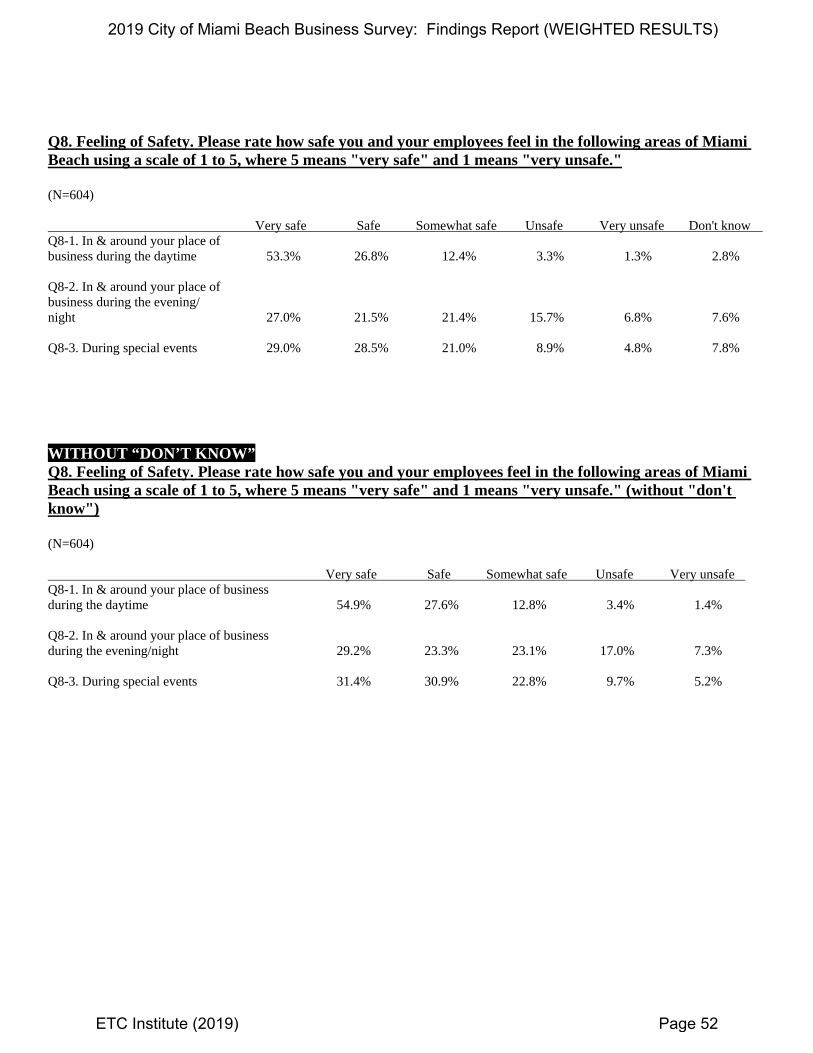
Q8. Feeling of Safety. Please rate how safe you and your employees feel in the following areas of Miami Beach using a scale of 1 to 5, where 5 means "very safe" and 1 means "very unsafe." (N=604) Very safe Safe Somewhat safe Unsafe Very unsafe Don't know Q8-1. In & around your place of business during the daytime 53.3% 26.8% 12.4% 3.3% 1.3% 2.8% Q8-2. In & around your place of business during the evening/ night 27.0% 21.5% 21.4% 15.7% 6.8% 7.6% Q8-3. During special events 29.0% 28.5% 21.0% 8.9% 4.8% 7.8%
WITHOUT “DON’T KNOW” Q8. Feeling of Safety. Please rate how safe you and your employees feel in the following areas of Miami Beach using a scale of 1 to 5, where 5 means "very safe" and 1 means "very unsafe." (without "don't know") (N=604) Very safe Safe Somewhat safe Unsafe Very unsafe Q8-1. In & around your place of business during the daytime 54.9% 27.6% 12.8% 3.4% 1.4% Q8-2. In & around your place of business during the evening/night 29.2% 23.3% 23.1% 17.0% 7.3% Q8-3. During special events 31.4% 30.9% 22.8% 9.7% 5.2%
2019 City of Miami Beach Business Survey: Findings Report (WEIGHTED RESULTS)
ETC Institute (2019) Page 52

Q9. Street Lighting. Do you think the amount of street lighting near your business is... Q9. What do you think the amount of street lighting near your business is Number Percent Too much/too bright 24 4.0 % About right 337 55.8 % Too little/too dark 202 33.4 % Don't know 41 6.8 % Total 604 100.0 % WITHOUT “DON’T KNOW” Q9. Street Lighting. Do you think the amount of street lighting near your business is... (without "don't know") Q9. What do you think the amount of street lighting near your business is Number Percent Too much/too bright 24 4.3 % About right 337 59.9 % Too little/too dark 202 35.9 % Total 563 100.0 %
2019 City of Miami Beach Business Survey: Findings Report (WEIGHTED RESULTS)
ETC Institute (2019) Page 53

Q10. Perceptions of the City. Please rate your satisfaction with each of the following using a scale of 1 to 5, where 5 means "very satisfied" and 1 means "very dissatisfied." (N=604) Very Very satisfied Satisfied Neutral Dissatisfied dissatisfied Don't know Q10-1. Overall image of City 27.0% 40.9% 17.9% 7.9% 3.3% 3.0% Q10-2. Quality of life 25.5% 36.4% 20.9% 8.8% 2.0% 6.5% Q10-3. Overall quality of City services 20.7% 41.6% 24.2% 7.3% 2.3% 4.0% Q10-4. Leadership provided by City's elected officials 16.1% 26.5% 22.4% 11.1% 7.1% 16.9% Q10-5. City efforts to plan for growth 19.7% 23.7% 20.0% 11.3% 10.9% 14.4% Q10-6. City efforts to prepare for the future 19.5% 24.2% 20.4% 10.6% 9.8% 15.6% Q10-7. City efforts to prepare for disasters 24.3% 32.3% 18.0% 7.5% 3.0% 14.9% Q10-8. City efforts to prevent crime 16.6% 30.8% 21.7% 11.6% 8.8% 10.6% Q10-9. Value you receive for City taxes your business pays 13.7% 24.3% 23.2% 14.9% 8.9% 14.9% Q10-10. City efforts to be a green or sustainable City 20.0% 26.3% 22.8% 10.1% 7.9% 12.7% Q10-11. City efforts to reduce risk from rainfall & sea-level rise 16.9% 26.0% 20.7% 10.4% 9.8% 16.2% Q10-12. City regulation of residential development 14.1% 23.7% 20.5% 10.8% 11.3% 19.7% Q10-13. City regulation of commercial development 14.1% 22.8% 21.5% 12.4% 13.9% 15.2% Q10-14. Quality of public schools 11.4% 18.4% 15.7% 7.1% 4.0% 43.4%
2019 City of Miami Beach Business Survey: Findings Report (WEIGHTED RESULTS)
ETC Institute (2019) Page 54

WITHOUT “DON’T KNOW” Q10. Perceptions of the City. Please rate your satisfaction with each of the following using a scale of 1 to 5, where 5 means "very satisfied" and 1 means "very dissatisfied." (without "don't know") (N=604) Very Very satisfied Satisfied Neutral Dissatisfied dissatisfied Q10-1. Overall image of City 27.8% 42.2% 18.4% 8.2% 3.4% Q10-2. Quality of life 27.3% 38.9% 22.3% 9.4% 2.1% Q10-3. Overall quality of City services 21.6% 43.3% 25.2% 7.6% 2.4% Q10-4. Leadership provided by City's elected officials 19.3% 31.9% 26.9% 13.3% 8.6% Q10-5. City efforts to plan for growth 23.0% 27.7% 23.4% 13.2% 12.8% Q10-6. City efforts to prepare for the future 23.1% 28.6% 24.1% 12.5% 11.6% Q10-7. City efforts to prepare for disasters 28.6% 37.9% 21.2% 8.8% 3.5% Q10-8. City efforts to prevent crime 18.5% 34.4% 24.3% 13.0% 9.8% Q10-9. Value you receive for City taxes your business pays 16.1% 28.6% 27.2% 17.5% 10.5% Q10-10. City efforts to be a green or sustainable City 23.0% 30.2% 26.2% 11.6% 9.1% Q10-11. City efforts to reduce risk from rainfall & sea-level rise 20.2% 31.0% 24.7% 12.5% 11.7% Q10-12. City regulation of residential development 17.5% 29.5% 25.6% 13.4% 14.0% Q10-13. City regulation of commercial development 16.6% 27.0% 25.4% 14.6% 16.4% Q10-14. Quality of public schools 20.2% 32.5% 27.8% 12.6% 7.0%
2019 City of Miami Beach Business Survey: Findings Report (WEIGHTED RESULTS)
ETC Institute (2019) Page 55
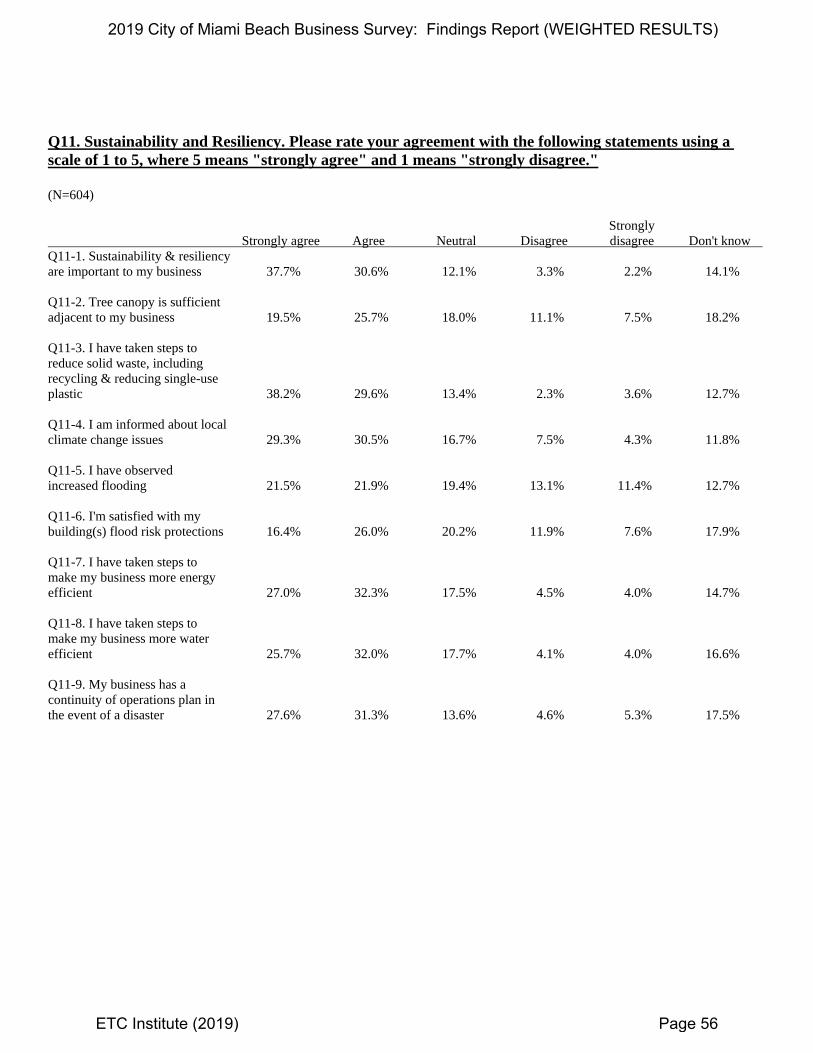
Q11. Sustainability and Resiliency. Please rate your agreement with the following statements using a scale of 1 to 5, where 5 means "strongly agree" and 1 means "strongly disagree." (N=604) Strongly Strongly agree Agree Neutral Disagree disagree Don't know Q11-1. Sustainability & resiliency are important to my business 37.7% 30.6% 12.1% 3.3% 2.2% 14.1% Q11-2. Tree canopy is sufficient adjacent to my business 19.5% 25.7% 18.0% 11.1% 7.5% 18.2% Q11-3. I have taken steps to reduce solid waste, including recycling & reducing single-use plastic 38.2% 29.6% 13.4% 2.3% 3.6% 12.7% Q11-4. I am informed about local climate change issues 29.3% 30.5% 16.7% 7.5% 4.3% 11.8% Q11-5. I have observed increased flooding 21.5% 21.9% 19.4% 13.1% 11.4% 12.7% Q11-6. I'm satisfied with my building(s) flood risk protections 16.4% 26.0% 20.2% 11.9% 7.6% 17.9% Q11-7. I have taken steps to make my business more energy efficient 27.0% 32.3% 17.5% 4.5% 4.0% 14.7% Q11-8. I have taken steps to make my business more water efficient 25.7% 32.0% 17.7% 4.1% 4.0% 16.6% Q11-9. My business has a continuity of operations plan in the event of a disaster 27.6% 31.3% 13.6% 4.6% 5.3% 17.5%
2019 City of Miami Beach Business Survey: Findings Report (WEIGHTED RESULTS)
ETC Institute (2019) Page 56

WITHOUT “DON’T KNOW” Q11. Sustainability and Resiliency. Please rate your agreement with the following statements using a scale of 1 to 5, where 5 means "strongly agree" and 1 means "strongly disagree." (without "don't know") (N=604) Strongly Strongly agree Agree Neutral Disagree disagree Q11-1. Sustainability & resiliency are important to my business 43.9% 35.6% 14.1% 3.9% 2.5% Q11-2. Tree canopy is sufficient adjacent to my business 23.9% 31.4% 22.1% 13.6% 9.1% Q11-3. I have taken steps to reduce solid waste, including recycling & reducing single- use plastic 43.8% 34.0% 15.4% 2.7% 4.2% Q11-4. I am informed about local climate change issues 33.2% 34.5% 18.9% 8.4% 4.9% Q11-5. I have observed increased flooding 24.7% 25.0% 22.2% 15.0% 13.1% Q11-6. I'm satisfied with my building(s) flood risk protections 20.0% 31.7% 24.6% 14.5% 9.3% Q11-7. I have taken steps to make my business more energy efficient 31.7% 37.9% 20.6% 5.2% 4.7% Q11-8. I have taken steps to make my business more water efficient 30.8% 38.3% 21.2% 5.0% 4.8% Q11-9. My business has a continuity of operations plan in the event of a disaster 33.5% 38.0% 16.5% 5.6% 6.4%
2019 City of Miami Beach Business Survey: Findings Report (WEIGHTED RESULTS)
ETC Institute (2019) Page 57
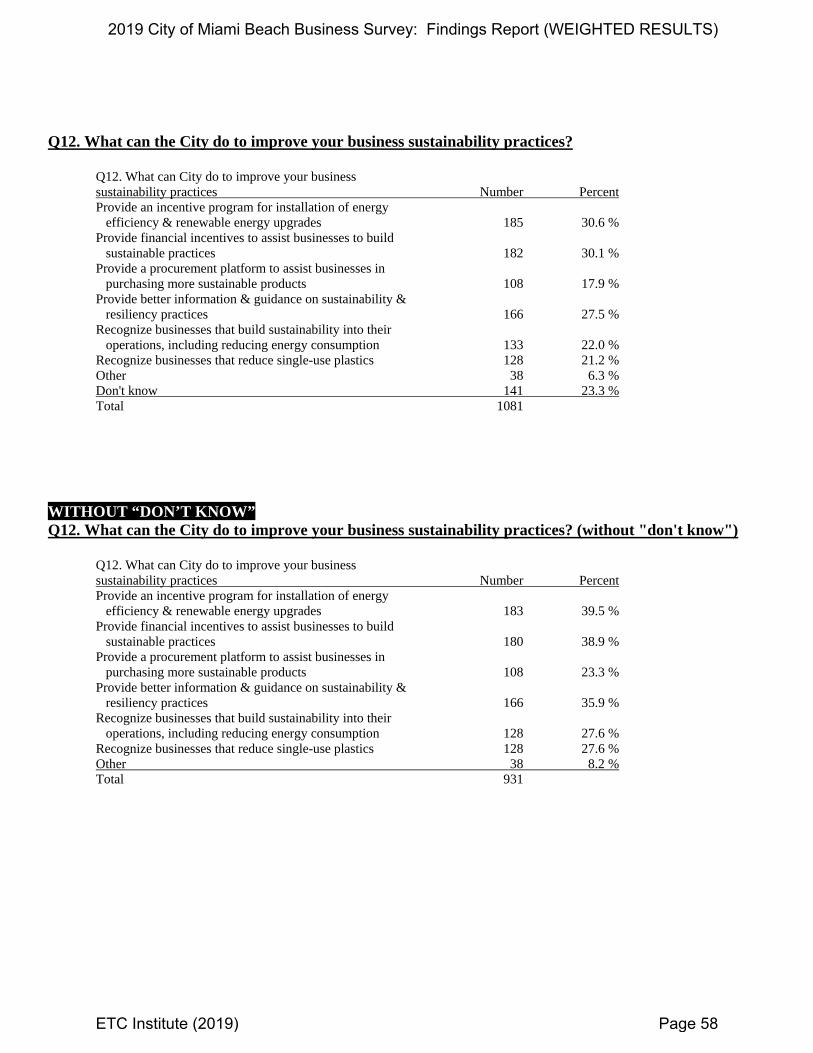
Q12. What can the City do to improve your business sustainability practices? Q12. What can City do to improve your business sustainability practices Number Percent Provide an incentive program for installation of energy efficiency & renewable energy upgrades 185 30.6 % Provide financial incentives to assist businesses to build sustainable practices 182 30.1 % Provide a procurement platform to assist businesses in purchasing more sustainable products 108 17.9 % Provide better information & guidance on sustainability & resiliency practices 166 27.5 % Recognize businesses that build sustainability into their operations, including reducing energy consumption 133 22.0 % Recognize businesses that reduce single-use plastics 128 21.2 % Other 38 6.3 % Don't know 141 23.3 % Total 1081 WITHOUT “DON’T KNOW” Q12. What can the City do to improve your business sustainability practices? (without "don't know") Q12. What can City do to improve your business sustainability practices Number Percent Provide an incentive program for installation of energy efficiency & renewable energy upgrades 183 39.5 % Provide financial incentives to assist businesses to build sustainable practices 180 38.9 % Provide a procurement platform to assist businesses in purchasing more sustainable products 108 23.3 % Provide better information & guidance on sustainability & resiliency practices 166 35.9 % Recognize businesses that build sustainability into their operations, including reducing energy consumption 128 27.6 % Recognize businesses that reduce single-use plastics 128 27.6 % Other 38 8.2 % Total 931
2019 City of Miami Beach Business Survey: Findings Report (WEIGHTED RESULTS)
ETC Institute (2019) Page 58
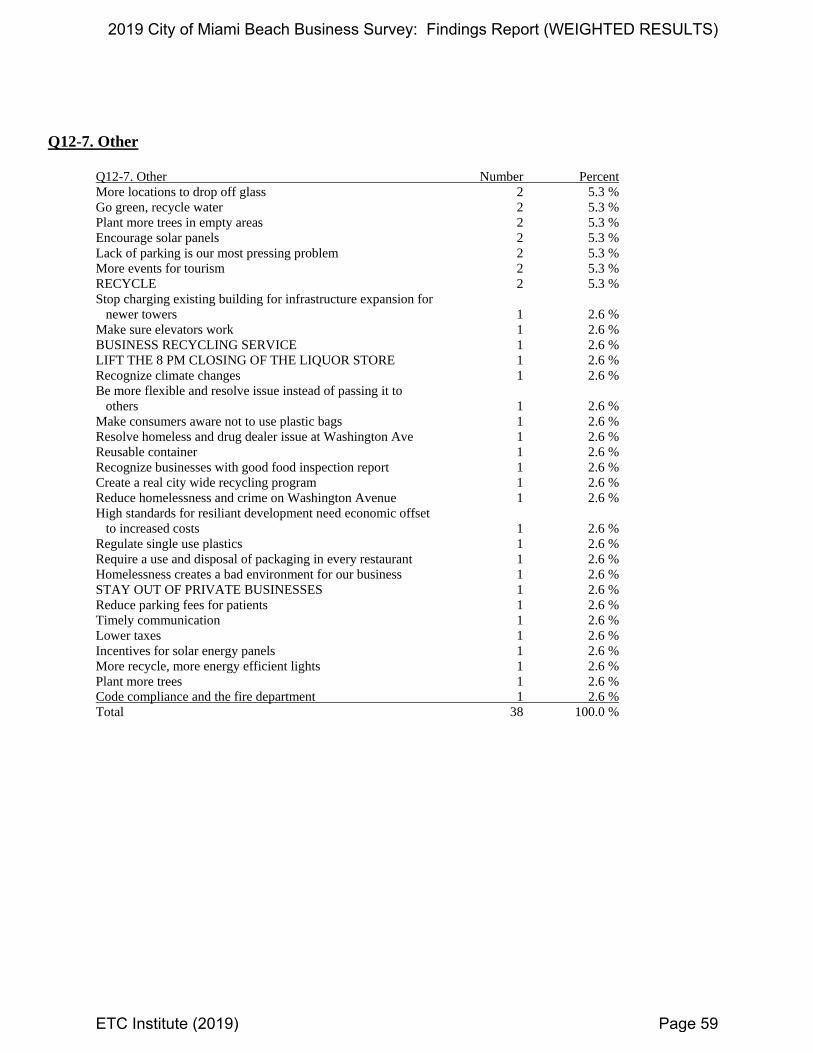
Q12-7. Other Q12-7. Other Number Percent More locations to drop off glass 2 5.3 % Go green, recycle water 2 5.3 % Plant more trees in empty areas 2 5.3 % Encourage solar panels 2 5.3 % Lack of parking is our most pressing problem 2 5.3 % More events for tourism 2 5.3 % RECYCLE 2 5.3 % Stop charging existing building for infrastructure expansion for newer towers 1 2.6 % Make sure elevators work 1 2.6 % BUSINESS RECYCLING SERVICE 1 2.6 % LIFT THE 8 PM CLOSING OF THE LIQUOR STORE 1 2.6 % Recognize climate changes 1 2.6 % Be more flexible and resolve issue instead of passing it to others 1 2.6 % Make consumers aware not to use plastic bags 1 2.6 % Resolve homeless and drug dealer issue at Washington Ave 1 2.6 % Reusable container 1 2.6 % Recognize businesses with good food inspection report 1 2.6 % Create a real city wide recycling program 1 2.6 % Reduce homelessness and crime on Washington Avenue 1 2.6 % High standards for resiliant development need economic offset to increased costs 1 2.6 % Regulate single use plastics 1 2.6 % Require a use and disposal of packaging in every restaurant 1 2.6 % Homelessness creates a bad environment for our business 1 2.6 % STAY OUT OF PRIVATE BUSINESSES 1 2.6 % Reduce parking fees for patients 1 2.6 % Timely communication 1 2.6 % Lower taxes 1 2.6 % Incentives for solar energy panels 1 2.6 % More recycle, more energy efficient lights 1 2.6 % Plant more trees 1 2.6 % Code compliance and the fire department 1 2.6 % Total 38 100.0 %
2019 City of Miami Beach Business Survey: Findings Report (WEIGHTED RESULTS)
ETC Institute (2019) Page 59

Q13. How supportive are you of the City of Miami Beach spending tax dollars to address sea-level rise? Q13. How supportive are you of City of Miami Beach spending tax dollars to address sea-level rise Number Percent Very supportive 233 38.6 % Supportive 151 25.0 % Neutral 96 15.9 % Not supportive 30 5.0 % Not at all supportive 25 4.1 % Don't know 69 11.4 % Total 604 100.0 % WITHOUT “DON’T KNOW” Q13. How supportive are you of the City of Miami Beach spending tax dollars to address sea-level rise? (without "don't know") Q13. How supportive are you of City of Miami Beach spending tax dollars to address sea-level rise Number Percent Very supportive 233 43.6 % Supportive 151 28.2 % Neutral 96 17.9 % Not supportive 30 5.6 % Not at all supportive 25 4.7 % Total 535 100.0 %
2019 City of Miami Beach Business Survey: Findings Report (WEIGHTED RESULTS)
ETC Institute (2019) Page 60

Q14. How willing would you be to pay more taxes to fund maintenance of assets such as buildings, roads, streets, sidewalks, and vehicles? Q14. How willing would you be to pay more taxes to fund maintenance of assets Number Percent Very willing 50 8.3 % Willing 125 20.7 % Neutral 140 23.2 % Not willing 108 17.9 % Not at all willing 116 19.2 % Don't know 65 10.8 % Total 604 100.0 % WITHOUT “DON’T KNOW” Q14. How willing would you be to pay more taxes to fund maintenance of assets such as buildings, roads, streets, sidewalks, and vehicles? (without "don't know") Q14. How willing would you be to pay more taxes to fund maintenance of assets Number Percent Very willing 50 9.3 % Willing 125 23.2 % Neutral 140 26.0 % Not willing 108 20.0 % Not at all willing 116 21.5 % Total 539 100.0 %
2019 City of Miami Beach Business Survey: Findings Report (WEIGHTED RESULTS)
ETC Institute (2019) Page 61

Q15. Code Enforcement. Do you think the level of code and ordinance enforcement established by the City of Miami Beach near your business is... Q15. What do you think the level of code & ordinance enforcement established by City of Miami Beach near your business is Number Percent Too much/too restrictive 167 27.6 % About right 265 43.9 % Too little/not restrictive enough 86 14.2 % Don't know 86 14.2 % Total 604 100.0 %
WITHOUT “DON’T KNOW” Q15. Code Enforcement. Do you think the level of code and ordinance enforcement established by the City of Miami Beach near your business is... (without "don't know") Q15. What do you think the level of code & ordinance enforcement established by City of Miami Beach near your business is Number Percent Too much/too restrictive 167 32.2 % About right 265 51.2 % Too little/not restrictive enough 86 16.6 % Total 518 100.0 %
2019 City of Miami Beach Business Survey: Findings Report (WEIGHTED RESULTS)
ETC Institute (2019) Page 62

Q16. Transportation and Mobility. Over the past 12 months, how would you rate the effectiveness of public transit for employee commuting? Q16. How would you rate effectiveness of public transit for employee commuting over past 12 months Number Percent Excellent 55 9.1 % Good 134 22.2 % Fair 120 19.9 % Poor 87 14.4 % Don't know 208 34.4 % Total 604 100.0 % WITHOUT “DON’T KNOW” Q16. Transportation and Mobility. Over the past 12 months, how would you rate the effectiveness of public transit for employee commuting? (without "don't know") Q16. How would you rate effectiveness of public transit for employee commuting over past 12 months Number Percent Excellent 55 13.9 % Good 134 33.8 % Fair 120 30.3 % Poor 87 22.0 % Total 396 100.0 %
2019 City of Miami Beach Business Survey: Findings Report (WEIGHTED RESULTS)
ETC Institute (2019) Page 63

Q17. Which of the following has your business done to provide additional transit options for your employees? Q17. What has your business done to provide additional transit options for your employees Number Percent Provide free or subsidized parking spots 169 28.0 % Encourage public transit use 85 14.1 % Coordinate carpool(s) 33 5.5 % Other 25 4.1 % None at this time 344 57.0 % Total 656
Q17-4. Other Q17-4. Other Number Percent Uber, Lyft 6 24.0 % Uber 5 20.0 % Free water 2 8.0 % Walk 2 8.0 % More trolleys 1 4.0 % Promote Trolley use 1 4.0 % Provide electric bike 1 4.0 % COME EARLY 1 4.0 % Bike 1 4.0 % Let employees move their cars during the day 1 4.0 % Uber, bikes or walk 1 4.0 % Valet 1 4.0 % Have spaces that are empty 1 4.0 % Bike racks 1 4.0 % Total 25 100.0 %
2019 City of Miami Beach Business Survey: Findings Report (WEIGHTED RESULTS)
ETC Institute (2019) Page 64

Q18. Which ONE of the following best describes the availability of public and private parking for your customers? Q18. What best describes the availability of public & private parking for your customers Number Percent There are almost always parking spaces nearby 113 18.7 % There are often parking spaces nearby 118 19.5 % There are seldom parking spaces nearby 142 23.5 % There are almost never parking spaces nearby 162 26.8 % Don't know 69 11.4 % Total 604 100.0 % WITHOUT “DON’T KNOW” Q18. Which ONE of the following best describes the availability of public and private parking for your customers? (without "don't know") Q18. What best describes the availability of public & private parking for your customers Number Percent There are almost always parking spaces nearby 113 21.1 % There are often parking spaces nearby 118 22.1 % There are seldom parking spaces nearby 142 26.5 % There are almost never parking spaces nearby 162 30.3 % Total 535 100.0 %
2019 City of Miami Beach Business Survey: Findings Report (WEIGHTED RESULTS)
ETC Institute (2019) Page 65

Q19. Communication. Which sources do you utilize to obtain information about City government, issues, and events? Q19. What sources do you utilize to obtain information about City government, issues, & events Number Percent MB Magazine 173 28.6 % MBTV (City's TV Government channel) 52 8.6 % Twitter 64 10.6 % Facebook 106 17.5 % City Website (www.miamibeachfl.gov) 308 51.0 % City email news 249 41.2 % Nextdoor app 31 5.1 % Radio (1670 AM) 22 3.6 % Forums/workshops/meetings 36 6.0 % City's E-Gov app 35 5.8 % Other news media 45 7.5 % HOA's or other civic groups 29 4.8 % Police Department's social media platforms 23 3.8 % Text messages 40 6.6 % Total 1213 Q19-11. Other news media: Q19-11. Other news media Number Percent Word of mouth 6 13.3 % Newspaper 5 11.1 % TV news 4 8.9 % TV 4 8.9 % Mail 3 6.7 % Flyers 2 4.4 % Face to Face 2 4.4 % NPR, emails from commissioner 2 4.4 % Miami Herald, local TV channels 2 4.4 % Radio 2 4.4 % Everything else but the above 2 4.4 % Instagram 2 4.4 % New Times 1 2.2 % Local news apps 1 2.2 % Hearald and New Times 1 2.2 % Mayor 1 2.2 % Internet 1 2.2 % Google news of Miami Beach 1 2.2 % Local news on Facebook, Miami Beach HIB on Facebook 1 2.2 % Google 1 2.2 % Local news 1 2.2 % Total 45 100.0 %
2019 City of Miami Beach Business Survey: Findings Report (WEIGHTED RESULTS)
ETC Institute (2019) Page 66

Q19-12. HOA's or other civic groups: Q19-12. HOA's or other civic groups Number Percent MB Chamber 1 16.7 % SDFL 1 16.7 % The Excelsior Condo 1 16.7 % Wavna 1 16.7 % Nautilus Homeowners Association 1 16.7 % NAHA 1 16.7 % Total 6 100.0 % Q19a. Which THREE of the communication channels listed in Question 19 do you prefer? Q19a. Top choice Number Percent MB Magazine 79 13.1 % MBTV (City's TV Government channel) 14 2.3 % Twitter 33 5.5 % Facebook 31 5.1 % City Website (www.miamibeachfl.gov) 146 24.2 % City email news 119 19.7 % Nextdoor app 2 0.3 % Radio (1670 AM) 6 1.0 % Forums/workshops/meetings 6 1.0 % City's E-Gov app 1 0.2 % Other news media 22 3.6 % HOA's or other civic groups 3 0.5 % Police Department's social media platforms 2 0.3 % Text messages 21 3.5 % None chosen 119 19.7 % Total 604 100.0 %
2019 City of Miami Beach Business Survey: Findings Report (WEIGHTED RESULTS)
ETC Institute (2019) Page 67

Q19a. Which THREE of the communication channels listed in Question 19 do you prefer? Q19a. 2nd choice Number Percent MB Magazine 30 5.0 % MBTV (City's TV Government channel) 15 2.5 % Twitter 14 2.3 % Facebook 40 6.6 % City Website (www.miamibeachfl.gov) 84 13.9 % City email news 99 16.4 % Nextdoor app 5 0.8 % Radio (1670 AM) 5 0.8 % Forums/workshops/meetings 8 1.3 % City's E-Gov app 7 1.2 % Other news media 14 2.3 % HOA's or other civic groups 12 2.0 % Police Department's social media platforms 3 0.5 % Text messages 16 2.6 % None chosen 252 41.7 % Total 604 100.0 %
Q19a. Which THREE of the communication channels listed in Question 19 do you prefer? Q19a. 3rd choice Number Percent MB Magazine 34 5.6 % MBTV (City's TV Government channel) 7 1.2 % Twitter 7 1.2 % Facebook 20 3.3 % City Website (www.miamibeachfl.gov) 40 6.6 % City email news 41 6.8 % Nextdoor app 8 1.3 % Radio (1670 AM) 5 0.8 % Forums/workshops/meetings 9 1.5 % City's E-Gov app 12 2.0 % Other news media 13 2.2 % HOA's or other civic groups 3 0.5 % Police Department's social media platforms 5 0.8 % Text messages 29 4.8 % None chosen 371 61.4 % Total 604 100.0 %
2019 City of Miami Beach Business Survey: Findings Report (WEIGHTED RESULTS)
ETC Institute (2019) Page 68

SUM OF TOP 3 CHOICES Q19a. Which THREE of the communication channels listed in Question 19 do you prefer? (top 3) Q19a. Sum of top 3 choices Number Percent MB Magazine 143 23.7 % MBTV (City's TV Government channel) 36 6.0 % Twitter 54 8.9 % Facebook 91 15.1 % City Website (www.miamibeachfl.gov) 270 44.7 % City email news 259 42.9 % Nextdoor app 15 2.5 % Radio (1670 AM) 16 2.6 % Forums/workshops/meetings 23 3.8 % City's E-Gov app 20 3.3 % Other news media 49 8.1 % HOA's or other civic groups 18 3.0 % Police Department's social media platforms 10 1.7 % Text messages 66 10.9 % None chosen 119 19.7 % Total 1189
2019 City of Miami Beach Business Survey: Findings Report (WEIGHTED RESULTS)
ETC Institute (2019) Page 69

Q20. Customer Service. In the last 12 months, how many times have you personally contacted, either by phone, in-person, or electronically, the City of Miami Beach government with a question, service request, or complaint? Q20. How many times have you personally contacted City of Miami Beach government in last 12 months Number Percent 0-5 486 80.5 % 6-10 60 9.9 % 11-15 28 4.6 % 16-20 11 1.8 % 20+ 15 2.5 % Not provided 4 0.7 % Total 604 100.0 %
WITHOUT “NOT PROVIDED” Q20. Customer Service. In the last 12 months, how many times have you personally contacted, either by phone, in-person, or electronically, the City of Miami Beach government with a question, service request, or complaint? (without "not provided") Q20. How many times have you personally contacted City of Miami Beach government in last 12 months Number Percent 0-5 486 81.0 % 6-10 60 10.0 % 11-15 28 4.7 % 16-20 11 1.8 % 20+ 15 2.5 % Total 600 100.0 %
2019 City of Miami Beach Business Survey: Findings Report (WEIGHTED RESULTS)
ETC Institute (2019) Page 70

Q20a. What was the reason for your most recent contact? Q20a. What was the reason for your most recent contact Number Percent Pay a bill 44 12.8 % Visit an elected official 10 2.9 % Research an issue 57 16.6 % Pull a building permit/plan review 70 20.3 % Attend a program/event 7 2.0 % File a complaint 47 13.7 % Other 91 26.5 % Not provided 18 5.2 % Total 344 100.0 % WITHOUT “NOT PROVIDED” Q20a. What was the reason for your most recent contact? (without "not provided") Q20a. What was the reason for your most recent contact Number Percent Pay a bill 44 13.5 % Visit an elected official 10 3.1 % Research an issue 57 17.5 % Pull a building permit/plan review 70 21.5 % Attend a program/event 7 2.1 % File a complaint 47 14.4 % Other 91 27.9 % Total 326 100.0 %
2019 City of Miami Beach Business Survey: Findings Report (WEIGHTED RESULTS)
ETC Institute (2019) Page 71

Q20a-7. Other Q20a-7. Other Number Percent License 14 17.5 % Parking 9 11.3 % Police 7 8.8 % Code compliance 5 6.3 % Parking tickets 4 5.0 % Homelessness 3 3.8 % Park and broken beach shower fountains 2 2.5 % Public works 2 2.5 % Water bill complaint 2 2.5 % Events, contact the Mayors aids 2 2.5 % Finance commissioner 2 2.5 % Business permit 1 1.3 % Resolve issues 1 1.3 % Parking issues 1 1.3 % Parking dept 1 1.3 % Renew ordinance 1 1.3 % Restriction to sell alcohol after 8 pm when bars next door can sell all night long 1 1.3 % License dept 1 1.3 % Finance 1 1.3 % Resolution of local business tax 1 1.3 % Security/police 1 1.3 % PARK NOT WORKING 1 1.3 % Zoning code fine 1 1.3 % Visited VCA for a meeting 1 1.3 % Btax 1 1.3 % Utilities 1 1.3 % Street lighting 1 1.3 % Trash 1 1.3 % Feral cats 1 1.3 % Dumpster access 1 1.3 % Sidewalk drain cover missing 1 1.3 % Garbage disposal 1 1.3 % Code and parking enforcement 1 1.3 % Resident parking renewal 1 1.3 % Place a Police Watch Order 1 1.3 % BTR registration 1 1.3 % Fire dept 1 1.3 % Plan event 1 1.3 % Fixing service road 1 1.3 % Total 80 100.0 %
2019 City of Miami Beach Business Survey: Findings Report (WEIGHTED RESULTS)
ETC Institute (2019) Page 72

Q20b. Please rate your agreement with the following statements using a scale of 1 to 5, where 5 means "strongly agree" and 1 means "strongly disagree," based on your most recent interaction with City employees. (N=344) Strongly Strongly agree Agree Neutral Disagree disagree Don't know Q20b-1. City of Miami Beach government is open & interested in hearing the concerns or issues of businesses 21.2% 27.6% 23.0% 13.4% 9.9% 4.9% Q20b-2. It is easy to contact someone at City who can help you 20.3% 26.7% 18.3% 18.0% 13.7% 2.9% Q20b-3. City employees are courteous & professional 31.1% 36.6% 19.8% 6.1% 3.8% 2.6% Q20b-4. City employees possess the proper knowledge 21.2% 35.2% 19.5% 12.5% 8.4% 3.2% Q20b-5. During my most recent contact with City, I found the process to be user-friendly & easy to understand 21.2% 28.2% 20.3% 15.7% 12.2% 2.3% Q20b-6. During my most recent contact with City, the requests made by my business were processed in a timely manner 21.8% 25.6% 18.3% 12.8% 16.9% 4.7% Q20b-7. During my most recent contact with City, I was satisfied with the experience I had 21.8% 27.3% 19.2% 11.9% 17.2% 2.6%
2019 City of Miami Beach Business Survey: Findings Report (WEIGHTED RESULTS)
ETC Institute (2019) Page 73

WITHOUT “DON’T KNOW” Q20b. Please rate your agreement with the following statements using a scale of 1 to 5, where 5 means "strongly agree" and 1 means "strongly disagree," based on your most recent interaction with City employees. (without "don't know") (N=344) Strongly Strongly agree Agree Neutral Disagree disagree Q20b-1. City of Miami Beach government is open & interested in hearing the concerns or issues of businesses 22.3% 29.1% 24.2% 14.1% 10.4% Q20b-2. It is easy to contact someone at City who can help you 21.0% 27.5% 18.9% 18.6% 14.1% Q20b-3. City employees are courteous & professional 31.9% 37.6% 20.3% 6.3% 3.9% Q20b-4. City employees possess the proper knowledge 21.9% 36.3% 20.1% 12.9% 8.7% Q20b-5. During my most recent contact with City, I found the process to be user-friendly & easy to understand 21.7% 28.9% 20.8% 16.1% 12.5% Q20b-6. During my most recent contact with City, the requests made by my business were processed in a timely manner 22.9% 26.8% 19.2% 13.4% 17.7% Q20b-7. During my most recent contact with City, I was satisfied with the experience I had 22.4% 28.1% 19.7% 12.2% 17.6%
2019 City of Miami Beach Business Survey: Findings Report (WEIGHTED RESULTS)
ETC Institute (2019) Page 74

Q21. What is the primary reason your business originally decided to locate in Miami Beach?
• A dream that I never had fulfilled. • A LOT OF FOOT TRAFFIC • a lot of wealth going thru the city • a need • access to ocean • already lived here • area is great • beach • Beach • beach • Beach / and I was fooled by the courteous nature of City employees into thinking they were here
to help when all they do is bounce you from Dept to Dept finding ways to stall or stop your business
• BEACH, WEATHER, FRIENDS • Beaches, events • Beaches, livelihood • Because the type of food they serve appeals to a very diverse market. • born here • born here • bought business 40 years ago • business • business opportunity • business was already here • business year round • busy location • busy location • cheap rent, location • circumstances • City 's affluence of population • clean • Clients • clients • Clients/Hospital • Clients/Hospital • Climate • climate and nice beaches which now look terrible with mounds of seaweed that the city refuses to
remove, and full of dangerous homeless people sleeping on the beach !!!! • Close to home • Close to home • Close to home
2019 City of Miami Beach Business Survey: Findings Report (WEIGHTED RESULTS)
ETC Institute (2019) Page 75
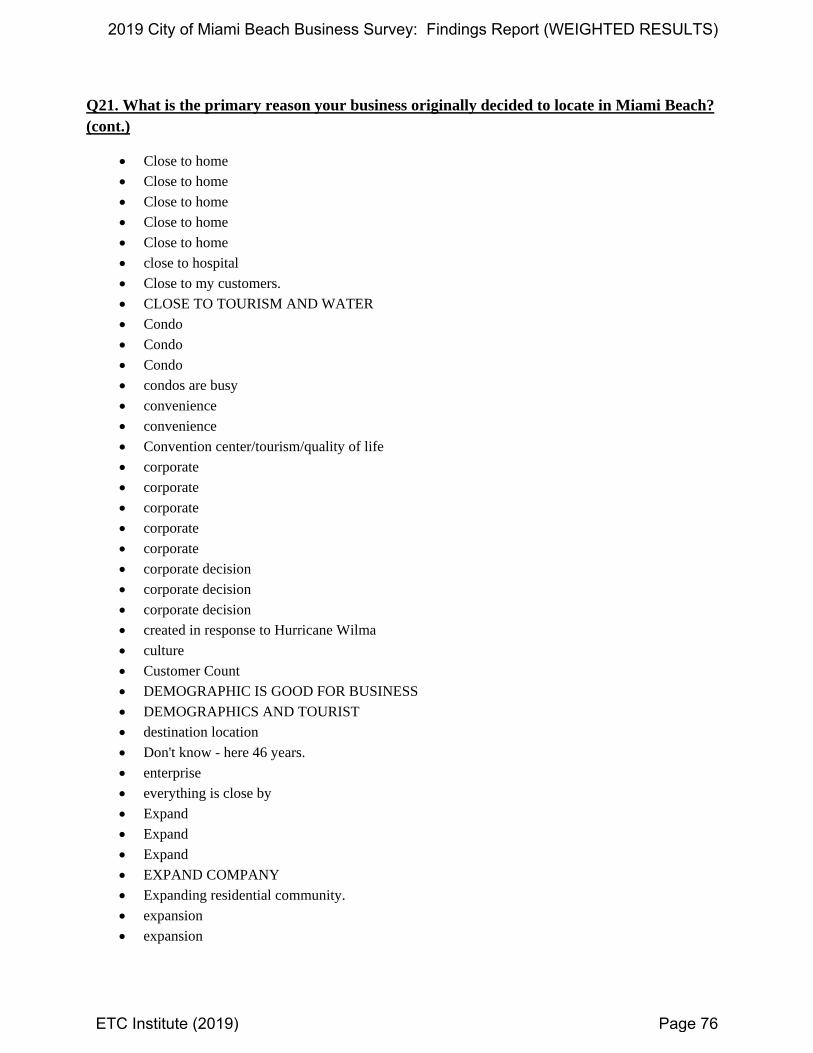
Q21. What is the primary reason your business originally decided to locate in Miami Beach? (cont.)
• Close to home • Close to home • Close to home • Close to home • Close to home • close to hospital • Close to my customers. • CLOSE TO TOURISM AND WATER • Condo • Condo • Condo • condos are busy • convenience • convenience • Convention center/tourism/quality of life • corporate • corporate • corporate • corporate • corporate • corporate decision • corporate decision • corporate decision • created in response to Hurricane Wilma • culture • Customer Count • DEMOGRAPHIC IS GOOD FOR BUSINESS • DEMOGRAPHICS AND TOURIST • destination location • Don't know - here 46 years. • enterprise • everything is close by • Expand • Expand • Expand • EXPAND COMPANY • Expanding residential community. • expansion • expansion
2019 City of Miami Beach Business Survey: Findings Report (WEIGHTED RESULTS)
ETC Institute (2019) Page 76

Q21. What is the primary reason your business originally decided to locate in Miami Beach? (cont.)
• Family • Family • Family • Family - liked location. • family business • Foot traffic • Foot traffic and tourism drive my business sales. • for being the doors to Latin America • founded here • from here • golf course • good clientele • good location • good location, central to business • good place for business • good place to do business • good place to live • Great location • Great location • Great location • great location for real estate business • great place to have parking garage • HAD CLIENTS HERE AND LIKED THE VIBE OF THE BEACH. • had previous business here • HAVE FOR 20 YEARS • HIGH TOURISM MARKET • historical place • home • home • home • home • home • home • home • home • home based • home business • Hospitality business. Great city. • Hotel
2019 City of Miami Beach Business Survey: Findings Report (WEIGHTED RESULTS)
ETC Institute (2019) Page 77

Q21. What is the primary reason your business originally decided to locate in Miami Beach? (cont.)
• I GREW UP HERE • I live here • I live here • I live here • I live in Miami Beach/Surfside area. • I live local • I live on beach. • I love Miami Beach • I LOVE THE BEACH • I reside in Miami beach • Impression developed previously as a guest to City • IT IS A GOOD PLACE FOR A CURRENCY EXCHANGE BUSINESS. • It is a great town for apartment/condo rentals • It is my home town • It was a place where everything was nice and easy, clean and organized and most important
tourist felt safe. • its where I grew up and live • its where I grew up and my business focuses on the assets Miami Beach offers, the ocean and
tourism. • I've lived on Miami beach for 30 years. it's only natural to be a pedestrian. In this urban paradise. • joint venture • large clientele • large need • Lifestyle • Lifestyle • like the city • LIVE HERE • LIVE HERE • LIVE HERE • LIVE HERE • LIVE HERE • LIVE HERE • LIVE HERE • LIVE HERE • LIVE HERE • LIVE HERE • LIVE HERE • LIVE HERE • LIVE HERE
2019 City of Miami Beach Business Survey: Findings Report (WEIGHTED RESULTS)
ETC Institute (2019) Page 78
Q21. What is the primary reason your business originally decided to locate in Miami Beach? (cont.)
• LIVE HERE • Location • Location • Location • Location • Location • Location • Location • Location • Location • Location • Location • Location • Location • Location • Location • Location • Location • Location • Location • Location • Location • Location • Location • Location • location , number of people • logistics • lots of sunburns • love the beach • love the city • Make money. • MB is our home. • Miami Beach is growing • Miami Beach was so attractive but now too commercialized. • near my home • need diversity in foods • need for a multi language schooling • needed a church • neighborhood social services need
2019 City of Miami Beach Business Survey: Findings Report (WEIGHTED RESULTS)
ETC Institute (2019) Page 79

Q21. What is the primary reason your business originally decided to locate in Miami Beach? (cont.)
• nice area- home • no other paint stores around at the time • Oil • only one in town • Opportunity • Opportunity • Opportunity • Opportunity • Opportunity • opportunity presented itself • Original to the beach • other locations • Owner • People to live and work in the same town. • POPULATION SIZE AND TRAVEL TO MIAMI BEACH • population/demographics • product works best near the beach • Proximity to the beach. • Public services, Illegal dumping, flooding and delinquency • public, tourism • purchased our office • purchased property • quality of life • quality of life • quality of life • Quality of tourism and foot traffic • Real state that is down now the city is dirty, the homeless and the trash people coming on spring
break damages my business • Residential Real Estate • Review license, tax and fees too high. • safe tourist city • Saw a need. • service industry that was lacking on the beach • Sunshine and no high rise buildings • The Beach • The Beach • THE CITY IS BEAUTIFUL. • The demographics. • The opportunities are diverse. Lots of tourists.
2019 City of Miami Beach Business Survey: Findings Report (WEIGHTED RESULTS)
ETC Institute (2019) Page 80

Q21. What is the primary reason your business originally decided to locate in Miami Beach? (cont.)
• The place I choose to live • THE SYNAGOGUE • The tourism industry was thriving in Miami Beach with a more mature & sophisticated tourist
profile. • This is where I will retire • to build a condo • tourism • tourism • tourism • tourism • tourism • tourism • tourism • tourism • tourism • tourism • tourism • tourism • tourism • tourism • tourism • tourism • tourism • tourism • tourism • tourism • tourism • tourism • tourism • tourism • tourism • tourism • tourism • tourism • tourism • tourism • tourism • tourism • tourism
2019 City of Miami Beach Business Survey: Findings Report (WEIGHTED RESULTS)
ETC Institute (2019) Page 81
Q21. What is the primary reason your business originally decided to locate in Miami Beach? (cont.)
• tourism • tourism • tourism • tourism • tourism • tourism • tourism • tourism • tourism • tourism • tourism • Tourist attraction, beach, livelihood • tourist destination • unique opportunity • use to love it before big brands kill unique business it was a different vibe now nothing special • Was my ex-husband's dream. • We live in Miami Beach • We love the area • WE MOVED TO MIAMI BEACH WHEN HUSBAND WAS TRANSFERRED. • Weather • Weather • Weather • Weather • Weather • Weather • Weather • Weather • Where I live. • wife decided • wonderful city • Work from home.
2019 City of Miami Beach Business Survey: Findings Report (WEIGHTED RESULTS)
ETC Institute (2019) Page 82

Q22. Compared to all you know or have heard about operating a business in other cities, how would you rate Miami Beach as a place to run a business? Q22. How would you rate Miami Beach as a place to run a business Number Percent Better 156 25.8 % About the same 196 32.5 % Worse 134 22.2 % Don't know 118 19.5 % Total 604 100.0 %
WITHOUT “DON’T KNOW” Q22. Compared to all you know or have heard about operating a business in other cities, how would you rate Miami Beach as a place to run a business? (without "don't know") Q22. How would you rate Miami Beach as a place to run a business Number Percent Better 156 32.1 % About the same 196 40.3 % Worse 134 27.6 % Total 486 100.0 %
2019 City of Miami Beach Business Survey: Findings Report (WEIGHTED RESULTS)
ETC Institute (2019) Page 83
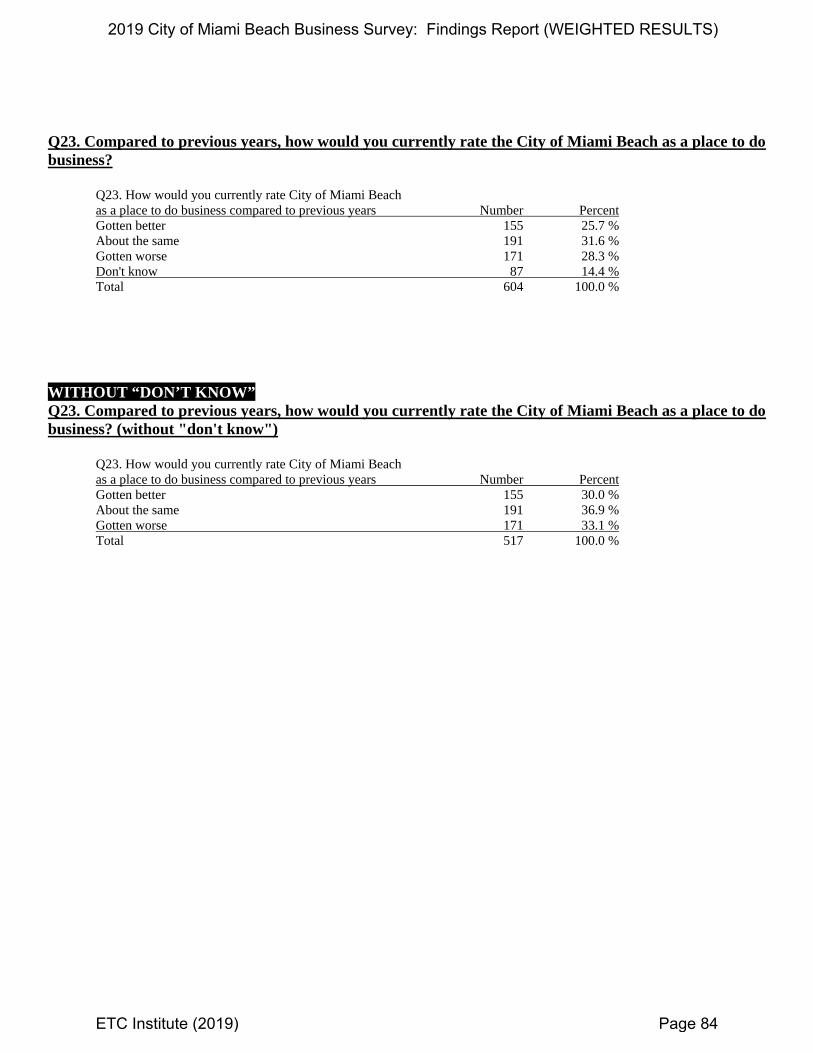
Q23. Compared to previous years, how would you currently rate the City of Miami Beach as a place to do business? Q23. How would you currently rate City of Miami Beach as a place to do business compared to previous years Number Percent Gotten better 155 25.7 % About the same 191 31.6 % Gotten worse 171 28.3 % Don't know 87 14.4 % Total 604 100.0 %
WITHOUT “DON’T KNOW” Q23. Compared to previous years, how would you currently rate the City of Miami Beach as a place to do business? (without "don't know") Q23. How would you currently rate City of Miami Beach as a place to do business compared to previous years Number Percent Gotten better 155 30.0 % About the same 191 36.9 % Gotten worse 171 33.1 % Total 517 100.0 %
2019 City of Miami Beach Business Survey: Findings Report (WEIGHTED RESULTS)
ETC Institute (2019) Page 84
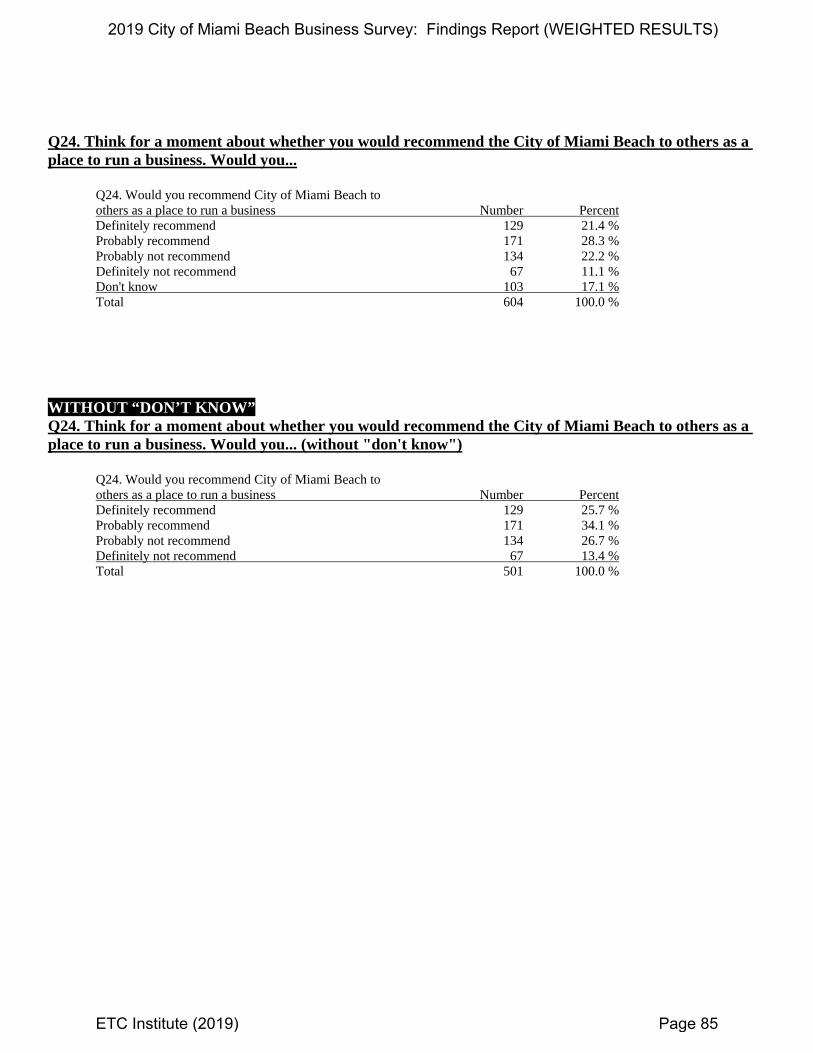
Q24. Think for a moment about whether you would recommend the City of Miami Beach to others as a place to run a business. Would you... Q24. Would you recommend City of Miami Beach to others as a place to run a business Number Percent Definitely recommend 129 21.4 % Probably recommend 171 28.3 % Probably not recommend 134 22.2 % Definitely not recommend 67 11.1 % Don't know 103 17.1 % Total 604 100.0 % WITHOUT “DON’T KNOW” Q24. Think for a moment about whether you would recommend the City of Miami Beach to others as a place to run a business. Would you... (without "don't know") Q24. Would you recommend City of Miami Beach to others as a place to run a business Number Percent Definitely recommend 129 25.7 % Probably recommend 171 34.1 % Probably not recommend 134 26.7 % Definitely not recommend 67 13.4 % Total 501 100.0 %
2019 City of Miami Beach Business Survey: Findings Report (WEIGHTED RESULTS)
ETC Institute (2019) Page 85

Q24a. Why would you recommend other businesses to open an office in Miami Beach?
• a lot of foot traffic • A lot of foot traffic in the right area. • ACCESS TO CUSTOMERS • ACCESS TO SERVICES, CITY PUBLICITY, PROGRAMS • accessibility • always busy • beach • Beach-tourism • beautiful beaches • beautiful city • beautiful destination • beautiful place • beautiful place • beautiful place • beautiful place • best place • big market • bring more business to the city • Business districts: Lincoln Rd, 41st St. • Business friendly, close to City Amenities, Venues, Public Parks, Schools, Commerce. • Business is good. • business oriented city • busy all year round, diversity • CAN BE LUCRATIVE, BUT SEVERAL THINGS TO KNOW AHEAD. • cheaper than New York • city is great • city is growing • city is responsive to business • City spends money on improving every year • city supports tourism • clientele • clientele • clientele • climate • climate • constant business • convenience • depends on business • depends on the business • depends on type of business
2019 City of Miami Beach Business Survey: Findings Report (WEIGHTED RESULTS)
ETC Institute (2019) Page 86

Q24a. Why would you recommend other businesses to open an office in Miami Beach? (cont.)
• depends on type of business • diverse • diverse • diverse market • Economy • Enough traffic for rest/bar business. • Everything very clear in dealing with city gov't. • family friendly city • FESTIVALS AND EVENTS INVOLVE THE MERCHANTS • foot traffic • foot traffic • foot traffic • Future growth potential if managed properly by city officials. • good business • good business atmosphere • Good city services and expanding residential community. • Good climate. lots of people • Good environment • good growth , tourist traffic • good opportunity • good place • good place • good place • good place to do business • good place to have a business • Good Public Average • good stable tourism • Great area to work in/people willing to invest in your business. • great brand building to have a location here • great city • great city • great city • great city • GREAT CULTURAL DIVERSITY. • Great location • Great location • Great place • Great place to do business. You need to be on your A game everyday. • Great place to live and work
2019 City of Miami Beach Business Survey: Findings Report (WEIGHTED RESULTS)
ETC Institute (2019) Page 87

Q24a. Why would you recommend other businesses to open an office in Miami Beach? (cont.)
• great place to start a business • Great tourism and weather • great tourist traffic • Growing opportunities • has everything people are looking for • hotels/apartments - yes • hotspot • I like the city. • If it were a retail business I would recommend because of the high foot traffic • if you are a resident living on the beach It makes sense to operate locally. Miami's infrastructure
is not as developed as CMB. We produce more and commute less. • interesting city • international • international city, restaurant, hotels, entertainment • It is a beautiful city. • It is a good city to be out and active • IT IS GREAT FOR THE CONDO BUSINESS, THE PEOPLE WHO WORK FOR THE CITY
ARE REALLY NICE AND HELPFUL. • It is nice. • IT IS NICER THAN OTHER CITIES. • it offers the best of the greater Miami Area • laws are easier than New York • lifestyle • like it here • like the area • Location • Location • Location • Location • Location • Location • Location • Location • Location - High Traffic Tourism • LOCATION AND DIVERSITY • location and revenue • location, beach, cleanliness • Location, services, amenities. • lot of money in this area
2019 City of Miami Beach Business Survey: Findings Report (WEIGHTED RESULTS)
ETC Institute (2019) Page 88
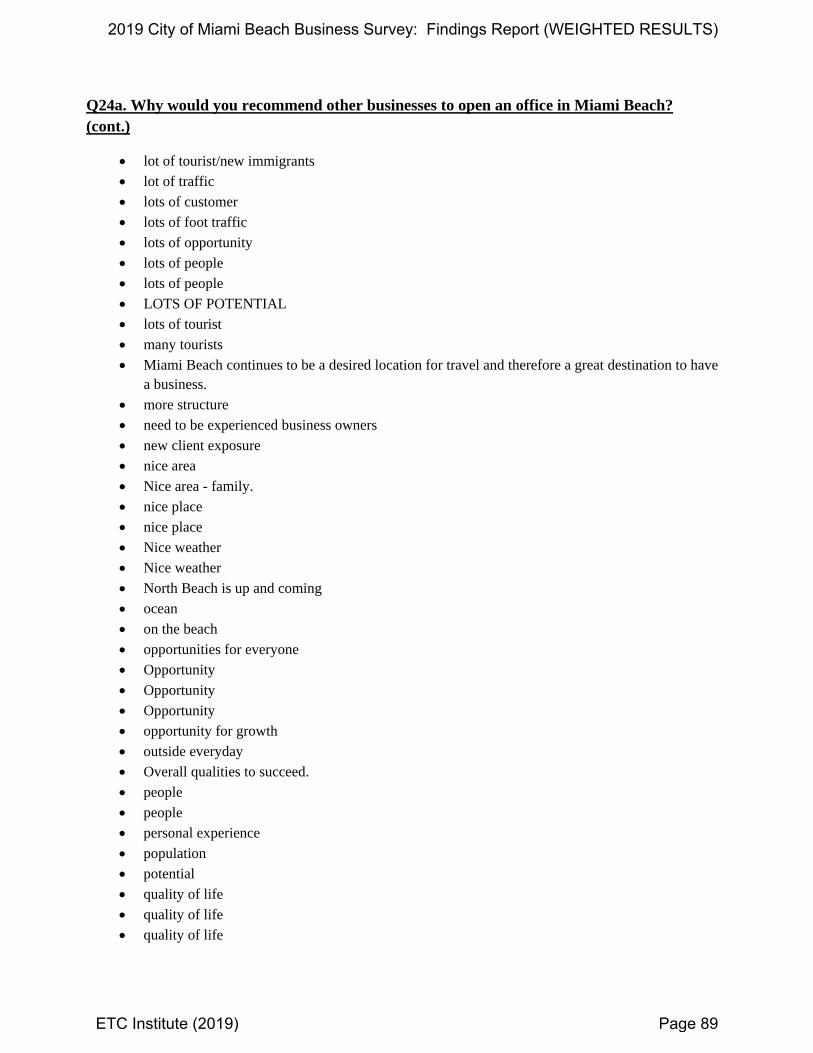
Q24a. Why would you recommend other businesses to open an office in Miami Beach? (cont.)
• lot of tourist/new immigrants • lot of traffic • lots of customer • lots of foot traffic • lots of opportunity • lots of people • lots of people • LOTS OF POTENTIAL • lots of tourist • many tourists • Miami Beach continues to be a desired location for travel and therefore a great destination to have
a business. • more structure • need to be experienced business owners • new client exposure • nice area • Nice area - family. • nice place • nice place • Nice weather • Nice weather • North Beach is up and coming • ocean • on the beach • opportunities for everyone • Opportunity • Opportunity • Opportunity • opportunity for growth • outside everyday • Overall qualities to succeed. • people • people • personal experience • population • potential • quality of life • quality of life • quality of life
2019 City of Miami Beach Business Survey: Findings Report (WEIGHTED RESULTS)
ETC Institute (2019) Page 89

Q24a. Why would you recommend other businesses to open an office in Miami Beach? (cont.)
• quality of life • QUALITY OF LIFE, WALKABILITY • retail tourism • Sales • Still have sunshine • strong tourism • strong tourism • The accessibility and tourists. • The opportunities are great. • there is a need here for many types of business • thriving city • Tight city with a lot of opportunity. • Tourism • Tourism • Tourism • Tourism • Tourism • Tourism • Tourism • Tourism • Tourism • Tourism • Tourism • Tourism • Tourism • Tourism • Tourism • Tourism • Tourism • Tourism • Tourism • Tourism • Tourism • Tourism • Tourism • Tourism • Tourism • Tourism • Tourism
2019 City of Miami Beach Business Survey: Findings Report (WEIGHTED RESULTS)
ETC Institute (2019) Page 90

Q24a. Why would you recommend other businesses to open an office in Miami Beach? (cont.)
• Tourism • Tourism • Tourism • Tourism • Tourism • Tourism • Tourism • Tourism • Tourism • Tourism • tourism brings people • Tourism supplies a lot of our business. • tourism, population, weather • tourist trade is good • Touristic area • traffic • traffic • very busy place • very good safe place to run a business • very nice place • wealth • weather • weather • wonderful place • wonderful place • you can walk everywhere
2019 City of Miami Beach Business Survey: Findings Report (WEIGHTED RESULTS)
ETC Institute (2019) Page 91

Q25. What are the THREE most significant challenges to the future growth and stability of your business? Q25. What are most significant challenges to the future growth & stability of your business Number Percent Cost of leasing or purchasing retail/commercial space 284 47.0 % Cost of technology 44 7.3 % Employee benefits (e.g. healthcare) 85 14.1 % Finding good employees 222 36.8 % Lack of available capital 59 9.8 % Marketing/promotion 86 14.2 % Transportation 92 15.2 % Taxes 137 22.7 % Other 89 14.7 % Don't know 65 10.8 % Total 1163 WITHOUT “DON’T KNOW” Q25. What are the THREE most significant challenges to the future growth and stability of your business? (without "don't know") Q25. What are most significant challenges to the future growth & stability of your business Number Percent Cost of leasing or purchasing retail/commercial space 282 52.3 % Cost of technology 44 8.2 % Employee benefits (e.g. healthcare) 85 15.8 % Finding good employees 222 41.2 % Lack of available capital 59 10.9 % Marketing/promotion 86 16.0 % Transportation 92 17.1 % Taxes 137 25.4 % Other 89 16.5 % Total 1096
2019 City of Miami Beach Business Survey: Findings Report (WEIGHTED RESULTS)
ETC Institute (2019) Page 92

Q25-9. Other: Q25-9. Other Number Percent Parking 16 18.0 % Traffic 9 10.1 % Climate change 3 3.4 % Building improvements 2 2.2 % Security 2 2.2 % Lack of parking 2 2.2 % Too restrictive 2 2.2 % Fees 2 2.2 % Difficult to open a new business 2 2.2 % Permits 2 2.2 % Flooding 2 2.2 % Growth of neighborhood 2 2.2 % Dealing with the CMB Building Department 2 2.2 % Worsening of the Market 2 2.2 % Water bill 2 2.2 % Project for North Beach development will destroy our business 2 2.2 % Business insurance 2 2.2 % LIMIT CITY REGULATIONS 1 1.1 % Bureaucracy 1 1.1 % Overbuilding 1 1.1 % Competitive wages 1 1.1 % License costs 1 1.1 % Crime, dirty streets, broken sidewalks 1 1.1 % Tourism 1 1.1 % Drawbridge is stuck open 1 1.1 % Potential good customers 1 1.1 % Water rising 1 1.1 % Safety 1 1.1 % City costs & insurance are out of control 1 1.1 % Cost of living 1 1.1 % Housing 1 1.1 % Animal control/clean beaches 1 1.1 % Cost of parking 1 1.1 % Generic corporate places 1 1.1 % Better customers 1 1.1 % Space 1 1.1 % Negative environmental impacts 1 1.1 % Work performance 1 1.1 % Affordable housing 1 1.1 % Regulations 1 1.1 % Homelessness 1 1.1 % Flow 1 1.1 % Global warming 1 1.1 % Lack of tourist 1 1.1 % Homelessness and trash 1 1.1 % Alcohol and drugs 1 1.1 % Sustainability 1 1.1 % Harassment by the city, building department, code compliance, fire department 1 1.1 % Keep coop in good condition 1 1.1 % Economy 1 1.1 % Total 89 100.0 %
2019 City of Miami Beach Business Survey: Findings Report (WEIGHTED RESULTS)
ETC Institute (2019) Page 93

Q26. Which THREE of the following items, if anything, have been a barrier to establishing your business in Miami Beach? Q26. What following items have been a barrier to establishing your business in Miami Beach Number Percent Cost of leasing or purchasing retail/commercial space 205 33.9 % License application process 133 22.0 % Parking 230 38.1 % Permitting 160 26.5 % Taxes 86 14.2 % Zoning 66 10.9 % Other 33 5.5 % Don't know 111 18.4 % Total 1024
WITHOUT “DON’T KNOW” Q26. Which THREE of the following items, if anything, have been a barrier to establishing your business in Miami Beach? (without "don't know") Q26. What following items have been a barrier to establishing your business in Miami Beach Number Percent Cost of leasing or purchasing retail/commercial space 205 41.6 % License application process 133 27.0 % Parking 230 46.7 % Permitting 160 32.5 % Taxes 86 17.4 % Zoning 66 13.4 % Other 33 6.7 % Total 913
2019 City of Miami Beach Business Survey: Findings Report (WEIGHTED RESULTS)
ETC Institute (2019) Page 94

Q26-7. Other: Q26-7. Other Number Percent Traffic 8 24.2 % Transportation 4 12.1 % Towing costs 2 6.1 % Crime/homelessness 2 6.1 % Parking 2 6.1 % Lack of tourists 2 6.1 % Quality of visitors and feeling unsafe 2 6.1 % Takes too long 1 3.0 % CITY REGULATIONS 1 3.0 % VISIBILITY 1 3.0 % New lines has reduced parking 1 3.0 % Bad press 1 3.0 % Good employees 1 3.0 % Affordable housing 1 3.0 % Internet 1 3.0 % Advertising 1 3.0 % Alcohol and drugs 1 3.0 % Lack of capital 1 3.0 % Total 33 100.0 %
2019 City of Miami Beach Business Survey: Findings Report (WEIGHTED RESULTS)
ETC Institute (2019) Page 95

Q27. If you could receive support in an area to help advance your business, which ONE of the items below would you choose? Q27. Which support would you choose Number Percent Access to capital 94 15.6 % Access to research & development (e.g. industry & consumer data/ trends) 14 2.3 % Financial literacy & planning 22 3.6 % Marketing & branding 86 14.2 % Operations (e.g. recruitment/retention 23 3.8 % Social media optimization 55 9.1 % Technology & training 23 3.8 % Other 35 5.8 % Don't know 252 41.7 % Total 604 100.0 % WITHOUT “DON’T KNOW” Q27. If you could receive support in an area to help advance your business, which ONE of the items below would you choose? (without "don't know") Q27. Which support would you choose Number Percent Access to capital 94 26.7 % Access to research & development (e.g. industry & consumer data/ trends) 14 4.0 % Financial literacy & planning 22 6.3 % Marketing & branding 86 24.4 % Operations (e.g. recruitment/retention 23 6.5 % Social media optimization 55 15.6 % Technology & training 23 6.5 % Other 35 9.9 % Total 352 100.0 %
2019 City of Miami Beach Business Survey: Findings Report (WEIGHTED RESULTS)
ETC Institute (2019) Page 96

Q27-8. Other: Q27-8. Other Number Percent Parking 3 8.6 % Application process 2 5.7 % Lack of parking 2 5.7 % Signage 2 5.7 % Homelessness 2 5.7 % Reduce fees, tax incentives 1 2.9 % RENT INCREASE SHOULD NOT BE SO HIGH 1 2.9 % Compete with unregulated online business 1 2.9 % More flexibilty with acquiring permits for older entities 1 2.9 % Permit process 1 2.9 % There is a total lack of Miami Beach specific sources and data 1 2.9 % Permits 1 2.9 % Leasing agreements 1 2.9 % Support local 1 2.9 % BBB 1 2.9 % Parking and towing expense 1 2.9 % Better environment 1 2.9 % Less homeless 1 2.9 % Parking and permits 1 2.9 % Simplify rules 1 2.9 % Parking is a big problem 1 2.9 % Lift useless regulations 1 2.9 % Traffic flow 1 2.9 % Sustainability 1 2.9 % Flooding 1 2.9 % Streets 1 2.9 % Tax break for small business 1 2.9 % Rent control 1 2.9 % Lower taxes 1 2.9 % Total 35 100.0 %
2019 City of Miami Beach Business Survey: Findings Report (WEIGHTED RESULTS)
ETC Institute (2019) Page 97

Q28. Are you an owner or manager at your business? Q28. Are you an owner or manager at your business Number Percent Yes 551 91.2 % No 12 2.0 % Not provided 41 6.8 % Total 604 100.0 %
WITHOUT “NOT PROVIDED” Q28. Are you an owner or manager at your business? (without "not provided") Q28. Are you an owner or manager at your business Number Percent Yes 551 97.9 % No 12 2.1 % Total 563 100.0 % Q28-2. (If "no" to Question 28) What is your role? Q28-2. What is your role Number Percent Front Desk Supervisor 2 16.7 % Office Manager 2 16.7 % ASSOCIATE MANAGER 1 8.3 % Senior Pastor 1 8.3 % Director of Operations 1 8.3 % Operation Manager 1 8.3 % Assistant Manager 1 8.3 % Office Clerk 1 8.3 % Architect 1 8.3 % Administrator 1 8.3 % Total 12 100.0 %
2019 City of Miami Beach Business Survey: Findings Report (WEIGHTED RESULTS)
ETC Institute (2019) Page 98

Q29. How long has your business been in the City of Miami Beach? Q29. How long has your business been in City of Miami Beach Number Percent 0-5 123 20.4 % 6-10 99 16.4 % 11-15 70 11.6 % 16-20 96 15.9 % 21-30 90 14.9 % 31+ 76 12.6 % Not provided 50 8.3 % Total 604 100.0 %
WITHOUT “NOT PROVIDED” Q29. How long has your business been in the City of Miami Beach? (without "not provided") Q29. How long has your business been in City of Miami Beach Number Percent 0-5 123 22.2 % 6-10 99 17.9 % 11-15 70 12.6 % 16-20 96 17.3 % 21-30 90 16.2 % 31+ 76 13.7 % Total 554 100.0 %
2019 City of Miami Beach Business Survey: Findings Report (WEIGHTED RESULTS)
ETC Institute (2019) Page 99

Q30. Approximately how many full-time employees does your business currently have at the location where you received this survey? Q30. How many full-time employees does your business currently have at the location where you received this survey Number Percent 0-4 326 54.0 % 5-10 97 16.1 % 11-24 74 12.3 % 25-49 34 5.6 % 50+ 27 4.5 % Not provided 46 7.6 % Total 604 100.0 %
WITHOUT “NOT PROVIDED” Q30. Approximately how many full-time employees does your business currently have at the location where you received this survey? (without "not provided") Q30. How many full-time employees does your business currently have at the location where you received this survey Number Percent 0-4 326 58.4 % 5-10 97 17.4 % 11-24 74 13.3 % 25-49 34 6.1 % 50+ 27 4.8 % Total 558 100.0 %
2019 City of Miami Beach Business Survey: Findings Report (WEIGHTED RESULTS)
ETC Institute (2019) Page 100
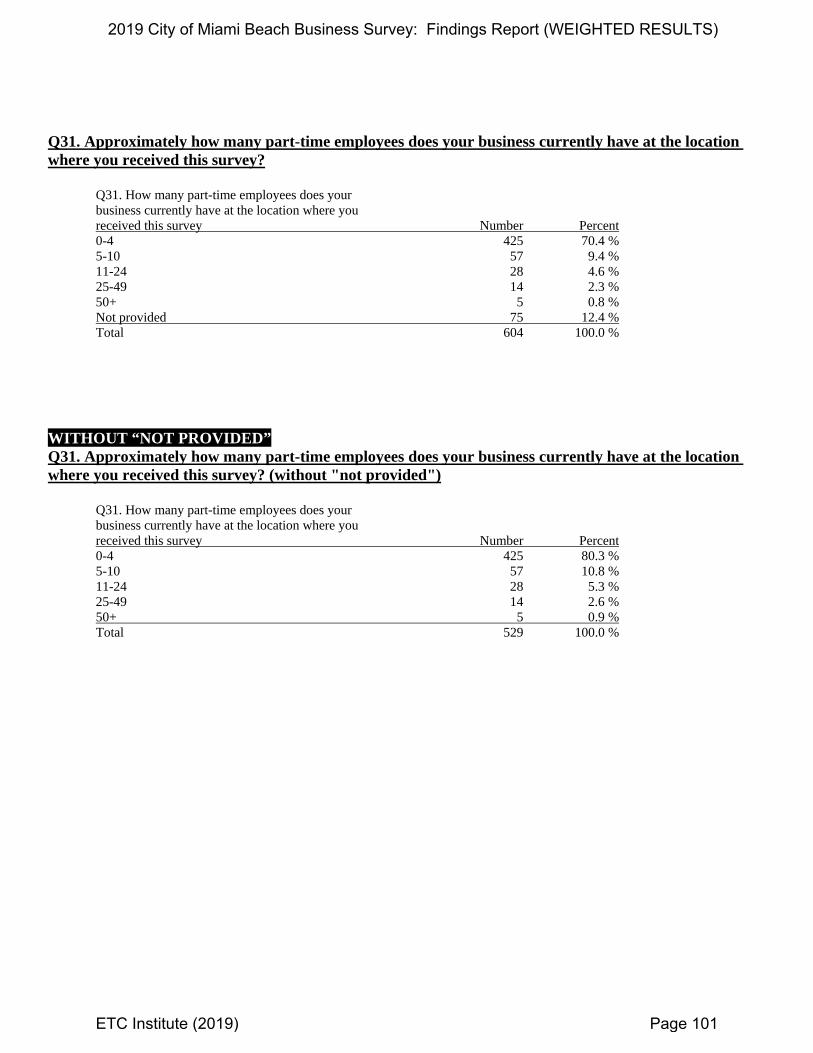
Q31. Approximately how many part-time employees does your business currently have at the location where you received this survey? Q31. How many part-time employees does your business currently have at the location where you received this survey Number Percent 0-4 425 70.4 % 5-10 57 9.4 % 11-24 28 4.6 % 25-49 14 2.3 % 50+ 5 0.8 % Not provided 75 12.4 % Total 604 100.0 % WITHOUT “NOT PROVIDED” Q31. Approximately how many part-time employees does your business currently have at the location where you received this survey? (without "not provided") Q31. How many part-time employees does your business currently have at the location where you received this survey Number Percent 0-4 425 80.3 % 5-10 57 10.8 % 11-24 28 5.3 % 25-49 14 2.6 % 50+ 5 0.9 % Total 529 100.0 %
2019 City of Miami Beach Business Survey: Findings Report (WEIGHTED RESULTS)
ETC Institute (2019) Page 101
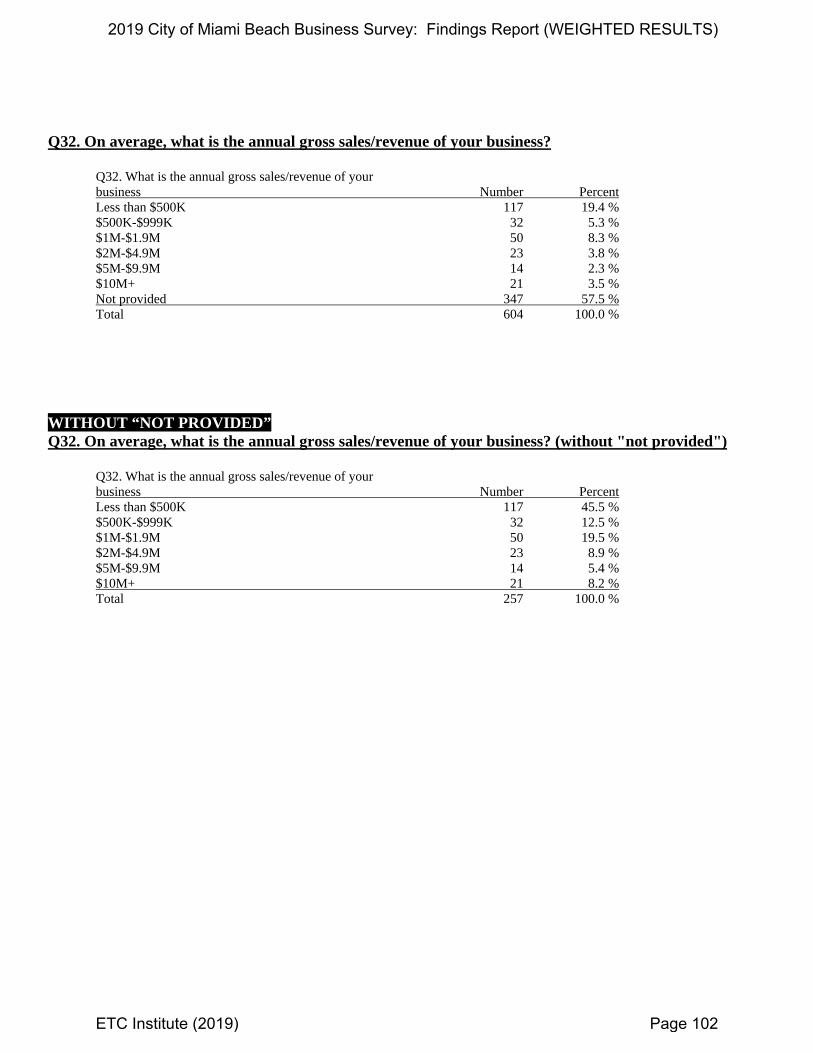
Q32. On average, what is the annual gross sales/revenue of your business? Q32. What is the annual gross sales/revenue of your business Number Percent Less than $500K 117 19.4 % $500K-$999K 32 5.3 % $1M-$1.9M 50 8.3 % $2M-$4.9M 23 3.8 % $5M-$9.9M 14 2.3 % $10M+ 21 3.5 % Not provided 347 57.5 % Total 604 100.0 %
WITHOUT “NOT PROVIDED” Q32. On average, what is the annual gross sales/revenue of your business? (without "not provided") Q32. What is the annual gross sales/revenue of your business Number Percent Less than $500K 117 45.5 % $500K-$999K 32 12.5 % $1M-$1.9M 50 19.5 % $2M-$4.9M 23 8.9 % $5M-$9.9M 14 5.4 % $10M+ 21 8.2 % Total 257 100.0 %
2019 City of Miami Beach Business Survey: Findings Report (WEIGHTED RESULTS)
ETC Institute (2019) Page 102

Q33. How many locations do you have inside the City of Miami Beach? Q33. How many locations do you have inside City of Miami Beach Number Percent 1 512 84.8 % 2 49 8.1 % 3 11 1.8 % 4 6 1.0 % 5+ 16 2.6 % Not provided 10 1.7 % Total 604 100.0 % WITHOUT “NOT PROVIDED” Q33. How many locations do you have inside the City of Miami Beach? (without "not provided") Q33. How many locations do you have inside City of Miami Beach Number Percent 1 512 86.2 % 2 49 8.2 % 3 11 1.9 % 4 6 1.0 % 5+ 16 2.7 % Total 594 100.0 %
2019 City of Miami Beach Business Survey: Findings Report (WEIGHTED RESULTS)
ETC Institute (2019) Page 103

Q34. How many locations do you have outside the City of Miami Beach? Q34. How many locations do you have outside City of Miami Beach Number Percent 0 319 52.8 % 1 83 13.7 % 2 27 4.5 % 3 19 3.1 % 4 5 0.8 % 5+ 43 7.1 % Not provided 108 17.9 % Total 604 100.0 %
WITHOUT “NOT PROVIDED” Q34. How many locations do you have outside the City of Miami Beach? (without "not provided") Q34. How many locations do you have outside City of Miami Beach Number Percent 0 319 64.3 % 1 83 16.7 % 2 27 5.4 % 3 19 3.8 % 4 5 1.0 % 5+ 43 8.7 % Total 496 100.0 %
2019 City of Miami Beach Business Survey: Findings Report (WEIGHTED RESULTS)
ETC Institute (2019) Page 104

Q35. What type of business is your establishment? Q35. What type of business is your establishment Number Percent Manufacturing 1 0.2 % Finance/insurance 16 2.6 % Administrative & support services 5 0.8 % Wholesaler/distributor 9 1.5 % Retail trade 128 21.2 % Accommodation & food services 103 17.1 % Health care/medical/social services 55 9.1 % Transportation/warehousing 5 0.8 % Professional, scientific/technical services 50 8.3 % Real estate, rentals, & leasing 125 20.7 % Other 59 9.8 % Not provided 48 7.9 % Total 604 100.0 % WITHOUT “NOT PROVIDED” Q35. What type of business is your establishment? (without "not provided") Q35. What type of business is your establishment Number Percent Manufacturing 1 0.2 % Finance/insurance 16 2.9 % Administrative & support services 5 0.9 % Wholesaler/distributor 9 1.6 % Retail trade 128 23.0 % Accommodation & food services 103 18.5 % Health care/medical/social services 55 9.9 % Transportation/warehousing 5 0.9 % Professional, scientific/technical services 50 9.0 % Real estate, rentals, & leasing 125 22.5 % Other 59 10.6 % Total 556 100.0 %
2019 City of Miami Beach Business Survey: Findings Report (WEIGHTED RESULTS)
ETC Institute (2019) Page 105
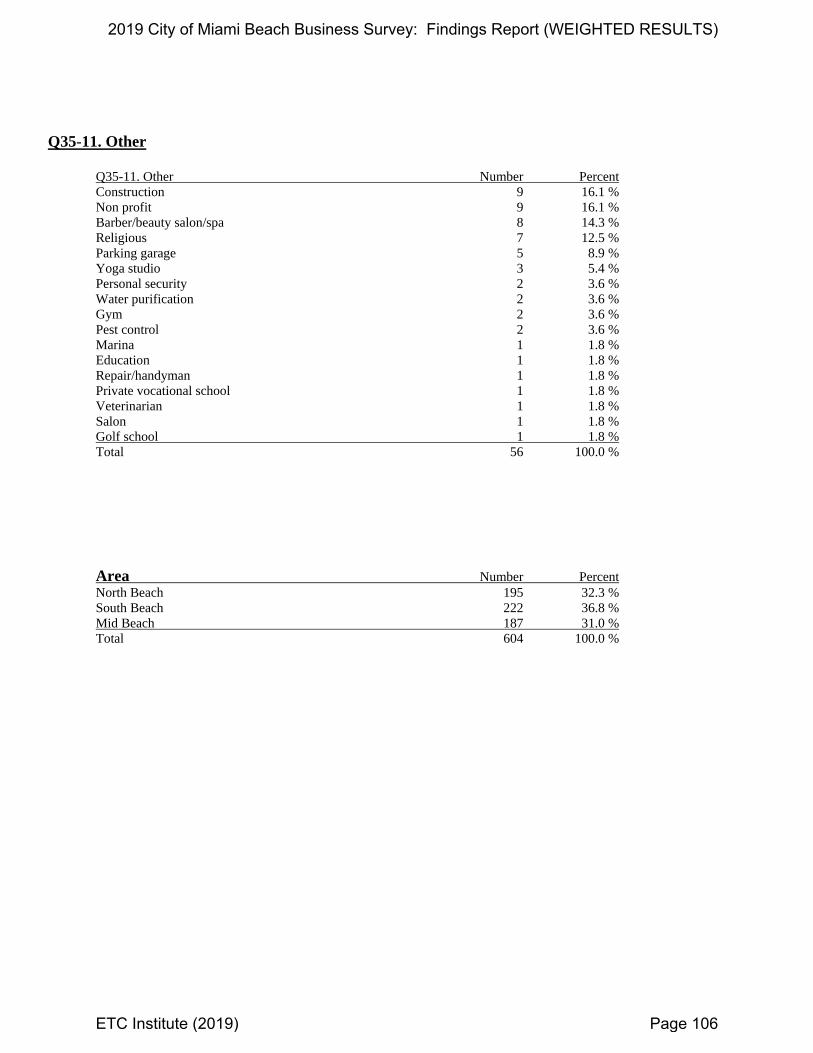
Q35-11. Other Q35-11. Other Number Percent Construction 9 16.1 % Non profit 9 16.1 % Barber/beauty salon/spa 8 14.3 % Religious 7 12.5 % Parking garage 5 8.9 % Yoga studio 3 5.4 % Personal security 2 3.6 % Water purification 2 3.6 % Gym 2 3.6 % Pest control 2 3.6 % Marina 1 1.8 % Education 1 1.8 % Repair/handyman 1 1.8 % Private vocational school 1 1.8 % Veterinarian 1 1.8 % Salon 1 1.8 % Golf school 1 1.8 % Total 56 100.0 % Area Number Percent North Beach 195 32.3 % South Beach 222 36.8 % Mid Beach 187 31.0 % Total 604 100.0 %
2019 City of Miami Beach Business Survey: Findings Report (WEIGHTED RESULTS)
ETC Institute (2019) Page 106
Section 5: Survey Instrument
2019 City of Miami Beach Business Survey: Findings Report (WEIGHTED RESULTS)
ETC Institute (2019) Page 107

©2019 ETC Institute Page 1
2019 City of Miami Beach Business Survey Please take a few minutes to complete this important survey. Your input will help the City of Miami Beach serve the needs of businesses better. When you are finished, please return your completed survey in the postage-paid envelope provided. You may also complete the survey online at www.MBBusinessSurvey.org. Thank you!
1. Satisfaction with City Services. City services provided by the City of Miami Beach are listed below. Please rate each service by circling the number to the right that corresponds to your rating.
Excellent Good Fair Poor Don't Know
01. Cleanliness of streets near your business 4 3 2 1 9
02. Cleanliness of canals/waterways 4 3 2 1 9
03. Condition of sidewalks (few or no cracks) 4 3 2 1 9
04. Condition of streets 4 3 2 1 9
05. Street lighting 4 3 2 1 9
06. Miami Beach trolley system 4 3 2 1 9
07. Miami Dade County's bus service 4 3 2 1 9
08. Appearance and maintenance of the City's public buildings 4 3 2 1 9
09. Maintenance of parks 4 3 2 1 9
10. Landscape maintenance in right of way of City streets/public areas 4 3 2 1 9
11. Overall quality of the beaches 4 3 2 1 9
12. Garbage/trash collection 4 3 2 1 9
13. Police services 4 3 2 1 9
14. Emergency medical services 4 3 2 1 9
15. Fire services 4 3 2 1 9
16. Ocean rescue/lifeguard/beach patrol services 4 3 2 1 9
17. City's emergency/hurricane preparedness efforts 4 3 2 1 9
18. Efforts to address homelessness 4 3 2 1 9
19. Efforts to manage stormwater drainage and flooding 4 3 2 1 9
20. Reliability of potable (drinking) water 4 3 2 1 9
21. Reliability of sewer (wastewater) services 4 3 2 1 9
22. Quality of customer service 4 3 2 1 9
23. City efforts to keep businesses informed 4 3 2 1 9
2. Which FIVE of the City services listed above do you think are most important for the City to provide? [Write in your answers below using the numbers from the list in Question 1.]
1st: ____ 2nd: ____ 3rd: ____ 4th: ____ 5th: ____
3. During the past 12 months, how many times has your establishment been inspected? (e.g. for site plans, license, solicitation, signage, sanitation, property maintenance, zoning, noise.)
____ times [If you have not been inspected, skip to Question 4.]
3a. How satisfied are you with the consistency and fairness of City inspections?
____(1) Very satisfied ____(2) Satisfied
____(3) Neutral ____(4) Dissatisfied
____(5) Very dissatisfied ____(9) Don't know
4. Fire Department. During the past 3 years how many times have you contacted or had any direct experience with the Miami Beach Fire Department?
____ times [If you have not been inspected, skip to Question 5.]

©2019 ETC Institute Page 2
4a. Please rate your agreement with the following statements using a scale of 1 to 5, where 5 means "Strongly Agree" and 1 means "Strongly Disagree" based on your experience interacting with the Fire Department over the past THREE years.
Strongly Agree
Agree Neutral Disagree Strongly Disagree
Don't Know
1. It was easy to contact someone who could help you in the Fire Department
5 4 3 2 1 9
2. The employees who assisted me were courteous and professional 5 4 3 2 1 9
3. Fire Department employees possess the proper knowledge 5 4 3 2 1 9
4. The overall experience I had with the City Fire Department was good 5 4 3 2 1 9
5. The inspections by the Fire Department are consistent from one inspection to the next
5 4 3 2 1 9
6. The State Fire Code is fair 5 4 3 2 1 9
7. The professionalism of Fire Department staff conducting State fire code inspections
5 4 3 2 1 9
8. The Fire Department is open and interested in hearing the concerns or issues of businesses
5 4 3 2 1 9
5. Culture. Please rate your agreement with the following statements using a scale of 1 to 5, where 5 means "Strongly Agree" and 1 means "Strongly Disagree."
Strongly agree
Agree Neutral Disagree Strongly Disagree
Don't Know
1. Museum exhibits and cultural organizations provide enough diverse art and cultural activities
5 4 3 2 1 9
2. Cultural activities (such as art shows, film festivals, musicals, and live performances) contribute to the success of my business
5 4 3 2 1 9
3. Cultural activities (such as movies in the park, music in the park, etc.) are family friendly and age appropriate
5 4 3 2 1 9
4. Miami Beach free or City sponsored art and cultural activities contribute to the success of my business
5 4 3 2 1 9
5. Major events (such as boat/home/auto shows, 4th of July celebrations, expositions, food and wine festivals, etc.) help my business succeed
5 4 3 2 1 9
6. Do you think the Miami Beach Convention Center contributes positively to the overall value of doing business in Miami Beach?
____(1) Yes ____(2) No ____(9) Don't know
7. Do you think the level of Miami Beach tourism adds value to the business community?
____(1) Yes ____(2) No ____(9) Don't know
8. Feeling of Safety. Please rate how safe you and your employees feel in the following areas of Miami Beach using a scale of 1 to 5, where 5 means "Very Safe" and 1 means "Very Unsafe."
How safe do you feel... Very Safe Safe Somewhat
Safe Unsafe
Very Unsafe
Don't Know
1. In and around your place of business during the daytime 5 4 3 2 1 9
2. In and around your place of business during the evening/night 5 4 3 2 1 9
3. During special events 5 4 3 2 1 9
9. Street Lighting. Do you think the amount of street lighting near your business is...
____(1) Too much/too bright ____(2) About right ____(3) Too little/too dark ____(9) Don't know

©2019 ETC Institute Page 3
10. Perceptions of the City. Please rate your satisfaction with each of the following using a scale of 1 to 5, where 5 means "Very Satisfied" and 1 means "Very Dissatisfied."
How satisfied are you with... Very
Satisfied Satisfied Neutral Dissatisfied
Very Dissatisfied
Don't Know
01. Overall image of the City 5 4 3 2 1 9
02. Quality of life 5 4 3 2 1 9
03. Overall quality of City services 5 4 3 2 1 9
04. Leadership provided by the City's elected officials 5 4 3 2 1 9
05. City efforts to plan for growth 5 4 3 2 1 9
06. City efforts to prepare for the future 5 4 3 2 1 9
07. City efforts to prepare for disasters 5 4 3 2 1 9
08. City efforts to prevent crime 5 4 3 2 1 9
09. Value you receive for the City taxes your business pays 5 4 3 2 1 9
10. City efforts to be a "green" or sustainable city 5 4 3 2 1 9
11. City efforts to reduce risk from rainfall and sea-level rise 5 4 3 2 1 9
12. City regulation of residential development 5 4 3 2 1 9
13. City regulation of commercial development 5 4 3 2 1 9
14. Quality of public schools 5 4 3 2 1 9
11. Sustainability and Resiliency. Please rate your agreement with the following statements using a scale of 1 to 5, where 5 means "Strongly Agree" and 1 means "Strongly Disagree."
Strongly Agree
Agree Neutral Disagree Strongly Disagree
Don't Know
1. Sustainability and Resiliency are important to my business 5 4 3 2 1 9
2. Tree canopy is sufficient adjacent to my business 5 4 3 2 1 9
3. I have taken steps to reduce solid waste, including recycling and reducing single-use plastic
5 4 3 2 1 9
4. I am informed about local climate change issues 5 4 3 2 1 9
5. I have observed increased flooding 5 4 3 2 1 9
6. I'm satisfied with my building(s) flood risk protections 5 4 3 2 1 9
7. I have taken steps to make my business more energy efficient 5 4 3 2 1 9
8. I have taken steps to make my business more water efficient 5 4 3 2 1 9
9. My business has a continuity of operations plan in the event of a disaster 5 4 3 2 1 9
12. What can the City do to improve your business sustainability practices?
____(1) Provide an incentive program for the installation of energy efficiency and renewable energy upgrades ____(2) Provide financial incentives to assist businesses to build sustainable practices ____(3) Provide a procurement platform to assist businesses in purchasing more sustainable products ____(4) Provide better information and guidance on sustainability and resiliency practices ____(5) Recognize businesses that build sustainability into their operations, including reducing energy consumption ____(6) Recognize businesses that reduce single-use plastics ____(7) Other: ___________________________________________________________________________________ ____(9) Don't know
12a. Please, provide your email address if you have ideas on how the City can help businesses become more sustainable.
13. How supportive are you of the City of Miami Beach spending tax dollars to address sea-level rise?
____(1) Very Supportive ____(2) Supportive
____(3) Neutral ____(4) Not Supportive
____(5) Not at all Supportive ____(9) Don't know
©2019 ETC Institute Page 4
14. How willing would you be to pay more taxes to fund maintenance of assets such as buildings, roads, streets, sidewalks, and vehicles?
____(1) Very willing ____(2) Willing
____(3) Neutral ____(4) Not Willing
____(5) Not at all willing ____(9) Don't know
15. Code Enforcement. Do you think the level of code and ordinance enforcement established by the City of Miami Beach near your business is...
____(1) Too much/too restrictive ____(2) About right
____(3) Too little/not restrictive enough ____(9) Don't know
16. Transportation and Mobility. Over the past 12 months, how would you rate the effectiveness of public transit for employee commuting?
____(1) Excellent ____(2) Good ____(3) Fair ____(4) Poor ____(9) Don't know
17. Which of the following has your business done to provide additional transit options for your employees? [Check all that apply.]
____(1) Provide free or subsidized parking spots ____(2) Encourage public transit use ____(3) Coordinate carpool(s)
____(4) Other: _____________________________________ ____(5) None at this time
18. Which ONE of the following best describes the availability of public and private parking for your customers?
____(1) There are almost always parking spaces nearby ____(2) There are often parking spaces nearby ____(3) There are seldom parking spaces nearby
____(4) There are almost never parking spaces nearby ____(9) Don't know
19. Communication. Which sources do you utilize to obtain information about City government, issues, and events? [Check all that apply.]
____(1) MB Magazine ____(2) MBTV (City's TV Government channel) ____(3) Twitter ____(4) Facebook ____(5) City Website (www.miamibeachfl.gov) ____(6) City e-mail news ____(7) Nextdoor App
____(8) Radio (1670 AM) ____(9) Forums/Workshops/Meetings ____(10) City's E-Gov app ____(11) Other news media: _______________________________ ____(12) HOA's or other civic groups: ________________________ ____(13) Police Department's social media platforms ____(14) Text messages
19a. Which THREE of the communication channels listed above do you prefer? [Write in your answers below using the numbers from the list in Question 19.]
1st: ____ 2nd: ____ 3rd: ____

©2019 ETC Institute Page 5
20. Customer Service. In the last 12 months, how many times have you personally contacted, either by phone, in-person, or electronically, the City of Miami Beach government with a question, service request, or complaint?
____ times [If more than "0" times, answer Question 20a-b.]
20a. What was the reason for your most recent contact?
____(1) Pay a bill ____(2) Visit an elected official ____(3) Research an issue ____(4) Pull a building permit/plan review
____(5) Attend a program/event ____(6) File a complaint ____(7) Other: ________________________________ ____(8) Don't remember
20b. Please rate your agreement with the following statements using a scale of 1 to 5, where 5 means "Strongly Agree" and 1 means "Strongly Disagree," based on your most recent interaction with City employees.
Strongly Agree
Agree Neutral Disagree Strongly Disagree
Don't Know
1. The City of Miami Beach government is open and interested in hearing the concerns or issues of businesses
5 4 3 2 1 9
2. It is easy to contact someone at the City who can help you 5 4 3 2 1 9
3. City employees are courteous and professional 5 4 3 2 1 9
4. City employees possess the proper knowledge 5 4 3 2 1 9
5. During my most recent contact with the City, I found the process to be user-friendly and easy to understand
5 4 3 2 1 9
6. During my most recent contact with the City, the requests made by my business were processed in a timely manner
5 4 3 2 1 9
7. During my most recent contact with the City, I was satisfied with the experience I had
5 4 3 2 1 9
21. Additional Questions. What is the primary reason your business originally decided to locate in Miami Beach?
22. Compared to all you know or have heard about operating a business in other cities, how would you rate Miami Beach as a place to run a business?
____(1) Better ____(2) About the same ____(3) Worse ____(9) Don't know
23. Compared to previous years, how would you currently rate the City of Miami Beach as a place to do business?
____(1) Gotten better ____(2) About the same ____(3) Gotten worse ____(9) Don't know
24. Think for a moment about whether you would recommend the City of Miami Beach to others as a place to run a business. Would you...
____(1) Definitely recommend [Answer Question 24a.] ____(2) Probably recommend [Answer Question 24a.] ____(3) Probably not recommend
____(4) Definitely not recommend ____(9) Don't know
24a. Why would you recommend other businesses to open an office in Miami Beach?

©2019 ETC Institute Page 6
25. What are the THREE most significant challenges to the future growth and stability of your business?
____(01) Cost of leasing or purchasing retail/commercial space ____(02) Cost of technology ____(03) Employee benefits (e.g. Healthcare) ____(04) Finding good employees ____(05) Lack of available capital
____(06) Marketing/Promotion ____(07) Transportation ____(08) Taxes ____(09) Other: ___________________________ ____(99) Don't know
26. Which THREE of the following items, if anything, have been a barrier to establishing your business in Miami Beach?
____(1) Cost of leasing or purchasing retail/commercial space ____(2) License application process ____(3) Parking ____(4) Permitting
____(5) Taxes ____(6) Zoning ____(7) Other: ____________________________ ____(9) Don't know
27. If you could receive support in an area to help advance your business, which ONE of the items below would you choose?
____(1) Access to capital ____(2) Access to research and development (e.g. industry and consumer
data/trends) ____(3) Financial literacy and planning ____(4) Marketing and branding ____(5) Operations (e.g. recruitment/retention; strategic planning; mentoring)
____(6) Social media optimization ____(7) Technology and training ____(8) Other_____________________ ____(9) Don't know
Please call the City Manager's Office at (305)-673-7010 if you would like to participate in focus groups (facilitated discussions about this survey).
Demographics
28. Are you an owner or manager at your business?
____(1) Yes ____(2) No (What is your role? _________________________________________________________)
29. How long has your business been in the City of Miami Beach? ______ years
30. Approximately how many full-time employees does your business currently have at the location where you received this survey?
______ employees
31. Approximately how many part-time employees does your business currently have at the location where you received this survey?
______ employees
32. On average, what is the annual gross sales/revenue of your business? $________ per year
33. How many locations do you have inside the City of Miami Beach? ______ locations

©2019 ETC Institute Page 7
34. How many locations do you have outside the City of Miami Beach? ______ locations
35. What type of business is your establishment?
____(01) Manufacturing ____(02) Finance/insurance ____(03) Administrative and support services ____(04) Wholesaler/distributor ____(05) Retail trade ____(06) Accommodation and food services
____(07) Health care/medical/social services ____(08) Transportation/warehousing ____(09) Professional, scientific/technical services ____(10) Real estate, rentals, and leasing ____(11) Other: _______________________________________
This concludes the survey. Thank you for your time! Please return your completed survey in the enclosed return-reply envelope addressed to:
ETC Institute, 725 W. Frontier Circle, Olathe, KS 66061
Your response will remain completely confidential. The address information on the sticker to the right will ONLY be used to help identify areas with special interests. Thank you.