Embed Size (px)
Citation preview
ICHEME SYMPOSIUM SERIES NO. 141
MHIDAS: THE FIRST TEN YEARS.
A.B.Harding AEA Technology pic, Thomson House, Risley Warrington, WA3 6AT
Following the Canvey Island study in 1982, it was identified that reliable data on frequency of release of flammable materials and ignition probabilities were not available. With the introduction of the CIMAH regulations, the range of incidents of interest increased to include all incidents with a potential for off-site harm.
In 1986, the MHIDAS database was launched by the HSE to give a reliable source of data on major hazard incidents, and this service was developed and is maintained by AEA Technology. This paper reviews the data collected over the first ten years of operation and reports some of the issues associated with a system of this kind.
Keywords: MHIDAS, major hazards, accident data
INTRODUCTION
In the mid I970's, an investigation was launched by the UK Health and Safety Executive into the hazards arising from operations in the Canvey Island/Thurrock area. The study was carried out by the Safety and Reliability Directorate (SRD) of the UKAEA. This was the most comprehensive non-nuclear application of risk assessment techniques at the time, and revealed a number of areas where reliable data were not available.
A study was then commissioned by the HSE to collect information, initially on the ignition of flammable releases. The scope was widened to include toxic releases, and finally to cover "those incidents involving hazardous materials that resulted in or had the potential to produce an off-site impact".
The importance of this study was re-inforced by the occurrence of several major accidents (Seveso, 1976, Mexico City and Bhopal, 1984), and the introduction of legislation requiring an understanding of potential hazards: the so-called 'Seveso' directive 82/501/EEC "on the major-accident hazards of certain industrial activities" and its implementation in UK Law as the "Control of Industrial Major Accident Hazards (CIMAH) Regulations 1984"
The Major Hazard Incident Data Service (MHIDAS) was launched in 1986 by UKAEA (as SRD) and the UK Health and Safety Executive. It draws on public domain information sources (press cuttings, magazine articles, journals, published reports etc) to ensure that the information can be widely disseminated, and has been continuously updated since its inception. There are currently records of over 7000 incidents worldwide, including information on incidents that occurred prior to the launch of the database. Under the remit set
,

ICHEME SYMPOSIUM SERIES NO. 141
by the HSE, MHTDAS is available and widely used through several routes, including CD-ROM and as an on-line service.
The use of the database is two-fold:
1 To learn from past incidents: to see what has happened, how it happened and what the consequences were. This is useful for designers, to avoid mistakes that have been made before, and for emergency planners, to appreciate the type and scope of incident that they may be expected to cope with.
2 Where there are sufficient data available, it may be possible to develop incident frequencies or probabilities for use in risk assessment.
Now that the service has been running for ten years, and the number of records increased significantly, a review has been instigated to look at trends that have developed over time. The trends to be considered are: the number of incidents by activity (transport, storage, processing etc.), the number of incidents by location (Europe, UK, USA, Far East etc.) and trends in the numbers of people affected (killed, injured or evacuated). It is possible that relationships could be discerned between mese trends and the introduction of specific legislation and the level of industrial activity.
This paper will also discuss the difficulties associated with maintaining such a database, given the 'public domain' nature of the data sources. These problems are related to availability of information, inconsistencies in reporting and the depth of information available. These are in turn related to how risks are perceived by the public and communicated by the media. A rise in reporting of incidents does not necessarily relate to a rise in the number of incidents.
NUMBER OF INCIDENTS
As mentioned above, the database to date contains information on over 7,000 incidents worldwide. However due to the availability of information in the public domain data sources to which there is ready access in the UK, the majority of these incidents originate in the UK and the USA. Indeed, for the years preceding the launch of the database (where information was gathered retrospectively) the majority of incidents recorded originated in the United States. This reflects the availability of public domain data sources at the time. Since then, AEA Technology have employed a press cutting service to gather references from the UK national and local newspapers which has had the effect of greatly increasing the number of UK incidents recorded in the system. It has also been a conscious decision to try and include "near miss" incidents whereby there may have been no actual major accident, but the potential for one was present. This mainly affects transport incidents where a vehicle transporting a major hazard material was involved in an accident, but the major hazard material played no part in the incident.
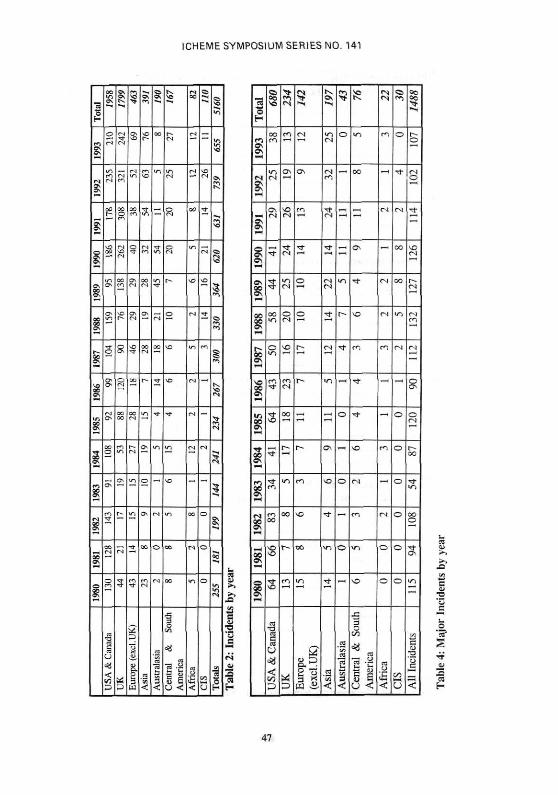
Table 1 shows me number of incidents by decade and location, and table 2 shows the number of incidents by year from 1980 to 1993.
Analysis of this data alone suggests a dramatic increase in the number of incidents in the UK over the past 10 years, and worldwide in the past thirty years, however this mainly if not
40

ICHEME SYMPOSIUM SERIES NO. 141
entirely is the effect of the way in which the data have been collected. There is a notable increase in the number of incidents per year from 1990, an increase that has been maintained. In an attempt to understand this, a second analysis has been performed which includes only those incidents that have had a major effect. The definition of a major incident has arbitrarily been taken as meaning those incidents which resulted in 5 or more fatalities, or 10 or more injuries, or 100 or more people evacuated, or Si million or more reported damage. This is based on the assumption that incidents of this scale will be reported in greater detail than smaller incidents mat may only attract coverage in local press. It is also felt that the retrospective collection of data would also be more effective for incidents of this size.
Table 3 shows the number of major incidents by decade and again there is a dramatic increase over the last 30 years worldwide, although not as pronounced as before. While this is certainly related to the data collection process, there will be a better correlation with the level, scale and control of industrial activity in this period. The number of major incidents since 1980 (table 4) is however a more reliable data set, in that the level of data collection, and the availability of data for this period, will be more constant than in previous years. It is interesting to note that the number of major incidents worldwide has remained reasonably constant, averaging approximately 106 per year between 1980 and 1993. If the extreme values of 54 in 1983 and 132 in 1988 are excluded, the mean increases slightly to 108 per year. There is a slight rising trend which may be related to the increase in world production, and the increasing availability of information from areas such as the CIS (former USSR).
The USA is still the area which has the largest contribution to the total number of major incidents, however mere is a definite downward trend in the number of incidents, from more than 60 per year in the early 1980's to less than 40 per year in the early 1990's. The most dramatic increase is reflected in the number of incidents in Asia, which is partly related to the increased availability of reports from this area of the world, but almost certainly due also to the rapid increase in industrial activity that Asia has maintained over the past decade.
The information for the UK does show a slight increasing trend, peaking at 26 major incidents in 1991, but returning to 13 in 1993.
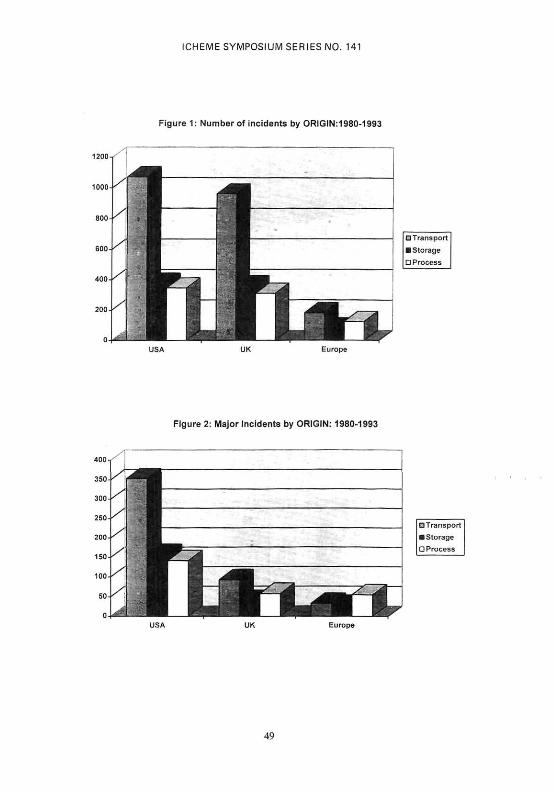
ORIGIN OF INCIDENTS
In MHIDAS. the origin of an incident is classified as either process, storage, transport, transfer (loading/unloading), waste storage, warehouse or domestic/commercial. Within each category there are a number of sub-categories such as reactor, pressurised storage vessel, rail tank car etc. Figure 1 shows the number of incidents by year for the process, storage and transport categories of incident, grouped into USA and Canada, the UK and the rest of Europe. By far the greatest number of incidents are attributed to transport incidents for all areas, with storage and process incidents contributing similar numbers of incidents in the USA and the UK. although process incidents contribute a larger proportion in the rest of Europe.
When only the major incidents are considered (Figure 2), the pattern in the USA remains die same, with more tiian 50% of the incidents occurring in transport, and storage and process incidents of a similar order. In the UK the pattern does change, and while transport incidents are still the largest section, process incidents rise in significance. It is also notable that a higher proportion of incidents in the USA are of sufficient severity to be classified as 'major'
4 ,
ICHEME SYMPOSIUM SERIES NO. 141
(36%) compared with the proportion of "major' incidents in the UK. This is due to the data collection process, whereby we have access to information on a larger number of smaller incidents in the UK than elsewhere.
When the major incidents are considered for the rest of Europe, there is a notable change in the pattern of incidents. In this case process incidents contribute the largest number. This may be representative of what is actually happening. There have been moves in Germany (for instance) to move the transport of hazardous goods off the roads and onto the railways. As a result, if there is an accident, then it is less Likely that members of the public will be involved. Also, it is possible that traffic densities and routing of dangerous goods across Europe leads
to fewer people at risk in Europe than in the USA or the UK. There is also a factor involved due to the difficulties in collecting data from other parts of Europe, however the change in pattern is so dramatic that it is probable thai other factors arc more significant.
In an attempt to carry out a more detailed analysis of this data for the UK, information has been extracted from the Government Statistical Service publication on transport statistics. The data produced on behalf of the Department of Transport break down the freight transported by commodity, and the commodities are fairly generic. The most appropriate for use in a comparison exercise with MHIDAS incidents are "petrol and petroleum products" for road transport and "oil and petroleum" for rail transport.
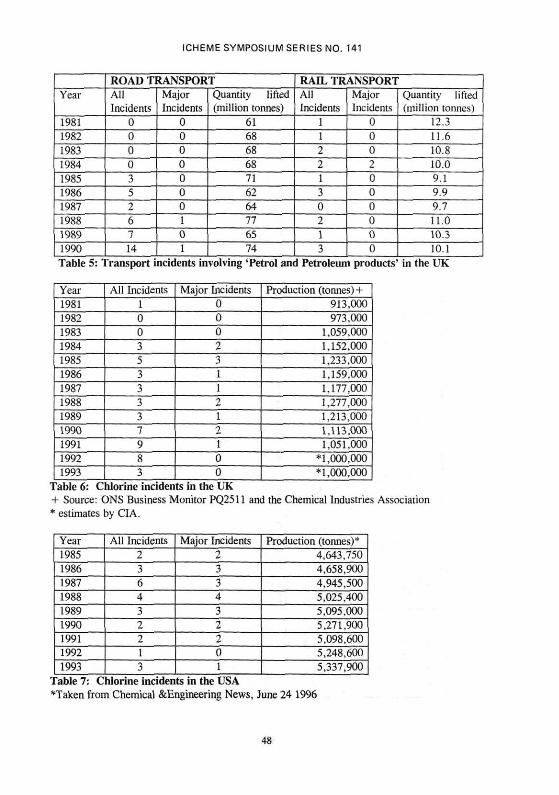
For road transport between 1981 and 1990, the quantity carried has remained relatively steady at around 70 million tonnes per year (Table 5). In this period, the number of incidents recorded on MHIDAS has risen from zero in 1984 to 14 in 1990. This increase is almost certainly due to the data collection process, but it will take a few more years to decide whether the upward trend is significant. As before, the 'major' incidents have been identified, of which there was one in 1988 and one in 1990. It would be difficult to support any statement on the basis of this information other lhan major road transport incidents do occur, but not frequently.
With rail transport, there appears to be a downward trend in the quantity of materials being carried, and there is a slight rising trend in the number of incidents, even so these remain at a low level, never exceeding three per year. However, as with the road accidents, the number of 'major' accidents is zero in most years. The quantity being carried by rail is approximately one seventh of the quantity carried by road. This reflects how the distribution networks and supply lines have developed in the UK, with die majority of refined product and derivatives in small loads being supplied by road, and much of me bulk distribution being achieved by pipeline instead of using die rail network.
It is difficult to draw any firm conclusions from the small total number of incidents that have occurred, and even more difficult to draw conclusions from the smaller number of 'major' incidents. For the UK at least, while mere is an increase in the reporting of smaller road transport incidents, the number of 'major' incidents remains low and suggests that die transportation of dangerous goods is generally well controlled.
42

ICHEME SYMPOSIUM SERIES NO. 141
INCIDENTS INVOLVING CHLORINE
Information on the production of chlorine is readily available, so the number of incidents involving chlorine have been extracted to see if there is any correlation between the number of incidents and the level of production.
The production of chlorine in the UK from 1981 to 1993 is shown in table 6. with the total number of incidents, and the number of 'major' incidents. The production of chlorine in this period has increased to a peak in 1988 and fallen again to approximately 1 million tonnes per year. Over the same period, the number of accidents involving chlorine remained steady at 3 per year until 1990, when there was a sudden increase. This reflects a change in the data collection whereby more information was collected on the less significant accidents. The occurrence of 'major' accidents has remained low, witii zero 'major' incidents in the last two years. It is to be hoped that this represents a real trend in the reduction in the number of 'major' accidents that has been achieved while production remains largely unaffected.
The production of chlorine in the USA from 1985 to 1993 is shown in table 7 in the same way. The production has shown a steady increase of approximately 15% over the nine year period. It is interesting to note that in this case, the number of serious incidents virtually matches the total number of incidents. This would seem to suggest under-reporting of incidents, or rather indicates the difficulty in obtaining data on small scale incidents from countries other than the UK. The steady increase in production appears to have been achieved with a reduction in the number of accidents.
This reduction in the rate of 'major' incidents, both in the UK and the USA. suggests that the risks associated with chlorine are under control, and that the industry is successfully taking measures to reduce those risks.
NUMBER OF PEOPLE AFFECTED
As well as recording the number of incidents MHIDAS also records the number of people killed, injured and evacuated during an incident in order to assess their scale. Figure 3 shows the number of incidents where people were killed worldwide, grouped into bands of fatalities. As may be expected, the number of incidents decreases as the number of fatalities increases.
The other point to be made from this chart is that the number of incidents is showing an upward trend for most bands. This is partly due to the increased level of reporting of incidents worldwide, but the area of greatest concern is the increase in the number of incidents involving larger numbers of fatalities (more than 10). While it may be expected that incidents involving smaller numbers of fatalities (less than 10) may go unreported outside the country in which it happened, those incidents involving many fatalities would certainly be widely reported. There may be exceptions, such as pre-glasnost USSR and mainland China, but generally incidents involving large numbers of fatalities would certainly be reported worldwide. This being the case, the increase in the number of high fatality incidents in recent years may be cause for concern. A more detailed analysis into the location of these high fatality incidents, and possible underlying causes is beyond the scope of this paper, but may form the basis of a future study.
43

ICHEME SYMPOSIUM SERIES NO. 141
Figure 4 shows the number of incidents involving injuries. While experience and received wisdom tells us that the expected number of injuries will be greater than the number of fatalities, it is interesting to note that for low numbers of injuries (1 to 5), the number of incidents is similar to the number of incidents involving low numbers of fatalities. This is related to the fact that it is very difficult to reliably identify the number of people injured from the data sources available. While the number of fatalities can be ascertained after the incident without much problem (although there may be widely varying estimates at the time of the incident), the number of injuries is more problematical. The first problem being how to define an injured person: should it be anyone who received first aid, or only people who were detained in hospital. There is the added problem in that medical facilities and the approach to medical treatment varies between countries - it may be that more emphasis is put on treatment at the scene of an incident, or it could be that people are taken to hospital as a matter of course. This will also vary depending on the scale of the incident and the number of people to be treated. In terms of collecting data for MHIDAS. it is often rare to be able to unambiguously identify the number of people injured due to the lack of information in the report.
Figure 5 shows the number of incidents where people were evacuated. This is difficult to quantify reliably as the reports seldom give exact numbers of people evacuated. Often we are faced with a report that states " nearby residents were evacuated" with no indication of the numbers involved. It is interesting to note that in this case the number of incidents where 50 or more people were evacuated significantly outweighs the other bands. This is probably because if a residential area is to be evacuated, then large numbers of people will be involved. The use of evacuation as a protective measure, as opposed to sheltering, will depend very
much on the view of the risks involved and local planning, which will vary from country to country and within regions of a country. Mass evacuations are only a viable option if significant pre-planning has been made, otherwise they may result in greater problems than they avoid.
REPORTING OF INCIDENTS
It was stated at the beginning of this paper that MHIDAS is based on public domain information sources. One of the characteristics associated with this is the variability in the quality and accuracy of reports. In the previous section, the difficulties in gelling reliable information on the number of people injured during an incident were mentioned. This difficulty is also encountered in reporting of the number of fatalities, and can manifest itself in two ways. It could be mat initial reports mention a large number of fatalities while people are not immediately accounted for, and it is not uncommon for the number of reported fatalities to fall within a few days from more than ten to one or two. It also happens where initial estimates of fatalities are low, but the number increases as bodies are pulled from wreckage, or people die from injuries sustained in the incident. In order to try and counter these effects,
the policy for MHIDAS is to collect as many references as possible to the incident before sorting and coding the data, in order to try and get to the facts behind the incident. This may take some time while investigations are carried out and, if the incident results in a prosecution by the regulatory body, then it may be some time before all the facts become available.
The quantity of reports involved is not necessarily related to the severity of the incident. It is very common for several newspapers to run a short report based on die same source (e.g.
44
ICHEME SYMPOSIUM SERIES NO. 141
Reuters or the Press Association), so while there may be several cuttings associated with an incident, it is based on a single report. Also an incident may attract local, national and international press coverage during and immediately after the event. While the variety of reports may provide different pieces of information, it is very rare that there is much consistency in the reporting - partly due to the difficulty in ascertaining the facts at the time, and also there is a degree of competition between reporters to get the "scoop" mat differentiaies their story.
It is also possible that small incidents will attract an inordinate amount of reporting, depending on what is perceived to be a risk to the public. Generally, fires do not attract much attention (relatively speaking) unless they are particularly spectacular. Incidents where there is the possibility of an environmental impact currently attract a lot of press coverage, even when the impact lias been limited by timely and appropriate action. Otherwise serious incidents can be pushed to the inside pages of national newspapers (or not mentioned at all) by a higher profile political or sporting event. There is very little correlation between the scale of an incident and how widely it is reported, unless the incident is particularly spectacular.
SUMMARY
MHIDAS has now been running for ten years, and in that time has gathered a large pool of information on die occurrence of accidents around the world. In diat time, there has been a general increase in me reported number of 'major' incidents around the world. Some of this increase will be attributable to increased availability of information from the former Soviet block countries, for instance, and some is attributable to the increase in industrial activity around die world. It is interesting to note me general downward trend in 'major- incidents in die USA against a background of increasing numbers of incidents elsewhere. The scale of incidents worldwide also seems to be increasing, widi growing numbers of high fatality incidents.
In compiling MHIDAS reports, we have had to overcome a general difficulty associated with collecting data from public domain sources, as me quality and quantity of reports varies considerably, and have little correlation widi die severity of the event. While local newspapers will probably carry an item on an incident, they may not be considered 'newsworthy' for a national or international readership. Much depends on what is perceived to be an issue of interest.
What has been described here is a small study of me information contained in the database. This year alone, at least two odier studies based almost entirely on the data held in MHIDAS mat have been offered for publication, one on incidents involving gas pipelines and the other into incidents involving fires. In addition, the data has been used to support research studies and risk assessments. MHIDAS is being continuously updated and data collected from a variety of sources.
45

ICHEME SYMPOSIUM SERIES NO. 141
USA & Canada UK Europe (excl.UK) Asia Australasia Central & South America Africa CIS Totals
<1950 108 24 22
3 1 1
0 0
159
1951-1960 152
8 7
2 0 1
0 1
171
1961-1970 278 61
107
20 13 19
9 0
507
1971-1980 689 233 302
126 18 58
21 0
1447
1981-1990 1205 884 261
175 164 87
45 59
2880
Total 2432 1210
699
326 196 166
75 60
5164
Table 1: Incidents by decade
USA & Canada UK Europe (excl.UK)
Asia Australasia Central & South America
Africa CIS All Incidents
<1950 33 15 20
0 I 1
0 0
74
1951-1960 46
0 4
2 0 1
0 0
55
1961-1970 US
15 50
9 3
13
2 0
217
1971-1980 354 52
123
53 29 29
5 0
661
1981-1990 524 163 93
102 46 46
16 23
1051
Total 1075 245 290
166 79 90
23 23
2058 Table 3: Major Incidents by decade
46
ICHEME SYMPOSIUM SERIES NO. 141
47
ICHEME SYMPOSIUM SERIES NO. 141
Year
1981 1982 1983 1984 1985 1986 1987 1988 1989 1990
ROAD TRANSPORT All Incidents
0 0 0 0 3 5 2 6 7 14
Major Incidents
0 0 0 0 0 0 0 1 0 1
Quantity lifted (million tonnes)
61 68 68 68 71 62 64 77 65 74
RAIL TRANSPORT All Incidents
1 1 2 2 1 3 0 2
1 3
Major Incidents
0 0 0 2 0 0 0 0 0 0
Quantity lifted (million tonnes)
12.3
11.6 10.8 10.0 9.1 9.9 9.7 11.0 10.3 10.1
Table 5: Transport incidents involving 'Petrol and Petroleum products' in the UK
Year 1981 1982 1983 1984 1985 1986 1987 1988 1989 1990 1991 1992 1993
All Incidents
1 0 0 3 5 3 3 3 3 7 9 8 3
Major Incidents 0 0 0
2 3 1 1 2 1 2 1 0 0
Production (tonnes) + 913,000 973,000
1,059,000 1,152.000 1,233.000 1,159.000 1.177,000 1,277,000 1,213.000 1.113,000 1,051,000
*1,000,000 •1,000.000
Table 6: Chlorine incidents in the UK + Source: ONS Business Monitor PQ2511 and the Chemical Industries Association * estimates by CIA.
Year 1985 1986 1987 1988 1989 1990 1991 1992 1993
All Incidents 2 3 6 4 3 2 2 1 3
Major Incidents
3 3 4 3 2 2 0 1
Production (tonnes)* 4,643,750 4,658,900 4.945,500 5.025,400 5.095,000 5,271,900 5,098,600 5,248,600 5,337,900
Table 7: Chlorine incidents in the USA •Taken from Chemical &Engineering News, June 24 1996
48
ICHEME S Y M P O S I U M SERIES NO. 141
Figure 1: Number of incidents by 0R1GIN:1980-1993
1200-
1000-
800-
600-
400-
200-
0-
/
I
1
1 1 I Wi 1 1 *
Europe
O Transport
• Storage
• Process
Figure 2: Major Incidents by ORIGIN: 1980-1993
400^
350-
300-
250 -,
200 J
150 -
100-
50-
f S /
/ \
/
/
S
D Transport
• Storage
OProcess
Europe
49

ICHEME SYMPOSIUM SERIES NO. 141
Figure 3: Number of Incidents involving fatalities
Number of fatalit ies
Figure 4: Number of incidents involving Injuries
1 to 5 610 10
to 20 21 to 50 Number of Injuries
50
Figure 5 IJjicjdjsrits involving Evacuation
>50 21 to 50
1 1 1 0 2 0 Number of 6 1 0 1 0 Evacuees
to 5
50