Embed Size (px)
Citation preview
MHD Simulations of a Supernova-driven ISMAlex!S!Hill1, MR!Joung2,5, RA!Benjamin3, LM Haffner1, C!Klingenberg4, M-M!Mac!Low5, K!Waagan6, KA!Wood7
1U of Wisconsin-Madison, 2Columbia U, 3U of Wisconsin-Whitewater, 4Würzburg U, 5American Museum of Natural History, 6U of Maryland, 7U of St Andrews
AbstractWe present new 3D magnetohydrodynamic (MHD) simula-tions of a supernova-driven, stratified ISM. We have previ-ously shown that the density distribution arising from hy-drodynamic (HD) versions of these simulations creates low-density pathways through which Lyman continuum pho-tons can travel to heights |z| > 1 kpc. This naturally pro-duces the warm ionized medium through photoionization due primarily to O stars near the plane. However, the HD models reproduce the peak but not the width of the emis-sion measure distribution observed in Wisconsin H-Alpha Mapper (WHAM) data. Here, we discuss the role of mag-netic fields in the structure of gas away from the plane.
The simulations were performed using the adaptive mesh refinement grid code FLASH with the new MHD solver de-veloped by Waagan et al.
IntroductionThe circulation of gas in the interstellar medium (ISM) be-tween the disk and halo plays a crucial role in the evolution of galaxies. In recent years, numerical simulations have shown that a supernova-driven ISM reproduces many of the observed features of the ISM of the Milky Way (eg Avillez & Breitschwerdt 2004, 2005; Joung & Mac Low 2006).
Inconsistencies between the observations and the simula-tions lead us to the present work, in which we extend the hydrodynamical simulations of Joung et al (2006, 2009) to include MHD in order to study the role of magnetic fields in the vertical structure of the ISM. We focus on three in-consistencies: 1) The observed distribution of H! emission measures is narrower than produced by the simulations, implying that the simulations have more low density and more high density gas than the real ISM (Wood et al 2010). 2) The gas densities at |z|~1 kpc are considerably lower in the simulation than observed, resulting in the near-absence
of the warm ionized medium at those heights (Wood et al 2010). 3) The model overpredicts the observed X-ray tem-perature by a factor of ~2 (Henley et al 2010). We expect magnetic fields to help with all three of these inconsistencies because magnetic fields resist compression of the medium, reducing the contrast between low- and high-density re-gions and provide vertical support of the gas. We expect the vertical support to produce denser gas at |z|~1–2 kpc, al-lowing more efficient cooling.
SimulationsOur model is an MHD extension of the hydrodynamical code developed by Joung et al (2006, 2009). We use FLASH v2.5, an Eulerian astrophysical code with AMR (Fryxell et al 2000) and the positive-states-preserving MUSCL-Hancock Riemann solver developed by Waagan (2009) to solve the MHD equations.
Initial conditions: We use a 1x1x10 kpc grid with 3 or 4 lev-els of refinement ranging from ≈2 pc to ≈16 pc. The grid ex-tends to z = ±5 kpc from the midplane. A total surface mass density of 13.2 M0 pc-2 is initially distributed isothermally in hydrostatic equilibrium with T = 11000 K. An initial, uni-form, horizontal magnetic field is applied with a constant plasma " at three midplane field strengths: Bx(z=0, t=0) = 0, 3.5, and 7.0 #G.
Gravity: We used a fixed gravitational potential from Kuijken & Gilmore (1989) modified to approximately trace the dark matter contribution measured by Dehnen & Binney (1998) at |z| > 2 kpc. We do not include self-gravity.
Supernovae: Supernova explosions are set off in the box at the Galactic rate in three populations: Type Ia (6.58 Myr-1 kpc-2, scale height h=325 pc), field core collapse (11.0 Myr-1 kpc-2, h=90 pc), and clustered core collapse (16.4 Myr-1 kpc-2, h=90 pc). These supernovae drive turbu-lence and structure formation in the grid.
Resolution: The AMR grid uses 3 levels of refinement with resolution ranging from ≈ 4 – 16 pc for the first 240 Myr of the simulation, switching to 4 levels of refinement with reso-lutions of ≈ 2 – 16 pc from 240 – 300 Myr in the 0 and 3.5 #G models; the 7 #G remains at the 4 – 16 pc resolution throughout.
ResultsVertical structure (Figures 1–2): Models with stronger fields have a more vertically-extended ISM.
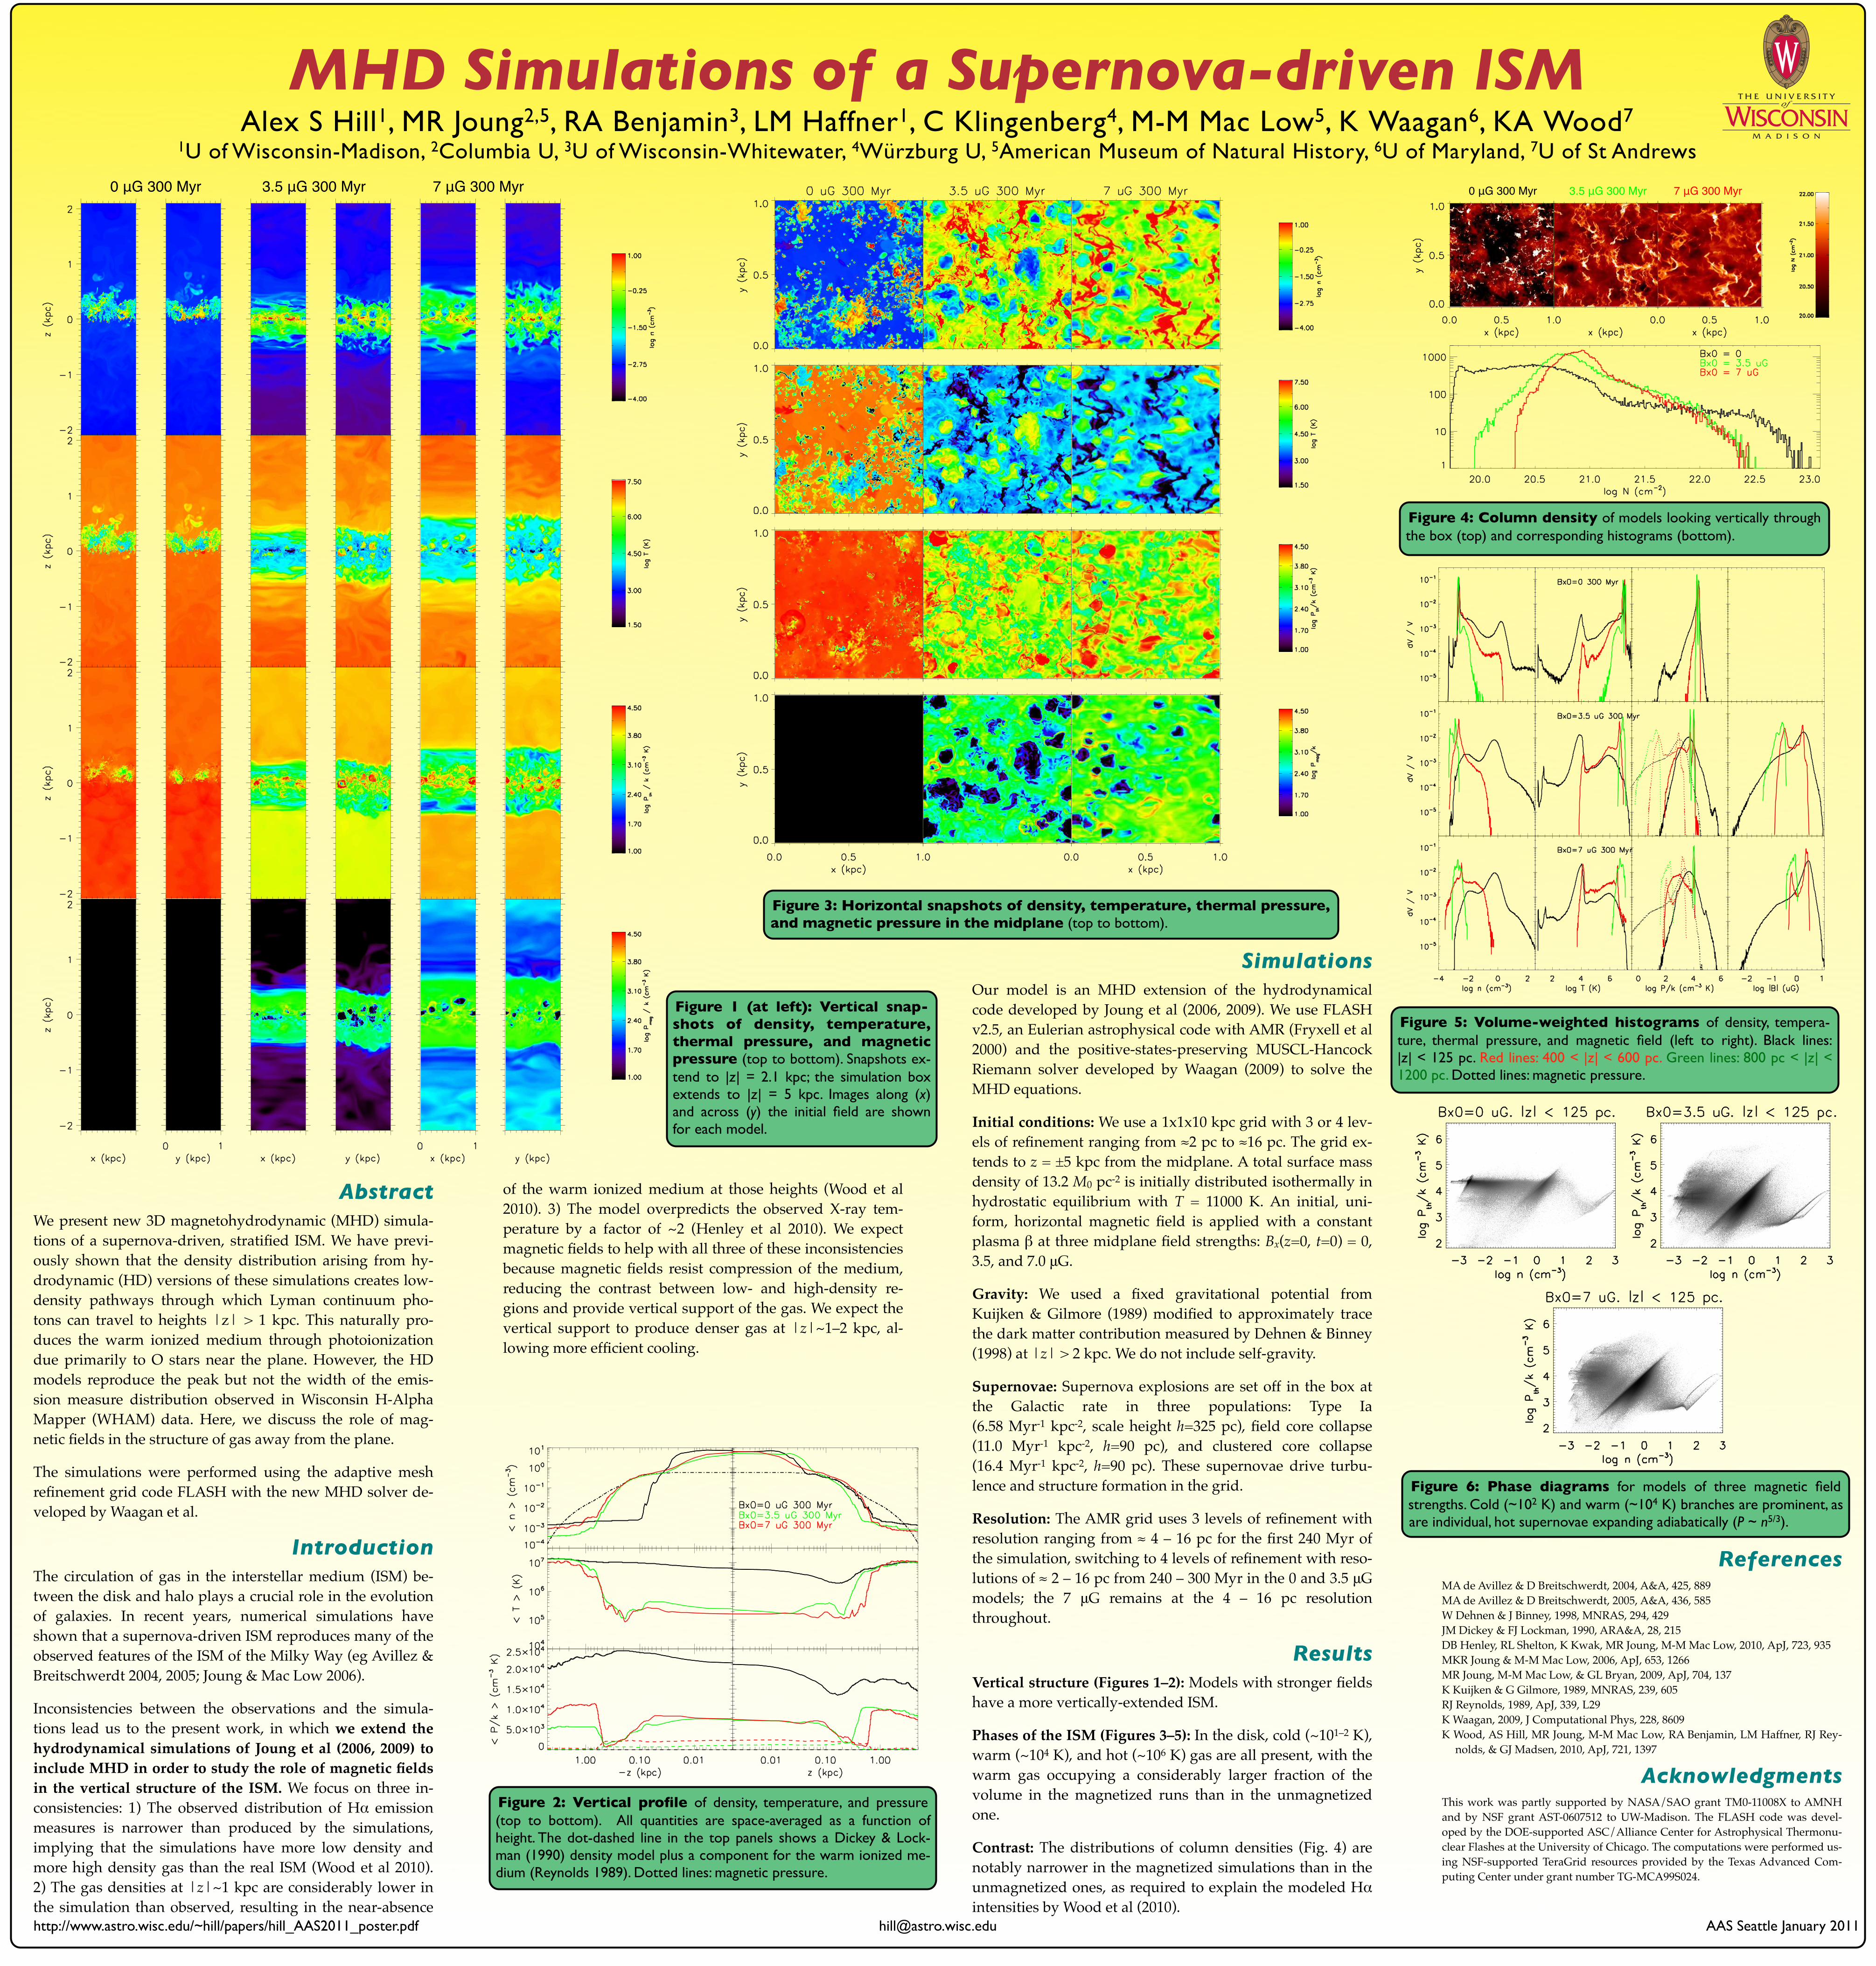
Phases of the ISM (Figures 3–5): In the disk, cold (~101–2 K), warm (~104 K), and hot (~106 K) gas are all present, with the warm gas occupying a considerably larger fraction of the volume in the magnetized runs than in the unmagnetized one.
Contrast: The distributions of column densities (Fig. 4) are notably narrower in the magnetized simulations than in the unmagnetized ones, as required to explain the modeled H! intensities by Wood et al (2010).
ReferencesMA de Avillez & D Breitschwerdt, 2004, A&A, 425, 889MA de Avillez & D Breitschwerdt, 2005, A&A, 436, 585W Dehnen & J Binney, 1998, MNRAS, 294, 429JM Dickey & FJ Lockman, 1990, ARA&A, 28, 215DB Henley, RL Shelton, K Kwak, MR Joung, M-M Mac Low, 2010, ApJ, 723, 935MKR Joung & M-M Mac Low, 2006, ApJ, 653, 1266MR Joung, M-M Mac Low, & GL Bryan, 2009, ApJ, 704, 137K Kuijken & G Gilmore, 1989, MNRAS, 239, 605RJ Reynolds, 1989, ApJ, 339, L29K Waagan, 2009, J Computational Phys, 228, 8609K Wood, AS Hill, MR Joung, M-M Mac Low, RA Benjamin, LM Haffner, RJ Rey-
nolds, & GJ Madsen, 2010, ApJ, 721, 1397
Acknowledgments This work was partly supported by NASA/SAO grant TM0-11008X to AMNH and by NSF grant AST-0607512 to UW-Madison. The FLASH code was devel-oped by the DOE-supported ASC/Alliance Center for Astrophysical Thermonu-clear Flashes at the University of Chicago. The computations were performed us-ing NSF-supported TeraGrid resources provided by the Texas Advanced Com-puting Center under grant number TG-MCA99S024.
Figure 5: Volume-weighted histograms of density, tempera-ture, thermal pressure, and magnetic field (left to right). Black lines: |z|!<!125!pc. Red lines: 400!<!|z|!<!600!pc. Green lines: 800!pc!<!|z|!< 1200!pc. Dotted lines: magnetic pressure.
http://www.astro.wisc.edu/~hill/papers/hill_AAS2011_poster.pdf AAS Seattle January 2011
Figure 3: Horizontal snapshots of density, temperature, thermal pressure, and magnetic pressure in the midplane (top to bottom).
Figure 1 (at left): Vertical snap-shots of density, temperature, thermal pressure, and magnetic pressure (top to bottom). Snapshots ex-tend to |z|!=!2.1!kpc; the simulation box extends to |z|! =! 5! kpc. Images along (x) and across (y) the initial field are shown for each model.
0 μG 300 Myr 3.5 μG 300 Myr 7 μG 300 Myr
Figure 2: Vertical profile of density, temperature, and pressure (top to bottom). All quantities are space-averaged as a function of height. The dot-dashed line in the top panels shows a Dickey & Lock-man (1990) density model plus a component for the warm ionized me-dium (Reynolds 1989). Dotted lines: magnetic pressure.
Figure 6: Phase diagrams for models of three magnetic field strengths. Cold (~102!K) and warm (~104!K) branches are prominent, as are individual, hot supernovae expanding adiabatically (P ~ n5/3).
Figure 4: Column density of models looking vertically through the box (top) and corresponding histograms (bottom).
0 μG 300 Myr 3.5 μG 300 Myr 7 μG 300 Myr


![arXiv:1711.02174v3 [astro-ph.HE] 25 Nov 2017 · 2017. 11. 28. · Subject headings: ISM: individual (Cygnus Loop) - ISM: kinematics and dynamics - ISM: supernova remnants 1. INTRODUCTION](https://img.pdfslide.us/doc/110x75/6023c325edd6783e2067e3b8/arxiv171102174v3-astro-phhe-25-nov-2017-2017-11-28-subject-headings-ism.jpg)