Embed Size (px)
Citation preview
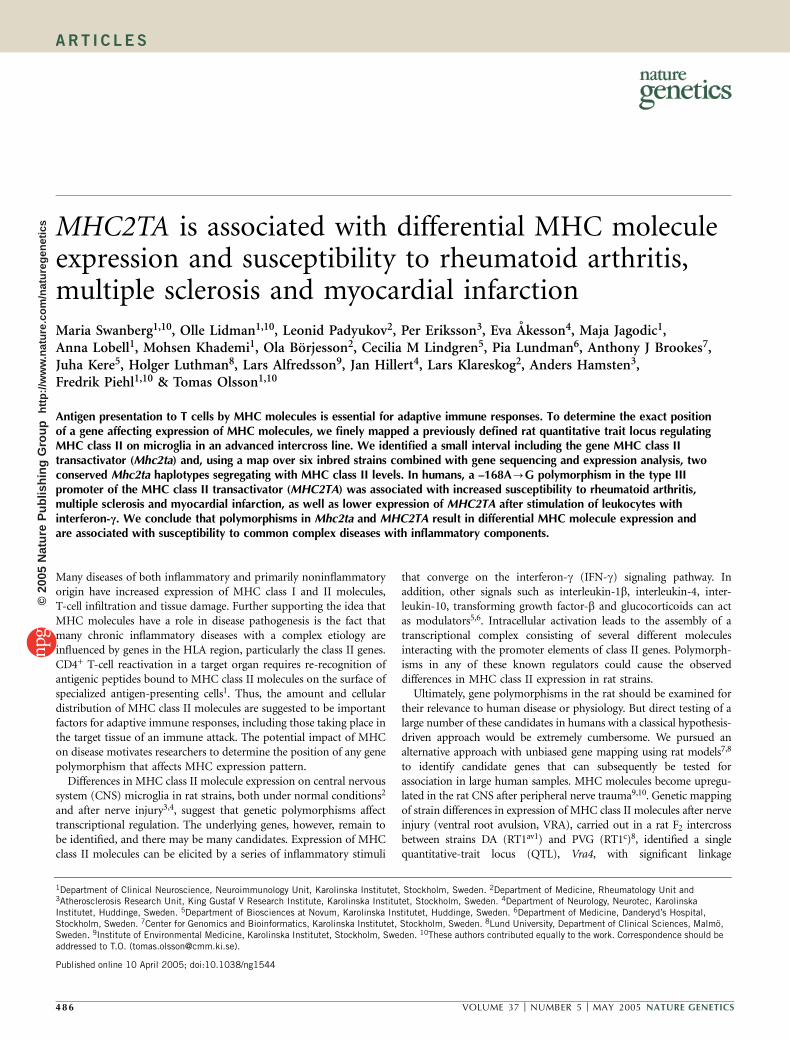
MHC2TA is associated with differential MHC moleculeexpression and susceptibility to rheumatoid arthritis,multiple sclerosis and myocardial infarctionMaria Swanberg1,10, Olle Lidman1,10, Leonid Padyukov2, Per Eriksson3, Eva Akesson4, Maja Jagodic1,Anna Lobell1, Mohsen Khademi1, Ola Borjesson2, Cecilia M Lindgren5, Pia Lundman6, Anthony J Brookes7,Juha Kere5, Holger Luthman8, Lars Alfredsson9, Jan Hillert4, Lars Klareskog2, Anders Hamsten3,Fredrik Piehl1,10 & Tomas Olsson1,10
Antigen presentation to T cells by MHC molecules is essential for adaptive immune responses. To determine the exact positionof a gene affecting expression of MHC molecules, we finely mapped a previously defined rat quantitative trait locus regulatingMHC class II on microglia in an advanced intercross line. We identified a small interval including the gene MHC class IItransactivator (Mhc2ta) and, using a map over six inbred strains combined with gene sequencing and expression analysis, twoconserved Mhc2ta haplotypes segregating with MHC class II levels. In humans, a –168A-G polymorphism in the type IIIpromoter of the MHC class II transactivator (MHC2TA) was associated with increased susceptibility to rheumatoid arthritis,multiple sclerosis and myocardial infarction, as well as lower expression of MHC2TA after stimulation of leukocytes withinterferon-c. We conclude that polymorphisms in Mhc2ta and MHC2TA result in differential MHC molecule expression andare associated with susceptibility to common complex diseases with inflammatory components.
Many diseases of both inflammatory and primarily noninflammatoryorigin have increased expression of MHC class I and II molecules,T-cell infiltration and tissue damage. Further supporting the idea thatMHC molecules have a role in disease pathogenesis is the fact thatmany chronic inflammatory diseases with a complex etiology areinfluenced by genes in the HLA region, particularly the class II genes.CD4+ T-cell reactivation in a target organ requires re-recognition ofantigenic peptides bound to MHC class II molecules on the surface ofspecialized antigen-presenting cells1. Thus, the amount and cellulardistribution of MHC class II molecules are suggested to be importantfactors for adaptive immune responses, including those taking place inthe target tissue of an immune attack. The potential impact of MHCon disease motivates researchers to determine the position of any genepolymorphism that affects MHC expression pattern.
Differences in MHC class II molecule expression on central nervoussystem (CNS) microglia in rat strains, both under normal conditions2
and after nerve injury3,4, suggest that genetic polymorphisms affecttranscriptional regulation. The underlying genes, however, remain tobe identified, and there may be many candidates. Expression of MHCclass II molecules can be elicited by a series of inflammatory stimuli
that converge on the interferon-g (IFN-g) signaling pathway. Inaddition, other signals such as interleukin-1b, interleukin-4, inter-leukin-10, transforming growth factor-b and glucocorticoids can actas modulators5,6. Intracellular activation leads to the assembly of atranscriptional complex consisting of several different moleculesinteracting with the promoter elements of class II genes. Polymorph-isms in any of these known regulators could cause the observeddifferences in MHC class II expression in rat strains.
Ultimately, gene polymorphisms in the rat should be examined fortheir relevance to human disease or physiology. But direct testing of alarge number of these candidates in humans with a classical hypothesis-driven approach would be extremely cumbersome. We pursued analternative approach with unbiased gene mapping using rat models7,8
to identify candidate genes that can subsequently be tested forassociation in large human samples. MHC molecules become upregu-lated in the rat CNS after peripheral nerve trauma9,10. Genetic mappingof strain differences in expression of MHC class II molecules after nerveinjury (ventral root avulsion, VRA), carried out in a rat F2 intercrossbetween strains DA (RT1av1) and PVG (RT1c)8, identified a singlequantitative-trait locus (QTL), Vra4, with significant linkage
Published online 10 April 2005; doi:10.1038/ng1544
1Department of Clinical Neuroscience, Neuroimmunology Unit, Karolinska Institutet, Stockholm, Sweden. 2Department of Medicine, Rheumatology Unit and3Atherosclerosis Research Unit, King Gustaf V Research Institute, Karolinska Institutet, Stockholm, Sweden. 4Department of Neurology, Neurotec, KarolinskaInstitutet, Huddinge, Sweden. 5Department of Biosciences at Novum, Karolinska Institutet, Huddinge, Sweden. 6Department of Medicine, Danderyd’s Hospital,Stockholm, Sweden. 7Center for Genomics and Bioinformatics, Karolinska Institutet, Stockholm, Sweden. 8Lund University, Department of Clinical Sciences, Malmo,Sweden. 9Institute of Environmental Medicine, Karolinska Institutet, Stockholm, Sweden. 10These authors contributed equally to the work. Correspondence should beaddressed to T.O. ([email protected]).
4 86 VOLUME 37 [ NUMBER 5 [ MAY 2005 NATURE GENETICS
A R T I C L E S©
2005
Nat
ure
Pub
lishi
ng G
roup
ht
tp://
ww
w.n
atur
e.co
m/n
atur
egen
etic
s
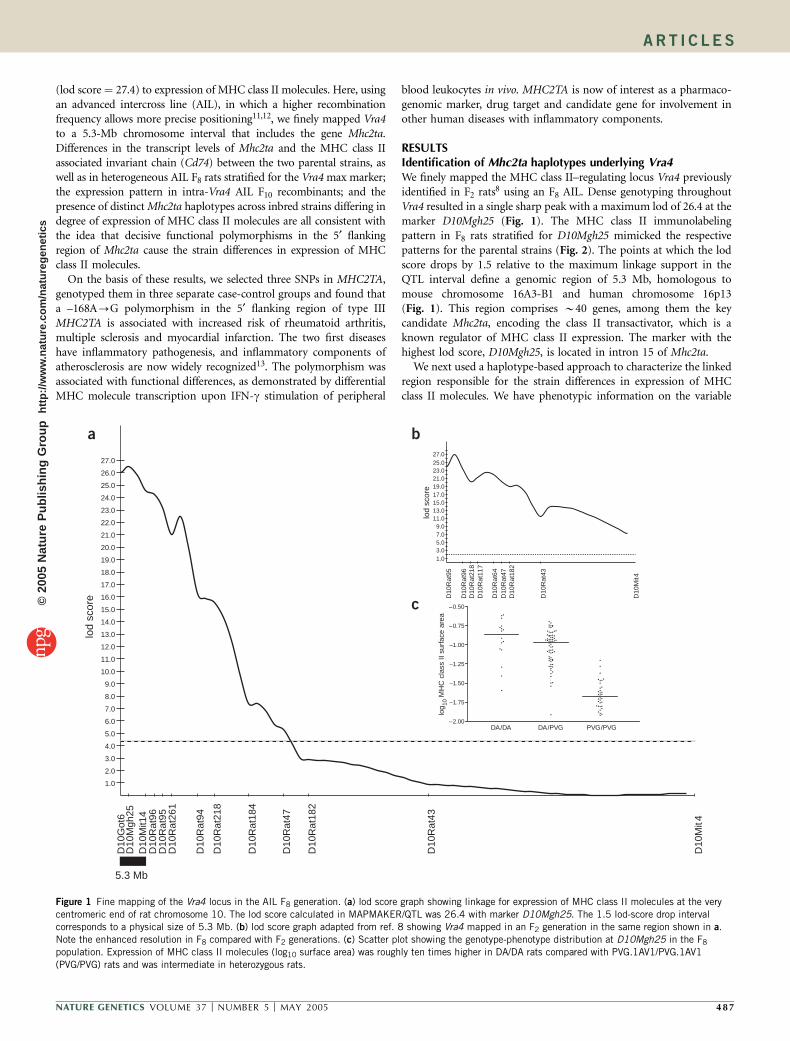
(lod score ¼ 27.4) to expression of MHC class II molecules. Here, usingan advanced intercross line (AIL), in which a higher recombinationfrequency allows more precise positioning11,12, we finely mapped Vra4to a 5.3-Mb chromosome interval that includes the gene Mhc2ta.Differences in the transcript levels of Mhc2ta and the MHC class IIassociated invariant chain (Cd74) between the two parental strains, aswell as in heterogeneous AIL F8 rats stratified for the Vra4 max marker;the expression pattern in intra-Vra4 AIL F10 recombinants; and thepresence of distinct Mhc2ta haplotypes across inbred strains differing indegree of expression of MHC class II molecules are all consistent withthe idea that decisive functional polymorphisms in the 5¢ flankingregion of Mhc2ta cause the strain differences in expression of MHCclass II molecules.
On the basis of these results, we selected three SNPs in MHC2TA,genotyped them in three separate case-control groups and found thata –168A-G polymorphism in the 5¢ flanking region of type IIIMHC2TA is associated with increased risk of rheumatoid arthritis,multiple sclerosis and myocardial infarction. The two first diseaseshave inflammatory pathogenesis, and inflammatory components ofatherosclerosis are now widely recognized13. The polymorphism wasassociated with functional differences, as demonstrated by differentialMHC molecule transcription upon IFN-g stimulation of peripheral
blood leukocytes in vivo. MHC2TA is now of interest as a pharmaco-genomic marker, drug target and candidate gene for involvement inother human diseases with inflammatory components.
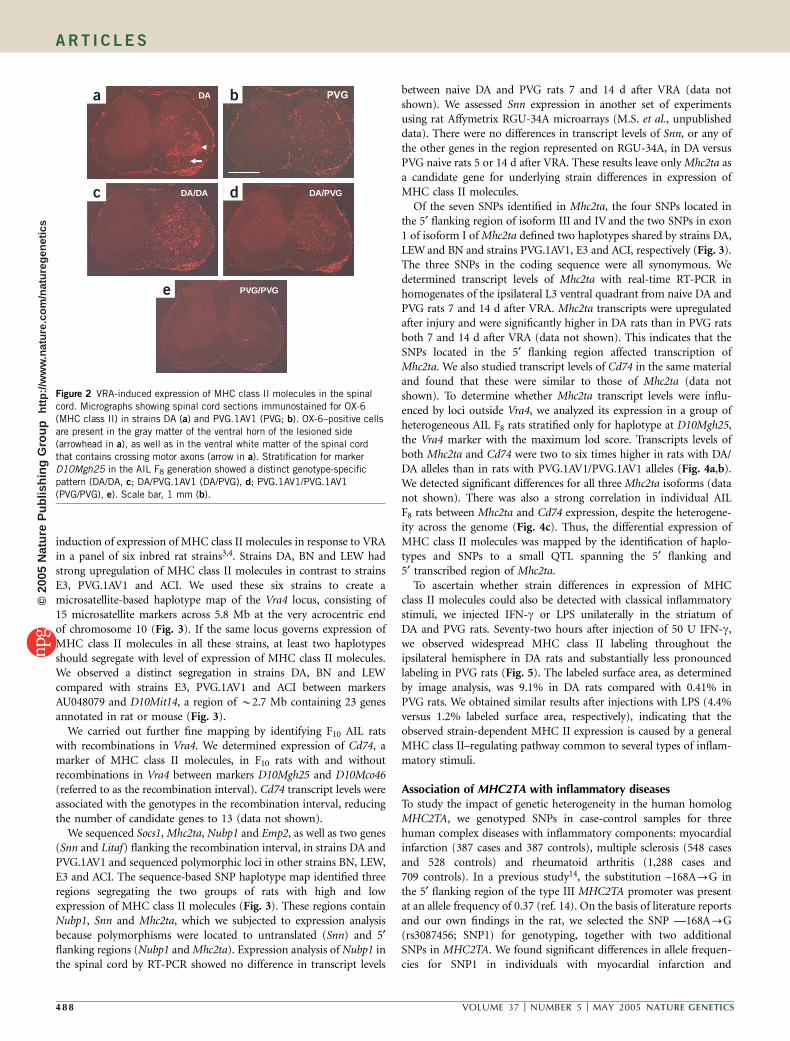
RESULTSIdentification of Mhc2ta haplotypes underlying Vra4We finely mapped the MHC class II–regulating locus Vra4 previouslyidentified in F2 rats8 using an F8 AIL. Dense genotyping throughoutVra4 resulted in a single sharp peak with a maximum lod of 26.4 at themarker D10Mgh25 (Fig. 1). The MHC class II immunolabelingpattern in F8 rats stratified for D10Mgh25 mimicked the respectivepatterns for the parental strains (Fig. 2). The points at which the lodscore drops by 1.5 relative to the maximum linkage support in theQTL interval define a genomic region of 5.3 Mb, homologous tomouse chromosome 16A3-B1 and human chromosome 16p13(Fig. 1). This region comprises B40 genes, among them the keycandidate Mhc2ta, encoding the class II transactivator, which is aknown regulator of MHC class II expression. The marker with thehighest lod score, D10Mgh25, is located in intron 15 of Mhc2ta.
We next used a haplotype-based approach to characterize the linkedregion responsible for the strain differences in expression of MHCclass II molecules. We have phenotypic information on the variable
27.0
26.0
25.0
24.0
23.0
22.0
21.0
20.0
19.0
18.0
17.0
16.0
15.0
14.0
13.0
12.0
11.0
10.0
9.0
8.0
7.0
6.0
5.0
4.0
3.0
2.0
1.0
5.3 Mb
D10
Got
6D
10M
gh25
D10
Mit1
4D
10R
at96
D10
Rat
95D
10R
at26
1
D10
Rat
94
D10
Rat
218
D10
Rat
184
D10
Rat
47
D10
Rat
182
D10
Rat
43
D10
Mit
4
lod
scor
e
lod
scor
e
27.025.023.021.019.017.015.013.011.09.07.05.03.01.0
D10
Rat
95
D10
Rat
96D
10R
at21
8D
10R
at11
7
D10
Rat
64D
10R
at47
D10
Rat
182
D10
Rat
43
D10
Mit
4
log 10
MH
C c
lass
II s
urfa
ce a
rea
–0.50
–0.75
–1.00
–1.25
–1.50
–1.75
–2.00DA/DA DA/PVG PVG/PVG
a b
c
Figure 1 Fine mapping of the Vra4 locus in the AIL F8 generation. (a) lod score graph showing linkage for expression of MHC class II molecules at the very
centromeric end of rat chromosome 10. The lod score calculated in MAPMAKER/QTL was 26.4 with marker D10Mgh25. The 1.5 lod-score drop intervalcorresponds to a physical size of 5.3 Mb. (b) lod score graph adapted from ref. 8 showing Vra4 mapped in an F2 generation in the same region shown in a.
Note the enhanced resolution in F8 compared with F2 generations. (c) Scatter plot showing the genotype-phenotype distribution at D10Mgh25 in the F8
population. Expression of MHC class II molecules (log10 surface area) was roughly ten times higher in DA/DA rats compared with PVG.1AV1/PVG.1AV1
(PVG/PVG) rats and was intermediate in heterozygous rats.
NATURE GENETICS VOLUME 37 [ NUMBER 5 [ MAY 2005 48 7
A R T I C L E S©
2005
Nat
ure
Pub
lishi
ng G
roup
ht
tp://
ww
w.n
atur
e.co
m/n
atur
egen
etic
s
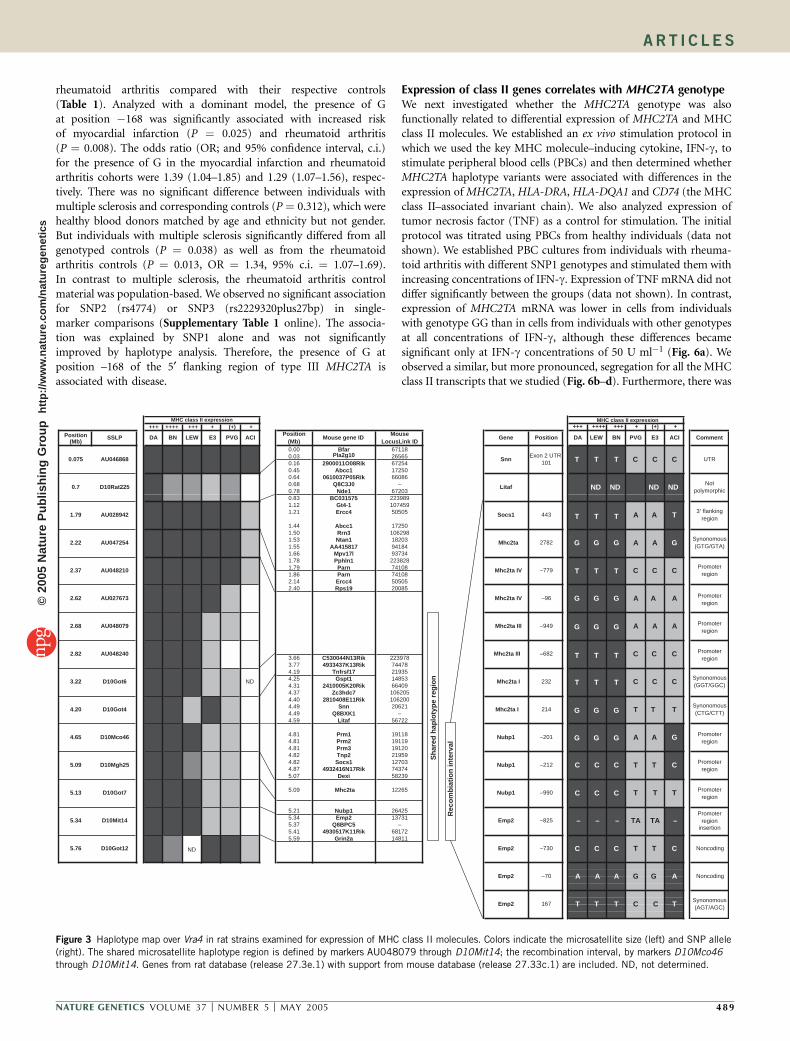
induction of expression of MHC class II molecules in response to VRAin a panel of six inbred rat strains3,4. Strains DA, BN and LEW hadstrong upregulation of MHC class II molecules in contrast to strainsE3, PVG.1AV1 and ACI. We used these six strains to create amicrosatellite-based haplotype map of the Vra4 locus, consisting of15 microsatellite markers across 5.8 Mb at the very acrocentric endof chromosome 10 (Fig. 3). If the same locus governs expression ofMHC class II molecules in all these strains, at least two haplotypesshould segregate with level of expression of MHC class II molecules.We observed a distinct segregation in strains DA, BN and LEWcompared with strains E3, PVG.1AV1 and ACI between markersAU048079 and D10Mit14, a region of B2.7 Mb containing 23 genesannotated in rat or mouse (Fig. 3).
We carried out further fine mapping by identifying F10 AIL ratswith recombinations in Vra4. We determined expression of Cd74, amarker of MHC class II molecules, in F10 rats with and withoutrecombinations in Vra4 between markers D10Mgh25 and D10Mco46(referred to as the recombination interval). Cd74 transcript levels wereassociated with the genotypes in the recombination interval, reducingthe number of candidate genes to 13 (data not shown).
We sequenced Socs1, Mhc2ta, Nubp1 and Emp2, as well as two genes(Snn and Litaf) flanking the recombination interval, in strains DA andPVG.1AV1 and sequenced polymorphic loci in other strains BN, LEW,E3 and ACI. The sequence-based SNP haplotype map identified threeregions segregating the two groups of rats with high and lowexpression of MHC class II molecules (Fig. 3). These regions containNubp1, Snn and Mhc2ta, which we subjected to expression analysisbecause polymorphisms were located to untranslated (Snn) and 5¢flanking regions (Nubp1 and Mhc2ta). Expression analysis of Nubp1 inthe spinal cord by RT-PCR showed no difference in transcript levels
between naive DA and PVG rats 7 and 14 d after VRA (data notshown). We assessed Snn expression in another set of experimentsusing rat Affymetrix RGU-34A microarrays (M.S. et al., unpublisheddata). There were no differences in transcript levels of Snn, or any ofthe other genes in the region represented on RGU-34A, in DA versusPVG naive rats 5 or 14 d after VRA. These results leave only Mhc2ta asa candidate gene for underlying strain differences in expression ofMHC class II molecules.
Of the seven SNPs identified in Mhc2ta, the four SNPs located inthe 5¢ flanking region of isoform III and IV and the two SNPs in exon1 of isoform I of Mhc2ta defined two haplotypes shared by strains DA,LEW and BN and strains PVG.1AV1, E3 and ACI, respectively (Fig. 3).The three SNPs in the coding sequence were all synonymous. Wedetermined transcript levels of Mhc2ta with real-time RT-PCR inhomogenates of the ipsilateral L3 ventral quadrant from naive DA andPVG rats 7 and 14 d after VRA. Mhc2ta transcripts were upregulatedafter injury and were significantly higher in DA rats than in PVG ratsboth 7 and 14 d after VRA (data not shown). This indicates that theSNPs located in the 5¢ flanking region affected transcription ofMhc2ta. We also studied transcript levels of Cd74 in the same materialand found that these were similar to those of Mhc2ta (data notshown). To determine whether Mhc2ta transcript levels were influ-enced by loci outside Vra4, we analyzed its expression in a group ofheterogeneous AIL F8 rats stratified only for haplotype at D10Mgh25,the Vra4 marker with the maximum lod score. Transcripts levels ofboth Mhc2ta and Cd74 were two to six times higher in rats with DA/DA alleles than in rats with PVG.1AV1/PVG.1AV1 alleles (Fig. 4a,b).We detected significant differences for all three Mhc2ta isoforms (datanot shown). There was also a strong correlation in individual AILF8 rats between Mhc2ta and Cd74 expression, despite the heterogene-ity across the genome (Fig. 4c). Thus, the differential expression ofMHC class II molecules was mapped by the identification of haplo-types and SNPs to a small QTL spanning the 5¢ flanking and5¢ transcribed region of Mhc2ta.
To ascertain whether strain differences in expression of MHCclass II molecules could also be detected with classical inflammatorystimuli, we injected IFN-g or LPS unilaterally in the striatum ofDA and PVG rats. Seventy-two hours after injection of 50 U IFN-g,we observed widespread MHC class II labeling throughout theipsilateral hemisphere in DA rats and substantially less pronouncedlabeling in PVG rats (Fig. 5). The labeled surface area, as determinedby image analysis, was 9.1% in DA rats compared with 0.41% inPVG rats. We obtained similar results after injections with LPS (4.4%versus 1.2% labeled surface area, respectively), indicating that theobserved strain-dependent MHC II expression is caused by a generalMHC class II–regulating pathway common to several types of inflam-matory stimuli.
Association of MHC2TA with inflammatory diseasesTo study the impact of genetic heterogeneity in the human homologMHC2TA, we genotyped SNPs in case-control samples for threehuman complex diseases with inflammatory components: myocardialinfarction (387 cases and 387 controls), multiple sclerosis (548 casesand 528 controls) and rheumatoid arthritis (1,288 cases and709 controls). In a previous study14, the substitution –168A-G inthe 5¢ flanking region of the type III MHC2TA promoter was presentat an allele frequency of 0.37 (ref. 14). On the basis of literature reportsand our own findings in the rat, we selected the SNP —168A-G(rs3087456; SNP1) for genotyping, together with two additionalSNPs in MHC2TA. We found significant differences in allele frequen-cies for SNP1 in individuals with myocardial infarction and
DA PVG
DA/DA
PVG/PVG
DA/PVG
ba
dc
e
Figure 2 VRA-induced expression of MHC class II molecules in the spinal
cord. Micrographs showing spinal cord sections immunostained for OX-6
(MHC class II) in strains DA (a) and PVG.1AV1 (PVG; b). OX-6–positive cells
are present in the gray matter of the ventral horn of the lesioned side
(arrowhead in a), as well as in the ventral white matter of the spinal cord
that contains crossing motor axons (arrow in a). Stratification for marker
D10Mgh25 in the AIL F8 generation showed a distinct genotype-specific
pattern (DA/DA, c; DA/PVG.1AV1 (DA/PVG), d; PVG.1AV1/PVG.1AV1
(PVG/PVG), e). Scale bar, 1 mm (b).
4 88 VOLUME 37 [ NUMBER 5 [ MAY 2005 NATURE GENETICS
A R T I C L E S©
2005
Nat
ure
Pub
lishi
ng G
roup
ht
tp://
ww
w.n
atur
e.co
m/n
atur
egen
etic
s
rheumatoid arthritis compared with their respective controls(Table 1). Analyzed with a dominant model, the presence of Gat position �168 was significantly associated with increased riskof myocardial infarction (P ¼ 0.025) and rheumatoid arthritis(P ¼ 0.008). The odds ratio (OR; and 95% confidence interval, c.i.)for the presence of G in the myocardial infarction and rheumatoidarthritis cohorts were 1.39 (1.04–1.85) and 1.29 (1.07–1.56), respec-tively. There was no significant difference between individuals withmultiple sclerosis and corresponding controls (P ¼ 0.312), which werehealthy blood donors matched by age and ethnicity but not gender.But individuals with multiple sclerosis significantly differed from allgenotyped controls (P ¼ 0.038) as well as from the rheumatoidarthritis controls (P ¼ 0.013, OR ¼ 1.34, 95% c.i. ¼ 1.07–1.69).In contrast to multiple sclerosis, the rheumatoid arthritis controlmaterial was population-based. We observed no significant associationfor SNP2 (rs4774) or SNP3 (rs2229320plus27bp) in single-marker comparisons (Supplementary Table 1 online). The associa-tion was explained by SNP1 alone and was not significantlyimproved by haplotype analysis. Therefore, the presence of G atposition –168 of the 5¢ flanking region of type III MHC2TA isassociated with disease.
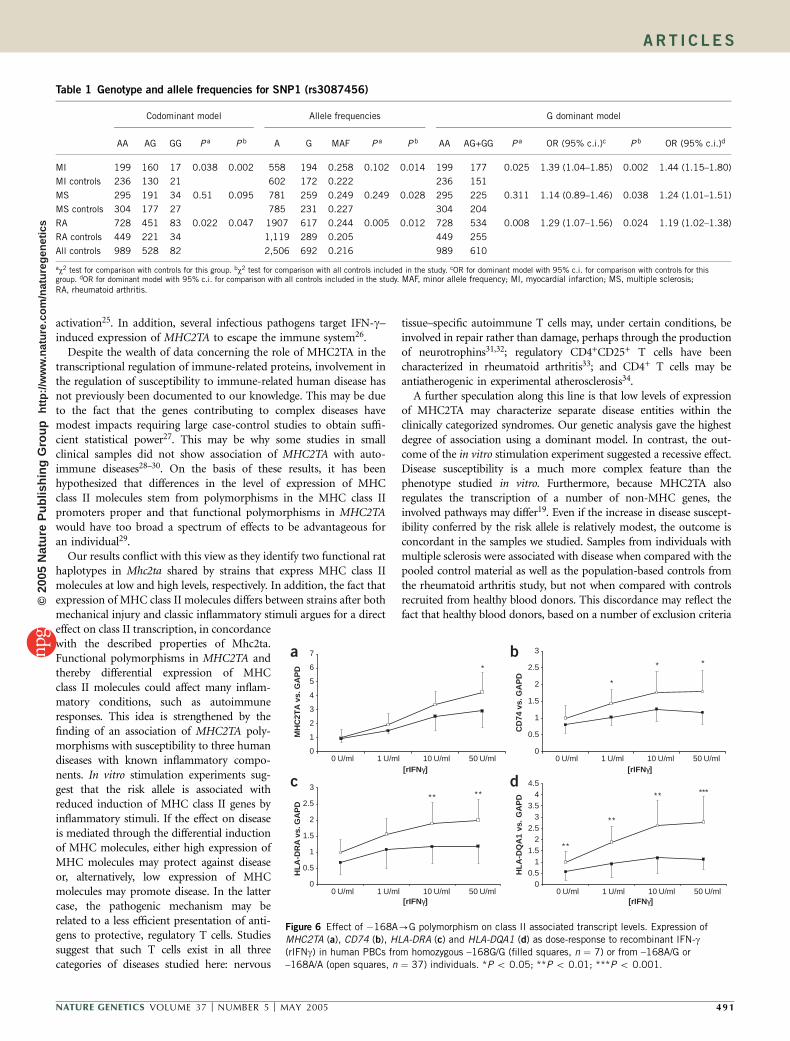
Expression of class II genes correlates with MHC2TA genotypeWe next investigated whether the MHC2TA genotype was alsofunctionally related to differential expression of MHC2TA and MHCclass II molecules. We established an ex vivo stimulation protocol inwhich we used the key MHC molecule–inducing cytokine, IFN-g, tostimulate peripheral blood cells (PBCs) and then determined whetherMHC2TA haplotype variants were associated with differences in theexpression of MHC2TA, HLA-DRA, HLA-DQA1 and CD74 (the MHCclass II–associated invariant chain). We also analyzed expression oftumor necrosis factor (TNF) as a control for stimulation. The initialprotocol was titrated using PBCs from healthy individuals (data notshown). We established PBC cultures from individuals with rheuma-toid arthritis with different SNP1 genotypes and stimulated them withincreasing concentrations of IFN-g. Expression of TNF mRNA did notdiffer significantly between the groups (data not shown). In contrast,expression of MHC2TA mRNA was lower in cells from individualswith genotype GG than in cells from individuals with other genotypesat all concentrations of IFN-g, although these differences becamesignificant only at IFN-g concentrations of 50 U ml�1 (Fig. 6a). Weobserved a similar, but more pronounced, segregation for all the MHCclass II transcripts that we studied (Fig. 6b–d). Furthermore, there was
+++ ++++ +++ + (+) + +++ ++++ +++ + (+) +
0.00 Bfar 671180.03 Pla2g10 265650.16 2900011O08Rik 672540.45 Abcc1 172500.64 0610037P05Rik 660860.68 Q8C3J0 –0.78 Nde1 672030.83 BC031575 2239891.12 Gt4-1 1074591.21 Ercc4 50505
1.44 Abcc1 172501.50 Rrn3 1062981.53 Ntan1 182031.55 AA415817 941841.66 Mpv17l 937341.78 Pphln1 2238281.79 Parn 741081.86 Parn 741082.14 Ercc4 505052.40 Rps19 20085
3.66 C530044N13Rik 2239783.77 4933437K13Rik 744784.19 Tnfrsf17 219354.25 Gspt1 148534.31 2410005K20Rik 664094.37 Zc3hdc7 1062054.40 2810408E11Rik 1062004.49 Snn 206214.49 Q8BXK1 –4.59 Litaf 56722
4.81 Prm1 191184.81 Prm2 191194.81 Prm3 191204.82 Tnp2 219594.82 Socs1 127034.87 4932416N17Rik 743745.07 Dexi 58239
5.09 Mhc2ta 12265
5.21 Nubp1 264255.34 Emp2 137315.37 Q8BPC5 –5.41 4930517K11Rik 681725.59 Grin2a 14811
Noncoding
Emp2 167 T T T C C TSynonomous(AGT/AGC)
AA G G AEmp2 –70 A
T T C Noncoding–730
insertion
5.76 D10Got12 ND Emp2
– TA TA –Emp2 –825 – –5.34 D10Mit14
T T T–9905.13 D10Got7 Nubp1
CCC
CCC
CCC
T T CNubp1 –2125.09 D10Mgh25
A A G–201
Synonomous(CTG/CTT)
4.65 D10Mco46 Nubp1
T T TMhc2ta I 2144.20 D10Got4
C C CSynonomous(GGT/GGC)
2323.22 D10Got6 ND Mhc2ta I
C C CMhc2ta III –6822.82 AU048240
A A A–9492.68 AU048079 Mhc2ta III
A A AMhc2ta IV –962.62 AU027673
C C CPromoter
region
Promoterregion
Promoterregion
Promoterregion
–779
Synonomous(GTG/GTA)
2.37 AU048210 Mhc2ta IV
GGG
GGG
GGG
GGG
GGG
A A GMhc2ta 27822.22 AU047254
A A T3′ flanking
region
ND NDNot
polymorphic
1.79 AU028942 Socs1 443
CCC UTR
0.7 D10Rat225 Litaf ND ND
Comment
0.075 AU046868 SnnExon 2 UTR
101 TTT
TTT
TTT
TTT
TTT
BN PVG E3 ACIGene Position DA LEWACIPosition
(Mb)Mouse gene ID
MouseLocusLink ID
MHC class II expression MHC class II expression
Position(Mb)
SSLP DA BN LEW E3 PVG
Rec
om
bia
tio
n in
terv
al
Sh
ared
hap
loty
pe
reg
ion
Promoterregion
Promoterregion
Promoterregion
Promoterregion
Figure 3 Haplotype map over Vra4 in rat strains examined for expression of MHC class II molecules. Colors indicate the microsatellite size (left) and SNP allele
(right). The shared microsatellite haplotype region is defined by markers AU048079 through D10Mit14; the recombination interval, by markers D10Mco46
through D10Mit14. Genes from rat database (release 27.3e.1) with support from mouse database (release 27.33c.1) are included. ND, not determined.
NATURE GENETICS VOLUME 37 [ NUMBER 5 [ MAY 2005 48 9
A R T I C L E S©
2005
Nat
ure
Pub
lishi
ng G
roup
ht
tp://
ww
w.n
atur
e.co
m/n
atur
egen
etic
s
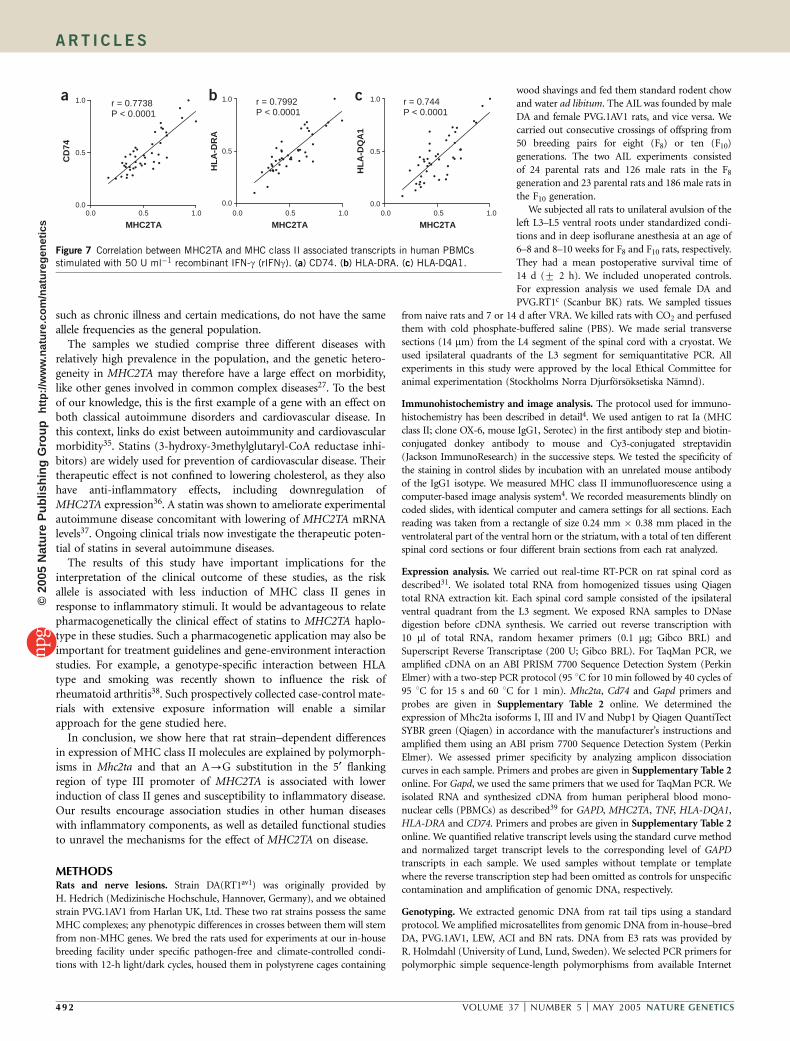
a highly significant correlation between levels of MHC2TA mRNA andthe other class II genes in individual samples (Fig. 7). These resultsstrongly support the ideas that functional gene polymorphisms inMHC2TA are associated with the studied —168A-G substitutionand that these have a most significant effect on the transcriptionalregulation of MHC class II genes, leading to reduced expression ofMHC molecules.
DISCUSSIONCombining findings from rat in vivo gene mapping in an AIL,haplotype analysis, gene sequencing and expression analysis withassociation and functional human case-control studies, we showhere that rat strain–dependent differences in expression of MHCclass II molecules on microglia are explained by polymorphisms inMhc2ta and that a polymorphism in the human type III MHC2TApromoter is associated with low expression of MHC molecules andwith susceptibility to three different human diseases with inflamma-tory components. This is a good example of how mapping of genesthat regulate complex phenotypes in experimental rats is relevant forhuman disease. Of many candidates, we identified MHC2TA asrelevant for differential expression of MHC molecules and humancomplex disease. Unlike ordinary association studies in which multiplegenes are studied on the basis of preformulated hypotheses or linkage,here we identified Mhc2ta and MHC2TA using an unbiased approachand characterized a unique functional phenotype. This fact isimportant when interpreting the degree of statistical significance ofassociation to disease. Although the evidence for an association todifferential expression of MHC molecules is solid, the association todisease is of moderate significance and requires replication in largersamples. Larger sample sizes will also allow us to study influences ondisease subphenotypes.
In the rat, we cannot completely rule out the possibility offunctional polymorphisms outside the sequenced regions or in anyof the few other genes, which have no known connection to
inflammatory processes, still present in the intrarecombination inter-val. The fact that extensive differences between parental strains arepresent also after exposure to classical inflammatory stimuli suggeststhat the functional gene polymorphism has relevance for inflamma-tory responses in a broad sense.
MHC2TA was originally identified by cloning of a gene with a nullmutation in hereditary MHC class II deficiency (bare lymphocytesyndrome)15 and is a global regulator of the expression of proteinsinvolved in antigen presentation and processing, including MHC classII and CD74 chains, HLA-DM and MHC class I molecules16–19.MHC2TA does not bind DNA itself but rather acts as a platform orchaperone for the assembly of several transcription factors at MHCpromoters. It may also have an ancillary or modulatory role in theregulation of the expression of many other genes (e.g., several kinasesand phosphatases, transcription factors, cell cycle genes, chromatinremodelers and genes involved in cell signaling)19. The activity ofMHC2TA is regulated primarily at the transcriptional level5, which isunder the control of four different promoters in humans (pI–pIV) andthree promoters in rats (pI, pIII and pIV)20. Each promoter isactivated in a tissue-specific manner and leads to the generation ofdifferent isoforms. A strong chain of evidence links MHC2TA toprocesses of fundamental importance for the immune system. There-fore, its expression is rate-limiting for constitutive and IFN-g–inducedexpression of MHC class II molecules21.
Transgenic Mhc2ta-deficient mice are totally devoid of cells expres-sing MHC class II molecules except for a subset of thymic epithelialcells16 and are resistant to experimental autoimmune encephalomye-litis induced not only by active immunization with CNS myelinantigen but also by adoptive transfer of encephalitogenic class II-restricted CD4+ Th1 cells, indicating that CNS antigen presentationis Mhc2ta-dependent22,23. More subtle differences may also have im-munological effects, as the level of MHC class II molecules modulatesimmune response24 and ectopic expression of Mhc2ta in transgenicmice leads to preferential differentiation into Th2 cells upon TCR
r = 0.95 P < 0.0001
DA/DA PVG/PVG0.0
0.5
1.0
DA/DA PVG/PVG0.0
0.5
1.0
0.0 0.5 1.0
1.0
0.0
0.5
Mhc2ta
Cd
74
Mh
c2ta
vs.
Gap
d
Mh
c2ta
vs.
Gap
d
a b cFigure 4 RT-PCR analysis of Mhc2ta and Cd74
transcript levels in ipsilateral L3 segments from
F8 rats 14 d after VRA stratified for marker
D10Mgh25. (a,b) DA/DA rats had significantly
higher levels of both transcripts than did
PVG.1AV1/ PVG.1AV1 (PVG/PVG) rats.
(a) P o 0.01. (b) P o 0.001. (c) A high degree
of correlation between levels of Mhc2ta and
Cd74 was present in individual F8 rats.
PVGDA
0DA PVG DA PVG
5
10
OX
-6 im
mun
opos
itive
are
a (%
)
OX
-6 im
mun
opos
itive
are
a (%
)
0.0
2.5
5.0
ba dc
Figure 5 Expression of MHC class II molecules in the striatum after intracerebral injections of IFN-g or LPS. (a,b) Micrographs showing IFN-g–induced OX-6
immunostaining in the left striatum of DA (a) and PVG.1AV1 (PVG) (b) rats. Scale bar, 1 mm. (c) Scatter plot showing the OX-6–labeled surface area in
the striatum after IFN-g injection in DA and PVG.1AV1 (PVG) rats. (d) MHC class II levels after LPS injection showed a similar strain-specific pattern.
(c) P o 0.0001. (d) P o 0.001.
4 90 VOLUME 37 [ NUMBER 5 [ MAY 2005 NATURE GENETICS
A R T I C L E S©
2005
Nat
ure
Pub
lishi
ng G
roup
ht
tp://
ww
w.n
atur
e.co
m/n
atur
egen
etic
s
activation25. In addition, several infectious pathogens target IFN-g–induced expression of MHC2TA to escape the immune system26.
Despite the wealth of data concerning the role of MHC2TA in thetranscriptional regulation of immune-related proteins, involvement inthe regulation of susceptibility to immune-related human disease hasnot previously been documented to our knowledge. This may be dueto the fact that the genes contributing to complex diseases havemodest impacts requiring large case-control studies to obtain suffi-cient statistical power27. This may be why some studies in smallclinical samples did not show association of MHC2TA with auto-immune diseases28–30. On the basis of these results, it has beenhypothesized that differences in the level of expression of MHCclass II molecules stem from polymorphisms in the MHC class IIpromoters proper and that functional polymorphisms in MHC2TAwould have too broad a spectrum of effects to be advantageous foran individual29.
Our results conflict with this view as they identify two functional rathaplotypes in Mhc2ta shared by strains that express MHC class IImolecules at low and high levels, respectively. In addition, the fact thatexpression of MHC class II molecules differs between strains after bothmechanical injury and classic inflammatory stimuli argues for a directeffect on class II transcription, in concordancewith the described properties of Mhc2ta.Functional polymorphisms in MHC2TA andthereby differential expression of MHCclass II molecules could affect many inflam-matory conditions, such as autoimmuneresponses. This idea is strengthened by thefinding of an association of MHC2TA poly-morphisms with susceptibility to three humandiseases with known inflammatory compo-nents. In vitro stimulation experiments sug-gest that the risk allele is associated withreduced induction of MHC class II genes byinflammatory stimuli. If the effect on diseaseis mediated through the differential inductionof MHC molecules, either high expression ofMHC molecules may protect against diseaseor, alternatively, low expression of MHCmolecules may promote disease. In the lattercase, the pathogenic mechanism may berelated to a less efficient presentation of anti-gens to protective, regulatory T cells. Studiessuggest that such T cells exist in all threecategories of diseases studied here: nervous
tissue–specific autoimmune T cells may, under certain conditions, beinvolved in repair rather than damage, perhaps through the productionof neurotrophins31,32; regulatory CD4+CD25+ T cells have beencharacterized in rheumatoid arthritis33; and CD4+ T cells may beantiatherogenic in experimental atherosclerosis34.
A further speculation along this line is that low levels of expressionof MHC2TA may characterize separate disease entities within theclinically categorized syndromes. Our genetic analysis gave the highestdegree of association using a dominant model. In contrast, the out-come of the in vitro stimulation experiment suggested a recessive effect.Disease susceptibility is a much more complex feature than thephenotype studied in vitro. Furthermore, because MHC2TA alsoregulates the transcription of a number of non-MHC genes, theinvolved pathways may differ19. Even if the increase in disease suscept-ibility conferred by the risk allele is relatively modest, the outcome isconcordant in the samples we studied. Samples from individuals withmultiple sclerosis were associated with disease when compared with thepooled control material as well as the population-based controls fromthe rheumatoid arthritis study, but not when compared with controlsrecruited from healthy blood donors. This discordance may reflect thefact that healthy blood donors, based on a number of exclusion criteria
Table 1 Genotype and allele frequencies for SNP1 (rs3087456)
Codominant model Allele frequencies G dominant model
AA AG GG P a P b A G MAF P a P b AA AG+GG P a OR (95% c.i.)c P b OR (95% c.i.)d
MI 199 160 17 0.038 0.002 558 194 0.258 0.102 0.014 199 177 0.025 1.39 (1.04–1.85) 0.002 1.44 (1.15–1.80)
MI controls 236 130 21 602 172 0.222 236 151
MS 295 191 34 0.51 0.095 781 259 0.249 0.249 0.028 295 225 0.311 1.14 (0.89–1.46) 0.038 1.24 (1.01–1.51)
MS controls 304 177 27 785 231 0.227 304 204
RA 728 451 83 0.022 0.047 1907 617 0.244 0.005 0.012 728 534 0.008 1.29 (1.07–1.56) 0.024 1.19 (1.02–1.38)
RA controls 449 221 34 1,119 289 0.205 449 255
All controls 989 528 82 2,506 692 0.216 989 610
aw2 test for comparison with controls for this group. bw2 test for comparison with all controls included in the study. cOR for dominant model with 95% c.i. for comparison with controls for thisgroup. dOR for dominant model with 95% c.i. for comparison with all controls included in the study. MAF, minor allele frequency; MI, myocardial infarction; MS, multiple sclerosis;RA, rheumatoid arthritis.
00.5
11.5
22.5
33.5
44.5
HL
A-D
QA
1 vs
. G
AP
DC
D74
vs.
GA
PD
0
1
2
3
4
5
6
7
MH
C2T
A v
s. G
AP
D
0
0.5
1
1.5
2
2.5
3
0
0.5
1
1.5
2
2.5
3
0 U/ml 1 U/ml 10 U/ml 50 U/ml
0 U/ml 1 U/ml 10 U/ml 50 U/ml
0 U/ml 1 U/ml 10 U/ml 50 U/ml
0 U/ml 1 U/ml 10 U/ml 50 U/ml
[rIFNγ] [rIFNγ]
[rIFNγ] [rIFNγ]
HL
A-D
RA
vs.
GA
PD
**
*
* * **** *
*
* *
* *
* *
a b
c d
Figure 6 Effect of �168A-G polymorphism on class II associated transcript levels. Expression of
MHC2TA (a), CD74 (b), HLA-DRA (c) and HLA-DQA1 (d) as dose-response to recombinant IFN-g(rIFNg) in human PBCs from homozygous –168G/G (filled squares, n ¼ 7) or from –168A/G or
–168A/A (open squares, n ¼ 37) individuals. *P o 0.05; **P o 0.01; ***P o 0.001.
NATURE GENETICS VOLUME 37 [ NUMBER 5 [ MAY 2005 49 1
A R T I C L E S©
2005
Nat
ure
Pub
lishi
ng G
roup
ht
tp://
ww
w.n
atur
e.co
m/n
atur
egen
etic
s
such as chronic illness and certain medications, do not have the sameallele frequencies as the general population.
The samples we studied comprise three different diseases withrelatively high prevalence in the population, and the genetic hetero-geneity in MHC2TA may therefore have a large effect on morbidity,like other genes involved in common complex diseases27. To the bestof our knowledge, this is the first example of a gene with an effect onboth classical autoimmune disorders and cardiovascular disease. Inthis context, links do exist between autoimmunity and cardiovascularmorbidity35. Statins (3-hydroxy-3methylglutaryl-CoA reductase inhi-bitors) are widely used for prevention of cardiovascular disease. Theirtherapeutic effect is not confined to lowering cholesterol, as they alsohave anti-inflammatory effects, including downregulation ofMHC2TA expression36. A statin was shown to ameliorate experimentalautoimmune disease concomitant with lowering of MHC2TA mRNAlevels37. Ongoing clinical trials now investigate the therapeutic poten-tial of statins in several autoimmune diseases.
The results of this study have important implications for theinterpretation of the clinical outcome of these studies, as the riskallele is associated with less induction of MHC class II genes inresponse to inflammatory stimuli. It would be advantageous to relatepharmacogenetically the clinical effect of statins to MHC2TA haplo-type in these studies. Such a pharmacogenetic application may also beimportant for treatment guidelines and gene-environment interactionstudies. For example, a genotype-specific interaction between HLAtype and smoking was recently shown to influence the risk ofrheumatoid arthritis38. Such prospectively collected case-control mate-rials with extensive exposure information will enable a similarapproach for the gene studied here.
In conclusion, we show here that rat strain–dependent differencesin expression of MHC class II molecules are explained by polymorph-isms in Mhc2ta and that an A-G substitution in the 5¢ flankingregion of type III promoter of MHC2TA is associated with lowerinduction of class II genes and susceptibility to inflammatory disease.Our results encourage association studies in other human diseaseswith inflammatory components, as well as detailed functional studiesto unravel the mechanisms for the effect of MHC2TA on disease.
METHODSRats and nerve lesions. Strain DA(RT1av1) was originally provided by
H. Hedrich (Medizinische Hochschule, Hannover, Germany), and we obtained
strain PVG.1AV1 from Harlan UK, Ltd. These two rat strains possess the same
MHC complexes; any phenotypic differences in crosses between them will stem
from non-MHC genes. We bred the rats used for experiments at our in-house
breeding facility under specific pathogen-free and climate-controlled condi-
tions with 12-h light/dark cycles, housed them in polystyrene cages containing
wood shavings and fed them standard rodent chow
and water ad libitum. The AIL was founded by male
DA and female PVG.1AV1 rats, and vice versa. We
carried out consecutive crossings of offspring from
50 breeding pairs for eight (F8) or ten (F10)
generations. The two AIL experiments consisted
of 24 parental rats and 126 male rats in the F8
generation and 23 parental rats and 186 male rats in
the F10 generation.
We subjected all rats to unilateral avulsion of the
left L3–L5 ventral roots under standardized condi-
tions and in deep isoflurane anesthesia at an age of
6–8 and 8–10 weeks for F8 and F10 rats, respectively.
They had a mean postoperative survival time of
14 d (7 2 h). We included unoperated controls.
For expression analysis we used female DA and
PVG.RT1c (Scanbur BK) rats. We sampled tissues
from naive rats and 7 or 14 d after VRA. We killed rats with CO2 and perfused
them with cold phosphate-buffered saline (PBS). We made serial transverse
sections (14 mm) from the L4 segment of the spinal cord with a cryostat. We
used ipsilateral quadrants of the L3 segment for semiquantitative PCR. All
experiments in this study were approved by the local Ethical Committee for
animal experimentation (Stockholms Norra Djurforsoksetiska Namnd).
Immunohistochemistry and image analysis. The protocol used for immuno-
histochemistry has been described in detail4. We used antigen to rat Ia (MHC
class II; clone OX-6, mouse IgG1, Serotec) in the first antibody step and biotin-
conjugated donkey antibody to mouse and Cy3-conjugated streptavidin
(Jackson ImmunoResearch) in the successive steps. We tested the specificity of
the staining in control slides by incubation with an unrelated mouse antibody
of the IgG1 isotype. We measured MHC class II immunofluorescence using a
computer-based image analysis system4. We recorded measurements blindly on
coded slides, with identical computer and camera settings for all sections. Each
reading was taken from a rectangle of size 0.24 mm � 0.38 mm placed in the
ventrolateral part of the ventral horn or the striatum, with a total of ten different
spinal cord sections or four different brain sections from each rat analyzed.
Expression analysis. We carried out real-time RT-PCR on rat spinal cord as
described31. We isolated total RNA from homogenized tissues using Qiagen
total RNA extraction kit. Each spinal cord sample consisted of the ipsilateral
ventral quadrant from the L3 segment. We exposed RNA samples to DNase
digestion before cDNA synthesis. We carried out reverse transcription with
10 ml of total RNA, random hexamer primers (0.1 mg; Gibco BRL) and
Superscript Reverse Transcriptase (200 U; Gibco BRL). For TaqMan PCR, we
amplified cDNA on an ABI PRISM 7700 Sequence Detection System (Perkin
Elmer) with a two-step PCR protocol (95 1C for 10 min followed by 40 cycles of
95 1C for 15 s and 60 1C for 1 min). Mhc2ta, Cd74 and Gapd primers and
probes are given in Supplementary Table 2 online. We determined the
expression of Mhc2ta isoforms I, III and IV and Nubp1 by Qiagen QuantiTect
SYBR green (Qiagen) in accordance with the manufacturer’s instructions and
amplified them using an ABI prism 7700 Sequence Detection System (Perkin
Elmer). We assessed primer specificity by analyzing amplicon dissociation
curves in each sample. Primers and probes are given in Supplementary Table 2
online. For Gapd, we used the same primers that we used for TaqMan PCR. We
isolated RNA and synthesized cDNA from human peripheral blood mono-
nuclear cells (PBMCs) as described39 for GAPD, MHC2TA, TNF, HLA-DQA1,
HLA-DRA and CD74. Primers and probes are given in Supplementary Table 2
online. We quantified relative transcript levels using the standard curve method
and normalized target transcript levels to the corresponding level of GAPD
transcripts in each sample. We used samples without template or template
where the reverse transcription step had been omitted as controls for unspecific
contamination and amplification of genomic DNA, respectively.
Genotyping. We extracted genomic DNA from rat tail tips using a standard
protocol. We amplified microsatellites from genomic DNA from in-house–bred
DA, PVG.1AV1, LEW, ACI and BN rats. DNA from E3 rats was provided by
R. Holmdahl (University of Lund, Lund, Sweden). We selected PCR primers for
polymorphic simple sequence-length polymorphisms from available Internet
a
0.0 0.5 1.00.0
0.5
1.0
0.0 0.5 1.00.0
0.5
1.0
0.0 0.5 1.00.0
0.5
1.0
MHC2TA
CD
74
MHC2TAH
LA
-DR
AMHC2TA
HL
A-D
QA
1
r = 0.744 P < 0.0001
r = 0.7992 P < 0.0001
r = 0.7738 P < 0.0001
b c
Figure 7 Correlation between MHC2TA and MHC class II associated transcripts in human PBMCs
stimulated with 50 U ml�1 recombinant IFN-g (rIFNg). (a) CD74. (b) HLA-DRA. (c) HLA-DQA1.
4 92 VOLUME 37 [ NUMBER 5 [ MAY 2005 NATURE GENETICS
A R T I C L E S©
2005
Nat
ure
Pub
lishi
ng G
roup
ht
tp://
ww
w.n
atur
e.co
m/n
atur
egen
etic
s
databases (Rat Genome Database, Center for Genomic Research, Whitehead
Institute/MIT and UniSTS at National Center for Biotechnology Information).
We purchased primers from PROLIGO. We labeled one primer in each pair
with [g-33P]ATP (PerkinElmer), amplified genomic DNA with a standard PCR
protocol and separated the amplified fragments on 6% polyacrylamide gels.
Genotypes were recorded manually from autoradiographic films independently
by two investigators. We included DNA from DA and PVG.1AV1 rats for every
marker. We mapped the simple sequence-length polymorphism marker order
using the MAPMAKER/EXP40 computer program.
We obtained data on physical position of rat microsatellite markers,
annotated or predicted genes and homologous genes in the mouse from the
Ensembl Genome Browser release 27.3e.1 and 27.33c.1, respectively. Homologs
of mouse Pphln1 and Rps19 were predicted for Vra4, although these are located
outside the homologous mouse region 16A3-B1.
Sequencing. We amplified sequencing templates on a PTC-225 (MJ research)
thermal cycler using a standard three-step PCR protocol with primers pur-
chased from PROLIGO. We carried out the sequencing reaction using the
BigDye terminator (Applied Biosystems) and separated and recorded the
products on an ABI 3100 (Applied Biosystems). We analyzed DNA sequences
using Vector NTI software (InforMax). We sequenced the complete coding
sequence and 1 kb upstream of Mhc2ta in each of the three isoforms’ 5¢flanking regions. We sequenced the other genes as follows: Nubp1 (1,000 bp of
5¢ flanking region and coding sequence), Soc1 (900 bp of 5¢ flanking region,
coding sequence and 150 bp of 3¢ flanking region), Emp2 (975 bp of 5¢ flanking
region, coding sequence and 220 bp of 3¢ flanking region), Litaf (coding
sequence except exon 1), SNN (400 bp of 5¢ flanking region and coding
sequence with 80 bp of the 5¢ untranslated region and 250 bp of the 3¢untranslated region).
In vivo stimulation experiments. We administered stereotactic intracerebral
injections in the striatum (coordinates: anterior-posterior, �0.3; medial-lateral,
+2.5; dorso-ventral, �4.3) to isoflurane-anesthetized 8- to 10-week-old male
DA and PVG.RT1c (Scanbur BK) rats using a Hamilton syringe (type 701 RN,
gauge 26s). The total injection volume was 2 ml over 2 min, containing a total of
50 U IFN-g, 5 mg LPS or vehicle alone (fluorophore-labeled dextran in PBS).
We removed brains and kept them at �70 1C until sectioning them at 14 mm.
We collected sections from the appropriate positions in the brain. We dissected
LPS-stimulated spleen from PBS-perfused rats 3 h after intraperitoneal admin-
istration of LPS (5 mg per kg body weight).
Linkage and statistical analysis. We carried out linkage analysis using MAP-
MAKER/QTL41. We subjected image analysis data for expression of MHC class
II molecules to log (base 10) transformation to obtain normally distributed
data. We carried out rat strain comparisons by Students’ t-test (IFN-g and LPS
injections). We applied nonparametric statistics (Mann-Whitney) for analysis
of mRNA expression using GraphPad Prism 3.0 (GraphPad Software Inc.). We
analyzed correlation between expression of Mhc2ta or MHC2TA and Cd74 or
CD74 in rats and human PBCs by Spearman rank test. We compared genotypes
and allele frequencies using the w2 test or Fisher exact test and considered
differences to be significant at P o 0.05 (StatView, version 5.0, SAS Institute
Inc.). P values in Table 1 and Supplementary Table 1 online were not adjusted
for multiple comparisons. We estimated haplotype frequencies by the EM
algorithm using the Arlequin software 2.000 (ref. 42) or by Bayesian methods
with PHASE 2.1 (ref. 43).
Clinical material. The multiple sclerosis cohort consisted of 548 subjects (413
females and 135 males; mean age 43.9 y, median age 44.0 y, range 13–80 y)
originating from Sweden or other Nordic countries fulfilling the McDonald
criteria of definite multiple sclerosis44 recruited by neurologists at the Kar-
olinska University Hospital Huddinge and Solna sites (tertiary referral centers
in Stockholm). The corresponding control group consisted of 528 blood
donors (217 females and 311 males; mean age 42.7 y, median age 43.0 y, range
18–70 y) residing in the Stockholm area and originating from Sweden or other
Nordic countries. Sixty-one percent of the individuals with multiple sclerosis
and 29% of the controls carried HLA-DRB1*1501.
The rheumatoid arthritis cohort consisted of 1,288 subjects (919 females and
369 males; mean age 51.6 y, median age 54.0 y, range 18–70 y; 805 rheumatoid
factor–positive, 416 rheumatoid factor–negative, data missing for 67). Newly
diagnosed individuals with rheumatoid arthritis were identified in several
rheumatology units in Sweden and included in the study if their symptoms
fulfilled the ACR criteria of 1987 (ref. 45). The individuals in the corresponding
control group (n ¼ 709; 522 females, 187 males; mean age 53.4 y, median age
56.0 y, range 18–70 y) were matched by age, sex and residential area. The
recruitment of affected individuals and controls was described previously in
connection with EIRA study46. Ninety-seven percent of the study population was
of self-reported Caucasian origin. Seventy-three percent of the individuals with
rheumatoid arthritis and 53% of the controls carried HLA-DRB1*01, *04 or *10.
The myocardial infarction cohort consisted of 387 subjects (68 females and
319 males; mean age 52.5 y, median age 54.0 y, range 49–57 y) recruited from
all patients less than 60 y of age who were admitted for acute myocardial
infarction to the coronary care units of the three hospitals in the northern part
of Stockholm (Danderyd Hospital, Karolinska Hospital and Norrtalje Hospital)
during January 1996–December 2000. Recruitment, exclusion criteria and basic
characteristics of participants have been described47. Ninety-nine percent of the
myocardial infarction study group was of self-reported Caucasian origin. The
participation rate of eligible patients was 76%. The corresponding control
group (69 females and 318 males; mean age 53.0 y, median age 54.0 y, range
49–57 y) comprised sex- and age-matched healthy persons recruited from the
general population of the same county.
In the final association analysis, we compared genotype frequencies between
the specific disease group and the respective control. The allele and genotype
frequencies did not differ statistically between the different control groups. We
could therefore also compare each disease with all controls combined to
increase statistical power. The human studies were done in agreement with
the Declaration of Helsinki, and the protocols were approved by the local ethics
committees. Informed consent was obtained from all individuals.
SNP genotyping. On the basis of available information in public databases
(National Center for Biotechnology Information), we initially selected seven
SNPs in MHC2TA. Three of these had to be excluded (two were monomorphic
and one assay did not perform robustly (success rate o85%) in our optimiza-
tions). We initially typed the remaining four SNPs (rs3087456, rs4774,
rs2229320plus27bp and rs2228238) in 186 individuals with multiple sclerosis
and 186 of the corresponding controls. SNP rs2228238 was redundant for
haplotype analysis and was therefore not analyzed further. We typed the
remaining three SNPs in all three populations and their respective control
groups: SNP1: rs3087456 (–168A-G from translation start or –155 from
transcription initiation), CCTCCC(C/T)ACACCTCT; SNP2: rs2229320plus
27bp (nt 2,536 from coding sequence, exon 11), CAGCTGCT(G/T)GAGCT
GCT; and SNP3: rs4774 (nt 1,614 from coding sequence, exon 11), CCTA
GACG(G/C)CTTCGAGG. We used a 5¢ nuclease assay to genotype SNP1 in
individuals with myocardial infarction and rheumatoid arthritis. We genotyped
SNP2 by DASH48 in individuals with myocardial infarction. We used MALDI-
TOF49 to type all three SNPs in individuals with multiple sclerosis and controls
as well as to type SNP2 and SNP3 in individuals with rheumatoid arthritis and
SNP3 in individuals with myocardial infarction. All analyzed markers were in
Hardy-Weinberg equilibrium.
In vitro stimulation of PBCs. We obtained peripheral blood samples from
individuals with rheumatoid arthritis who were homozygous (n ¼ 7 for GG,
n ¼ 25 for AA) or heterozygous (n ¼ 12) with respect to SNP1. There were no
differences in type of therapy between selected groups of donors. We sampled
peripheral blood in cell preparation tubes containing sodium citrate (Vacutai-
ner CPT, Becton Dickinson). We separated PBCs by density-gradient centrifu-
gation. We collected interphase cells and washed twice them with Dulbecco’s
PBS. We assessed the proportion of viable cells with trypan blue. More than
95% of the cells excluded trypan blue in each preparation. We evaluated the
stimulation protocol in initial experiments using PBCs from three healthy
subjects. Immediately after preparation, we added 1, 10 or 50 U of recombinant
human IFN-g (Preprotech) or medium alone to cultures of 5 � 105 cells each.
After 6 h of culturing, we pelleted the cells and lysed them for RNA extraction.
URLs. The Rat Genome Database is available at http://rgd.mcw.edu/. The
Center for Genomic Research at the Whitehead Institute/MIT is available at
http://www.broad.mit.edu/rat/public/. UniSTS, LocusLink and the National
NATURE GENETICS VOLUME 37 [ NUMBER 5 [ MAY 2005 49 3
A R T I C L E S©
2005
Nat
ure
Pub
lishi
ng G
roup
ht
tp://
ww
w.n
atur
e.co
m/n
atur
egen
etic
s
Center for Biotechnology Information are available at http://www.ncbi.nlm.
nih.gov/. The Ensembl Genome Browser is available at http://www.ensembl.
org/. The HUGO Gene Nomenclature Committee is available at http://
www.gene.ucl.ac.uk/nomenclature/.
Note: Supplementary information is available on the Nature Genetics website.
ACKNOWLEDGMENTSL.P., P.E. and E.A. contributed equally to the human genetic part of the study. Wethank K. Becanovic, J. Lorentzen, L. Backdahl and E. Wallstrom for expert advicein genetics and practical help with breeding of the AIL; K. Duvefelt forcollaboration on microarray analysis; and the EIRA group, E. Jemseby, the MIgroup and B. Burt for their contributions. This study was supported by grantsfrom the Wadsworth Foundation, Torsten and Ragnar Soderbergs Foundation,The Swedish Heart-Lung Foundation, the Petrus and Augusta HedlundsFoundation, Bjorklunds Foundation, Nils and Bibbi Jenssens Foundation, theSwedish Foundation for Neurologically Disabled, Montel Williams Foundation,Svenska Lakaresallskapet, Max and Edit Follins Foundation, the King Gustaf Vand Queen Victoria foundation, AFA insurance and the Swedish ResearchCouncil, af Ugglas Foundation, Novartis Foundation, Royal Physiographic Societyand The Swedish Medical Research Council.
COMPETING INTERESTS STATEMENTThe authors declare that they have no competing financial interests.
Received 8 October 2004; accepted 25 February 2005
Published online at http://www.nature.com/naturegenetics/
1. Flugel, A. et al. Migratory activity and functional changes of green fluorescent effectorcells before and during experimental autoimmune encephalomyelitis. Immunity 14,547–560 (2001).
2. Sedgwick, J.D., Schwender, S., Gregersen, R., Dorries, R. & ter Meulen, V. Residentmacrophages (ramified microglia) of the adult brown Norway rat central nervous systemare constitutively major histocompatibility complex class II positive. J. Exp. Med 177,1145–1152 (1993).
3. Piehl, F. et al. Non-MHC gene regulation of nerve root injury-induced spinal cordinflammation and neuron death. J. Neuroimmunol. 101, 87–97 (1999).
4. Lundberg, C., Lidman, O., Holmdahl, R., Olsson, T. & Piehl, F. Neurodegeneration andglial activation patterns after mechanical nerve injury are differentially regulated bynon-MHC genes in congenic inbred rat strains. J. Comp. Neurol. 431, 75–87 (2001).
5. Ting, J.P. & Trowsdale, J. Genetic control of MHC class II expression. Cell 109, 21–33(2002).
6. Boss, J.M. & Jensen, P.E. Transcriptional regulation of the MHC class II antigenpresentation pathway. Curr. Opin. Immunol. 15, 105–111 (2003).
7. Dahlman, I. et al. Genome-wide linkage analysis of chronic relapsing experimentalautoimmune encephalomyelitis in the rat identifies a major susceptibility locus onchromosome 9. J. Immunol. 162, 2581–2588 (1999).
8. Lidman, O. et al. Discrete gene loci regulate neurodegeneration, lymphocyte infiltra-tion, and major histocompatibility complex class II expression in the CNS. J. Neurosci.23, 9817–9823 (2003).
9. Maehlen, J., Schroder, H., Klareskog, L., Olsson, T. & Kristensson, K. Axotomy inducesMHC class I antigen expression on rat nerve cells. Neurosci. Lett. 92, 8–13 (1988).
10. Streit, W.J., Graeber, M.B. & Kreutzberg, G.W. Peripheral nerve lesion producesincreased levels of major histocompatibility complex antigens in the central nervoussystem. J. Neuroimmunol. 21, 117–123 (1989).
11. Darvasi, A. & Soller, M. Advanced intercross lines, an experimental population for finegenetic mapping. Genetics 141, 1199–1207 (1995).
12. Jagodic, M. et al. An advanced intercross line resolves Eae18 into two narrowquantitative trait loci syntenic to multiple sclerosis candidate loci. J. Immunol. 173,1366–1373 (2004).
13. Libby, P. Inflammation in atherosclerosis. Nature 420, 868–874 (2002).14. Patarroyo, J.C. et al. Single nucleotide polymorphisms in MHC2TA, the gene encoding
the MHC class II transactivator (CIITA). Genes Immun. 3, 34–37 (2002).15. Steimle, V., Otten, L.A., Zufferey, M. & Mach, B. Complementation cloning of an MHC
class II transactivator mutated in hereditary MHC class II deficiency (or barelymphocyte syndrome). Cell 75, 135–146 (1993).
16. Chang, C.H., Guerder, S., Hong, S.C., van Ewijk, W. & Flavell, R.A. Mice lacking theMHC class II transactivator (CIITA) show tissue-specific impairment of MHC class IIexpression. Immunity 4, 167–178 (1996).
17. Chang, C.H. & Flavell, R.A. Class II transactivator regulates the expression of multiplegenes involved in antigen presentation. J. Exp. Med. 181, 765–767 (1995).
18. Kern, I., Steimle, V., Siegrist, C.A. & Mach, B. The two novel MHC class IItransactivators RFX5 and CIITA both control expression of HLA-DM genes. Int.Immunol. 7, 1295–1299 (1995).
19. Nagarajan, U.M., Bushey, A. & Boss, J.M. Modulation of gene expression by the MHCclass II transactivator. J. Immunol. 169, 5078–5088 (2002).
20. Muhlethaler-Mottet, A., Otten, L.A., Steimle, V. & Mach, B. Expression of MHC class IImolecules in different cellular and functional compartments is controlled by differ-
ential usage of multiple promoters of the transactivator CIITA. EMBO J. 16, 2851–2860 (1997).
21. Otten, L.A., Steimle, V., Bontron, S. & Mach, B. Quantitative control of MHC class IIexpression by the transactivator CIITA. Eur. J. Immunol. 28, 473–478 (1998).
22. Stuve, O. et al. The role of the MHC class II transactivator in class II expression andantigen presentation by astrocytes and in susceptibility to central nervous systemautoimmune disease. J. Immunol. 169, 6720–6732 (2002).
23. Tompkins, S.M. et al. De novo central nervous system processing of myelin antigen isrequired for the initiation of experimental autoimmune encephalomyelitis. J. Immunol.168, 4173–4183 (2002).
24. Baumgart, M., Moos, V., Schuhbauer, D. & Muller, B. Differential expression of majorhistocompatibility complex class II genes on murine macrophages associated withT cell cytokine profile and protective/suppressive effects. Proc. Natl. Acad. Sci. USA95, 6936–6940 (1998).
25. Otten, L.A. et al. Deregulated MHC class II transactivator expression leads to a strongTh2 bias in CD4+ T lymphocytes. J. Immunol. 170, 1150–1157 (2003).
26. Hegde, N.R., Chevalier, M.S. & Johnson, D.C. Viral inhibition of MHC class II antigenpresentation. Trends Immunol. 24, 278–285 (2003).
27. Ueda, H. et al. Association of the T-cell regulatory gene CTLA4 with susceptibility toautoimmune disease. Nature 423, 506–511 (2003).
28. Sartoris, S. et al. Analysis of CIITA encoding AIR-1 gene promoters in insulin-dependent diabetes mellitus and rheumatoid arthritis patients from the northeast ofItaly: absence of sequence variability. Hum. Immunol. 61, 599–604 (2000).
29. Janitz, M., Reiners-Schramm, L., Muhlethaler-Mottet, A., Rosowski, M. & Lauster, R.Analysis of the sequence polymorphism within class II transactivator gene promoters.Exp. Clin. Immunogenet. 18, 199–205 (2001).
30. Rasmussen, H.B., Kelly, M.A. & Clausen, J. Genetic susceptibility to multiplesclerosis: detection of polymorphic nucleotides and an intron in the 3¢ untranslatedregion of the major histocompatibility complex class II transactivator gene. Hum.Immunol. 62, 371–377 (2001).
31. Hammarberg, H. et al. Neuroprotection by encephalomyelitis: rescue of mechanicallyinjured neurons and neurotrophin production by CNS-infiltrating T and natural killercells. J. Neurosci. 20, 5283–5291 (2000).
32. Olsson, T., Lidman, O. & Piehl, F. Harm or heal - divergent effects of autoimmuneneuroinflammation? Trends Immunol. 24, 5–6 (2003).
33. Cao, D. et al. Isolation and functional characterization of regulatory CD25brightCD4+ Tcells from the target organ of patients with rheumatoid arthritis. Eur. J. Immunol. 33,215–223 (2003).
34. Mallat, Z. et al. Induction of a regulatory T cell type 1 response reduces thedevelopment of atherosclerosis in apolipoprotein E-knockout mice. Circulation 108,1232–1237 (2003).
35. Turesson, C., Jarenros, A. & Jacobsson, L. Increased incidence of cardiovasculardisease in patients with rheumatoid arthritis: results from a community based study.Ann. Rheum. Dis. 63, 952–955 (2004).
36. Kwak, B., Mulhaupt, F., Myit, S. & Mach, F. Statins as a newly recognized type ofimmunomodulator. Nat. Med. 6, 1399–1402 (2000).
37. Youssef, S. et al. The HMG-CoA reductase inhibitor, atorvastatin, promotes a Th2 biasand reverses paralysis in central nervous system autoimmune disease. Nature 420,78–84 (2002).
38. Padyukov, L.C.S., Stolt, P., Alfredsson, L. & Klareskog, L. The EIRA study group. Agene-environment interaction between smoking and shared epitope genes in HLA-DRB1 provides a high risk of seropositive rheumatoid arthritis. Arthritis Rheum. 50,3085–3092 (2004).
39. Khademi, M. et al. T Cell Ig- and mucin-domain-containing molecule-3 (TIM-3) andTIM-1 molecules are differentially expressed on human Th1 and Th2 cells and incerebrospinal fluid-derived mononuclear cells in multiple sclerosis. J. Immunol. 172,7169–7176 (2004).
40. Lander, E.S. et al. MAPMAKER: an interactive computer package for constructingprimary genetic linkage maps of experimental and natural populations. Genomics 1,174–181 (1987).
41. Lander, E.S. & Botstein, D. Mapping mendelian factors underlying quantitative traitsusing RFLP linkage maps. Genetics 121, 185–199 (1989).
42. Schneider, S., Roessli, D. & Excoffier, L. Arlequin ver. 2000: A Software for PopulationGenetics Data Analysis (Genetics and Biometrics Laboratory, University of Geneva,Switzerland, 2000).
43. Stephens, M. & Donnelly, P. A comparison of bayesian methods for haplotype recon-struction from population genotype data. Am. J. Hum. Genet. 73, 1162–1169 (2003).
44. McDonald, W.I. et al. Recommended diagnostic criteria for multiple sclerosis: guide-lines from the International Panel on the diagnosis of multiple sclerosis. Ann. Neurol.50, 121–127 (2001).
45. Arnett, F.C. et al. The American Rheumatism Association 1987 revised criteria for theclassification of rheumatoid arthritis. Arthritis Rheum. 31, 315–324 (1988).
46. Stolt, P. et al. Quantification of the influence of cigarette smoking on rheumatoidarthritis: results from a population based case-control study, using incident cases. Ann.Rheum. Dis. 62, 835–841 (2003).
47. Eriksson, P. et al. Human evidence that the cystatin C gene is implicated in focalprogression of coronary artery disease. Arterioscler. Thromb. Vasc. Biol. 24, 551–557(2004).
48. Jobs, M., Howell, W.M., Stromqvist, L., Mayr, T. & Brookes, A.J. DASH-2 flexible, low-cost, and high-throughput SNP genotyping by dynamic allele-specific hybridization onmembrane arrays. Genome Res. 13, 916–924 (2003).
49. Jurinke, C., van den Boom, D., Cantor, C.R. & Koster, H. Automated genotyping usingthe DNA MassArray technology. Methods Mol. Biol. 187, 179–192 (2002).
4 94 VOLUME 37 [ NUMBER 5 [ MAY 2005 NATURE GENETICS
A R T I C L E S©
2005
Nat
ure
Pub
lishi
ng G
roup
ht
tp://
ww
w.n
atur
e.co
m/n
atur
egen
etic
s


![Mini HI-FI Component System · Mini HI-FI Component System Manual de instrucciones MHC-GTR88 MHC-GTR77 MHC-GTR55 MHC-GTR33. model name [MHC-GTR88] [4-165-654-33(2)] ES 2ES filename[D:\NORM'S](https://img.pdfslide.us/doc/110x75/5fdb9723a8509a11bd58c844/mini-hi-fi-component-system-mini-hi-fi-component-system-manual-de-instrucciones.jpg)


![MHC-GTR66H/GTR88 · 2020. 3. 25. · model name [MHC-GTR88] [4-165-654-71 (1)] GB. 3. filename[D:\SONY 2010\MHC-GTR66H\MHC-GTR66H\PT-BR080ADD.fm] masterpage:Left. Especificações](https://img.pdfslide.us/doc/110x75/6082b9df98ee084912593c99/mhc-gtr66hgtr88-2020-3-25-model-name-mhc-gtr88-4-165-654-71-1-gb-3.jpg)