Embed Size (px)
Citation preview

M&G Investment Fund s (14)Annual Long Report and audited Financial Statementsfor the year ended 30 April 2018

Contents
M&G Investment Funds (14)
Authorised Corporate Director’s Report Page 1
Directors’ statement Page 3
Depositary’s Responsibilities and Report Page 4
Independent Auditor’s Report Page 5
Financial statements and notes Page 7
Authorised Corporate Director’s Reports, including the financial highlights and financial statements and notes for:
M&G Income Allocation Fund Page 11
M&G Prudent Allocation Fund Page 29
Other regulatory disclosures Page 45
Glossary Page 46

The Authorised Corporate Director (ACD) of M&G Investment Funds (14)presents its Annual Long Report and audited Financial Statements forthe year ended 30 April 2018.
The audited financial statements of M&G Investment Funds (14) andthe investment report and audited financial statements and notes ofeach sub-fund are presented in their individual sections of this reportas set out in the contents page.
Please note that we have included an explanation of key investmentterminology in the ‘Glossary’ (at the back of this report).
Company information
M&G Investment Funds (14) is an umbrella Open-Ended InvestmentCompany (OEIC) and contains two sub-funds, hereinafter referred toas ‘funds’ in the rest of this report. Each fund is a UCITS(Undertakings for Collective Investment in Transferable Securities)scheme as defined in the Collective Investment Schemes sourcebook,as issued (and amended) by the Financial Conduct Authority (FCA).This OEIC is an Investment Company with Variable Capital (ICVC)incorporated under the Open-Ended Investment CompaniesRegulations 2001. It is authorised and regulated by the FCA under theFinancial Services and Markets Act 2000.
The Company was authorised on 8 October 2013, the M&G IncomeAllocation Fund was launched on 7 November 2013 and the M&GPrudent Allocation Fund was launched on 23 April 2015.
The Company’s principal activity is to carry on business as an OEIC.The Company is structured as an umbrella company, and differentfunds may be established by the ACD from time to time with theagreement of the Depositary and approval from the FCA. The fundsare operated separately and the assets of each fund are managed inaccordance with the investment objective and policy applicable to that fund.
As at 30 April 2018, none of the funds held shares of the other fundswithin this OEIC.
A shareholder is not liable for the debts of the Company and will neverbe liable to make any further payment to the Company after paying thepurchase price of the shares.
Fund managers
The following fund managers are employed by M&G Limited which isan associate of M&G Securities Limited.
M&G Income Allocation FundSteven Andrew
M&G Prudent Allocation FundJuan Nevado & Craig Moran
ACDM&G Securities Limited, Laurence Pountney Hill, London EC4R 0HH, UKTelephone: 0800 390 390 (UK only)
(Authorised and regulated by the Financial Conduct Authority. M&GSecurities Limited is a member of the Investment Association andof the Tax Incentivised Savings Association.)
Directors of the ACDG N Cotton, N M Donnelly*, P R Jelfs, G W MacDowall, L J Mumford
* Appointed 9 June 2017.
W J Nott resigned with effect from 31 December 2017.
Investment manager M&G Investment Management Limited, Laurence Pountney Hill, London EC4R 0HH, UKTelephone: +44 (0)20 7626 4588
(Authorised and regulated by the Financial Conduct Authority)
RegistrarDST Financial Services Europe Ltd*, DST House, St. Nicholas Lane, Basildon, Essex SS15 5FS, UK
(Authorised and regulated by the Financial Conduct Authority)
* International Financial Data Services (UK) Ltd changed its name to DST Financial
Services Europe Ltd on 14 August 2017.
DepositaryNational Westminster Bank Plc, Trustee & Depositary Services,Drummond House, 1 Redheughs Avenue, Edinburgh EH12 9RH, UK
(Authorised by the Prudential Regulation Authority and regulated bythe Financial Conduct Authority and the Prudential RegulationAuthority)
Independent auditorErnst & Young LLPAtria One,144 Morrison Street, Edinburgh EH3 8EX, UK
Important information
On 9 February 2018, the merger of M&G Income Allocation Fund intoM&G (Lux) Income Allocation Fund and the merger of M&G PrudentAllocation Fund into M&G (Lux) Conservative Allocation Fund (sub-funds of M&G (Lux) Investment Funds 1, a Luxembourg authorisedUCITS) was approved by shareholders. The effective date of themerger was 16 March 2018. As a result the financial statements forthe year to 30 April 2018 have been prepared on a break-up basis.Termination will be completed once all of the assets and liabilities havebeen settled.
1
M&G Investment Funds (14)Authorised Corporate Director’s Report
ANNUAL LONG REPORT AND AUDITED FINANCIAL STATEMENTS • April 2018

Investor information
The Prospectus, Instrument of Incorporation, Key Investor InformationDocuments, the latest Annual or Interim Investment Report andFinancial Statements as well as a list of purchases and sales areavailable free of charge on request from the following addresses. TheInstrument of Incorporation can also be inspected at our offices or atthe office of the Depositary.
Customer services and administration for UK clients:M&G Securities Limited,PO Box 9039, Chelmsford CM99 2XG, UK
Please remember to quote your name and M&G client reference andsign any written communication to M&G. Failure to provide this willaffect your ability to transact with us.
Telephone: 0800 390 390 (UK only)
For security purposes and to improve the quality of our service, wemay record and monitor telephone calls. You will require your M&Gclient reference. Failure to provide this will affect your ability to transactwith us.
Customer services and administration for non-UK clients:M&G Securities Limited,c/o RBC I&TS, 14, Porte de France, L-4360 Esch-sur-Alzette, Grand Duchy of Luxembourg
Please remember to quote your name and M&G client reference andsign any written communication to M&G. Failure to provide this willaffect your ability to transact with us.
Telephone: +352 2605 9944Email: [email protected]
For security purposes and to improve the quality of our service, wemay record and monitor telephone calls. You will require your M&Gclient reference. Failure to provide this will affect your ability to transactwith us.
Austrian paying and information agent:Société Générale, Vienna Branch, Prinz Eugen-Strasse 8-10/5/Top 11, 1040 Wien, Austria
Belgian financial agent:Société Générale Private Banking NV, Kortrijksesteenweg 302, 9000 Gent, Belgium
Danish representative agent:Nordea Bank Danmark A/S, Client Relations DK, Investor Services & Solutions,Postbox 850, Reg.no.6428. HH. 6.1., 0900 København C, Denmark
French centralising agent:RBC Investor Services, Bank France S.A.,105 rue Réaumur, 75002 Paris, France
German information agent:M&G International Investments Limited,mainBuilding, Taunusanlage 19, 60325 Frankfurt am Main, Germany
Greek paying agent and distributor:Eurobank Ergasias S.A.,8, Othonos Street, 10557 Athens, Greece
Irish facilities agent:Société Générale S.A., Dublin Branch,3rd Floor IFSC House – The IFSC, Dublin 1, Ireland
Italian paying agents:Allfunds Bank, S.A., Via Santa Margherita 7, 20121 Milano, Italy
Banca Monte dei Paschi di Siena S.p.A., Piazza Salimbeni 3, 53100 Siena, Italy
Banca Sella Holding S.p.A.,Piazza Gaudenzio Sella 1, 13900 Biella, Italy
BNP PARIBAS Securities Services,Piazza Lina Bo Bardi 3, 20124 Milano, Italy
CACEIS Bank Luxembourg, Milan Branch, Piazza Cavour 2, 20121 Milano, Italy
RBC Investor Services Bank S.A., Milan BranchVia Vittor Pisani 26, 20124 Milano, Italy
State Street Bank S.p.A., Via Ferrante Aporti 10, 20125 Milano, Italy
Société Générale Securities Services S.A., Via Benigno Crespi 19A - MAC 2, 20159 Milano, Italy
Luxembourg paying and information agent:Société Générale Bank & Trust S.A., Centre operationnel, 28-32, place de la Gare, 1616 Luxembourg,Grand Duchy of Luxembourg
Portuguese distributor:Best - Banco Electrónico de Serviço Total, S.A., Praça Marquês de Pombal, no. 3 - 3º, 1250-161 Lisboa, Portugal
Spanish representative:Allfunds Bank, S.A., Calle Estafeta, No 6 Complejo Plaza de la Fuente, La Moraleja 28109, Alcobendas, Madrid, Spain
Swedish paying agent:Nordea Bank AB (publ), Smålandsgatan 17, 105 71 Stockholm, Sweden
Swiss paying agent and representative:Société Générale, Paris, Zurich Branch, Talacker 50, 8021 Zurich, Switzerland
2
M&G Investment Funds (14) Authorised Corporate Director’s Report
ANNUAL LONG REPORT AND AUDITED FINANCIAL STATEMENTS • April 2018

Authorised Corporate Director’sResponsibilities
The Authorised Corporate Director (ACD) is required to prepare annualand interim long reports for the Company. The ACD must ensure thatthe financial statements, contained in this report, for each of the fundsare prepared in accordance with the Investment Association Statementof Recommended Practice for Financial Statements of UK AuthorisedFunds (SORP) and UK Financial Reporting Standards, and give a trueand fair view of the net revenue or expenses and net capital gains orlosses for the accounting period, and the financial position at the endof that period.
The ACD is required to keep proper accounting records, and to managethe Company in accordance with the Collective Investment Schemessourcebook, as issued (and amended) by the FCA, the Instrument ofIncorporation and the Prospectus, and to take reasonable steps for theprevention and detection of fraud or other irregularities.
Directors’ statement
This report has been prepared in accordance with the requirementsof the Collective Investment Schemes sourcebook, as issued andamended by the Financial Conduct Authority.
G W MACDOWALL }DirectorsL J MUMFORD
14 June 2018
ANNUAL LONG REPORT AND AUDITED FINANCIAL STATEMENTS • April 2018 3
M&G Investment Funds (14) Authorised Corporate Director’s Report

Statement of the Depositary’sResponsibilities and Report of the Depositary to the Shareholders of M&G Investment Funds (14) (‘the Company’) for the periodended 30 April 2018The Depositary must ensure that the Company is managed inaccordance with the Financial Conduct Authority’s CollectiveInvestment Schemes sourcebook, the Open-Ended InvestmentCompanies Regulations 2001 (SI2001/1228) (the OEIC Regulations),as amended, the Financial Services and Markets Act 2000, asamended, (together ‘the Regulations’), the Company’s Instrument ofIncorporation and Prospectus (together ‘the Scheme documents’) asdetailed below.
The Depositary must in the context of its role act honestly, fairly,professionally, independently and in the interests of the Company andits investors.
The Depositary is responsible for the safekeeping of all custodialassets and maintaining a record of all other assets of the Companyin accordance with the Regulations.
The Depositary must ensure that:
• the Company’s cashflows are properly monitored and that cash ofthe Company is booked into the cash accounts in accordance withthe Regulations;
• the sale, issue, redemption and cancellation of shares are carriedout in accordance with the Regulations;
• the value of shares in the Company is calculated in accordancewith the Regulations;
• any consideration relating to transactions in the Company’s assetsis remitted to the Company within the usual time limits;
• the Company’s income is applied in accordance with theRegulations; and
• the instructions of the Authorised Fund Manager (‘the AFM’) arecarried out (unless they conflict with the Regulations).
The Depositary also has a duty to take reasonable care to ensure thatthe Company is managed in accordance with the Regulations and theScheme documents in relation to the investment and borrowingpowers applicable to the Company.
Having carried out such procedures as we consider necessary todischarge our responsibilities as Depositary of the Company, it is ouropinion, based on the information available to us and the explanationsprovided, that in all material respects the Company, acting throughthe AFM:
(i) has carried out the issue, sale, redemption and cancellation, andcalculation of the price of the Company’s shares and theapplication of the Company’s income in accordance with theRegulations and the Scheme documents of the Company, and
(ii) has observed the investment and borrowing powers andrestrictions applicable to the Company.
Edinburgh National Westminster Bank Plc14 June 2018 Trustee and Depositary Services
ANNUAL LONG REPORT AND AUDITED FINANCIAL STATEMENTS • April 20184
M&G Investment Funds (14) Depositary’s Responsibilities and Report

Independent Auditor’s Report to the shareholders of M&GInvestment Funds (14)Opinion
We have audited the financial statements of M&G Investment Funds (14)ICVC (“the Company”) for the year ended 30 April 2018 which comprisethe Statement of Total Return and Statement of Change in Net AssetsAttributable to Shareholders together with the Balance Sheet for each ofthe Company’s funds, the accounting policies of the Company, therelated notes for each fund and the Distribution Tables including asummary of significant policies. The financial reporting framework thathas been applied in their preparation is applicable law and UnitedKingdom Accounting Standards (United Kingdom Generally AcceptedAccounting Practice) including FRS 102 ‘The Financial ReportingStandard applicable to the UK and Republic of Ireland’. The financialstatements of M&G Investment Funds (14) ICVC have been preparedon a break up basis as disclosed in Note 2(a).
In our opinion, the financial statements:
• give a true and fair view of the financial position of the Companycomprising each of its funds as at 30 April 2018 and of the netrevenue and the net capital gains on the scheme property of theCompany comprising each of its funds for the year then ended; and
• have been properly prepared in accordance with United KingdomGenerally Accepted Accounting Practice FRS 102 ‘The FinancialReporting standard applicable in the UK and Republic of Ireland’.
Basis for opinion
We conducted our audit in accordance with International Standardson Auditing (UK) (ISAs (UK)) and applicable law. Our responsibilitiesunder those standards are further described in the Auditor’sresponsibilities for the audit of the financial statements section of ourreport below. We are independent of the Company in accordance withthe ethical requirements that are relevant to our audit of the financialstatements in the UK, including the FRC’s Ethical Standard, and wehave fulfilled our other ethical responsibilities in accordance with theserequirements.
We believe that the audit evidence we have obtained is sufficient andappropriate to provide a basis for our opinion.
Other information
The other information comprises the information included in the annualreport, other than the financial statements and our auditor’s reportthereon. The ACD is responsible for the other information.
Our opinion on the financial statements does not cover the otherinformation and, except to the extent otherwise explicitly stated in thisreport, we do not express any form of assurance conclusion thereon.
In connection with our audit of the financial statements, ourresponsibility is to read the other information and, in doing so, considerwhether the other information is materially inconsistent with thefinancial statements or our knowledge obtained in the audit orotherwise appears to be materially misstated. If we identify suchmaterial inconsistencies or apparent material misstatements, we arerequired to determine whether there is a material misstatement in thefinancial statements or a material misstatement of the otherinformation. If, based on the work we have performed, we concludethat there is a material misstatement of the other information, we arerequired to report that fact.
We have nothing to report in this regard.
Opinions on other matters prescribed by the rules of the Collective Investment Schemes sourcebook of the Financial Conduct Authority
In our opinion:
• the financial statements have been properly prepared in accordancewith the Statement of Recommended Practice relating to AuthorisedFunds, the rules of the Collective Investment Schemes sourcebookof the Financial Conduct Authority and the Instrument ofIncorporation;
• the information given in the ACD’s report for the financial year forwhich the financial statements are prepared is consistent with thefinancial statements; and
• there is nothing to indicate that proper accounting records have notbeen kept or that the financial statements are not in agreement withthose records.
Matters on which we are required to report byexception
We have nothing to report in respect of the following matter in relationto which the Collective Investment Schemes Sourcebook of theFinancial Conduct Authority rules requires us to report to you if, in ouropinion:
• we have not received all the information and explanations which, tothe best of our knowledge and belief, are necessary for thepurposes of our audit.
Responsibilities of the Authorised Corporate Director(ACD)
As explained more fully in the ACD’s responsibilities statement set outon page 3, the ACD is responsible for the preparation of the financialstatements and for being satisfied that they give a true and fair view,and for such internal control as the ACD determines is necessary toenable the preparation of financial statements that are free frommaterial misstatement, whether due to fraud or error.
In preparing the financial statements, the ACD is responsible forassessing the Company’s ability to continue as a going concern,disclosing, as applicable, matters related to going concern and usingthe going concern basis of accounting unless the ACD either intendsto liquidate the Company or to cease operations, or has no realisticalternative but to do so.
ANNUAL LONG REPORT AND AUDITED FINANCIAL STATEMENTS • April 2018 5
M&G Investment Funds (14) Independent Auditor’s Report

Auditor’s responsibilities for the audit of the financialstatements
Our objectives are to obtain reasonable assurance about whether thefinancial statements as a whole are free from material misstatement,whether due to fraud or error, and to issue an auditor’s report thatincludes our opinion. Reasonable assurance is a high level ofassurance, but is not a guarantee that an audit conducted inaccordance with ISAs (UK) will always detect a material misstatementwhen it exists. Misstatements can arise from fraud or error and areconsidered material if, individually or in the aggregate, they couldreasonably be expected to influence the economic decisions of userstaken on the basis of these financial statements.
A further description of our responsibilities for the audit of the financialstatements is located on the Financial Reporting Council’s website athttps://www.frc.org.uk/auditorsresponsibilities. This description formspart of our auditor’s report.
Use of our report
This report is made solely to the company’s shareholders, as a body,pursuant to Paragraph 4.5.12 of the rules of the Collective InvestmentSchemes sourcebook of the Financial Conduct Authority. Our auditwork has been undertaken so that we might state to the company’sshareholders those matters we are required to state to them in anauditor’s report and for no other purpose. To the fullest extent permittedby law, we do not accept or assume responsibility to anyone other thanthe company and the company’s shareholders as a body, for our auditwork, for this report, or for the opinions we have formed.
Edinburgh Ernst & Young LLP14 June 2018 Statutory Auditor
1. The maintenance and integrity of the M&G website is the responsibility of the
ACD; the work carried out by the auditors does not involve consideration of these
matters and, accordingly, the auditors accept no responsibility for any changes
that may have occurred to the financial statements since they were initially
presented on the website.
2. Legislation in the United Kingdom governing the preparation and dissemination
of financial statements may differ from legislation in other jurisdictions.
ANNUAL LONG REPORT AND AUDITED FINANCIAL STATEMENTS • April 20186
M&G Investment Funds (14) Independent Auditor’s Report
Independent Auditor’s Report to the shareholders of M&G Investment Funds (14)

The financial statements for M&G Investment Funds (14) comprise theindividual financial statements for each fund and the notes below.
Notes to the financial statements
1 Statement of compliance
The financial statements of M&G Investment Funds (14) have beenprepared in compliance with UK Financial Reporting Standard 102(FRS 102) and in accordance with the Statement of RecommendedPractice (SORP) for Authorised Funds issued by the InvestmentAssociation in May 2014.
2 Summary of significant accounting policies
a) Basis of preparation
On 16 March 2018, M&G Income Allocation Fund merged intoM&G (Lux) Income Allocation Fund and M&G Prudent AllocationFund merged into M&G (Lux) Conservative Allocation Fund. As aresult the financial statements are not prepared on a goingconcern basis for the year ended 30 April 2018, but are preparedon a break-up basis. Under this basis, all assets are recorded attheir estimated realisable amounts, all liabilities at their estimatedsettlement amounts and provision is made for any further liabilitieswhich may arise.
b) Functional and presentational currency
The functional and presentational currency of M&G InvestmentFunds (14) is euros.
c) Exchange rates
Transactions in currencies other than each fund’s functionalcurrency are translated at the rate of exchange ruling on the dateof the transaction and where applicable assets and liabilities aretranslated into the fund’s functional currency at the rate ofexchange ruling as at 12 noon on 30 April 2018 being the lastbusiness day of the accounting period.
d) Investments - recognition and valuation
The provisions of both Section 11 and Section 12 of FRS 102have been applied in full. All investments have been designatedas fair value through profit and loss and recognised initially at fairvalue, which is normally the transaction price (excludingtransaction costs and accrued interest).
At the end of the reporting period all investments have beenmeasured at their fair value using the prices and the portfolioholdings determined at 12 noon on 30 April 2018, being the lastvaluation point of the accounting period, as this is not materiallydifferent from a valuation carried out at close of business on thebalance sheet date.
Where separate bid and offer prices are available, the bid price isused for investment assets and the offer price for investmentliabilities. Otherwise, the single price or most recent transactionprice is used. Interest accrued is not included in the fair value. Themethods of determining fair value for the principal classes ofinvestment are:
• Equities and debt securities which are traded on an active marketare included at the quoted price, which is normally the bid price,excluding any accrued interest in respect of bonds.
• Equities traded on the Alternative Investment Market (AIM), whoseliquidity cannot be guaranteed, are included at their quoted bidprice as this represents the most objective and appropriate methodof valuation.
• Collective investment schemes operated by the ACD are includedat either their cancellation price for dual priced funds or their singleprice for single priced funds.
• Collective investment schemes operated by another manager areincluded at either their bid price for dual priced funds or their singleprice for single priced funds.
• Other equities and debt securities which are unquoted or notactively traded on a quoted market are included at a valueestimated by the ACD using an appropriate valuation technique,excluding any accrued interest in respect of bonds.
• Exchange traded futures and options are included at the cost ofclosing out the contract at the balance sheet date.
• Over the counter equity options, credit default swaps, interest rateswaps, asset swaps and inflation swaps are included at a valueprovided by Markit Valuations Limited, an independent creditderivative price provider. Their fair value excludes any accruedinterest in respect of derivatives where the income is revenue innature.
• Forward currency contracts, for share class hedging andinvestment, are included at a value determined by reference tocurrent forward exchange rates for contracts with similar maturityprofiles.
e) Recognition of income and expenses
• Dividends, including ordinary stock dividends, from equityinvestments are recognised when the security is quoted ex-dividend.
• Distributions from collective investment schemes are recognisedwhen the scheme is priced ex-distribution.
• Interest income, including coupons from debt securities and bankinterest is recognised on an accruals basis.
• Underwriting commission is recognised when the issue takesplace.
• Revenue from derivatives is recognised on an accruals basis.
• Fee rebates from investing in other collective investment schemesare recognised on an accruals basis.
• Expenses are recognised on an accruals basis.
f) Treatment of income and expenses
• Any increases or decreases in the fair value of investments andgains and losses realised on sales of investments are treated ascapital and recognised in net capital gains / (losses).
• The value of any enhancement to a stock dividend is treated ascapital.
• Ordinary equity dividends, including ordinary stock dividends aretreated as revenue.
• Special dividends, share buy backs or additional share issues maybe treated as revenue or capital depending on the facts of eachparticular case.
ANNUAL LONG REPORT AND AUDITED FINANCIAL STATEMENTS • April 2018 7
M&G Investment Funds (14) Financial statements and notes

• Distributions from collective investment schemes are treated asrevenue in nature, except for any element of equalisation, whichrepresents the average amount of income included in the pricepaid for the collective investment scheme, which is treated ascapital.
• Debt security interest comprises the coupon interest and thedifference between the purchase price and the expected maturityprice spread over its expected remaining life. This is treated asrevenue with the difference adjusting the cost of the shares andtreated as capital.
• Other interest income, such as bank interest is treated as revenue.
• Underwriting commission is treated as revenue, except where thefund is required to take up all or some of the shares underwritten,in which case a proportion of the commission received is deductedfrom the cost of the shares and treated as capital.
• The treatment of the income on derivative contracts depends uponthe nature of the transaction. Both motive and circumstances areused to determine whether the returns should be treated as capitalor revenue. Where positions are undertaken to protect or enhancecapital, and the circumstances support this, the returns arerecognised in net capital gains; similarly where the motives andcircumstances are to generate or protect revenue, and thecircumstances support this, the returns are included within netrevenue before taxation. Where positions generate total returns itwill generally be appropriate to apportion such returns betweencapital and revenue to properly reflect the nature of thetransaction.
• Expenses relating to the purchase and sale of investments aretreated as capital; all other expenses are treated as revenue.
• Rebates of charges from holdings in collective investmentschemes are treated as revenue or capital in accordance with theunderlying scheme’s distribution policy.
g) Tax
Dividends and similar income receivable are recognised at anamount that includes any withholding tax but excludesirrecoverable tax credits. Any withholding tax suffered is shown aspart of the tax charge.
Tax is accounted for at the appropriate rate of corporation tax withrelief for double taxation taken where appropriate. The taxaccounting treatment follows the principal amounts involved.
Deferred tax is recognised in respect of temporary timingdifferences that have originated but not reversed by the balancesheet date. Deferred tax is measured on a non-discounted basis,at the average rate of tax expected to apply in the period in whichit expects the deferred tax to be realised or settled. A deferred taxasset is only recognised to the extent that it is more likely than notthat the asset will be recovered.
Marginal tax relief has not been taken into account in respect ofexpenses offset against capital.
h) Allocation of returns to share classes
The annual management charge, any share class hedging returnsand associated share class hedging charge are directlyattributable to individual share classes. All other returns areapportioned to each fund’s share classes pro-rata to the value ofthe net assets of the relevant share class on the day that theincome or expenses are recognised.
All available net revenue accounted for in accordance with theabove policies and adjusted where relevant by any specificdistribution policies set out in the notes to that fund’s financialstatements, is distributed to holders of Income shares or retainedand reinvested for holders of Accumulation shares. Shouldexpenses and taxation together exceed revenue, there will be nodistribution and the shortfall will be met from capital.
Distributions which have remained unclaimed by shareholders formore than six years are credited to the capital property of the fund.
3 Risk management policies
The ACD is responsible for establishing, implementing and maintainingan adequate and documented risk management policy for identifying,measuring and managing all risks to which funds are or might beexposed.
The Company’s investment activities expose it to various types of riskwhich are associated with the financial instruments and markets inwhich it invests; market risk, credit risk and liquidity risk.
These financial statements are designed to enable users to evaluatethe nature and extent of those risks and how they are managed.
The following risk management policies are applicable to the funds,with specific risk disclosures set out in the notes to the financialstatements of each fund.
Market risk
Market risk is the risk of loss resulting from fluctuations in the marketvalue of positions in a fund’s portfolio attributable to changes in marketvariables, such as interest rates, exchange rates, equity andcommodity prices or an issuer’s creditworthiness.
In relation to market risk, processes are applied that take account ofthe investment objective and policy of each fund. All funds are subjectto an investment oversight process in accordance with the type andnature of the fund. In addition all funds are monitored for compliancewithin regulatory limits.
In measuring and monitoring market risk, the global exposure of a fundmay be calculated using a ‘commitment’ approach or ‘Value at Risk’(VaR) approach.
ANNUAL LONG REPORT AND AUDITED FINANCIAL STATEMENTS • April 20188
M&G Investment Funds (14) Financial statements and notes
Notes to the financial statements
2 Summary of significant accounting policies(continued)
f) Treatment of income and expenses (continued)

Commitment approach
The commitment approach is applied for funds investing only intraditional asset classes, namely equities, fixed income, money marketinstruments and collective investment schemes.
In addition, the approach is applied for funds which use or intend touse derivatives or instruments embedding derivatives, but only forefficient portfolio management purposes, or in a simple way notnecessarily restricted to efficient portfolio management.
Under the commitment approach the global exposure of funds ismeasured and monitored using a commitment (adjusted notional)methodology.
Market risk is considered on a daily basis and forms the foundation ofinvestment oversight analysis. This can include for each fund (but isnot limited to) the analysis of factors such as fund concentration; style,geographical, industry and market capitalisation biases; active,systematic and specific risk measurements; active money; and betacharacteristics.
Value at Risk approach
The Value at Risk (VaR) approach is a methodology for estimatingthe maximum potential loss due to market risk based on historicmarket volatilities and correlations. More particularly, the VaRapproach gives a broad indication of the maximum potential loss ata given confidence level (probability), over a specific time period undernormal market conditions.
Instrument and portfolio modelling techniques are based on marketaccepted practices and are subject to regular audit (back-testing).Market risk factors that are analysed include LIBOR / swap rates,government yield curves, equity prices, exchange rates, marketvolatility, credit spreads and credit default swap (CDS) spreads.
The VaR model is based on a Monte Carlo process with actual VaRbeing reported on the basis of a 99% confidence interval over a onemonth period (20 business days). Risk factor history used in the MonteCarlo process is based on 250 business days. From the variance /covariance matrices, a parametric Monte Carlo scenario set of 5,000simulations is derived and applied to the fund.
VaR does have limitations in its ability to present valid levels of risk inextreme market conditions. Accordingly, the Risk Analysis team alsocarries out monthly stress testing and scenario based analysis. Stresstesting allows for extreme sets of market circumstances which maynot be reflected in historical data sets thereby enabling furtherassessment of combinations of market movements which may causeserious damage to portfolio values. The key element to the scenariobased analysis is challenging the correlation assumptions implicitwithin statistical based models such as VaR.
The stress test and scenario based analysis is customised for eachfund type and the VaR analysis is produced on a daily basis.
The table below shows funds using the ‘commitment’ approach andthose using the ‘Value at Risk (VaR)’ approach:Fund Global exposure approach
M&G Income Allocation Fund VaR
M&G Prudent Allocation Fund VaR
Liquidity risk
Liquidity risk is the risk that a fund’s holdings cannot be sold, liquidatedor closed out at limited cost in an adequately short time frame and thatthe ability of the scheme to comply at any time with its obligation tosell and redeem shares is thereby compromised.
The overall liquidity profile for each fund is reviewed and updatedregularly. The liquidity profile takes into account investment, cashflowand market liquidity considerations.
Investment liquidity considerations include an assessment of assetclass liquidity conditions, liquidity of underlying holdings, portfolioconstruction and concentration, the scale of individual stock ownershipand the nature of the investment strategy.
Cashflow liquidity is managed in each fund on a daily basis usingreports that include subscription and redemption information as wellas the impact of trading, derivative lifecycle events and corporateaction activity. In addition to the daily reporting, the fund managers areprovided with reporting that highlights the impact of reasonablypredictable events in the portfolio, including an allowance for thepotential future exposures that might result from derivative exposures.
Market (or distribution-related) considerations include an assessmentof asset demand, fund growth, client concentration and the persistencyof the client base. Supplementary to this, market liquidity stress testsare carried out on a monthly basis for all sophisticated funds.
Credit risk
For funds exposed to credit risk, the credit rating, yield and maturity ofeach interest bearing security is considered to determine if the yieldfully reflects the risk. The capital value of interest-bearing securitieswithin the funds will fall in the event of the default or perceivedincreased credit risk of an issuer.
The capital value of interest-bearing securities within a fund may alsobe affected by interest rate fluctuations such that when interest ratesrise, the capital value of the interest-bearing securities is likely to falland vice versa.
Funds investing in derivatives are exposed to counterparty risk. Thisis the risk that the other party to the transaction fails to fulfil theirobligations, either by failing to pay or failing to deliver securities. Tominimise this risk, carefully selected, financially strong and well-established counterparties are selected following a thorough duediligence review and collateral is posted daily (in the form of cash orhigh-quality government bonds). Derivative positions are valued on amark-to-market basis (revalued to reflect prevailing market prices) dailyand collateral moves from one counterparty to the other to reflectmovements in the unrealised profit or loss. As a result, the maximumloss to the fund would be limited to that day’s price movements inaffected derivatives contracts.
For funds in which they are used, credit default swaps are bought andsold in response to detailed credit research to take advantage ofanticipated movements in credit spreads on individual stocks andbaskets of securities. When a fund buys a credit default swap thedefault risk associated with the underlying security transfers to thecounterparty. When a fund sells a credit default swap the fundassumes the credit risk of the underlying security.
ANNUAL LONG REPORT AND AUDITED FINANCIAL STATEMENTS • April 2018 9
M&G Investment Funds (14) Financial statements and notes
Notes to the financial statements
3 Risk management policies (continued)

ANNUAL LONG REPORT AND AUDITED FINANCIAL STATEMENTS • April 201810
M&G Investment Funds (14)Financial statements and notes
This page is intentionally blank

Investment objective up to fundclosure on 16 March 2018
The fund aims to generate a growing level of income over the mediumterm through investment in a range of global assets. The fund alsoaims to provide capital growth over the long term.
Investment policy up to fund closureon 16 March 2018
The manager adopts a flexible approach to the allocation of capitalbetween asset classes in response to changes in economic conditionsand the valuation of assets. As a result, at any one time the portfoliomay be diversified across asset classes, sectors, currencies andcountries or, at the investment manager’s discretion, may be morefocussed. Market risk will be managed through active asset allocation.
The fund can invest in transferable securities such as equities andfixed income assets (including, but not limited to, corporate bonds andgovernment and public securities), warrants, money marketinstruments, deposits, cash and near cash. The fund’s exposure tothese assets may be gained directly, or indirectly via investment incollective investment schemes and via derivatives (including equityindex futures, currency forwards, interest rate swaps and otherderivatives). The manager may seek to manage currency risk throughthe combination of diversification and hedging. Derivatives may alsobe used for efficient portfolio management purposes.
Investment approach up to fundclosure on 16 March 2018
The fund manager believes the best way to meet the income objectiveis by investing flexibly among different asset classes. This approachcombines in-depth research to determine the value of assets over themedium to long term, with analysis of investors’ emotional reaction toevents to identify investment opportunities. In particular, the managerseeks to respond when asset prices move away from a reasonablesense of ‘fair’ value due to investors reacting emotionally to events.He believes such episodes create opportunities because emotionsshould be less important than asset valuations over the medium andlong term.
The fund invests in a range of income-generating assets from aroundthe world. It will typically invest 10-50% of its assets in companyshares, 40-80% in fixed income securities and up to 20% in otherassets, which can include convertibles (fixed income investments thathave the right to be converted into a predetermined number ofcompany shares). At least 70% of the fund will be held in euro assets.The fund may also invest in derivatives, which are financial instrumentswhose value is linked to the expected future price movements of anunderlying asset. The holdings in different asset classes will beadjusted regularly according to where the fund manager sees the mostvalue and to manage risks.
Risk profile up to fund closure on16 March 2018
The fund invests globally in a broad range of assets, includingcompany shares (equities), fixed income securities (bonds), currenciesand other assets such as property shares and convertible bonds. Thefund is, therefore, subject to the price volatility of global financial andcurrency markets.
The fund adopts a flexible approach to the allocation of capitalbetween asset classes in response to changes in economic conditionsand the valuation of assets, and the manager will seek to maximiseportfolio diversity wherever possible. The fund has a bias towardsincome-producing assets. Income distributions from the fund’sholdings, however, are not guaranteed and may vary.
The blend of assets held in the fund is regularly adjusted dependingon where the manager sees the most value and to manage risks,including liquidity, credit, currency and market risks. The fund’s risksare measured and managed as an integral part of the investmentprocess.
The following table shows the risk number associated with the fundand is based on Euro Class ‘A’ shares.
The above number:
• is based on the rate at which the value of the fund has moved up and down in the
past and is based on historical data so may not be a reliable indicator of the future
risk profile of the fund.
• is not guaranteed and may change over time and the lowest risk number does not
mean risk free.
• has not changed during this period.
Low risk High risk
Typically lower rewards Typically higher rewards
1 2 3 4 5 6 7
M&G Income Allocation Fund Authorised Corporate Director’s Report
ANNUAL LONG REPORT AND AUDITED FINANCIAL STATEMENTS • April 2018 11

Investment review
As at 1 May 2018, for the period from 2 May 2017 to16 March 2018
Distribution summary
Due to the merger of M&G Income Allocation Fund into M&G (Lux)Income Allocation Fund, with identical investment approach andobjectives, the investment below covers the period from 2 May 2017to 16 March 2018. This shortened review period therefore comprisesonly 10.5 months. The fund made 10 regular monthly distributions anda final special distribution during this shortened period, totalling 32.11¢
per Euro Class ‘A’ (Income) share. While this represents a decreaseof 13.4% compared to the previous review period, the fewer numberof distributions and the shorter period must be kept in mind. At the endof the reporting period, the payout represented a yield (distributedincome as a percentage of the share price at the end of the period) of2.83%. Similarly to what was said before, this was lower than the 3.3%level a year earlier, as this only included 10 regular payments and onespecial distribution.
The fund’s distribution and distribution yield are shown in the ‘Specificshare class performance’ tables in this report. This fund provides avariable level of income.
Performance against objective
Between 2 May 2017 (the start of the review period) and 16 March2018, when it was merged into a Luxembourg-authorised SICAV, theM&G Income Allocation Fund produced a positive total return (thecombination of income and growth of capital) across all of its shareclasses. The fund was ahead of its peer group, the Morningstar EURModerate Allocation Global Sector, which returned 1.7% over thesame period.
The fund has achieved its aims of generating capital growth andproducing a growing level of income over a three-year period.*
* For the performance of each share class, please refer to the ‘Long-term
performance by share class’ table in the ‘Fund performance’ section of this report.
Please note that the performance data covers the period from 2 May 2017 until
16 March 2018, not for the full reporting period, due to the fund being merged.
Investment performance
Risk assets, such as company shares (equities, which offer ownershipof stakes in companies) enjoyed healthy rallies in the first eightmonths of the review period, as investors focused on the robusteconomic data being released and strong growth in companyearnings. Several stockmarkets, including the US and the UK, hit aseries of record highs. However, sentiment changed dramatically inFebruary 2018, when signs of wage growth in the US led to theexpectation of higher interest rates to combat inflation. This sparkeda sell-off in the bond markets, which was more than reflected in equitymarkets. (Bonds are loans that are extended by an investor to anissuer – such as a company or government – in exchange for regularinterest payments. Bonds issued by companies are referred to as‘corporate bonds’, while those issued by governments are called‘government bonds’.) After a brief recovery, share prices fell again inMarch, as President Trump announced tariffs on imports from variouscountries, raising the prospect of a global trade war. The periodfinished with another robust recovery. Despite the pick-up in thevariability (or volatility) of share prices, most stockmarkets deliveredpositive returns over the review period.
On the other hand, bond markets suffered as expectations of higherinflation and interest rates, especially in the US, increased. Thelikelihood of higher interest rates elsewhere also rose, as centralbankers are widely expected to begin the withdrawal of the policiesthey introduced to keep interest rates low, such as massive purchasesof government bonds. This action has been very beneficial to theprices of such bonds. Overall, most mainstream government bondsdeclined during the year, although bonds issued by emerging marketgovernments and companies performed better.
The increase in volatility was helpful for our strategy of focusing onthe facts – such as economic data and the relative valuations ofdifferent assets – rather than getting carried away by temporary newsstories. We were able to exploit several investment opportunitiespresented by the large price movements, many of which weconsidered were driven by shifts in emotion, rather than fundamentalchanges to, for example, the economic environment.
Since we believed that better economic activity will eventually bereflected in improved company earnings and, consequently, highershare prices, we maintained a bias towards equities throughout thereview period. In our opinion, equities offer significantly better valuethan most government bonds, which we regard as expensive. Webelieve that government bonds from the UK, Germany and Japanremain overvalued.
The fund was therefore positioned in favour of equities for the wholeof the review period and the allocation was increased during theperiod. We think company shares are more attractively valued thanbonds and, if selected carefully, can pay healthy levels of dividend –an important consideration given the fund’s income objective. The biastowards equities was the major driver of the fund’s robust performanceover the review period, with substantial value being generated by ourholdings of shares in US companies, particularly technologybusinesses and banks. Our allocations towards equities in Japan,which included industrial companies and banks, also generatedsubstantial returns. Holdings in Taiwan and Italy added decent valueas well.
Our investments in bonds also delivered a positive contribution toperformance, primarily driven by our stakes in government bonds fromcountries in peripheral Europe, namely Portugal, Italy and Spain, whichall experienced better economic conditions. Holdings of governmentbonds issued by South Africa, Mexico and Brazil rose in price too, asthe issuing countries’ economic and political situations improved.
We hold a substantial stake in US government bonds, which are heldas ‘insurance’ against a major drop in equity prices and as a diversifierto some of our emerging market bonds. The yield, or return, on theUS bonds increased during the review period and, in our opinion, thisshould increase their potential diversification properties in the event ofweakness elsewhere. The returns from US government bonds werefairly flat overall, with occasional sell-offs caused by rising concernabout inflation, offset by investors seeking safe havens whengeopolitical tensions increased.
ANNUAL LONG REPORT AND AUDITED FINANCIAL STATEMENTS • April 201812
M&G Income Allocation Fund Authorised Corporate Director’s Report

Investment activities
Although most asset classes made steady progress in the early partof the review period, there was a marked increase in price movementsas we moved into 2018. During each of these so-called ‘episodes’, wecarefully assessed whether there had been any change in theeconomic background that could justify the sharp movements in priceor whether they were simply driven by shifts in investors’ sentiment. Onseveral occasions, we adjusted the fund’s positioning in response tochanges in asset prices that we thought would eventually be ‘corrected’.
For example, we reduced equity exposure significantly in January,when we believed the rally in share prices might have gone too far,before rebuilding the positions following sharp stock price falls.
Overall, the allocation to equities rose during the review period, withthe main increase being in Japan. Several European banks were alsoadded to the portfolio. Conversely, exposure to equities from Taiwan,the US, Canada and the UK was scaled back.
The overall allocation to government bonds was reduced mainly inEurope where, after good performance, we sold our holdings of bondsissued by Portugal and reduced the size of our holdings from Spainand Italy.
We remain cautious on most mainstream government bonds, sincewe believe that these assets are overvalued and vulnerable to pricefalls in the event of better economic data and higher interest rates.Hence, we have no exposure to government bonds from Japan, theUK or Germany. The exception is US government bonds, where weincreased the fund’s allocation to long-dated government bonds afterprice weakness improved their yields, making it more likely that theywould behave differently from our holdings of equities and bondsissued by emerging market governments. We also used lower pricesto introduce a position in 10-year government bonds.
Although the fund’s holdings of corporate bonds were reduced aftergood performance, exposure to emerging market government bondswas increased via the purchases of government debt from Poland andBrazil, as well as a new holding in the M&G (Lux) Emerging MarketsHard Currency Bond Fund. This fund adds some diversification to ourexposure to fixed income assets from emerging markets without theunderlying currency risk, while benefiting from M&G’s emerging marketcredit expertise.
The fund’s cash holding reduced the risk from potential asset pricefalls in the event of a negative surprise, and it gave us scope to exploitany unwarranted changes in valuation that took place.
Outlook
Since we do not think that the fundamental economic background haschanged materially, we maintained the fund’s bias towards equities.We believe the asset class should benefit from continued economicgrowth and improved corporate earnings. However, the fund also hasa large weighting in US government bonds, which we believe now offera reasonable yield and should act as a good diversifier in the event ofweakness in equity markets.
The fact that the fund’s holdings of US bank equities and USgovernment bonds are likely to move in opposite directions, as wasdemonstrated in March 2018, is a key reason why we hold both assets.US bank equity tends to rally when Treasuries sell off, and to declineas yields fall. US banks are still attractively valued, experiencingearnings growth and likely to benefit if expectations of higher USinterest rates increase. But we are considering the position in US bankstocks since, although we still expect some weakness in USgovernment bonds, their yields – which move inversely to bondprices – have already risen substantially. This is why we havediversified the exposure to banks by adding to holdings of financialgroups in Europe and Japan, where interest rates have not yet risen.
We also continue to see value in some emerging market bonds, whichoffer higher levels of real yield.
We see the increase in price volatility at the end of the review periodas a positive factor, since changes in asset prices and valuationsshould present investment opportunities that we can exploit using ourvaluation-driven approach. The fund merged into a Luxembourg-authorised SICAV on 16 March, but we continue to invest in thoseareas of the market that we believe combine strong growthcharacteristics with attractive valuations, while diversifying the portfolioacross both sectors and geographies.
Steven AndrewFund manager
An employee of M&G Limited which is an associate of M&G Securities Limited.
Please note that the views expressed in this Report should not be taken as a
recommendation or advice on how the fund or any holding mentioned in the Report
is likely to perform. If you wish to obtain financial advice as to whether an investment
is suitable for your needs, you should consult a Financial Adviser.
Investments
The fund had no holdings at the year end.
ANNUAL LONG REPORT AND AUDITED FINANCIAL STATEMENTS • April 2018 13
M&G Income Allocation Fund Authorised Corporate Director’s Report
Investment review

Fund performance
Please note past performance is not a guide to future performanceand the value of investments, and the income from them, will fluctuate.This will cause the fund price to fall as well as rise and you may notget back the original amount you invested.
Due to the merger of the M&G Income Allocation Fund into the M&G(Lux) Income Allocation Fund on 16 March 2018, the performancedata below covers a period that is shorter than the 12-month financialyear of the fund. Instead, it runs from 2 May 2017 to 16 March 2018.
Fund level performance
Fund net asset value
2018 2017 2016as at 30 April €’000 €’000 €’000
Fund net asset value (NAV) 0 918,830 907,041
The NAV figure as at 30 April 2018 is shown as €0 due to the fundclosure on 16 March 2018.
Performance since launch
To give an indication of how the fund has performed since launch, thechart below shows total return of Euro Class ‘A’ (Accumulation) shares.
100
103
106
110
115
130
125
120
135
982013 2014 2015 2016 2017 2018
* Income reinvested Source: Morningstar, Inc. and M&G
November 2013 = 100, plotted monthly Chart date 16 March 2018
Euro Class ‘A’ (Accumulation) shares*
Morningstar EUR Moderate Allocation - Global sector average*
Distribution since launch
The chart below shows the annual distribution (per financial year) ofEuro Class ‘A’ (income) shares since launch. Please note, for the 2018accounting period, the fund made 10 regular monthly distributions anda final special distribution, instead of 12 regular monthly distributions.This was because the fund was merged into a Luxembourg-authorisedSICAV with an identical investment approach and objective.
To give an indication of the performance of the fund, the following tableshows the compound rate of return, per annum, over the period, tothe merger date, 16 March 2018. Calculated on a price to price basiswith income reinvested. Please note that due to the fund closure on16 March 2018, the one, three and five-year performance periods arenot full periods.
Long-term performance by share class
One Three Five Since year years years launch 02.05.17 01.05.15 01.05.13 to 16.03.18 to 16.03.18 to 16.03.18 % [a] % p.a. % p.a. % p.a.
Euro [b] Class ‘A’ +3.4 +2.7 n/a +6.5 [c]
Class ‘A Q’ +3.9 n/a n/a +3.2 [d]
Class ‘B Q’ +3.1 n/a n/a +6.6 [e]
Class ‘C’ +4.0 +3.4 n/a +7.3 [c]
Class ‘C Q’ +4.5 n/a n/a +3.7 [d]
Singapore dollar [b] Class ‘A-H’ +4.8 n/a n/a +7.7 [f]
Class ‘C-H’ +5.4 n/a n/a +8.5 [f]
Swiss franc [b] Class ‘A-H’ +3.0 +2.0 n/a +5.8 [c]
Class ‘C-H’ +3.7 +2.7 n/a +6.5 [c]
US dollar [b] Class ‘A-H’ +5.3 n/a n/a +7.7 [f]
Class ‘C-H’ +6.0 n/a n/a +8.4 [f]
[a] Absolute basis.
[b] Price to price with net income reinvested.
[c] 7 November 2013, the launch date of the fund.
[d] 8 May 2015, the launch date of the share class.
[e] 11 September 2015, the launch date of the share class.
[f] 9 October 2015, the launch date of the share class.
0.0
10.0
15.0
5.0
25.0
20.0
45.0
40.0
30.0
35.0
2014* 2015 2017 2018*2016
* Partial fund financial year distributions
Annual distributions since launch Chart date 16 March 2018
Euro Class ‘A’ (Income) shares
Years ending April
Dis
trib
utio
n (c
ents
per
sha
re)
Source: M&G
ANNUAL LONG REPORT AND AUDITED FINANCIAL STATEMENTS • April 201814
M&G Income Allocation Fund Financial highlights

Operating charges and portfoliotransaction costs
We explain below the payments made to meet the ongoing costs ofinvesting and managing the fund, comprising operating charges andportfolio transaction costs.
Operating charges
Operating charges include payments made to M&G and to providersindependent of M&G:
• Investment management: Charge paid to M&G for investmentmanagement of the fund (also known as Annual ManagementCharge).
• Administration: Charge paid to M&G for administration servicesin addition to investment management – any surplus from thischarge will be retained by M&G.
• Share class hedging: Charge paid to M&G for currency hedgingservices to minimise exchange rate risk for the share class.
• Oversight and other independent services: Charges paid toproviders independent of M&G for services which includedepositary, custody and audit.
• Ongoing charges from underlying funds: Ongoing charges onholdings in underlying funds that are not rebated.
The operating charges paid by each share class of the fund are shownin the following performance tables. Operating charges do not includeportfolio transaction costs or any entry and exit charges (also known asinitial and redemption charges). The charging structures of shareclasses may differ, and therefore the operating charges may differ.
Operating charges are the same as the ongoing charges shown in theKey Investor Information Document, other than where an estimate hasbeen used for the ongoing charge because a material change has madethe operating charges unreliable as an estimate of future charges.
For this fund there is no difference between operating charges andongoing charges figures, unless disclosed under the specific shareclass performance table.
Portfolio transaction costs
Portfolio transaction costs are incurred by funds when buying andselling investments. These costs vary depending on the types ofinvestment, their market capitalisation, country of exchange andmethod of execution. They are made up of direct and indirect portfoliotransaction costs:
• Direct portfolio transaction costs: Broker execution commissionand taxes.
• Indirect portfolio transaction costs: ‘Dealing spread’ – thedifference between the buying and selling prices of the fund’sinvestments; some types of investment, such as fixed interestsecurities, have no direct transaction costs and only the dealingspread is paid.
Investments are bought or sold by a fund when changes are made tothe investment portfolio and in response to net flows of money into orout of the fund from investors buying and selling shares in the fund.
To protect existing investors, portfolio transaction costs incurred as aresult of investors buying and selling shares in the fund are recoveredfrom those investors through a ‘dilution adjustment’ to the price theypay or receive. The table below shows direct portfolio transaction costspaid by the fund before and after that part of the dilution adjustmentrelating to direct portfolio transaction costs. To give an indication of theindirect portfolio dealing costs the table also shows the averageportfolio dealing spread.
Portfolio transaction costs
for the year to 30 April 2018 2017 2016 Average [a]
Direct portfolio transaction costs [b] % % % %
Broker commission 0.03 0.03 0.04 0.03
Taxes 0.06 0.03 0.39 0.16
Costs before dilution adjustments 0.09 0.06 0.43 0.19
Dilution adjustments [c] (0.03) (0.01) (0.02) (0.02)
Total direct portfolio transaction costs 0.06 0.05 0.41 0.17
as at 30 April 2018 2017 2016 Average [a]
Indirect portfolio transaction costs % % % %
Average portfolio dealing spread 0.00 [d] 0.22 0.32 0.18
[a] Average of first three columns.
[b] As a percentage of average net asset value.
[c] In respect of direct portfolio transaction costs. Please see the section above this
table for an explanation of dilution adjustments.
[d] The average is not a true representation, as the fund has not been in existence
for the full 2018 financial year.
ANNUAL LONG REPORT AND AUDITED FINANCIAL STATEMENTS • April 2018 15
M&G Income Allocation Fund Financial highlights
Fund performance

Specific share class performance
The following tables show the performance of each share class. All‘Performance and charges’ percentages represent an annual rateexcept for the ‘Return after operating charges’ which is calculated asa percentage of the opening net asset value per share (NAV). ‘Dilutionadjustments’ are only in respect of direct portfolio transaction costs.
Euro Class ‘A’ Income share performanceThe share class was launched 7 November 2013.
for the year to 30 April 2018 2017 2016Change in NAV per share Euro ¢ Euro ¢ Euro ¢
Opening NAV 1,123.45 1,039.09 1,163.28
Return before operating charges and after directportfolio transaction costs 59.91 139.34 (65.69)
Operating charges (16.75) (17.90) (17.92)
Return after operating charges 43.16 121.44 (83.61)
Distributions (32.11) (37.08) (40.58)
Return to shareholder as a resultof share class closure (1,134.50) n/a n/a
Closing NAV 0.00 1,123.45 1,039.09
Direct portfolio transaction costs Euro ¢ Euro ¢ Euro ¢
Costs before dilution adjustments 0.84 0.62 4.62
Dilution adjustments [a] (0.27) (0.09) (0.23)
Total direct portfolio transaction costs 0.57 0.53 4.39
Performance and charges % % %
Direct portfolio transaction costs [b] 0.06 0.05 0.41
Operating charges [c] 1.69 1.68 1.68
Return after operating charges +3.84 +11.69 -7.19
Historic yield n/a 3.29 3.99
Effect on yield of charges offset against capital 1.69 1.68 1.68
Other information
Closing NAV (€’000) 0 458,369 459,186
Closing NAV percentage of total fund NAV (%) 0.00 49.89 50.63
Number of shares 0 40,800,095 44,191,108
Highest share price (Euro ¢) 1,171.02 1,135.29 1,163.08
Lowest share price (Euro ¢) 1,109.86 994.21 944.02
Euro Class ‘A’ Accumulation share performanceThe share class was launched on 7 November 2013.
for the year to 30 April 2018 2017 2016Change in NAV per share Euro ¢ Euro ¢ Euro ¢
Opening NAV 1,270.20 1,135.16 1,223.11
Return before operating charges and after directportfolio transaction costs 68.48 154.86 (68.78)
Operating charges (19.16) (19.82) (19.17)
Return after operating charges 49.32 135.04 (87.95)
Distributions (17.88) (24.74) (43.52)
Retained distributions 17.88 24.74 43.52
Return to shareholder as a resultof share class closure (1,319.52) n/a n/a
Closing NAV 0.00 1,270.20 1,135.16
Direct portfolio transaction costs Euro ¢ Euro ¢ Euro ¢
Costs before dilution adjustments 0.96 0.68 4.93
Dilution adjustments [a] (0.31) (0.10) (0.24)
Total direct portfolio transaction costs 0.65 0.58 4.69
Performance and charges % % %
Direct portfolio transaction costs [b] 0.06 0.05 0.41
Operating charges [c] 1.69 1.68 1.68
Return after operating charges +3.88 +11.90 -7.19
Historic yield n/a 1.71 3.92
Effect on yield of charges offset against capital 0.03 0.03 1.68
Other information
Closing NAV (€’000) 0 345,351 384,920
Closing NAV percentage of total fund NAV (%) 0.00 37.59 42.44
Number of shares 0 27,188,764 33,908,782
Highest share price (Euro ¢) 1,351.57 1,277.69 1,222.94
Lowest share price (Euro ¢) 1,266.25 1,089.39 1,018.00
Euro Class ‘A Q’ Income share performanceThe share class was launched on 8 May 2015.
for the year to 30 April 2018 2017 2016Change in NAV per share Euro ¢ Euro ¢ Euro ¢
Opening NAV 976.50 903.05 1,000.00
Return before operating charges and after directportfolio transaction costs 52.29 121.68 (47.86)
Operating charges (14.56) (15.80) (14.97)
Return after operating charges 37.73 105.88 (62.83)
Distributions (27.98) (32.43) (34.12)
Return to shareholder as a resultof share class closure (986.25) n/a n/a
Closing NAV 0.00 976.50 903.05
Direct portfolio transaction costs Euro ¢ Euro ¢ Euro ¢
Costs before dilution adjustments 0.73 0.54 3.90
Dilution adjustments [a] (0.23) (0.08) (0.19)
Total direct portfolio transaction costs 0.50 0.46 3.71
Performance and charges % % %
Direct portfolio transaction costs [b] 0.06 0.05 0.41
Operating charges [c] 1.68 1.68 1.66
Return after operating charges +3.86 +11.72 -6.28
Historic yield n/a 3.30 3.84
Effect on yield of charges offset against capital 1.68 1.68 1.66
Other information
Closing NAV (€’000) 0 14,298 3,074
Closing NAV percentage of total fund NAV (%) 0.00 1.56 0.34
Number of shares 0 1,464,198 340,390
Highest share price (Euro ¢) 1,022.61 992.64 1,008.35
Lowest share price (Euro ¢) 966.03 866.35 818.94
ANNUAL LONG REPORT AND AUDITED FINANCIAL STATEMENTS • April 201816
M&G Income Allocation Fund Financial highlights

Euro Class ‘B Q’ Income share performanceThe share class was launched on 11 September 2015.
for the year to 30 April 2018 2017 2016Change in NAV per share Euro ¢ Euro ¢ Euro ¢Opening NAV 1,066.29 990.81 1,000.00Return before operating charges and after directportfolio transaction costs 57.94 134.50 34.81
Operating charges (20.59) (22.60) (15.49)
Return after operating charges 37.35 111.90 19.32
Distributions (30.93) (36.42) (28.51)
Return to shareholder as a resultof share class closure (1,072.71) n/a n/a
Closing NAV 0.00 1,066.29 990.81
Direct portfolio transaction costs Euro ¢ Euro ¢ Euro ¢Costs before dilution adjustments 0.80 0.60 3.11Dilution adjustments [a] (0.25) (0.08) (0.15)
Total direct portfolio transaction costs 0.55 0.52 2.96
Performance and charges % % %Direct portfolio transaction costs [b] 0.06 0.05 0.41Operating charges [c] 2.18 2.18 2.16Return after operating charges +3.50 +11.29 +1.93Historic yield n/a 3.39 3.33Effect on yield of charges offset against capital 2.18 2.18 2.16
Other information Closing NAV (€’000) 0 13,749 1,892Closing NAV percentage of total fund NAV (%) 0.00 1.50 0.21Number of shares 0 1,289,384 190,940Highest share price (Euro ¢) 1,113.10 1,084.63 1,041.26Lowest share price (Euro ¢) 1,053.44 949.91 899.32
Euro Class ‘B Q’ Accumulation share performanceThe share class was launched on 11 September 2015.
for the year to 30 April 2018 2017 2016Change in NAV per share Euro ¢ Euro ¢ Euro ¢Opening NAV 1,136.43 1,019.47 1,000.00Return before operating charges and after directportfolio transaction costs 62.20 140.58 35.09
Operating charges (22.21) (23.62) (15.62)
Return after operating charges 39.99 116.96 19.47
Distributions (11.86) (18.83) (28.70)
Retained distributions 11.86 18.83 28.70
Return to shareholder as a resultof share class closure (1,176.42) n/a n/a
Closing NAV 0.00 1,136.43 1,019.47
Direct portfolio transaction costs Euro ¢ Euro ¢ Euro ¢Costs before dilution adjustments 0.86 0.63 3.13Dilution adjustments [a] (0.27) (0.09) (0.15)
Total direct portfolio transaction costs 0.59 0.54 2.98
Performance and charges % % %Direct portfolio transaction costs [b] 0.06 0.05 0.41Operating charges [c] 2.18 2.18 2.15Return after operating charges +3.52 +11.47 +1.95Historic yield n/a 1.33 3.33Effect on yield of charges offset against capital 0.03 0.03 2.15
Other information Closing NAV (€’000) 0 3,093 469Closing NAV percentage of total fund NAV (%) 0.00 0.34 0.05Number of shares 0 272,212 46,041Highest share price (Euro ¢) 1,205.65 1,143.02 1,046.36Lowest share price (Euro ¢) 1,131.38 977.51 914.83
Euro Class ‘C’ Income share performanceThe share class was launched on 7 November 2013.
for the year to 30 April 2018 2017 2016Change in NAV per share Euro ¢ Euro ¢ Euro ¢
Opening NAV 1,155.62 1,059.87 1,175.62
Return before operating charges and after directportfolio transaction costs 60.06 141.01 (68.13)
Operating charges (8.54) (9.07) (8.82)
Return after operating charges 51.52 131.94 (76.95)
Distributions (31.38) (36.19) (38.80)
Return to shareholder as a resultof share class closure (1,175.76) n/a n/a
Closing NAV 0.00 1,155.62 1,059.87
Direct portfolio transaction costs Euro ¢ Euro ¢ Euro ¢
Costs before dilution adjustments 0.87 0.63 4.60
Dilution adjustments [a] (0.28) (0.10) (0.23)
Total direct portfolio transaction costs 0.59 0.53 4.37
Performance and charges % % %
Direct portfolio transaction costs [b] 0.06 0.05 0.41
Operating charges [c] 0.83 0.83 0.83
Return after operating charges +4.46 +12.45 -6.55
Historic yield n/a 3.12 3.73
Effect on yield of charges offset against capital 0.83 0.83 0.83
Other information
Closing NAV (€’000) 0 38,584 23,441
Closing NAV percentage of total fund NAV (%) 0.00 4.20 2.59
Number of shares 0 3,338,820 2,211,725
Highest share price (Euro ¢) 1,211.19 1,166.47 1,175.57
Lowest share price (Euro ¢) 1,144.47 1,015.23 959.52
Euro Class ‘C’ Accumulation share performanceThe share class was launched on 7 November 2013.
for the year to 30 April 2018 2017 2016Change in NAV per share Euro ¢ Euro ¢ Euro ¢
Opening NAV 1,299.78 1,153.49 1,235.30
Return before operating charges and after directportfolio transaction costs 68.22 156.31 (71.96)
Operating charges (9.59) (10.02) (9.85)
Return after operating charges 58.63 146.29 (81.81)
Distributions (26.36) (31.90) (43.74)
Retained distributions 26.36 31.90 43.74
Return to shareholder as a resultof share class closure (1,358.41) n/a n/a
Closing NAV 0.00 1,299.78 1,153.49
Direct portfolio transaction costs Euro ¢ Euro ¢ Euro ¢
Costs before dilution adjustments 0.99 0.70 5.13
Dilution adjustments [a] (0.31) (0.11) (0.25)
Total direct portfolio transaction costs 0.68 0.59 4.88
Performance and charges % % %
Direct portfolio transaction costs [b] 0.06 0.05 0.41
Operating charges [c] 0.82 0.83 0.83
Return after operating charges +4.51 +12.68 -6.62
Historic yield n/a 2.33 3.94
Effect on yield of charges offset against capital 0.02 0.03 0.83
Other information
Closing NAV (€’000) 0 42,993 33,749
Closing NAV percentage of total fund NAV (%) 0.00 4.68 3.73
Number of shares 0 3,307,715 2,925,854
Highest share price (Euro ¢) 1,390.11 1,307.30 1,235.25
Lowest share price (Euro ¢) 1,298.74 1,109.26 1,033.63
ANNUAL LONG REPORT AND AUDITED FINANCIAL STATEMENTS • April 2018 17
M&G Income Allocation Fund Financial highlights
Specific share class performance

Euro Class ‘C Q’ Income share performanceThe share class was launched on 8 May 2015.
for the year to 30 April 2018 2017 2016Change in NAV per share Euro ¢ Euro ¢ Euro ¢
Opening NAV 991.47 909.07 1,000.00Return before operating charges and after directportfolio transaction costs 51.60 120.91 (49.53)Operating charges (7.13) (7.65) (7.62)
Return after operating charges 44.47 113.26 (57.15)
Distributions (26.88) (30.86) (33.78)
Return to shareholder as a resultof share class closure (1,009.06) n/a n/a
Closing NAV 0.00 991.47 909.07
Direct portfolio transaction costs Euro ¢ Euro ¢ Euro ¢
Costs before dilution adjustments 0.72 0.56 4.10Dilution adjustments [a] (0.23) (0.08) (0.20)
Total direct portfolio transaction costs 0.49 0.48 3.90
Performance and charges % % %
Direct portfolio transaction costs [b] 0.06 0.05 0.41Operating charges [c] 0.81 0.81 0.83Return after operating charges +4.49 +12.46 -5.72Historic yield n/a 3.11 3.79Effect on yield of charges offset against capital 0.81 0.81 0.83
Other information
Closing NAV (€’000) 0 10 9Closing NAV percentage of total fund NAV (%) 0.00 0.00 0.00Number of shares 0 1,000 1,000Highest share price (Euro ¢) 1,044.56 1,006.40 1,008.63Lowest share price (Euro ¢) 983.12 873.12 822.97
Singapore dollar Class ‘A-H’ Income share performanceThe share class was launched on 9 October 2015.
for the year to 30 April 2018 2017 2016Change in NAV per share Singapore ¢ Singapore ¢ Singapore ¢
Opening NAV 1,075.92 982.22 1,000.00Return before operating charges and after directportfolio transaction costs 73.24 145.99 15.51
Operating charges (16.20) (17.12) (10.64)
Return after operating charges 57.04 128.87 4.87
Distributions (30.92) (35.17) (22.65)
Return to shareholder as a resultof share class closure (1,102.04) n/a n/a
Closing NAV 0.00 1,075.92 982.22
Direct portfolio transaction costs Singapore ¢ Singapore ¢ Singapore ¢
Costs before dilution adjustments 0.81 0.59 2.76Dilution adjustments [a] (0.25) (0.09) (0.14)
Total direct portfolio transaction costs 0.56 0.50 2.62
Performance and charges % % %
Direct portfolio transaction costs [b] 0.06 0.05 0.41Operating charges [c] 1.69 1.68 1.69Return after operating charges +5.30 +13.12 +0.49Historic yield n/a 3.29 4.02Effect on yield of charges offset against capital 1.69 1.68 1.69
Other information
Closing NAV (€’000) 0 28 26Closing NAV percentage of total fund NAV (%) 0.00 0.00 0.00Number of shares 0 4,000 4,000Highest share price (Singapore ¢) 1,134.32 1,086.92 1,020.36Lowest share price (Singapore ¢) 1,068.18 942.85 889.13
Singapore dollar Class ‘A-H’ Accumulation share performanceThe share class was launched on 9 October 2015.
for the year to 30 April 2018 2017 2016Change in NAV per share Singapore ¢ Singapore ¢ Singapore ¢
Opening NAV 1,139.57 1,005.15 1,000.00
Return before operating charges and after directportfolio transaction costs 78.70 152.23 15.89
Operating charges (17.43) (17.81) (10.74)
Return after operating charges 61.27 134.42 5.15
Distributions (16.10) (21.79) (22.86)
Retained distributions 16.10 21.79 22.86
Return to shareholder as a resultof share class closure (1,200.84) n/a n/a
Closing NAV 0.00 1,139.57 1,005.15
Direct portfolio transaction costs Singapore ¢ Singapore ¢ Singapore ¢
Costs before dilution adjustments 0.87 0.61 2.79
Dilution adjustments [a] (0.27) (0.09) (0.14)
Total direct portfolio transaction costs 0.60 0.52 2.65
Performance and charges % % %
Direct portfolio transaction costs [b] 0.06 0.05 0.41
Operating charges [c] 1.70 1.69 1.69
Return after operating charges +5.38 +13.37 +0.51
Historic yield n/a 1.69 4.02
Effect on yield of charges offset against capital 0.02 0.02 1.69
Other information
Closing NAV (€’000) 0 30 26
Closing NAV percentage of total fund NAV (%) 0.00 0.00 0.00
Number of shares 0 4,001 4,001
Highest share price (Singapore ¢) 1,226.56 1,146.12 1,026.04
Lowest share price (Singapore ¢) 1,139.72 967.65 899.48
Singapore dollar Class ‘C-H’ Income share performanceThe share class was launched on 9 October 2015.
for the year to 30 April 2018 2017 2016Change in NAV per share Singapore ¢ Singapore ¢ Singapore ¢
Opening NAV 1,089.31 986.84 1,000.00
Return before operating charges and after directportfolio transaction costs 74.29 144.78 13.94
Operating charges (8.15) (8.56) (5.36)
Return after operating charges 66.14 136.22 8.58
Distributions (29.76) (33.75) (21.74)
Return to shareholder as a resultof share class closure (1,125.69) n/a n/a
Closing NAV 0.00 1,089.31 986.84
Direct portfolio transaction costs Singapore ¢ Singapore ¢ Singapore ¢
Costs before dilution adjustments 0.83 0.60 2.77
Dilution adjustments [a] (0.26) (0.09) (0.14)
Total direct portfolio transaction costs 0.57 0.51 2.63
Performance and charges % % %
Direct portfolio transaction costs [b] 0.06 0.05 0.41
Operating charges [c] 0.84 0.83 0.85
Return after operating charges +6.07 +13.80 +0.86
Historic yield n/a 3.11 3.73
Effect on yield of charges offset against capital 0.84 0.83 0.85
Other information
Closing NAV (€’000) 0 29 26
Closing NAV percentage of total fund NAV (%) 0.00 0.00 0.00
Number of shares 0 4,002 4,002
Highest share price (Singapore ¢) 1,156.36 1,100.06 1,021.39
Lowest share price (Singapore ¢) 1,085.44 948.34 891.47
ANNUAL LONG REPORT AND AUDITED FINANCIAL STATEMENTS • April 201818
M&G Income Allocation Fund Financial highlights
Specific share class performance

Singapore dollar Class ‘C-H’ Accumulation share performanceThe share class was launched on 9 October 2015.
for the year to 30 April 2018 2017 2016Change in NAV per share Singapore ¢ Singapore ¢ Singapore ¢
Opening NAV 1,151.56 1,008.87 1,000.00Return before operating charges and after directportfolio transaction costs 78.34 151.60 14.27
Operating charges (8.79) (8.91) (5.40)
Return after operating charges 69.55 142.69 8.87
Distributions (23.42) (27.74) (21.96)
Retained distributions 23.42 27.74 21.96
Return to shareholder as a resultof share class closure (1,221.11) n/a n/a
Closing NAV 0.00 1,151.56 1,008.87
Direct portfolio transaction costs Singapore ¢ Singapore ¢ Singapore ¢
Costs before dilution adjustments 0.88 0.61 2.79Dilution adjustments [a] (0.28) (0.09) (0.14)
Total direct portfolio transaction costs 0.60 0.52 2.65
Performance and charges % % %
Direct portfolio transaction costs [b] 0.06 0.05 0.41Operating charges [c] 0.84 0.84 0.85Return after operating charges +6.04 +14.14 +0.89Historic yield n/a 2.31 3.73Effect on yield of charges offset against capital 0.02 0.02 0.85
Other information
Closing NAV (€’000) 0 30 27Closing NAV percentage of total fund NAV (%) 0.00 0.00 0.00Number of shares 0 4,003 4,003Highest share price (Singapore ¢) 1,245.93 1,158.10 1,027.03Lowest share price (Singapore ¢) 1,152.13 972.32 901.52
Swiss franc Class ‘A-H’ Accumulation share performanceThe share class was launched on 7 November 2013.
for the year to 30 April 2018 2017 2016Change in NAV per share Swiss ¢ Swiss ¢ Swiss ¢Opening NAV 1,238.18 1,112.35 1,210.38Return before operating charges and after directportfolio transaction costs 62.70 146.08 (78.84)
Operating charges (18.87) (20.25) (19.19)
Return after operating charges 43.83 125.83 (98.03)
Distributions (17.38) (24.14) (43.62)
Retained distributions 17.38 24.14 43.62
Return to shareholder as a resultof share class closure (1,282.01) n/a n/a
Closing NAV 0.00 1,238.18 1,112.35
Direct portfolio transaction costs Swiss ¢ Swiss ¢ Swiss ¢Costs before dilution adjustments 0.94 0.69 4.89Dilution adjustments [a] (0.30) (0.10) (0.24)
Total direct portfolio transaction costs 0.64 0.59 4.65
Performance and charges % % %Direct portfolio transaction costs [b] 0.06 0.05 0.41Operating charges [c] 1.70 1.70 1.71Return after operating charges +3.54 +11.31 -8.10Historic yield n/a 1.71 4.06Effect on yield of charges offset against capital 0.03 0.03 1.71
Other information Closing NAV (€’000) 0 648 81Closing NAV percentage of total fund NAV (%) 0.00 0.07 0.01Number of shares 0 56,673 8,019Highest share price (Swiss ¢) 1,313.36 1,245.23 1,210.11Lowest share price (Swiss ¢) 1,232.65 1,068.37 1,000.36
Swiss franc Class ‘C-H’ Accumulation share performanceThe share class was launched on 7 November 2013.
for the year to 30 April 2018 2017 2016Change in NAV per share Swiss ¢ Swiss ¢ Swiss ¢
Opening NAV 1,265.34 1,128.91 1,219.06Return before operating charges and after directportfolio transaction costs 62.25 146.76 (80.45)
Operating charges (9.60) (10.33) (9.70)
Return after operating charges 52.65 136.43 (90.15)
Distributions (25.58) (31.18) (41.45)
Retained distributions 25.58 31.18 41.45
Return to shareholder as a resultof share class closure (1,317.99) n/a n/a
Closing NAV 0.00 1,265.34 1,128.91
Direct portfolio transaction costs Swiss ¢ Swiss ¢ Swiss ¢
Costs before dilution adjustments 0.96 0.70 4.90Dilution adjustments [a] (0.30) (0.11) (0.24)
Total direct portfolio transaction costs 0.66 0.59 4.66
Performance and charges % % %
Direct portfolio transaction costs [b] 0.06 0.05 0.41Operating charges [c] 0.85 0.85 0.86Return after operating charges +4.16 +12.09 -7.40Historic yield n/a 2.36 3.76Effect on yield of charges offset against capital 0.02 0.03 0.86
Other information
Closing NAV (€’000) 0 88 10Closing NAV percentage of total fund NAV (%) 0.00 0.01 0.00Number of shares 0 7,500 1,000Highest share price (Swiss ¢) 1,349.01 1,272.47 1,218.73Lowest share price (Swiss ¢) 1,262.70 1,084.93 1,012.97
US dollar Class ‘A-H’ Income share performanceThe share class was launched on 9 October 2015.
for the year to 30 April 2018 2017 2016Change in NAV per share US ¢ US ¢ US ¢
Opening NAV 1,070.71 978.13 1,000.00Return before operating charges and after directportfolio transaction costs 78.99 145.98 11.51
Operating charges (16.16) (18.17) (10.70)
Return after operating charges 62.83 127.81 0.81
Distributions (31.11) (35.23) (22.68)
Return to shareholder as a resultof share class closure (1,102.43) n/a n/a
Closing NAV 0.00 1,070.71 978.13
Direct portfolio transaction costs US ¢ US ¢ US ¢
Costs before dilution adjustments 0.80 0.62 2.77Dilution adjustments [a] (0.25) (0.09) (0.14)
Total direct portfolio transaction costs 0.55 0.53 2.63
Performance and charges % % %
Direct portfolio transaction costs [b] 0.06 0.05 0.41Operating charges [c] 1.70 1.70 1.69Return after operating charges +5.87 +13.07 +0.08Historic yield n/a 3.25 3.99Effect on yield of charges offset against capital 1.70 1.70 1.69
Other information
Closing NAV (€’000) 0 720 26Closing NAV percentage of total fund NAV (%) 0.00 0.08 0.00Number of shares 0 73,562 3,000Highest share price (US ¢) 1,133.13 1,081.61 1,019.12Lowest share price (US ¢) 1,064.89 937.13 884.64
ANNUAL LONG REPORT AND AUDITED FINANCIAL STATEMENTS • April 2018 19
M&G Income Allocation Fund Financial highlights
Specific share class performance

US dollar Class ‘A-H’ Accumulation share performanceThe share class was launched on 9 October 2015.
for the year to 30 April 2018 2017 2016Change in NAV per share US ¢ US ¢ US ¢
Opening NAV 1,134.29 1,000.82 1,000.00Return before operating charges and after directportfolio transaction costs 84.10 152.36 11.61Operating charges (17.20) (18.89) (10.79)
Return after operating charges 66.90 133.47 0.82
Distributions (16.13) (21.86) (22.89)
Retained distributions 16.13 21.86 22.89
Return to shareholder as a resultof share class closure (1,201.19) n/a n/a
Closing NAV 0.00 1,134.29 1,000.82
Direct portfolio transaction costs US ¢ US ¢ US ¢
Costs before dilution adjustments 0.86 0.64 2.81Dilution adjustments [a] (0.27) (0.10) (0.14)
Total direct portfolio transaction costs 0.59 0.54 2.67
Performance and charges % % %
Direct portfolio transaction costs [b] 0.06 0.05 0.41Operating charges [c] 1.70 1.70 1.69Return after operating charges +5.90 +13.34 +0.08Historic yield n/a 1.67 3.99Effect on yield of charges offset against capital 0.03 0.03 1.69
Other information
Closing NAV (€’000) 0 749 26Closing NAV percentage of total fund NAV (%) 0.00 0.08 0.00Number of shares 0 72,205 3,001Highest share price (US ¢) 1,224.78 1,140.09 1,024.51Lowest share price (US ¢) 1,134.35 961.70 894.60
US dollar Class ‘C-H’ Income share performanceThe share class was launched on 9 October 2015.
for the year to 30 April 2018 2017 2016Change in NAV per share US ¢ US ¢ US ¢
Opening NAV 1,084.90 982.74 1,000.00Return before operating charges and after directportfolio transaction costs 79.49 144.21 9.90Operating charges (8.15) (8.57) (5.38)
Return after operating charges 71.34 135.64 4.52
Distributions (29.69) (33.48) (21.78)
Return to shareholder as a resultof share class closure (1,126.55) n/a n/a
Closing NAV 0.00 1,084.90 982.74
Direct portfolio transaction costs US ¢ US ¢ US ¢
Costs before dilution adjustments 0.82 0.59 2.78Dilution adjustments [a] (0.26) (0.09) (0.14)
Total direct portfolio transaction costs 0.56 0.50 2.64
Performance and charges % % %
Direct portfolio transaction costs [b] 0.06 0.05 0.41Operating charges [c] 0.84 0.84 0.85Return after operating charges +6.58 +13.80 +0.45Historic yield n/a 3.08 3.69Effect on yield of charges offset against capital 0.84 0.84 0.85
Other information
Closing NAV (€’000) 0 30 26Closing NAV percentage of total fund NAV (%) 0.00 0.00 0.00Number of shares 0 3,002 3,002Highest share price (US ¢) 1,155.35 1,094.56 1,019.96Lowest share price (US ¢) 1,082.01 942.61 886.97
US dollar Class ‘C-H’ Accumulation share performanceThe share class was launched on 9 October 2015.
for the year to 30 April 2018 2017 2016Change in NAV per share US ¢ US ¢ US ¢
Opening NAV 1,145.46 1,004.52 1,000.00
Return before operating charges and after directportfolio transaction costs 84.88 149.85 9.94
Operating charges (8.78) (8.91) (5.42)
Return after operating charges 76.10 140.94 4.52
Distributions (23.42) (27.53) (21.98)
Retained distributions 23.42 27.53 21.98
Return to shareholder as a resultof share class closure (1,221.56) n/a n/a
Closing NAV 0.00 1,145.46 1,004.52
Direct portfolio transaction costs US ¢ US ¢ US ¢
Costs before dilution adjustments 0.88 0.61 2.81
Dilution adjustments [a] (0.28) (0.09) (0.14)
Total direct portfolio transaction costs 0.60 0.52 2.67
Performance and charges % % %
Direct portfolio transaction costs [b] 0.06 0.05 0.41
Operating charges [c] 0.85 0.84 0.85
Return after operating charges +6.64 +14.03 +0.45
Historic yield n/a 2.28 3.69
Effect on yield of charges offset against capital 0.02 0.02 0.85
Other information
Closing NAV (€’000) 0 31 27
Closing NAV percentage of total fund NAV (%) 0.00 0.00 0.00
Number of shares 0 3,003 3,003
Highest share price (US ¢) 1,244.37 1,151.84 1,025.48
Lowest share price (US ¢) 1,146.32 966.33 896.63
[a] In respect of direct portfolio transaction costs.
[b] As a percentage of average net asset value.
[c] The data for the operating charges figure is to 16 March 2018.
ANNUAL LONG REPORT AND AUDITED FINANCIAL STATEMENTS • April 201820
M&G Income Allocation Fund Financial highlights
Specific share class performance

Financial statements
Statement of total return
2018 2017for the year to 30 April Note €’000 €’000 €’000 €’000
Income
Net capital gains / (losses) 3 22,704 81,140
Revenue 5 31,570 33,175
Expenses 6 (14,345) (14,210) ______ ______Net revenue / (expense) beforetaxation 17,225 18,965
Taxation 7 (2,669) (2,981) ______ ______Net revenue / (expense) aftertaxation 14,556 15,984
Total return before distributions 37,260 97,124Distributions 8 (22,955) (25,043)
Change in net assets attributableto shareholders from investmentactivities 14,305 72,081
Statement of change in net assets attributable to shareholders
2018 2017for the year to 30 April €’000 €’000 €’000 €’000
Opening net assets attributable toshareholders 918,830 907,041Amounts received on issue of shares 454,832 85,012
Amounts paid on cancellation of shares (1,395,104) (153,769) _______ ______ (940,272) (68,757)
Dilution adjustments 636 260
Change in net assets attributable toshareholders from investment activities(see above) 14,305 72,081
Retained distributions on Accumulationshares 6,501 8,205
Closing net assets attributable toshareholders 0 918,830
Balance sheet
2018 2017as at 30 April Note €’000 €’000
Assets
Fixed assets Investments 0 899,635
Current assets Debtors 9 507 9,804
Cash and bank balances 10 1,014 14,930
Total assets 1,521 924,369
Liabilities Investment liabilities 0 (1,126)
Creditors Distribution payable 0 (2,562)
Other creditors 11 (1,521) (1,851)
Total liabilities (1,521) (5,539)
Net assets attributable to shareholders 0 918,830
Notes to the financial statements
1 Accounting policies
The financial statements have been prepared in accordance with the‘Summary of significant accounting policies’ set out on pages 7 and 8.
2 Distribution policy
In determining the amount available for reinvestment to Accumulationshares, all expenses with the exception of the annual managementcharge, administration charge, share class hedging charge andoverdraft interest are offset against capital, increasing the amountavailable for reinvestment whilst restraining capital performance toan equivalent extent. In determining the amount available fordistribution to Income shares, all expenses with the exception ofoverdraft interest are offset against capital, increasing the amountavailable for distribution whilst restraining capital performance to anequivalent extent.
3 Net capital gains / (losses) 2018 2017for the year to 30 April €’000 €’000
Non-derivative securities (7,289) 95,571
Derivative contracts 30,028 (8,694)
Currency gains / (losses) (103) (5,731)
Management charge rebates taken to capital 60 0
Administration charge rebates taken to capital 15 0
Transaction charges (7) (6)
Net capital gains / (losses) 22,704 81,140
ANNUAL LONG REPORT AND AUDITED FINANCIAL STATEMENTS • April 2018 21
M&G Income Allocation Fund Financial statements and notes

4 Portfolio transactions and associated costs
The following tables show portfolio transactions and their associatedtransaction costs. For more information about the nature of the costsplease see the section on ‘Operating charges and portfolio transactioncosts’ on page 15.
2018 % of 2017 % offor the year to 30 April €’000 transaction €’000 transaction
a) Purchases Equities Equities before transaction costs 408,459 239,034 Commissions 164 0.04 140 0.06Taxes 291 0.07 207 0.09
Equities after transaction costs 408,914 239,381
Debt securities [a] 302,915 152,210
Collective investment schemes 18,057 0
Other transaction types Corporate actions 4,254 0
Total purchases after transactioncosts 734,140 391,591
b) Sales Equities Equities before transaction costs 203,323 283,225 Commissions (109) 0.05 (142) 0.05Taxes (197) 0.10 (13) 0.00
Equities after transaction costs 203,017 283,070
Debt securities [a] 122,119 181,986
Other transaction types Corporate actions 6,831 5,132
Total sales after transaction costs 331,967 470,188
2018 % of 2017 % ofc) Direct portfolio transaction costs €’000 average NAV €’000 average NAV
Commissions paid Equities 273 0.03 282 0.03Taxes paid Equities 488 0.06 220 0.03
Total direct portfolio transactioncosts [b] 761 0.09 502 0.06
d) Indirect portfolio transaction costs % %
Portfolio dealing spread [c] 0.00 0.22
[a] These transaction types do not attract direct portfolio transaction costs.
[b] Costs before dilution adjustments. Please refer to the ‘Financial highlights’ sectionfor the effect of dilution adjustments.
[c] Average portfolio dealing spread at the balance sheet date.
5 Revenue 2018 2017for the year to 30 April €’000 €’000
Bank interest 17 6
Deposit interest (170) (104)
Distributions from collective investment schemes: taxable 734 305
Dividends from equity investments: non-taxable 12,330 12,793
Dividends from equity investments: taxable 1,387 813
Interest on debt securities 16,951 18,461
Stock dividends 321 886
Underwriting commission 0 15
Total revenue 31,570 33,175
6 Expenses 2018 2017for the year to 30 April €’000 €’000
Payable to the ACD or associate Annual management charge [a] 12,673 12,522
Administration charge [b] 1,355 1,302
Share class hedging charge 1 0
14,029 13,824
Payable to the Depositary or associate Depositary’s charge (including VAT) 51 54
Other expenses Audit fee (including VAT) 9 16
Interest payable 100 163
Legal fees 0 1
Safe custody charge 156 152
265 332
Total expenses 14,345 14,210
[a] This charge excludes management charge rebates received from M&G Securities
Limited, or an associate, in relation to the annual management charge of the
underlying collective investment schemes for which M&G Securities Limited, or
an associate, acts as Authorised Corporate Director.
These rebates have been recognised as capital in note 3 and amount to €60,000
(2017: €nil).
[b] This charge excludes administration charge rebates received from M&G Securities
Limited, or an associate, in relation to the administration charge of the underlying
collective investment schemes for which M&G Securities Limited, or an associate,
acts as Authorised Corporate Director.
These rebates have been recognised as capital in note 3 and amount to €15,000
(2017: €nil).
7 Taxation 2018 2017for the year to 30 April €’000 €’000
a) Analysis of charge in the year Corporation tax 589 1,008
Withholding tax 2,027 2,080
Current double taxation relief 0 (137)
Capital gains tax 61 0
Deferred tax (note 7c) ( 8) 30
Total taxation 2,669 2,981
b) Factors affecting taxation charge for the year Net revenue / (expense) before taxation 17,225 18,965
______ ______Corporation tax at 20% 3,445 3,793
Effects of:
Tax on management and administration chargerebates taken to capital 15 0
Dividends from equity investments: non-taxable ( 2,475) (2,559)
Stock dividends not taxable ( 64) (177)
Withholding tax 2,027 2,080
Total double taxation relief (340) (156)
Capital gains tax 61 0
Total tax charge (note 7a) 2,669 2,981
c) Provision for deferred taxation Provision at the start of the year 30 0
Deferred tax in profit and loss account (note 7a) (8) 30
Provision at the end of the year 22 30
ANNUAL LONG REPORT AND AUDITED FINANCIAL STATEMENTS • April 201822
M&G Income Allocation Fund Financial statements and notes
Notes to the financial statements

8 Distributions 2018 2017for the year to 30 April Inc [a] Acc [b] Inc [a] Acc [b]
Dividend distributions €’000 €’000 €’000 €’000
First interim 1,220 484 1,293 1,101
Second interim 1,342 562 1,232 1,014
Third interim 1,683 651 1,184 451
Fourth interim 1,345 653 1,130 372
Fifth interim 1,365 492 1,249 832
Sixth interim 1,851 516 1,321 492
Seventh interim 1,393 606 1,260 538
Eighth interim 1,489 606 1,290 622
Ninth interim 1,999 424 1,393 511
Tenth interim 1,471 780 1,455 830
Eleventh interim n/a n/a 1,488 542
Final 1,679 727 2,562 900
Total net distributions 23,338 25,062
Income deducted on cancellation of shares 155 205
Income received on issue of shares (538) (224)
Distributions 22,955 25,043
Net revenue / (expense) per statement oftotal return 14,556 15,984
Expenses offset against capital 8,353 9,059
Tax on management and administrationcharge rebates taken to capital (15) 0
Tax on short-term capital gains onoverseas securities 61 0
Distributions 22,955 25,043
[a] Distributions payable on Income shares.
[b] Retained distributions on Accumulation shares.
9 Debtors 2018 2017as at 30 April €’000 €’000
Amounts receivable on issues of shares 0 2,326
Currency deals outstanding 0 2
Debt security interest receivable 0 5,278
Dividends receivable 203 1,839
Withholding tax recoverable 304 359
Total debtors 507 9,804
10 Cash and bank balances 2018 2017as at 30 April €’000 €’000
Amounts held at futures clearing houses and collateral manager 0 600
Cash held as bank balances 1,014 14,330
Total cash and bank balances 1,014 14,930
11 Other creditors 2018 2017as at 30 April €’000 €’000
ACD’s annual management charge payable 0 649
Administration charge payable 0 68
Amounts payable on cancellation of shares 0 738
Corporation tax payable 290 303
Currency deals outstanding 0 2
Deferred taxation 22 30
Expenses payable 49 61
Balances due to M&G (Lux) Income Allocation Fund 1,160 0
Total other creditors 1,521 1,851
12 Contingent assets, liabilities and outstandingcommitments
There were no contingent assets, liabilities or outstandingcommitments at the balance sheet date (2017: same).
13 Shares in issue
The following table shows each class of share in issue during the year.Each share class has the same rights on winding up however theymay have different charging structures as set out in note 14.
Opening Movements ClosingShare class 01.05.17 Issued Cancelled 30.04.18
Euro Class ‘A’ Income 40,800,095 2,189,500 (42,989,595) 0
Class ‘A’ Accumulation 27,188,764 3,124,759 (30,313,523) 0
Class ‘A Q’ Income 1,464,198 2,334,383 (3,798,581) 0
Class ‘B Q’ Income 1,289,384 2,667,206 (3,956,590) 0
Class ‘B Q’ Accumulation 272,212 796,804 (1,069,016) 0
Class ‘C’ Income 3,338,820 7,278,047 (10,616,867) 0
Class ‘C’ Accumulation 3,307,715 16,659,631 (19,967,346) 0
Class ‘C Q’ Income 1,000 2,483 (3,483) 0
Singapore dollar Class ‘A-H’ Income 4,000 0 (4,000) 0
Class ‘A-H’ Accumulation 4,001 0 (4,001) 0
Class ‘C-H’ Income 4,002 0 (4,002) 0
Class ‘C-H’ Accumulation 4,003 0 (4,003) 0
Swiss franc Class ‘A-H’ Accumulation 56,673 4,351 (61,024) 0
Class ‘C-H’ Accumulation 7,500 10,833 (18,333) 0
US dollar Class ‘A-H’ Income 73,562 616,738 (690,300) 0
Class ‘A-H’ Accumulation 72,205 1,170,500 (1,242,705) 0
Class ‘C-H’ Income 3,002 2,000 (5,002) 0
Class ‘C-H’ Accumulation 3,003 410 (3,413) 0
14 Charging structure
The table below sets out the charging structure for each class of share.The charging structure is the same for both Income and Accumulationshares of each class. Annual Share class Entry Exit management hedging charge charge charge chargeShare class % % % %
Euro Class ‘A’ 4.00 n/a 1.50 n/a
Class ‘A Q’ 4.00 n/a 1.50 n/a
Class ‘B Q’ 1.25 n/a 2.00 n/a
Class ‘C’ 1.25 n/a 0.65 n/a
Class ‘C Q’ 1.25 n/a 0.65 n/a
Singapore dollar Class ‘A-H’ 4.00 n/a 1.50 [a]
Class ‘C-H’ 1.25 n/a 0.65 [a]
Swiss franc Class ‘A-H’ 4.00 n/a 1.50 [a]
Class ‘C-H’ 1.25 n/a 0.65 [a]
US dollar Class ‘A-H’ 4.00 n/a 1.50 [a]
Class ‘C-H’ 1.25 n/a 0.65 [a]
[a] This charge may vary between 0.01% and 0.055%.
ANNUAL LONG REPORT AND AUDITED FINANCIAL STATEMENTS • April 2018 23
M&G Income Allocation Fund Financial statements and notes
Notes to the financial statements

15 Related parties
M&G Securities Limited, as Authorised Corporate Director (ACD), is arelated party and acts as principal on all the transactions of shares inthe fund except with in specie transactions, where M&G SecuritiesLimited acts as an agent. The aggregate monies received throughissues, and paid on cancellations, are disclosed in the ‘Statement ofchange in net assets attributable to shareholders’ and note 8. Amountsdue to / from M&G Securities Limited in respect of share transactionsat the year end are disclosed in notes 9 and 11 where applicable.
Amounts paid to M&G Securities Limited in respect of the ACD’sannual management charge, administration charge and share classhedging charge are disclosed in note 6. Amounts due at the year endin respect of the ACD’s annual management charge, administrationcharge and share class hedging charge are disclosed in note 11.
Amounts paid to M&G Securities Limited in respect of rebatearrangements for the ACD’s annual management charge andadministration charge are disclosed in note 3 on page 21.
At the balance sheet date, there were no material shareholders fromwithin Prudential plc, of which M&G Securities Limited is a whollyowned subsidiary (2017: same).
16 Events after the balance sheet date
There were no events after the balance sheet date to disclose.
17 Fair value analysis
Financial instruments have been measured at their fair value and havebeen classified below using a hierarchy that reflects the significanceof the inputs used in measuring their fair value:
Level 1: Unadjusted quoted price in an active market for anidentical instrument
This includes instruments such as publicly traded equities; highly liquidbonds (e.g. Government bonds) and exchange traded derivatives (e.g.futures) for which quoted prices are readily and regularly available.
Level 2: Valuation technique using observable market data
This includes instruments such as over-the-counter (OTC) derivatives,debt securities, convertible bonds, mortgage-backed securities, asset-backed securities and open-ended funds which have been valuedusing models with observable market data inputs.
Level 3: Valuation technique using unobservable inputs
This refers to instruments which have been valued using models withunobservable data inputs. This includes single broker-pricedinstruments, suspended/unquoted securities, private equity, unlistedclosed-ended funds and open-ended funds with restrictions onredemption rights. However no such financial instruments were held.
Assets Liabilities Assets Liabilitiesas at 30 April 2018 2018 2017 2017Basis of valuation €’000 €’000 €’000 €’000
Level 1 0 0 579,987 0
Level 2 0 0 319,648 (1,126)
Level 3 0 0 0 0
0 0 899,635 (1,126)
As the fund no longer has any investment assets there is no fair valueexposure.
18 Risk management policies
The general risk management policies for the fund are set out in note3 to the financial statements on pages 8 and 9.
19 Market risk sensitivity and exposure
VaR is the risk measurement methodology used to assess the fund’sleverage and market risk volatility. When VaR is calculated as apercentage of the net asset value it may not be greater than the VaRlimit set for the fund.
The VaR limit set during the financial year to 30 April 2018 was 11%(2017: 11%).
The lowest, highest and average VaR calculated during the financialyears ended 30 April 2018 and 30 April 2017 are disclosed in the tablebelow. 2018 [a] 2017for the year to 30 April % %
Lowest 2.99 3.81
Highest 4.03 7.05
Average 3.39 5.42
[a] The fund merged and therefore closed on 16 March 2018.
The lowest, highest and average utilisation of VaR is with reference tothe limit above. 2018 2017 Utilisation of Utilisation of 2018 [a] upper limit VaR [b] 2017 upper limit VaR [b]
for the year to 30 April % of VaR 11% % of VaR 11%
Lowest 2.99 27.22 3.81 34.63
Highest 4.03 36.67 7.05 64.10
Average 3.39 30.80 5.42 49.26
[a] The fund merged into the M&G (Lux) Income Allocation Fund and therefore closed
on 16 March 2018.
[b] The VaR on the fund has been divided by its maximum limit.
As the fund no longer has any investment assets there is no exposure to market risk
sensitivity.
20 Credit risk
The fund is exposed to credit risk both through the credit quality of theinvestments it holds and through the derivative positions withcounterparties. The table below shows the credit quality of theinvestments held in the portfolio. 2018 2017as at 30 April €’000 €’000
Investment grade securities 0 269,039
Below investment grade securities 0 131,335
Unrated securities 0 9,389
Other investments 0 488,746
Total 0 898,509
As the fund no longer has any investment assets there is no exposure to credit risk.
ANNUAL LONG REPORT AND AUDITED FINANCIAL STATEMENTS • April 201824
M&G Income Allocation Fund Financial statements and notes
Notes to the financial statements

The table below shows the exposure to counterparties. Collateral isposted daily, in the form of cash or high-quality government bonds, tominimise this exposure. Forward currency Swaps contractsas at 30 April 2017 €’000 €’000
BNP Paribas (174) 0
Citigroup 0 892
Goldman Sachs 0 (25)
HSBC 0 404
National Australia Bank 0 (374)
State Street Bank 0 2,456
UBS 0 2,994
Total (174) 6,347
Net exposure represents the mark-to-market value of derivative contracts less any
cash collateral held. Positive exposure represents the fund’s exposure to that
counterparty. Negative amounts are not an exposure to the fund.
21 Leverage risk
Funds using VaR approaches are required to disclose the level ofleverage employed during the financial reporting period.
Derivatives can be used by the fund to generate market exposure toinvestments exceeding the net asset value. As a result of thisexposure, the size of any positive or negative movement in marketsmay have a more significant effect on the net asset value of the fund.
The lowest, highest and average level of leverage employed andutilisation of the leverage level calculated during the financial yearsended 30 April 2018 and 30 April 2017 are disclosed in the table below.
2018 2018 2017 2017for the year to 30 April €’000 [a] % [a] €’000 [a] % [a]
Lowest 132,861 392 1,052,384 122
Highest 293,890 392 1,551,395 174
Average 180,694 271 1,153,227 132
[a] Global exposure stated as gross notional. Expressed as a percentage over fund
valuation.
The fund merged into the M&G (Lux) Income Allocation Fund and therefore closed
on 16 March 2018.
As the fund no longer has any investment assets there is no exposure to leverage
risk.
22 Exchange rate risk for hedged share classes
This fund contains hedged share classes. These share classesoperate currency hedges designed to reduce the impact of exchangerates in certain circumstances. As a result, profit and loss on thecurrency hedges may impact the liquidity of the overall fund. On a dayto day basis this is monitored using reporting from the outsourcedprovider of the hedged share class service. On an ongoing basis thesize of the hedged share classes is monitored to ensure thatunforeseen exchange rate volatility can be adequately managedwithout significantly impacting all shareholders.
23 Dividend distribution tables
This fund pays both monthly and quarterly ordinary distributionsdepending on the share class. The following tables set out thedistribution periods applicable.
Monthly distribution periods Start End Xd Payment
First interim 01.05.17 31.05.17 01.06.17 30.06.17
Second interim 01.06.17 30.06.17 03.07.17 31.07.17
Third interim 01.07.17 31.07.17 01.08.17 31.08.17
Fourth interim 01.08.17 31.08.17 01.09.17 30.09.17
Fifth interim 01.09.17 30.09.17 02.10.17 31.10.17
Sixth interim 01.10.17 31.10.17 01.11.17 30.11.17
Seventh interim 01.11.17 30.11.17 01.12.17 31.12.17
Eighth interim 01.12.17 31.12.17 02.01.18 31.01.18
Ninth interim 01.01.18 31.01.18 01.02.18 28.02.18
Tenth interim 01.02.18 28.02.18 01.03.18 31.03.18
Eleventh interim n/a n/a n/a n/a
Final 01.03.18 16.03.18 16.03.18 26.04.18
Quarterly distribution periods Start End Xd Payment
First interim 01.05.17 31.07.17 01.08.17 30.09.17
Second interim 01.08.17 31.10.17 01.11.17 31.12.17
Third interim 01.11.17 31.01.18 01.02.18 31.03.18
Final 01.02.18 16.03.18 16.03.18 26.04.18
The following tables set out for each distribution the rates per sharefor both Group 1 and Group 2 shares.
Group 1 shares are those purchased prior to a distribution period andtherefore their income rate is the same as the distribution rate.
Group 2 shares are those purchased during a distribution period andtherefore their distribution rate is made up of income and equalisation.Equalisation is the average amount of income included in thepurchase price of all Group 2 shares and is refunded to the holders ofthese shares as a return of capital. Being capital it is not liable toIncome Tax. Instead, it must be deducted from the cost of shares forCapital Gains Tax purposes. The tables below show the split of theGroup 2 rates into the income and equalisation components.
As a result of the merger of M&G Income Allocation fund into M&G(Lux) Income Allocation Fund on 16 March 2018, any income availablefor distribution up to the effective date of the merger was paid as afinal distribution to shareholders on 26 April 2018.
Euro Class ‘A’ Income shares
Ordinary distributions Group 2 Group 1 & 2for the year Income Equalisation Distributionto 30 April 2018 2018 2018 2017
¢ ¢ ¢ ¢First interim 1.0915 1.6236 2.7151 2.8151
Second interim 1.1064 1.8296 2.9360 2.7438
Third interim 0.8704 2.0432 2.9136 2.5474
Fourth interim 0.9344 1.9668 2.9012 2.5606
Fifth interim 0.7006 2.2180 2.9186 2.8442
Sixth interim 0.6196 2.3446 2.9642 2.8709
Seventh interim 0.5893 2.3804 2.9697 2.9064
Eighth interim 0.9770 2.0124 2.9894 2.9759
Ninth interim 0.6866 2.3332 3.0198 2.9406
Tenth interim 0.5130 2.4608 2.9738 3.3278
Eleventh interim n/a n/a n/a 3.3665
Final 0.6711 2.1340 2.8051 5.1820
ANNUAL LONG REPORT AND AUDITED FINANCIAL STATEMENTS • April 2018 25
M&G Income Allocation Fund Financial statements and notes
Notes to the financial statements
20 Credit risk (continued)
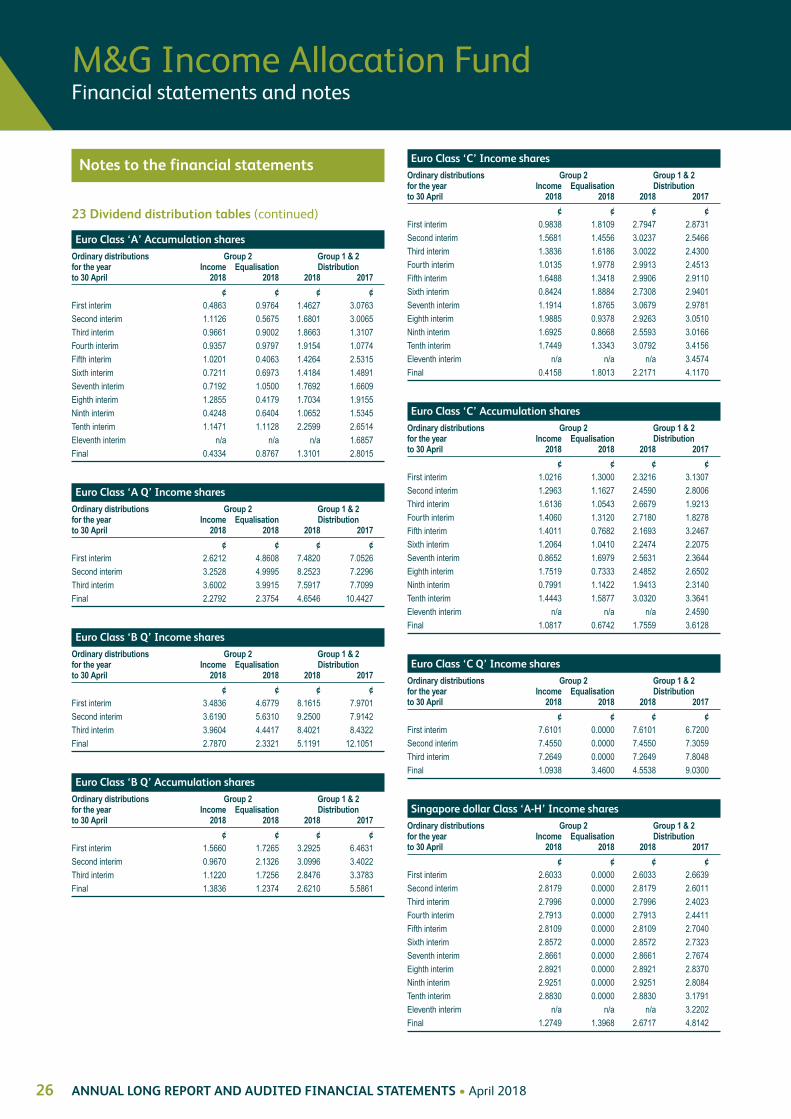
Euro Class ‘A’ Accumulation shares
Ordinary distributions Group 2 Group 1 & 2for the year Income Equalisation Distributionto 30 April 2018 2018 2018 2017
¢ ¢ ¢ ¢First interim 0.4863 0.9764 1.4627 3.0763
Second interim 1.1126 0.5675 1.6801 3.0065
Third interim 0.9661 0.9002 1.8663 1.3107
Fourth interim 0.9357 0.9797 1.9154 1.0774
Fifth interim 1.0201 0.4063 1.4264 2.5315
Sixth interim 0.7211 0.6973 1.4184 1.4891
Seventh interim 0.7192 1.0500 1.7692 1.6609
Eighth interim 1.2855 0.4179 1.7034 1.9155
Ninth interim 0.4248 0.6404 1.0652 1.5345
Tenth interim 1.1471 1.1128 2.2599 2.6514
Eleventh interim n/a n/a n/a 1.6857
Final 0.4334 0.8767 1.3101 2.8015
Euro Class ‘A Q’ Income shares
Ordinary distributions Group 2 Group 1 & 2for the year Income Equalisation Distributionto 30 April 2018 2018 2018 2017
¢ ¢ ¢ ¢First interim 2.6212 4.8608 7.4820 7.0526
Second interim 3.2528 4.9995 8.2523 7.2296
Third interim 3.6002 3.9915 7.5917 7.7099
Final 2.2792 2.3754 4.6546 10.4427
Euro Class ‘B Q’ Income shares
Ordinary distributions Group 2 Group 1 & 2for the year Income Equalisation Distributionto 30 April 2018 2018 2018 2017
¢ ¢ ¢ ¢First interim 3.4836 4.6779 8.1615 7.9701
Second interim 3.6190 5.6310 9.2500 7.9142
Third interim 3.9604 4.4417 8.4021 8.4322
Final 2.7870 2.3321 5.1191 12.1051
Euro Class ‘B Q’ Accumulation shares
Ordinary distributions Group 2 Group 1 & 2for the year Income Equalisation Distributionto 30 April 2018 2018 2018 2017
¢ ¢ ¢ ¢First interim 1.5660 1.7265 3.2925 6.4631
Second interim 0.9670 2.1326 3.0996 3.4022
Third interim 1.1220 1.7256 2.8476 3.3783
Final 1.3836 1.2374 2.6210 5.5861
Euro Class ‘C’ Income shares
Ordinary distributions Group 2 Group 1 & 2for the year Income Equalisation Distributionto 30 April 2018 2018 2018 2017
¢ ¢ ¢ ¢First interim 0.9838 1.8109 2.7947 2.8731
Second interim 1.5681 1.4556 3.0237 2.5466
Third interim 1.3836 1.6186 3.0022 2.4300
Fourth interim 1.0135 1.9778 2.9913 2.4513
Fifth interim 1.6488 1.3418 2.9906 2.9110
Sixth interim 0.8424 1.8884 2.7308 2.9401
Seventh interim 1.1914 1.8765 3.0679 2.9781
Eighth interim 1.9885 0.9378 2.9263 3.0510
Ninth interim 1.6925 0.8668 2.5593 3.0166
Tenth interim 1.7449 1.3343 3.0792 3.4156
Eleventh interim n/a n/a n/a 3.4574
Final 0.4158 1.8013 2.2171 4.1170
Euro Class ‘C’ Accumulation shares
Ordinary distributions Group 2 Group 1 & 2for the year Income Equalisation Distributionto 30 April 2018 2018 2018 2017
¢ ¢ ¢ ¢First interim 1.0216 1.3000 2.3216 3.1307
Second interim 1.2963 1.1627 2.4590 2.8006
Third interim 1.6136 1.0543 2.6679 1.9213
Fourth interim 1.4060 1.3120 2.7180 1.8278
Fifth interim 1.4011 0.7682 2.1693 3.2467
Sixth interim 1.2064 1.0410 2.2474 2.2075
Seventh interim 0.8652 1.6979 2.5631 2.3644
Eighth interim 1.7519 0.7333 2.4852 2.6502
Ninth interim 0.7991 1.1422 1.9413 2.3140
Tenth interim 1.4443 1.5877 3.0320 3.3641
Eleventh interim n/a n/a n/a 2.4590
Final 1.0817 0.6742 1.7559 3.6128
Euro Class ‘C Q’ Income shares
Ordinary distributions Group 2 Group 1 & 2for the year Income Equalisation Distributionto 30 April 2018 2018 2018 2017
¢ ¢ ¢ ¢First interim 7.6101 0.0000 7.6101 6.7200
Second interim 7.4550 0.0000 7.4550 7.3059
Third interim 7.2649 0.0000 7.2649 7.8048
Final 1.0938 3.4600 4.5538 9.0300
Singapore dollar Class ‘A-H’ Income shares
Ordinary distributions Group 2 Group 1 & 2for the year Income Equalisation Distributionto 30 April 2018 2018 2018 2017
¢ ¢ ¢ ¢First interim 2.6033 0.0000 2.6033 2.6639
Second interim 2.8179 0.0000 2.8179 2.6011
Third interim 2.7996 0.0000 2.7996 2.4023
Fourth interim 2.7913 0.0000 2.7913 2.4411
Fifth interim 2.8109 0.0000 2.8109 2.7040
Sixth interim 2.8572 0.0000 2.8572 2.7323
Seventh interim 2.8661 0.0000 2.8661 2.7674
Eighth interim 2.8921 0.0000 2.8921 2.8370
Ninth interim 2.9251 0.0000 2.9251 2.8084
Tenth interim 2.8830 0.0000 2.8830 3.1791
Eleventh interim n/a n/a n/a 3.2202
Final 1.2749 1.3968 2.6717 4.8142
ANNUAL LONG REPORT AND AUDITED FINANCIAL STATEMENTS • April 201826
M&G Income Allocation Fund Financial statements and notes
Notes to the financial statements
23 Dividend distribution tables (continued)

Singapore dollar Class ‘A-H’ Accumulation shares
Ordinary distributions Group 2 Group 1 & 2for the year Income Equalisation Distributionto 30 April 2018 2018 2018 2017
¢ ¢ ¢ ¢First interim 1.2938 0.0000 1.2938 2.7266
Second interim 1.4847 0.0000 1.4847 2.6695
Third interim 1.7050 0.0000 1.7050 1.1369
Fourth interim 1.7407 0.0000 1.7407 0.9538
Fifth interim 1.2616 0.0000 1.2616 2.2335
Sixth interim 1.2546 0.0000 1.2546 1.2574
Seventh interim 1.5916 0.0000 1.5916 1.5041
Eighth interim 1.5371 0.0000 1.5371 1.6631
Ninth interim 0.9820 0.0000 0.9820 1.3824
Tenth interim 2.0509 0.0000 2.0509 2.2991
Eleventh interim n/a n/a n/a 1.5012
Final 0.6341 0.5633 1.1974 2.4601
Singapore dollar Class ‘C-H’ Income shares
Ordinary distributions Group 2 Group 1 & 2for the year Income Equalisation Distributionto 30 April 2018 2018 2018 2017
¢ ¢ ¢ ¢First interim 2.4193 0.0000 2.4193 2.6780
Second interim 2.8592 0.0000 2.8592 2.3828
Third interim 2.8424 0.0000 2.8424 2.2508
Fourth interim 2.8360 0.0000 2.8360 2.3032
Fifth interim 2.8576 0.0000 2.8576 2.7260
Sixth interim 2.7205 0.0000 2.7205 2.7562
Seventh interim 2.9062 0.0000 2.9062 2.7933
Eighth interim 2.7866 0.0000 2.7866 2.8651
Ninth interim 2.4642 0.0000 2.4642 2.8378
Tenth interim 2.9424 0.0000 2.9424 3.2141
Eleventh interim n/a n/a n/a 3.2576
Final 1.2320 0.8928 2.1248 3.6849
Singapore dollar Class ‘C-H’ Accumulation shares
Ordinary distributions Group 2 Group 1 & 2for the year Income Equalisation Distributionto 30 April 2018 2018 2018 2017
¢ ¢ ¢ ¢First interim 2.0201 0.0000 2.0201 2.7384
Second interim 2.1656 0.0000 2.1656 2.4441
Third interim 2.3928 0.0000 2.3928 1.6582
Fourth interim 2.4296 0.0000 2.4296 1.6011
Fifth interim 1.9055 0.0000 1.9055 2.8296
Sixth interim 1.9807 0.0000 1.9807 1.8710
Seventh interim 2.2739 0.0000 2.2739 2.1082
Eighth interim 2.2061 0.0000 2.2061 2.2887
Ninth interim 1.7478 0.0000 1.7478 2.0611
Tenth interim 2.7163 0.0000 2.7163 2.8902
Eleventh interim n/a n/a n/a 2.1659
Final 0.9900 0.5957 1.5857 3.0859
Swiss franc Class ‘A-H’ Accumulation shares
Ordinary distributions Group 2 Group 1 & 2for the year Income Equalisation Distributionto 30 April 2018 2018 2018 2017
¢ ¢ ¢ ¢First interim 1.4118 0.0000 1.4118 3.0142
Second interim 1.6202 0.0000 1.6202 2.9468
Third interim 1.8524 0.0000 1.8524 1.1928
Fourth interim 1.9273 0.0000 1.9273 1.0427
Fifth interim 1.3728 0.0000 1.3728 2.4580
Sixth interim 1.3752 0.0000 1.3752 1.4363
Seventh interim 1.7270 0.0000 1.7270 1.5659
Eighth interim 1.4271 0.2247 1.6518 1.8354
Ninth interim 0.6809 0.3323 1.0132 1.4814
Tenth interim 1.2726 0.8838 2.1564 2.5632
Eleventh interim n/a n/a n/a 1.6450
Final 1.2732 0.0000 1.2732 2.9546
Swiss franc Class ‘C-H’ Accumulation shares
Ordinary distributions Group 2 Group 1 & 2for the year Income Equalisation Distributionto 30 April 2018 2018 2018 2017
¢ ¢ ¢ ¢First interim 2.2189 0.0000 2.2189 3.0593
Second interim 2.3745 0.0000 2.3745 2.6878
Third interim 2.6338 0.0000 2.6338 1.8250
Fourth interim 2.7083 0.0000 2.7083 1.7730
Fifth interim 0.0000 2.0940 2.0940 3.1680
Sixth interim 2.1960 0.0000 2.1960 2.1010
Seventh interim 2.4624 0.0000 2.4624 2.3340
Eighth interim 2.2491 0.1599 2.4090 2.5300
Ninth interim 1.8594 0.0000 1.8594 2.4410
Tenth interim 2.9036 0.0000 2.9036 3.2227
Eleventh interim n/a n/a n/a 2.3713
Final 1.0777 0.6440 1.7217 3.6706
US dollar Class ‘A-H’ Income shares
Ordinary distributions Group 2 Group 1 & 2for the year Income Equalisation Distributionto 30 April 2018 2018 2018 2017
¢ ¢ ¢ ¢First interim 1.1906 1.4007 2.5913 2.6504
Second interim 1.3518 1.4552 2.8070 2.5868
Third interim 0.0876 2.7024 2.7900 2.3872
Fourth interim 0.4253 2.3574 2.7827 2.4207
Fifth interim 0.5454 2.2581 2.8035 2.6907
Sixth interim 0.1947 2.6562 2.8509 2.7191
Seventh interim 0.4497 2.4115 2.8612 2.7533
Eighth interim 0.2315 2.6562 2.8877 2.8211
Ninth interim 0.4689 2.4531 2.9220 2.7915
Tenth interim 1.2919 1.5908 2.8827 3.1612
Eleventh interim n/a n/a n/a 3.2044
Final 0.9308 1.9964 2.9272 5.0459
ANNUAL LONG REPORT AND AUDITED FINANCIAL STATEMENTS • April 2018 27
M&G Income Allocation Fund Financial statements and notes
Notes to the financial statements
23 Dividend distribution tables (continued)

US dollar Class ‘A-H’ Accumulation shares
Ordinary distributions Group 2 Group 1 & 2for the year Income Equalisation Distributionto 30 April 2018 2018 2018 2017
¢ ¢ ¢ ¢First interim 0.2464 1.0905 1.3369 2.7125
Second interim 0.9659 0.5419 1.5078 2.6546
Third interim 0.7390 0.9737 1.7127 1.1226
Fourth interim 0.7574 1.0011 1.7585 0.9537
Fifth interim 0.6198 0.6362 1.2560 2.2154
Sixth interim 0.4326 0.8092 1.2418 1.2227
Seventh interim 0.8415 0.7432 1.5847 1.4865
Eighth interim 0.2378 1.3015 1.5393 1.6118
Ninth interim 0.5873 0.3962 0.9835 1.3851
Tenth interim 1.0077 1.0088 2.0165 2.2792
Eleventh interim n/a n/a n/a 1.5238
Final 0.2559 0.9412 1.1971 2.6915
US dollar Class ‘C-H’ Income shares
Ordinary distributions Group 2 Group 1 & 2for the year Income Equalisation Distributionto 30 April 2018 2018 2018 2017
¢ ¢ ¢ ¢First interim 2.4083 0.0000 2.4083 2.6645
Second interim 2.8480 0.0000 2.8480 2.3514
Third interim 2.8325 0.0000 2.8325 2.2534
Fourth interim 2.8275 0.0000 2.8275 2.2825
Fifth interim 2.8501 0.0000 2.8501 2.7126
Sixth interim 2.6861 0.0000 2.6861 2.7430
Seventh interim 2.8960 0.0000 2.8960 2.7792
Eighth interim 2.7982 0.0000 2.7982 2.8492
Ninth interim 2.4747 0.0000 2.4747 2.8206
Tenth interim 2.9425 0.0000 2.9425 3.1957
Eleventh interim n/a n/a n/a 3.2407
Final 1.2565 0.8727 2.1292 3.5866
US dollar Class ‘C-H’ Accumulation shares
Ordinary distributions Group 2 Group 1 & 2for the year Income Equalisation Distributionto 30 April 2018 2018 2018 2017
¢ ¢ ¢ ¢First interim 2.0007 0.0000 2.0007 2.7241
Second interim 2.1737 0.0000 2.1737 2.4136
Third interim 2.4121 0.0000 2.4121 1.6680
Fourth interim 2.4382 0.0000 2.4382 1.5944
Fifth interim 1.8985 0.0000 1.8985 2.8066
Sixth interim 1.9706 0.0000 1.9706 1.8344
Seventh interim 2.2679 0.0000 2.2679 2.0390
Eighth interim 2.2176 0.0000 2.2176 2.2274
Ninth interim 1.7675 0.0000 1.7675 2.0812
Tenth interim 2.6900 0.0000 2.6900 2.8782
Eleventh interim n/a n/a n/a 2.1841
Final 0.9960 0.5917 1.5877 3.0792
ANNUAL LONG REPORT AND AUDITED FINANCIAL STATEMENTS • April 201828
M&G Income Allocation Fund Financial statements and notes
Notes to the financial statements
23 Dividend distribution tables (continued)

Investment objective up to fundclosure on 16 March 2018
The fund aims to deliver a positive total return in any three year periodfrom a flexibly managed portfolio of global assets. There is noguarantee that the fund will achieve a positive return over this, or anyother, period and investors may not recoup the original amount they invested.
Investment policy up to fund closureon 16 March 2018
The fund may invest in a range of fixed income assets, equities,collective investment schemes, other transferable securities, cash andnear cash, deposits, warrants and money market instruments.Derivatives may also be used, for both hedging and investmentpurposes.
Asset allocation is central to the fund’s investment philosophy and isbased on the fund manager’s macroeconomic outlook, asset classvaluations and active risk management in portfolio construction. Thefund seeks to manage risk by investing globally in multiple assetclasses. As such the portfolio may be diversified across asset classes,sectors, currencies and countries although, at the fund manager’sdiscretion, there may be some periods where the portfolio will have ahigher than usual concentration of asset or market exposure. The fundwill not have the majority of its assets in equities.
The fund seeks to participate in a variety of rising asset values;however, capital preservation will be central to the fund’s strategy. Thefund manager may use derivatives strategies to create value throughadditional asset exposure and/or where these may help to manageportfolio risk.
Investment approach up to fundclosure on 16 March 2018
The fund managers believe that the fund’s highly flexible investmentapproach has the potential to deliver returns of 3-6% per annum onaverage over the medium term (over three to five years), with anannualised volatility in returns of between 3% and 7%. (Volatilitymeasures the degree to which a given security, fund, or index rapidlychanges. It is calculated as the degree of deviation from the norm forthat type of investment over a given time period. The higher thevolatility, the riskier the security tends to be.)
The fund will normally invest within the following net allocation ranges:0-35% of its assets in equities, 0-100% in fixed income securities(excluding cash and cash equivalents) and up to 20% in other assets,which can include indirect exposure to property and convertibles (fixedincome investments that have the right to be converted into apredetermined number of company shares). The fund managers willactively manage the fund’s foreign currency exposure to seek toenhance returns. At least 60% of the fund will be held in euro assets.The fund’s investment strategy may involve the use of financialinstruments to take short positions, that is, positions that profit from afall in the price of an asset.
Risk profile up to fund closure on 16 March 2018
The fund invests globally in a broad range of assets, includingcompany shares (equities), fixed income securities (bonds), currenciesand other assets such as property shares and convertible bonds. Thefund is, therefore, subject to the price volatility of global financial andcurrency markets. Exposure to the different asset classes may begained through the use of derivatives.
In association with the use of derivatives, including those instrumentsnot traded through an exchange, collateral is deposited in order tomitigate the risk that a counterparty may default on its obligations orbecome insolvent.
The fund adopts a flexible approach to the allocation of capitalbetween asset classes in response to changes in economic conditionsand the valuation of assets, and the managers will seek to maximiseportfolio diversity wherever possible. However, in cases where themanagers believe that the opportunities are limited to a few areas,there may be higher-than-usual concentration of asset or marketexposure. Such strategies may result in higher volatility of the fund’sshort-term performance.
The following table shows the risk number associated with the fundand is based on Euro Class ‘A’ shares.
The above number:
• is based on the rate at which the value of the fund has moved up and down in the
past and is based on historical data so may not be a reliable indicator of the future
risk profile of the fund.
• is not guaranteed and may change over time and the lowest risk number does not
mean risk free.
• has not changed during this period.
Investment review
As at 1 May 2018, for the period from 2 May 2017 to16 March 2018
Performance against objective
Between 2 May 2017 (the start of the review period) and 16 March 2018,when it was merged into a Luxembourg-authorised SICAV, the M&GPrudent Allocation Fund delivered a positive total return (the combinationof income and growth of capital) across all of its share classes*.
From 1 May 2015 until it was merged into the Luxembourg-authorisedSICAV on 16 March 2018, the fund had achieved its aim of deliveringa positive total return.
* For the performance of each share class, please refer to the ‘Long-term
performance by share class’ table in the ‘Fund performance’ section of this report.
Please note that the performance data covers the period from 2 May 2017 until
16 March 2018, not for the full reporting period, due to the fund merging.
Low risk High risk
Typically lower rewards Typically higher rewards
1 2 3 4 5 6 7
ANNUAL LONG REPORT AND AUDITED FINANCIAL STATEMENTS • April 2018 29
M&G Prudent Allocation Fund Authorised Corporate Director’s Report

Investment performance
Global equities – company shares, which represent ownership stakesin companies – initially advanced over the period under review,supported by an upswing in global economic data and companyearnings. However, towards the beginning of 2018, the situationabruptly reversed as investors grew worried about rising interest rates,the potential for a trade war initiated by US president Donald Trumpand the possibility of regulation for leading technology firms. This wasreflected in the performance of company shares globally, which tendto do well when the global economy is growing, but can experienceturbulence when market uncertainty increases.
Similarly, global bond markets experienced mixed performance as,despite growing investor confidence, the period saw bonds issued bysome developed market governments at times fall out of favour. Bondsecurities – which are essentially loans extended by investors togovernments and companies in exchange for regular interestpayments – are often considered ‘safe’ given the high creditworthinessof their issuers. They therefore tend to underperform when investorsentiment over the health of the global economy improves, as theirlower risk attributes are less in demand, and vice versa. However,when volatility re-emerged in January, bonds did not act as a ‘safehaven’ as had historically been the case.
The environment that prevailed for most of the period largely provedbeneficial for the fund, which was positioned in favour of equities overbonds, based on observations of relative valuation signals and signsof global economic growth. However, this positioning dragged onperformance during the bouts of volatility at the end of the period.
Nonetheless, most of the gains came from equity positions, wherenotable value was added through the fund’s exposure to Europe, asthe region saw concerted economic growth. Positions in Asia Pacificex Japan, in particular South Korea, which held up well despite politicalturbulence in the region towards the end of the period, also addedsignificantly to gains. Holdings of banking stocks generated goodreturns as well, while Japanese equities rallied as corporateconfidence improved. Short exposure (a position designed to benefitfrom a fall in the value of the stocks) to the S&P 500 Index detracted,as the index reached new highs.
The fund’s exposure to bonds added to performance overall, althoughthe fund’s positioning designed to benefit from a fall in the value ofbonds issued by the Western governments detracted fromperformance. However, exposure to emerging market governmentbonds, in particular those from South Africa and Mexico, and fromEuropean countries like Poland and Portugal helped returns.
Meanwhile, the exposure to convertibles and infrastructure detracted,as did currency positioning.
Investment activities
By the end of the review period, we had increased the extent to whichthe fund is positioned in favour of equities versus bonds. This wasimplemented by increasing positions designed to benefit from lossesin bond markets as well as those designed to benefit from gains inequity markets. Specifically, UK, European, Japanese and US equitypositions were increased, while exposure to Asia ex Japan was slightlyreduced. These changes largely focused on realising profits onpositions that had worked well, while retaining the focus of the fundon exploiting the still elevated difference in valuation between equitiesand bonds. The team also took advantage of equity market weaknessin February and March to further increase equity exposure.
We made significant changes to fixed income (bonds) positioning.Five- and 10-year US government bond yields have risen to such anextent from the lows reached during the summer of 2016, that weconsider that their risk/reward profile is now much more balanced; wetherefore removed all short positions on those assets. Bond yield refersto the interest received from a fixed income security and is usuallyexpressed annually as a percentage based on the investment’s cost,its current market value or its face value. When the bond’s yieldincreases, the bond’s price decreases, and vice versa. Soon after, wetook US 10-year government bond holdings further long and the other10-year developed bond market holdings further short, to exploit thesharp increase in spreads – differences between yields – between theUS and the other developed bond markets.
We also reduced positions in Latin American bonds, after strongperformance left them offering somewhat less value than previously.Some proceeds were reinvested in the new M&G (Lux) EmergingMarkets Hard Currency Bond Fund, giving us access to emergingbond markets and making use of M&G’s fixed interest team’s credit expertise.
Credit risk within the portfolio was significantly reduced in January. Thisreflects our view that the favourable credit environment is now almostfully reflected in pricing and spreads, as well as positioning the fundfor a rising-rate environment. Meanwhile, in currencies, the US dollarpositioning was moved to modestly long, reflecting a revised valuationfollowing an extended period of weakness. This followed a periodwhen we were short of the currency, when we believed that it wasovervalued by the market.
ANNUAL LONG REPORT AND AUDITED FINANCIAL STATEMENTS • April 201830
M&G Prudent Allocation Fund Authorised Corporate Director’s Report
Investment review

Outlook
Despite potentially unsettling news flow about politics and policy actiondominating headlines over the review period, global economicindicators broadly improved, which was reflected in the sustainedperiod of relative calm in markets seen throughout 2017. The volatilitythat opened 2018 reflects investor uncertainty about the futuredirection of equity markets. There are also many factors that couldunsettle investors. These include the pace of potential interest rateincreases in the US and elsewhere, as well as geopolitical concerns.Central banks around the world, while generally supportive, aresignalling a return to more normal conditions.
However, our broad macroeconomic outlook has not changed. For us,the additional prospective return that equities offer compared to bondsremains the most compelling opportunity and we continue to holdequities in preference to Western government bonds. We considerthat, even at current levels of inflation, Western government bonds aredeeply unattractive. They remain highly vulnerable to central bankpolicy tightening – raising interest rates and winding down assetpurchases – having benefited from sustained buying of bonds bycentral banks when they were attempting to keep interest rates low.
We believe that the global economy is likely to continue growing at areasonable pace and, indeed, that equity valuations have becomemore attractive owing to the ongoing volatility, since corporate earningshave held up, despite the fact that prices have fallen.
Juan Nevado & Craig MoranCo-fund managers
Employees of M&G Limited which is an associate of M&G Securities Limited.
Please note that the views expressed in this Report should not be taken as a
recommendation or advice on how the fund or any holding mentioned in the Report
is likely to perform. If you wish to obtain financial advice as to whether an investment
is suitable for your needs, you should consult a Financial Adviser.
Investments
The fund had no holdings at the year end.
ANNUAL LONG REPORT AND AUDITED FINANCIAL STATEMENTS • April 2018 31
M&G Prudent Allocation Fund Authorised Corporate Director’s Report
Investment review

Fund performance
Please note past performance is not a guide to future performanceand the value of investments, and the income from them, will fluctuate.This will cause the fund price to fall as well as rise and you may notget back the original amount you invested.
Due to the merger of the M&G Prudent Allocation Fund into the M&G (Lux) Conservative Allocation Fund on 16 March 2018, the performance data below covers a period that is shorter than the12-month financial year of the fund. Instead, it runs from 2 May 2017to 16 March 2018.
Fund level performance
Fund net asset value
2018 2017 2016as at 30 April €’000 €’000 €’000
Fund net asset value (NAV) 0 1,008,192 207,071
The NAV figure as at 30 April 2018 is shown as €0 due to the fundclosure on 16 March 2018.
Performance since launch
To give an indication of how the fund has performed since launch, thechart below shows total return of Euro Class ‘A’ (Accumulation) shares.
92
96
94
98
100
102
104
106
112
110
108
91Apr 15 Jun 15 Sep 15 Dec 15 Mar 16 Jun 16 Sep 16 Dec 16 Mar 17 Jun 17 Sep 17 Dec 17 Mar 18
* Income reinvested Source: Morningstar, Inc. and M&G
April 2015 = 100, plotted monthly Chart date 16 March 2018
Euro Class ‘A’ (Accumulation) shares*
Morningstar EUR Cautious Allocation - Global sector average*
To give an indication of the performance of the fund, the following tableshows the compound rate of return, per annum, over the period, tothe merger date 16 March 2018. Calculated on a price to price basiswith income reinvested. Please note that due to the fund closure on16 March 2018, the one, three and five-year performance periods arenot full periods.
Long-term performance by share class
One Three Five Since year years years launch 02.05.17 01.05.15 01.05.13 to 16.03.18 to 16.03.18 to 16.03.18 % [a] % p.a. % p.a. % p.a.
Euro [b] Class ‘A’ +2.7 +3.4 n/a +3.0 [c]
Class ‘B’ +2.3 n/a n/a +5.3 [d]
Class ‘C’ +3.5 +4.2 n/a +3.7 [c]
Swiss franc [b] Class ‘A-H’ +2.4 n/a n/a +6.1 [e]
Class ‘C-H’ +3.1 n/a n/a +6.9 [e]
US dollar [b] Class ‘A-H’ +4.8 +4.8 n/a +4.3 [c]
Class ‘C-H’ +5.5 +5.5 n/a +5.0 [c]
[a] Absolute basis.
[b] Price to price with net income reinvested.
[c] 23 April 2015, the launch date of the fund.
[d] 11 September 2015, the launch date of the share class.
[e] 12 August 2016, the launch date of the share class.
Operating charges and portfoliotransaction costs
We explain below the payments made to meet the ongoing costs ofinvesting and managing the fund, comprising operating charges andportfolio transaction costs.
Operating charges
Operating charges include payments made to M&G and to providersindependent of M&G:
• Investment management: Charge paid to M&G for investmentmanagement of the fund (also known as Annual ManagementCharge).
• Administration: Charge paid to M&G for administration servicesin addition to investment management – any surplus from thischarge will be retained by M&G.
• Share class hedging: Charge paid to M&G for currency hedgingservices to minimise exchange rate risk for the share class.
• Oversight and other independent services: Charges paid toproviders independent of M&G for services which includedepositary, custody and audit.
• Ongoing charges from underlying funds: Ongoing charges onholdings in underlying funds that are not rebated.
ANNUAL LONG REPORT AND AUDITED FINANCIAL STATEMENTS • April 201832
M&G Prudent Allocation Fund Financial highlights
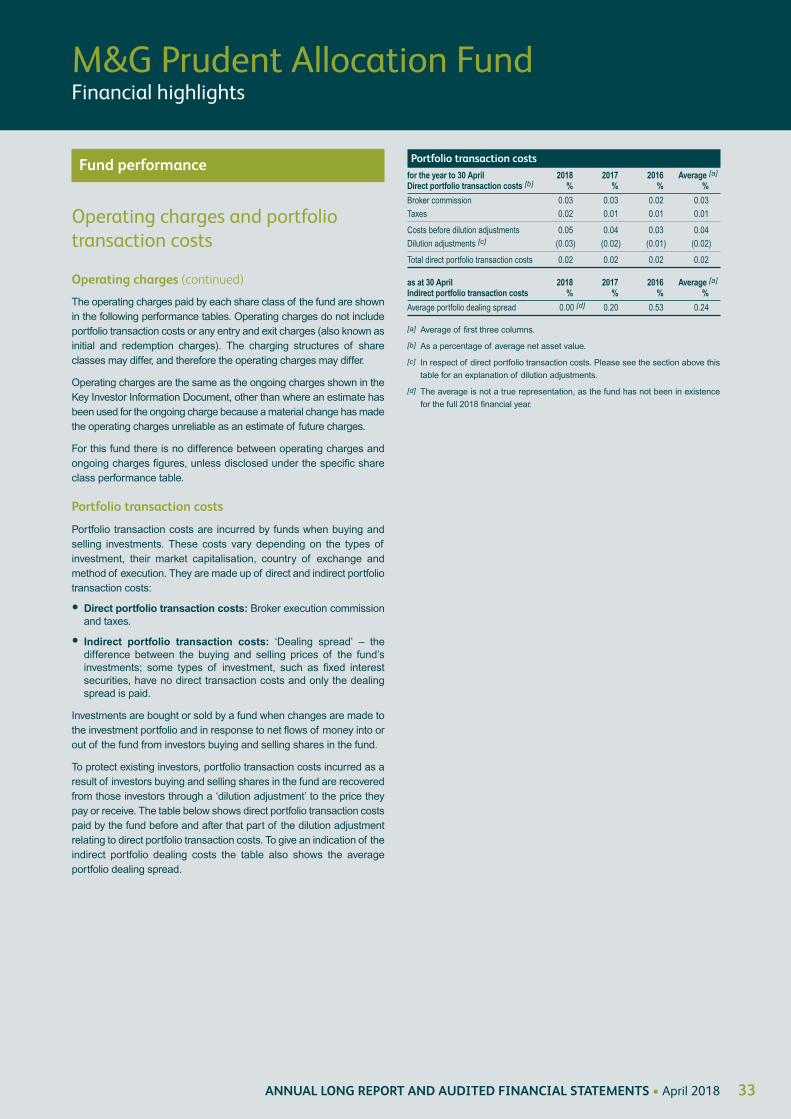
The operating charges paid by each share class of the fund are shownin the following performance tables. Operating charges do not includeportfolio transaction costs or any entry and exit charges (also known asinitial and redemption charges). The charging structures of shareclasses may differ, and therefore the operating charges may differ.
Operating charges are the same as the ongoing charges shown in theKey Investor Information Document, other than where an estimate hasbeen used for the ongoing charge because a material change has madethe operating charges unreliable as an estimate of future charges.
For this fund there is no difference between operating charges andongoing charges figures, unless disclosed under the specific shareclass performance table.
Portfolio transaction costs
Portfolio transaction costs are incurred by funds when buying andselling investments. These costs vary depending on the types ofinvestment, their market capitalisation, country of exchange andmethod of execution. They are made up of direct and indirect portfoliotransaction costs:
• Direct portfolio transaction costs: Broker execution commissionand taxes.
• Indirect portfolio transaction costs: ‘Dealing spread’ – thedifference between the buying and selling prices of the fund’sinvestments; some types of investment, such as fixed interestsecurities, have no direct transaction costs and only the dealingspread is paid.
Investments are bought or sold by a fund when changes are made tothe investment portfolio and in response to net flows of money into orout of the fund from investors buying and selling shares in the fund.
To protect existing investors, portfolio transaction costs incurred as aresult of investors buying and selling shares in the fund are recoveredfrom those investors through a ‘dilution adjustment’ to the price theypay or receive. The table below shows direct portfolio transaction costspaid by the fund before and after that part of the dilution adjustmentrelating to direct portfolio transaction costs. To give an indication of theindirect portfolio dealing costs the table also shows the averageportfolio dealing spread.
Portfolio transaction costs
for the year to 30 April 2018 2017 2016 Average [a]
Direct portfolio transaction costs [b] % % % %
Broker commission 0.03 0.03 0.02 0.03
Taxes 0.02 0.01 0.01 0.01
Costs before dilution adjustments 0.05 0.04 0.03 0.04
Dilution adjustments [c] (0.03) (0.02) (0.01) (0.02)
Total direct portfolio transaction costs 0.02 0.02 0.02 0.02
as at 30 April 2018 2017 2016 Average [a]
Indirect portfolio transaction costs % % % %
Average portfolio dealing spread 0.00 [d] 0.20 0.53 0.24
[a] Average of first three columns.
[b] As a percentage of average net asset value.
[c] In respect of direct portfolio transaction costs. Please see the section above this
table for an explanation of dilution adjustments.
[d] The average is not a true representation, as the fund has not been in existence
for the full 2018 financial year.
ANNUAL LONG REPORT AND AUDITED FINANCIAL STATEMENTS • April 2018 33
M&G Prudent Allocation Fund Financial highlights
Fund performance
Operating charges and portfoliotransaction costs
Operating charges (continued)

Specific share class performance
The following tables show the performance of each share class. All‘Performance and charges’ percentages represent an annual rateexcept for the ‘Return after operating charges’ which is calculated asa percentage of the opening net asset value per share (NAV). ‘Dilutionadjustments’ are only in respect of direct portfolio transaction costs.
Euro Class ‘A’ Income share performanceThe share class was launched on 23 April 2015.
for the year to 30 April 2018 2017 2016Change in NAV per share Euro ¢ Euro ¢ Euro ¢
Opening NAV 1,031.74 958.85 1,000.00
Return before operating charges and after directportfolio transaction costs 47.78 103.95 (20.11)
Operating charges (14.54) (14.98) (15.31)
Return after operating charges 33.24 88.97 (35.42)
Distributions (11.44) (16.08) (5.73)
Return to shareholder as a resultof share class closure (1,053.54) n/a n/a
Closing NAV 0.00 1,031.74 958.85
Direct portfolio transaction costs Euro ¢ Euro ¢ Euro ¢
Costs before dilution adjustments 0.43 0.44 0.31
Dilution adjustments [a] (0.24) (0.24) (0.11)
Total direct portfolio transaction costs 0.19 0.20 0.20
Performance and charges % % %
Direct portfolio transaction costs [b] 0.02 0.02 0.02
Operating charges [c] 1.57 1.49 1.62
Return after operating charges +3.22 +9.28 -3.54
Historic yield n/a 1.78 0.61
Effect on yield of charges offset against capital 1.55 1.55 0.00
Other information
Closing NAV (€’000) 0 33,929 8,922
Closing NAV percentage of total fund NAV (%) 0.00 3.37 4.31
Number of shares 0 3,288,524 930,504
Highest share price (Euro ¢) 1,079.95 1,039.70 1,002.02
Lowest share price (Euro ¢) 1,035.83 936.22 879.61
Euro Class ‘A’ Accumulation share performanceThe share class was launched on 23 April 2015.
for the year to 30 April 2018 2017 2016Change in NAV per share Euro ¢ Euro ¢ Euro ¢
Opening NAV 1,054.82 964.76 1,000.00
Return before operating charges and after directportfolio transaction costs 48.88 105.32 (19.94)
Operating charges (14.95) (15.26) (15.30)
Return after operating charges 33.93 90.06 (35.24)
Distributions 0.00 (3.41) (5.75)
Retained distributions 0.00 3.41 5.75
Return to shareholder as a result of share class closure (1,088.75) n/a n/a
Closing NAV 0.00 1,054.82 964.76
Direct portfolio transaction costs Euro ¢ Euro ¢ Euro ¢
Costs before dilution adjustments 0.44 0.45 0.31
Dilution adjustments [a] (0.25) (0.25) (0.11)
Total direct portfolio transaction costs 0.19 0.20 0.20
Performance and charges % % %
Direct portfolio transaction costs [b] 0.02 0.02 0.02
Operating charges [c] 1.57 1.49 1.62
Return after operating charges +3.22 +9.33 -3.52
Historic yield n/a 0.32 0.61
Effect on yield of charges offset against capital 0.00 0.00 0.00
Other information
Closing NAV (€’000) 0 392,119 71,695
Closing NAV percentage of total fund NAV (%) 0.00 38.89 34.62
Number of shares 0 37,174,187 7,431,309
Highest share price (Euro ¢) 1,111.57 1,058.18 1,002.02
Lowest share price (Euro ¢) 1,058.96 942.08 883.34
Euro Class ‘B’ Income share performanceThe share class was launched on 11 September 2015.
for the year to 30 April 2018 2017 2016Change in NAV per share Euro ¢ Euro ¢ Euro ¢
Opening NAV 1,088.77 1,015.11 1,000.00
Return before operating charges and after directportfolio transaction costs 50.30 111.26 31.71
Operating charges (20.19) (21.48) (12.91)
Return after operating charges 30.11 89.78 18.80
Distributions (12.05) (16.12) (3.69)
Return to shareholder as a resultof share class closure (1,106.83) n/a n/a
Closing NAV 0.00 1,088.77 1,015.11
Direct portfolio transaction costs Euro ¢ Euro ¢ Euro ¢
Costs before dilution adjustments 0.45 0.47 0.20
Dilution adjustments [a] (0.25) (0.26) (0.07)
Total direct portfolio transaction costs 0.20 0.21 0.13
Performance and charges % % %
Direct portfolio transaction costs [b] 0.02 0.02 0.02
Operating charges [c] 2.07 2.00 2.08
Return after operating charges +2.77 +8.84 +1.88
Historic yield n/a 1.77 0.12
Effect on yield of charges offset against capital 2.05 2.05 0.00
Other information
Closing NAV (€’000) 0 20,567 1,011
Closing NAV percentage of total fund NAV (%) 0.00 2.04 0.49
Number of shares 0 1,888,978 99,598
Highest share price (Euro ¢) 1,135.35 1,097.12 1,026.67
Lowest share price (Euro ¢) 1,092.96 990.53 931.11
ANNUAL LONG REPORT AND AUDITED FINANCIAL STATEMENTS • April 201834
M&G Prudent Allocation FundFinancial highlights

Euro Class ‘B’ Accumulation share performanceThe share class was launched on 11 September 2015.
for the year to 30 April 2018 2017 2016Change in NAV per share Euro ¢ Euro ¢ Euro ¢Opening NAV 1,109.52 1,019.10 1,000.00Return before operating charges and after directportfolio transaction costs 51.37 111.96 32.02
Operating charges (20.69) (21.54) (12.92)
Return after operating charges 30.68 90.42 19.10
Distributions 0.00 0.00 (3.78)
Retained distributions 0.00 0.00 3.78
Return to shareholder as a resultof share class closure (1,140,20) n/a n/a
Closing NAV 0.00 1,109.52 1,019.10
Direct portfolio transaction costs Euro ¢ Euro ¢ Euro ¢Costs before dilution adjustments 0.46 0.47 0.20Dilution adjustments [a] (0.26) (0.26) (0.07)
Total direct portfolio transaction costs 0.20 0.21 0.13
Performance and charges % % %Direct portfolio transaction costs [b] 0.02 0.02 0.02Operating charges [c] 2.07 2.00 2.07Return after operating charges +2.77 +8.87 +1.91Historic yield n/a 0.00 0.12Effect on yield of charges offset against capital 0.00 0.00 0.00
Other information Closing NAV (€’000) 0 59,709 3,407Closing NAV percentage of total fund NAV (%) 0.00 5.92 1.65Number of shares 0 5,381,496 334,290Highest share price (Euro ¢) 1,164.77 1,113.02 1,028.45Lowest share price (Euro ¢) 1,113.77 994.38 933.73
Euro Class ‘C’ Income share performanceThe share class was launched on 23 April 2015.
for the year to 30 April 2018 2017 2016Change in NAV per share Euro ¢ Euro ¢ Euro ¢Opening NAV 1,038.70 959.02 1,000.00Return before operating charges and after directportfolio transaction costs 48.16 102.52 (21.51)
Operating charges (7.19) (6.88) (7.68)
Return after operating charges 40.97 95.64 (29.19)
Distributions (11.53) (15.96) (11.79)
Return to shareholder as a resultof share class closure (1,068.14) n/a n/a
Closing NAV 0.00 1,038.70 959.02
Direct portfolio transaction costs Euro ¢ Euro ¢ Euro ¢Costs before dilution adjustments 0.43 0.44 0.31Dilution adjustments [a] (0.24) (0.24) (0.11)
Total direct portfolio transaction costs 0.19 0.20 0.20
Performance and charges % % %Direct portfolio transaction costs [b] 0.02 0.02 0.02Operating charges [c] 0.77 0.69 0.81Return after operating charges +3.94 +9.97 -2.92Historic yield n/a 1.63 1.25Effect on yield of charges offset against capital 0.75 0.75 0.00
Other information Closing NAV (€’000) 0 62,544 42,377Closing NAV percentage of total fund NAV (%) 0.00 6.21 20.47Number of shares 0 6,021,414 4,418,800Highest share price (Euro ¢) 1,093.72 1,046.39 1,002.08Lowest share price (Euro ¢) 1,042.89 937.39 879.99
Euro Class ‘C’ Accumulation share performanceThe share class was launched on 23 April 2015.
for the year to 30 April 2018 2017 2016Change in NAV per share Euro ¢ Euro ¢ Euro ¢
Opening NAV 1,068.52 971.04 1,000.00Return before operating charges and after directportfolio transaction costs 49.55 104.55 (20.89)
Operating charges (7.43) (7.07) (8.07)
Return after operating charges 42.12 97.48 (28.96)
Distributions (4.63) (9.93) (11.80)
Retained distributions 4.63 9.93 11.80
Return to shareholder as a resultof share class closure (1,110.64) n/a n/a
Closing NAV 0.00 1,068.52 971.04
Direct portfolio transaction costs Euro ¢ Euro ¢ Euro ¢
Costs before dilution adjustments 0.45 0.45 0.31Dilution adjustments [a] (0.25) (0.25) (0.11)
Total direct portfolio transaction costs 0.20 0.20 0.20
Performance and charges % % %
Direct portfolio transaction costs [b] 0.02 0.02 0.02Operating charges [c] 0.77 0.69 0.84Return after operating charges +3.94 +10.04 -2.90Historic yield n/a 0.92 1.23Effect on yield of charges offset against capital 0.00 0.00 0.00
Other information
Closing NAV (€’000) 0 431,955 76,506Closing NAV percentage of total fund NAV (%) 0.00 42.84 36.95Number of shares 0 40,425,542 7,878,721Highest share price (Euro ¢) 1,132.86 1,071.94 1,002.08Lowest share price (Euro ¢) 1,072.82 949.21 887.87
Swiss franc Class ‘A-H’ Accumulation share performanceThe share class was launched on 12 August 2016.
for the year to 30 April 2018 2017 2016Change in NAV per share Swiss ¢ Swiss ¢ Swiss ¢
Opening NAV 1,070.02 1,000.00 n/aReturn before operating charges and after directportfolio transaction costs 45.88 81.12 n/a
Operating charges (15.30) (11.10) n/a
Return after operating charges 30.58 70.02 n/a
Distributions 0.00 (2.29) n/a
Retained distributions 0.00 2.29 n/a
Return to shareholder as a resultof share class closure (1,100.60) n/a n/a
Closing NAV 0.00 1,070.02 n/a
Direct portfolio transaction costs Swiss ¢ Swiss ¢ Swiss ¢
Costs before dilution adjustments 0.45 0.32 n/aDilution adjustments [a] (0.25) (0.18) n/a
Total direct portfolio transaction costs 0.20 0.14 n/a
Performance and charges % % %
Direct portfolio transaction costs [b] 0.02 0.02 n/aOperating charges [c] 1.60 1.50 n/aReturn after operating charges +2.86 +7.00 n/aHistoric yield n/a 0.29 n/aEffect on yield of charges offset against capital 0.00 0.00 n/a
Other information
Closing NAV (€’000) 0 30 n/aClosing NAV percentage of total fund NAV (%) 0.00 0.00 n/aNumber of shares 0 3,000 n/aHighest share price (Swiss ¢) 1,124.07 1,073.46 n/aLowest share price (Swiss ¢) 1,074.24 994.39 n/a
ANNUAL LONG REPORT AND AUDITED FINANCIAL STATEMENTS • April 2018 35
M&G Prudent Allocation Fund Financial highlights
Specific share class performance
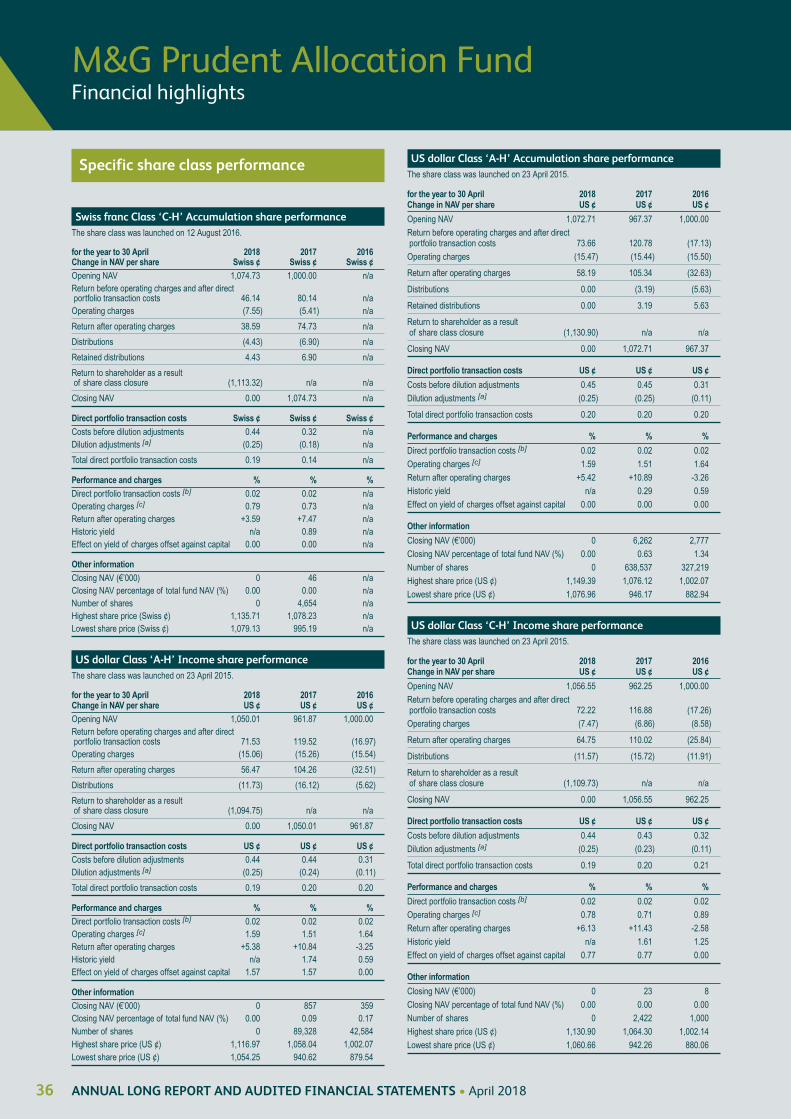
Swiss franc Class ‘C-H’ Accumulation share performanceThe share class was launched on 12 August 2016.
for the year to 30 April 2018 2017 2016Change in NAV per share Swiss ¢ Swiss ¢ Swiss ¢
Opening NAV 1,074.73 1,000.00 n/aReturn before operating charges and after directportfolio transaction costs 46.14 80.14 n/aOperating charges (7.55) (5.41) n/a
Return after operating charges 38.59 74.73 n/a
Distributions (4.43) (6.90) n/a
Retained distributions 4.43 6.90 n/a
Return to shareholder as a resultof share class closure (1,113.32) n/a n/a
Closing NAV 0.00 1,074.73 n/a
Direct portfolio transaction costs Swiss ¢ Swiss ¢ Swiss ¢
Costs before dilution adjustments 0.44 0.32 n/aDilution adjustments [a] (0.25) (0.18) n/a
Total direct portfolio transaction costs 0.19 0.14 n/a
Performance and charges % % %
Direct portfolio transaction costs [b] 0.02 0.02 n/aOperating charges [c] 0.79 0.73 n/aReturn after operating charges +3.59 +7.47 n/aHistoric yield n/a 0.89 n/aEffect on yield of charges offset against capital 0.00 0.00 n/a
Other information
Closing NAV (€’000) 0 46 n/aClosing NAV percentage of total fund NAV (%) 0.00 0.00 n/aNumber of shares 0 4,654 n/aHighest share price (Swiss ¢) 1,135.71 1,078.23 n/aLowest share price (Swiss ¢) 1,079.13 995.19 n/a
US dollar Class ‘A-H’ Income share performanceThe share class was launched on 23 April 2015.
for the year to 30 April 2018 2017 2016Change in NAV per share US ¢ US ¢ US ¢
Opening NAV 1,050.01 961.87 1,000.00Return before operating charges and after directportfolio transaction costs 71.53 119.52 (16.97)Operating charges (15.06) (15.26) (15.54)
Return after operating charges 56.47 104.26 (32.51)
Distributions (11.73) (16.12) (5.62)
Return to shareholder as a resultof share class closure (1,094.75) n/a n/a
Closing NAV 0.00 1,050.01 961.87
Direct portfolio transaction costs US ¢ US ¢ US ¢
Costs before dilution adjustments 0.44 0.44 0.31Dilution adjustments [a] (0.25) (0.24) (0.11)
Total direct portfolio transaction costs 0.19 0.20 0.20
Performance and charges % % %
Direct portfolio transaction costs [b] 0.02 0.02 0.02Operating charges [c] 1.59 1.51 1.64Return after operating charges +5.38 +10.84 -3.25Historic yield n/a 1.74 0.59Effect on yield of charges offset against capital 1.57 1.57 0.00
Other information
Closing NAV (€’000) 0 857 359Closing NAV percentage of total fund NAV (%) 0.00 0.09 0.17Number of shares 0 89,328 42,584Highest share price (US ¢) 1,116.97 1,058.04 1,002.07Lowest share price (US ¢) 1,054.25 940.62 879.54
US dollar Class ‘A-H’ Accumulation share performanceThe share class was launched on 23 April 2015.
for the year to 30 April 2018 2017 2016Change in NAV per share US ¢ US ¢ US ¢
Opening NAV 1,072.71 967.37 1,000.00
Return before operating charges and after directportfolio transaction costs 73.66 120.78 (17.13)
Operating charges (15.47) (15.44) (15.50)
Return after operating charges 58.19 105.34 (32.63)
Distributions 0.00 (3.19) (5.63)
Retained distributions 0.00 3.19 5.63
Return to shareholder as a resultof share class closure (1,130.90) n/a n/a
Closing NAV 0.00 1,072.71 967.37
Direct portfolio transaction costs US ¢ US ¢ US ¢
Costs before dilution adjustments 0.45 0.45 0.31
Dilution adjustments [a] (0.25) (0.25) (0.11)
Total direct portfolio transaction costs 0.20 0.20 0.20
Performance and charges % % %
Direct portfolio transaction costs [b] 0.02 0.02 0.02
Operating charges [c] 1.59 1.51 1.64
Return after operating charges +5.42 +10.89 -3.26
Historic yield n/a 0.29 0.59
Effect on yield of charges offset against capital 0.00 0.00 0.00
Other information
Closing NAV (€’000) 0 6,262 2,777
Closing NAV percentage of total fund NAV (%) 0.00 0.63 1.34
Number of shares 0 638,537 327,219
Highest share price (US ¢) 1,149.39 1,076.12 1,002.07
Lowest share price (US ¢) 1,076.96 946.17 882.94
US dollar Class ‘C-H’ Income share performanceThe share class was launched on 23 April 2015.
for the year to 30 April 2018 2017 2016Change in NAV per share US ¢ US ¢ US ¢
Opening NAV 1,056.55 962.25 1,000.00
Return before operating charges and after directportfolio transaction costs 72.22 116.88 (17.26)
Operating charges (7.47) (6.86) (8.58)
Return after operating charges 64.75 110.02 (25.84)
Distributions (11.57) (15.72) (11.91)
Return to shareholder as a resultof share class closure (1,109.73) n/a n/a
Closing NAV 0.00 1,056.55 962.25
Direct portfolio transaction costs US ¢ US ¢ US ¢
Costs before dilution adjustments 0.44 0.43 0.32
Dilution adjustments [a] (0.25) (0.23) (0.11)
Total direct portfolio transaction costs 0.19 0.20 0.21
Performance and charges % % %
Direct portfolio transaction costs [b] 0.02 0.02 0.02
Operating charges [c] 0.78 0.71 0.89
Return after operating charges +6.13 +11.43 -2.58
Historic yield n/a 1.61 1.25
Effect on yield of charges offset against capital 0.77 0.77 0.00
Other information
Closing NAV (€’000) 0 23 8
Closing NAV percentage of total fund NAV (%) 0.00 0.00 0.00
Number of shares 0 2,422 1,000
Highest share price (US ¢) 1,130.90 1,064.30 1,002.14
Lowest share price (US ¢) 1,060.66 942.26 880.06
ANNUAL LONG REPORT AND AUDITED FINANCIAL STATEMENTS • April 201836
M&G Prudent Allocation FundFinancial highlights
Specific share class performance

US dollar Class ‘C-H’ Accumulation share performanceThe share class was launched on 23 April 2015.
for the year to 30 April 2018 2017 2016Change in NAV per share US ¢ US ¢ US ¢
Opening NAV 1,087.94 974.56 1,000.00
Return before operating charges and after directportfolio transaction costs 74.18 121.31 (16.83)
Operating charges (7.69) (7.93) (8.61)
Return after operating charges 66.49 113.38 (25.44)
Distributions (4.63) (9.64) (11.57)
Retained distributions 4.63 9.64 11.57
Return to shareholder as a resultof share class closure (1,154.43) n/a n/a
Closing NAV 0.00 1,087.94 974.56
Direct portfolio transaction costs US ¢ US ¢ US ¢
Costs before dilution adjustments 0.45 0.49 0.32
Dilution adjustments [a] (0.25) (0.27) (0.11)
Total direct portfolio transaction costs 0.20 0.22 0.21
Performance and charges % % %
Direct portfolio transaction costs [b] 0.02 0.02 0.02
Operating charges [c] 0.79 0.74 0.89
Return after operating charges +6.11 +11.63 -2.54
Historic yield n/a 0.87 1.19
Effect on yield of charges offset against capital 0.00 0.00 n/a
Other information
Closing NAV (€’000) 0 151 9
Closing NAV percentage of total fund NAV (%) 0.00 0.01 0.00
Number of shares 0 15,155 1,000
Highest share price (US ¢) 1,172.49 1,091.35 1,002.14
Lowest share price (US ¢) 1,092.35 954.46 888.24
[a] In respect of direct portfolio transaction costs.
[b] As a percentage of average net asset value.
[c] The data for the operating charges figure is to 16 March 2018.
ANNUAL LONG REPORT AND AUDITED FINANCIAL STATEMENTS • April 2018 37
M&G Prudent Allocation FundFinancial highlights
Specific share class performance

Financial statements
Statement of total return
2018 2017for the year to 30 April Note €’000 €’000 €’000 €’000
Income
Net capital gains / (losses) 3 41,264 44,188
Revenue 5 20,492 9,998
Expenses 6 (19,818) (5,874) ______ ______Net revenue / (expense) beforetaxation 674 4,124
Taxation 7 (1,517) (711) ______ ______Net revenue / (expense) aftertaxation (843) 3,413
Total return before distributions 40,421 47,601Distributions 8 (6,024) (4,112)
Change in net assets attributableto shareholders from investmentactivities 34,397 43,489
Statement of change in net assets attributable to shareholders
2018 2017for the year to 30 April €’000 €’000 €’000 €’000
Opening net assets attributable toshareholders 1,008,192 207,071Amounts received on issue of shares 1,746,583 809,074
Amounts paid on cancellation of shares (2,794,176) (56,187) ________ ______ (1,047,593) 752,887
Dilution adjustments 1,647 1,187
Change in net assets attributable toshareholders from investment activities(see above) 34,397 43,489
Retained distributions on Accumulationshares 3,357 3,558
Closing net assets attributable toshareholders 0 1,008,192
Balance sheet
2018 2017as at 30 April Note €’000 €’000
Assets
Fixed assets Investments 0 960,358
Current assets Debtors 9 288 21,905
Cash and bank balances 10 106 252,787
Total assets 394 1,235,050
Liabilities Investment liabilities 0 (9,165)
Creditors Distribution payable 0 (513)
Other creditors 11 (394) (217,180)
Total liabilities (394) (226,858)
Net assets attributable to shareholders 0 1,008,192
Notes to the financial statements
1 Accounting policies
The financial statements have been prepared in accordance with the‘Summary of significant accounting policies’ set out on pages 7 and 8.
2 Distribution policy
In determining the amount available for distribution to Income shares,the annual management charge, administration charge and shareclass hedging charge are offset against capital, increasing the amountavailable for distribution whilst restraining capital performance to anequivalent extent.
3 Net capital gains / (losses) 2018 2017for the year to 30 April €’000 €’000
Non-derivative securities (21,073) 20,090
Derivative contracts 63,365 25,997
Currency gains / (losses) (1,273) (1,915)
Management charge rebates taken to capital 225 25
Administration charge rebates taken to capital 33 3
Transaction charges (13) (12)
Net capital gains / (losses) 41,264 44,188
ANNUAL LONG REPORT AND AUDITED FINANCIAL STATEMENTS • April 201838
M&G Prudent Allocation FundFinancial statements and notes

4 Portfolio transactions and associated costs
The following tables show portfolio transactions and their associatedtransaction costs. For more information about the nature of the costsplease see the section on ‘Operating charges and portfolio transactioncosts’ on pages 32 and 33.
2018 % of 2017 % offor the year to 30 April €’000 transaction €’000 transaction
a) Purchases Equities Equities before transaction costs 331,135 127,060
Commissions 122 0.04 58 0.05
Taxes 322 0.10 58 0.05
Equities after transaction costs 331,579 127,176
Debt securities [a] 1,693,036 587,221
Collective investment schemes Collective investment schemes before transaction costs 119,465 76,297
Commissions 5 0.00 4 0.01
Taxes 0 0.00 12 0.02
Collective investment schemes after transaction costs 119,470 76,313
Total purchases after transactioncosts 2,144,085 790,710
b) Sales Equities Equities before transaction costs 90,943 18,335
Commissions (43) 0.05 (9) 0.05
Taxes (1) 0.00 0 0.00
Equities after transaction costs 90,899 18,326
Debt securities [a] 553,764 194,272
Collective investment schemes 9,735 11,225
Other transaction types Corporate actions 1,929 900
Total sales after transaction costs 656,327 224,723
2018 % of 2017 % ofc) Direct portfolio transaction costs €’000 average NAV €’000 average NAV
Commissions paid Equities 165 0.01 67 0.01
Collective investment schemes 5 0.00 4 0.00
Derivatives 229 0.02 82 0.02
Total commissions paid 399 0.03 153 0.03
Taxes paid Equities 323 0.02 58 0.01
Collective investment schemes 0 0.00 12 0.00
Total taxes paid 323 0.02 70 0.01
Total direct portfolio transactioncosts [b] 722 0.05 223 0.04
d) Indirect portfolio transaction costs % %
Portfolio dealing spread [c] 0.00 0.20
[a] These transaction types do not attract direct portfolio transaction costs.
[b] Costs before dilution adjustments. Please refer to the ‘Financial highlights’ section
for the effect of dilution adjustments.
[c] Average portfolio dealing spread at the balance sheet date.
5 Revenue 2018 2017for the year to 30 April €’000 €’000
Administration charge rebates 79 47
Bank interest 79 35
Deposit interest (1,597) (542)
Derivative revenue (4,264) (1,282)
Distributions from collective investment schemes: non-taxable 122 0
Distributions from collective investment schemes: taxable 1,066 607
Dividends from equity investments: non-taxable 5,889 1,585
Dividends from equity investments: taxable 1,397 (56)
Interest on debt securities 16,796 9,258
Management charge rebates 828 346
Stock dividends 97 0
Total revenue 20,492 9,998
6 Expenses 2018 2017for the year to 30 April €’000 €’000
Payable to the ACD or associate Annual management charge [a] 16,973 4,751
Administration charge [b] 2,340 759
Share class hedging charge 2 1
19,315 5,511
Payable to the Depositary or associate Depositary’s charge (including VAT) 71 35
Other expenses Audit fee (including VAT) 10 10
Dividend charges 26 8
Interest payable 256 229
Transaction fees 1 0
Safe custody charge 139 81
432 328
Total expenses 19,818 5,874
[a] This charge excludes management charge rebates received from M&G Securities
Limited, or an associate, in relation to the annual management charge of the
underlying collective investment schemes for which M&G Securities Limited, or
an associate, acts as Authorised Corporate Director.
These rebates have been recognised as either capital or revenue in notes 3 and
5 and amount to €225,000 (2017: €25,000) and €828,000 (2017: €346,000).
[b] This charge excludes administration charge rebates received from M&G Securities
Limited, or an associate, in relation to the administration charge of the underlying
collective investment schemes for which M&G Securities Limited, or an associate,
acts as Authorised Corporate Director.
These rebates have been recognised as either capital or revenue in notes 3 and
5 and amount to €33,000 (2017: €3,000) and €79,000 (2017: €47,000).
ANNUAL LONG REPORT AND AUDITED FINANCIAL STATEMENTS • April 2018 39
M&G Prudent Allocation FundFinancial statements and notes
Notes to the financial statements

7 Taxation 2018 2017for the year to 30 April €’000 €’000
a) Analysis of charge in the year Corporation tax 0 509
Withholding tax 1,377 335
Current double taxation relief 0 (133)
Capital gains tax 140 0
Deferred tax (note 7c) 0 0
Total taxation 1,517 711
b) Factors affecting taxation charge for the year Net revenue / (expense) before taxation 674 4,124
______ ______Corporation tax at 20% 135 825
Effects of:
Tax on management and administration chargerebates taken to capital 51 5
Dividends from equity investments: non-taxable (1,178) (317)
Distributions from collective investment schemes: non-taxable (24) 0
Stock dividends not taxable (19) 0
Current year expenses not utilised 1,096 0
Withholding tax 1,377 335
Withholding tax recoverable: exchange rate movements 0 (4)
Withholding tax expensed (61) 0
Total double taxation relief 0 (133)
Capital gains tax 140 0
Total tax charge (note 7a) 1,517 711
c) Provision for deferred taxation Provision at the start of the year 0 0
Deferred tax in profit and loss account (note 7a) 0 0
Provision at the end of the year 0 0
The fund has not recognised a deferred tax asset of €1,096,000 (2017: €nil) arising
as a result of having excess management expenses. We do not expect this asset to
be utilised in the foreseeable future.
8 Distributions 2018 2017for the year to 30 April Inc [a] Acc [b] Inc [a] Acc [b]
Dividend distributions €’000 €’000 €’000 €’000
First interim 562 900 142 392
Second interim 654 888 326 852
Third interim 641 539 386 977
Final 523 1,030 513 1,337
Total net distributions 5,737 4,925
Income deducted on cancellation of shares 53 94
Income received on issue of shares 234 (907)
Distributions 6,024 4,112
Net revenue / (expense) per statement oftotal return (843) 3,413
Expenses offset against capital 2,236 666
Capital gains tax 140 0
Relief on expenses offset against capital 6 (9)
Income deficit transferred to capital 4,485 42
Distributions 6,024 4,112
[a] Distributions payable on Income shares.
[b] Retained distributions on Accumulation shares.
9 Debtors 2018 2017as at 30 April €’000 €’000
Administration charge rebates due 0 3
Amounts receivable on issues of shares 0 14,784
Corporation tax refund receivable 114 0
Currency deals outstanding 0 208
Debt security interest receivable 0 6,310
Dividends receivable 151 456
Withholding tax recoverable 23 27
Management charge rebates due 0 37
Tax recoverable 0 80
Total debtors 288 21,905
10 Cash and bank balances 2018 2017as at 30 April €’000 €’000
Amounts held at futures clearing houses and collateral manager 0 22,508
Cash held as bank balances 106 230,279
Total cash and bank balances 106 252,787
11 Other creditors 2018 2017as at 30 April €’000 €’000
ACD’s annual management charge payable 0 502
Administration charge payable 0 72
Corporation tax payable 0 376
Currency deals outstanding 0 207
Derivative expense payable 0 467
Expenses payable 38 43
Purchases awaiting settlement 0 215,513
Balances due to M&G (Lux) Conservative Allocation Fund 356 0
Total other creditors 394 217,180
12 Contingent assets, liabilities and outstandingcommitments
There were no contingent assets, liabilities or outstandingcommitments at the balance sheet date (2017: same).
13 Shares in issue
The following table shows each class of share in issue during the year.Each share class has the same rights on winding up however theymay have different charging structures as set out in note 14.
Opening Movements ClosingShare class 01.05.17 Issued Cancelled 30.04.18
Euro Class ‘A’ Income 3,288,524 6,568,605 (9,857,129) 0
Class ‘A’ Accumulation 37,174,187 64,978,724 (102,152,911) 0
Class ‘B’ Income 1,888,978 3,895,412 (5,784,390) 0
Class ‘B’ Accumulation 5,381,496 11,913,739 (17,295,235) 0
Class ‘C’ Income 6,021,414 4,661,581 (10,682,995) 0
Class ‘C’ Accumulation 40,425,542 65,366,628 (105,792,170) 0
Swiss franc Class ‘A-H’ Accumulation 3,000 15,926 (18,926) 0
Class ‘C-H’ Accumulation 4,654 253,353 (258,007) 0
US dollar Class ‘A-H’ Income 89,328 135,964 (225,292) 0
Class ‘A-H’ Accumulation 638,537 688,160 (1,326,697) 0
Class ‘C-H’ Income 2,422 182,064 (184,486) 0
Class ‘C-H’ Accumulation 15,155 1,041,443 (1,056,598) 0
ANNUAL LONG REPORT AND AUDITED FINANCIAL STATEMENTS • April 201840
M&G Prudent Allocation FundFinancial statements and notes
Notes to the financial statements

14 Charging structure
The table below sets out the charging structure for each class of share.The charging structure is the same for both Income and Accumulationshares of each class. Annual Share class Entry Exit management hedging charge charge charge chargeShare class % % % %
Euro Class ‘A’ 4.00 n/a 1.40 n/a
Class ‘B’ 1.25 n/a 1.90 n/a
Class ‘C’ 1.25 n/a 0.60 n/a
Swiss franc Class ‘A-H’ 4.00 n/a 1.40 [a]
Class ‘C-H’ 1.25 n/a 0.60 [a]
US dollar Class ‘A-H’ 4.00 n/a 1.40 [a]
Class ‘C-H’ 1.25 n/a 0.60 [a]
[a] This charge may vary between 0.01% and 0.055%.
15 Related parties
M&G Securities Limited, as Authorised Corporate Director (ACD), is arelated party and acts as principal on all the transactions of shares inthe fund except with in specie transactions, where M&G SecuritiesLimited acts as an agent. The aggregate monies received throughissues, and paid on cancellations, are disclosed in the ‘Statement ofchange in net assets attributable to shareholders’ and note 8. Amountsdue to / from M&G Securities Limited in respect of share transactionsat the year end are disclosed in notes 9 and 11 where applicable.
Amounts paid to M&G Securities Limited in respect of the ACD’sannual management charge, administration charge and share classhedging charge are disclosed in note 6. Amounts due at the year endin respect of the ACD’s annual management charge, administrationcharge and share class hedging charge are disclosed in note 11.
Amounts paid to M&G Securities Limited in respect of rebatearrangements for the ACD’s annual management charge andadministration charge are disclosed in notes 3 and 5. Amounts due atthe year end from the ACD, and / or associate, in respect of theserebates are disclosed in note 9.
During the year, there were transactions in Prudential plc, a relatedparty of M&G Securities Limited, with a total value of €84,082,000 (2017: €60,899,000).
At the balance sheet date, the fund held shares in related parties ofM&G Securities Limited with a value of €nil (2017: €58,069,000).
At the balance sheet date, there were no material shareholders fromwithin Prudential plc, of which M&G Securities Limited is a whollyowned subsidiary (2017: same).
16 Events after the balance sheet date
There were no events after the balance sheet date to disclose.
17 Fair value analysis
Financial instruments have been measured at their fair value and havebeen classified below using a hierarchy that reflects the significanceof the inputs used in measuring their fair value:
Level 1: Unadjusted quoted price in an active market for anidentical instrument
This includes instruments such as publicly traded equities; highly liquidbonds (e.g. Government bonds) and exchange traded derivatives (e.g.futures) for which quoted prices are readily and regularly available.
Level 2: Valuation technique using observable market data
This includes instruments such as over-the-counter (OTC) derivatives,debt securities, convertible bonds, mortgage-backed securities, asset-backed securities and open-ended funds which have been valuedusing models with observable market data inputs.
Level 3: Valuation technique using unobservable inputs
This refers to instruments which have been valued using models withunobservable data inputs. This includes single broker-pricedinstruments, suspended/unquoted securities, private equity, unlistedclosed-ended funds and open-ended funds with restrictions onredemption rights. However no such financial instruments were held.
Assets Liabilities Assets Liabilitiesas at 30 April 2018 2018 2017 2017Basis of valuation €’000 €’000 €’000 €’000
Level 1 0 0 936,022 (3,191)
Level 2 0 0 24,336 (5,974)
Level 3 0 0 0 0
0 0 960,358 (9,165)
As the fund no longer has any investment assets there is no exposureto fair value.
In accordance with FRS 102 (22.4a) the shares in issue for each classmeet the definition of a puttable instrument as the shareholders havethe right to sell the shares back to the issuer. The shares in the fundmay be issued and redeemed on any business day at the quoted price.These shares are not traded on an exchange. However, the price isobservable and transactions within the fund take place regularly at thatprice. The shares in issue as detailed in note 13 meet the definition ofa level 2 financial instrument ‘Valuation technique using observablemarket data’.
18 Risk management policies
The general risk management policies for the fund are set out in note3 to the financial statements on pages 8 and 9.
ANNUAL LONG REPORT AND AUDITED FINANCIAL STATEMENTS • April 2018 41
M&G Prudent Allocation FundFinancial statements and notes
Notes to the financial statements

19 Market risk sensitivity and exposure
VaR is the risk measurement methodology used to assess the fund’sleverage and market risk volatility. When VaR is calculated as apercentage of the net asset value it may not be greater than the VaRlimit set for the fund.
The VaR limit set during the financial year to 30 April 2018 was 8%(2017: 8%).
The lowest, highest and average VaR calculated during the financialyears ended 30 April 2018 and 30 April 2017 are disclosed in the table below. 2018 2017for the year to 30 April % %
Lowest 1.54 2.78
Highest 3.37 4.86
Average 2.29 3.78
The lowest, highest and average utilisation of VaR is with reference tothe limit above. 2018 2017 Utilisation Utilisation 2018 [a] of VaR [b] 2017 of VaR [b]
for the year to 30 April % of VaR 8% % of VaR 8%
Lowest 1.54 19.28 2.78 34.70
Highest 3.37 42.18 4.86 60.69
Average 2.29 28.66 3.78 47.31
[a] The fund merged and therefore closed on 16 March 2018.
[b] The VaR on the fund has been divided by its maximum limit.
As the fund no longer has any investment assets there is no exposure to market risk
sensitivity.
20 Credit risk
The fund is exposed to credit risk both through the credit quality of theinvestments it holds and through the derivative positions withcounterparties. The table below shows the credit quality of theinvestments held in the portfolio. 2018 2017as at 30 April €’000 €’000
Investment grade securities 0 367,307
Below investment grade securities 0 124,068
Unrated securities 0 0
Other investments 0 459,818
Total 0 951,193
As the fund no longer has any assets there is no exposure to credit risk.
The table below shows the exposure to counterparties. Collateral isposted daily, in the form of cash or high-quality government bonds, tominimise this exposure. Swaps Forwardsas at 30 April 2017 €’000 €’000
Bank of America Merrill Lynch 0 89
BNP Paribas 0 (37)
Citigroup (363) 3,240
HSBC 4,871 (181)
National Australia Bank 0 2,392
State Street Bank 0 2,487
UBS 2,135 3,729
Total 6,643 11,719
Net exposure represents the mark-to-market value of derivative contracts less any
cash collateral held. Positive exposure represents the fund’s exposure to that
counterparty. Negative amounts are not an exposure to the fund.
21 Leverage risk
Funds using VaR approaches are required to disclose the level ofleverage employed during the financial reporting period.
Derivatives can be used by the fund to generate market exposure toinvestments exceeding the net asset value. As a result of thisexposure, the size of any positive or negative movement in marketsmay have a more significant effect on the net asset value of the fund.
The lowest, highest and average level of leverage employed andutilisation of the leverage level calculated during the financial yearsended 30 April 2018 and 30 April 2017 are disclosed in the table below.
2018 [a] 2018 [a] 2017 [a] 2017 [a]
for the year to 30 April €’000 % €’000 %
Lowest 1,886,188 133 406,270 183
Highest 4,867,774 203 2,199,505 269
Average 2,790,443 148 1,105,573 214
[a] Global exposure stated as gross notional. Expressed as a percentage over fund
valuation.
The fund merged into the M&G (Lux) Conservative Allocation Fund and therefore
closed on 16 March 2018.
As the fund no longer has any investment assets there is no exposure to leverage
risk.
22 Exchange rate risk for hedged share classes
This fund contains hedged share classes. These share classesoperate currency hedges designed to reduce the impact of exchangerates in certain circumstances. As a result, profit and loss on thecurrency hedges may impact the liquidity of the overall fund. On a dayto day basis this is monitored using reporting from the outsourcedprovider of the hedged share class service. On an ongoing basis thesize of the hedged share classes is monitored to ensure thatunforeseen exchange rate volatility can be adequately managedwithout significantly impacting all shareholders.
ANNUAL LONG REPORT AND AUDITED FINANCIAL STATEMENTS • April 201842
M&G Prudent Allocation FundFinancial statements and notes
Notes to the financial statements

23 Dividend distribution tables
This fund pays quarterly ordinary distributions and the following tablesets out the distribution periods.
Quarterly distribution periods Start End Xd Payment
First interim 01.05.17 31.07.17 01.08.17 30.09.17
Second interim 01.08.17 31.10.17 01.11.17 31.12.17
Third interim 01.11.17 31.01.18 01.02.18 31.03.18
Final 01.02.18 16.03.18 16.03.18 29.03.18
The following tables set out for each distribution the rates per sharefor both Group 1 and Group 2 shares.
Group 1 shares are those purchased prior to a distribution period andtherefore their income rate is the same as the distribution rate.
Group 2 shares are those purchased during a distribution period andtherefore their distribution rate is made up of income and equalisation.Equalisation is the average amount of income included in thepurchase price of all Group 2 shares and is refunded to the holders ofthese shares as a return of capital. Being capital it is not liable toIncome Tax. Instead, it must be deducted from the cost of shares forCapital Gains Tax purposes. The tables below show the split of theGroup 2 rates into the income and equalisation components.
As a result of the merger of M&G Prudent Allocation Fund into M&G(Lux) Conservative Allocation Fund on 16 March 2018, any incomeavailable for distribution up to the effective date of the merger was paidas a final distribution to shareholders on 29 March 2018.
Euro Class ‘A’ Income shares
Ordinary distributions Group 2 Group 1 & 2for the year Income Equalisation Distributionto 30 April 2018 2018 2018 2017
¢ ¢ ¢ ¢First interim 0.7870 2.7299 3.5169 1.5774
Second interim 0.8816 2.4118 3.2934 4.9872
Third interim 0.9534 1.6925 2.6459 4.8751
Final 0.8177 1.1692 1.9869 4.6429
Euro Class ‘A’ Accumulation shares
Ordinary distributions Group 2 Group 1 & 2for the year Income Equalisation Distributionto 30 April 2018 2018 2018 2017
¢ ¢ ¢ ¢First interim 0.0000 0.0000 0.0000 0.4419
Second interim 0.0000 0.0000 0.0000 1.1630
Third interim 0.0000 0.0000 0.0000 0.9571
Final 0.0000 0.0000 0.0000 0.8527
Euro Class ‘B’ Income shares
Ordinary distributions Group 2 Group 1 & 2for the year Income Equalisation Distributionto 30 April 2018 2018 2018 2017
¢ ¢ ¢ ¢First interim 1.1884 2.5225 3.7109 0.8755
Second interim 0.8415 2.6279 3.4694 5.1943
Third interim 1.0895 1.6942 2.7837 5.1054
Final 0.9368 1.1513 2.0881 4.9431
Euro Class ‘B’ Accumulation shares
Ordinary distributions Group 2 Group 1 & 2for the year Income Equalisation Distributionto 30 April 2018 2018 2018 2017
¢ ¢ ¢ ¢First interim 0.0000 0.0000 0.0000 0.0000
Second interim 0.0000 0.0000 0.0000 0.0000
Third interim 0.0000 0.0000 0.0000 0.0000
Final 0.0000 0.0000 0.0000 0.0000
Euro Class ‘C’ Income shares
Ordinary distributions Group 2 Group 1 & 2for the year Income Equalisation Distributionto 30 April 2018 2018 2018 2017
¢ ¢ ¢ ¢First interim 2.1913 1.3385 3.5298 2.4987
Second interim 0.8492 2.4727 3.3219 4.6096
Third interim 0.4801 2.1964 2.6765 4.4856
Final 0.6148 1.3853 2.0001 4.3703
Euro Class ‘C’ Accumulation shares
Ordinary distributions Group 2 Group 1 & 2for the year Income Equalisation Distributionto 30 April 2018 2018 2018 2017
¢ ¢ ¢ ¢First interim 0.1954 1.3785 1.5739 1.9583
Second interim 0.0690 1.2914 1.3604 2.8342
Third interim 0.0047 0.6647 0.6694 2.6291
Final 0.3313 0.6917 1.0230 2.5091
Swiss franc Class ‘A-H’ Accumulation shares
Ordinary distributions Group 2 Group 1 & 2for the year Income Equalisation Distributionto 30 April 2018 2018 2018 2017
¢ ¢ ¢ ¢First interim 0.0000 0.0000 0.0000 n/a
Second interim 0.0000 0.0000 0.0000 0.5717
Third interim 0.0000 0.0000 0.0000 0.8823
Final 0.0000 0.0000 0.0000 0.8340
Swiss franc Class ‘C-H’ Accumulation shares
Ordinary distributions Group 2 Group 1 & 2for the year Income Equalisation Distributionto 30 April 2018 2018 2018 2017
¢ ¢ ¢ ¢First interim 0.2299 1.2463 1.4762 n/a
Second interim 0.0000 1.3604 1.3604 1.9747
Third interim 0.0000 0.6027 0.6027 2.5631
Final 0.5202 0.4678 0.9880 2.3613
ANNUAL LONG REPORT AND AUDITED FINANCIAL STATEMENTS • April 2018 43
M&G Prudent Allocation FundFinancial statements and notes
Notes to the financial statements

US dollar Class ‘A-H’ Income shares
Ordinary distributions Group 2 Group 1 & 2for the year Income Equalisation Distributionto 30 April 2018 2018 2018 2017
¢ ¢ ¢ ¢First interim 1.2833 2.2518 3.5351 1.4913
Second interim 1.2722 2.1047 3.3769 5.0024
Third interim 1.5263 1.2220 2.7483 4.9270
Final 0.6121 1.4577 2.0698 4.6950
US dollar Class ‘A-H’ Accumulation shares
Ordinary distributions Group 2 Group 1 & 2for the year Income Equalisation Distributionto 30 April 2018 2018 2018 2017
¢ ¢ ¢ ¢First interim 0.0000 0.0000 0.0000 0.3969
Second interim 0.0000 0.0000 0.0000 1.0920
Third interim 0.0000 0.0000 0.0000 0.8591
Final 0.0000 0.0000 0.0000 0.8407
US dollar Class ‘C-H’ Income shares
Ordinary distributions Group 2 Group 1 & 2for the year Income Equalisation Distributionto 30 April 2018 2018 2018 2017
¢ ¢ ¢ ¢First interim 3.2749 0.0000 3.2749 2.4991
Second interim 0.0072 3.4109 3.4181 4.6084
Third interim 2.7837 0.0000 2.7837 4.4713
Final 0.6098 1.4873 2.0971 4.1382
US dollar Class ‘C-H’ Accumulation shares
Ordinary distributions Group 2 Group 1 & 2for the year Income Equalisation Distributionto 30 April 2018 2018 2018 2017
¢ ¢ ¢ ¢First interim 1.6197 0.0000 1.6197 1.9057
Second interim 0.0000 1.3421 1.3421 2.7232
Third interim 0.0000 0.6450 0.6450 2.5200
Final 0.3605 0.6620 1.0225 2.4944
ANNUAL LONG REPORT AND AUDITED FINANCIAL STATEMENTS • April 201844
M&G Prudent Allocation FundFinancial statements and notes
Notes to the financial statements
23 Dividend distribution tables (continued)

ANNUAL LONG REPORT AND AUDITED FINANCIAL STATEMENTS • April 2018 45
M&G Investment Funds (14)Other regulatory disclosures
Remuneration
In line with the requirements of the Undertakings for CollectiveInvestment in Transferable Securities (UCITS) V, the UCITS Manageris subject to a remuneration policy which is consistent with theprinciples outlined in SYSC19E of the FCA Handbook (UCITSRemuneration Code).
The remuneration policies are designed to ensure that any relevantconflicts of interest can be managed appropriately at all times and thatthe remuneration of its staff is in line with the risk policies andobjectives of the UCITS funds it manages. Further details of theremuneration policy applicable at an M&G Limited level can be foundhere www.mandg.com/en/corporate/about-mg/our-people. M&G’sremuneration policy is reviewed on an annual basis, or more frequentlywhere required, and approved by the M&G Remuneration Committee.
The UCITS management company is required under UCITS to makequantitative disclosures of remuneration. These disclosures are madein line with M&G’s interpretation of currently available guidance onquantitative remuneration disclosures. As market or regulatoryguidance evolves, M&G may consider it appropriate to make changesto the way in which quantitative disclosures are calculated. Membersof staff and senior management typically provide both UCITS andnon-UCITS related services and have a number of areas ofresponsibility. Therefore, only the portion of remuneration for thoseindividuals’ services which may be attributable to UCITS is includedin the remuneration figures disclosed. Accordingly the figures are notrepresentative of any individual’s actual remuneration.
M&G Securities Limited does not directly employ any staff members.However, for the financial year ended 31 December 2017, aggregateremuneration of £39,245,473 (£4,916,932 in respect of fixedremuneration and £34,328,541 in respect of variable remuneration)was paid to individuals whose actions may have a material impact onthe risk profile of the UCITS Manager, of which £1,812,300 related tosenior management.
Swiss investor information
For funds registered in Switzerland we are required by FINMA todisclose the Total Expense Ratio (TER).
For these funds the TERs are the same as the operating chargesdisclosed in each fund’s financial highlights section under‘Performance and charges’.

Accumulation shares: A type of share where distributions areautomatically reinvested and reflected in the value of the shares.
Accumulation units: A type of unit where distributions areautomatically reinvested and reflected in the value of the units.
Asset: Anything having commercial or exchange value that is ownedby a business, institution or individual.
Asset allocation: Apportioning a portfolio’s assets according to risktolerance and investment goals.
Asset class: Category of assets, such as cash, company shares,fixed income securities and their sub-categories, as well as tangibleassets such as real estate.
Bond:A loan in the form of a security, usually issued by a governmentor company, which normally pays a fixed rate of interest over a giventime period, at the end of which the initial amount borrowed is repaid.
Bond issue: A set of fixed income securities offered for sale to thepublic by a company or government. If the bonds are sold for the firsttime, it is called a ‘new issue’.
Bottom-up selection: Selecting stocks based on the attractivenessof a company.
Bunds: Fixed income securities issued by the German government.
Capital: Refers to the financial assets, or resources, that a companyhas to fund its business operations.
Capital growth: Occurs when the current value of an investment isgreater than the initial amount invested.
Capital return: The term for the gain or loss derived from aninvestment over a particular period. Capital return includes capital gainor loss only and excludes income (in the form of interest or dividendpayments).
Cash equivalents: Deposits or investments with similarcharacteristics to cash.
Comparative sector: A group of funds with similar investmentobjectives and/or types of investment, as classified by bodies such asthe Investment Association (IA) or Morningstar™. Sector definitionsare mostly based on the main assets a fund should invest in, and mayalso have a geographic focus. Sectors can be the basis for comparingthe different characteristics of similar funds, such as their performanceor charging structure.
Consumer Prices Index (CPI): An index used to measure inflation,which is the rate of change in prices for a basket of goods andservices. The contents of the basket are meant to be representativeof products and services we typically spend our money on.
Convertible bonds: Fixed income securities that can be exchangedfor predetermined amounts of company shares at certain times duringtheir life.
Corporate bonds: Fixed income securities issued by a company.They are also known as bonds and can offer higher interest paymentsthan bonds issued by governments as they are often considered morerisky.
Coupon: The interest paid by the government or company that hasraised a loan by selling bonds.
Credit: The borrowing capacity of an individual, company orgovernment. More narrowly, the term is often used as a synonym forfixed income securities issued by companies.
Credit default swaps (CDS): Are a type of derivative, namelyfinancial instruments whose value, and price, are dependent on oneor more underlying assets. CDS are insurance-like contracts that allowinvestors to transfer the risk of a fixed income security defaulting toanother investor.
Credit rating: An independent assessment of a borrower’s ability torepay its debts. A high rating indicates that the credit rating agencyconsiders the issuer to be at low risk of default; likewise, a low ratingindicates high risk of default. Standard & Poor’s, Fitch and Moody’sare the three most prominent credit rating agencies. Default meansthat a company or government is unable to meet interest payments orrepay the initial investment amount at the end of a security’s life.
Credit rating agency: A company that analyses the financialstrength of issuers of fixed income securities and attaches a rating totheir debt. Examples include Standard & Poor’s and Moody’s.
Credit risk: Risk that a financial obligation will not be paid and a losswill result for the lender.
Credit selection: The process of evaluating a fixed income security,also called a bond, in order to ascertain the ability of the borrower tomeet its debt obligations. This research seeks to identify theappropriate level of default risk associated with investing in thatparticular bond.
Credit spread: The difference between the yield of a corporate bond,a fixed income security issued by a company, and a government bondof the same life span. Yield refers to the income received from aninvestment and is expressed as a percentage of the investment’scurrent market value.
Default: When a borrower does not maintain interest payments orrepay the amount borrowed when due.
Default risk: Risk that a debtholder will not receive interest and fullrepayment of the loan when due.
Derivatives: Financial instruments whose value, and price, aredependent on one or more underlying assets. Derivatives can be usedto gain exposure to, or to help protect against, expected changes inthe value of the underlying investments. Derivatives may be traded ona regulated exchange or traded over the counter.
Developed economy/market:Well-established economies with ahigh degree of industrialisation, standard of living and security.
Dilution adjustments: The dilution adjustment is used to protectongoing investors against the transaction charges incurred in investingor divesting in respect of creations and cancellations. The dilutionadjustment is made up of the direct and indirect transaction charges.In the financial statements the direct transaction charges as apercentage of average NAV will be disclosed. This percentage will takeaccount of those direct transaction charges that have been recoveredthrough the dilution adjustment leaving a percentage that justrepresents the costs incurred in portfolio management.
Distribution: Distributions represent a share in the income of thefund and are paid out to Income shareholders or reinvested forAccumulation shareholders at set times of the year (monthly, quarterly,half-yearly or annually). They may either be in the form of interestdistributions or dividend distributions.
Distribution yield: Expresses the amount that is expected to bedistributed by the fund over the next 12 months as a percentage of theshare price as at a certain date. It is based on the expected grossincome less the ongoing charges.
ANNUAL LONG REPORT AND AUDITED FINANCIAL STATEMENTS • April 201846
Glossary

ANNUAL LONG REPORT AND AUDITED FINANCIAL STATEMENTS • April 2018 47
M&G Example Fund Example Second LineGlossary
Diversification: The practice of investing in a variety of assets. Thisis a risk management technique where, in a well-diversified portfolio,any loss from an individual holding should be offset by gains in otherholdings, thereby lessening the impact on the overall portfolio.
Dividend: Dividends represent a share in the profits of a companyand are paid out to the company’s shareholders at set times of theyear.
Duration:A measure of the sensitivity of a fixed income security, alsocalled a bond, or bond fund to changes in interest rates. The longer abond or bond fund’s duration, the more sensitive it is to interest ratemovements.
Duration risk: The longer a fixed income security, also called a bond,or bond fund’s duration, the more sensitive and therefore at risk it is tochanges in interest rates.
Emerging economy or market:Economies in the process of rapidgrowth and increasing industrialisation. Investments in emergingmarkets are generally considered to be riskier than those in developedmarkets.
Equities: Shares of ownership in a company.
Exchange traded: Usually refers to investments traded on anexchange, such as company shares on a stock exchange.
Ex-dividend, ex-distribution or XD date: The date on whichdeclared distributions officially belong to underlying investors.
Exposure: The proportion of a fund invested in a particularshare/fixed income security, sector/region, usually expressed as apercentage of the overall portfolio.
Fixed income security: A loan in the form of a security, usuallyissued by a government or company, which normally pays a fixed rateof interest over a given time period, at the end of which the initialamount borrowed is repaid. Also referred to as a bond.
Floating rate notes (FRNs): Securities whose interest (income)payments are periodically adjusted depending on the change in areference interest rate.
Foreign exchange: The exchange of one currency for another, orthe conversion of one currency into another currency. Foreignexchange also refers to the global market where currencies are tradedvirtually around the clock. The term foreign exchange is usuallyabbreviated as ‘forex’ and occasionally as ‘FX’.
Foreign exchange (FX) strategy: Currencies can be an assetclass in its own right, along with company shares, fixed incomesecurities, property and cash. Foreign exchange strategy can thereforebe a source of investment returns.
Forward contract: A contract between two parties to buy or sell aparticular commodity or financial instrument at a pre-determined priceat a future date. Examples include foward currency contracts.
Fundamentals (company): A basic principle, rule, law, or the like,that serves as the groundwork of a system. A company’sfundamentals pertain specifically to that company, and are factors suchas its business model, earnings, balance sheet and debt.
Fundamentals (economic): A basic principle, rule, law, or the like,that serves as the groundwork of a system. Economic fundamentalsare factors such as inflation, employment, economic growth.
Futures: A futures contract is a contract between two parties to buyor sell a particular commodity or financial instrument at a pre-determined price at a future date. Futures are traded on a regulatedexchange.
Gilts: Fixed income securities issued by the UK government.
Government bonds: Fixed income securities issued bygovernments, that normally pay a fixed rate of interest over a giventime period, at the end of which the initial investment is repaid.
Hedging: A method of reducing unnecessary or unintended risk.
High water mark (HWM): The highest level that a fund’s NAV (netasset value) has reached at the end of any 12-month accountingperiod.
High yield bonds: Fixed income securities issued by companies witha low credit rating from a recognised credit rating agency. They areconsidered to be at higher risk of default than better quality, ie higher-rated fixed income securities but have the potential for higher rewards.Default means that a company or government is unable to meetinterest payments or repay the initial investment amount at the end ofa security’s life.
Historic yield: The historic yield reflects distributions declared overthe past 12 months as a percentage of the share price, as at the dateshown.
Income yield:Refers to the income received from an investment andis usually expressed annually as a percentage based on theinvestment’s cost, its current market value or face value.
Index: An index represents a particular market or a portion of it,serving as a performance indicator for that market.
Income shares: A type of share where distributions are paid out ascash on the payment date.
Income units:A type of unit where distributions are paid out as cashon the payment date.
Index tracking:A fund management strategy that aims to match thereturns from a particular index.
Index-linked bonds: Fixed income securities where both the valueof the loan and the interest payments are adjusted in line with inflationover the life of the security. Also referred to as inflation-linked bonds.
Inflation: The rate of increase in the cost of living. Inflation is usuallyquoted as an annual percentage, comparing the average price thismonth with the same month a year earlier.
Inflation risk: The risk that inflation will reduce the return of aninvestment in real terms.
Initial public offering (IPO): The first sale of shares by a privatecompany to the public.
Interest rate risk: The risk that a fixed income investment will losevalue if interest rates rise.
Interest rate swap: An agreement between two parties to swap afixed interest payment with a variable interest payment over a specifiedperiod of time.
Investment Association (IA): The UK trade body that representsfund managers. It works with investment managers, liaising withgovernment on matters of taxation and regulation, and also aims tohelp investors understand the industry and the investment optionsavailable to them.

Issuer: An entity that sells securities, such as fixed income securitiesand company shares.
Investment grade bonds: Fixed income securities issued by acompany with a medium or high credit rating from a recognised creditrating agency. They are considered to be at lower risk from default thanthose issued by companies with lower credit ratings. Default meansthat a company or government is unable to meet interest payments orrepay the initial investment amount at the end of a security’s life.
Issuer: An entity that sells securities, such as fixed income securitiesand company shares.
Leverage: When referring to a company, leverage is the level of acompany’s debt in relation to its assets. A company with significantlymore debt than capital is considered to be leveraged. It can also referto a fund that borrows money or uses derivatives to magnify aninvestment position.
Liquidity: A company is considered highly liquid if it has plenty ofcash at its disposal. A company’s shares are considered highly liquidif they can be easily bought or sold since large amounts are regularlytraded.
Long position: Refers to ownership of a security held in theexpectation that the security will rise in value.
Macroeconomic: Refers to the performance and behaviour of aneconomy at the regional or national level. Macroeconomic factors suchas economic output, unemployment, inflation and investment are keyindicators of economic performance. Sometimes abbreviated to‘macro’.
Maturity: The length of time until the initial investment amount of afixed income security is due to be repaid to the holder of the security.
Modified duration: A measure of the sensitivity of a fixed incomesecurity, called a bond, or bond fund to changes in interest rates. Thelonger a bond or bond fund’s duration, the more sensitive it is to interestrate movements.
Monetary easing: When central banks lower interest rates or buysecurities on the open market to increase the money in circulation.
Monetary policy:A central bank’s regulation of money in circulationand interest rates.
Monetary tightening: When central banks raise interest rates orsell securities on the open market to decrease the money in circulation.
Morningstar™: A provider of independent investment research,including performance statistics and independent fund ratings.
Near cash: Deposits or investments with similar characteristics tocash.
Net asset value (NAV): A fund’s net asset value is calculated bytaking the current value of the fund’s assets and subtracting itsliabilities.
Ongoing Charge Figure: The Ongoing Charge Figure includescharges for the following items: management of the fund (also knownas Annual Management Charge), administration services, servicesprovided by external parties which include depository, custody andaudit, as well as incorporating the ongoing charge figure from fundsheld in the portfolio (taking into account any rebates).
Open-ended investment company (OEIC): A type of managedfund, whose value is directly linked to the value of the fund’s underlyinginvestments.
Options: Financial contracts that offer the right, but not the obligation,to buy or sell an asset at a given price on or before a given date in thefuture.
Over-the-counter (OTC): Whereby financial assets are tradeddirectly between two parties. This is in contrast to exchange trading,which is carried out through exchanges set up specifically for thepurpose of trading. OTC is also known as off-exchange trading.
Overweight: If a fund is ‘overweight’ a stock, it holds a largerproportion of that stock than the comparable index or sector.
Payment date: The date on which distributions will be paid by thefund to investors, usually the last business day of the month.
Physical assets: An item of value that has tangible existence, forexample, cash, equipment, inventory or real estate. Physical assetscan also refer to securities, such as company shares or fixed incomesecurities.
Portfolio transaction cost: The cost of trading, such as brokerage,clearing, exchange fees and bid-offer spread as well as taxes such asstamp duty.
Preference shares: Preference shares are a loan to a company thatmay be traded in the same way as ordinary shares, but generally havea higher yield and pay dividends on fixed dates. Preference shareshave varying characteristics as to the treatment of the principal andthe dividend payment, which includes ranking them above ordinaryshares when it comes to dividend payments.
Principal: The face value of a fixed income security, which is theamount due back to the investor by the borrower when the securityreaches the end of its life.
Private placement:An offer of sale of securities to a relatively smallnumber of investors selected by the company, generally investmentbanks, mutual funds, insurance companies or pension funds.
Property Expense Ratio (PER): Property expenses are theoperating expenses that relate to the management of the propertyassets in the portfolio. These include: insurance and rates, rent reviewand lease renewal costs and maintenance and repairs, but notimprovements. They depend on the level of activity taking place withinthe fund. The Property Expense Ratio is the ratio of property expensesto the fund’s net asset value.
Real yield: The return of an investment, adjusted for changes inprices in an economy.
Retail Prices Index (RPI): A UK inflation index that measures therate of change in prices for a basket of goods and services in the UK,including mortgage payments and council tax.
Risk: The chance that an investment’s return will be different to whatis expected. Risk includes the possibility of losing some or all of theoriginal investment.
Risk management: The term used to describe the activities the fundmanager undertakes to limit the risk of a loss in a fund.
Risk premium: The difference between the return from a risk-freeasset, such as a high-quality government bond or cash, and the returnfrom an investment in any other asset. The risk premium can beconsidered the ‘price’ or ‘pay-off’ for taking on increased risk. A higherrisk premium implies higher risk.
Risk-free asset: An asset that notionally carries no risk of non-payment by the borrower such as a high-quality fixed income securityissued by a government or cash.
ANNUAL LONG REPORT AND AUDITED FINANCIAL STATEMENTS • April 201848
Glossary

Risk/reward ratio: A ratio comparing the expected returns of aninvestment with the amount of risk undertaken.
Safe-haven assets: Refers to assets that investors perceive to berelatively safe from suffering a loss in times of market turmoil.
Security: Financial term for a paper asset – usually a share in acompany or a fixed income security also known as a bond.
Share class: Each M&G fund has different share classes, such as A,R and I. Each has a different level of charges and minimuminvestment. Details on charges and minimum investments can befound in the Key Investor Information Documents.
Share class hedging: Activities undertaken in respect of hedgedshares to mitigate the impact on performance of exchange ratemovements between the fund’s currency exposure and the investor’schosen currency.
Short position: A way for a fund manager to express his or her viewthat the market might fall in value.
Short selling: This often refers to the practice whereby an investorsells an asset they do not own. The investor borrows the asset fromsomeone who does own it and pays a fee. The investor musteventually return the borrowed asset by buying it in the open market.If the asset has fallen in price, the investor buys it for less than theysold it for, thus making a profit. The contrary may also occur.
Short-dated corporate bonds: Fixed income securities issued bycompanies and repaid over relatively short periods.
Short-dated government bonds: Fixed income securities issuedby governments and repaid over relatively short periods.
Sovereign debt: Debt of a government. Also referred to asgovernment bonds.
Sub-investment grade bonds: Fixed income securities issued bya company with a low rating from a recognised credit rating agency.They are considered to be at higher risk from default than those issuedby companies with higher credit ratings. Default means that a companyor government is unable to meet interest payments or repay the initialinvestment amount at the end of a security’s life.
Top-down investing: An investment approach that analyseseconomic factors, ie surveys the ‘big picture’, before selecting whichcompanies to invest in. The top-down investor will look at whichindustries are likely to generate the best returns in certain economicconditions and limit the search to that area.
Total return: The term for the gain or loss derived from an investmentover a particular period. Total return includes income (in the form ofinterest or dividend payments) and capital gains.
Treasuries: Fixed income securities issued by the US government.
Triple A or AAA rated: The highest possible rating a fixed incomesecurity, also called a bond, can be assigned by credit rating agencies.Bonds that are rated AAA are perceived to have the lowest risk ofdefault. Default means that a company or government is unable tomeet interest payments or repay the initial investment amount at theend of a security’s life.
UCITS: Stands for Undertakings for Collective Investment inTransferable Securities. This is the European regulatory framework foran investment vehicle that can be marketed across the EuropeanUnion and is designed to enhance the single market in financial assetswhile maintaining high levels of investor protection.
Unconstrained: The term used to describe the mandate of a fundwhereby the manager has the freedom to invest according to his orher own strategy, not being obliged to allocate capital according to theweightings of any index, for example.
Underlying value: The fundamental value of a company, reflectingboth tangible and intangible assets, rather than the current marketvalue.
Underlying yield:Refers to the income received by a managed fund,and is usually expressed annually as a percentage based on the fund’scurrent value.
Underweight: If a portfolio is ‘underweight’ a stock, it holds a smallerproportion of that stock than the comparable index or sector.
Unit trust: A type of managed fund, whose value is directly linked tothe value of the fund’s underlying investments.
Unit/share type: Type of units/shares held by investors in a trust orfund (unit/share types differ by features such as whether income is tobe paid out as cash or reinvested on the payment date).
Valuation: The worth of an asset or company based on its currentprice.
Volatile: When the value of a particular share, market or sectorswings up and down fairly frequently and/or significantly, it isconsidered volatile.
Volatility: The degree to which a given security, fund, or index rapidlychanges. It is calculated as the degree of deviation from the norm forthat type of investment over a given time period. The higher thevolatility, the riskier the security tends to be.
Warrant: A security issued by a company that gives the holder theright to buy shares in that company at a specified price and within acertain timeframe.
Yield: This refers to either the interest received from a fixed incomesecurity or to the dividends received from a share. It is usuallyexpressed as a percentage based on the investment’s costs, its currentmarket value or its face value. Dividends represent a share in theprofits of the company and are paid out to a company’s shareholdersat set times of the year.
Yield (equity): Refers to the dividends received by a holder ofcompany shares and is usually expressed annually as a percentagebased on the investment’s cost, its current market value or face value.Dividends represent a share in the profits of the company and are paidout to a company’s shareholders at set times of the year.
Yield (bonds): This refers to the interest received from a fixed incomesecurity and is usually expressed annually as a percentage based onthe investment’s cost, its current market value or its face value.
Yield (income): Refers to the income received from an investmentand is usually expressed annually as a percentage based on theinvestment’s cost, its current market value or face value.
ANNUAL LONG REPORT AND AUDITED FINANCIAL STATEMENTS • April 2018 49
Glossary
M&G Securities Limited is authorised and regulated by the Financial Conduct
Authority and provides investment products. The Company’s registered office is
Laurence Pountney Hill, London EC4R 0HH. Registered in England number 90776.

56683_CR_300619