Embed Size (px)
DESCRIPTION
MFP 101: Seven Easy Steps to Understanding the Minimum Foundation Program Formula. LEADS Conference July 26, 2006. MFP Purpose. Determine the cost of a minimum foundation program of education in the State Equitably distribute State funds to local school systems. Level 1 - How It Works. - PowerPoint PPT Presentation
Citation preview


MFP 101: Seven Easy Steps to Understanding
the Minimum Foundation Program Formula
LEADS Conference July 26, 2006

MFP Purpose
Determine the cost of a minimum foundation program of education in the State
Equitably distribute State funds to local school systems

Level 1 - How It Works Determines cost of education in
every school district Cost = Weighted Student Count
times Weighted Per Pupil Amount At-Risk, Vocational Education,
Special Education, and Gifted/Talented Students plus Small Districts weighted to provide extra funding

Special EducationOther
Exceptionalities1.50
Special EducationOther
Exceptionalities1.50
Special EducationGifted & Talented
.60
Special EducationGifted & Talented
.60
Voc-ed Units
.05
Voc-ed Units
.05
Oct. 1 Membership1.00
Oct. 1 Membership1.00
At-Risk Students
.17
At-Risk Students
.17
Economy of Scale
Max .20
Economy of Scale
Max .20
= TOTAL WEIGHTED MEMBERSHIP
Student Characteristics & Weights
plusplus
plusplus
plusplus
plusplus
plusplus

time
stim
e
sBase Per Pupil
Amount
Base Per Pupil Amount
TOTAL LEVEL 1 COSTS
TOTAL LEVEL 1 COSTS
Total Weighted Membership
Total Weighted Membership
Total Level 1 Costs

Level 1 - How It Works (cont’d)
Determines proportion of total cost to be shared between State and local systems
Local school district share based on local sales and property tax capacity
On average, State provides 65% and local districts provide 35% of cost
Actual percentage varies by district according to district’s wealth

Property and Sales Tax Revenues plus Other
Revenues
Total Fiscal Capacity
Fiscal Capacity Per
Pupil
Divided by
StudentsEquals
Equals
Fiscal Capacity

Fiscal Capacity Per Pupil
State Average
Fiscal Capacity Per
PupilLocal Wealth Factor
Local Wealth Factor
Divided by
Equal
s

Local Wealth Factor
Weighted Proportion
of State Membership
Local Equalization
Factor
Local Equalization Factor
Equal
sEqual
s
Time
sTime
s

Local Equalization
Factor Total Level 1
Costs
35%
Local Support of Level 1 Costs
times
times
Local Support of Level 1 Costs

Total Level 1 Costs
Total Level 1 Costs
Local Support of Level 1 Costs
State Support of Level 1 Costs
lessless
State Support of Level 1 Costs

Level 2 - How It Works
Rewards local school systems that contribute a greater portion towards the cost of education through raising local tax revenues
Approximately 40 cents on the dollar up to a maximum amount

Total Level 1 Costs
33%
Limit of State Level 2 Support
timetimess
Determining the Level 2 Limit

Total Local Revenue
Level 1 Local Revenue
Local Revenue above Level 1
lessless
Determining Local Revenue Eligible for Level
2 Funding

40% of Equalized Local Wealth Factor
1-[(1-.40)X LWF)]
Eligible Revenue
(lesser of Local Revenue Above Level 1 or Local Revenue Limit)
times
Level 2 Funding
equals
Level 2 – Reward Funding

Level 3 - How It Works
Includes continuation funding for items such as prior across the board teacher pay raise, prior support worker pay raise, salaries for foreign associate teachers, and hold harmless funding

MFP – Use of Funds
MFP is a block grant from the State to local school districts
Funds not earmarked for specific purposes
Provides flexibility to school districts in spending funds as long as program requirements are met

Instructional Expenditure Requirement
Districts must ensure 70% of general fund expenditures are on instructional activities
Instruction includes: classroom instruction, pupil support, instructional staff services, and school administration activities•FY 06-07 formula adds school
administration to capture principals and assistant principals

Instructional Expenditure Requirement
All expenditure categories directly touch the student
Restricts educational school expenditures to school building level only (new to FY06-07 formula)
Central office expenditures will not be considered when measuring the 70% requirement

FY 2006-2007 Certificated and Non-Certificated Pay Raise
Certificated Pay Raise of $1,500•Plus 15.8% for the employer share
of retirement Non-certificated/Support Worker
Pay Raise of $500•Plus 17.7% for the employer share
of retirement

FY 2006-2007 Certificated and Non-Certificated Pay Raise
Initial allocation based on Spring 2006 PEP Data
Actual allocation will be based on October 2, 2006 PEP Data collection
Add to salary schedules by August 1, 2006 and begin paying out raises

Certificated Pay Raise Requirement
Provides that 50% of a district’s increased funds provided in Levels 1 and 2 over the prior year (“growth funds”) shall be used only to supplement and enhance full-time certificated staff salaries and retirement benefits.•“Growth funds” are adjusted for increases in
student membership•Exempts districts with teacher salaries above
the SREB average ($42,291) from the 50% pay raise requirement
Applies to DeSoto, St. James, and West Feliciana

Mid-year Supplemental Funding
Mid-year Supplemental Funding •Student Increases: provided if
increase in students = 50 students or 1% of student population
•Provides for two mid-year adjustments
May 1, 2006 compared to October 2, 2006 • (Increase times per pupil amount)
October 2, 2006 compared to February 1, 2006
• (Increase times one-half of per pupil amount)

Additions to FY2006-2007 MFP
Provides for $80 per student for Mandated Costs (increased from $60 in FY05-06 revised budget letter)
Provides for 15% cap in sales tax base for purposes of calculating the Local Wealth Factor (reduced from 20% cap)
Adds students with Limited English Proficiency to the at-risk student count

FY2006-2007 MFPProvisions for Storm Impacted
Districts
Applicable to:•City of Bogalusa
•Cameron
•Jefferson
•Orleans
•Plaquemines
•St. Bernard

FY2006-2007 MFPProvisions for Storm Impacted
Districts
Uses a minimum percentage of October 1, 2004 student count for funding•Allows for greater budgetary stability
Adjusts FY2004-2005 local revenues by the same percentage set for student minimums•Provides stability to Local Wealth Factor

Critical Dates - October SIS
•Count Date = as of 10.2.06•Close Date = 10.31.06
PEP•Count Date = as of 10.2.06•Close Date = 10.11.06
•Impacts funding for mid-year adjustment for student growth and allocations for certificated and non-certificated pay raises

Critical Dates - October SER
•Close Date = 10.31.06
•Data will be used for IDEA reporting
•Snapshot taken as of 10.31.06
•No impact to MFP payments
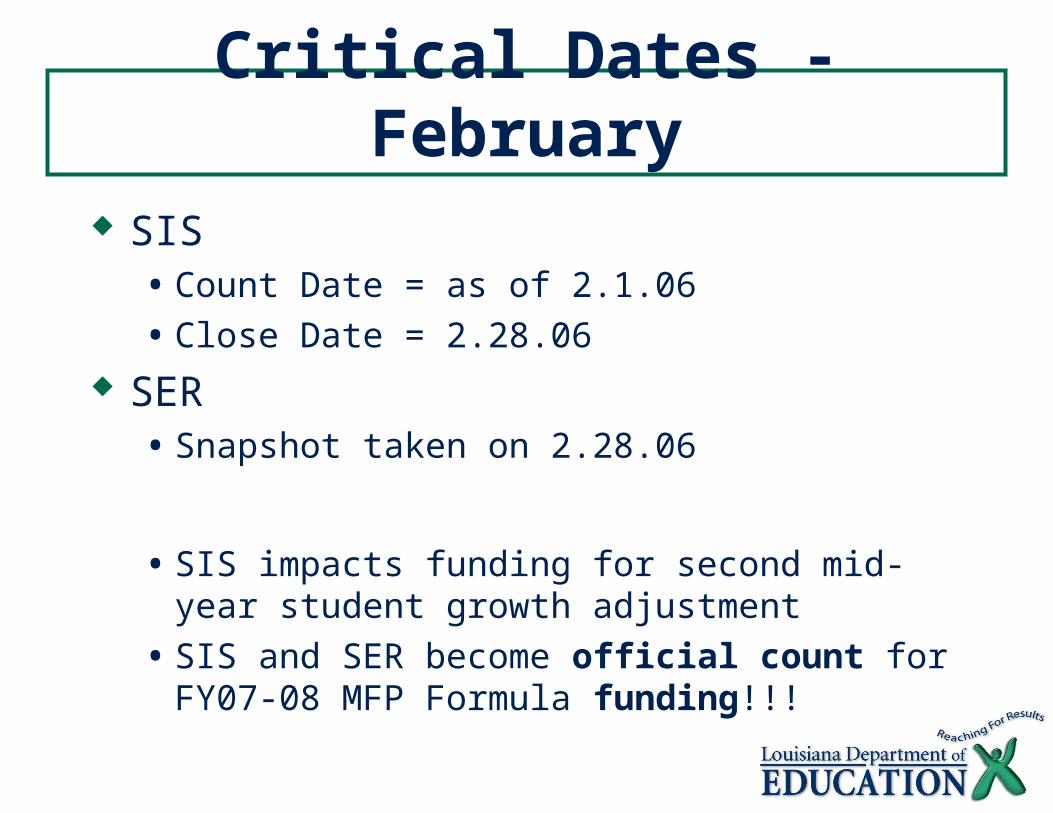
Critical Dates - February SIS
• Count Date = as of 2.1.06
• Close Date = 2.28.06 SER
• Snapshot taken on 2.28.06
• SIS impacts funding for second mid-year student growth adjustment
• SIS and SER become official count for FY07-08 MFP Formula funding!!!

Critical Dates - LEADS LEADS
•Class schedule data = as of 10.2.06
•Close Date = 12.8.06
•LEAs may begin transmission of class schedule data during October 2 SIS and PEP submissions
•Becomes official voc ed count for FY07-08 MFP Formula funding!!!

Helpful Web Links
MFP Webpage:• http://www.louisianaschools.net/lde/finance/
673.html
MFP Payments:• http://www.louisianaschools.net/lde/appropriatio
n/908.html
Data Collection Systems:• http://www.louisianaschools.net/lde/pair/638.
html