Embed Size (px)
Citation preview

QualityOrientedMarketing
of
HARDWINTERWHEAT
Adescription of
quality evaluationtechniques
COOPERATIVE EXTENSION SERVICEKANSAS STATE UNIVERSITY
MANHATTAN, KANSAS
Hard Winter Wheat Growing Areas in the United States
HARD RED WINTER WHEAT HARD WHITE WHEAT

• • • • • • • • • • • • • • • • • • • • • • • •
EVALUATION EQUIPMENT
D
E
F G H
I
J
ASinglekernel wheatcharacteriza-tion system
CRapid ViscoAnalyzer
DRotap kernelsize test
ECarter Daydockage tester
GFarinographrecordingdough mixer
HQuadrumatSeniorlaboratoryflour mill
IFallingNumber
JAlveographephysicaldough testingequipment
A
CB
BMCI Kickerlaboratorygrain cleaner
FMixographrecordingdough mixer

• • • • • • • • • • • • • • • • • • • • • • • • • • • • • • • • • • • • • • • • • • • Quality Oriented Marketing of Hard Winter Wheat 1
ContentsPhysical QualityCharacteristics 3
Sanitary and SafetyQuality Characteristics 7
Intrinsic QualityCharacteristics 9
Case Study:Economic andQuality Comparisons 13
Future Technologyfor Measuring Quality 14
Summary 14
Glossary 15
Appendix 1 21
Literature Cited 23
Wheat Kernel DamageA) WHEAT HEAT DAMAGE kernels and pieces of kernels of wheat damaged
by heat and materially discolored to the extent shown.Whole kernels of wheat must occasionally be cross-sectioned (see Kernel 3) toconfirm the entire face of both halves are as dark or darker than shown inKernels 1 or 2.
B) WHEAT GERM DAMAGE (Sick Wheat—Damaged as result of Respiration)Kernels with germs as dark or darker than the kernel shown are damaged.Procedure: Kernels should be scraped carefully with a sharp instrument suchas a pick to avoid scraping too deeply and destroying the evidence of damage.Note: Germs with more intense discoloration require less coverage to beconsidered damage.
C) WHEAT WEEVIL OR INSECT BORED DAMAGE Kernels that have beenbored or tunneled by insects are damaged. Illustrated from left to right:Kernel 1: Kernel that has been tunneled.Kernels 2 and 3: Kernels that have been bored.
D) WHEAT FROST DAMAGE (Flaked) Kernels that have a slight flaked-offbran coat due to frost.Note: Evidence of frost must be present. Do not confuse with kernels that havethe bran coat rubbed off due to handling.
E) WHEAT SPROUT DAMAGE Kernels with the germ covers broken opendue to germination and showing sprouts or from which the sprouts havebroken off are damaged. Illustrated from left to right:Kernel 1: The sprout is broken off leaving part of the germ cover over thesocket area.Kernel 2: The sprout is broken off leaving no germ cover over the socket area.
Note: The starchy area may or may not be discolored.Kernel 3: The germ cover is broken open with a sprout showing at the bottom.Kernel 4: The germ cover is broken open with a sprout showing at the top.
Note: Sprouts must be equal to or greater than shown on Kernels 3 and 4.
F) WHEAT BLIGHT, SCAB DAMAGE Scab damage is a result of disease.Kernels that are scab-damaged have a dull, lifeless, chalky appearance andusually contain mold in the germ or in the crease. Kernels meeting any one ofthe following criteria are damaged. Illustrated from left to right:Kernel 1: Kernels with the scab appearance as shown and as describedabove shall be considered damaged without further examination.Kernel 2: Kernels with the scab appearance as described above andcontaining mold in the crease equal to or greater than shown.Kernel 3: Kernels with the scab appearance as described above andcontaining mold in the germ.
Procedure for Kernel 3: Kernels shall be scraped carefully with the use of asharp instrument such as a pick to avoid scraping too deeply and destroy-ing the evidence of damage.

2 Quality Oriented Marketing of Hard Winter Wheat • • • • • • • • • • • • • • • • • • • • • • • • • • • • • • • • • • • • • • • • • • •
ACKNOWLEDGEMENTS
The authors wish to thank Henry Bahn, StewartDuncan, Jim Frahm, Bob Frisbie, Jeff Gwirtz, DelJepsen, Tom Maxwell, Robert Pudden, Joe Smith, BobStandage, Curt Thompson, and Todd Whitney forreviewing this publication and their many helpfulsuggestions. We also thank Lori Cansler for thepublication design and Mark Stadtlander for editingthis bulletin.

• • • • • • • • • • • • • • • • • • • • • • • • • • • • • • • • • • • • • • • • • • • Quality Oriented Marketing of Hard Winter Wheat 3
U.S. farmers produce about 2.4 billion bushels ofwheat each year. The average annual hard winterwheat production from 1990 to 1994 was 970million bushels valued at an estimated $3.1 billion(Economic Research Service, 1994). Per capitaconsumption of f lour in the United States hasincreased to 144 pounds, and in 1994 flour millsproduced a record 390 million hundredweight(Milling & Baking News, 1995).
Despite these favorable trends in wheat processingand flour utilization, the production and storage ofwheat have become less profitable in recent years.Since 1983 production costs have remained wellabove the market price of wheat with several yearsshowing more than a dollar per bushel difference. Therecent idling of nearly 64 million acres of cropland ingovernment programs (National Grain and FeedAssociation, 1992) and the reduction of governmentgrain storage has rendered nearly 47 percent of thecommercial grain-storage system unused (NationalAgricultural Statistics Service, 1994).
Declining public and private returns to U.S. wheatproducers and concern about the strategic tradeposition of the United States relative to other wheatexporters, especially Canada, have been major factorsin prompting the pursuit of a quality-oriented market-ing system as defined in the Grain Quality Acts of 1986and 1990 (Stiegert, 1995). In these bills Congressmandated the Federal Grain Inspection Service (FGIS)and the Agricultural Research Service (ARS) collaboratein the design and implementation of a quality-basedclassification and grain-grading system.
The single kernel wheat characterization system,which measures individual kernel weight, size,moisture, and hardness, is the first of these newtechnologies that will be incorporated into theofficial grain-inspection system. Scientists through-out the world are involved in developing newtechnologies that rapidly measure and predict end-use qualities in grain (Smail, 1995).
In spite of research advances pertaining to wheatquality characterization and technology developmentto predict wheat end-use quality, most farmers andgrain handlers treat hard red winter wheat as acommodity. The U.S. farm program encouragesproduction of high-yielding wheat with little regard toprocessor needs, and the U.S. grain-grading standardsencourage blending wheat by commercial grainelevators based on grading factors rather than end-usequality. The ratification of the General Agreement onTrade and Tariffs (GATT) by the U.S. Congress andpolitical pressure to reduce farm subsidies create anenvironment more conducive to the adoption of amarketing system that rewards the production andsegregation of wheat based on end-use quality.
In response to these developments, this bulletinwas prepared to help educate producers, grainhandlers, and grain merchandisers in technologyused to evaluate hard winter wheat quality and to
QualityOriented
Marketingof
HARDWINTERWHEAT
Adescription of
quality evaluationtechniques
AuthorsTim Herrman
Robert K. BequettePatrick J. McCluskey
John R. PedersenJoseph G. PonteJames P. Shroyer
explain the relationship between these measure-ments and end-use properties. This is important asindividuals prepare to participate in opportunitiesinvolving value-added marketing of hard winterwheat. The discussion of wheat quality characteris-tics is divided into three categories: physical,sanitary, and intrinsic quality. A case study wasperformed to demonstrate the potential valueassociated with quality-oriented marketing of hardwinter wheat. A glossary of terms pertaining towheat quality, its measurement, f lour types, bakingequipment, and dough properties is included at theback of this bulletin.
Physical Quality CharacteristicsMost hard winter wheat produced in the United
States is marketed using physical quality characteris-tics outlined in the U.S. Wheat Standards (FGIS,1993). Dockage and moisture measurements arereported on the official grain certificate as manda-tory nongrade determining factors. Quality measure-ments that determine grade include test weight,kernel damage, shrunken and broken wheat, foreignmaterial (FM) and the presence of wheat from acontrasting class (Table 1).
Dockage is defined in the U.S. Wheat Standardsas the nonwheat material removed by an approvedcleaning device. The Carter Day dockage tester is theapproved cleaning device for official inspection;however, other grain cleaners are available formeasuring dockage. These mechanical cleanersremove the nonwheat material (dockage) usingaspiration and sieves. In the absence of a mecha-nized method for removing dockage, hand sievesmay be used to remove nonwheat material for thepurpose of estimating dockage. Further details onhand sieving and grain grading methods arepresented in Appendix 1.
Moisture can be measured indirectly usingelectrical meters or a near-infrared spectrophotom-eter (NIR) or by taking a direct moisture measure-ment such as the oven-dry method. The Motomco919 electrical meter, which is approved by FGIS forofficial grain inspection, is accurate within ±0.4percent for wheat ranging in moisture contentbetween 8 and 16 percent.
Changing the moisture content of wheat changesits weight. This relationship is expressed mathemati-cally using the following equation:
% Weight Change (or Moisture Shrink) = Mo–Mf x 100100–Mf
Mo = original or initial moisture content (%)
Mf = Final moisture content (%)
The percent weight change or moisture shrinkwhen wheat dries from 14 percent to 12 percentmoisture content can be calculated as follows:
% Weight Change = 14–12 x 100 = 2.27100–12

4 Quality Oriented Marketing of Hard Winter Wheat • • • • • • • • • • • • • • • • • • • • • • • • • • • • • • • • • • • • • • • • • • •
TABLE 1.GRADES AND GRADE REQUIREMENTS
Grades U.S. Nos.
Grading Factors 1 2 3 4 5
Minimum pound limits of:
Test WeightHard Red Spring wheator White Club wheat
lbs/bu 58.0 57.0 55.0 53.0 50.0
All other classes and subclasseslbs/bu 60.0 58.0 56.0 54.0 51.0
Maximum percent limits of:
DefectsDamaged kernelsHeat (part of total) 0.2 0.2 0.5 1.0 3.0Total 2.0 4.0 7.0 10.0 15.0Foreign material 0.4 0.7 1.3 3.0 5.0Shrunken and broken kernels 3.0 5.0 8.0 12.0 20.0Total1 3.0 5.0 8.0 12.0 20.0
Wheat of other classes2
Contrasting classes 1.0 2.0 3.0 10.0 10.0Total3 3.0 5.0 10.0 10.0 10.0
Stones 0.1 0.1 0.1 0.1 0.1
Maximum count limits of:
Other materialAnimal filth 1 1 1 1 1Castor beans 1 1 1 1 1Crotalaria seeds 2 2 2 2 2Glass 0 0 0 0 0Stone 3 3 3 3 3Unknown foreign substance 3 3 3 3 3Total4 4 4 4 4 4
Insect-damaged kernelsin 100 grams 31 31 31 31 31
U.S. Sample gradeWheat that:
(a) Does not meet the requirements for U.S. Nos. 1, 2, 3, 4, or 5; or(b) Has a musty, sour, or commercially objectionable foreign odor (except smut or
garlic odor); or(c) Is heating or of distinctly low quality
1Includes damaged kernels (total), foreign material, and shrunken and broken kernels.2Unclassed wheat of any grade may contain not more than 10.0 percent of wheat of otherclasses.3Includes contrasting classes.4Includes any combination of animal filth, castor beans, crotalaria seeds, glass, stones, orunknown foreign substance.
A shrink factor can be derived by dividingmoisture shrink by the percent change in moisturecontent (e.g. 2.27 ÷ 2 = 1.135). Many grain elevatorsuse a fixed moisture shrink factor (e.g. 1.2) whendiscounting high-moisture grain.
Test weight is a bulk density measure (weightper given volume) and is reported as pounds perWinchester bushel (bu). Test weight provides a roughestimate of f lour yield potential in hard winterwheat. The cause of low test weight is importantwhen considering wheat end-use performance.Dockage in a wheat sample reduces test weight;therefore, official test weight measures are performed
on dockage-free wheat as specified by the U.S. WheatStandards (FGIS, 1993). Shriveled kernels caused bydisease, drought, and heat stress during kerneldevelopment reduce test weight and flour yield. Alow test weight caused by kernels swelling after arain on physiologically mature wheat may notnecessarily lower f lour yield. Severe weathering,however, may cause a significant deterioration ofintrinsic quality.
Grain moisture content has an inverse relation-ship with test weight. In other words, as moisturecontent increases, test weight decreases. Thisrelationship is expressed by the following equation(Nelson, 1980):
D = 774.4 – 703 M + 18,510 M2 – 1489,960 M3 + 311,600 M4
where: D = density expressed as kg/m3
M = % moisture wet basis/100.
This method of expressing the relationshipbetween density and mass-moisture of grain (forstorage) is part of the American Society of Agricul-tural Engineers (ASAE) and American NationalStandards Institute (ANSI) Standards D241.4 Feb93.Density expressed in kilograms per cubic meter canbe converted to pounds per bushel using theconstant 0.0777 as follows:
D × 0.0777 = lbs/bu
Figure 2 presents the relationship betweenmoisture content and test weight derived from theNelson equation. The six lines represent grain ofdifferent bulk density (e.g. wheat with test weightsof 52, 54, 56, 58, 60 and 62 pounds at 14-percentmoisture). Little change in test weight occursbetween 8 to 12 percent moisture content, whereastest weight declines almost 1 pound per 1 percentincrease in moisture greater than 15 percent.
Foreign material (FM) includes all nonwheatmaterial that remains in the dockage-free andshrunken or broken free portion of a sample. Often,the removal of FM requires more machinery than ispresent in commercial elevators equipped with graincleaners, which clean grain using aspiration andsieves. Disk separators and gravity tables, whichremove nonwheat material based on shape anddensity, respectively, may be required to clean outthe FM from wheat. Both types of cleaning equip-ment are usually present in flour mills and seedhouses. In some cases, it may not be possible toremove the nonwheat material because it so closelyresembles wheat in size, shape, and density. Con-tamination by this type of material may render thewheat unmerchantable for food processing.
Shrunken and broken wheat are those kernelsthat are removed by a Number 2 sieve in the CarterDay dockage tester or that pass through an 8/125–inch(.064) by 3/8–inch screen when using hand sieves.Shrunken and broken kernels are important to f lourmillers since this wheat is usually removed in the

• • • • • • • • • • • • • • • • • • • • • • • • • • • • • • • • • • • • • • • • • • • Quality Oriented Marketing of Hard Winter Wheat 5
cleaning house prior to milling and is sold as mill-feed at a substantial discount compared to f lour.
Kernel damage is based on a visual assessmentof kernel defects (Figure 1, front inside cover).Pictures of kernel damage in Figure 1 were repro-duced from interpretive line slides that are used bygrain inspectors. Kernels of wheat with the degreeof damage (or more) represented in the picture are“picked” as damaged kernels. These kernels areweighed and reported as a percent for the purposeof assigning a grade. Damaged kernels reduce theintrinsic and sanitary quality of wheat. Some ofthe most common forms of kernel damage arediscussed below.
Heat damage (Figure 1-A) occurs in storageresulting from wheat possessing too high a moisturecontent, from moisture migration due to convectiveair currents in the bin, or from localized infestationsof stored grain by insects that produce heat. High-moisture grain creates an environment that favorsmold growth and heating of the grain, which causesthe endosperm to turn dark brown or black.Damaged kernels do not perform like healthy kernelsduring milling. These heat-damaged kernels producedark particles when milled and create an undesirableappearance in flour.
Germ damage by mold (Figure 1-B) results in adarkened germ, which, if severe enough, indicatesthe likelihood of heat damage to the endosperm.
Insect-damaged kernels (Figure 1-C) are detectedfrom the presence of an exit hole by insects that infestthe internal portion of the wheat. Larvae grow insidethe kernel, feed on the endosperm, excrete frass (fecalmaterial), and shed their exoskeletons during develop-ment, which results in increased ash content.
Frost-damaged kernels (Figure 1-D) are detectedby a slightly flaked-off bran coat. In sufficient quantity,the damage may lead to more powder bran in theflour, possibly resulting in higher ash. Many flourmills are equipped with cleaning or scouring equip-ment that lessen the effect of frost-flaked kernels.
Sprouting (Figure 1-E) usually occurs in responseto severe weathering in the field after the wheatreaches physiological maturity or in storage due tomoisture migration as described under heat damage.Sprouting causes an activation of enzymes thatconvert the long-chain starch molecules in theendosperm into smaller carbohydrates and simplesugars (see Falling Number Test under IntrinsicQuality Section). Storage proteins that produce glutenare also split into smaller compounds during sprout-ing and a reduction in mill f lour yield may occur.
Scab (Figure 1-F) results from field infection bythe Fusarium species during anthesis through kernelfilling. Infected wheat heads produce shriveledkernels and, in many instances, mycotoxins. Mycotox-ins are toxic metabolites produced by mold (fungus)and jeopardize the sanitary quality of whole grainand their products.
Wheat classification is based on visual tech-niques that are used to assign kernel color (red orwhite), growth habit (spring or winter), and hardness(hard or soft). Presently, commercial wheat is dividedinto eight classes including Durum, Hard Red Spring,Hard Red Winter, Soft Red Winter, Hard White, SoftWhite, Unclassed, and Mixed. Wheat class reflects theintended end-use of the flour (see Table 2). Thepresent grain inspection system utilizes kernel shapeand appearance to distinguish wheat class.
Kernel hardness is an important characteristicsince it influences the way wheat performs duringprocessing. “It affects the way in which wheat mustbe tempered (addition of water to facilitate theremoval of the bran from the endosperm during
64
62
60
58
56
54
52
50
48
46
8 10 12 14 16 18 20
FIGURE 2.RELATIONSHIP BETWEEN TEST WEIGHT AND MOISTURE CONTENT FOR WHEATGraph presents the relationship between moisture content and test weight derived fromNelson’s equation. For example, the top line represents wheat with a test weight of 63.9lb/bu at 8% moisture, 62 lb/bu at 14% moisture, and 56.8 lb/bu at 20% moisture.
<
<
<
<
<
<
<
<
<
<
<
<
TABLE 2.RANGES IN HARDNESS VALUES from the single kernel wheat characterization metersystem (SKWCM) for different wheat classes and principle flour use
U.S. Wheat SKWCM Hardness ValueClasses -25 0 25 50 75 100 110 Principle Use
Durum DUR Pasta
Hard Red Spring HRS Bread, Hearth Bread
Hard Red Winter HRW Bread, All Purpose Flour
Hard White HW Bread, High Fiber Products
Soft White SW Cookies, Cakes, Pastries,Crackers, Breakfast Cereals
Soft Red Winter SRW Same as Soft White
Test
Wei
ght
(lb/
bu)
Percent Moisture—Wet Basis

6 Quality Oriented Marketing of Hard Winter Wheat • • • • • • • • • • • • • • • • • • • • • • • • • • • • • • • • • • • • • • • • • • •
milling); the yield and the particle size, shape, anddensity of flour particles; and the end-use propertiesin milling, bread-making, production of soft wheatproducts, and noodle-making” (Pomeranz, 1992).
Making the transition from a visual classificationsystem to an objective classification system requiresthe development of new technology. The first ofthese involves measurement of individual kernelhardness. The “Single Kernel Wheat CharacterizationMeter” (SKWCM) was developed by ARS engineers atthe U.S. Grain Marketing Research Laboratory in
KER
NEL
PER
CEN
T
HARDNESS INDEX
KER
NEL
PER
CEN
T
HARDNESS INDEX
KER
NEL
PER
CEN
T
HARDNESS INDEX
KER
NEL
PER
CEN
T
HARDNESS INDEX
KER
NEL
PER
CEN
T
HARDNESS INDEX
MIXED HISTOGRAM PATTERNS
HARD HISTOGRAM PATTERNS SOFT HISTOGRAM PATTERNS
KER
NEL
PER
CEN
T
HARDNESS INDEX
KER
NEL
PER
CEN
T
HARDNESS INDEX
KER
NEL
PER
CEN
T
HARDNESS INDEXK
ERN
EL P
ERC
ENT
HARDNESS INDEX
FIGURE 3.OBJECTIVE HARDNESS CLASSIFICATIONThe objective classification method requires not only the average hardness result, but also the degrees of ranges of hardness within a sample set to define classesas Soft, Hard, or Mixed. The following definitions and examples illustrate how the classification system could categorize wheats based on hardness. HardWheat: Wheat having a high hardness score with not more than 10 percent soft kernels, which exhibits a single peak in a 4-part histogram. Soft Wheat:Wheat having a low hardness score with not more than 10 percent hard kernels, which exhibits a single peak in a 4-part histogram. Mixed Wheat: Wheat thatdoes not meet the definition of Hard or Soft what. These samples may exceed the 10 percent limit for soft wheat in hard wheat or hard wheat in soft wheat. Thesesamples also may exhibit a “double peak” on the histogram. Double Peak: A double peak is a bimodal hardness distribution within a sample. A double peakoccurs when the sample average measures on one side of the histogram and at least 10 percent of the kernels are on the other side of the histogram and there isat least a 3 percent difference between the adjacent parts.
Manhattan, Kans., to measure individual kernelhardness. An algorithm that includes crushing force,kernel moisture, and kernel weight calculates thehardness index for a wheat sample. The SKWCMprovides a measurement of kernel uniformity(standard deviation) since kernels are evaluatedindividually rather than as a single measure for theentire sample. The technology of measuring indi-vidual kernels permits the separation of wheat lotsinto three categories: hard, soft, and mixed (Figure 3).The SKWCM cannot differentiate among hard red
➨ Increasing Hardness➨
Soft Hard
➨ Increasing Hardness➨
Soft Hard
➨ Increasing Hardness➨
Soft Hard
➨ Increasing Hardness➨
Soft Hard
➨ Increasing Hardness➨
Soft Hard
➨ Increasing Hardness➨
Soft Hard
➨ Increasing Hardness➨
Soft Hard
➨ Increasing Hardness➨
Soft Hard
➨ Increasing Hardness➨
Soft Hard

• • • • • • • • • • • • • • • • • • • • • • • • • • • • • • • • • • • • • • • • • • • Quality Oriented Marketing of Hard Winter Wheat 7
winter, hard red spring, and hard white wheat dueto considerable overlap in the hardness index values(Table 2) of these classes.
The SKWCM also measures individual kernelmoisture, size, weight, and the standard deviationfor these measurements. Kernel weight and size areimportant to millers since they help provide additionalestimates of milling performance. These measure-ments, however, are not grade-determining factors.
ARS and FGIS scientists are investigating the useof NIR as a means of characterizing kernel color. Anobjective measurement of kernel color is necessary,particularly in the case of hard white wheat. Vitreouswhite wheat kernels normally have an amber colorand, under some growing conditions, may appear tohave a reddish tint. During the interim period,classification of hard white wheat will be based onvisual identification of the particular variety inquestion (FGIS Program Bulletin 94.19).
Additional measurements of physical qualitycommonly used by the milling industry but not partof the U.S. Wheat Standards include thousand kernelweight (TKW) and kernel size distribution. Kernelweight is reported in grams (g) per 1,000 kernels ona 12-percent moisture basis. Kernel size distributionis measured by sifting wheat over wire mesh sieves(7w, 9w, and 12w). The percentage of larger kernelsleft on the seven-wire sieve provides additionalinformation about the potential flour yield. Targetvalues for kernel size and weight established by theWheat Quality Council are 60 percent or morekernels over the seven-wire and a TKW of more than30 grams (Curran et al, 1995).
Sanitary and Safety QualityCharacteristics
Contaminants that jeopardize the sanitation andsafety of wheat include the presence of insects,insect-damaged kernels (IDK), harmful or toxicsubstances, pesticide residues, fungal infection andmycotoxins, off-odor, and deleterious foreign matter,such as glass and metal fragments.
At the time of sampling, wheat (on the basis of thelot as a whole) may be considered “distinctly lowquality” (DLQ) by FGIS if it contains large debris suchas two or more stones, pieces of glass, concrete, orother pieces of debris, or if it is obviously affected byunusual conditions that adversely affect its quality ina 1,000-gram sample. Wheat suspected of containingdiatomaceous earth (DE) is considered DLQ unless anexamination to verify the presence of DE has beenrequested. Lots of wheat (the economic unit for salethat was sampled and graded, e.g. truck load, rail car)considered DLQ are graded “U.S. Sample Grade.”
Determination of rodent pellets, bird droppings,other animal filth, broken glass, castor beans,cockleburs, Crotalaria seeds, live insect infestation,large stones, unknown foreign substances, andcommonly recognized harmful or toxic substances
are made on the basis of the sample (usually about1,000 grams) as a whole (before removal of dockage).
Wheat samples as a whole will cause a lot ofwheat to be considered “Sample Grade” by FGIS ifthey contain the following1: eight or more stones orany number of stones with an aggregate weightgreater than 0.2 percent of the sample weight; twoor more castor beans (Ricinus communis L.); fouror more particles of an unknown foreign substanceor a commonly recognized harmful or toxic sub-stance; two or more rodent pellets, bird droppings,or equivalent quantity of other animal filth per1,000 grams of wheat; has a musty, sour, or commer-cially objectionable foreign odor (such as persistentfumigant or insecticide odors); or is heating orotherwise of distinctly low quality (Table 1). Thirty-two or more insect-damaged kernels per 100 grams(about 3,350 kernels) of wheat (dockage, shriveled,and broken free wheat) will also cause a lot of wheatto be graded “Sample Grade.”
The FGIS and the Food and Drug Administration(FDA) have implemented a Memorandum of Under-standing (MOU) that specifies the above levels ofcontaminants in wheat are actionable and will becross-reported.
The presence of any live weevil or any other liveinsect injurious to stored grain indicates the probabilityof infestation and warns the wheat must be carefullyexamined to determine if it is infested. To ref lectthe presence of live infestation in a lot of wheat, theFGIS in 1988 revised the special grade designationfrom “WEEVILY” to “INFESTED” and changed thecombination of insects required to cause a lot ofwheat to be graded “INFESTED.” The special gradedesignation is appended to the numerical grade (i.e.U.S. No. 1, 2, etc.) that is determined on the basis ofphysical quality characteristics. In effect, any two liveinsects, either weevils or other live insects injuriousto wheat, will cause the lot to be graded “infested.”
In 1977, prior to the MOU with FGIS, the FDAestablished “Defect Action Levels” (DALs) for insectand rodent contamination in wheat for humanconsumption. The DALs indicate the natural orunavoidable levels of contamination that constituteno health hazard.
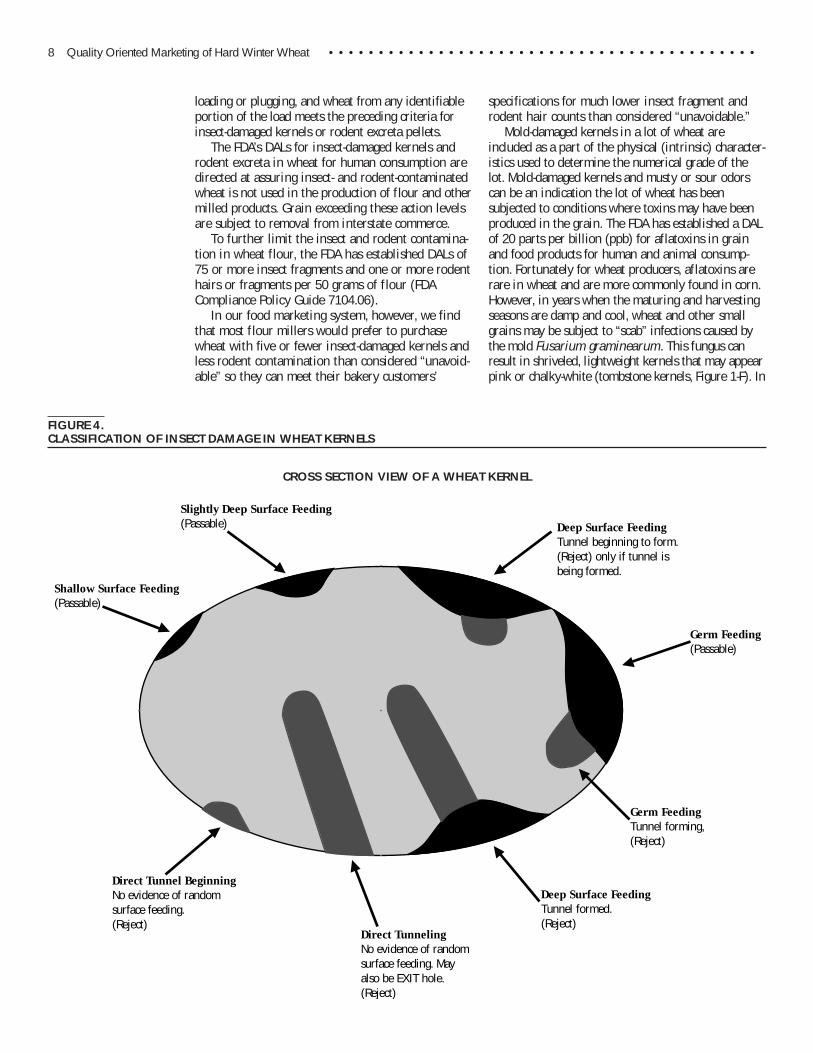
Thirty-two or more insect-damaged kernels per 100grams is considered subject to action by the FDA (FDAPolicy Compliance Guide 7104.03). Insect-damagedkernels (IDK) are those that show evidence oftunneling or boring (Figure 4). Occasionally, wheatkernels that meet this criteria are found in samplescoming directly from the field. It has not beenestablished whether these damaged kernels are due to“stored-grain” insects or field insects. The FDA PolicyCompliance Guide also includes a “defect action level”for rodent excreta in wheat for human consumption.Nine milligrams or more of rodent excreta perkilogram of wheat will cause the lot to be consideredactionable. A lot of wheat may also be consideredactionable if there is clear-cut evidence of uneven
1Based on a dockage-freesample.
8 Quality Oriented Marketing of Hard Winter Wheat • • • • • • • • • • • • • • • • • • • • • • • • • • • • • • • • • • • • • • • • • • •
loading or plugging, and wheat from any identifiableportion of the load meets the preceding criteria forinsect-damaged kernels or rodent excreta pellets.
The FDA’s DALs for insect-damaged kernels androdent excreta in wheat for human consumption aredirected at assuring insect- and rodent-contaminatedwheat is not used in the production of f lour and othermilled products. Grain exceeding these action levelsare subject to removal from interstate commerce.
To further limit the insect and rodent contamina-tion in wheat flour, the FDA has established DALs of75 or more insect fragments and one or more rodenthairs or fragments per 50 grams of f lour (FDACompliance Policy Guide 7104.06).
In our food marketing system, however, we findthat most f lour millers would prefer to purchasewheat with five or fewer insect-damaged kernels andless rodent contamination than considered “unavoid-able” so they can meet their bakery customers’
Slightly Deep Surface Feeding(Passable)
Shallow Surface Feeding(Passable)
Deep Surface FeedingTunnel beginning to form.(Reject) only if tunnel isbeing formed.
Germ Feeding(Passable)
Deep Surface FeedingTunnel formed.(Reject)
Germ FeedingTunnel forming,(Reject)
Direct TunnelingNo evidence of randomsurface feeding. Mayalso be EXIT hole.(Reject)
Direct Tunnel BeginningNo evidence of randomsurface feeding.(Reject)
FIGURE 4.CLASSIFICATION OF INSECT DAMAGE IN WHEAT KERNELS
CROSS SECTION VIEW OF A WHEAT KERNEL
specifications for much lower insect fragment androdent hair counts than considered “unavoidable.”
Mold-damaged kernels in a lot of wheat areincluded as a part of the physical (intrinsic) character-istics used to determine the numerical grade of thelot. Mold-damaged kernels and musty or sour odorscan be an indication the lot of wheat has beensubjected to conditions where toxins may have beenproduced in the grain. The FDA has established a DALof 20 parts per billion (ppb) for aflatoxins in grainand food products for human and animal consump-tion. Fortunately for wheat producers, aflatoxins arerare in wheat and are more commonly found in corn.However, in years when the maturing and harvestingseasons are damp and cool, wheat and other smallgrains may be subject to “scab” infections caused bythe mold Fusarium graminearum. This fungus canresult in shriveled, lightweight kernels that may appearpink or chalky-white (tombstone kernels, Figure 1-F). In

• • • • • • • • • • • • • • • • • • • • • • • • • • • • • • • • • • • • • • • • • • • Quality Oriented Marketing of Hard Winter Wheat 9
addition, the toxin deoxynivalenol (DON), also calledvomitoxin, may be produced in the wheat.
In 1993, the FDA established new advisory levelsfor vomitoxin in wheat. These guidelines (Table 3)advised that DON should not exceed 1 part permillion (ppm) in finished wheat products for humanconsumption. FDA did not state an advisory level forwheat intended for milling because normal manufac-turing practices and additional technology available tomillers can reduce DON levels substantially in finishedwheat products from those found in the wheat.
Symptoms produced by DON-contaminated wheatfed to swine and other animals include refusal to eat(swine), digestive disorders, diarrhea, and ultimatelydeath. Advisory levels for use in animal feeding weresuggested by the FDA (Table 3). Advisory levels serveas guidelines that grain handlers, feeders, and proces-sors follow voluntarily. The significance of DON inhuman health is yet to be demonstrated (CAST, 1989).
The detection of DON and other mycotoxins inwheat and other grains has been greatly simplifiedthrough biotechnology using antibodies for specifictoxins and other rapid methods. This technology isavailable in various kits for rapid testing withminimal laboratory equipment. The FGIS and manylaboratories offer mycotoxin testing for a fee.
The Environmental Protection Agency (EPA) hasestablished pesticide residue tolerances for cerealgrains including wheat. Tolerances have beenestablished for only a few insecticides (grainprotectants) that are labeled for direct application towheat to prevent infestation (Table 4). Only thosepesticides labeled for application to specific grainscan be applied, and residues must be at or below theestablished tolerance. Similarly, only a few fumigantsare labeled for disinfesting grains. Tolerances forthese fumigants have also been established (Table 5).Tolerances have also been established on grains forsome pesticides that may have been applied to thegrowing crop in the field.
Some export customers have established pesticidetolerances below those specified by the EPA. Lists ofspecified tolerances for various export customers areavailable from U.S. Wheat Associates or state wheatcommissions.
The EPA has recently directed its efforts topromoting integrated pest management (IPM)practices in the post-harvest handling of grains. Onegoal of IPM is to reduce pesticide use and residue toa minimum.
Intrinsic Quality CharacteristicsIntrinsic quality characteristics determine the
milling and bread-making (end-use) performance ofhard wheat. These characteristics include proteincontent and quality, falling number, f lour yield, ashcontent, flour color, bread-loaf volume, grain, texture,and color. Hard winter wheat varieties with excep-tional intrinsic qualities possess the genetic potential
to produce large, uniform kernels with high proteincontent and good milling and baking performanceunder favorable growing conditions (Bequette et al,1994). Identity-preserved marketing capitalizes on
TABLE 3.FDA ADVISORY LEVELS FOR DEOXYNIVALENOL (DON)
1 ppm Finished wheat products, e.g. f lour, bran and germ, that may potentially beconsumed by humans. FDA is not stating an advisory level for wheat intendedfor milling because normal manufacturing practices and additional technologyavailable to millers can substantially reduce DON levels in the finished wheatproduct from those found in the original raw wheat. Because there issignificant variability in manufacturing processes, an advisory level forraw wheat is not practical.
10 ppm Grains and grain by-products destined for ruminating beef and feedlot cattleolder than four months and for chickens with the added recommendation thatthese ingredients not exceed 50 percent of the diet of cattle or chickens.
5 ppm Grains and grain by-products destined for swine with the added recommenda-tions that these ingredients not exceed 20 percent of their diet.
5 ppm Grains and grain by-products destined for all other animals with the addedrecommendation that these ingredients not exceed 40 percent of their diet.
Source: U.S. Department of Health and Human Services, Food and Drug Administration,September 16, 1993.
TABLE 4.GRAIN PROTECTANTS
Protectant Grains Tolerance
Pyrethrins & Piperonyl butoxide Wheat, Corn, Barley, 3 ppm Pyrethrinsor MGK-26 Rye, and Rice 20 ppm Pip. But.
Sorghum, Oats 1 ppm Pyrethrins8 ppm Pip. But.
Malathion Barley, Corn, Oats, 8 ppmRice, Rye, Sorghum,and Wheat
Chlorpyrifos-methyl (Reldan) Barley, Oats, Rice,Sorghum, and Wheat 6 ppmMilling Fraction (Except Flour)Oats 130 ppmBarley, Sorghum 90 ppmRice, Wheat 30 ppm
Pirimiphos-methyl Corn, Sorghum 8 ppm(Actellic) Milling Fractions
(Except Flour)Corn, Sorghum 40 ppm
Diatomaceus Earth (DE) Cereal Grains Exempt
Bacillus thuringiensis Cereal Grains Exempt
TABLE 5.GRAIN FUMIGANTS
Fumigant Grain Tolerance
Methyl Bromide Barley, Corn, Oats, Rice, Sorghum and Wheat 50 ppm
Peanuts and Soybeans 200 ppm
Phosphine Barley, Corn, Millet, Oats, Rice, Rye,Sorghum, Soybeans, and Wheat 0.1 ppm

10 Quality Oriented Marketing of Hard Winter Wheat • • • • • • • • • • • • • • • • • • • • • • • • • • • • • • • • • • • • • • • • • • •
the added value associated with wheat varietiespossessing exceptional intrinsic or sanitary quality.
Wheat flour is unique in its ability to form astrong, cohesive dough that can retain gas andproduce a light baked product. Gluten proteins,which are part of the total wheat protein composi-tion, are (largely) responsible for this uniqueproperty. Gluten protein resides in the endospermportion of the wheat kernel (from which flour ismade) and functions as a storage protein.
Much of the hard winter wheat f lour is utilized bythe commercial baking industry in the production ofvarious breads, rolls, and other products. Goodquality hard winter wheat f lour has desirableproperties for making pan breads and rolls; suchflour will yield readily mixed, extensible doughs thatmachine properly in high-speed bakeries and yieldproducts with good volume and crumb characteris-tics. Hard winter wheat flour is also used for Frenchand other hearth-type breads, pita and similar f latbreads, pizza, tortillas, croissants, and other specialtybakery foods. Although not suitable for cakes, hardwinter wheat f lour is used for producing consider-able amounts of sweet bakery foods, such as sweetgoods (e.g. coffee cakes, cinnamon rolls), Danishpastry, and puff pastry items. Hard winter wheatflour is used in home baking, either as family f lour(sometimes blended with some weaker flour) or as abread flour.
Protein, like moisture content in wheat, can bemeasured directly or indirectly. Direct measurementcan be performed using the Kjeldahl technique,which employs wet chemistry to measure totalnitrogen content. Another direct measurementtechnique performed by the Leco nitrogen analyzerinvolves sample combustion and detection ofvolatilized nitrogen. FGIS adopted the Leco combus-tible nitrogen analyzer as the official method forcalibrating NIR instruments used to measure protein.The NIR method measures the optical properties of
protein in wheat based on reflectance or transmit-tance (depending on the instrument) and can beperformed on ground wheat, whole kernels, or f lour.
The market value of protein will vary based onits supply. Table 6 contains the average annualprotein premiums offered for hard red winter wheatprotein from 1984 to 1994.
Flour protein levels tend to be about 1 percentless than wheat kernel protein content. A desirableflour protein content to produce white pan breadtends to range between 11 percent and 12 percent.
The FGIS certificates report protein content inwheat at a 12-percent moisture basis. Flour proteincontent is generally reported at a 14-percentmoisture basis. The following formula can be used toadjust protein content to the desired moisture level:
% Protein @12% Moisture Basis
= % Protein @ As Is Moisture x 88
100 – (As Is Moisture %)
For example, 13.2-percent-protein wheat at 10percent moisture is equivalent to 12.9 percentprotein at 12 percent moisture:
% Protein @ 12% Moisture Basis = 13.2 x 88 = 12.9%100 – 10
Wet gluten content, which is directly related toprotein content, can be measured using a Glutomaticanalyzer (back inside cover). This instrument washesout the nongluten material from a sample of flour orfinely ground wheat using a 2-percent saline solution.Wet gluten values are generally reported on a percentbasis with average values in the mid 20s to lower 30s.
The mixograph is an instrument that measuresand records the resistance to mixing of flour andwater to form dough (back inside cover). Themixograph curve (referred to as the mixogram)represents the formation of gluten. It peaks at optimaldough development and then falls as gluten is brokendown by continued mixing (Figure 5). The curve peakprovides an estimate of the time required for mixingthat properly develops the dough for bread-baking.The rate (or slope) at which the curve falls andnarrows after the peak indicates the protein stabilityto overmixing. Water absorption values obtained fromthe mixograph provide an estimate of the amount ofwater required for baking. Commercial bread bakeriesoperate most efficiently using f lour that possesses ahigh water absorption (63 to 67 percent), medium-long mixing peak (3.5 to 5.5 minutes), and adequatemixing tolerance (1 to 3 minutes past peak). This testis widely used in the United States.
The farinograph, similar to the mixograph, is arecording dough mixer that records the resistancedough offers to a pair of rotating sigma blades in atemperature-controlled bowl (back inside cover). Theresistance is transmitted to a dynamometer, which inturn is connected to a lever system that traces acurve on a kymograph chart. Water is added to theflour such that the peak of the curve will center onthe arbitrary 500 Brabender Unit (BU) line along the
TABLE 6.PREMIUM OVER ORDINARY HARD RED WINTER WHEAT (in cents per bushel)
Year
Protein 84 85 86 87 88 89 90 91 92 93 94
11.0% 1.2 1.5 0.4 0.2 0.3 0.0 0.0 0.0 0.0 1.4 0.311.2% 1.6 2.9 0.6 0.3 0.3 0.2 0.1 0.0 0.2 3.0 0.511.4% 2.1 4.9 1.1 0.4 0.3 0.3 0.2 0.1 1.3 5.8 0.611.6% 2.9 6.8 1.5 0.5 0.4 0.3 0.3 0.1 1.4 11.1 2.111.8% 3.9 9.0 2.3 1.6 0.8 0.3 0.6 0.3 1.9 16.3 3.012.0% 5.2 12.3 4.0 3.5 0.9 0.4 0.9 0.3 2.4 22.6 3.512.2% 7.2 15.8 6.2 5.4 1.4 0.1 1.2 0.5 3.4 27.0 3.712.4% 11.3 20.0 9.2 8.6 1.7 0.1 1.7 0.8 4.4 32.3 4.212.6% 14.1 24.1 12.0 12.3 1.9 0.0 2.8 1.3 5.4 39.9 4.512.8% 15.6 35.1 14.6 14.8 2.2 –0.3 3.9 1.6 6.6 51.4 5.213.0% 19.9 35.4 16.7 17.1 2.3 –0.6 7.0 1.9 10.3 67.9 7.513.2% 22.5 36.7 18.7 18.9 2.7 –0.6 7.9 2.1 11.0 74..7 8.613.4% 25.2 39.9 20.4 21.3 3.2 –1.0 8.8 2.2 12.3 82.6 9.513.6% 27.9 43.3 22.2 23.7 3.9 –1.2 9.8 2.4 13.6 91.9 11.813.8% 30.5 46.6 23.3 26.2 4.2 –1.4 10.6 2.9 14.7 99.1 13.514.0% 33.2 50.0 28.1 28.7 4.9 –1.5 11.7 3.4 18.6 114.3 18.2

• • • • • • • • • • • • • • • • • • • • • • • • • • • • • • • • • • • • • • • • • • • Quality Oriented Marketing of Hard Winter Wheat 11
1 MIN.
1 MIN.
middle of the chart. The time required to reach thepeak is the development time, when the glutenproteins and the dough are presumably optimallydeveloped. The curve profile, that is the rate atwhich the dough reaches and then descends from thepeak, provides a measure of dough stability againstmechanical abuse.
Thus, the farinograph indicates three generalproperties: amount of water to make a dough, timeto optimally mix a dough, and the stability ortolerance of a dough towards mixing. The baker canuse this information as a guide to handling a givenflour in a bakery. Further, the farinograph curve, orfarinogram, may be used as an index of f lour
FIGURE 5.MIXOGRAMS FOR TAM 107 AND AGSECO 7853
TAM 107
AGSECO 7853
Developing Slope = 19˚Tolerance Angle = 150˚Height = 52 mmPeak at 4.9 minutesAbsorption = 61.5%
Developing Slope = 37˚Tolerance Angle = 115˚Height = 66 mmPeak at 3.8 minutesAbsorption = 65%
These lines are superimposedon the mixogram to depictascending and descending
slope. These lines crossat the curve peak.
12 Quality Oriented Marketing of Hard Winter Wheat • • • • • • • • • • • • • • • • • • • • • • • • • • • • • • • • • • • • • • • • • • •
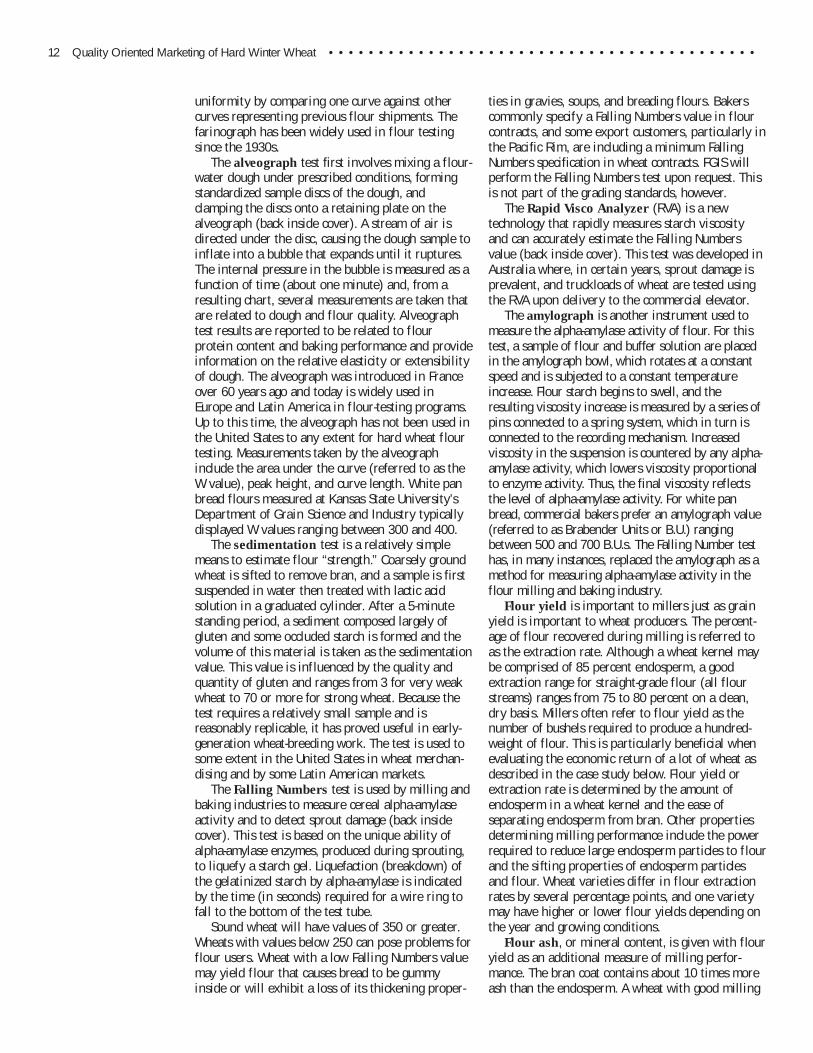
uniformity by comparing one curve against othercurves representing previous flour shipments. Thefarinograph has been widely used in f lour testingsince the 1930s.
The alveograph test first involves mixing a f lour-water dough under prescribed conditions, formingstandardized sample discs of the dough, andclamping the discs onto a retaining plate on thealveograph (back inside cover). A stream of air isdirected under the disc, causing the dough sample toinflate into a bubble that expands until it ruptures.The internal pressure in the bubble is measured as afunction of time (about one minute) and, from aresulting chart, several measurements are taken thatare related to dough and f lour quality. Alveographtest results are reported to be related to f lourprotein content and baking performance and provideinformation on the relative elasticity or extensibilityof dough. The alveograph was introduced in Franceover 60 years ago and today is widely used inEurope and Latin America in f lour-testing programs.Up to this time, the alveograph has not been used inthe United States to any extent for hard wheat f lourtesting. Measurements taken by the alveographinclude the area under the curve (referred to as theW value), peak height, and curve length. White panbread flours measured at Kansas State University’sDepartment of Grain Science and Industry typicallydisplayed W values ranging between 300 and 400.
The sedimentation test is a relatively simplemeans to estimate flour “strength.” Coarsely groundwheat is sifted to remove bran, and a sample is firstsuspended in water then treated with lactic acidsolution in a graduated cylinder. After a 5-minutestanding period, a sediment composed largely ofgluten and some occluded starch is formed and thevolume of this material is taken as the sedimentationvalue. This value is inf luenced by the quality andquantity of gluten and ranges from 3 for very weakwheat to 70 or more for strong wheat. Because thetest requires a relatively small sample and isreasonably replicable, it has proved useful in early-generation wheat-breeding work. The test is used tosome extent in the United States in wheat merchan-dising and by some Latin American markets.
The Falling Numbers test is used by milling andbaking industries to measure cereal alpha-amylaseactivity and to detect sprout damage (back insidecover). This test is based on the unique ability ofalpha-amylase enzymes, produced during sprouting,to liquefy a starch gel. Liquefaction (breakdown) ofthe gelatinized starch by alpha-amylase is indicatedby the time (in seconds) required for a wire ring tofall to the bottom of the test tube.
Sound wheat will have values of 350 or greater.Wheats with values below 250 can pose problems forflour users. Wheat with a low Falling Numbers valuemay yield f lour that causes bread to be gummyinside or will exhibit a loss of its thickening proper-
ties in gravies, soups, and breading f lours. Bakerscommonly specify a Falling Numbers value in f lourcontracts, and some export customers, particularly inthe Pacific Rim, are including a minimum FallingNumbers specification in wheat contracts. FGIS willperform the Falling Numbers test upon request. Thisis not part of the grading standards, however.
The Rapid Visco Analyzer (RVA) is a newtechnology that rapidly measures starch viscosityand can accurately estimate the Falling Numbersvalue (back inside cover). This test was developed inAustralia where, in certain years, sprout damage isprevalent, and truckloads of wheat are tested usingthe RVA upon delivery to the commercial elevator.
The amylograph is another instrument used tomeasure the alpha-amylase activity of f lour. For thistest, a sample of f lour and buffer solution are placedin the amylograph bowl, which rotates at a constantspeed and is subjected to a constant temperatureincrease. Flour starch begins to swell, and theresulting viscosity increase is measured by a series ofpins connected to a spring system, which in turn isconnected to the recording mechanism. Increasedviscosity in the suspension is countered by any alpha-amylase activity, which lowers viscosity proportionalto enzyme activity. Thus, the final viscosity reflectsthe level of alpha-amylase activity. For white panbread, commercial bakers prefer an amylograph value(referred to as Brabender Units or B.U.) rangingbetween 500 and 700 B.U.s. The Falling Number testhas, in many instances, replaced the amylograph as amethod for measuring alpha-amylase activity in theflour milling and baking industry.
Flour yield is important to millers just as grainyield is important to wheat producers. The percent-age of flour recovered during milling is referred toas the extraction rate. Although a wheat kernel maybe comprised of 85 percent endosperm, a goodextraction range for straight-grade flour (all flourstreams) ranges from 75 to 80 percent on a clean,dry basis. Millers often refer to flour yield as thenumber of bushels required to produce a hundred-weight of flour. This is particularly beneficial whenevaluating the economic return of a lot of wheat asdescribed in the case study below. Flour yield orextraction rate is determined by the amount ofendosperm in a wheat kernel and the ease ofseparating endosperm from bran. Other propertiesdetermining milling performance include the powerrequired to reduce large endosperm particles to f lourand the sifting properties of endosperm particlesand flour. Wheat varieties differ in flour extractionrates by several percentage points, and one varietymay have higher or lower flour yields depending onthe year and growing conditions.
Flour ash, or mineral content, is given with flouryield as an additional measure of milling perfor-mance. The bran coat contains about 10 times moreash than the endosperm. A wheat with good milling

• • • • • • • • • • • • • • • • • • • • • • • • • • • • • • • • • • • • • • • • • • • Quality Oriented Marketing of Hard Winter Wheat 13
characteristics gives a high yield of low-ash flour.Flour ash content is specified by the baker andusually ranges between 0.48 and 0.52 percent.
Flour color can be measured using a number oftechniques, both visual and instrumental. Thischaracteristic has diminished in importance as morebakers specify unbleached f lour.
Bread characteristics are judged by a combina-tion of objective and subjective evaluations appliedto external and internal loaf properties. Externally,loaf volume is of particular importance because itindicates the inherent bread-making potential of aflour. This characteristic is typically measured by aninstrument using rape seed displacement (outsideback cover). Crust color and loaf symmetry are alsoexternal factors. Other external factors include break,the horizontal separation that usually occurs alongone side of the bread, and shred, the verticalstriations just above the break. Both of these factorsshould be smooth and uniform. Important internalcharacteristics include crumb structure, in terms ofcell size and uniformity, and crumb color, which maybe judged visually or by means of an instrument.Crumb textural properties, or firmness, may beestimated subjectively or objectively by any of anumber of instruments. Flavor of the bread is, ofcourse, important and is routinely judged subjec-tively but can be objectively characterized by meansof a sensory taste panel.
Case Study: Economic andQuality Comparisons
A comparison of physical and intrinsic qualitiesbetween two wheat varieties (AGSECO 7853 and TAM107) is performed to help illustrate the value of wheatquality. The wheat used in this comparison wasproduced in nine western Kansas Extension demon-stration plots. AGSECO 7853 possesses superiormilling and bread-baking properties and occupiedabout 2 percent of the seeded wheat acreage inKansas in 1995. TAM 107 tends to exhibit some lessdesirable flour and bread-making properties, includ-ing a yellowish tint in both flour and bread and lowerprotein content. This variety occupied approximately20 percent of Kansas wheat acreage in 1994.
AGSECO 7853 kernels were bigger, heavier, andcontained a higher protein content compared to TAM107 (Table 7). AGSECO 7853 wheat yielded moreflour that was whiter, possessed a higher mixographabsorption, and produced a larger loaf of bread withbetter internal loaf color and texture compared toTAM 107.
The TAM 107 flour mixogram has a peak mixingtime of 4.9 minutes. The developing (ascending)slope is 19˚ and the angle between the developingslope and the weakening (descending) slope is 150˚.The developing slope indicates the rate at which thedough develops, whereas the angle between slopes
TABLE 7.CASE STUDY evaluating the physical and intrinsic quality of AGSECO 7853 and TAM107 produced at 9 locations in western Kansas in 1993
AGSECO 7853 TAM 107
Physical QualityTest Weight 58.7 lbs/bu 56.7 lbs/buKernel Hardness 64 65Kernel Size 2.72 mm 2.45 mmKernel Weight 34.5 mg 30.9 mg
Kernel Protein 12.8% 11.0%
Intrinsic QualityFlour Protein 11.84% 10.12%Flour Extraction 72.3% 71.3%Flour Color 85.3 80.3Mixogram Absorption 65% 61.5%Mixogram Peak 3.8 minutes 4.9 minutesBread Loaf Volume 972 cc 915 ccBread Color Bright White Yellow
indicates mixing tolerance. The AGSECO 7853 flourmixogram has a peak mixing time of 3.8 minutes.The developing slope is 37˚ and the angle betweenthe developing slope and the weakening slope is115˚.
Note that AGSECO 7853 mixogram is higher onthe paper than the TAM 107. The height of themixogram is a function of the protein content of theflour. TAM 107 flour protein content was 10.1percent, whereas the AGSECO 7853 flour proteincontent was 11.8 percent (Table 7).
The mill yields for TAM 107 and AGSECO 7853are calculated below using their respective extractionrates of 71.3 and 72.3 percent. Flour yield, expressedas bushels of wheat to produce a hundredweight offlour, can be calculated by dividing 1.667 (wheatbushels equivalent to 100 pounds) by the flourextraction rate then multiplying by 100. The price ofwheat in this case example was $4 per bushel andthe average mill feed price was $0.0349 per pound.
Flour yields and the raw-material cost of produc-ing one hundredweight of f lour with TAM 107 andAGSECO 7853 are presented in Table 8. The differencein raw material cost between TAM 107 and AGSECO7853 was $0.128 per hundredweight of flour. Thevalue of mill-feed by-product (based on Kansas CityJune-May) for TAM 107 was $0.0675 greater perhundredweight of flour produced compared toAGSECO 7853. The lower raw material cost forAGSECO 7853 ($0.128) minus the mill feed valuefrom TAM 107 ($0.0675) equates to a savings of$0.0605 per hundredweight of flour using AGSECO7853. This is equivalent to $605 per day in a 10,000-hundredweight mill. Flour extraction percentage wasacquired using a Brabender Quadramate Seniorlaboratory mill (inside back cover).
Protein premiums may represent significant valueduring marketing years when the supply of high-protein wheat is low. During the 1993 marketingyear, the average price spread between 11 percent

14 Quality Oriented Marketing of Hard Winter Wheat • • • • • • • • • • • • • • • • • • • • • • • • • • • • • • • • • • • • • • • • • • •
protein Hard Red Winter wheat and 12.8-percent-protein Hard Red Winter wheat was $0.50 per bushel(Table 6).
Farmers usually select wheat varieties based onagronomic characteristics that provide the highestyield potential in their fields (environment). Whileboth TAM 107 and AGSECO 7853 exhibit similaryield potential in western Kansas (50 bushels peracre), based on Kansas State University VarietyPerformance Tests, producers continue to plant asubstantial amount of TAM 107. Marketing incentives(premiums, contracts, or dividends from identitypreserved marketing of AGSECO 7853) wouldencourage farmers to plant more AGSECO 7853. Inthis case example, the added value from improvedmilling performance and protein content was $0.526per bushel during the 1993 marketing season.
Future Technologyfor Measuring Quality
Investigations are underway to develop newprocedures to assess or predict the biochemicalcomposition of grain that inf luences milling andbread-baking characteristics. These technologies relyupon near infrared, nuclear magnetic resonance, andinfrared spectral analysis. Such measurements may
provide rapid, nondestructive measurements of grainquality that may predict end-use properties presentlymeasured by techniques such as falling number,mixograph, and bake tests.
Digital image analysis is being explored as amethod to automate the identification of kerneldamage and differentiation between hard red winterand hard red spring wheat. The development of anautomated method for detecting off-odor in grainwill utilize gas chromatography. Renewed interest inthe use of acoustical sensors to detect stored graininsect infestation has lead to a reinvestigation intothis area. Development of more sensitive, solid-stateelectronics since the 1950s, when acoustical detec-tion of insect infestations was first explored, mayrender this method as a viable option in an auto-mated grain-grading system.
This research should spawn new technologies thatwill facilitate the transition to an objective grain-inspection system that will augment quality-orientedmarketing of wheat.
SummaryDomestic mills and bakeries have become highly
automated and process large quantities of wheat andflour. Their demand for a uniform product withspecific qualities has become more important. Manyexport customers are no longer represented by asingle government buying agency. The privatizationof these economies has been accompanied by anincreased demand for wheat quality. Understandingcustomer needs and the evaluation techniques usedto measure end-use quality affords greater oppor-tunity to increase or preserve profits in the U.S.grain industry.
Growers, grain handlers, and merchandisers canrealize added value when they market wheat thatmeets specific quality characteristics for theircustomers. Producers should consider the market forwhich they are producing wheat and select varietiesthat possess superior agronomic and end-usequalities. As the milling industry shifts from aproduction orientation to a customer orientation, thedemand for wheat with specific qualities willcontinue to increase.
Public concern about food safety and the commit-ment by U.S. millers and bakers to provide safe,wholesome food has resulted in sanitary qualitystandards for wheat that are many times morestringent than those imposed by the Food and DrugAdministration. In deference to a growing number ofcustomers who prefer pesticide-free products, asignificant market has emerged for organically grownwheat. Efforts to preserve the sanitary quality ofwheat through the entire production, storage,handling, and milling processes are importantquality criteria.
TABLE 8.ECONOMIC COMPARISON between TAM 107 and AGSECO 7853 for raw materialcost and mill by-product value
Mill Yield
TAM 107 @ 71.3% extraction
1.667 bu/cwt × 100 = 2.338 bu per cwt f lour71.3%
2.338 bu/cwt × $4.00/bu = $9.352/cwt of f lour
AGSECO 7853 @ 72.3% extraction
1.667 bu/cwt × 100 = 2.306 bu per cwt f lour72.3%
2.306 bu/cwt × $4.00/bu = $9.224/cwt of f lour
Savings of $0.128 per cwt. of flour using AGSECO 7853
Mill Feed
TAM 107
$.0349/lb ×2.338 bu × 60 lb × .287 mill feed extraction = $1.405cwt bu
AGSECO 7853
$.0349/lb ×2.306 bu × 60 lb × .277 mill feed extraction = $1.3376cwt bu
Difference of $0.0675 mill feed value/cwt flour
Added value of AGSECO 7853 = $0.06/cwt flour

• • • • • • • • • • • • • • • • • • • • • • • • • • • • • • • • • • • • • • • • • • • Quality Oriented Marketing of Hard Winter Wheat 15
Glossary2
AbsorptionThe amount of water required to be added to a
particular f lour in order for it to function optimallyin some application (usually the amount required tomake the best possible bread dough), expressed as apercent of the f lour weight.
AdditiveAccording to the FDA: any substance, the intended
use of which results or may reasonably be expectedto result, directly or indirectly, in its becoming acomponent of, or otherwise affecting, the character-istics of any food.
AdulterateTo clandestinely add some foreign or inferior
substance to a food or ingredient, usually for thepurpose of making the food material cheaper toproduce, as added water would be an adulterant inmilk.
AerationThe process of circulating air upwards or down-
wards through binned grain to prevent the grainfrom developing hot spots brought about by heatingdue to insect and mold development.
Aerated grain bins are fitted with ducts and fansthat pull in outside air and push or pull it throughthe grain mass. Temperature and humidity controlsare often used to permit aeration only when thoseconditions are within the desired limits.
AgingA step in the milling process in which flour is
stored for a considerable time after grinding so itsoriginal creamy tint is greatly reduced by naturalreactions and its baking quality is improved. Seldom,if ever, used in modern mills in the United States.
Air ClassificationA process by which the particles in a mill stream
are separated according to size and density bycyclone separators instead of sieves.
All-Purpose FlourAll-purpose flour is a medium-protein wheat f lour
designed for use in a wide range of food productsthat are made principally in the home, schools, orsmall institutions where it is not economical topurchase a number of specialized flours.
AlveographAn instrument that measures the stretchability of
dough; said to provide an indication of bakingquality. A standard disc of dough is blown into abubble, and the pressure change and burstingpressure is charted versus time.
AmylographAn instrument used to determine change of
viscosity with time in a heated mixture of water anda starchy material such as f lour.
AshThe inorganic material left after flour is burned.
Frequently included in flour specifications as acriterion of the extraction rate and inf luences flour/product color.
AspiratorA grain-cleaning apparatus that utilizes the
separation power of air currents to remove low-density impurities such as dust, light chaff, and branparticles from grains or other granular material.
Bake-outThe amount of weight loss undergone by a dough
or batter during its passage through the oven.
Baker’s Hard Wheat Bread FlourBaker’s Hard Wheat Bread Flour shall be milled
only from the classes Hard Red Spring, Hard RedWinter, or Hard White Wheat…and shall meet thefollowing chemical and physical requirements:Moisture 14.0% Max.
(Following on a 14% moisture basis.)Protein (N x 5.7) 11.30% Min. 13.00% Max.Ash 0.44% Min. 0.48% Max.Falling Number, (Range) 200 Min. 300 Max.
Baker’s PercentThe weight of individual ingredients expressed as
a percentage of the weight of flour in the formula.Thus, a dough made from 100 pounds of f lour and60 pounds of water would have 60 percent ingredi-ent water (60 percent absorption).
BeardThe small bristles that grow at one end of the
wheat kernel.
Biscuit FlourA wheat flour milled from soft wheat, or a
combination of soft and hard wheats, for theproduction of chemically leavened biscuits.
Biscuit f lour will have an approximate proteincontent of 9 to 10 percent and an ash content ofapproximately 0.38 to 0.44 percent.
Bleached FlourWheat flour that has been treated with chemicals,
such as benzoyl peroxide, in order to increase itswhiteness; usually, some maturing action also isexerted by these chemicals.
BleachingTreating flour with an oxidizing agent to discolor
some of the natural pigments or cause desirablechanges in all flour components.
Boerner DividerThe official device used for dividing a grain
sample into representative subsamples.
Brabender ExtensographA dough-testing device used as a supplement to
the Brabender Farinograph that measures extensibil-ity and resistance to extension.
2Wingfield, 1989.Dictionary of millingterms and equipment.Association of OperativeMillers. Leawood, KS,and Matz, S.A., 1993.Glossary of Milling andBaking Terms, Pan-TechInternational, Inc.McAllen, TX.

16 Quality Oriented Marketing of Hard Winter Wheat • • • • • • • • • • • • • • • • • • • • • • • • • • • • • • • • • • • • • • • • • • •
The Extensograph, or Extensigraph, stretches apiece of preformed dough at a constant speed andrecords the resistance on a moving graph until thedough piece breaks. The resultant curve can be readto show the effect of f lour improvers, such asbromate and iodate, which can scarcely be observedon the Farinogram.
Brabender FarinographA recording dough mixer.The Farinograph consists of a mixing bowl, the
blades of which are driven by a motor connected toa dynamometer. As the dough develops, a torque isproduced on the blades. The dynamometer isconnected to a pen that records the torque on amoving graph.
The complete curve for a given dough is called aFarinogram. The Farinogram can be read for theindices of water absorption, mixing time, stability,and mixing tolerance index, all of which can be usedto predict how a f lour will perform in a commercialbakery.
BranIn the milling of grain, the fraction consisting
mostly of the fibrous outer layers of the kernels.
Bread ScoringA system of evaluating bread that consists of
applying numerical scores to various quality featuresof the loaf and summing these individual scores togive an overall single-figure characterization of thequality of the product.
Break(1) One of the first steps by which the grain is
reduced to meal in roller milling processes; usuallyperformed by pairs of corrugated steel cylinders.
(2) The portion of inner crust exposed when theouter crust ruptures during oven spring; in a panloaf of bread, its the lighter and rougher area alongthe side of the loaf just above the pan top.
Bromated FlourPotassium bromate is added in a quantity not
exceeding 50 parts to each million parts of thefinished bromated flour and is added only to flourswhose baking qualities are improved by such addition.
BuckyA bucky dough is tough and dense and resists
extension; it tends to tear when stretched. Buckinessis characteristic of a “young” or underfermenteddough, but there are other causes as well.
Cake FlourCake f lour is milled from Soft Red Winter or Soft
White Wheat classes of wheat.The flour should have a 9.3-percent maximum
protein (N x 5.7), 0.40-percent maximum ash, 13.5-percent maximum moisture, and a 250-secondminimum Falling Number.
Chemical LeaveningUsually some form of baking powder, i.e. a
mixture of sodium bicarbonate with an acid-reactingsubstance. Ammonium bicarbonate is also in thiscategory.
ChlorinationAdding small amounts of chlorine gas to wheat
flour in order to whiten it and improve its qualityfor cake baking.
Clear FlourThe portion of f lour remaining after the “patent”
mill streams have been diverted.
Clearing TimeTime from beginning of mixing until the dough
forms into a single mass and takes up the materialsmeared on the back of the bowl.
Color TestA test often applied to cereal products to deter-
mine their quality.The color of white products can be checked by the
eye using the Pekar test or by using some type ofinstrument such as the Kent-Jones or Agtron colormeters. Flours may be dark or dull due to poormilling or due to the presence of nonwhite contami-nants such as bran. Nonwhite cereal products may bechecked for their desired color, such as yellow forcorn and durum products. In any color test the effectof granulation on color must be negated, if at allpossible, as changes in color due to granulation willnot affect the color of the baked product.
ConditioningThe process of adding water, steam, or a combina-
tion of both to grain. As the recommended levels ofmoisture for the storage of grain are usually belowthe desirable moisture levels for milling, it is usuallynecessary to add water after cleaning and beforemilling. The addition of water brings about changesin the grain kernel that facilitate the removal of thebran from the endosperm and reduce the energynecessary for endosperm reduction. The use of heatin the conditioning process shortens the time neededfor complete absorption of the water and, if excessheat is applied, it may change the functionalproperties of the grain.
Also referred to as TEMPERING or WETTING.
Cookie FlourA flour milled from lower-protein soft wheats.Cookie f lour is used in the production of cookies
and has an approximate protein content of 7.5 to 8.5percent (N x 5.7) and an ash content of approxi-mately 0.40 to 0.46 percent, both on a 14-percentmoisture basis.
Cracker FlourA flour milled from 100-percent Soft Red Winter
wheat or from a blend of hard and soft wheats.Most cracker flours are a blend, containing
between 20 and 40 percent hard winter. Cracker

• • • • • • • • • • • • • • • • • • • • • • • • • • • • • • • • • • • • • • • • • • • Quality Oriented Marketing of Hard Winter Wheat 17
f lour varies between an 85-percent patent and astraight-grade flour, with a 95-percent patent beingtypical, having a protein content between 8 and 10percent and an ash content between 0.38 and 0.44percent. The lower-protein cracker f lours are usedfor crackers made by the straight dough process,while the higher-protein cracker flours are moresuitable for the sponge dough process.
Defect Action Levels, FDAA listing of the maximum amount of certain
naturally occurring defects that are allowable in foodstuffs sold in interstate commerce.
The Defect Action Levels for Foods are establishedby the Food and Drug Administration and cover, inaddition to many other foods, certain grains andgrain products. The defects listed do not constitute ahazard to health. The official statement in the defectpamphlet says: “The action levels are set because it isnot now possible, and never has been possible, togrow in open fields, harvest, and process crops thatare totally free from natural defects.” Cereal foodsexceeding the defect action levels listed are unlawfuland subject to seizure and penalties. The FDA canalso act against cereal foods that are below theDefect Action Levels if the food has been found to bemade in violation of the current Good ManufacturingPractices (GMPs).
Disk SeparatorA machine containing a set of upright revolving
discs covered with small pockets, used in graincleaning to remove foreign matter that has either asize or shape difference from that of the desired kernels.
DividerMachine that cuts masses of dough into pieces of
uniform weight.
Dough BrakeHeavily built machines for pressing a sheet or
large chunk of dough between metal rollers thatrotate fairly rapidly; their function is to reducedough thickness, squeezing out most of the gas andorienting the fibrils of the gluten as part of theprocessing of bread doughs and the like.
Drum MolderA machine that forms bread loaves by pressing
dough pieces between a rotating drum and an outerjacket positioned to leave a channel between itselfand the drum.
EndospermThe white starch interior material of grain.
Enriched FlourEnriched f lour contains in each pound 2.9
milligrams of thiamine, 1.8 milligrams of riboflavin,24 milligrams of niacin, and 20 milligrams of iron.
It may contain added calcium in such quantitythat the total calcium content is 960 milligrams perpound. Enriched f lour may be acidified withmonocalcium phosphate within the limits prescribed
for “phosphated flour,” but if insufficient additionalcalcium is present to meet the 960 milligram level,no claim may be made on the label for calcium as anutrient.
It may contain no more than 5 percent by weightof wheat germ or partly defatted wheat germ.
(Self-rising and bromated flour may also beenriched.)
Fancy Patent FlourThe name sometimes applied to soft and hard
wheat patent f lours having very low ash contentused for the production of very white cakes.
Fancy patents may constitute approximately 50percent or less of the total f lour streams producedwhen milling a given wheat.
First Clear FlourFirst clear f lour is made up of a selection of the
individual flour streams that are not used for theproduction of short patent f lour. This product willhave an ash content of approximately 0.75 percent(14 percent M.B.) with an average protein content of13.2 percent when milled from a hard winter-springwheat blend and an average protein content of 10percent when milled from a soft wheat.
Hard wheat first clears are used for blendingpurposes to strengthen other flours. Soft wheat firstclears are used in a variety of food products asthickeners and binders.
Flour Classification SystemIn the milling and baking trade, most f lours are
given designations based on their proposed end-product use. These terms are quite general (unlessofficially defined) and vary considerably betweencompanies and geographic locations. Flours in theUnited States fall into the broad classifications of:
Cake Flour All-purpose flourCookie f lour Baker’s bread flourPastry f lour Hearth bread flourDoughnut flour Blending f lourPancake and waffle flourThese are listed in the general order of lowest to
highest protein contents.
Flour Extraction RateThe amount of f lour produced divided by the
amount of grain used and expressed as a percentage.
GlutenA high-protein (75 to 80 percent dry basis) food
product obtained by the wet processing or milling ofwheat or wheat flour. Also known as vital wheatgluten, gum gluten, or crude gluten.
When wheat f lour is made extensible by addingwater and mixing, a dough or batter is formeddepending on the amount of water added. Most ofproteinaceous materials are linked together by thisprocess and can be separated from the starchymaterials by a washing process. The wet glutenformed will contain about 60 percent free water that

18 Qualit y Oriented Marketing of Hard Winter Wheat • • • • • • • • • • • • • • • • • • • • • • • • • • • • • • • • • • • • • • • • • • •
can be removed by drying, and the resulting productis ground into a brownish f lour.
Gluten may be used for (1) dough strengthening,(2) gas retention and controlled expansion, (3)structural enhancement due to thermosetting, (4)water absorption and retention allowing improvedyields, product softness, and extended shelf life, and(5) natural f lavor enhancement. Wheat gluten maybe used in breakfast cereals, breadings, batter mixes,pasta, nutritional snacks, meat, poultry, and fishproducts, and pet foods.
Gradual ReductionThe modern process of milling, in which the goal
is to produce middlings rather than to avoid doingso as was the principle before the New Process wasintroduced. In gradual reduction, the middlings aresized and separated from the bran by sieves andpurifiers, and the particles in each size range arereprocessed under conditions particularly suited tothat size. The process is repeated until the desiredend-products are obtained.
Hagberg Falling Number TestA quick method of determining the presence of
the enzyme alpha-amylase. The Hagberg diastaticnumber is calculated from the inverse of theliquification time minus the gelatinization time. Thistest is frequently used to determine the degree ofgermination in a grain.
Hearth BreadOriginally, loaves or rolls baked on the f loor of
the oven without the use of pans. Now, often appliedto bread or rolls baked in or on pans that do notconfine their lateral expansion.
Hearth-Style FlourBaker’s Hard Wheat hearth-style flour shall be
milled only from the classes Hard Red Spring, HardRed Winter, and Hard White and shall meet thefollowing chemical and physical requirements:Moisture 14.0% Max.
(Following on a 14% moisture basis.)Protein (N x 5.7) 13.25% Min. 14.25% Max.Ash 0.50% Min. 0.55% Max.Falling Number Range 175 Min. 275 Max.
High-Extraction FlourWheat flours containing greater amounts of the
aleurone endosperm.Extraction rates of more than 78 percent are
required to make high-extraction flours that releasemore bran powder, so a darker flour results. High-extraction flours recover more of the total wheatprotein but require more energy to produce than thelower extraction rate flours.
Hungarian ProcessThe modern flour milling system of gradual
reduction with rollers and a primitive type ofpurifier was first put into widespread practice inHungary, and so, for a time, such milling was calledby this name.
Identity PreservedThe characterization of desired traits and quality
factors of a variety and the subsequent process ofsorting and maintaining that variety by name (ortrait) with the intent of increasing the value of theproduct through the point of sale.
KjeldahlA procedure for determining total combined
nitrogen in foods. The nitrogen so determined canbe multiplied by a factor, such as 5.7 for flour, whichgives the approximate protein content of thematerial.
Laboratory MillA milling machine, or a combination of machines,
that can extract milled products from small quanti-ties of grain for testing purposes.
LeaveningAnything used to generate gas inside a dough so
as to provide the typical internal structure of abaked product. Yeast, baking powder, and ammo-nium bicarbonate are the most common leaveners.Water vapor and expanding air also contribute to theleavening of baked products.
Long Patent FlourThe name usually applies to f lours produced
by combining approximately 90 percent or more ofthe total f lour streams produced when milling agiven wheat.
Long patents are normally used for the productionof yeast-raised products such as pan breads.
Low-Grade FlourWheat flour made by combining those individual
flour streams having a higher amount of bran specks.Low-grade f lours are somewhat gray to brown in
color, with a higher protein content than the wheatfrom which they are milled. Minimum ash isapproximately 1 percent.
Low-grade f lours may be sent to a starch orgluten washing plant for recovery of the gluten, soldfor feed, or for various industrial uses, such as afiller and binder for charcoal briquettes.
Even though one low-grade f lour may be taken bya mill, it may be referred to as second low-grade flour.
Middlings (Wheat)Consists of fine particles of wheat bran, wheat
shorts, wheat germ, wheat f lour, and some of theoffal from the “tail of the mill” (Red Dog). Thisproduct must be obtained in the usual process ofcommercial milling and must contain no more than9.5 percent crude fiber.
Milling YieldThe amount of f lour, or other major products,
obtained from a given lot of grain. Many differentmethods are used to report milling yields. Theyinclude:

• • • • • • • • • • • • • • • • • • • • • • • • • • • • • • • • • • • • • • • • • • • Quality Oriented Marketing of Hard Winter Wheat 19
1. Yield by bushel. The amount of grain, inbushels, required to make 1 hundredweight (100pounds) of f lour.
2. Yield by pounds. The amount of grain, inpounds, required to make 1 hundredweight (100pounds) of f lour.
Yields are also reported on different types ofgrain basis.
Some examples are:1. Dry, dirty grain yield. The flour produced is
divided by the grain used before it is cleaned ortempered. This type of yield reporting is used todetermine the cost of raw grain used to produce agiven amount of f lour. This type of yield is impor-tant from an economic sense but is of lesser impor-tance to indicate milling efficiency.
Sometimes referred to as a gross yield.2. Dry, clean grain yield. The flour produced is
divided by the grain used after it has been cleanedbut before tempering. This type of yield reportingeliminates the dockage and foreign material (screen-ings) factors. This type of yield can be compared tothe dry, dirty grain yield to see the effect of cleaningon yields. The yield can be obtained by subtractingthe percent of screenings produced from the dry,dirty yield.
3. Wet, clean yield. The flour produced isdivided by the grain used after it has been cleanedand tempered. This type of yield provides the bestmilling efficiency, or milling performance, compari-son as it is independent of the amount of foreignmaterial or the moisture content on the grain used.
4. Product yield. The flour produced is dividedby the total products produced. This yield does notrequire a wheat scale and provides a quick estimateof mill efficiency.
5. Grand yield. The amount of f lour put into thefinal mode of transportation leaving the mill dividedby the amount of grain received. This is a long-term,usually monthly, yield that is the ultimate economicyield as it relates the final amount of product sold tothe customer compared to the amount of grainpurchased to make the product. It takes into accountall types of losses such as moisture loss, loss of flourto feed, theft, invisible losses, etc.
Moisture BasisThe moisture content at which a quantitative
assay is reported. Common moisture basis ofreporting are:
1. As is. Reported on whatever moisture basisthe original sample was. Grain proteins, as anexample, are commonly reported on this basis.
2. Dry matter. Reported on a zero-water-contentbasis. Most scientific reporting is on this basis as iteliminates moisture as a variable.
3. 14 percent moisture. Flour results are oftenreported on this basis as it is milled at or near thismoisture content.
Mixing ToleranceThe relative capacity of a dough to withstand
changes in mixing conditions, especially variationsin mixing times.
No-Time DoughsA straight dough, which through the use of more
fermenting agents and higher temperatures thannormal and usually with the aid of more mechanicaldevelopment in the form of mixing, has its fermenta-tion period reduced from hours to less than 20minutes. These doughs are sent to make-up immedi-ately after mixing, with a generally unregulated floortime during which some fermentation occurs.
OffalsThe combined by-products obtained from the
milling of wheat consisting of bran and fine wheatfeed. (British)
The remaining or rejected materials resultingfrom the reduction process.
One Thousand Kernel Weight (TKW)The weight of 1,000 kernels of a grain expressed
in grams.
Oven SpringThe expansion of the loaf that occurs during
baking.
Pastry FlourFlour milled from either the Soft Red Winter or
White Wheat classes.The f lour shall have a maximum moisture of 14
percent, a maximum protein of 10.5 percent (N × 5.7),an ash content between 0.41 percent and 0.47 percent,both on a 14-percent moisture basis and a FallingNumber of 250.
Patent FlourThe term PATENT, as applied to wheat f lour
grades, originates from the use of patented processesintroduced in the late 19th and early 20th centuries,which made use of the purifier to produce extrawhite, low-ash flours. Today, patent flours areproduced by combining the white, lower-ash flourstreams during the milling process.
Proof BoxA chamber or room equipped with means for
maintaining relatively constant temperature andhumidity and for transporting dough containers suchas loaf pans through the space.
ProofingThe final rising of bread dough (except for oven
spring) occurring after the dough has been formedinto the final piece.
Recovery PeriodsThe rest stages that allow dough pieces to
accumulate gas and the gluten to relax following, forexample, rounding.

20 Quality Oriented Marketing of Hard Winter Wheat • • • • • • • • • • • • • • • • • • • • • • • • • • • • • • • • • • • • • • • • • • •
Red DogConsists of the offal from the “tail of the mill”
together with some fine particles of wheat bran, wheatgerm, and wheat flour. This product must be obtainedin the usual process of commercial milling and mustcontain not more than 4 percent crude fiber.
RoundingRolling cut dough pieces coming from the divider
so as to seal the surfaces and form a uniform skin onthe pieces.
Sedimentation TestA test for evaluating gluten protein quality; f lour
is suspended in an aqueous solution of lactic acidand alcohol and held for a time under specifiedconditions. The volume occupied by the sediment ismeasured.
Self-Rising FlourSelf-rising f lour is a mixture of f lour, sodium
bicarbonate, and one or more of the acid-reactingsubstances monocalcium phosphate, sodium acidpyrophosphate, and sodium phosphate.
Shaker, Sieve, Testing, Ro-TapA device that holds and shakes, for a predeter-
mined period of time, a set of testing sieves.
Short Patent FlourThe name usually applied to flours produced by
combining approximately 50 to 90 percent of the totalflour streams produced when milling a given wheat.
Short patents are normally used for bakedproducts requiring a very white crumb color and arelow in ash content.
Also referred to as TOP PATENT flour.
ShortsWheat shorts consist of fine particles of wheat bran,
wheat germ, wheat f lour, and the offal from the “tailof the mill” (red dog). This product must be obtainedin the usual process of commercial milling and mustcontain not more than 7 percent crude fiber.
Sponge-and-DoughA method of producing bread in which a sponge
is made by mixing a part of the flour with part orall of the water, and, usually, all of the yeast andyeast food; this mixture is allowed to ferment until itis judged to be ready for incorporation with theother ingredients to make the “dough”.
Straight Dough ProcessA method of bread-making in which substantially
all the ingredients are mixed together at one timeand then fermented, as contrasted with the sponge-and-dough process.
Straight-Grade FlourWheat flours made by combining all of the
individual f lour streams made when milling a givenwheat. No clears are taken.
Straight-grade flours will have a protein contentof approximately 0.8 to 1.2 percent less than the
protein of the wheat used, are of a lower color, andhigher ash content than patent f lours. Straight-gradehard wheat f lours are used for yeast-leavened breadproducts. Straight-grade soft wheat flours are usedfor cookie, wafer, cracker, pie crust, and thickenerproduction.
Swanson MixographA recording dough mixer.The Mixograph mixing bowl contains three
vertical pins. Four other vertical pins, lowered intothe bowl, travel in a planetary motion around thestationary pins. The torque on the mixing bowl,created by the developing dough, is measured bymeans of its rotational resistance against a spring oran electronic strain gage and is recorded on amoving chart. The complete curve produced for agiven dough is called a Mixogram. The Mixogramcurve has a shape that can characterize indicessimilar to those defined for the Farinograph.
Test WeightThe weight of a specific volume of grain as
determined by an approved device. U.S. grainstandards test the dockage-free sample of grain todetermine the pounds per Winchester bushel(2,150.42 cubic inches). Canada and Britain measuretest weight in pounds per Imperial bushel (2,219.36cubic inches). In some countries test weight ismeasured in kilograms per hectoliter (2.8379bushels per hectoliter), or 1.288 times pounds perWinchester bushel.
Wheat BranBroad f lakes of the white, red, or brown outer
covering of the wheat kernel including most of thealeurone endosperm layer. Specifications for feedgrade bran are usually in the order of 13.5 to morethan 20 percent protein (N × 5.7), 2.5 percent fat,and 12 percent fiber (14 percent moisture basis).
Wheat Bran, HeavyLarge (+ No. 8 sieve) pieces of wheat bran with
considerable amounts of adhering endosperm.Heavy bran is usually taken from the first or
second break sifter and is used for the production oftoasted bran flakes for breakfast cereals. Heavy branis usually milled from soft white wheat as its brancolor and taste is usually preferred.
• • • • • • • • • • • • • • • • • • • • • • • • • • • • • • • • • • • • • • • • • • • Quality Oriented Marketing of Hard Winter Wheat 21
APPENDIX 1Grading WheatTerms Defined
Definition of Wheat.Grain that, before the removal of dockage,
consists of 50 percent or more common wheat(Triticum aestivum L.), club wheat (T.compactumHost.), and durum wheat (T.durum Desf.) and notmore than 10 percent of other grains for whichstandards have been established under the UnitedStates Grain Standards Act and that, after the removalof the dockage, contains 50 percent or more ofwhole kernels of one or more of these wheats.
Definitions of other terms.(a) Classes. There are eight classes for wheat:
Durum wheat, Hard Red Spring wheat, Hard RedWinter wheat, Soft Red Winter wheat, HardWhite wheat, Soft White wheat, Unclassed wheat,and Mixed wheat.(1) Durum wheat. All varieties of white
(amber) durum wheat. This class is dividedinto the following three subclasses:(i) Hard Amber Durum wheat. Durum
wheat with 75 percent or more of hardand vitreous kernels of amber color.
(ii) Amber Durum wheat. Durum wheatwith 60 percent or more but less than 75percent of hard and vitreous kernels ofamber color.
(iii) Durum wheat. Durum wheat with lessthan 60 percent of hard and vitreouskernels of amber color.
(2) Hard Red Spring wheat. All varieties ofHard Red Spring wheat. This class is dividedinto the following three subclasses:(i) Dark Northern Spring wheat. Hard Red
Spring wheat with 75 percent or more ofdark, hard, and vitreous kernels.
(ii) Northern Spring wheat. Hard RedSpring wheat with 25 percent or morebut less than 75 percent of dark, hard,and vitreous kernels.
(iii) Red Spring wheat. Hard Red Springwheat with less than 25 percent of dark,hard, and vitreous kernels.
(3) Hard Red Winter wheat. All varieties ofHard Red Winter wheat. There are nosubclasses in this class.
(4) Soft Red Winter wheat. All varieties of SoftRed Winter wheat. There are no subclasses inthis class.
(5) Hard White wheat. All hard endospermwhite wheat varieties. There are no sub-classes in this class.
(6) Soft White wheat. All soft endosperm whitewheat varieties. This class is divided into thefollowing three subclasses:
(i) Soft White wheat. Soft endosperm whitewheat varieties that contain not morethan 10 percent of white club wheat.
(ii) White Club wheat. Soft endospermwhite club wheat containing not morethan 10 percent of other soft white wheats.
(iii) Western White wheat. Soft whitewheat containing more than 10 percentof white club wheat and more than 10percent of other soft white wheats.
(7) Unclassed wheat. Any variety of wheat thatis not classifiable under other criteriaprovided in the wheat standards. There are nosubclasses in this class. This class includesany wheat that is other than red or white incolor.
(8) Mixed wheat. Any mixture of wheat thatconsists of less than 90 percent of one classand more than 10 percent of one other classor a combination of classes that meet thedefinition of wheat.
(b) Contrasting classes. Contrasting classes are:(1) Durum wheat, Hard White wheat, Soft White
wheat, and Unclassed wheat in the classesHard Red Spring wheat and Hard Red Winterwheat.
(2) Hard Red Spring wheat, Hard Red Winterwheat, Hard White wheat, Soft Red Winterwheat, Soft White wheat, and Unclassedwheat in the class Durum wheat.
(3) Durum wheat and Unclassed wheat in theclass Soft Red Winter wheat.
(4) Durum wheat, Hard Red Spring wheat, HardRed Winter wheat, Soft Red Winter wheat,and Unclassed wheat in the classes HardWhite wheat and Soft White wheat.
(c) Damaged kernels. Kernels, pieces of wheatkernels, and other grains that are badly ground-damaged, badly weather-damaged, diseased,frost-damaged, germ-damaged, heat-damaged,insect-bored, mold-damaged, sprout-damaged, orotherwise materially damaged.
(d) Defects. Damaged kernels, foreign material, andshrunken and broken kernels. The sum of thesethree factors may not exceed the limit for thefactor defects for each numerical grade.
(e) Dockage. All matter other than wheat that canbe removed from the original sample by use ofan approved device according to proceduresprescribed in FGIS instructions. Also, underdevel-oped, shriveled, and small pieces of wheatkernels removed in properly separating thematerial other than wheat and that cannot berecovered by properly rescreening or recleaning.
(f) Foreign material. All matter other than wheatthat remains in the sample after the removal ofdockage and shrunken and broken kernels.Determine the amount of foreign material inwheat by handpicking.

22 Quality Oriented Marketing of Hard Winter Wheat • • • • • • • • • • • • • • • • • • • • • • • • • • • • • • • • • • • • • • • • • • •
(g) Heat-damaged kernels. Kernels, pieces of wheatkernels, and other grains that are materiallydiscolored and damaged by heat that remain inthe sample after the removal of dockage andshrunken and broken kernels.
(h) Other grains. Barley, corn, cultivated buck-wheat, einkorn, emmer, f laxseed, guar, hull-lessbarley, nongrain sorghum, oats, Polish wheat,popcorn, poulard wheat, rice, rye, safflower,sorghum, soybeans, spelt, sunflower seed, sweetcorn, triticale, and wild oats.
(i) Shrunken and broken kernels. All matter thatpasses through a 0.064-inch by 3/8-inch oblong-hole sieve after sieving according to proceduresprescribed in the FGIS instructions.
(j) Sieve—0.064 by 3/8 oblong-hole sieve. A metalsieve 0.032 inch thick with oblong perforations0.064 inch by 0.375 (3/8) inch.
Principles Governing theApplication of StandardsBasis of determination
Each determination of heat-damaged kernels,damaged kernels, foreign material, wheat of otherclasses, contrasting classes, and subclasses is madeon the basis of the grain when free from dockageand shrunken and broken kernels. Other determina-tions not specifically provided for under the generalprovisions are made on the basis of the grain whenfree from dockage, except the determination of odoris made on either the basis of the grain as a wholeor the grain when free from dockage.(b) Grades and grade requirements for Mixed
wheat.Mixed wheat is graded according to the U.S.numerical and U.S. Sample Grade requirements ofthe class of wheat that predominates in themixture, except that the factor wheat of otherclasses is disregarded.
Special Grades and SpecialGrade Requirements(a) Ergoty wheat. Wheat that contains more than
0.05 percent of ergot.(b) Garlicky wheat. Wheat that contains in a 1,000-
gram portion more than two green garlicbulblets or an equivalent quantity of dry orpartly dry bulblets.
(c) Infested Wheat. Wheat that is infested with liveweevils or other live insects injurious to storedgrain.
(d) Light smutty wheat. Wheat that has anunmistakable odor of smut, or which contains, ina 250-gram portion, smut balls, portions of smutballs, or spores of smut in excess of a quantityequal to five smut balls, but not in excess of aquantity equal to 30 smut balls of average size.
(e) Smutty wheat. Wheat that contains in a 250-gramportion smut balls, portions of smut balls, or
spores of smut in excess of a quantity equal to30 smut balls of average size.
(f) Treated wheat. Wheat that has been scoured,limed, washed, sulfured, or treated in such amanner that the true quality is not reflected byeither the numerical grades or the U.S. SampleGrade designation alone.
Grade wheat as follows:
Step 1.Examine the sample for heating, odor, animal
filth, castor beans, crotalaria seeds, garlic, glass,insect infestation, unknown foreign substances, andother unusual conditions.
Step 2.Divide out a representative portion from the
sample and determine its moisture content.
Step 3.Determine the percentage of dockage in the
sample.
Step 4.Examine the dockage-free sample for ergot, smut,
stones, and treated seeds.
Step 5.Determine the test weight per bushel of the
dockage-free sample.
Step 6.When deemed necessary, divide out a representa-
tive portion from the dockage-free sample anddetermine the percentage of protein.
Step 7.Divide out a representative portion from the
dockage-free sample and determine the percentage ofshrunken and broken kernels (SHBN).
Step 8.When deemed necessary, divide out representa-
tive portions from the SHBN-free sample anddetermine the percentage of class, contrastingclasses, damaged kernels, heat-damaged kernels,foreign material, subclass, and wheat of other classes.
Portion Sizes.
Damaged kernels 15 grams
Dockage 250 grams
Foreign material 30 grams
Heating The lot as a whole.
Infestation The original sample or lot as awhole.
Moisture The amount recommended bythe instrument manufacturer.
Objectionable odors The original sample or lot as awhole.
Test weight per bushel An amount sufficient to causegrain to overf low a kettle.

• • • • • • • • • • • • • • • • • • • • • • • • • • • • • • • • • • • • • • • • • • • Quality Oriented Marketing of Hard Winter Wheat 23
Procedure for Determining Dockage withHand Sieves.
Step 1.Nest the appropriate sieves on top of a bottom
pan. Place a 12/64-inch round-hole sieve on top of a4.5/64-inch round-hole sieve.
Step 2.Pour the sample into the center of the top sieve,
place the sieves in a mechanical grain sizer, set thesizer’s time to 20, and turn it on.
If a mechanical sizer is not available, hold thesieves and bottom pan level. Then, using a steadymotion, move the sieve from right to left approxi-mately 10 inches and then return from left to right.Repeat this operation 20 times.
Step 3.Remove the dockage. Consider dockage to be all
coarse material that remains on top of the sieves andall material that passed through the bottom sieve.
Test Weight per Bushel.Test weight per bushel is the weight of the
volume of grain that is required to fill a Winchesterbushel (2,150.42 cubic inch) to capacity. Since testweight per bushel tends to increase as moisturecontent decreases, determine it as quickly as possibleafter the grain is sampled. Determine test weight perbushel after the removal of dockage.
Step 1.Pour the sample through a funnel into a kettle
until the grain overflows the kettle.
Step 2.After pouring the grain into the kettle, level it off
by making three, full-length, zigzag motions with astroker.
Step 3.Then weigh the filled kettle on either (1) a special
beam scale attached to the funnel stand, (2) anelectronic scale programmed to convert gram weightto test weight per bushel, or (3) a standard labora-tory scale.
LITERATURE CITEDBequette, R.K., Curran, S.P., Deyoe, C.W., Herrman,
T.J., and R.F. Pudden. Milling & Bread-bakingQualities of Hard Winter Wheat Varieties, 1994Kansas Update. MF-1077. Kansas State UniversityCooperative Extension Service, Manhattan, 66506.
Council for Agricultural Science and Technology.1989. Mycotoxins Economic and Health Risks.Report No. 116. Ames, IA.
Curran, S., D. Eustace, R. Bequette, J. Ponte, and R.Pudden. 1995. 1995 Milling and Baking TestResults for Hard Winter Wheats. Wheat QualityCouncil. Pierre, SD.
Economic Research Service, United States Depart-ment of Agriculture. 1994. Wheat, situation andoutlook report. July, WHS-307.
Federal Grain Inspection Service, United StatesDepartment of Agriculture. 1993. Grain inspec-tion handbook, chapter 13 wheat. USDA, Wa. D.C.
Freese, L.D., M. Hogye, K. Kesecker, A.H. White, andJ.S. Wu. 1994. A discussion paper on objectivewheat classification. U.S.D.A./A.M.S./S.D./StatisticsBranch. Washington, D.C.
Milling & Baking News. 1994. New flour data reveal’93 records. Milling & Baking News, June 7, p.1.
National Agricultural Statistics Service, United StatesDepartment of Agriculture. 1994. Grain stocks.Wa. D.C.
National Grain and Feed Association. 1992. U.S.Agriculture 2020: An economic growth plan forU.S. agriculture. National Grain and Feed Associa-tion, Washington, D.C.
Nelson, S.O. 1980. Moisture-dependent kernel- andbulk-density relationships for wheat and corn.Transactions of the ASAE 23(1):139-143.
Pomeranz, Y. 1992. Wheat hardness: its geneticstructural and biochemical background, measure-ment, and significance. In: Advances in CerealScience and Technology. American Association ofCereal Chemists, St. Paul. pp 471-548.
Smail, V.W. 1995. Improving grain quality throughrapid prediction systems. Cereal Foods World.40(1):5-6.
Stiegert, Kyle. 1995. Marketing Strategies for U.S.Hard Winter Wheat. Research Report #18.Department of Agricultural Economics. KansasState University.

24 Qualit y Oriented Marketing of Hard Winter Wheat • • • • • • • • • • • • • • • • • • • • • • • • • • • • • • • • • • • • • • • • • • •

• • • • • • • • • • • • • • • • • • • • • • • •
WHEAT KERNEL DAMAGE
C
E
A
Photos of wheat kernel damagereproduced from interpretive lineslides with permission of SeedburoEquipment Company.
B
F
Heat Germ
Weevil or Insect Bored D Frost
Sprout
Scab

• • • • • • • • • • • • • • • • • • • • • • • •
BREAD PRODUCTION
Cooperative Extension ServiceKansas State UniversityManhattan, Kansas
MF-2119 June 1995
Issued in furtherance of Cooperative Extension Work, acts of May 8and June 30, 1914, as amended. Kansas State University, CountyExtension Councils, Extension Districts, and United StatesDepartment of Agriculture Cooperating, Richard D. Wootton,Associate Director. All educational programs and materialsavailable without discrimination on the basis of race, color, nationalorigin, sex, age, or disability.
File Code: Grain Science 6 MS 6-95—5M
Straight-dough bread baking test using100 g (0.22 pounds) of flour to measure waterabsorption, mixing requirement, dough machin-ing properties, loaf volume (size), and internalloaf properties including color, grain (cellstructure), and texture (feel).
Photo CreditsThanks to the Kansas Wheat Commission, the AgriculturalExperiment Station, Tim Herrman and Bob Bequette forphotos used in this publication. Photos of wheat kerneldamage reproduced from interpretive line slides withpermission of Seedburo Equipment Company. Specialthanks to Stafford County Flour Mill in Hudson, Kansas,for the photo of their flour mill.