Embed Size (px)
Citation preview
MF Global Corporate Overview
Credit Suisse Financial Services Forum
February 6, 2009
Presented by Randy MacDonald
Chief Financial Officer
Statements contained in this presentation that are not based on current or historical
fact are forward-looking in nature. Such forward-looking statements are based on
current plans, estimates and expectations and are made pursuant to the Private
Securities Litigation Reform Act of 1995. Forward-looking statements are based on
known and unknown risks, assumptions, uncertainties and other factors. The
Company's actual results, performance, or achievements may differ materially from
Safe Harbor
1
Company's actual results, performance, or achievements may differ materially from
any future results, performance, or achievements expressed or implied by such
forward-looking statements. The Company undertakes no obligation to publicly
update or revise any forward-looking statement. For a discussion of some of the
important factors that could cause the issuer’s results to differ from those expressed
in, and implied by, the following forward-looking statements, please refer to the 10-Q
filed with the SEC, in particular, the “Risk Factors” section thereof.
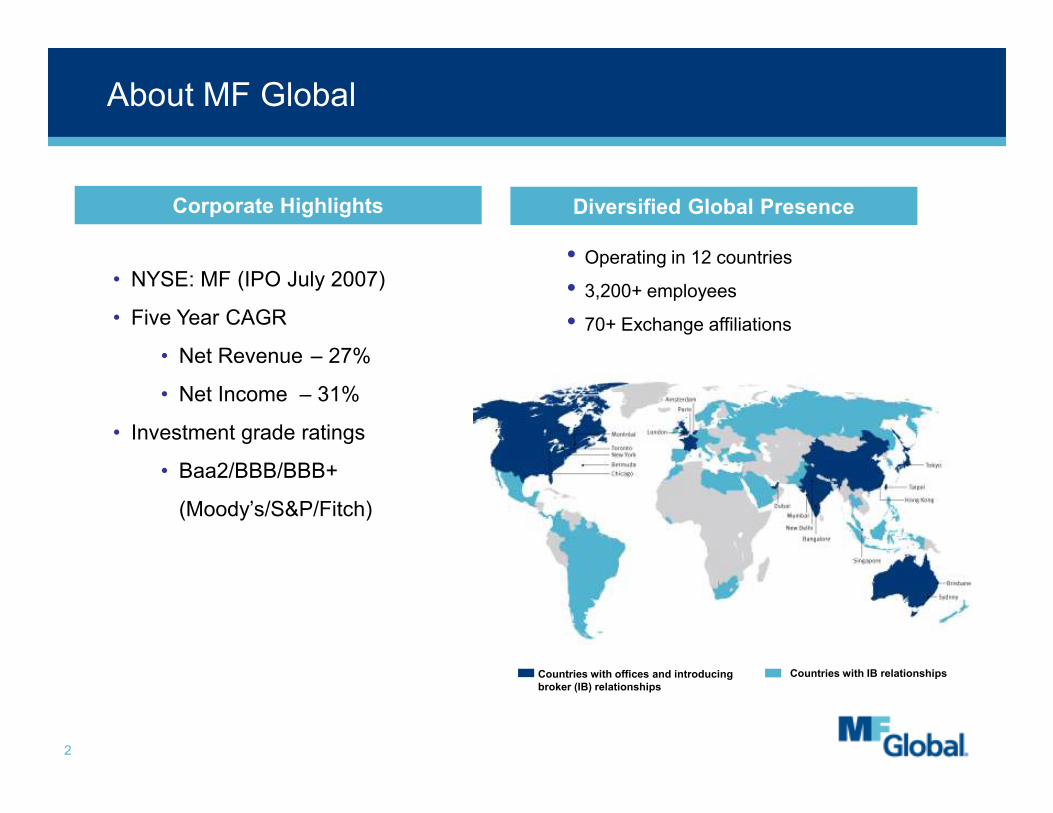
About MF Global
• Operating in 12 countries• 3,200+ employees• 70+ Exchange affiliations
Diversified Global PresenceCorporate Highlights
• NYSE: MF (IPO July 2007)
• Five Year CAGR
• Net Revenue – 27%
• Net Income – 31%
2
Countries with offices and introducing broker (IB) relationships
Countries with IB relationships
• Investment grade ratings
• Baa2/BBB/BBB+
(Moody’s/S&P/Fitch)
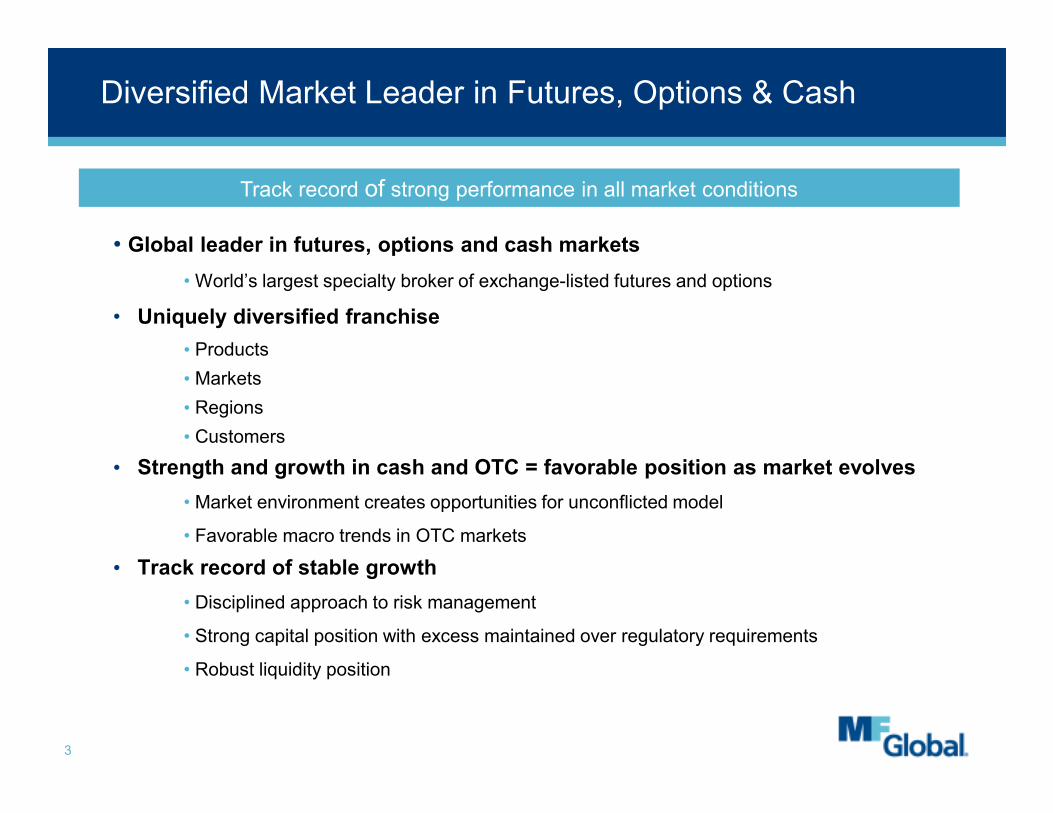
Diversified Market Leader in Futures, Options & Cash
• Global leader in futures, options and cash markets
• World’s largest specialty broker of exchange-listed futures and options
• Uniquely diversified franchise
• Products
• Markets
• Regions
Track record of strong performance in all market conditions
3
• Regions
• Customers
• Strength and growth in cash and OTC = favorable position as market evolves
• Market environment creates opportunities for unconflicted model
• Favorable macro trends in OTC markets
• Track record of stable growth
• Disciplined approach to risk management
• Strong capital position with excess maintained over regulatory requirements
• Robust liquidity position
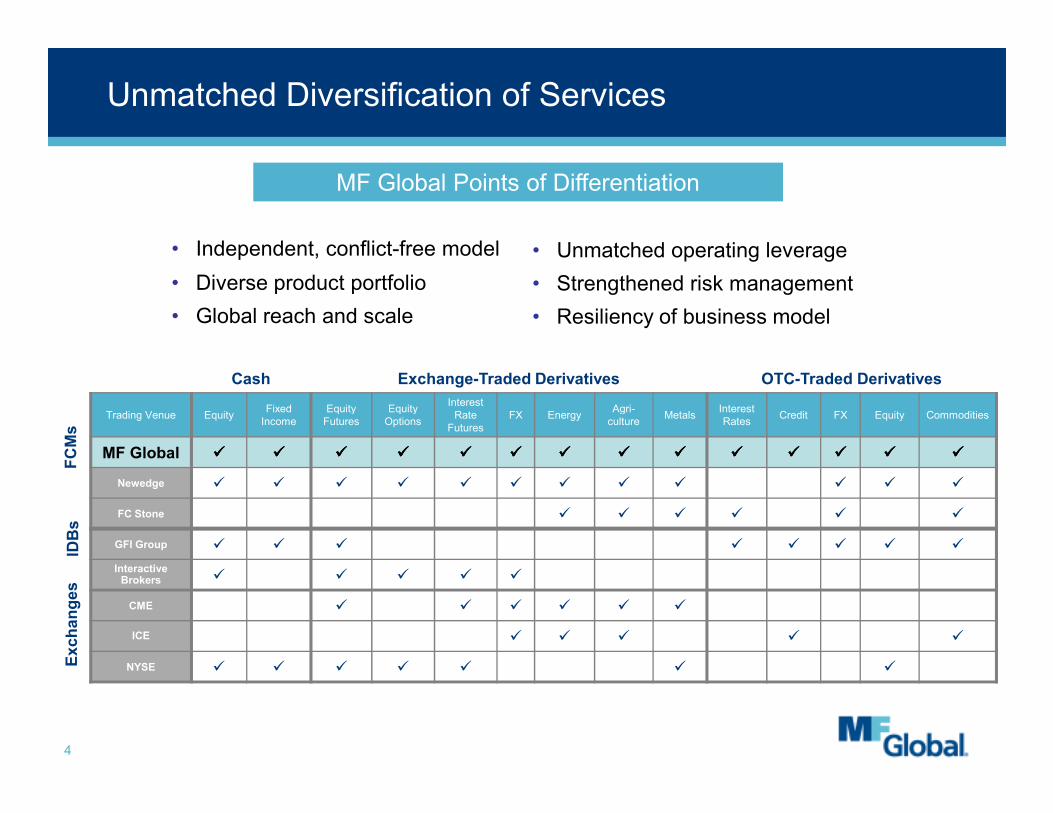
Cash Exchange-Traded Derivatives OTC-Traded Derivatives
Fixed Equity Equity Interest
Agri- Interest
Unmatched Diversification of Services
• Independent, conflict-free model
• Diverse product portfolio
• Global reach and scale
• Unmatched operating leverage
• Strengthened risk management
• Resiliency of business model
MF Global Points of Differentiation
4
Trading Venue EquityFixed Income
Equity Futures
Equity Options
Interest Rate Futures
FX EnergyAgri-culture
MetalsInterest Rates
Credit FX Equity Commodities
MF Global ���� ���� ���� ���� ���� ���� ���� ���� ���� ���� ���� ���� ���� ����
Newedge � � � � � � � � � � � �
FC Stone � � � � � �
GFI Group � � � � � � � �
Interactive Brokers � � � � �
CME � � � � � �
ICE � � � � �
NYSE � � � � � � �Exchanges
IDBs
FCMs
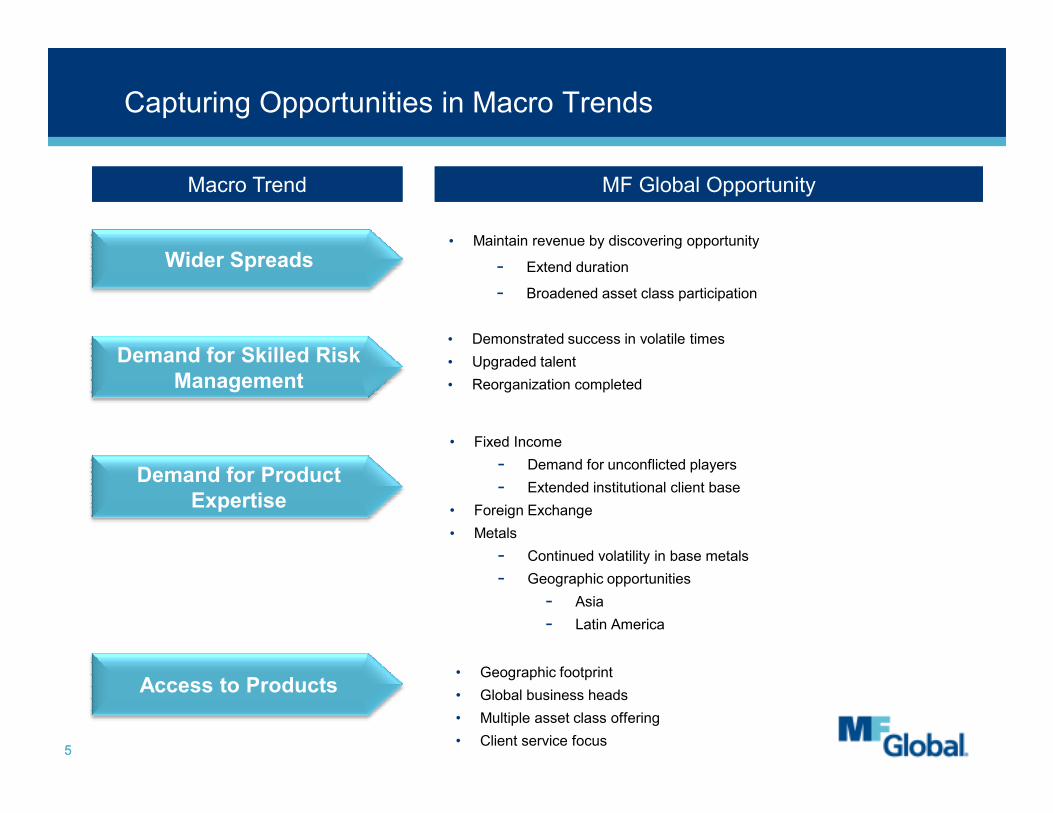
Capturing Opportunities in Macro Trends
• Maintain revenue by discovering opportunity
- Extend duration
- Broadened asset class participation
Wider Spreads
Demand for Skilled Risk Management
Macro TrendMacro Trend MF Global OpportunityMF Global Opportunity
• Demonstrated success in volatile times
• Upgraded talent
• Reorganization completed
55
Demand for Product Expertise
• Fixed Income
- Demand for unconflicted players
- Extended institutional client base
• Foreign Exchange
• Metals
- Continued volatility in base metals
- Geographic opportunities
- Asia
- Latin America
Access to Products• Geographic footprint
• Global business heads
• Multiple asset class offering
• Client service focus
3.00
3.25
3.50
3.75
4.00
4.25
4.50
4.75
5.00
5.25
5.50
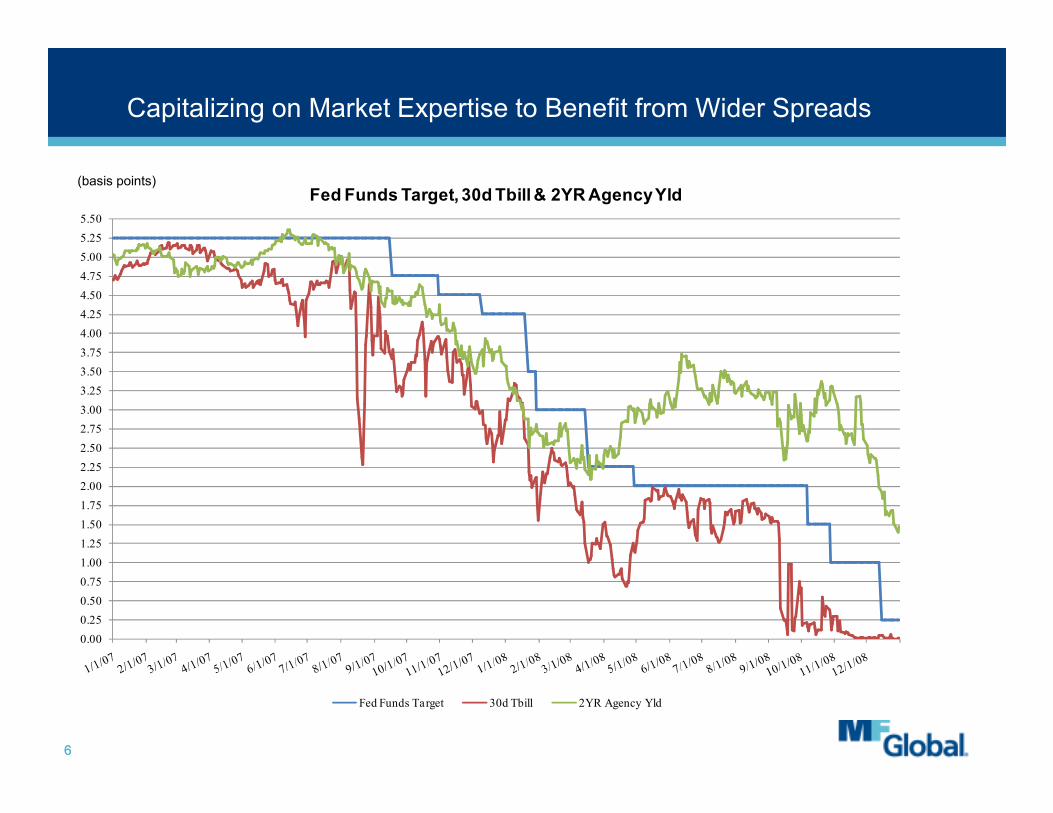
Fed Funds Target, 30d Tbill & 2YR Agency Yld(basis points)
Capitalizing on Market Expertise to Benefit from Wider Spreads
0.00
0.25
0.50
0.75
1.00
1.25
1.50
1.75
2.00
2.25
2.50
2.75
3.00
Fed Funds Target 30d Tbill 2YR Agency Yld
66
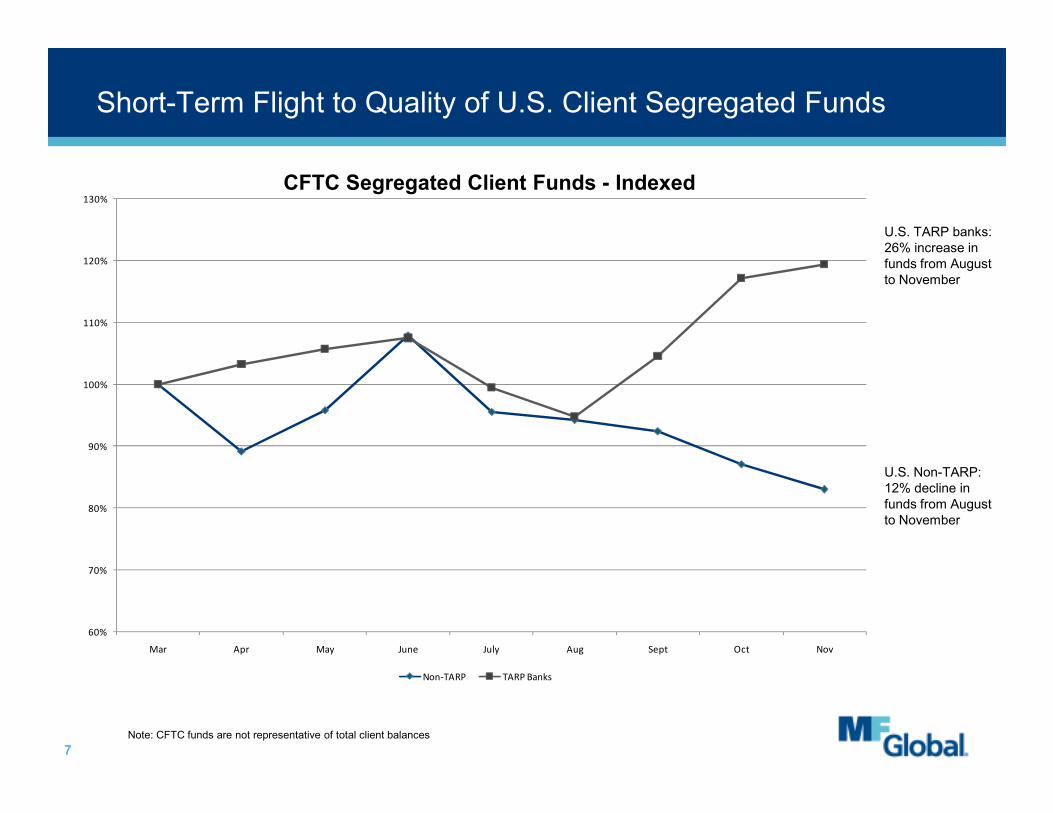
100%
110%
120%
130%
Short-Term Flight to Quality of U.S. Client Segregated Funds
U.S. TARP banks: 26% increase in funds from August to November
CFTC Segregated Client Funds - Indexed
60%
70%
80%
90%
Mar Apr May June July Aug Sept Oct Nov
Non-TARP TARP Banks
77Note: CFTC funds are not representative of total client balances
U.S. Non-TARP: 12% decline in funds from August to November
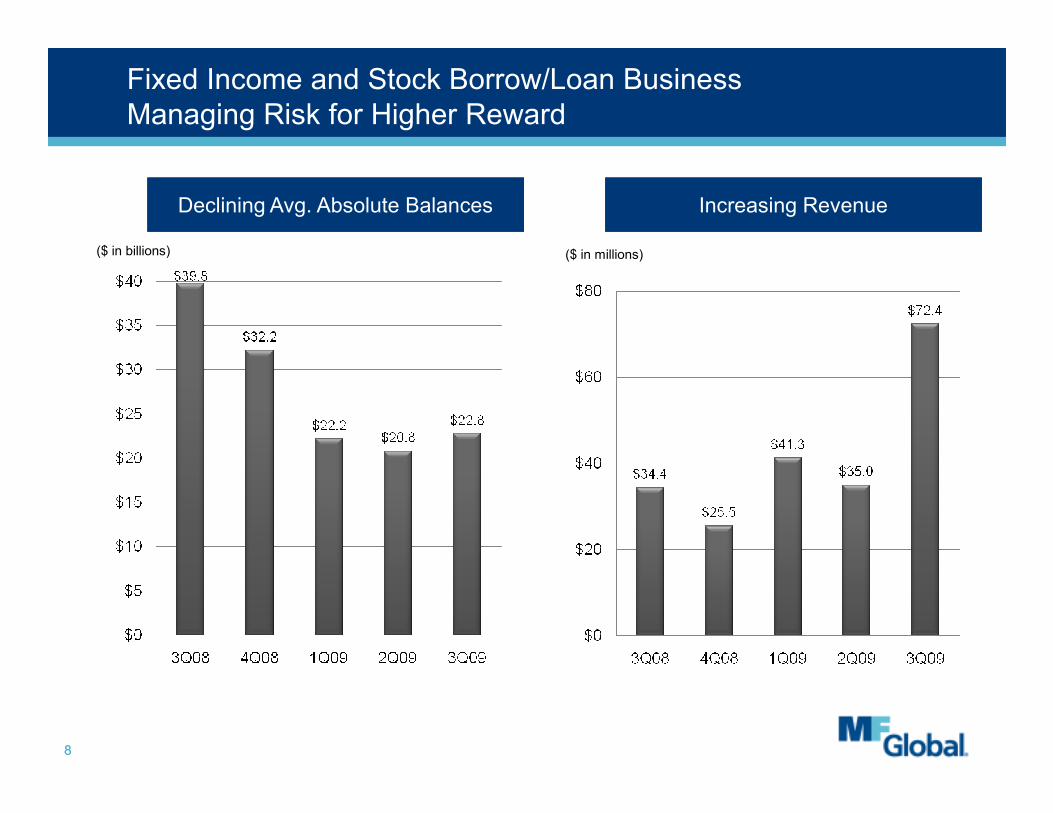
Fixed Income and Stock Borrow/Loan BusinessManaging Risk for Higher Reward
Declining Avg. Absolute BalancesDeclining Avg. Absolute Balances Increasing RevenueIncreasing Revenue
($ in millions)($ in billions)
88
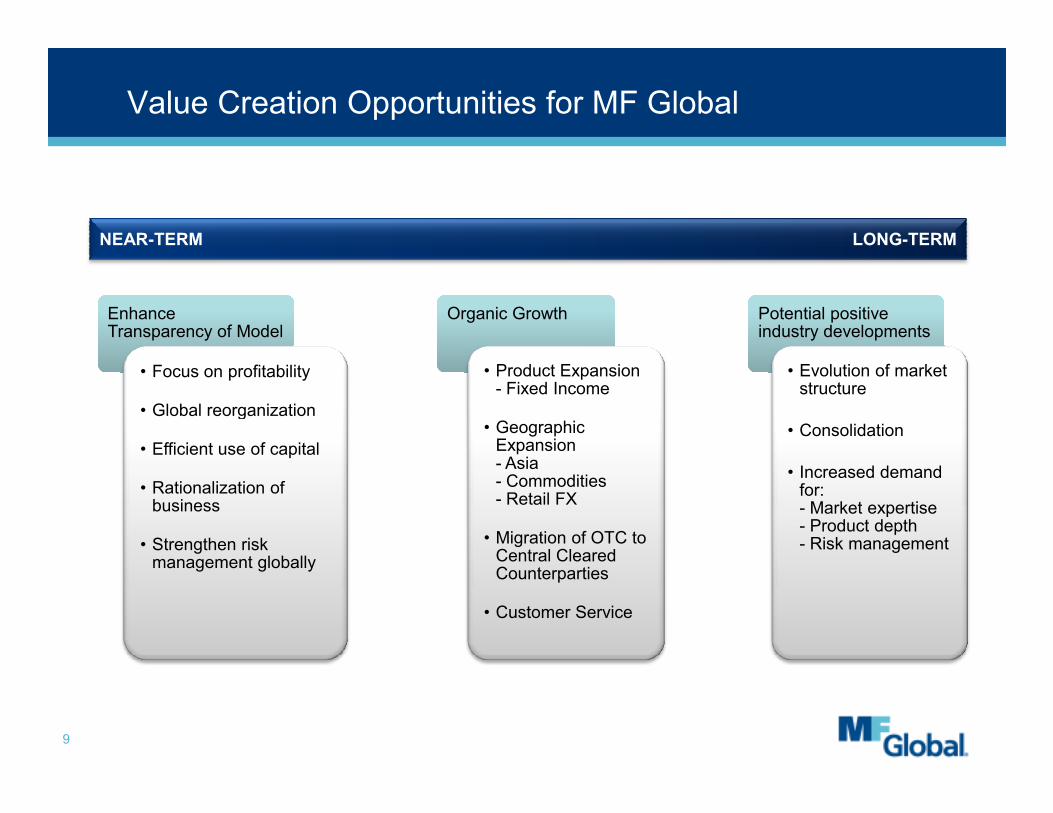
Value Creation Opportunities for MF Global
NEAR-TERM LONG-TERM
Enhance Transparency of ModelEnhance Transparency of Model
• Focus on profitability
• Global reorganization
Organic GrowthOrganic Growth
• Product Expansion- Fixed Income
Potential positive industry developmentsPotential positive industry developments
• Evolution of market structure
9
• Global reorganization
• Efficient use of capital
• Rationalization of business
• Strengthen risk management globally
• Geographic Expansion- Asia- Commodities- Retail FX
• Migration of OTC to Central Cleared Counterparties
• Customer Service
• Consolidation
• Increased demand for:- Market expertise- Product depth- Risk management
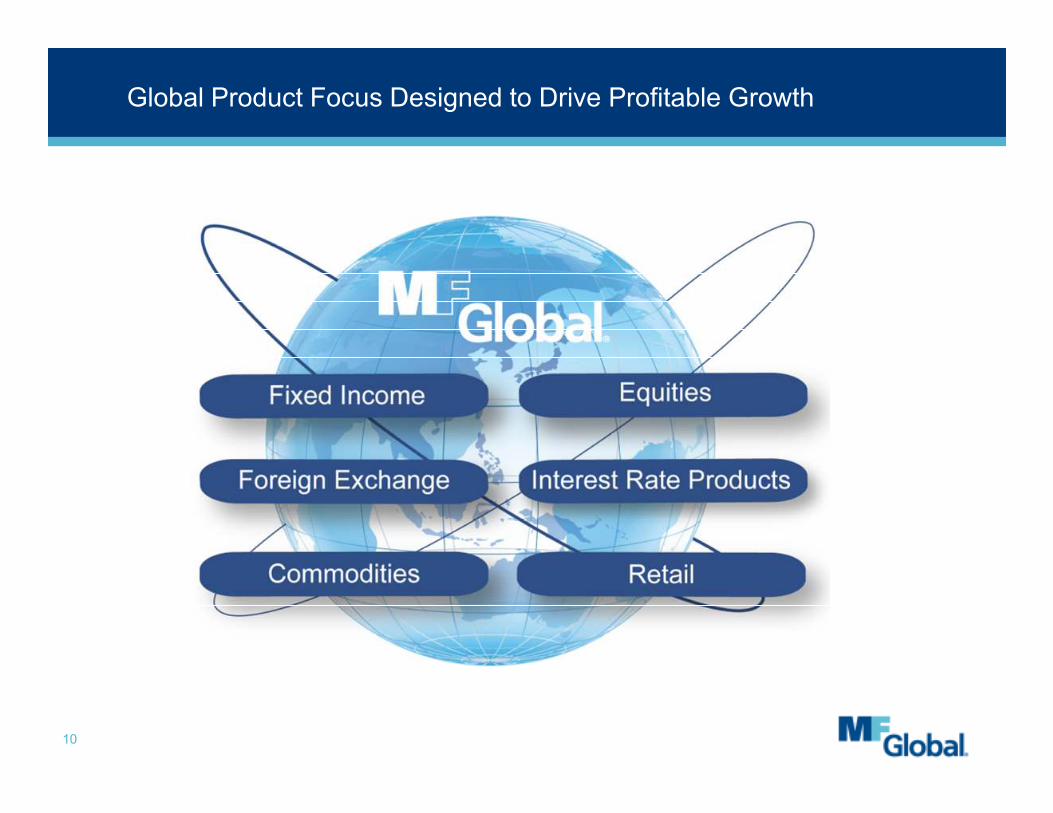
Global Product Focus Designed to Drive Profitable Growth
10
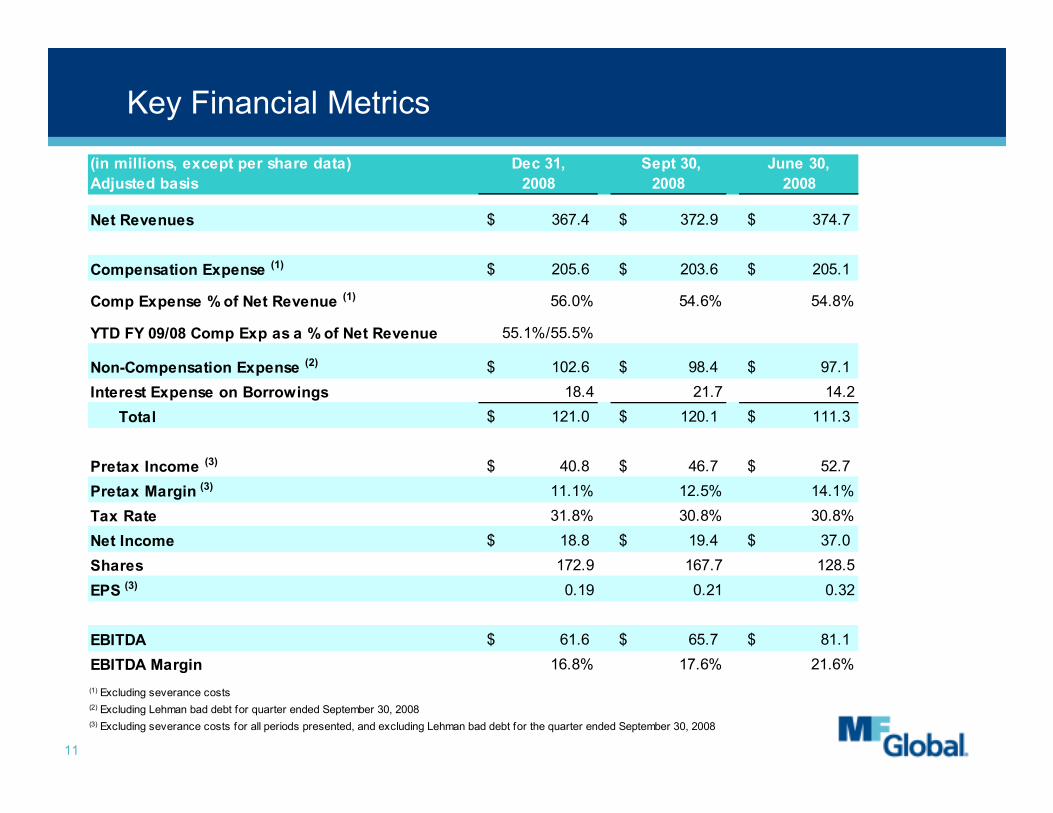
Key Financial Metrics
(in millions, except per share data) Dec 31, Sept 30, June 30,
Adjusted basis 2008 2008 2008
Net Revenues 367.4$ 372.9$ 374.7$
Compensation Expense (1) 205.6$ 203.6$ 205.1$
Comp Expense % of Net Revenue (1) 56.0% 54.6% 54.8%
YTD FY 09/08 Comp Exp as a % of Net Revenue 55.1%/55.5%
Non-Compensation Expense (2) 102.6$ 98.4$ 97.1$
Interest Expense on Borrowings 18.4 21.7 14.2
11
Total 121.0$ 120.1$ 111.3$
Pretax Income (3) 40.8$ 46.7$ 52.7$
Pretax Margin (3) 11.1% 12.5% 14.1%
Tax Rate 31.8% 30.8% 30.8%
Net Income 18.8$ 19.4$ 37.0$
Shares 172.9 167.7 128.5
EPS (3) 0.19 0.21 0.32
EBITDA 61.6$ 65.7$ 81.1$
EBITDA Margin 16.8% 17.6% 21.6%
(1) Excluding severance costs(2) Excluding Lehman bad debt for quarter ended September 30, 2008(3) Excluding severance costs for all periods presented, and excluding Lehman bad debt for the quarter ended September 30, 2008
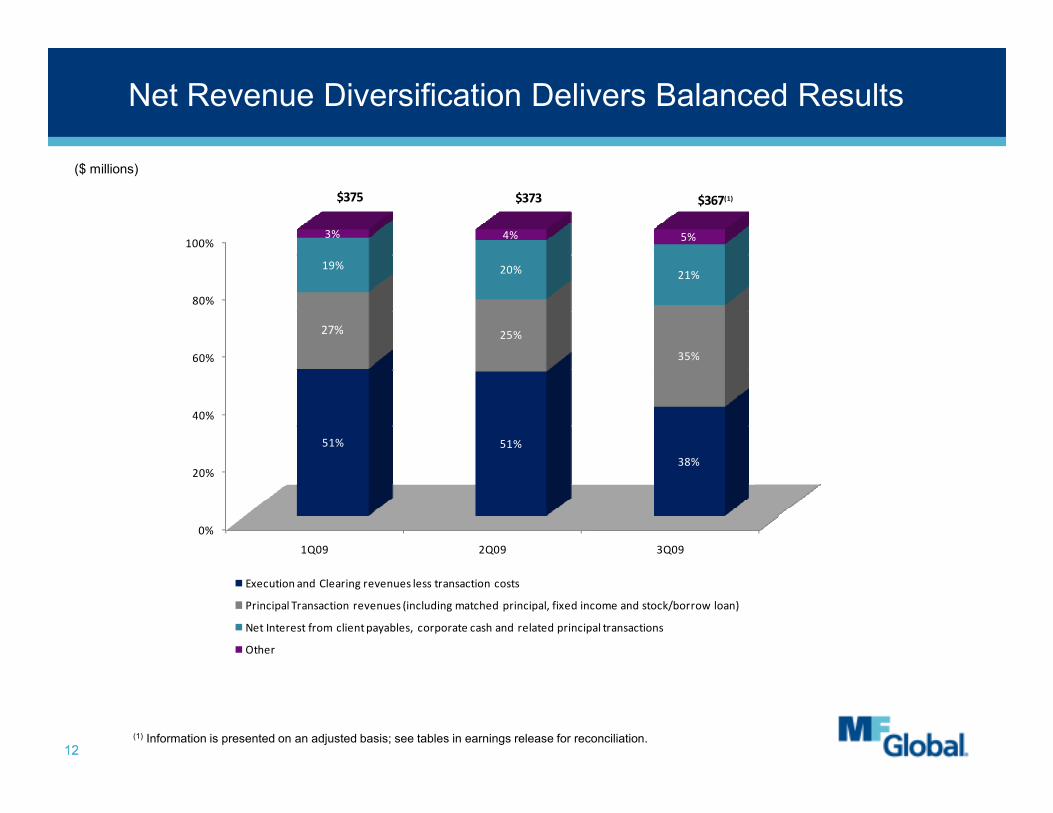
($ millions)
Net Revenue Diversification Delivers Balanced Results
60%
80%
100%
27% 25%
35%
19% 20% 21%
3% 4% 5%
$375 $373 $367(1)
1212(1) Information is presented on an adjusted basis; see tables in earnings release for reconciliation.
0%
20%
40%
1Q09 2Q09 3Q09
51% 51%
38%
Execution and Clearing revenues less transaction costs
Principal Transaction revenues (including matched principal, fixed income and stock/borrow loan)
Net Interest from client payables, corporate cash and related principal transactions
Other
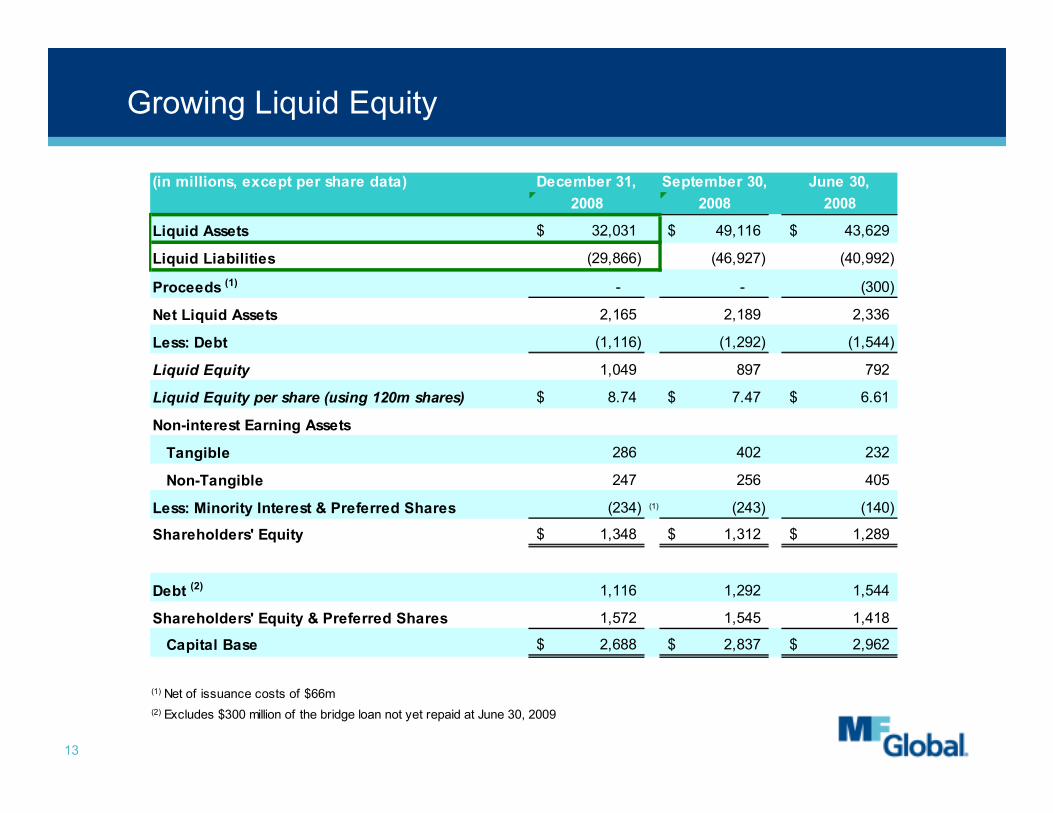
Growing Liquid Equity
(in millions, except per share data) December 31, September 30, June 30,
2008 2008 2008
Liquid Assets 32,031$ 49,116$ 43,629$
Liquid Liabilities (29,866) (46,927) (40,992)
Proceeds (1) - - (300)
Net Liquid Assets 2,165 2,189 2,336
Less: Debt (1,116) (1,292) (1,544)
Liquid Equity 1,049 897 792
Liquid Equity per share (using 120m shares) 8.74$ 7.47$ 6.61$
13
Non-interest Earning Assets
Tangible 286 402 232
Non-Tangible 247 256 405
Less: Minority Interest & Preferred Shares (234) (1) (243) (140)
Shareholders' Equity 1,348$ 1,312$ 1,289$
Debt (2) 1,116 1,292 1,544
Shareholders' Equity & Preferred Shares 1,572 1,545 1,418
Capital Base 2,688$ 2,837$ 2,962$
(1) Net of issuance costs of $66m
(2) Excludes $300 million of the bridge loan not yet repaid at June 30, 2009
800
1,000
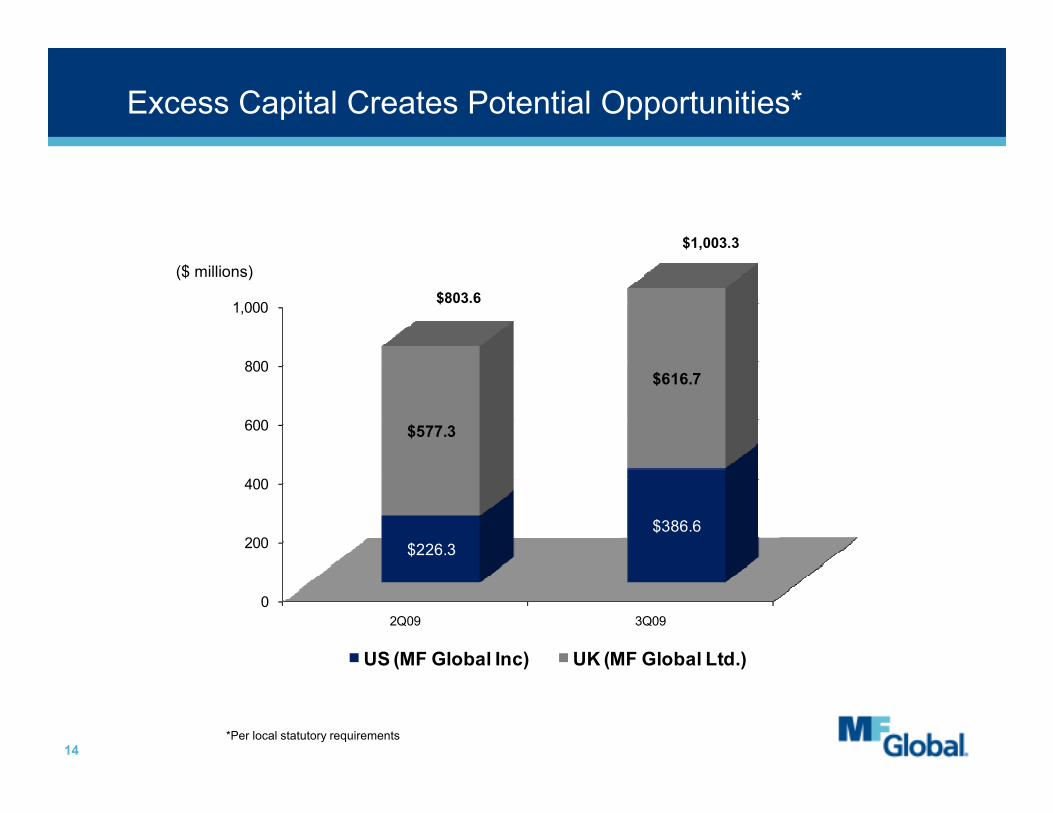
$616.7
Excess Capital Creates Potential Opportunities*
($ millions)
$803.6
$1,003.3
0
200
400
600
2Q09 3Q09
$226.3
$386.6
$577.3
US (MF Global Inc) UK (MF Global Ltd.)
14*Per local statutory requirements

Diversified Market Leader in Futures, Options & Cash
• Global leader in futures, options and cash markets
• World’s largest specialty broker of exchange-listed futures and options
• Uniquely diversified franchise
• Products
• Markets
• Regions
Track record of strong performance in all market conditions
15
• Regions
• Customers
• Strength and growth in cash and OTC = favorable position as market evolves
• Market environment creates opportunities for unconflicted model
• Favorable macro trends in OTC markets
• Track record of stable growth
• Disciplined approach to risk management
• Strong capital position with excess maintained over regulatory requirements
• Robust liquidity position

Questions
This section of the page should be blank except when footnotes are present.