Embed Size (px)
Citation preview
ICCTAug2017
i|P a g e
FinalReport
MEXICOFREIGHTASSESSMENT
GLOBALGREENFREIGHTACTIONPLAN
Authors:
JohnRogers,RobinKaenzigandStevenJ.RogersSubmittedto:
TheInternationalCouncilonCleanTransportation(ICCT)
SanFranciscoCABy:
TheSustainableTransportandEmissionsServicesCompanyTSTESSAdeCV.
Calz.deTlalpan5005ACol.LaJoya,TlalpanMexicoDFCP14090
Incollaborationwith:
IntegratedTransportPlanningLtd50NorthThirteenthStreetMiltonKeynesMK93BPUK
Date: Aug24,2017
ICCTAug2017
ii|P a g e
ContentsTables......................................................................................................................vi
Figures.....................................................................................................................ix
Abbreviations..........................................................................................................xi
Acknowledgements................................................................................................xii
Chapter1:-ExecutiveSummary................................................................................1
Chapter2:-FreightcontextinMexicoandtheUSA..................................................3
FreightbymodeinMexicoandtheUSA..................................................................................................4
DomesticFreightinMexicoandtheUSA.............................................................................................4
ImportandExportfreighttoUSAandCanada.....................................................................................9
TransportInfrastructureinMexico........................................................................................................11
RoadSystem.......................................................................................................................................11
RailSystem.........................................................................................................................................13
Multimodalfreight.............................................................................................................................15
Pipelines.............................................................................................................................................15
TransportActivitybymodesotherthanRoad.......................................................................................17
FreighttransportedbyRail.................................................................................................................17
RailEnergyEfficiency..........................................................................................................................19
Principalportsbytonnage(nationalandInternational)2015...........................................................20
AirOperations....................................................................................................................................21
Chapter3:-CharacteristicsofIn-useTractor-trailersinMexico............................24
HighwayTractors....................................................................................................................................26
Registeredpopulation........................................................................................................................26
ActivepopulationofHighwayTractors..............................................................................................28
Highwaytractors–enginereplacementpractices.............................................................................38
Semi-trailers...........................................................................................................................................40
ICCTAug2017
iii|P a g e
Semi-trailerpopulation......................................................................................................................40
Ageandexpectedlifeofvehicles...........................................................................................................44
HighwayTractorTechnology..................................................................................................................47
Tires....................................................................................................................................................49
UsageofAirConditioning...................................................................................................................50
Chapter4:-VehiclePurchasing..............................................................................53
NewVehiclesales...................................................................................................................................55
Purchasepatternsofvehicles................................................................................................................57
UsedVehiclesales..................................................................................................................................58
Howarevehiclesforsalelocated.......................................................................................................58
Expectedsalespriceforusedunits....................................................................................................60
Motivesforchoosingaspecificmakeofhighwaytractor..................................................................61
Motivesforchoosingaspecificmakeofsemi-trailer.........................................................................62
Howpurchasesarefinanced..............................................................................................................63
Currentproblemswithfinancing.......................................................................................................64
Expectedpurchasesoverthecoming24months..............................................................................65
Chapter5:-Tractor-trailerUsageandOperatingCosts..........................................68
Theroleofthedifferenttypesoffleets.............................................................................................71
Highwaytractorkilometersperyear..................................................................................................72
Owner-operator.................................................................................................................................74
ForHireFleets....................................................................................................................................75
Industry&Commerce........................................................................................................................75
Construction&Mining.......................................................................................................................76
Agriculture..........................................................................................................................................77
Government.......................................................................................................................................78
Highwaytractornumberoftripsandtriplength...............................................................................79
FuelEconomy.....................................................................................................................................81
FuelCost.............................................................................................................................................85
OperatingExpenses................................................................................................................................85
Datacollectedonin-usetractor-trailersinMexico................................................................................89
ICCTAug2017
iv|P a g e
NationalEmissionsRegister(RENE).......................................................................................................90
Chapter6:-Tariffs,FreighttypeandLogistics........................................................92
TariffNegotiationandIncreases........................................................................................................93
TypeandSourceofFreightshipments...................................................................................................94
Vehicleloadingandscheduling..........................................................................................................96
Logistics..............................................................................................................................................97
Fleetmembershipofassociations/confederations..........................................................................98
Chapter7:-InstitutionalandRegulatoryFramework...........................................100
ImpactofDeregulation........................................................................................................................100
PresentRegulation...............................................................................................................................101
RequiredDocumentationandapplicablestandards............................................................................102
On-roadtransportpolicies(currentandfuture)..................................................................................104
Opportunitiesforapolicyframeworktopromotethegrowthofcleanfreight...............................105
Chapter8:-ProgramadeTransporteLimpioandrelatedprograms....................108
Currentpoliciesandprograms.............................................................................................................110
TransporteLimpio................................................................................................................................110
PurposeofTransporteLimpio..........................................................................................................110
Programachievements....................................................................................................................111
Challengesandbarriers....................................................................................................................116
Areasforfuturedevelopment..............................................................................................................119
FurtherhomologationwithSmartWay............................................................................................120
HowfarcanTransporteLimpiogointhenext10years...................................................................122
ProgramfortheModernizationoftheFederalMotorCarrierFleet....................................................122
Challengesandbarriers....................................................................................................................123
FederalMotorCarrierScrappageScheme...........................................................................................124
Challengesandbarriers........................................................................................................................124
Futurepoliciesandprograms...............................................................................................................125
MexicanOfficialStandardNOM-044................................................................................................125
FederalRoadFreightTransportNAMA(forowneroperatorsandsmallerfleetcarriers)...............126
ICCTAug2017
v|P a g e
Chapter9:-Fuelefficiencyandemissionsstandards...........................................127
EmissionstandardsfornewheavydutydieselvehiclesinMexico......................................................128
DieselEngineStandards...................................................................................................................129
EmissionstandardsforIn-useHeavyDutydieselvehiclesinMexico..................................................133
Previouslimits..................................................................................................................................134
CurrentLimits...................................................................................................................................134
Testprocedure.................................................................................................................................135
TestFrequency.................................................................................................................................135
TestFacilities....................................................................................................................................135
TestEffectiveness.............................................................................................................................135
TestResults......................................................................................................................................136
FuelefficiencystandardsintheUSA................................................................................................136
ANNEX:.................................................................................................................138
ApproachandMethodology................................................................................138
a) Informationavailablefrompublicsources...................................................................................138
b) InformationavailablefrompreviousstudiesconductedbyTSTES..............................................139
c) Newfieldsurveyandinterviewdata............................................................................................140
HowtheactivepopulationofHighwayTractorswasdetermined.......................................................141
ActivepopulationofHighwayTractorsinthecurrentsurvey..........................................................144
ActivepopulationofSemi-trailersinthecurrentsurvey.................................................................147
References............................................................................................................149
ICCTAug2017
vi|P a g e
Tables
Table1-DomesticfreighttransportbymodeinMexico.............................................................................8Table2-DomesticfreighttransportbymodeinUSA..................................................................................8Table3-DomesticfreighttrafficbymodeinMexico..................................................................................8Table4- DomesticfreighttransportbymodeinUSA.............................................................................9Table5-EXPORTMerchandisetradeofMexicotoNAFTAcountriesandtheworldbymajorproductgroup,2014..................................................................................................................................................9Table6-IMPORTMerchandisetradeofMexicofromNAFTAcountriesandtheworldbymajorproductgroup,2014..................................................................................................................................................9Table7-PrincipalportsofEntry/Exitforfreightto/fromNAFTAtradingpartners...................................10Table8-TransportInfrastructureinMexico.............................................................................................11Table9-ConstructionofnewpipelinesinMexicoupto2017..................................................................16Table10-PrincipalproductstransportedbyRailinMexico......................................................................18Table11-FreighttransportedbyRailandfuelefficiencyinMexico.........................................................19Table12-PrincipalportsbyfreighttonnageinMexico............................................................................21Table13-YearlyTradeRatiosofValuetoWeightbetweenUSA-MEXICO(importvaluetotheUSAincurrentU.S.dollarsandimportweightinKg)............................................................................................22Table14-PrincipalstatesforAirfreightinMexico...................................................................................23Table15StateswithmostregisteredHighwayTractors(2016)................................................................27Table16--ActiveparcofHighwayTractorsin2015(MacKaystudy).......................................................29Table17-Comparisonofregisteredvsin-usehighwaytractorsin2015..................................................30Table18-PopulationofHighwayTractorsinactivefleetusage...............................................................31Table19-Top100delautotransporteT21(10aEdición)Dec2016..........................................................34Table20-HighwayTractorsbymake........................................................................................................38Table21-Enginesbymake........................................................................................................................39Table22-Ratioofsemitrailersperhighwaytractorbyvocation..............................................................41Table23-Semi-trailerbytype...................................................................................................................43Table24-Semi-trailerbymake.................................................................................................................44Table25–MakeofTireused.....................................................................................................................50Table26-UsageofAirConditioning..........................................................................................................51Table27-Popularsitesforusedhighwaytractors....................................................................................59Table28-Howdoyoufindtheunittobeabletobuyit?..........................................................................60Table29-Expectedsecond-handresaleprice...........................................................................................61Table30–ReasonsforchoosingthismakeofHighwayTractor................................................................62Table31-ReasonsforchoosingthismakeofSemi-trailer........................................................................62Table32-Howthepurchaseofaunitwasfinanced.................................................................................63Table33-Howhighwaytractorpurchaseswerefinanced........................................................................64Table34-Problemsassociatedwithobtainingfinance.............................................................................65
ICCTAug2017
vii|P a g e
Table35-NumberofHighwayTractorsthatareexpectedtobeboughtorsoldoverthecoming24months.......................................................................................................................................................66Table36-NumberofSemi-trailersthatareexpectedtobeboughtorsoldoverthecoming24months67Table37-AveragekmsbyageofvehiclebyVocation..............................................................................73Table38-Averagetriplength(kms)byageandvocation.........................................................................80Table39-Averagenumberoftripspermonthbyageandvocation.........................................................81Table40-Averagefueleconomykm/L)byageandvocation...................................................................83Table41-Illustrativedrivecycleexamples.................................................................................................84Table42-Ratiooftrailerspertractorinthe2011and2017studies........................................................85Table43-OperatingExpensesforHighwayTractors(thousandsofpesos)..............................................87Table44–DifferencesinOperatingExpensesforHighwayTractorsbyVocation(thousandsofpesos)..88Table45-Otherexpenseitemsmentionedbytheinterviewees...............................................................89Table74-Whichcontrolsdofleetsregularlykeep?..................................................................................90Table46-TariffNegotiation......................................................................................................................94Table47-FrequencyofTariffIncreases....................................................................................................94Table48-Whodefinestheexactrouteanddeparturetime.....................................................................98Table50-Membershipswithassociations/confederations/transportorganizations............................99Table51-WeightandDimensions...........................................................................................................103Table52-TransporteLimpiomarketedfuelsavingsfromstrategiesandtechnology............................111Table57-Howoftendoyoumeasureprogress?....................................................................................113Table58-Haveyoumadechangestoimprovetheperformanceandemissionsofyourvehicles?Which?..................................................................................................................................................................113Table59-Changesmadetoimprovetheperformanceandemissionsoftheirvehicles........................114Table60-Changesintervieweesplanttomaketoimprovetheperformanceandemissionsoftheirvehicles.....................................................................................................................................................114Table61-Changesmadetoimprovetravelscheduling..........................................................................115Table56-EXAMPLESOFSMARTWAYBRANDING.EPA(2016)................................................................117Table54-SmartWayandTransporteLimpioperformancestatistics......................................................120Table55-SmartWaymeasuresagainstTransporteLimpio.....................................................................121Table53-:Currentscrappageincentivesagainstvalueofoldvehicles..................................................124Table64-Max.PermissibleEmissionsStandards;Heavy-dutyVehiclesCompliance.............................130Table65-MaximumPermissibleEmissionsforHeavy-dutyVehiclesing/bhp-hr..................................130Table66-MaximumPermissibleEmissionsforHeavy-dutyVehiclesing/kwhr.....................................130Table67-Frameworkoftheproposedstandardsfor2019.....................................................................131Table68-U.S.certificationlimitvaluesforheavy-dutyengines.............................................................132Table69-Europeancertificationlimitvaluesforheavy-dutyengines....................................................132Table70-Usefulliferequirements..........................................................................................................132Table71-NOM-045-SEMARNAT-1996Limitsforvehiclesofover2,727kgsPBV...................................134Table72-NOM-045-SEMARNAT-2006Limitsfordieselvehiclesofover2,727kgsPBV........................134Table73-NOM-EM-167-SEMARNAT-2016Limitsfordieselvehiclesofover2,727kgsPBV..................134
ICCTAug2017
viii|P a g e
Table63–HeavyHEAVY-DUTY(Class8)COMBINATIONTRACTOREPAEMISSIONSSTANDARDS(GCO2/TON-MILE)ANDNHTSAFUELCONSUMPTIONSTANDARDS(GAL/1,000TON-MILE).......................137Table75-Face-to-faceInterviewdistribution.........................................................................................142Table76-Vocation..................................................................................................................................142Table77-TelephoneInterviewsbyCategory..........................................................................................143Table78--ActiveparcofHighwayTractorsin2015(MacKaystudy).....................................................143Table79-NumberofHighwayTractorsinthesample............................................................................146Table80-NumberofSemi-trailersinthesample...................................................................................148
ICCTAug2017
ix|P a g e
Figures
Figure1-DomesticfreighttransportinMexicoandtheUSA.....................................................................5Figure2-DomesticfreighttransportbymodeinMexicoandUSA.............................................................5Figure3-TotalfreighttransportbymodeinMexico..................................................................................6Figure4-DomesticfreighttrafficbymodeinMexicoandtheUSA............................................................7Figure5-PrincipalHighwaysinMexico.....................................................................................................12Figure6-HighwaysystemlengthinMexico..............................................................................................13Figure7-RailinfrastructureinMexico......................................................................................................14Figure8-Mexicanpipelineinfrastructure.................................................................................................16Figure9-FreighttransportedbyRailinMexico........................................................................................17Figure10-PrincipalproductstransportedbyRail.....................................................................................18Figure11-FuelefficiencyofRailfreightserviceinMexico.......................................................................20Figure12-PrincipalAirfreightroutes.......................................................................................................22Figure13--RegisteredParcofHighwayTractors(2016)SCTdata............................................................26Figure14-CompositionoftheParcofhighwayTractorsin2016bymodelyear.....................................27Figure15-PopulationofhighwayTractors(T2&T3)bystatein2016(SCTdata)....................................28Figure16-Comparisonofin-usevehiclenumbersfromtheMacKaystudy(2015)vsSCTregistrationdata....................................................................................................................................................................30Figure17-ParcHighwayTractors(2015)byvocation(MacKaystudy).....................................................33Figure18-ParcHighwayTractors(2015)byfleetsize(MacKaystudy).....................................................34Figure19-Distributionofthe2principalmakesofHighwayTractorbymodelyear................................38Figure20.Agraphtoshowreplacementofengines;istheengineoriginal?...........................................39Figure21-Registeredfleetofsemi-trailersinMexico..............................................................................40Figure22-RatioofSemi-trailersperhighwaytractor...............................................................................40Figure23-RatioTrailers/Tractorsbyvocation..........................................................................................41Figure24-USAratioofdryvanstohighwaytractor.................................................................................43Figure25-Averageageofvehiclesbyvocation........................................................................................45Figure26-Howmanyyearsmoreareyouplanningonusingyourhighwaytractor?...............................46Figure27-Semi-trailers:Howmanyyearsmoreareyouplanningonusingit?........................................47Figure28-Technologicallevelofhighwaytractors...................................................................................48Figure29–Fuelefficienttechnologypenetrationintheowner-operatorandsmallcarriersegment......52Figure30-Nationalsalesofhighwaytractors(Wholesale).......................................................................55Figure31–Totalnationalsalesofhighwaytractorsbymanufacturer1963-2010..................................56Figure32-2010Nationalsalesofhighwaytractorsbymanufacturer......................................................57Figure33-UsedHighwayTractorsonsalebymodelyear........................................................................59Figure34-Howhighwaytractorpurchaseswerefinanced.......................................................................64Figure35-Averagekmsbyageofvehicle.................................................................................................74Figure36-Owner/operator;Averagekmsbyageofvehicle...................................................................74Figure37-Forhire;Averagekmsbyageofvehicle...................................................................................75
ICCTAug2017
x|P a g e
Figure38-Industry&Commerce;Averagekmsbyageofvehicle............................................................76Figure39-Construction&Mining;Averagekmsbyageofvehicle...........................................................77Figure40-Agriculture;Averagekmsbyageofvehicle.............................................................................78Figure41--Government;Averagekmsbyageofvehicle..........................................................................79Figure42-Averagetriplength(kms)byageandvocation........................................................................80Figure43-Averagenumberoftripspermonthbyageandvocation.......................................................81Figure44-Averagefueleconomykm/L)byageandvocation..................................................................82Figure45-FuelEconomyofHighwayTractorsbyvocationin2017vs2011.............................................85Figure46-TotalannualoperatingexpensesperunitforHighwayTractorsinpesos($MN)....................86Figure47-Totalperkmoperatingcost($MN/km)...................................................................................87Figure48-Percentagedistributionofoperatingexpenses.......................................................................88Figure49-Typeoffreightbyvocation......................................................................................................95Figure50-SourceofFreight......................................................................................................................95Figure51-LoadingofVehicle....................................................................................................................96Figure52-Tripscheduling.........................................................................................................................97Figure53-Tripprogramming....................................................................................................................98Figure54-CarbonemissionssavingsresultingfromTransporteLimpio(2008to2014)........................112Figure55-KnowledgeandparticipationintheProgramadeTransporteLimpio...................................113Figure56-Numberoffleetsinthesamplebyfleetsize(DataMac2015)...............................................142Figure57-Numberoffleetsinthesamplebyfleetsize(ICCTsurvey)....................................................144Figure58-NumberofHighwayTractorsinthesample...........................................................................145Figure59-AveragenumberofHighwayTractorsperfleetbymodelyearinthesample.......................146Figure60-Averageageofhighwaytractorsineachfleetagainstthenumberofhighwaytractorsineachfleet(ICCTsample)...................................................................................................................................147Figure61-NumberofSemi-trailersinthesample..................................................................................148
ICCTAug2017
xi|P a g e
Abbreviations
3PL Third-partylogisticscompanyAMDA AsociaciónMexicanadeDistribuidoresdeAutomotoresAMIA AsociaciónMexicanadeLaIndustriaAutomotrizAMMPAC AsociaciónMexicanadeMensajeríayPaqueteríaA.C.ANPACT AsociaciónNacionaldeProductoresdeAutobuses,Camionesy
TractocamionesANTP AsociaciónNacionaldelTransportePrivadoCANACAR CameraNacionaldelAutotransportedeCargaCANACINTRA CámaraNacionaldelaIndustriadeTransformaciónCCAC ClimateandCleanAirCoalitionCESPEDES ConsejoEmpresarialparaelDesarrolloSostenibleCO CarbonmonoxideCO2 CarbondioxideCONATRAM ConfederaciónNacionaldeTransportistasMexicanosCONCAMIN ConfederacióndeCámarasIndustrialesDGAF DirecciónGeneraldeAutotransporteFederalDGGCARETC DirecciónGeneraldeGestióndelaCalidaddelAireyRegistrodeEmisionesy
TransferenciadeContaminantesEMBARQ EMBARQisnowtheWRIRossCenterforSustainableCitiesEPA UnitedStatesEnvironmentalProtectionAgencyGIZ DeutscheGesellschaftfürInternationaleZusammenarbeitGmbHHC hydrocarbonsICCT InternationalCouncilonCleanTransportationINECC InstitutoNacionaldeEcologiayCambioClimaticoITDP InstituteforTransportationandDevelopmentPolicyMN MonedaNacional(Mexicanpesos)NAFTA NorthAmericanFreeTradeAgreementNAMA NationallyAppropriateMitigationActionsNGO Non-governmentalorganizationNOM NormaOficialMexicanaNOx nitrogenoxidesOEM OriginalEquipmentManufacturerPM particulatematterSCT SecretaríadeComunicacionesyTransportesSEMARNAT SecretaríadeMedioAmbienteyRecursosNaturalesSHCP-SAT ServiciodeAdministraciónTributariadelaSecretaríadeHaciendayCréditoPúblicoSMAEM SecretaríadeMedioAmbientedelEstadodeMexicoSmartway USEPA'sSmartWayTransportPartnershipTELMEX TelefonosdeMexicoTPP TranspacificAssociationAgreementTransporteLimpio VoluntaryCleanTransportprogramdevelopedbySEMARNATandSCT.TSTES TheSustainableTransportandEmissionsServicesCompanyUNFCC UnitedNationsFrameworkConventiononClimateChange
ICCTAug2017
xii|P a g e
Acknowledgements
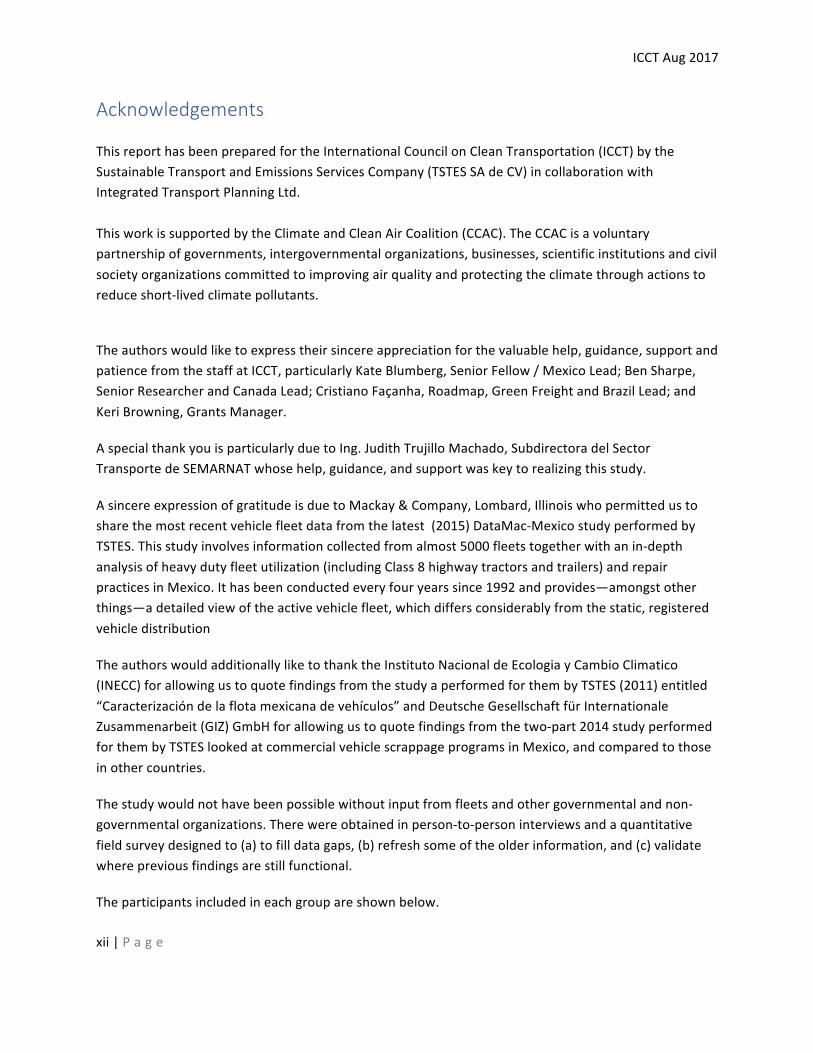
ThisreporthasbeenpreparedfortheInternationalCouncilonCleanTransportation(ICCT)bytheSustainableTransportandEmissionsServicesCompany(TSTESSAdeCV)incollaborationwithIntegratedTransportPlanningLtd.ThisworkissupportedbytheClimateandCleanAirCoalition(CCAC).TheCCACisavoluntarypartnershipofgovernments,intergovernmentalorganizations,businesses,scientificinstitutionsandcivilsocietyorganizationscommittedtoimprovingairqualityandprotectingtheclimatethroughactionstoreduceshort-livedclimatepollutants.
Theauthorswouldliketoexpresstheirsincereappreciationforthevaluablehelp,guidance,supportandpatiencefromthestaffatICCT,particularlyKateBlumberg,SeniorFellow/MexicoLead;BenSharpe,SeniorResearcherandCanadaLead;CristianoFaçanha,Roadmap,GreenFreightandBrazilLead;andKeriBrowning,GrantsManager.
AspecialthankyouisparticularlyduetoIng.JudithTrujilloMachado,SubdirectoradelSectorTransportedeSEMARNATwhosehelp,guidance,andsupportwaskeytorealizingthisstudy.
AsincereexpressionofgratitudeisduetoMackay&Company,Lombard,Illinoiswhopermittedustosharethemostrecentvehiclefleetdatafromthelatest(2015)DataMac-MexicostudyperformedbyTSTES.Thisstudyinvolvesinformationcollectedfromalmost5000fleetstogetherwithanin-depthanalysisofheavydutyfleetutilization(includingClass8highwaytractorsandtrailers)andrepairpracticesinMexico.Ithasbeenconductedeveryfouryearssince1992andprovides—amongstotherthings—adetailedviewoftheactivevehiclefleet,whichdiffersconsiderablyfromthestatic,registeredvehicledistribution
TheauthorswouldadditionallyliketothanktheInstitutoNacionaldeEcologiayCambioClimatico(INECC)forallowingustoquotefindingsfromthestudyaperformedforthembyTSTES(2011)entitled“Caracterizacióndelaflotamexicanadevehículos”andDeutscheGesellschaftfürInternationaleZusammenarbeit(GIZ)GmbHforallowingustoquotefindingsfromthetwo-part2014studyperformedforthembyTSTESlookedatcommercialvehiclescrappageprogramsinMexico,andcomparedtothoseinothercountries.
Thestudywouldnothavebeenpossiblewithoutinputfromfleetsandothergovernmentalandnon-governmentalorganizations.Therewereobtainedinperson-to-personinterviewsandaquantitativefieldsurveydesignedto(a)tofilldatagaps,(b)refreshsomeoftheolderinformation,and(c)validatewherepreviousfindingsarestillfunctional.
Theparticipantsincludedineachgroupareshownbelow.
ICCTAug2017
xiii|P a g e
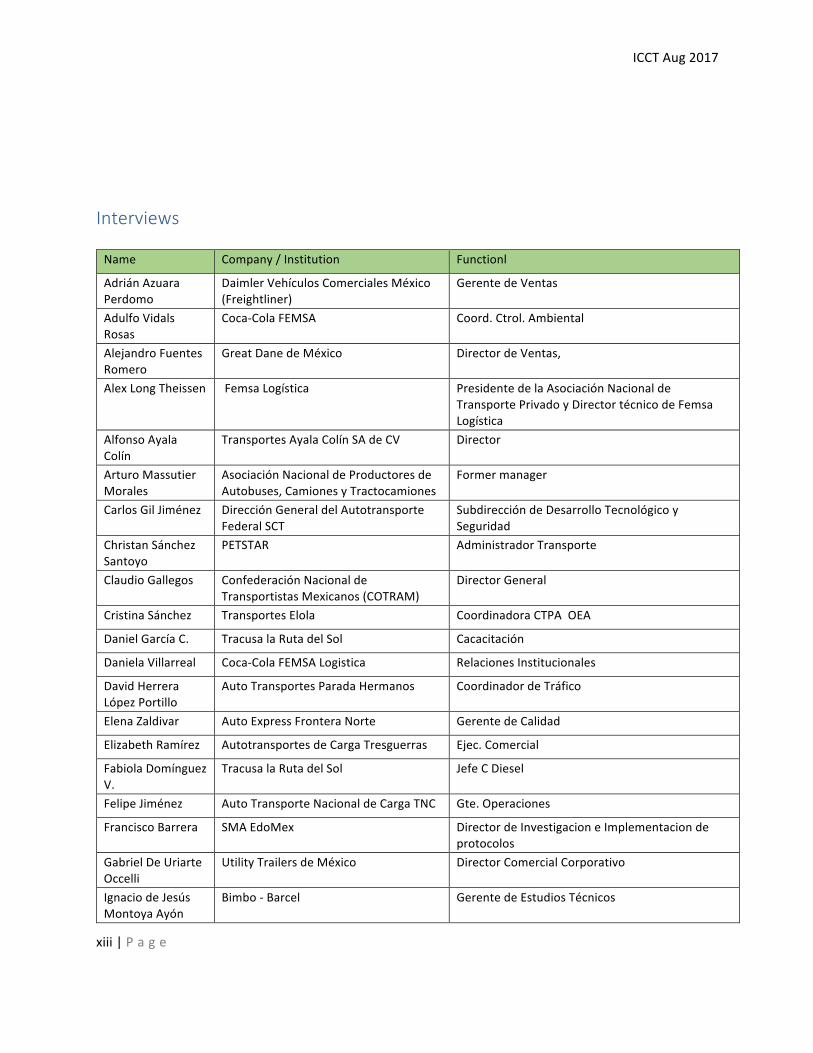
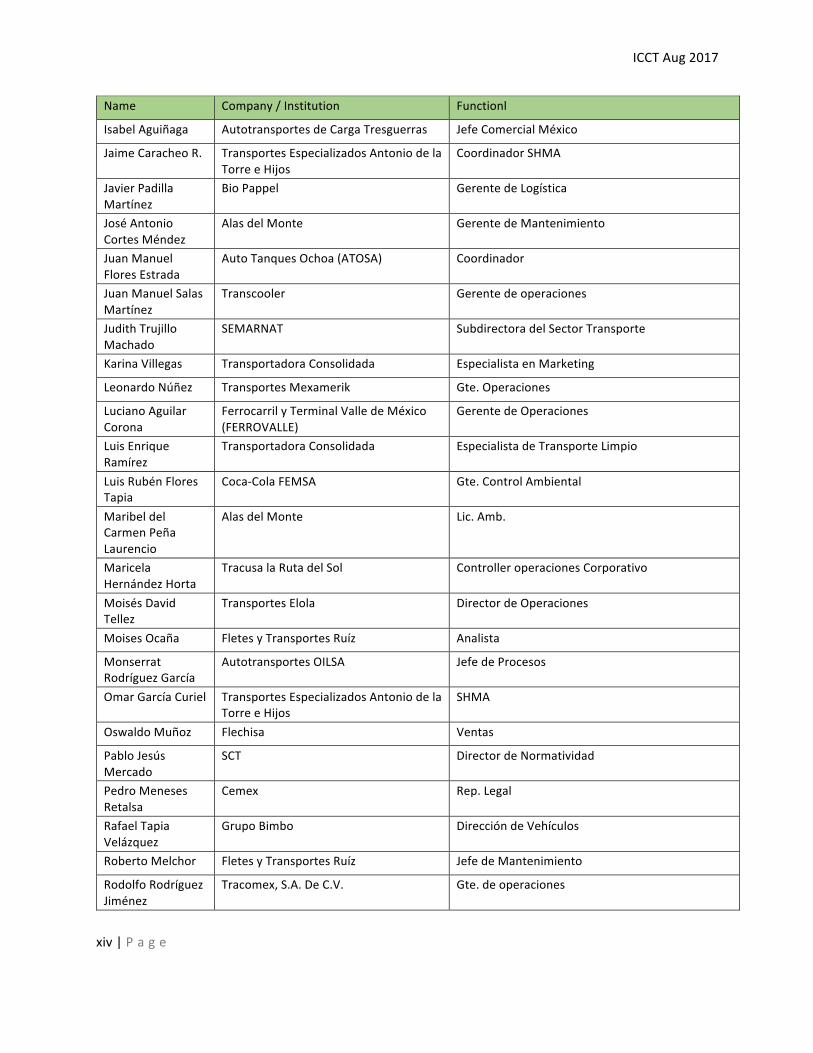
Interviews
Name Company/Institution Functionl
AdriánAzuaraPerdomo
DaimlerVehículosComercialesMéxico(Freightliner)
GerentedeVentas
AdulfoVidalsRosas
Coca-ColaFEMSA Coord.Ctrol.Ambiental
AlejandroFuentesRomero
GreatDanedeMéxico DirectordeVentas,
AlexLongTheissen FemsaLogística PresidentedelaAsociaciónNacionaldeTransportePrivadoyDirectortécnicodeFemsaLogística
AlfonsoAyalaColín
TransportesAyalaColínSAdeCV Director
ArturoMassutierMorales
AsociaciónNacionaldeProductoresdeAutobuses,CamionesyTractocamiones
Formermanager
CarlosGilJiménez DirecciónGeneraldelAutotransporteFederalSCT
SubdireccióndeDesarrolloTecnológicoySeguridad
ChristanSánchezSantoyo
PETSTAR AdministradorTransporte
ClaudioGallegos ConfederaciónNacionaldeTransportistasMexicanos(COTRAM)
DirectorGeneral
CristinaSánchez TransportesElola CoordinadoraCTPAOEA
DanielGarcíaC. TracusalaRutadelSol Cacacitación
DanielaVillarreal Coca-ColaFEMSALogistica RelacionesInstitucionales
DavidHerreraLópezPortillo
AutoTransportesParadaHermanos CoordinadordeTráfico
ElenaZaldivar AutoExpressFronteraNorte GerentedeCalidad
ElizabethRamírez AutotransportesdeCargaTresguerras Ejec.Comercial
FabiolaDomínguezV.
TracusalaRutadelSol JefeCDiesel
FelipeJiménez AutoTransporteNacionaldeCargaTNC Gte.Operaciones
FranciscoBarrera SMAEdoMex DirectordeInvestigacioneImplementaciondeprotocolos
GabrielDeUriarteOccelli
UtilityTrailersdeMéxico DirectorComercialCorporativo
IgnaciodeJesúsMontoyaAyón
Bimbo-Barcel GerentedeEstudiosTécnicos
ICCTAug2017
xiv|P a g e
Name Company/Institution Functionl
IsabelAguiñaga AutotransportesdeCargaTresguerras JefeComercialMéxico
JaimeCaracheoR. TransportesEspecializadosAntoniodelaTorreeHijos
CoordinadorSHMA
JavierPadillaMartínez
BioPappel GerentedeLogística
JoséAntonioCortesMéndez
AlasdelMonte GerentedeMantenimiento
JuanManuelFloresEstrada
AutoTanquesOchoa(ATOSA) Coordinador
JuanManuelSalasMartínez
Transcooler Gerentedeoperaciones
JudithTrujilloMachado
SEMARNAT SubdirectoradelSectorTransporte
KarinaVillegas TransportadoraConsolidada EspecialistaenMarketing
LeonardoNúñez TransportesMexamerik Gte.Operaciones
LucianoAguilarCorona
FerrocarrilyTerminalValledeMéxico(FERROVALLE)
GerentedeOperaciones
LuisEnriqueRamírez
TransportadoraConsolidada EspecialistadeTransporteLimpio
LuisRubénFloresTapia
Coca-ColaFEMSA Gte.ControlAmbiental
MaribeldelCarmenPeñaLaurencio
AlasdelMonte Lic.Amb.
MaricelaHernándezHorta
TracusalaRutadelSol ControlleroperacionesCorporativo
MoisésDavidTellez
TransportesElola DirectordeOperaciones
MoisesOcaña FletesyTransportesRuíz Analista
MonserratRodríguezGarcía
AutotransportesOILSA JefedeProcesos
OmarGarcíaCuriel TransportesEspecializadosAntoniodelaTorreeHijos
SHMA
OswaldoMuñoz Flechisa Ventas
PabloJesúsMercado
SCT DirectordeNormatividad
PedroMenesesRetalsa
Cemex Rep.Legal
RafaelTapiaVelázquez
GrupoBimbo DireccióndeVehículos
RobertoMelchor FletesyTransportesRuíz JefedeMantenimiento
RodolfoRodríguezJiménez
Tracomex,S.A.DeC.V. Gte.deoperaciones
ICCTAug2017
xv|P a g e
Name Company/Institution Functionl
RodrigoPerrusquíaMáximo
SEMARNAT JefedeDepartamentodeGestiónAmbientaldelSectorTransporte
SergioZirath INECC Directordeinvestigaciónsobrelacalidaddelaireyloscontaminantesclimáticosdevidacorta
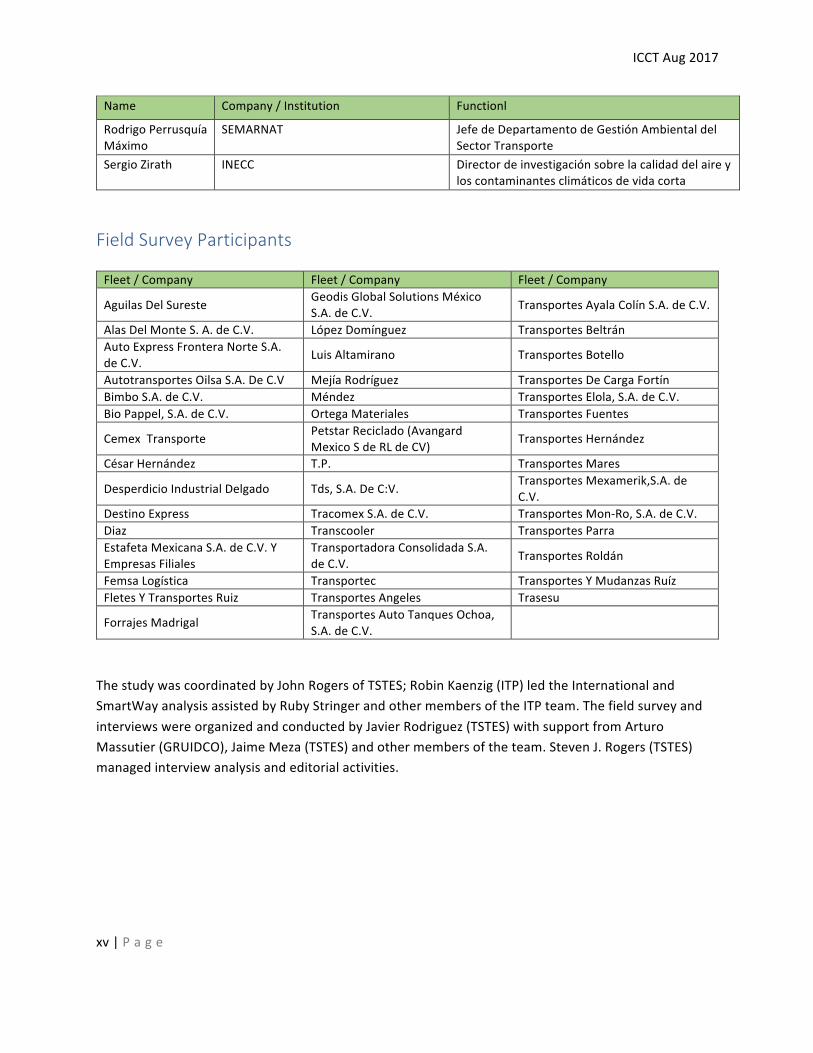
FieldSurveyParticipants
Fleet/Company Fleet/Company Fleet/Company
AguilasDelSureste GeodisGlobalSolutionsMéxicoS.A.deC.V. TransportesAyalaColínS.A.deC.V.
AlasDelMonteS.A.deC.V. LópezDomínguez TransportesBeltránAutoExpressFronteraNorteS.A.deC.V. LuisAltamirano TransportesBotello
AutotransportesOilsaS.A.DeC.V MejíaRodríguez TransportesDeCargaFortínBimboS.A.deC.V. Méndez TransportesElola,S.A.deC.V.BioPappel,S.A.deC.V. OrtegaMateriales TransportesFuentes
CemexTransporte PetstarReciclado(AvangardMexicoSdeRLdeCV) TransportesHernández
CésarHernández T.P. TransportesMares
DesperdicioIndustrialDelgado Tds,S.A.DeC:V. TransportesMexamerik,S.A.deC.V.
DestinoExpress TracomexS.A.deC.V. TransportesMon-Ro,S.A.deC.V.Diaz Transcooler TransportesParraEstafetaMexicanaS.A.deC.V.YEmpresasFiliales
TransportadoraConsolidadaS.A.deC.V. TransportesRoldán
FemsaLogística Transportec TransportesYMudanzasRuízFletesYTransportesRuiz TransportesAngeles Trasesu
ForrajesMadrigal TransportesAutoTanquesOchoa,S.A.deC.V.
ThestudywascoordinatedbyJohnRogersofTSTES;RobinKaenzig(ITP)ledtheInternationalandSmartWayanalysisassistedbyRubyStringerandothermembersoftheITPteam.ThefieldsurveyandinterviewswereorganizedandconductedbyJavierRodriguez(TSTES)withsupportfromArturoMassutier(GRUIDCO),JaimeMeza(TSTES)andothermembersoftheteam.StevenJ.Rogers(TSTES)managedinterviewanalysisandeditorialactivities.
ICCTAug2017
1|P a g e
Chapter1:-ExecutiveSummary
ThisMexicoFreightAssessmentwasconductedin2017fortheInternationalCouncilonCleanTransportation(ICCT)bytheSustainableTransportandEmissionsServicesCompany,TSTESSAdeCV,MexicoinconjunctionwithIntegratedTransportPlanningLtd,England.
ICCTsponsoredthisprojecttoassessthefreightsysteminMexico,withafocusonon-roadgoodsmovement,asakeycontributortotheClimateandCleanAirCoalition’s(CCAC)GlobalGreenFreightActionPlanfocusedondevelopingandharmonizinggreenfreighteffortsonaglobalscaleinordertogetmaximumreductionsofblackcarbonandimprovedefficiencyfromfreighttransport.
Theprimarymotivationforthisprojectwastodevelopamuchdeeperunderstandingoftheon-roadfreightsysteminMexico.Thisfreightassessmentbuildsuptheknowledgebaseinseveralareas,includingmarketdynamics,opportunitiesandbarriersfortruckfuel-savingtechnologiesandoperationalmeasures,andthepotentialbenefitsofbuildingamorerobustandextensiveTransporteLimpioprogram,andharmonizingitwithSmartWay.
Thescopeoftheprojectwasexclusivelyfocusedonfreighttransportationbytractor-trailers,andinclusiveofthevariousactorsthatimpactthefreightsystem.ThisresearchlookstopresentacompendiumofknowledgetogovernmentagenciesandotherstakeholdersinMexicowhoaredevelopingstrategiesforreducingtheenvironmentalimpactsofthetruckingsectorandgivethesedecision-makersbettertoolstoevaluatehowagreenfreightprogramfitsintotheoverallportfolioofpoliciesaimedatthefreightsector.
ThestudycompilespubliclyavailabledatawithfindingsfrompreviousstudiesconductedbyTSTES(andincludedwithoriginalclientagreement)andinputfromfleetsandothergovernmentalandnon-governmentalorganizations.Informationwasgatheredfromperson-to-personinterviewsandalimitedquantitativefieldsurveywith89stakeholdersfromdifferentlevelsoftheon-roadfreightsysteminMexicoto(a)filldatagaps,(b)updateolderinformation,and(c)validatepreviousfindingswhereadequate.Althoughresourceconstraintspreventedastatisticallysignificantanalysisofanswers,thestudyprovidesthemostrecentdataavailableontheMexicanon-roadfreightsector.
Thisdataiscollatedinto8thematicgroups,(inChapters2through9)andahighlightofeachispresentedatthebeginningofthecorrespondingchapters:
ICCTAug2017
2|P a g e
Chapter2:-FreightcontextinMexicoandtheUSA..................................................3onfreighttransportinMexicoinallmodes(road,rail,waterborneandair)tosetthecontextforthesub-sectorthatisthethemeofthisstudy,on-roadfreighttransportedbyhighwaytractor-trailers.
Chapter3:-CharacteristicsofIn-useTractor-trailersinMexico............................24ontheregistered,andactivein-usepopulationofhighwaytractorsandsemi-trailersinMexico.Itpresentsdatabysizeoffleetandbyvocation,andlooksattheexpectedlifeoftheseunits.
Chapter4:-VehiclePurchasing..............................................................................53onhowfleetsbuyhighwaytractorsandsemi-trailers.Itlooksatthesourcesofinformation,advertising,andpublicitythatisusedtopromotesecond-handvehiclesales,howpurchasesarefinanced,andthemotivesforselectingaspecificbrand
Chapter5:-Tractor-trailerUsageandOperatingCosts..........................................68ontheroleofthedifferentplayersinthissub-sector.Itlooksatvehicleusage,triplengthandfrequency.Itevaluatesfueleconomyandotheroperatingcosts,withdetailsbyageofvehicleandbyvocation.Italsolooksatwhoiscollectinginformationontrav¡ctor.traileropderationinMexico
Chapter6:-Tariffs,FreighttypeandLogistics........................................................92ontheinteractionbetweentransport(For-Hire)fleetsandtheirclients,lookingattariffnegotiations,fareincreasesandtripprogramming
Chapter7:-InstitutionalandRegulatoryFramework...........................................100ontheinstitutionalandregulatoryframeworkthatsurroundson-roadfreighttransportinMexico
Chapter8:-ProgramadeTransporteLimpioandrelatedprograms....................108onstandardsandprogramsinMexicothatpromotecleantransport—suchastheProgramadeTransporteLimpio—andlooktomodernizethevehiclefleet.
Chapter9:-Fuelefficiencyandemissionsstandards...........................................127onfuelefficiencyandemissionsstandardsintheUSAandMexico
AnANNEXprovidesinformationontheApproachandMethodologyandhowtheactivepopulationofHighwayTractorswasdetermined.
ICCTAug2017
3|P a g e
Chapter2:-FreightcontextinMexicoandtheUSA
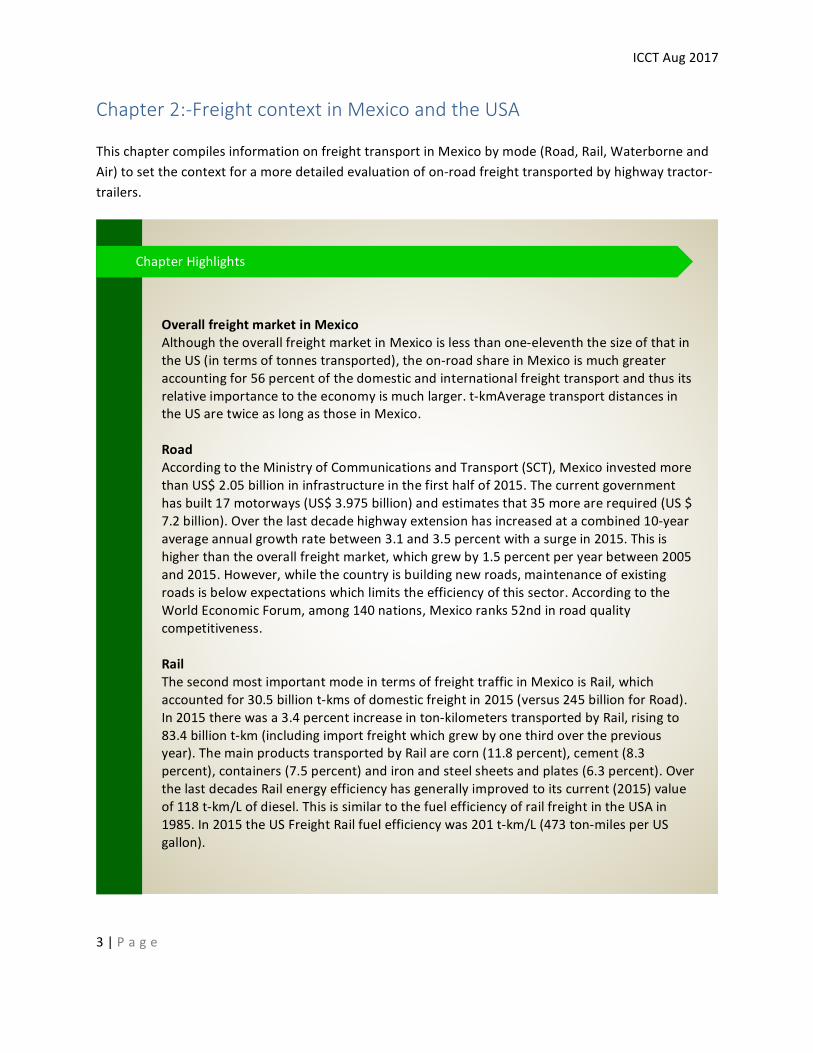
ThischaptercompilesinformationonfreighttransportinMexicobymode(Road,Rail,WaterborneandAir)tosetthecontextforamoredetailedevaluationofon-roadfreighttransportedbyhighwaytractor-trailers.
OverallfreightmarketinMexicoAlthoughtheoverallfreightmarketinMexicoislessthanone-elevenththesizeofthatintheUS(intermsoftonnestransported),theon-roadshareinMexicoismuchgreateraccountingfor56percentofthedomesticandinternationalfreighttransportandthusitsrelativeimportancetotheeconomyismuchlarger.t-kmAveragetransportdistancesintheUSaretwiceaslongasthoseinMexico.RoadAccordingtotheMinistryofCommunicationsandTransport(SCT),MexicoinvestedmorethanUS$2.05billionininfrastructureinthefirsthalfof2015.Thecurrentgovernmenthasbuilt17motorways(US$3.975billion)andestimatesthat35morearerequired(US$7.2billion).Overthelastdecadehighwayextensionhasincreasedatacombined10-yearaverageannualgrowthratebetween3.1and3.5percentwithasurgein2015.Thisishigherthantheoverallfreightmarket,whichgrewby1.5percentperyearbetween2005and2015.However,whilethecountryisbuildingnewroads,maintenanceofexistingroadsisbelowexpectationswhichlimitstheefficiencyofthissector.AccordingtotheWorldEconomicForum,among140nations,Mexicoranks52ndinroadqualitycompetitiveness.RailThesecondmostimportantmodeintermsoffreighttrafficinMexicoisRail,whichaccountedfor30.5billiont-kmsofdomesticfreightin2015(versus245billionforRoad).In2015therewasa3.4percentincreaseinton-kilometerstransportedbyRail,risingto83.4billiont-km(includingimportfreightwhichgrewbyonethirdoverthepreviousyear).ThemainproductstransportedbyRailarecorn(11.8percent),cement(8.3percent),containers(7.5percent)andironandsteelsheetsandplates(6.3percent).OverthelastdecadesRailenergyefficiencyhasgenerallyimprovedtoitscurrent(2015)valueof118t-km/Lofdiesel.ThisissimilartothefuelefficiencyofrailfreightintheUSAin1985.In2015theUSFreightRailfuelefficiencywas201t-km/L(473ton-milesperUSgallon).
ChapterHighlights
ICCTAug2017
4|P a g e
FreightbymodeinMexicoandtheUSA
DomesticFreightinMexicoandtheUSA
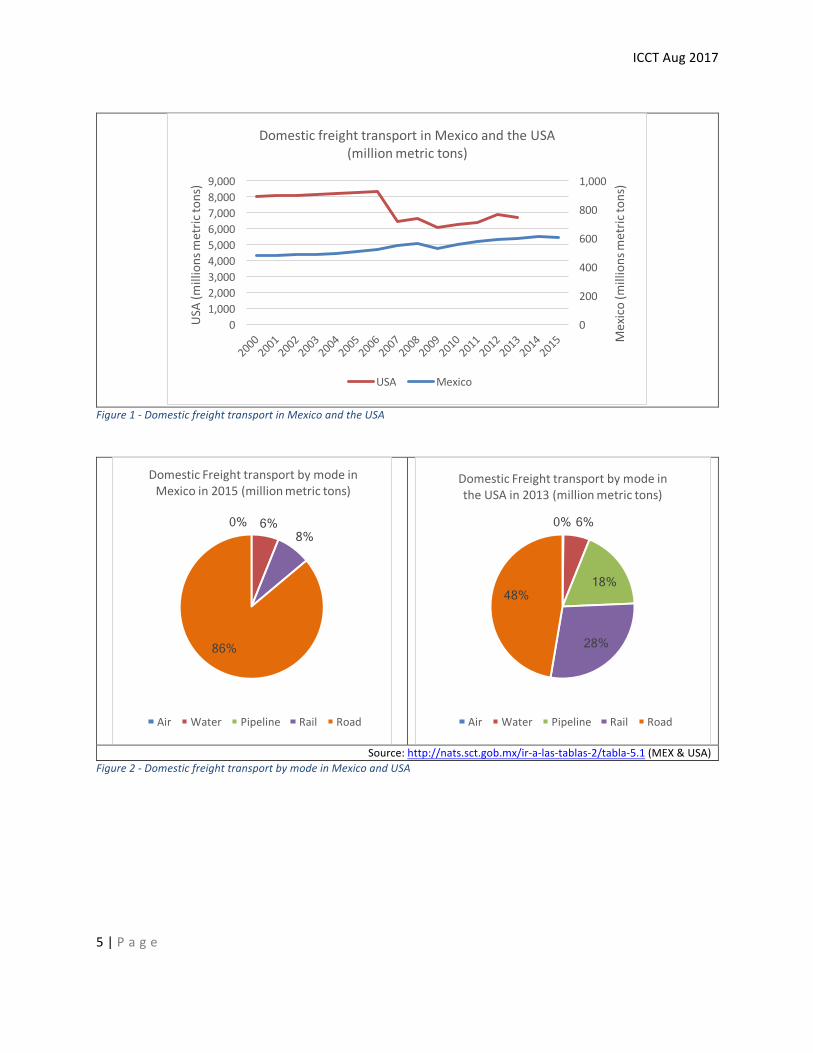
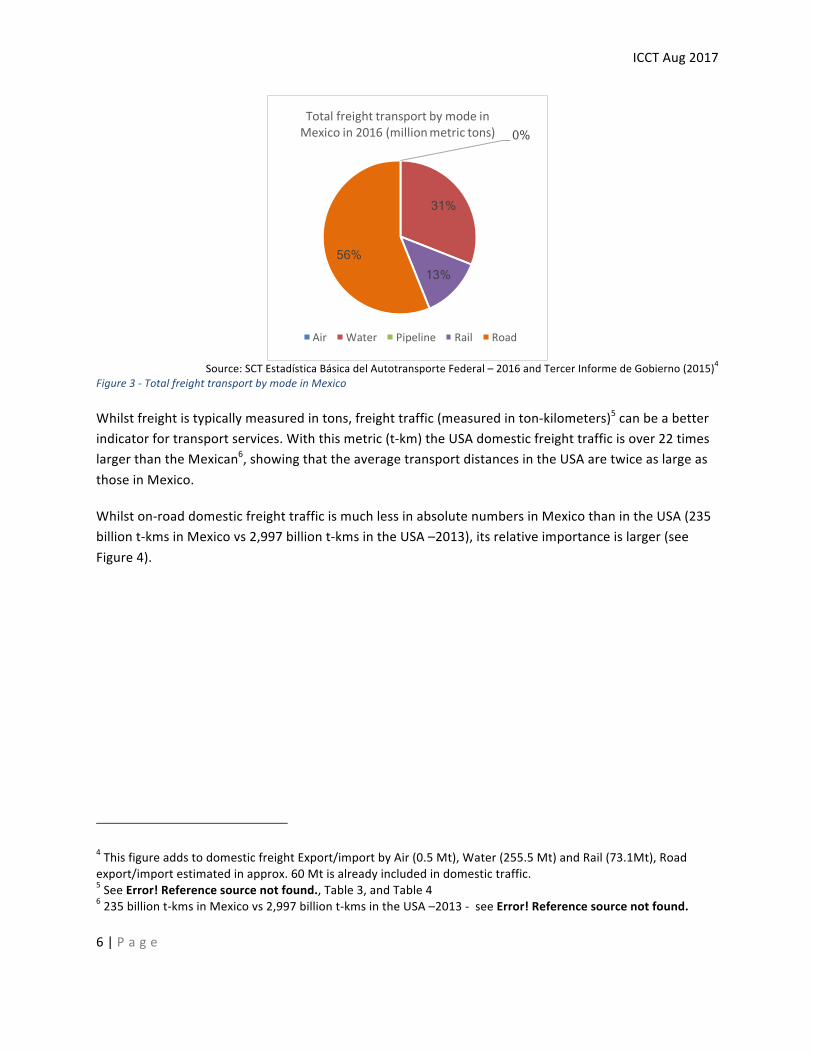
AlthoughtheoverallfreightmarketinMexicoislessthanone-elevenththesizeofthatintheUSA(intermsoftonstransported:seeFigure1)1,theon-roadshareismuchgreateraccountingfor56percentofthedomesticandinternationalfreighttransportandthusitsrelativeimportancetotheeconomyismuchlarger.In2015,86percentofdomesticfreightwascarriedbyRoad(comparedto48percentintheUSA);only8percentbyRailand6percentbySea2(seeFigure2).AccountingforInternationalfreight3,theproportionofMexicanfreightbySeaandRailincreasesto31percentand13percent,respectively,leavingRoadwithamodeshareof56percent(Figure3).
1In2013theUSdomesticmarketwas6,710vs600millionmetrictonsinMexico2ThefreightnumbersinMexicodonothavecomparablefiguresforpipelinetransport,whichisexcluded.3Internationalfreightisthatwhichhasthegoodoriginordestinationinadifferentcountry.Nationalfreighthasgoodsoriginanddestinationwithinthesamecountry.Onethirdofallfreighttransported(intons)inMexicoisinternational(import/export).
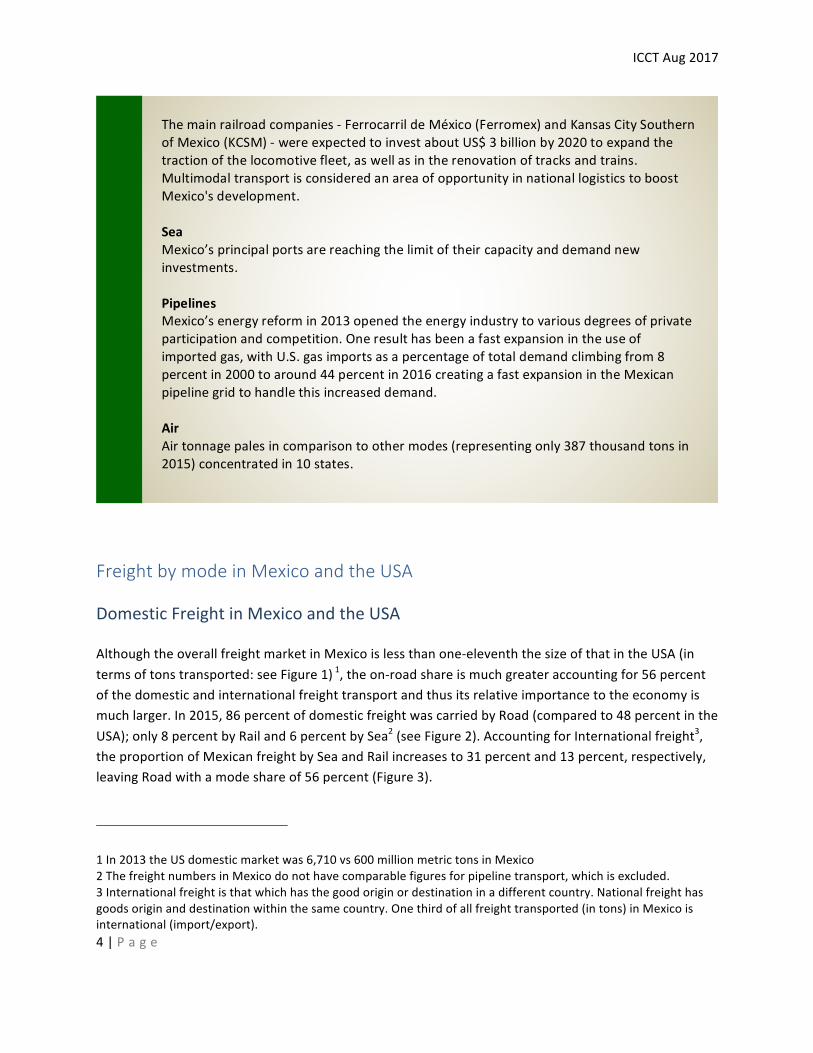
Themainrailroadcompanies-FerrocarrildeMéxico(Ferromex)andKansasCitySouthernofMexico(KCSM)-wereexpectedtoinvestaboutUS$3billionby2020toexpandthetractionofthelocomotivefleet,aswellasintherenovationoftracksandtrains.MultimodaltransportisconsideredanareaofopportunityinnationallogisticstoboostMexico'sdevelopment.SeaMexico’sprincipalportsarereachingthelimitoftheircapacityanddemandnewinvestments.PipelinesMexico’senergyreformin2013openedtheenergyindustrytovariousdegreesofprivateparticipationandcompetition.Oneresulthasbeenafastexpansionintheuseofimportedgas,withU.S.gasimportsasapercentageoftotaldemandclimbingfrom8percentin2000toaround44percentin2016creatingafastexpansionintheMexicanpipelinegridtohandlethisincreaseddemand.AirAirtonnagepalesincomparisontoothermodes(representingonly387thousandtonsin2015)concentratedin10states.
ICCTAug2017
5|P a g e
Figure1-DomesticfreighttransportinMexicoandtheUSA
Source:http://nats.sct.gob.mx/ir-a-las-tablas-2/tabla-5.1(MEX&USA)
Figure2-DomesticfreighttransportbymodeinMexicoandUSA
0
200
400
600
800
1,000
01,0002,0003,0004,0005,0006,0007,0008,0009,000
Mexico(m
illionsmetric
tons)
USA(m
illionsmetric
tons)
DomesticfreighttransportinMexicoandtheUSA(millionmetrictons)
USA Mexico
0% 6% 8%
86%
DomesticFreighttransportbymodeinMexicoin2015(millionmetrictons)
Air Water Pipeline Rail Road
0% 6%
18%
28%
48%
DomesticFreighttransportbymodeintheUSAin2013(millionmetrictons)
Air Water Pipeline Rail Road
ICCTAug2017
6|P a g e
Source:SCTEstadísticaBásicadelAutotransporteFederal–2016andTercerInformedeGobierno(2015)4
Figure3-TotalfreighttransportbymodeinMexico
Whilstfreightistypicallymeasuredintons,freighttraffic(measuredinton-kilometers)5canbeabetterindicatorfortransportservices.Withthismetric(t-km)theUSAdomesticfreighttrafficisover22timeslargerthantheMexican6,showingthattheaveragetransportdistancesintheUSAaretwiceaslargeasthoseinMexico.
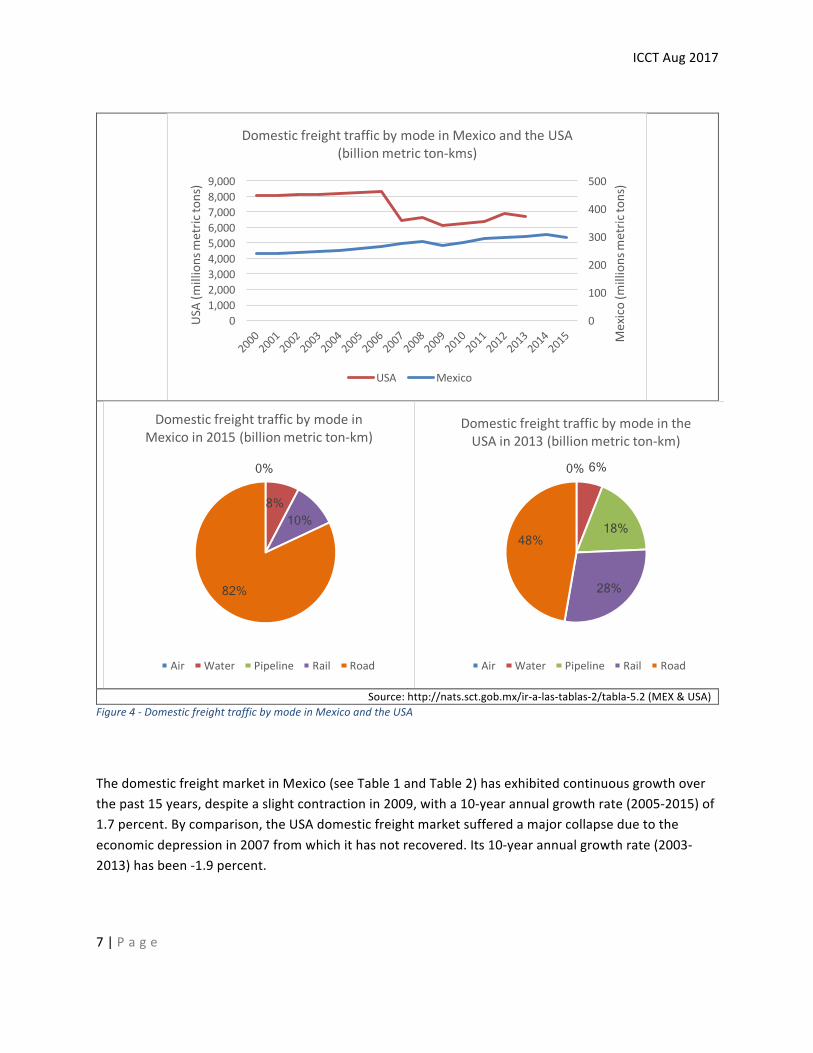
Whilston-roaddomesticfreighttrafficismuchlessinabsolutenumbersinMexicothanintheUSA(235billiont-kmsinMexicovs2,997billiont-kmsintheUSA–2013),itsrelativeimportanceislarger(seeFigure4).
4ThisfigureaddstodomesticfreightExport/importbyAir(0.5Mt),Water(255.5Mt)andRail(73.1Mt),Roadexport/importestimatedinapprox.60Mtisalreadyincludedindomestictraffic.5SeeError!Referencesourcenotfound.,Table3,andTable46235billiont-kmsinMexicovs2,997billiont-kmsintheUSA–2013-seeError!Referencesourcenotfound.
0%
31%
13% 56%
TotalfreighttransportbymodeinMexicoin2016(millionmetrictons)
Air Water Pipeline Rail Road
ICCTAug2017
7|P a g e
Source:http://nats.sct.gob.mx/ir-a-las-tablas-2/tabla-5.2(MEX&USA)
Figure4-DomesticfreighttrafficbymodeinMexicoandtheUSA
ThedomesticfreightmarketinMexico(seeTable1andTable2)hasexhibitedcontinuousgrowthoverthepast15years,despiteaslightcontractionin2009,witha10-yearannualgrowthrate(2005-2015)of1.7percent.Bycomparison,theUSAdomesticfreightmarketsufferedamajorcollapseduetotheeconomicdepressionin2007fromwhichithasnotrecovered.Its10-yearannualgrowthrate(2003-2013)hasbeen-1.9percent.
0
100
200
300
400
500
01,0002,0003,0004,0005,0006,0007,0008,0009,000
Mexico(m
illionsmetric
tons)
USA(m
illionsmetric
tons)
DomesticfreighttrafficbymodeinMexicoandtheUSA(billionmetricton-kms)
USA Mexico
0%
8% 10%
82%
DomesticfreighttrafficbymodeinMexicoin2015(billionmetricton-km)
Air Water Pipeline Rail Road
0% 6%
18%
28%
48%
DomesticfreighttrafficbymodeintheUSAin2013(billionmetricton-km)
Air Water Pipeline Rail Road
ICCTAug2017
8|P a g e
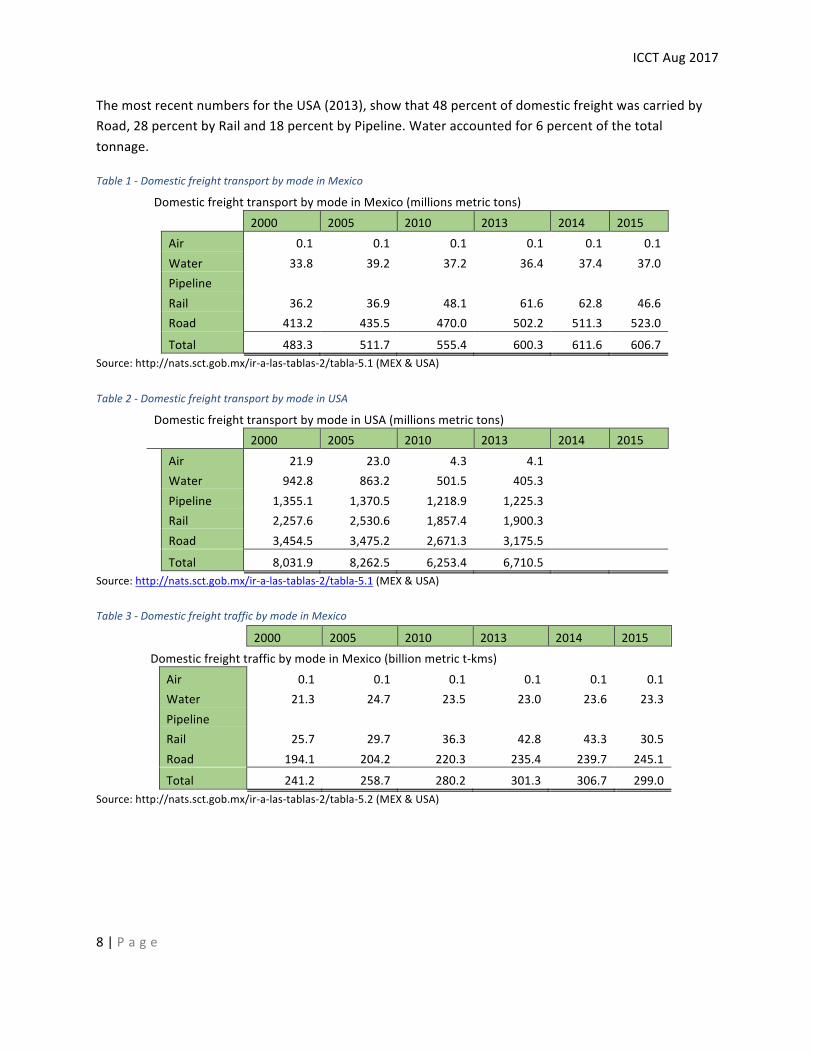
ThemostrecentnumbersfortheUSA(2013),showthat48percentofdomesticfreightwascarriedbyRoad,28percentbyRailand18percentbyPipeline.Wateraccountedfor6percentofthetotaltonnage.
Table1-DomesticfreighttransportbymodeinMexico
DomesticfreighttransportbymodeinMexico(millionsmetrictons) 2000 2005 2010 2013 2014 2015 Air 0.1 0.1 0.1 0.1 0.1 0.1 Water 33.8 39.2 37.2 36.4 37.4 37.0 Pipeline Rail 36.2 36.9 48.1 61.6 62.8 46.6 Road 413.2 435.5 470.0 502.2 511.3 523.0
Total 483.3 511.7 555.4 600.3 611.6 606.7Source:http://nats.sct.gob.mx/ir-a-las-tablas-2/tabla-5.1(MEX&USA)Table2-DomesticfreighttransportbymodeinUSA
DomesticfreighttransportbymodeinUSA(millionsmetrictons) 2000 2005 2010 2013 2014 2015 Air 21.9 23.0 4.3 4.1 Water 942.8 863.2 501.5 405.3 Pipeline 1,355.1 1,370.5 1,218.9 1,225.3 Rail 2,257.6 2,530.6 1,857.4 1,900.3 Road 3,454.5 3,475.2 2,671.3 3,175.5
Total 8,031.9 8,262.5 6,253.4 6,710.5 Source:http://nats.sct.gob.mx/ir-a-las-tablas-2/tabla-5.1(MEX&USA)Table3-DomesticfreighttrafficbymodeinMexico
2000 2005 2010 2013 2014 2015DomesticfreighttrafficbymodeinMexico(billionmetrict-kms) Air 0.1 0.1 0.1 0.1 0.1 0.1 Water 21.3 24.7 23.5 23.0 23.6 23.3 Pipeline Rail 25.7 29.7 36.3 42.8 43.3 30.5 Road 194.1 204.2 220.3 235.4 239.7 245.1
Total 241.2 258.7 280.2 301.3 306.7 299.0Source:http://nats.sct.gob.mx/ir-a-las-tablas-2/tabla-5.2(MEX&USA)
ICCTAug2017
9|P a g e
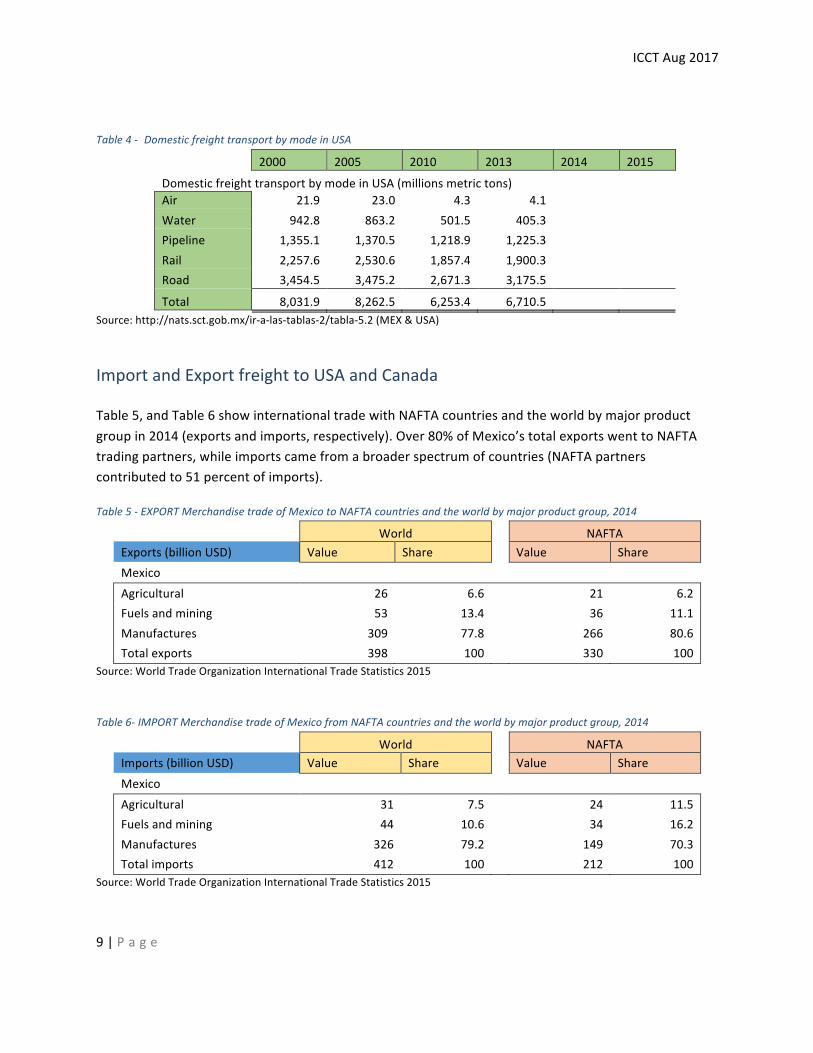
Table4-DomesticfreighttransportbymodeinUSA
2000 2005 2010 2013 2014 2015
DomesticfreighttransportbymodeinUSA(millionsmetrictons) Air 21.9 23.0 4.3 4.1 Water 942.8 863.2 501.5 405.3 Pipeline 1,355.1 1,370.5 1,218.9 1,225.3 Rail 2,257.6 2,530.6 1,857.4 1,900.3 Road 3,454.5 3,475.2 2,671.3 3,175.5
Total 8,031.9 8,262.5 6,253.4 6,710.5 Source:http://nats.sct.gob.mx/ir-a-las-tablas-2/tabla-5.2(MEX&USA)
ImportandExportfreighttoUSAandCanada
Table5,andTable6showinternationaltradewithNAFTAcountriesandtheworldbymajorproductgroupin2014(exportsandimports,respectively).Over80%ofMexico’stotalexportswenttoNAFTAtradingpartners,whileimportscamefromabroaderspectrumofcountries(NAFTApartnerscontributedto51percentofimports).
Table5-EXPORTMerchandisetradeofMexicotoNAFTAcountriesandtheworldbymajorproductgroup,2014
World NAFTAExports(billionUSD) Value Share Value ShareMexico Agricultural 26 6.6 21 6.2Fuelsandmining 53 13.4 36 11.1Manufactures 309 77.8 266 80.6Totalexports 398 100 330 100
Source:WorldTradeOrganizationInternationalTradeStatistics2015
Table6-IMPORTMerchandisetradeofMexicofromNAFTAcountriesandtheworldbymajorproductgroup,2014
World NAFTAImports(billionUSD) Value Share Value ShareMexico Agricultural 31 7.5 24 11.5Fuelsandmining 44 10.6 34 16.2Manufactures 326 79.2 149 70.3Totalimports 412 100 212 100
Source:WorldTradeOrganizationInternationalTradeStatistics2015
ICCTAug2017
10|P a g e
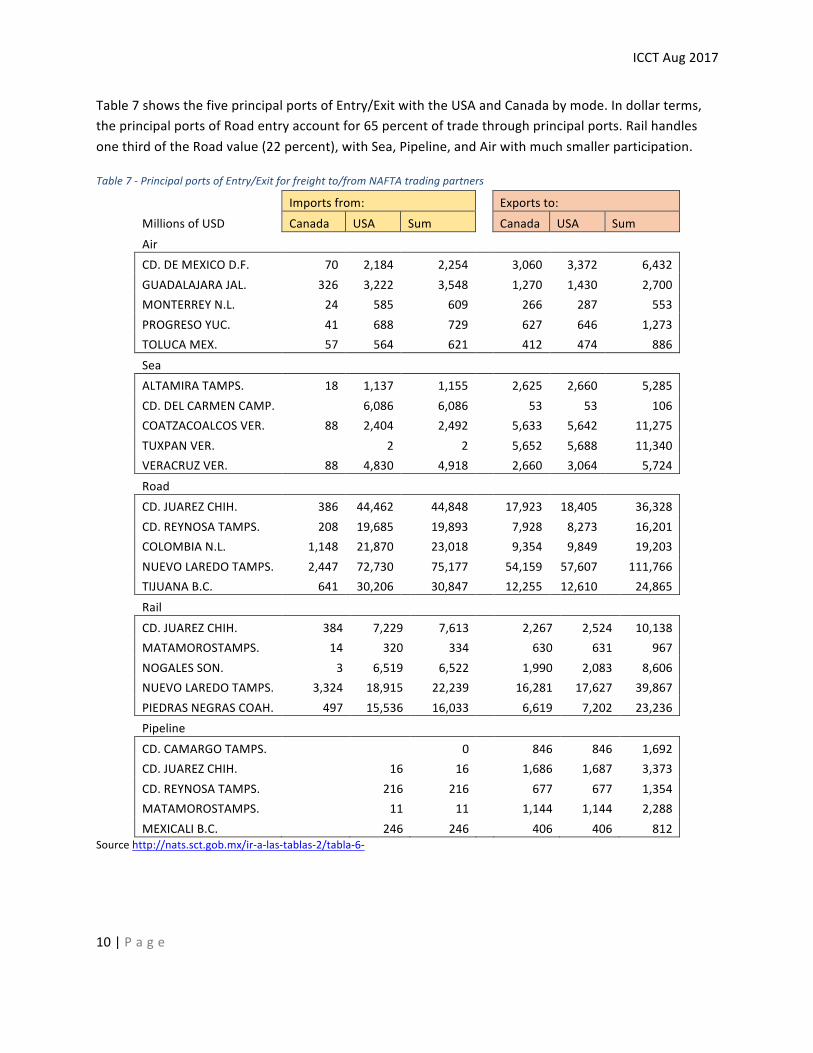
Table7showsthefiveprincipalportsofEntry/ExitwiththeUSAandCanadabymode.Indollarterms,theprincipalportsofRoadentryaccountfor65percentoftradethroughprincipalports.RailhandlesonethirdoftheRoadvalue(22percent),withSea,Pipeline,andAirwithmuchsmallerparticipation.
Table7-PrincipalportsofEntry/Exitforfreightto/fromNAFTAtradingpartners
Importsfrom: Exportsto:MillionsofUSD Canada USA Sum Canada USA SumAir CD.DEMEXICOD.F. 70 2,184 2,254 3,060 3,372 6,432GUADALAJARAJAL. 326 3,222 3,548 1,270 1,430 2,700MONTERREYN.L. 24 585 609 266 287 553PROGRESOYUC. 41 688 729 627 646 1,273TOLUCAMEX. 57 564 621 412 474 886Sea ALTAMIRATAMPS. 18 1,137 1,155 2,625 2,660 5,285CD.DELCARMENCAMP. 6,086 6,086 53 53 106COATZACOALCOSVER. 88 2,404 2,492 5,633 5,642 11,275TUXPANVER. 2 2 5,652 5,688 11,340VERACRUZVER. 88 4,830 4,918 2,660 3,064 5,724Road CD.JUAREZCHIH. 386 44,462 44,848 17,923 18,405 36,328CD.REYNOSATAMPS. 208 19,685 19,893 7,928 8,273 16,201COLOMBIAN.L. 1,148 21,870 23,018 9,354 9,849 19,203NUEVOLAREDOTAMPS. 2,447 72,730 75,177 54,159 57,607 111,766TIJUANAB.C. 641 30,206 30,847 12,255 12,610 24,865Rail CD.JUAREZCHIH. 384 7,229 7,613 2,267 2,524 10,138MATAMOROSTAMPS. 14 320 334 630 631 967NOGALESSON. 3 6,519 6,522 1,990 2,083 8,606NUEVOLAREDOTAMPS. 3,324 18,915 22,239 16,281 17,627 39,867PIEDRASNEGRASCOAH. 497 15,536 16,033 6,619 7,202 23,236Pipeline CD.CAMARGOTAMPS. 0 846 846 1,692CD.JUAREZCHIH. 16 16 1,686 1,687 3,373CD.REYNOSATAMPS. 216 216 677 677 1,354MATAMOROSTAMPS. 11 11 1,144 1,144 2,288MEXICALIB.C. 246 246 406 406 812
Sourcehttp://nats.sct.gob.mx/ir-a-las-tablas-2/tabla-6-
ICCTAug2017
11|P a g e
TransportInfrastructureinMexico
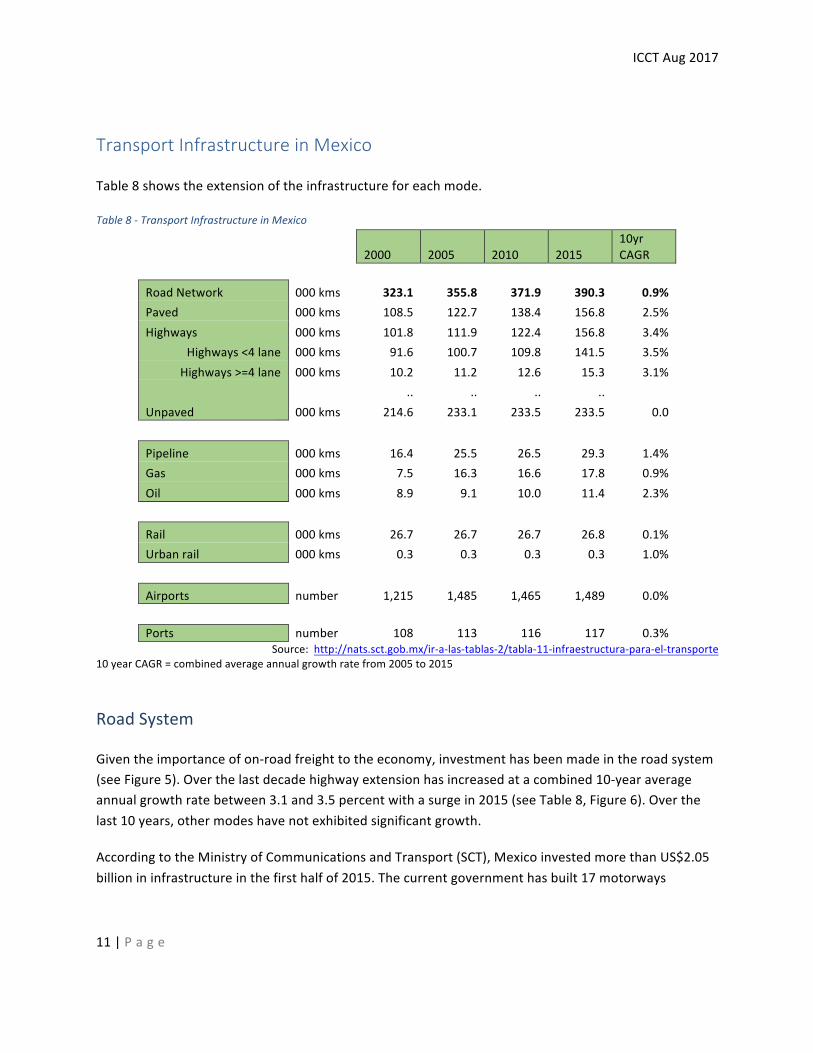
Table8showstheextensionoftheinfrastructureforeachmode.
Table8-TransportInfrastructureinMexico
2000 2005 2010 201510yrCAGR
RoadNetwork 000kms 323.1 355.8 371.9 390.3 0.9%Paved 000kms 108.5 122.7 138.4 156.8 2.5%Highways 000kms 101.8 111.9 122.4 156.8 3.4%
Highways<4lane 000kms 91.6 100.7 109.8 141.5 3.5%Highways>=4lane 000kms 10.2 11.2 12.6 15.3 3.1%
.. .. .. ..
Unpaved 000kms 214.6 233.1 233.5 233.5 0.0
Pipeline 000kms 16.4 25.5 26.5 29.3 1.4%Gas 000kms 7.5 16.3 16.6 17.8 0.9%Oil 000kms 8.9 9.1 10.0 11.4 2.3%
Rail 000kms 26.7 26.7 26.7 26.8 0.1%Urbanrail 000kms 0.3 0.3 0.3 0.3 1.0%
Airports number 1,215 1,485 1,465 1,489 0.0% Ports number 108 113 116 117 0.3%
Source:http://nats.sct.gob.mx/ir-a-las-tablas-2/tabla-11-infraestructura-para-el-transporte10yearCAGR=combinedaverageannualgrowthratefrom2005to2015
RoadSystem
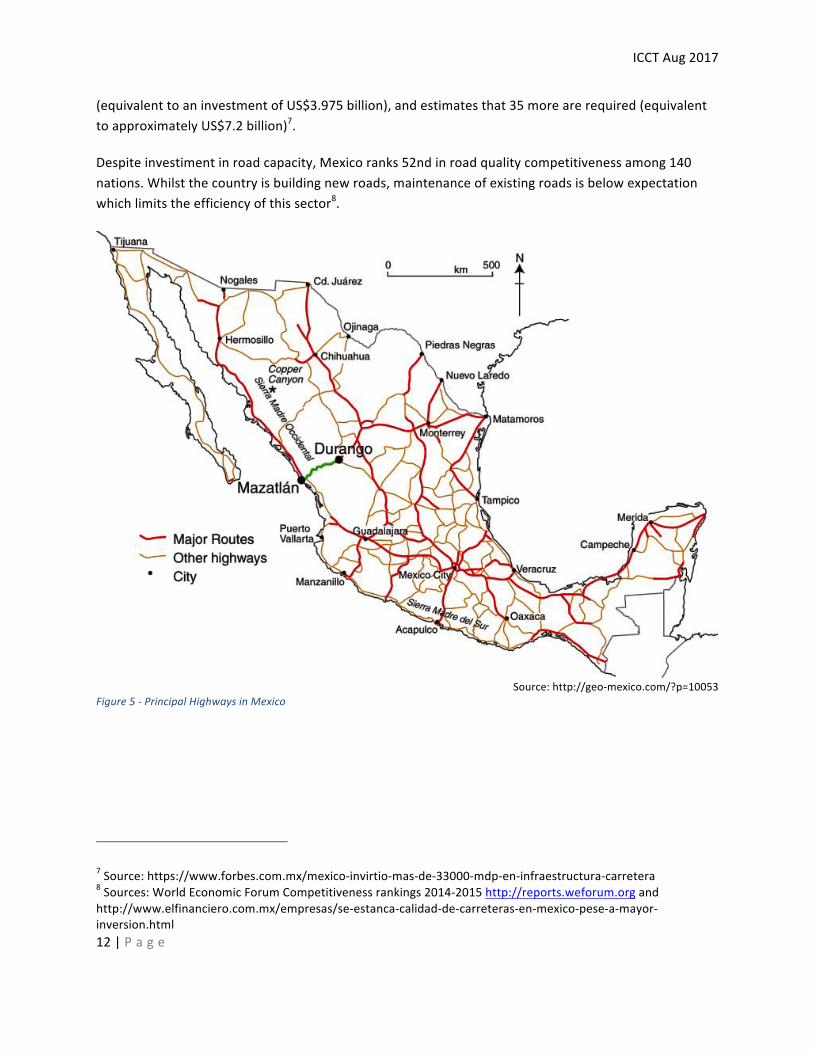
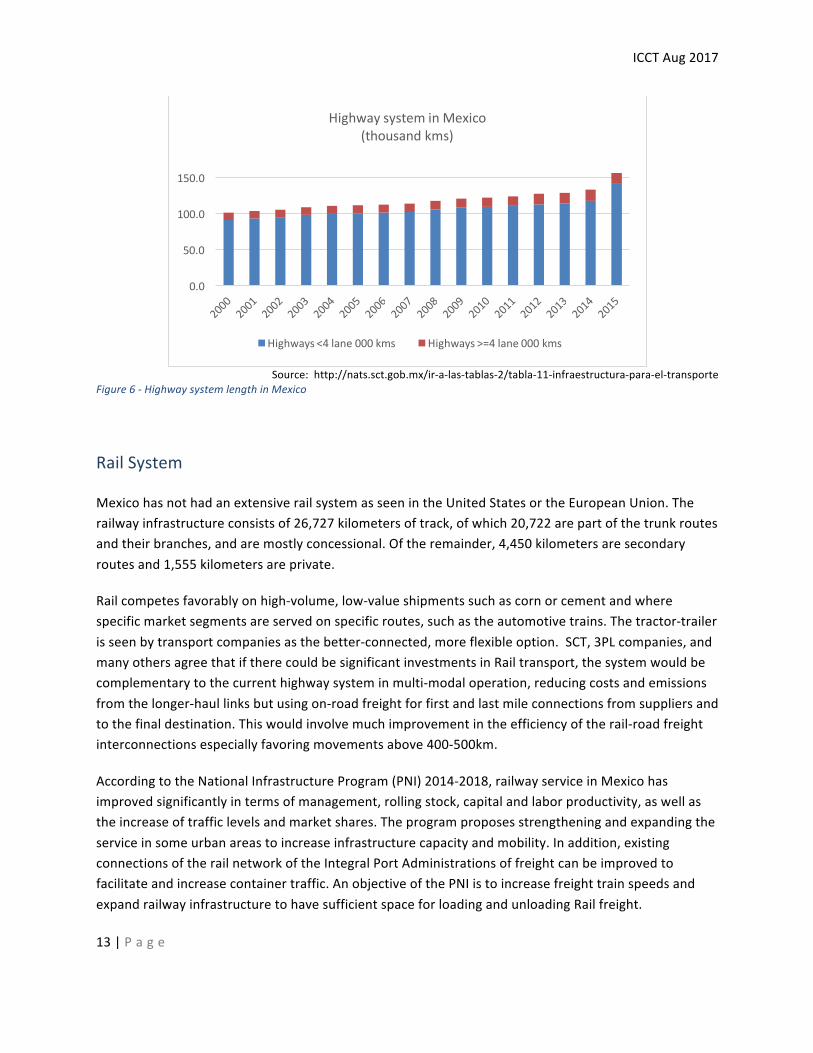
Giventheimportanceofon-roadfreighttotheeconomy,investmenthasbeenmadeintheroadsystem(seeFigure5).Overthelastdecadehighwayextensionhasincreasedatacombined10-yearaverageannualgrowthratebetween3.1and3.5percentwithasurgein2015(seeTable8,Figure6).Overthelast10years,othermodeshavenotexhibitedsignificantgrowth.
AccordingtotheMinistryofCommunicationsandTransport(SCT),MexicoinvestedmorethanUS$2.05billionininfrastructureinthefirsthalfof2015.Thecurrentgovernmenthasbuilt17motorways
ICCTAug2017
12|P a g e
(equivalenttoaninvestmentofUS$3.975billion),andestimatesthat35morearerequired(equivalenttoapproximatelyUS$7.2billion)7.
Despiteinvestimentinroadcapacity,Mexicoranks52ndinroadqualitycompetitivenessamong140nations.Whilstthecountryisbuildingnewroads,maintenanceofexistingroadsisbelowexpectationwhichlimitstheefficiencyofthissector8.
Source:http://geo-mexico.com/?p=10053
Figure5-PrincipalHighwaysinMexico
7Source:https://www.forbes.com.mx/mexico-invirtio-mas-de-33000-mdp-en-infraestructura-carretera8Sources:WorldEconomicForumCompetitivenessrankings2014-2015http://reports.weforum.organdhttp://www.elfinanciero.com.mx/empresas/se-estanca-calidad-de-carreteras-en-mexico-pese-a-mayor-inversion.html
ICCTAug2017
13|P a g e
Source:http://nats.sct.gob.mx/ir-a-las-tablas-2/tabla-11-infraestructura-para-el-transporte
Figure6-HighwaysystemlengthinMexico
RailSystem
MexicohasnothadanextensiverailsystemasseenintheUnitedStatesortheEuropeanUnion.Therailwayinfrastructureconsistsof26,727kilometersoftrack,ofwhich20,722arepartofthetrunkroutesandtheirbranches,andaremostlyconcessional.Oftheremainder,4,450kilometersaresecondaryroutesand1,555kilometersareprivate.
Railcompetesfavorablyonhigh-volume,low-valueshipmentssuchascornorcementandwherespecificmarketsegmentsareservedonspecificroutes,suchastheautomotivetrains.Thetractor-trailerisseenbytransportcompaniesasthebetter-connected,moreflexibleoption.SCT,3PLcompanies,andmanyothersagreethatiftherecouldbesignificantinvestmentsinRailtransport,thesystemwouldbecomplementarytothecurrenthighwaysysteminmulti-modaloperation,reducingcostsandemissionsfromthelonger-haullinksbutusingon-roadfreightforfirstandlastmileconnectionsfromsuppliersandtothefinaldestination.Thiswouldinvolvemuchimprovementintheefficiencyoftherail-roadfreightinterconnectionsespeciallyfavoringmovementsabove400-500km.
AccordingtotheNationalInfrastructureProgram(PNI)2014-2018,railwayserviceinMexicohasimprovedsignificantlyintermsofmanagement,rollingstock,capitalandlaborproductivity,aswellastheincreaseoftrafficlevelsandmarketshares.Theprogramproposesstrengtheningandexpandingtheserviceinsomeurbanareastoincreaseinfrastructurecapacityandmobility.Inaddition,existingconnectionsoftherailnetworkoftheIntegralPortAdministrationsoffreightcanbeimprovedtofacilitateandincreasecontainertraffic.AnobjectiveofthePNIistoincreasefreighttrainspeedsandexpandrailwayinfrastructuretohavesufficientspaceforloadingandunloadingRailfreight.
0.0
50.0
100.0
150.0
HighwaysysteminMexico(thousandkms)
Highways<4lane000kms Highways>=4lane000kms
ICCTAug2017
14|P a g e
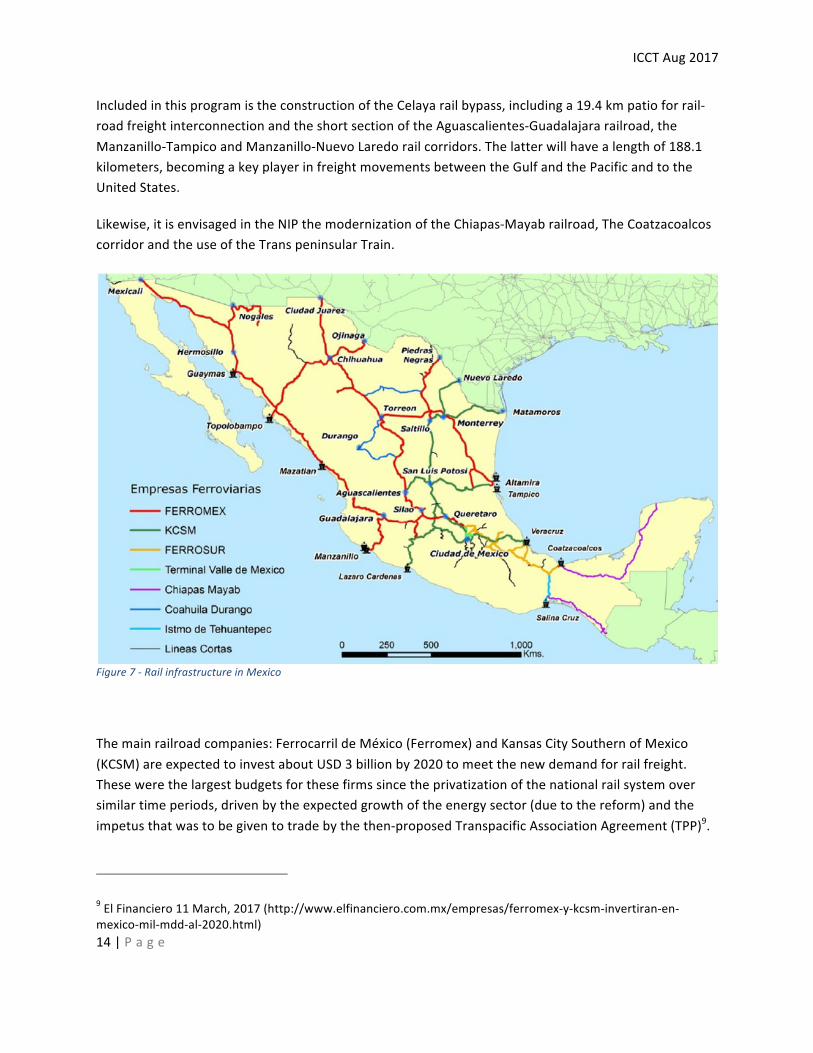
IncludedinthisprogramistheconstructionoftheCelayarailbypass,includinga19.4kmpatioforrail-roadfreightinterconnectionandtheshortsectionoftheAguascalientes-Guadalajararailroad,theManzanillo-TampicoandManzanillo-NuevoLaredorailcorridors.Thelatterwillhavealengthof188.1kilometers,becomingakeyplayerinfreightmovementsbetweentheGulfandthePacificandtotheUnitedStates.
Likewise,itisenvisagedintheNIPthemodernizationoftheChiapas-Mayabrailroad,TheCoatzacoalcoscorridorandtheuseoftheTranspeninsularTrain.
Figure7-RailinfrastructureinMexico
Themainrailroadcompanies:FerrocarrildeMéxico(Ferromex)andKansasCitySouthernofMexico(KCSM)areexpectedtoinvestaboutUSD3billionby2020tomeetthenewdemandforrailfreight.Thesewerethelargestbudgetsforthesefirmssincetheprivatizationofthenationalrailsystemoversimilartimeperiods,drivenbytheexpectedgrowthoftheenergysector(duetothereform)andtheimpetusthatwastobegiventotradebythethen-proposedTranspacificAssociationAgreement(TPP)9.
9ElFinanciero11March,2017(http://www.elfinanciero.com.mx/empresas/ferromex-y-kcsm-invertiran-en-mexico-mil-mdd-al-2020.html)
ICCTAug2017
15|P a g e
Theinvestmentswillbeusedtoexpandthetractionofthelocomotivefleet,aswellasintherenovationoftracksandtrains.
Despitetheseinvestments,mostfreightcompaniesintervieweddonotseeRailascompetingwithtractor-trailertrucksinMexico.ThelevelofRailinfrastructureinvestmenttobeabletocompetewithhighway,forgeneralfreight,wouldbeexpensiveandpoliticallycomplexduetotheconcessionsysteminplace.
Multimodalfreight
FreightterminalsinMexicomustbeauthorizedbytheMinistryofCommunicationsandTransport(SCT)andinadditiontoallowingtheloadingandunloadingoffreightbetweentherailwayandon-roadtransport,canprovideservicessuchasreception,storage,classification,consolidation,anddispatchoffreight.
In2015,therewere59railfreightterminalsoperatingwithpermits,mainlyinthestatesofNuevoLeón(25%),StateofMexico(15%),Jalisco(10%)Querétaro(10%),Hidalgo(8%)andS.L.P.(8%).
MultimodaltransportisconsideredanareaofopportunityinnationallogisticstoboostMexico'sdevelopment.Bothforthedomesticmarketandexports,manymultimodaltriplengthsaregreaterthan400-500kilometers,abovewhichRail,ifproperlyexploited,cangeneratebothcostandemissionssavings10.
Pipelines
InDecember2013,Mexico’senergyreformopenedtheenergyindustrytovariousdegreesofprivateparticipationandcompetition.ThishasnotledtoanincreaseinnationalgasproductionbecausemorethanhalfofMexico’snaturalgasproductionisassociatedgasfromoilandislocatedatthesouthernendofthecountry.Domesticgassupplyhasdeclinedbynearly0.9billioncubicfeetperday(Bcf/d)since2010to4.1Bcf/din2015asoilproductionlagged,butatthesametime,demandforgaspickedup,mostlyfromthepowersector,inwhich1,990MWofnewcombinedcyclenaturalgaspowerplantswillbeinstalled,andpipelineimportsfromtheU.S.havebeenutilizedtobalancethemarket.
Tomeetthisdemand,newpipelinesarebeingbuilt(seeTable9),andexistingpipelinesarebeingexpandedorhavingtheirflowcapabilityreversed.GasimportsfromtheU.S.accountedforonly8%ofMexicangasdemandin2000.By2010,U.S.gasimportsasapercentageoftotaldemandclimbedto14%.In2016pipelineimportssurgedtoaround44%andareexpectedtoaccountforhalf,ifnotmore,oftotaldemandin2017andbeyond.Bytheendof2017,twelvenewnaturalgaspipelinesareexpected
10Source:PNIandElEconomista29April2014(http://eleconomista.com.mx/industrias/2014/04/29/transporte-multimodal-impulsara-desarrollo-mexico)
ICCTAug2017
16|P a g e
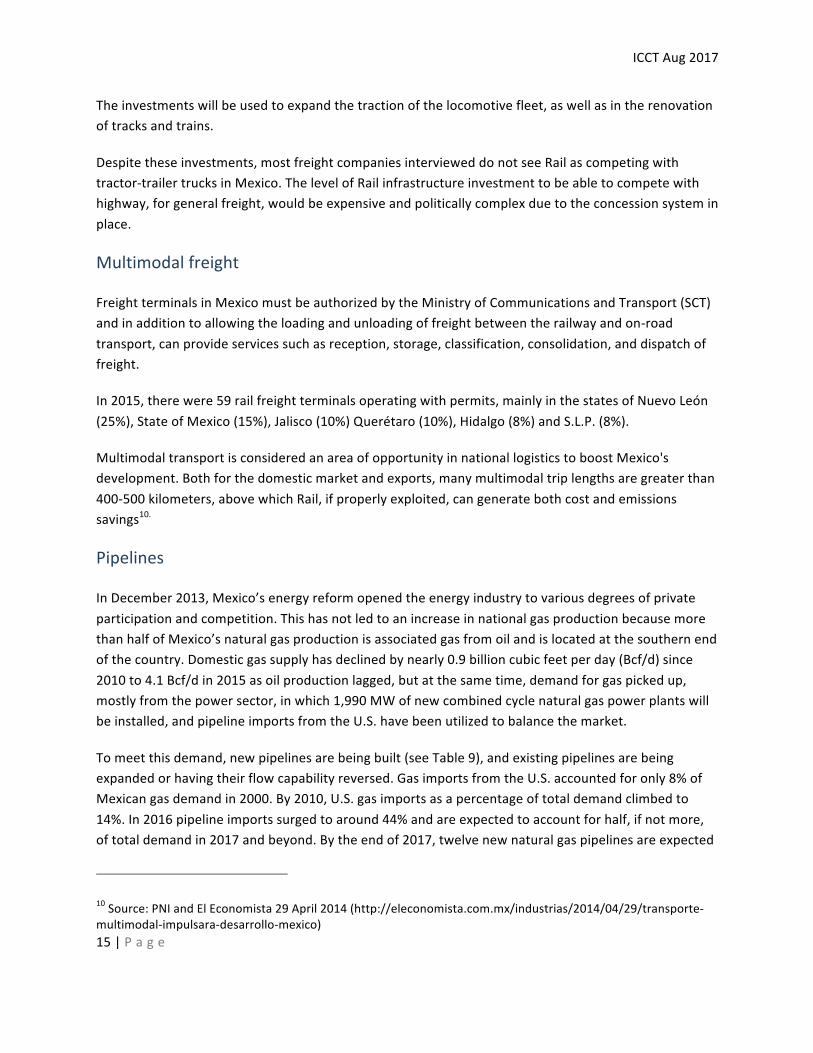
tobeplacedinservice,facilitatingnaturalgasexportgrowthfromtheUSAtoMexicoandprovidingincreasedinterconnectivityfortheMexicannaturalgasgrid.
TheexpansionsplannedfortheMexicanpipelinegridareintendedtoprovidealong-termfoundationforincreasednaturalgasburn,withimportsgraduallyincreasingasprojectsarecompleted.
Table9-ConstructionofnewpipelinesinMexicoupto2017Year New
Pipelines(km)
TotalExtension(km)
2010 11,5422011 300 2013 625 2014 365 2016 1,944 2017 1,021 15,797
Source:InsightsofTransportation&LogisticsSectorinMexico,PWC,Sept2014(https://www.pwc.com/mx/es/knowledge-center/archivo/2014-09-transportation-and-logistics.pdf)
Figure8-Mexicanpipelineinfrastructure
ICCTAug2017
17|P a g e
TransportActivitybymodesotherthanRoad
FreighttransportedbyRail
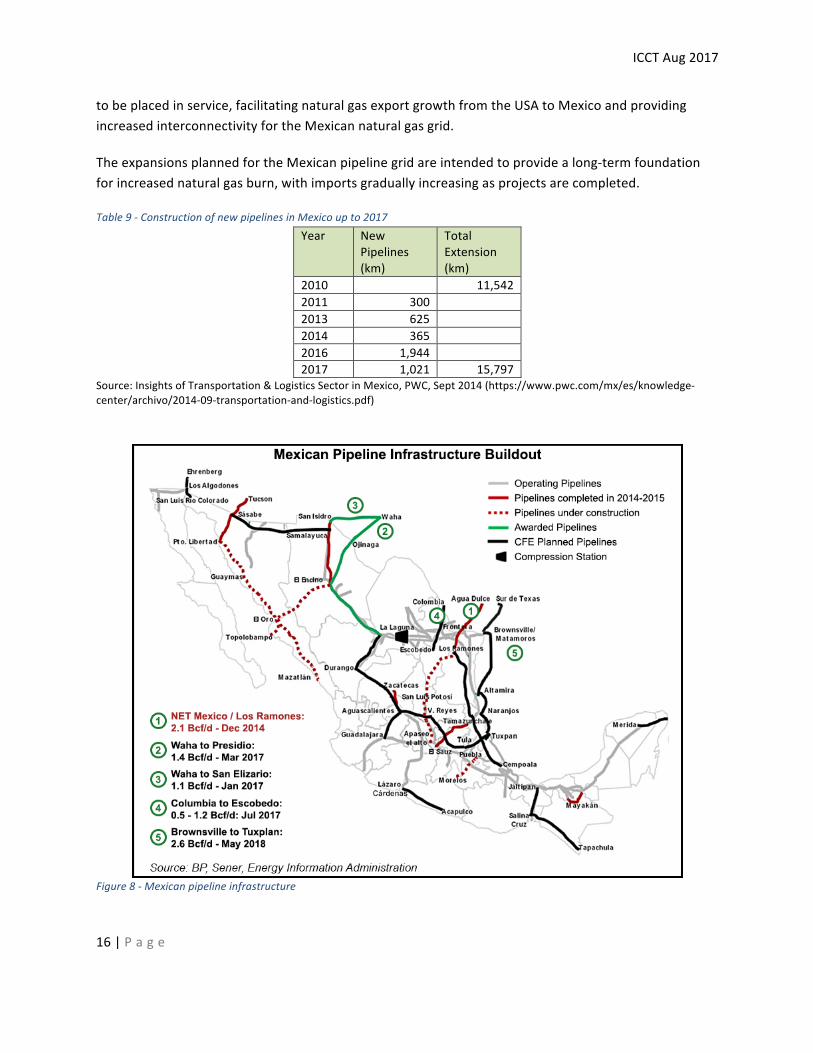
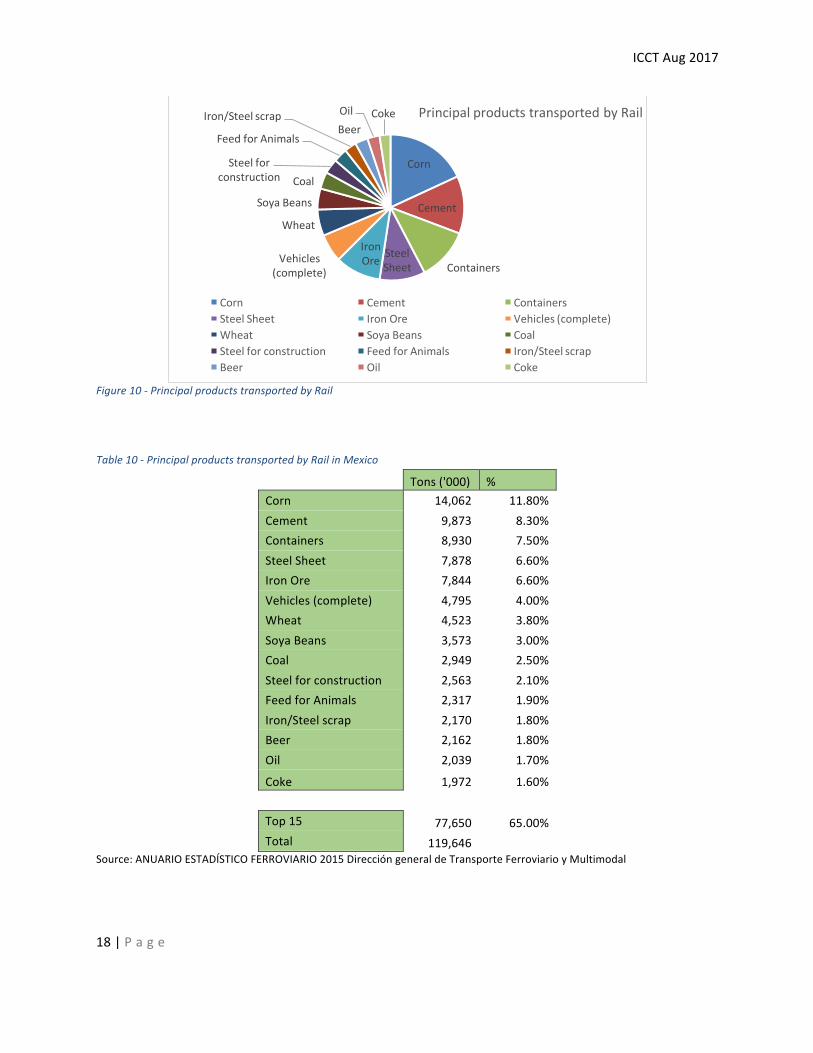
In2015,freighttransportbyRail(seeFigure9)increasedby2.3percentcomparedto2014,recordingamovementof119.6millionnettons.Likewise,therewasa3.4percentincreaseinton-kilometerstransported,risingto83.4billiont-kmin2015.Similarly,Railtrafficofimportcargoamountedto54.9milliontonsin2015;anincreaseof32.9percentoverthepreviousyear.ThemainproductstransportedbyRail(seeFigure10andTable10)arecorn(11.8percent),cement(8.3percent),containers(7.5percent)andironandsteelsheetsandplates(6.3percent).
Source:ANUARIOESTADÍSTICOFERROVIARIO2015DireccióngeneraldeTransporteFerroviarioyMultimodal
Figure9-FreighttransportedbyRailinMexico
010,00020,00030,00040,00050,00060,00070,00080,00090,000
0
20
40
60
80
100
120
140
Freighttraffic(thou
sand
ton-km
)
Freighttranspo
rted
(tho
usandtons)
Year
TotalfreightmovementbyrailinMexico
tons('000) ton-km('000)
ICCTAug2017
18|P a g e
Figure10-PrincipalproductstransportedbyRail
Table10-PrincipalproductstransportedbyRailinMexico
Tons('000) %Corn 14,062 11.80%Cement 9,873 8.30%Containers 8,930 7.50%SteelSheet 7,878 6.60%IronOre 7,844 6.60%Vehicles(complete) 4,795 4.00%Wheat 4,523 3.80%SoyaBeans 3,573 3.00%Coal 2,949 2.50%Steelforconstruction 2,563 2.10%FeedforAnimals 2,317 1.90%Iron/Steelscrap 2,170 1.80%Beer 2,162 1.80%Oil 2,039 1.70%
Coke 1,972 1.60% Top15 77,650 65.00%Total 119,646
Source:ANUARIOESTADÍSTICOFERROVIARIO2015DireccióngeneraldeTransporteFerroviarioyMultimodal
Corn
Cement
ContainersSteelSheet
IronOreVehicles
(complete)
Wheat
SoyaBeans
CoalSteelfor
construction
FeedforAnimals
Iron/SteelscrapBeerOil Coke PrincipalproductstransportedbyRail
Corn Cement ContainersSteelSheet IronOre Vehicles(complete)Wheat SoyaBeans CoalSteelforconstruction FeedforAnimals Iron/SteelscrapBeer Oil Coke
ICCTAug2017
19|P a g e
RailEnergyEfficiency
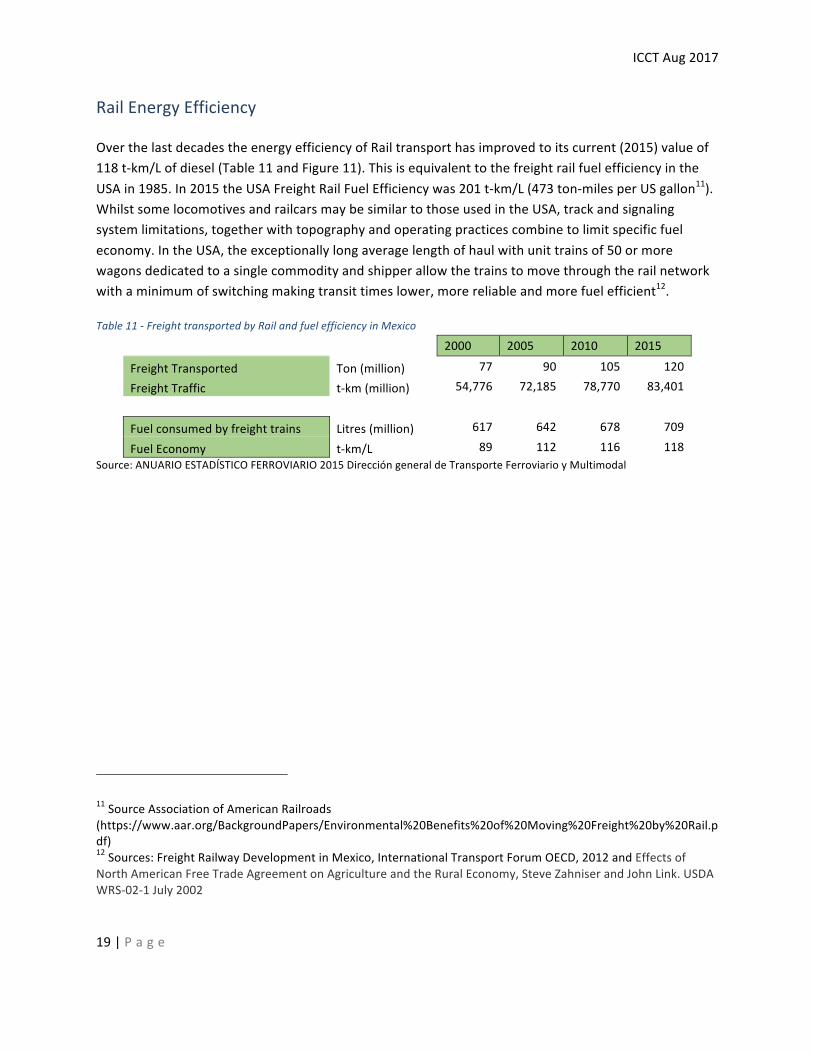
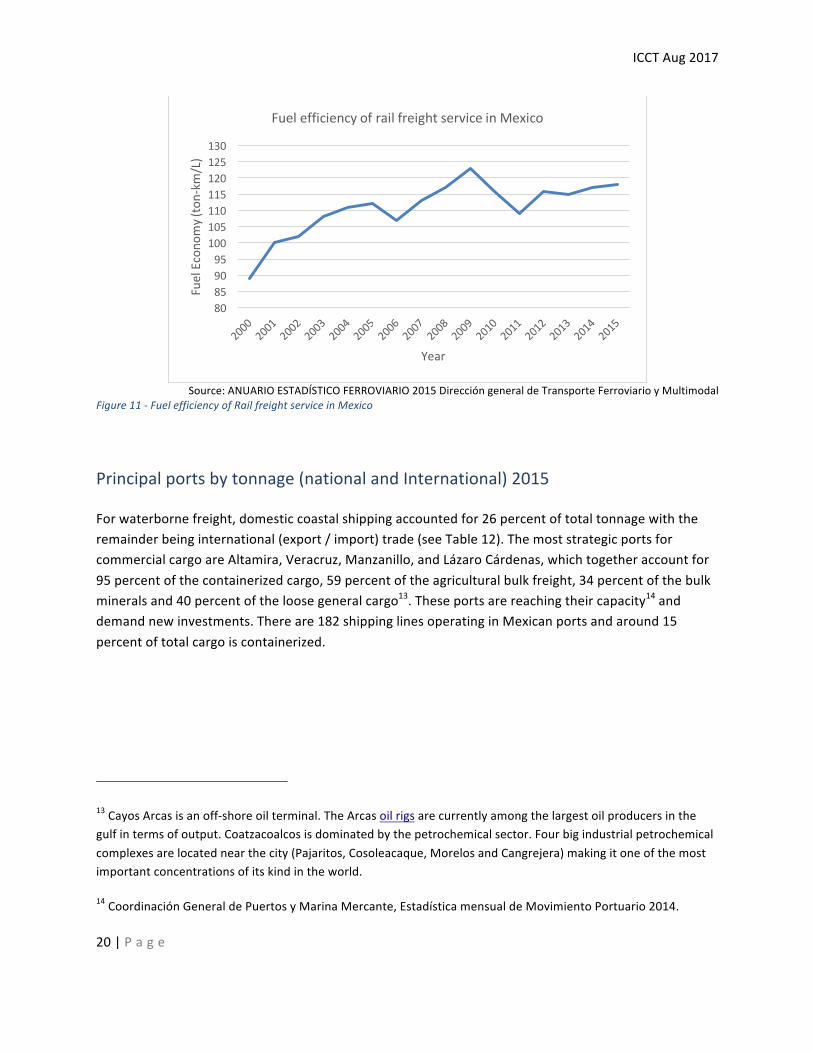
OverthelastdecadestheenergyefficiencyofRailtransporthasimprovedtoitscurrent(2015)valueof118t-km/Lofdiesel(Table11andFigure11).ThisisequivalenttothefreightrailfuelefficiencyintheUSAin1985.In2015theUSAFreightRailFuelEfficiencywas201t-km/L(473ton-milesperUSgallon11).WhilstsomelocomotivesandrailcarsmaybesimilartothoseusedintheUSA,trackandsignalingsystemlimitations,togetherwithtopographyandoperatingpracticescombinetolimitspecificfueleconomy.IntheUSA,theexceptionallylongaveragelengthofhaulwithunittrainsof50ormorewagonsdedicatedtoasinglecommodityandshipperallowthetrainstomovethroughtherailnetworkwithaminimumofswitchingmakingtransittimeslower,morereliableandmorefuelefficient12.
Table11-FreighttransportedbyRailandfuelefficiencyinMexico
2000 2005 2010 2015
FreightTransported Ton(million) 77 90 105 120
FreightTraffic t-km(million) 54,776 72,185 78,770 83,401
Fuelconsumedbyfreighttrains Litres(million) 617 642 678 709
FuelEconomy t-km/L 89 112 116 118Source:ANUARIOESTADÍSTICOFERROVIARIO2015DireccióngeneraldeTransporteFerroviarioyMultimodal
11SourceAssociationofAmericanRailroads(https://www.aar.org/BackgroundPapers/Environmental%20Benefits%20of%20Moving%20Freight%20by%20Rail.pdf)12Sources:FreightRailwayDevelopmentinMexico,InternationalTransportForumOECD,2012andEffectsofNorthAmericanFreeTradeAgreementonAgricultureandtheRuralEconomy,SteveZahniserandJohnLink.USDAWRS-02-1July2002
ICCTAug2017
20|P a g e
Source:ANUARIOESTADÍSTICOFERROVIARIO2015DireccióngeneraldeTransporteFerroviarioyMultimodal
Figure11-FuelefficiencyofRailfreightserviceinMexico
Principalportsbytonnage(nationalandInternational)2015
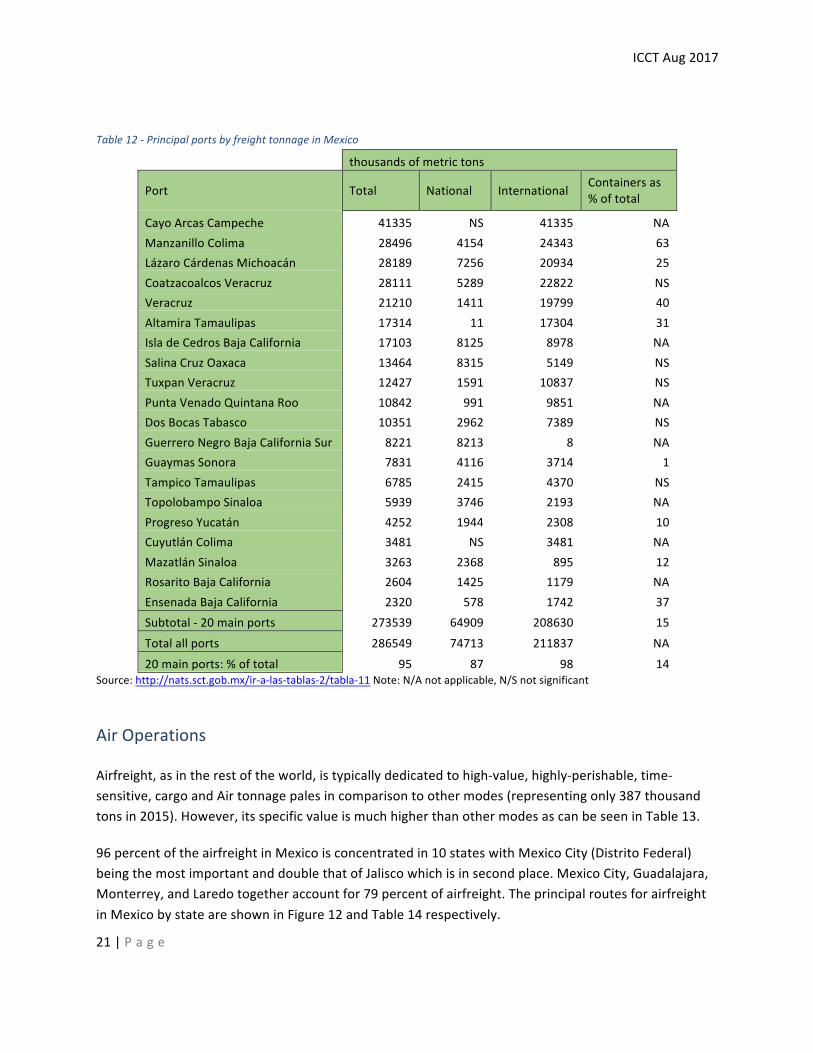
Forwaterbornefreight,domesticcoastalshippingaccountedfor26percentoftotaltonnagewiththeremainderbeinginternational(export/import)trade(seeTable12).ThemoststrategicportsforcommercialcargoareAltamira,Veracruz,Manzanillo,andLázaroCárdenas,whichtogetheraccountfor95percentofthecontainerizedcargo,59percentoftheagriculturalbulkfreight,34percentofthebulkmineralsand40percentoftheloosegeneralcargo13.Theseportsarereachingtheircapacity14anddemandnewinvestments.Thereare182shippinglinesoperatinginMexicanportsandaround15percentoftotalcargoiscontainerized.
13CayosArcasisanoff-shoreoilterminal.TheArcasoilrigsarecurrentlyamongthelargestoilproducersinthegulfintermsofoutput.Coatzacoalcosisdominatedbythepetrochemicalsector.Fourbigindustrialpetrochemicalcomplexesarelocatednearthecity(Pajaritos,Cosoleacaque,MorelosandCangrejera)makingitoneofthemostimportantconcentrationsofitskindintheworld.
14CoordinaciónGeneraldePuertosyMarinaMercante,EstadísticamensualdeMovimientoPortuario2014.
80859095
100105110115120125130
FuelEcono
my(ton-km
/L)
Year
FuelefficiencyofrailfreightserviceinMexico
ICCTAug2017
21|P a g e
Table12-PrincipalportsbyfreighttonnageinMexico
thousandsofmetrictons
Port Total National International Containersas%oftotal
CayoArcasCampeche 41335 NS 41335 NAManzanilloColima 28496 4154 24343 63LázaroCárdenasMichoacán 28189 7256 20934 25CoatzacoalcosVeracruz 28111 5289 22822 NSVeracruz 21210 1411 19799 40AltamiraTamaulipas 17314 11 17304 31IsladeCedrosBajaCalifornia 17103 8125 8978 NASalinaCruzOaxaca 13464 8315 5149 NSTuxpanVeracruz 12427 1591 10837 NSPuntaVenadoQuintanaRoo 10842 991 9851 NADosBocasTabasco 10351 2962 7389 NSGuerreroNegroBajaCaliforniaSur 8221 8213 8 NAGuaymasSonora 7831 4116 3714 1TampicoTamaulipas 6785 2415 4370 NSTopolobampoSinaloa 5939 3746 2193 NAProgresoYucatán 4252 1944 2308 10CuyutlánColima 3481 NS 3481 NAMazatlánSinaloa 3263 2368 895 12RosaritoBajaCalifornia 2604 1425 1179 NAEnsenadaBajaCalifornia 2320 578 1742 37Subtotal-20mainports 273539 64909 208630 15Totalallports 286549 74713 211837 NA20mainports:%oftotal 95 87 98 14
Source:http://nats.sct.gob.mx/ir-a-las-tablas-2/tabla-11Note:N/Anotapplicable,N/Snotsignificant
AirOperations
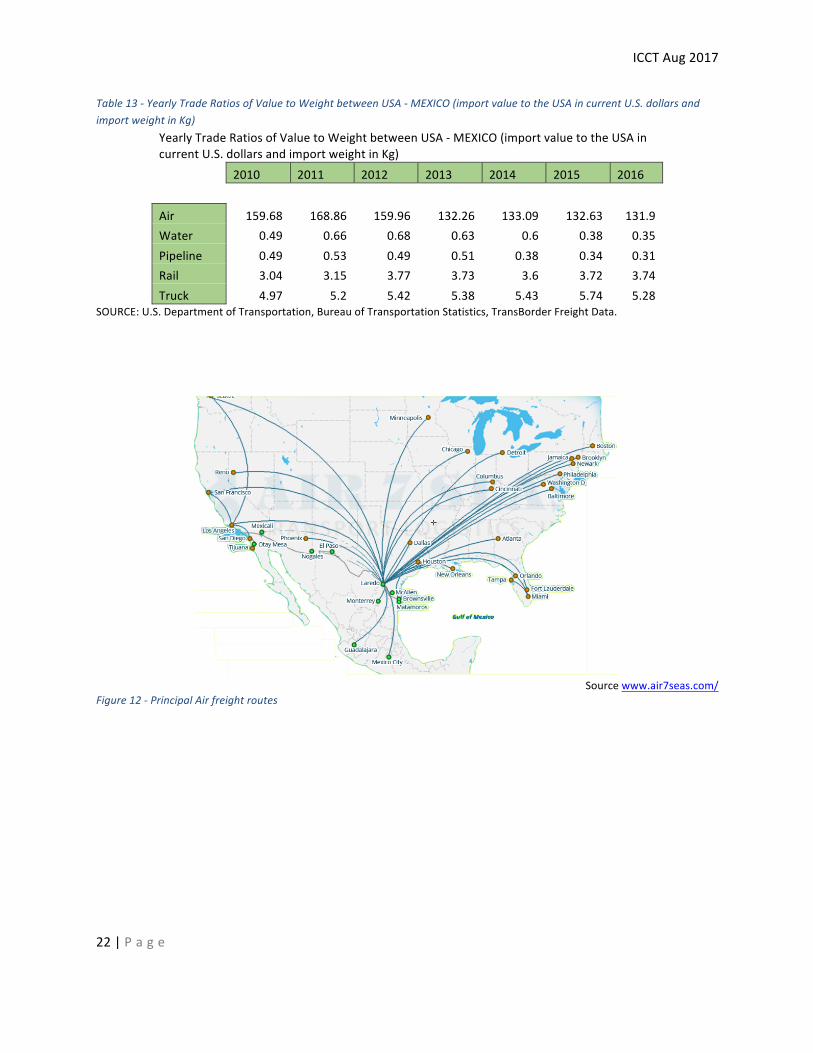
Airfreight,asintherestoftheworld,istypicallydedicatedtohigh-value,highly-perishable,time-sensitive,cargoandAirtonnagepalesincomparisontoothermodes(representingonly387thousandtonsin2015).However,itsspecificvalueismuchhigherthanothermodesascanbeseeninTable13.
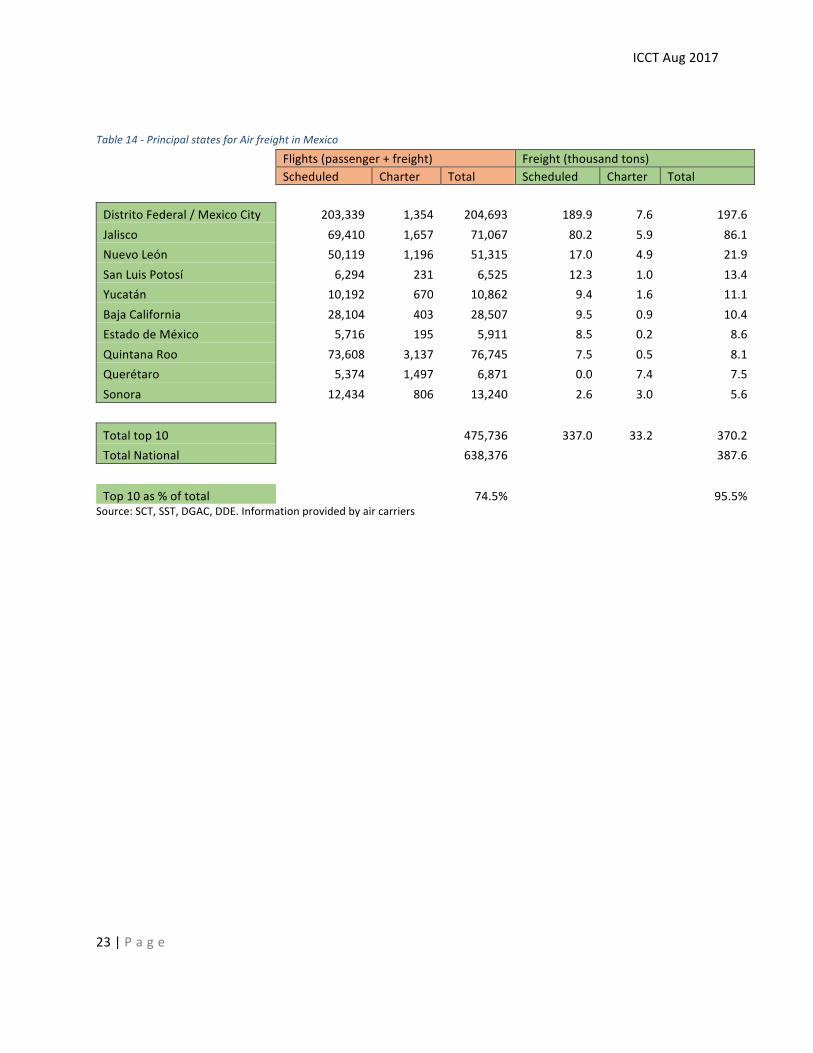
96percentoftheairfreightinMexicoisconcentratedin10stateswithMexicoCity(DistritoFederal)beingthemostimportantanddoublethatofJaliscowhichisinsecondplace.MexicoCity,Guadalajara,Monterrey,andLaredotogetheraccountfor79percentofairfreight.TheprincipalroutesforairfreightinMexicobystateareshowninFigure12andTable14respectively.
ICCTAug2017
22|P a g e
Table13-YearlyTradeRatiosofValuetoWeightbetweenUSA-MEXICO(importvaluetotheUSAincurrentU.S.dollarsandimportweightinKg)
YearlyTradeRatiosofValuetoWeightbetweenUSA-MEXICO(importvaluetotheUSAincurrentU.S.dollarsandimportweightinKg) 2010 2011 2012 2013 2014 2015 2016 Air 159.68 168.86 159.96 132.26 133.09 132.63 131.9Water 0.49 0.66 0.68 0.63 0.6 0.38 0.35Pipeline 0.49 0.53 0.49 0.51 0.38 0.34 0.31Rail 3.04 3.15 3.77 3.73 3.6 3.72 3.74Truck 4.97 5.2 5.42 5.38 5.43 5.74 5.28
SOURCE:U.S.DepartmentofTransportation,BureauofTransportationStatistics,TransBorderFreightData.
Sourcewww.air7seas.com/
Figure12-PrincipalAirfreightroutes
ICCTAug2017
23|P a g e
Table14-PrincipalstatesforAirfreightinMexico
Flights(passenger+freight) Freight(thousandtons) Scheduled Charter Total Scheduled Charter Total DistritoFederal/MexicoCity 203,339 1,354 204,693 189.9 7.6 197.6Jalisco 69,410 1,657 71,067 80.2 5.9 86.1NuevoLeón 50,119 1,196 51,315 17.0 4.9 21.9SanLuisPotosí 6,294 231 6,525 12.3 1.0 13.4Yucatán 10,192 670 10,862 9.4 1.6 11.1BajaCalifornia 28,104 403 28,507 9.5 0.9 10.4EstadodeMéxico 5,716 195 5,911 8.5 0.2 8.6QuintanaRoo 73,608 3,137 76,745 7.5 0.5 8.1Querétaro 5,374 1,497 6,871 0.0 7.4 7.5Sonora 12,434 806 13,240 2.6 3.0 5.6 Totaltop10 475,736 337.0 33.2 370.2TotalNational 638,376 387.6 Top10as%oftotal 74.5% 95.5%
Source:SCT,SST,DGAC,DDE.Informationprovidedbyaircarriers
ICCTAug2017
24|P a g e
Chapter3:-CharacteristicsofIn-useTractor-trailersinMexico
Thischaptercompilesinformationontheregistered,andactivein-usepopulationofhighwaytractorsandsemi-trailersinMexico.Itpresentsdatabysizeoffleetandbyvocation,andlooksattheexpectedlifeoftheseunits.
PopulationofIn-useHighwayTractorsThenationalpopulationofregisteredhighwaytractorsattheendof2016is284,349unitswhichhasgrownatanaveragerateof4.6percentperyearoverthelast10years.Thesenumbersgiveanin-usefleetaverageageof15.1yearswith30.3percentofthepopulationwithover20yearsofuse(thatismodelyear1995orearlier).However,theactivepopulationofhighwaytractorsasgivenbytheMacKayseriesofsurveysisaround70percentofthisfigure,upfrom64percentinthe‘90s.Theaverageageofthisactivefleetis8.5yearstobecomparedtotheaverageageofaheavy-dutyvehicleintheUSof9.4years.ItistobeexpectedthattheMexicanfleetisyoungerbecauseofthedifferenceinannualgrowthrate.Mostoftheremaining30percentofover20-year-oldvehiclesdoexist,butnotinnormalmain-linefleetoperation.Theprincipalvocationsoftheactivein-usefleetare“ForHire”61percentand“Industry&Commerce”26percentwithalmost70percentofthesevehiclesreportedbyfleetsofover100vehicles.Attheendofthe‘90s,IndustryandCommerceaccountedforonly11percentofhighwaytractors(withasignificantlyhigherpenetrationinrigidtrucks).Thishasgrownto26percent(in2015)andisnowdroppingagainwithincreasingusageof3PLlogisticscompaniestomanagetheirtransportneeds.Overthecoming24months,“Forhire”expectsanetincreaseof3percentinhighwaytractorsand2percentinsemi-trailerswhilst“IndustryandCommerce”arelookingataconsiderablereductioninbothof33and22percentrespectivelycausedbyapowerfulshifttowardstheuseof3PLlogisticscompanies.Onemainadvantageoftheseisthattheyareexemptfromthelimitationonprivatefleetsthathaveanyforeigninvestmentoftransportingonlythosegoodsthataredirectlyrelatedtotheirbusinessneeds,andalsohaveloweroperatingcoststhan“IndustryandCommerce”fleets.Inthemostrecentsurvey,overhalfoftheHighwayTractorsfoundinthesampleareKenworth,withFreightlinerinsecondplacewith31percent.Itisinterestingtonotethatforbothbrandsthemostrecentmodelyearsshowedthehighestpenetrations;36percentofallFreightlinersinthesamplewereof2015ornewermodelyear(comparedthe28percentofKenworth)
ChapterHighlights
ICCTAug2017
25|P a g e
Populationofsemi-trailersThenationalpopulationofregisteredsemi-trailersattheendof2016is417,000unitswhichhasgrownatanaveragerateof6.6percentperyearoverthelast10years.Thisgivesanoverallratioofsemi-trailersperhighwaytractorthatincreasesfrom1.20in2005to1.47in2016.Byvocation,Owner/operatorhavearatioof1.17;“Forhire”transportfleets,1.46;andIndustry&Commerce2.01.TheTop100fleetsbysize(independentofvocation)givearatioof1.98semi-trailersperhighwaytractor.Asapointofreference,intheUSAsince2005,theratioofdryvanstoClass8tractorshasremainedinaverytightband:1.96to2.01trailerspertractor.Whilstfleetstendtocarefullychoosetheirtractorsbymake,trailersareconsideredmoreofacommoditywherepriceisthemaindifferencingfactor.Aswithhighwaytractors,thereisadifferenceforsemi-trailersbetweenthetotalnumberregisteredandthosefoundinfleetactiveservice.WhilsttheSCTregisterednumberswouldgiveanaverageageof16.1years,theactivefleethasanaverageageof6.9years.Inthemostrecentsurvey25makesofsemi-trailerwerementionedbytheinterviewees,ofthese,threemakesaccountforalmost55percentofthesample—Utility,Fruehauf,andGallegos.VehiclepopulationbyremaininglifeHighwaytractorsThetimethatthefleetexpectstokeepthevehicleinoperationbeforesellingit,variessubstantiallybyvocation.Industryandcommerceexpecttousetheirvehiclesofmodelyear2013orneweranadditional8years.Thislifeexpectancedropstooneyearforvehiclesthatare20yearsold.For“ForHire”transportfleetsthestoryismorecomplex.Newvehiclesthataretypicallyboughtbythelargerfleetshavealifeexpectancy(withtheirfirstbuyer)oflessthan12years.These(togetherwithprivatefleetvehicles)arethenresoldtosmallerfleetsandresoldagainuntiltheyendupinthehandsofowner-operatorsandsmallfleets.Becauseofthis,aftertheunithashad25yearsofoperation,itsexpectedlifereachesanewpeakofanadditional12years.Noneofthefleetsinthesamplehadvehiclesolderthan1984modelyear.Semi-trailersIndustryandcommerceexpecttousetheirsemi-trailersofmodelyear2015orneweranadditional10years.Thislifeexpectancedropstotwoyearsforunitsthatareofmodelyear2004orolder.Inthesample,Industryandcommercedidnothaveanysemi-trailersofover20yearsofage.
ICCTAug2017
26|P a g e
HighwayTractors
Registeredpopulation
ThemostcitedvehiclepopulationfiguresarereportedbySCTintheirannualstatisticalreport(EstadisticaBásicadelAutotransporteFederal).
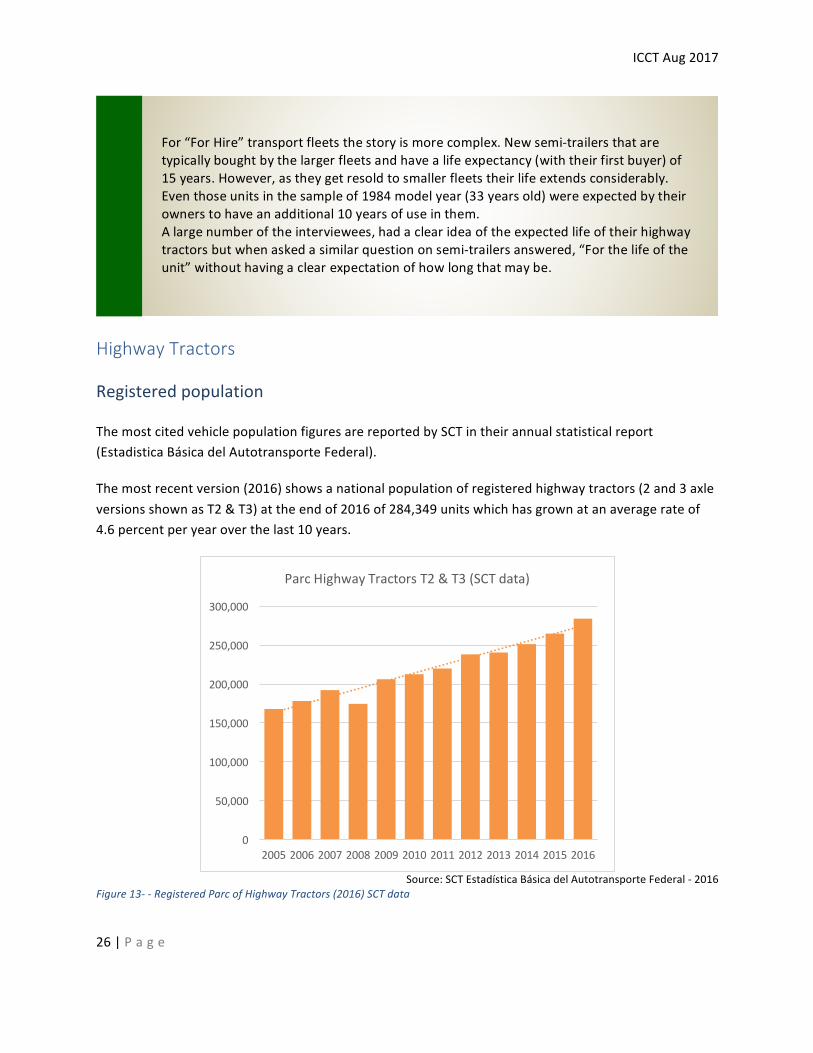
Themostrecentversion(2016)showsanationalpopulationofregisteredhighwaytractors(2and3axleversionsshownasT2&T3)attheendof2016of284,349unitswhichhasgrownatanaveragerateof4.6percentperyearoverthelast10years.
Source:SCTEstadísticaBásicadelAutotransporteFederal-2016
Figure13--RegisteredParcofHighwayTractors(2016)SCTdata
0
50,000
100,000
150,000
200,000
250,000
300,000
2005 2006 2007 2008 2009 2010 2011 2012 2013 2014 2015 2016
ParcHighwayTractorsT2&T3(SCTdata)
For“ForHire”transportfleetsthestoryismorecomplex.Newsemi-trailersthataretypicallyboughtbythelargerfleetsandhavealifeexpectancy(withtheirfirstbuyer)of15years.However,astheygetresoldtosmallerfleetstheirlifeextendsconsiderably.Eventhoseunitsinthesampleof1984modelyear(33yearsold)wereexpectedbytheirownerstohaveanadditional10yearsofuseinthem.Alargenumberoftheinterviewees,hadaclearideaoftheexpectedlifeoftheirhighwaytractorsbutwhenaskedasimilarquestiononsemi-trailersanswered,“Forthelifeoftheunit”withouthavingaclearexpectationofhowlongthatmaybe.
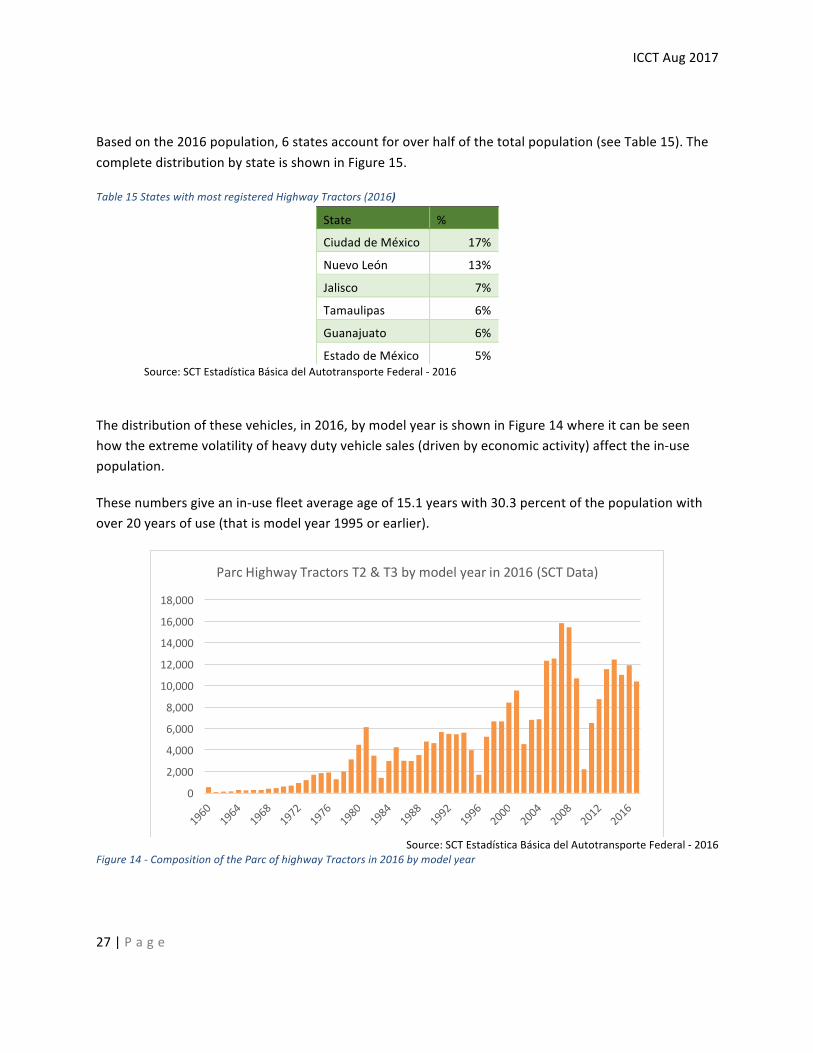
ICCTAug2017
27|P a g e
Basedonthe2016population,6statesaccountforoverhalfofthetotalpopulation(seeTable15).ThecompletedistributionbystateisshowninFigure15.
Table15StateswithmostregisteredHighwayTractors(2016)
State %
CiudaddeMéxico 17%
NuevoLeón 13%
Jalisco 7%
Tamaulipas 6%
Guanajuato 6%
EstadodeMéxico 5% Source:SCTEstadísticaBásicadelAutotransporteFederal-2016
Thedistributionofthesevehicles,in2016,bymodelyearisshowninFigure14whereitcanbeseenhowtheextremevolatilityofheavydutyvehiclesales(drivenbyeconomicactivity)affectthein-usepopulation.
Thesenumbersgiveanin-usefleetaverageageof15.1yearswith30.3percentofthepopulationwithover20yearsofuse(thatismodelyear1995orearlier).
Source:SCTEstadísticaBásicadelAutotransporteFederal-2016
Figure14-CompositionoftheParcofhighwayTractorsin2016bymodelyear
0
2,000
4,000
6,000
8,000
10,000
12,000
14,000
16,000
18,000
ParcHighwayTractorsT2&T3bymodelyearin2016(SCTData)
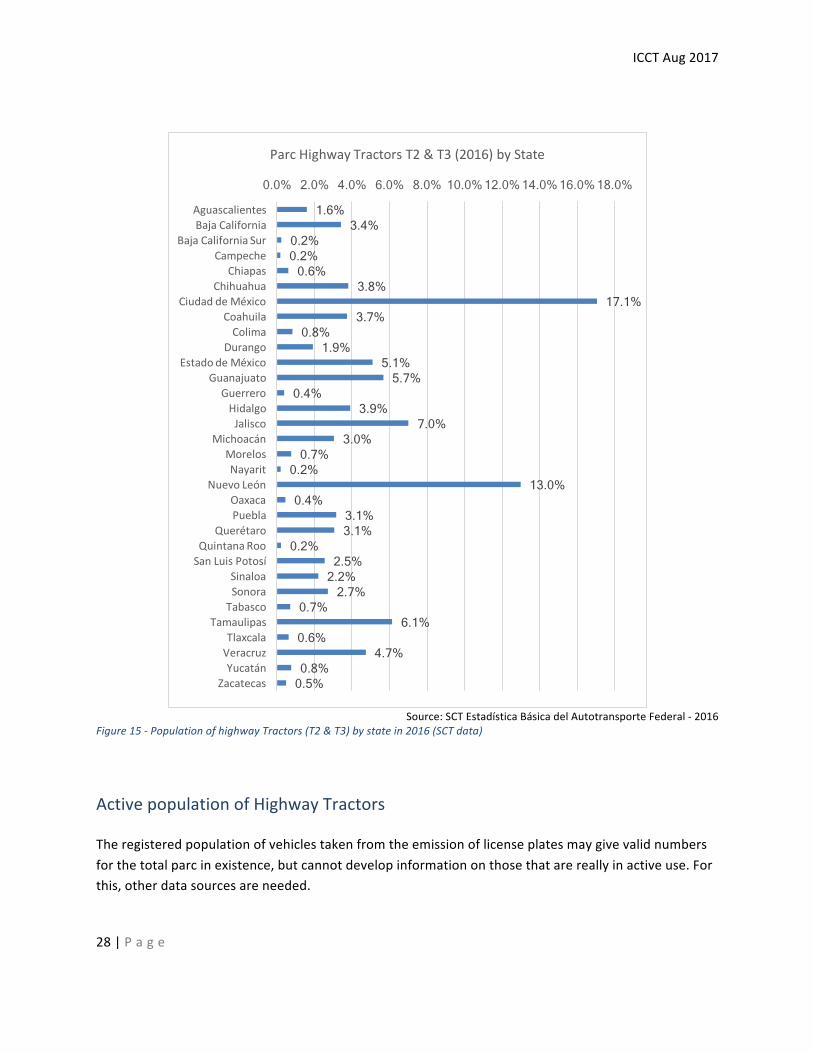
ICCTAug2017
28|P a g e
Source:SCTEstadísticaBásicadelAutotransporteFederal-2016
Figure15-PopulationofhighwayTractors(T2&T3)bystatein2016(SCTdata)
ActivepopulationofHighwayTractors
Theregisteredpopulationofvehiclestakenfromtheemissionoflicenseplatesmaygivevalidnumbersforthetotalparcinexistence,butcannotdevelopinformationonthosethatarereallyinactiveuse.Forthis,otherdatasourcesareneeded.
1.6% 3.4%
0.2% 0.2% 0.6%
3.8% 17.1%
3.7% 0.8%
1.9% 5.1% 5.7%
0.4% 3.9%
7.0% 3.0%
0.7% 0.2%
13.0% 0.4%
3.1% 3.1%
0.2% 2.5%
2.2% 2.7%
0.7% 6.1%
0.6% 4.7%
0.8% 0.5%
0.0% 2.0% 4.0% 6.0% 8.0% 10.0% 12.0% 14.0% 16.0% 18.0%
AguascalientesBajaCalifornia
BajaCaliforniaSurCampeche
ChiapasChihuahua
CiudaddeMéxicoCoahuilaColima
DurangoEstadodeMéxico
GuanajuatoGuerreroHidalgoJalisco
MichoacánMorelosNayarit
NuevoLeónOaxacaPuebla
QuerétaroQuintanaRooSanLuisPotosí
SinaloaSonoraTabasco
TamaulipasTlaxcalaVeracruzYucatán
Zacatecas
ParcHighwayTractorsT2&T3(2016)byState
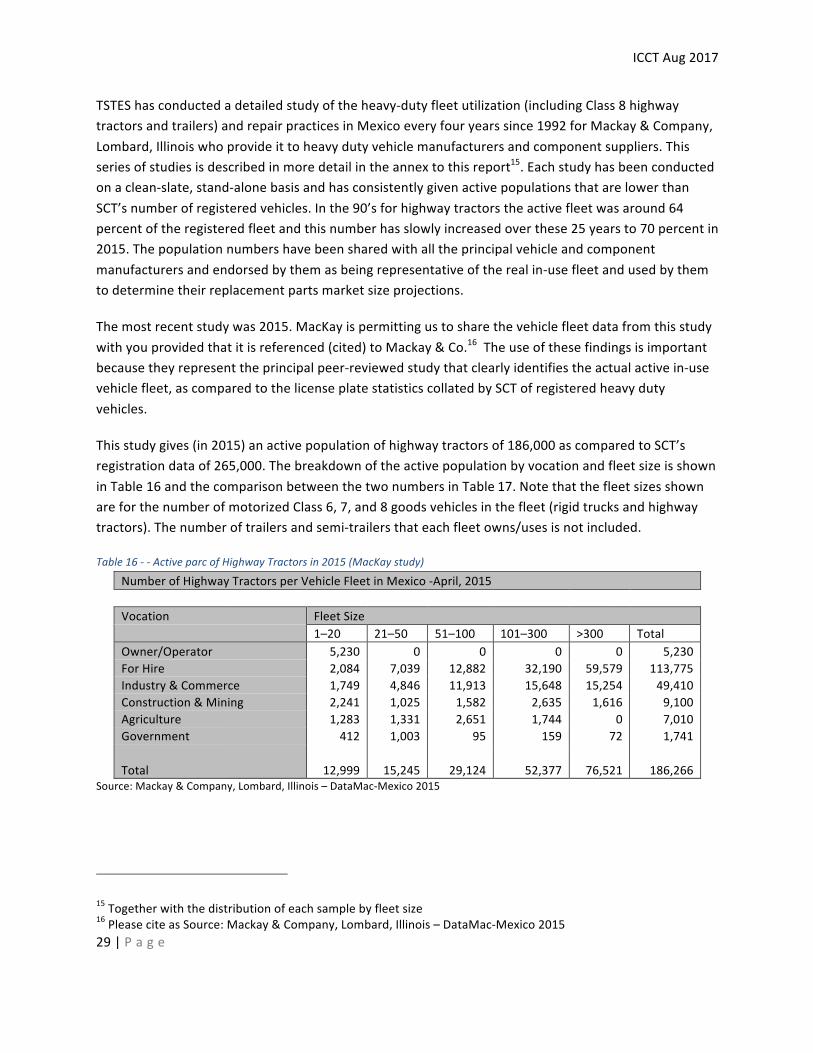
ICCTAug2017
29|P a g e
TSTEShasconductedadetailedstudyoftheheavy-dutyfleetutilization(includingClass8highwaytractorsandtrailers)andrepairpracticesinMexicoeveryfouryearssince1992forMackay&Company,Lombard,Illinoiswhoprovideittoheavydutyvehiclemanufacturersandcomponentsuppliers.Thisseriesofstudiesisdescribedinmoredetailintheannextothisreport15.Eachstudyhasbeenconductedonaclean-slate,stand-alonebasisandhasconsistentlygivenactivepopulationsthatarelowerthanSCT’snumberofregisteredvehicles.Inthe90’sforhighwaytractorstheactivefleetwasaround64percentoftheregisteredfleetandthisnumberhasslowlyincreasedoverthese25yearsto70percentin2015.Thepopulationnumbershavebeensharedwithalltheprincipalvehicleandcomponentmanufacturersandendorsedbythemasbeingrepresentativeoftherealin-usefleetandusedbythemtodeterminetheirreplacementpartsmarketsizeprojections.
Themostrecentstudywas2015.MacKayispermittingustosharethevehiclefleetdatafromthisstudywithyouprovidedthatitisreferenced(cited)toMackay&Co.16Theuseofthesefindingsisimportantbecausetheyrepresenttheprincipalpeer-reviewedstudythatclearlyidentifiestheactualactivein-usevehiclefleet,ascomparedtothelicenseplatestatisticscollatedbySCTofregisteredheavydutyvehicles.
Thisstudygives(in2015)anactivepopulationofhighwaytractorsof186,000ascomparedtoSCT’sregistrationdataof265,000.ThebreakdownoftheactivepopulationbyvocationandfleetsizeisshowninTable16andthecomparisonbetweenthetwonumbersinTable17.NotethatthefleetsizesshownareforthenumberofmotorizedClass6,7,and8goodsvehiclesinthefleet(rigidtrucksandhighwaytractors).Thenumberoftrailersandsemi-trailersthateachfleetowns/usesisnotincluded.
Table16--ActiveparcofHighwayTractorsin2015(MacKaystudy)
NumberofHighwayTractorsperVehicleFleetinMexico-April,2015 Vocation FleetSize 1–20 21–50 51–100 101–300 >300 TotalOwner/Operator 5,230 0 0 0 0 5,230ForHire 2,084 7,039 12,882 32,190 59,579 113,775Industry&Commerce 1,749 4,846 11,913 15,648 15,254 49,410Construction&Mining 2,241 1,025 1,582 2,635 1,616 9,100Agriculture 1,283 1,331 2,651 1,744 0 7,010Government 412 1,003 95 159 72 1,741 Total 12,999 15,245 29,124 52,377 76,521 186,266
Source:Mackay&Company,Lombard,Illinois–DataMac-Mexico2015
15Togetherwiththedistributionofeachsamplebyfleetsize16PleaseciteasSource:Mackay&Company,Lombard,Illinois–DataMac-Mexico2015
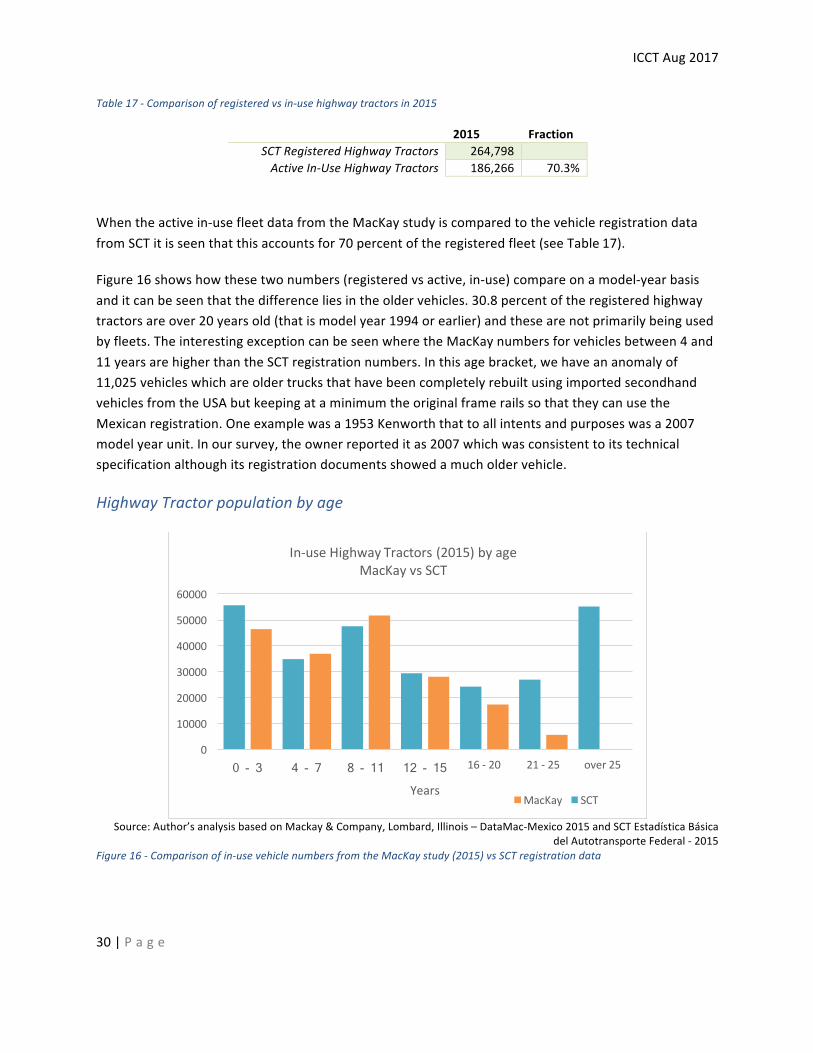
ICCTAug2017
30|P a g e
Table17-Comparisonofregisteredvsin-usehighwaytractorsin2015
2015 FractionSCTRegisteredHighwayTractors 264,798 ActiveIn-UseHighwayTractors 186,266 70.3%
Whentheactivein-usefleetdatafromtheMacKaystudyiscomparedtothevehicleregistrationdatafromSCTitisseenthatthisaccountsfor70percentoftheregisteredfleet(seeTable17).
Figure16showshowthesetwonumbers(registeredvsactive,in-use)compareonamodel-yearbasisanditcanbeseenthatthedifferenceliesintheoldervehicles.30.8percentoftheregisteredhighwaytractorsareover20yearsold(thatismodelyear1994orearlier)andthesearenotprimarilybeingusedbyfleets.TheinterestingexceptioncanbeseenwheretheMacKaynumbersforvehiclesbetween4and11yearsarehigherthantheSCTregistrationnumbers.Inthisagebracket,wehaveananomalyof11,025vehicleswhichareoldertrucksthathavebeencompletelyrebuiltusingimportedsecondhandvehiclesfromtheUSAbutkeepingataminimumtheoriginalframerailssothattheycanusetheMexicanregistration.Oneexamplewasa1953Kenworththattoallintentsandpurposeswasa2007modelyearunit.Inoursurvey,theownerreporteditas2007whichwasconsistenttoitstechnicalspecificationalthoughitsregistrationdocumentsshowedamucholdervehicle.
HighwayTractorpopulationbyage
Source:Author’sanalysisbasedonMackay&Company,Lombard,Illinois–DataMac-Mexico2015andSCTEstadísticaBásica
delAutotransporteFederal-2015Figure16-Comparisonofin-usevehiclenumbersfromtheMacKaystudy(2015)vsSCTregistrationdata
0
10000
20000
30000
40000
50000
60000
over2521- 2516- 2012 - 15 8 - 11 4 - 7 0 - 3 Years
In-useHighwayTractors(2015)byageMacKayvsSCT
MacKay SCT
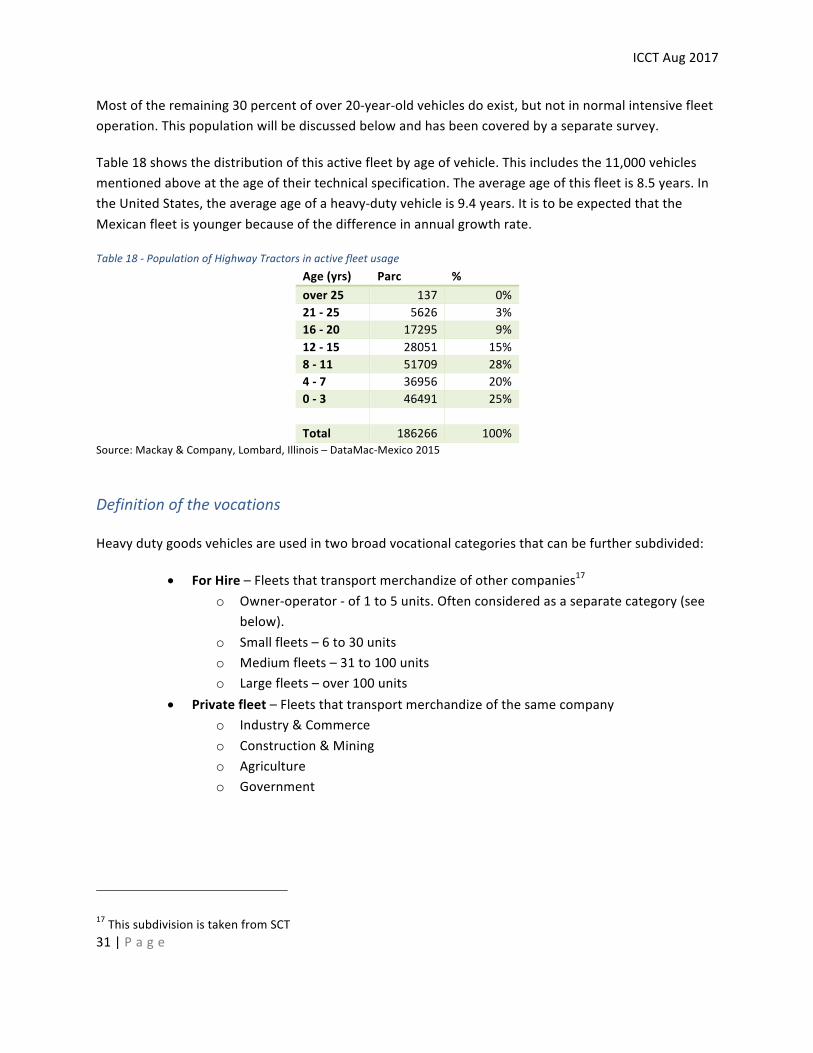
ICCTAug2017
31|P a g e
Mostoftheremaining30percentofover20-year-oldvehiclesdoexist,butnotinnormalintensivefleetoperation.Thispopulationwillbediscussedbelowandhasbeencoveredbyaseparatesurvey.
Table18showsthedistributionofthisactivefleetbyageofvehicle.Thisincludesthe11,000vehiclesmentionedaboveattheageoftheirtechnicalspecification.Theaverageageofthisfleetis8.5years.IntheUnitedStates,theaverageageofaheavy-dutyvehicleis9.4years.ItistobeexpectedthattheMexicanfleetisyoungerbecauseofthedifferenceinannualgrowthrate.
Table18-PopulationofHighwayTractorsinactivefleetusageAge(yrs) Parc %over25 137 0%21-25 5626 3%16-20 17295 9%12-15 28051 15%8-11 51709 28%4-7 36956 20%0-3 46491 25% Total 186266 100%
Source:Mackay&Company,Lombard,Illinois–DataMac-Mexico2015
Definitionofthevocations
Heavydutygoodsvehiclesareusedintwobroadvocationalcategoriesthatcanbefurthersubdivided:
• ForHire–Fleetsthattransportmerchandizeofothercompanies17o Owner-operator-of1to5units.Oftenconsideredasaseparatecategory(see
below).o Smallfleets–6to30unitso Mediumfleets–31to100unitso Largefleets–over100units
• Privatefleet–Fleetsthattransportmerchandizeofthesamecompanyo Industry&Commerceo Construction&Miningo Agricultureo Government
17ThissubdivisionistakenfromSCT
ICCTAug2017
32|P a g e
Owner-operators
Owner-operatorsarethosepeoplethatownandoperatetheirowntruckingbusiness.Theyarefreetoeitherhaulfreelance(non-committaltoanyonefirmorproduct),orenterintoaleaseagreementtodedicatetheirequipmenttoonecustomerorproduct.Thereareapproximately350,000owner-operatorsregisteredintheUnitedStatesand114,308registeredforfreightinMexico18.
IntheUSA,ifanowner-operatoroperatesundertheirownauthoritytheywillhaveaDepartmentofTransportation(DOT)andMotorCarrier(MC)numberidentifyingthemasaregisteredcarrier.However,mostleaseontolargercarriersandoperateunderthatcarriersDOTnumber.Ontheotherhand,ProfessionalEmployeeDrivers(PEDs)donotownoroperatetheirowntruckandtrailer,nordotheyhaveaDOTorMCnumber.Instead,theyworkdirectlyforacarrierasanemployee.
IntheUSA,owner-operatorsdifferfromPEDsinthattheytypically19:• Arebettereducated(with45percenthavingcollegeeducation)• Haveahigherincome(netaverageincomeover$50,000vs$38,000to40,000foraPED• Aremostlikelytoownpremiumvehicles(PeterbuiltorKenworth)oftenoutfittedwith
accessories• Aremostlikelytohavehigherpoweredengines(69percentwith450BHPormore)• Haveasubstantialinvestmentintheirvehicles(with66percentfullypaidoff)• Areawayfromhomea100+nightsayearwith41%spendingoveratleast200nights
awayfromhome• Typicallyoperatefulltruck-loadshipments
InMexico,owner-operatorsalsooperateundertheirownauthority.However,theytypicallydonothaveaccesstofinanceandlackthispremiumstatus.
InMexico,owner-operatorstypically:• Operateonacash-flowbasiswithlittleornofinancialplanning• Donothaveacollegeeducation• Ownanduse20yearorolderhighwaytractorsandtrailerswhichtheyboughtsecond
hand• Areaffiliatedtootherowner-operatorsintoalooseknitfleetforcommercialpurposes.• Operateonlessattractiveroutesandfeederoperationswherelargerfleetsdonot
participateorcompeteasmuch.• Oftenoperateonlessthantruckloadbasis.• Oftenoperatewithintheinformalsector.
18Source:SCTESTADÍSTICABÁSICADELAUTOTRANSPORTEFEDERAL201619Source:OOIDAFoundation(seehttp://www.ooida.com/OOIDA%20Foundation/RecentResearch/OOfacts.asp)
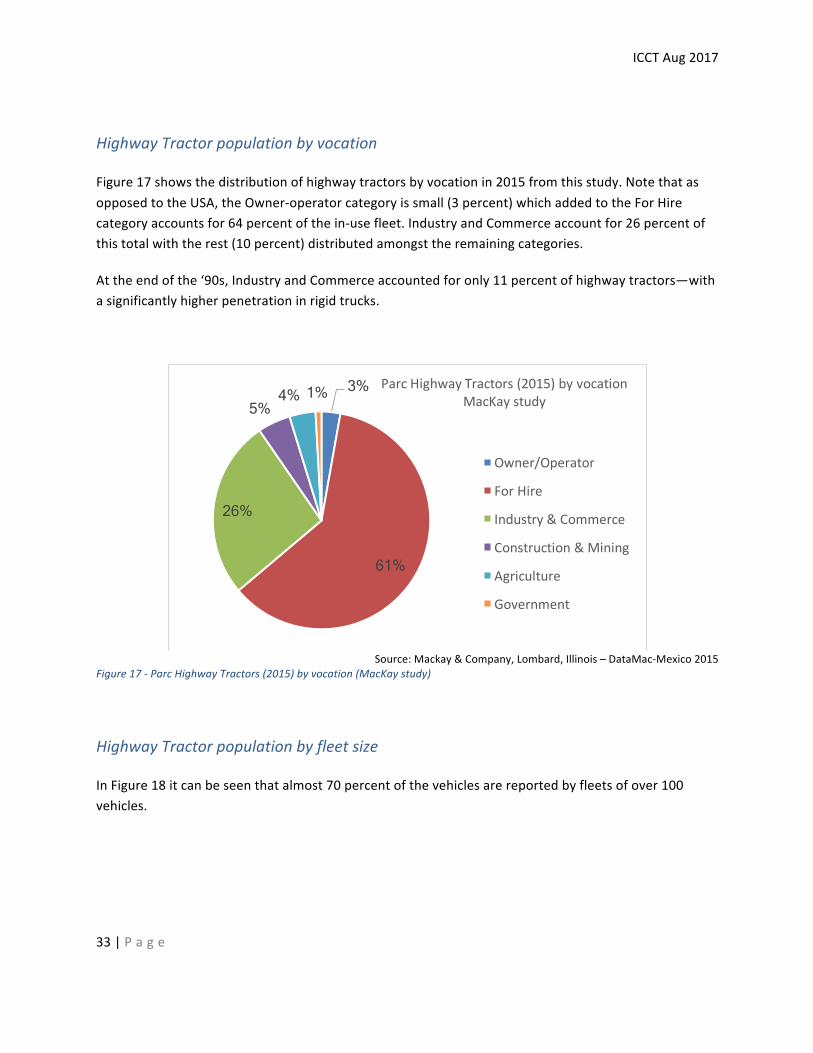
ICCTAug2017
33|P a g e
HighwayTractorpopulationbyvocation
Figure17showsthedistributionofhighwaytractorsbyvocationin2015fromthisstudy.NotethatasopposedtotheUSA,theOwner-operatorcategoryissmall(3percent)whichaddedtotheForHirecategoryaccountsfor64percentofthein-usefleet.IndustryandCommerceaccountfor26percentofthistotalwiththerest(10percent)distributedamongsttheremainingcategories.
Attheendofthe‘90s,IndustryandCommerceaccountedforonly11percentofhighwaytractors—withasignificantlyhigherpenetrationinrigidtrucks.
Source:Mackay&Company,Lombard,Illinois–DataMac-Mexico2015
Figure17-ParcHighwayTractors(2015)byvocation(MacKaystudy)
HighwayTractorpopulationbyfleetsize
InFigure18itcanbeseenthatalmost70percentofthevehiclesarereportedbyfleetsofover100vehicles.
3%
61%
26%
5% 4% 1% ParcHighwayTractors(2015)byvocation
MacKaystudy
Owner/Operator
ForHire
Industry&Commerce
Construction&Mining
Agriculture
Government
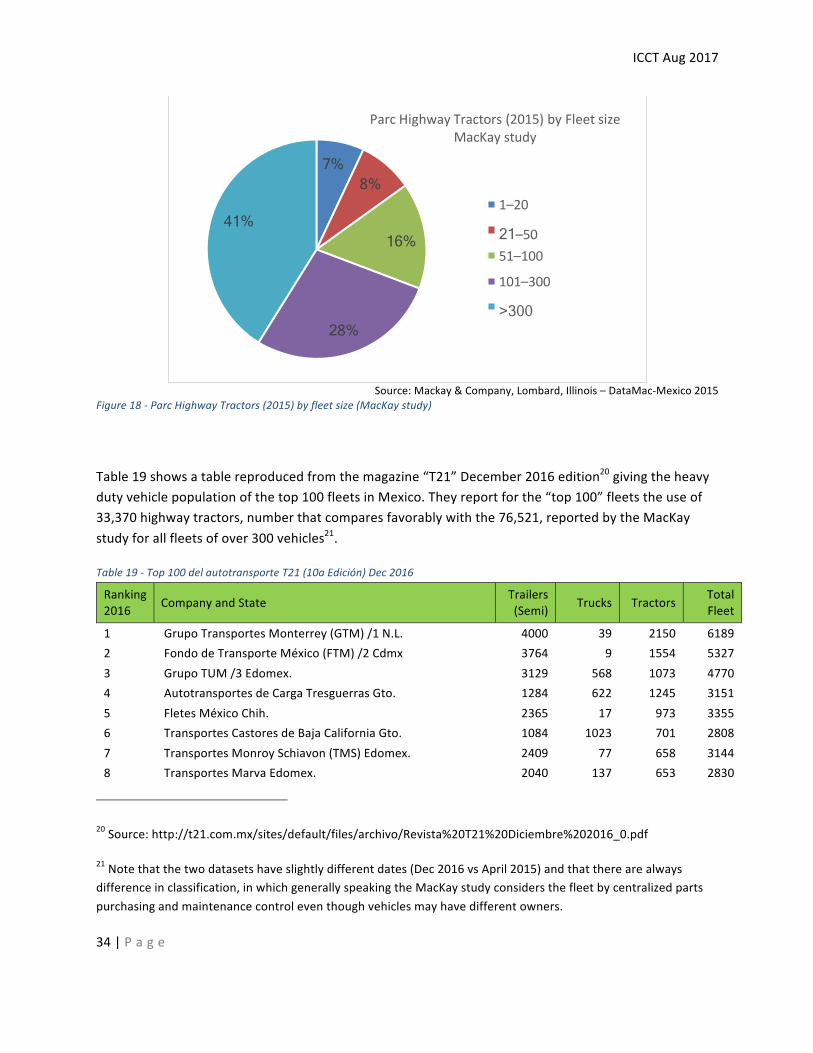
ICCTAug2017
34|P a g e
Source:Mackay&Company,Lombard,Illinois–DataMac-Mexico2015
Figure18-ParcHighwayTractors(2015)byfleetsize(MacKaystudy)
Table19showsatablereproducedfromthemagazine“T21”December2016edition20givingtheheavydutyvehiclepopulationofthetop100fleetsinMexico.Theyreportforthe“top100”fleetstheuseof33,370highwaytractors,numberthatcomparesfavorablywiththe76,521,reportedbytheMacKaystudyforallfleetsofover300vehicles21.
Table19-Top100delautotransporteT21(10aEdición)Dec2016
Ranking2016 CompanyandState Trailers
(Semi) Trucks Tractors TotalFleet
1 GrupoTransportesMonterrey(GTM)/1N.L. 4000 39 2150 61892 FondodeTransporteMéxico(FTM)/2Cdmx 3764 9 1554 53273 GrupoTUM/3Edomex. 3129 568 1073 47704 AutotransportesdeCargaTresguerrasGto. 1284 622 1245 31515 FletesMéxicoChih. 2365 17 973 33556 TransportesCastoresdeBajaCaliforniaGto. 1084 1023 701 28087 TransportesMonroySchiavon(TMS)Edomex. 2409 77 658 31448 TransportesMarvaEdomex. 2040 137 653 2830
20Source:http://t21.com.mx/sites/default/files/archivo/Revista%20T21%20Diciembre%202016_0.pdf
21Notethatthetwodatasetshaveslightlydifferentdates(Dec2016vsApril2015)andthattherearealwaysdifferenceinclassification,inwhichgenerallyspeakingtheMacKaystudyconsidersthefleetbycentralizedpartspurchasingandmaintenancecontroleventhoughvehiclesmayhavedifferentowners.
7% 8%
16%
28%
41%
ParcHighwayTractors(2015)byFleetsizeMacKaystudy
1–20
21–50 51–100
101–300
>300
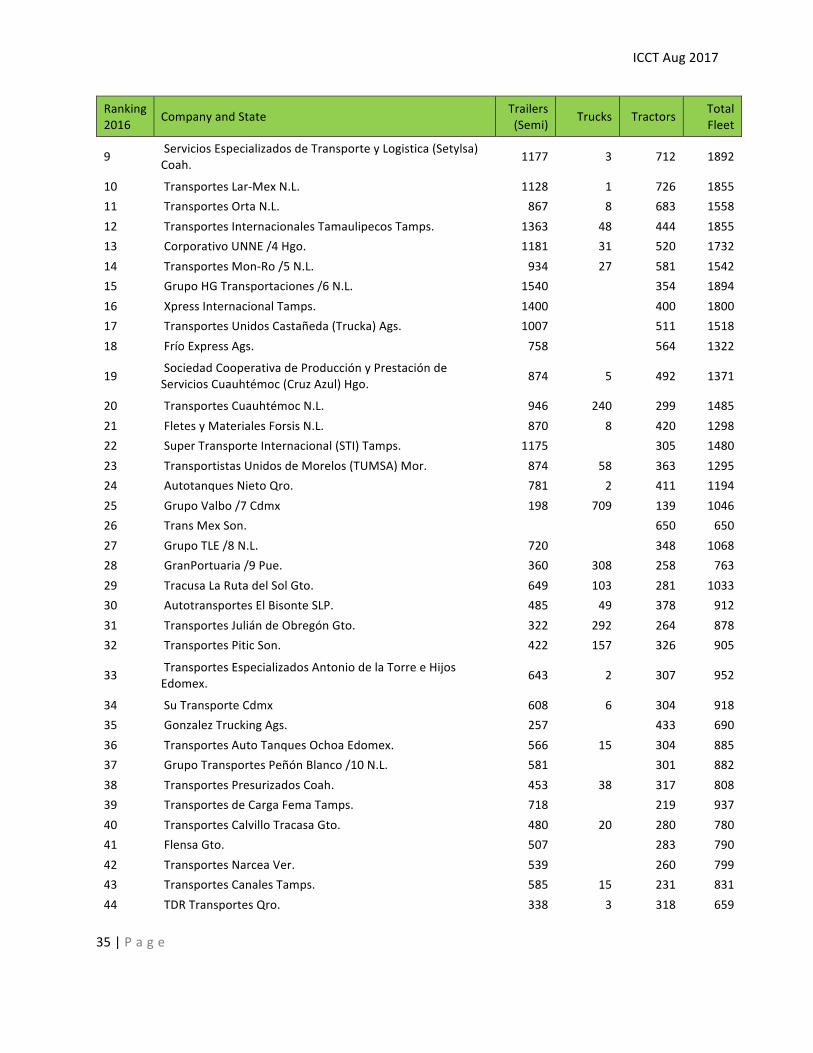
ICCTAug2017
35|P a g e
Ranking2016 CompanyandState Trailers
(Semi) Trucks Tractors TotalFleet
9 ServiciosEspecializadosdeTransporteyLogistica(Setylsa)Coah. 1177 3 712 1892
10 TransportesLar-MexN.L. 1128 1 726 185511 TransportesOrtaN.L. 867 8 683 155812 TransportesInternacionalesTamaulipecosTamps. 1363 48 444 185513 CorporativoUNNE/4Hgo. 1181 31 520 173214 TransportesMon-Ro/5N.L. 934 27 581 154215 GrupoHGTransportaciones/6N.L. 1540 354 189416 XpressInternacionalTamps. 1400 400 180017 TransportesUnidosCastañeda(Trucka)Ags. 1007 511 151818 FríoExpressAgs. 758 564 1322
19 SociedadCooperativadeProducciónyPrestacióndeServiciosCuauhtémoc(CruzAzul)Hgo. 874 5 492 1371
20 TransportesCuauhtémocN.L. 946 240 299 148521 FletesyMaterialesForsisN.L. 870 8 420 129822 SuperTransporteInternacional(STI)Tamps. 1175 305 148023 TransportistasUnidosdeMorelos(TUMSA)Mor. 874 58 363 129524 AutotanquesNietoQro. 781 2 411 119425 GrupoValbo/7Cdmx 198 709 139 104626 TransMexSon. 650 65027 GrupoTLE/8N.L. 720 348 106828 GranPortuaria/9Pue. 360 308 258 76329 TracusaLaRutadelSolGto. 649 103 281 103330 AutotransportesElBisonteSLP. 485 49 378 91231 TransportesJuliándeObregónGto. 322 292 264 87832 TransportesPiticSon. 422 157 326 905
33 TransportesEspecializadosAntoniodelaTorreeHijosEdomex. 643 2 307 952
34 SuTransporteCdmx 608 6 304 91835 GonzalezTruckingAgs. 257 433 69036 TransportesAutoTanquesOchoaEdomex. 566 15 304 88537 GrupoTransportesPeñónBlanco/10N.L. 581 301 88238 TransportesPresurizadosCoah. 453 38 317 80839 TransportesdeCargaFemaTamps. 718 219 93740 TransportesCalvilloTracasaGto. 480 20 280 78041 FlensaGto. 507 283 79042 TransportesNarceaVer. 539 260 79943 TransportesCanalesTamps. 585 15 231 83144 TDRTransportesQro. 338 3 318 659
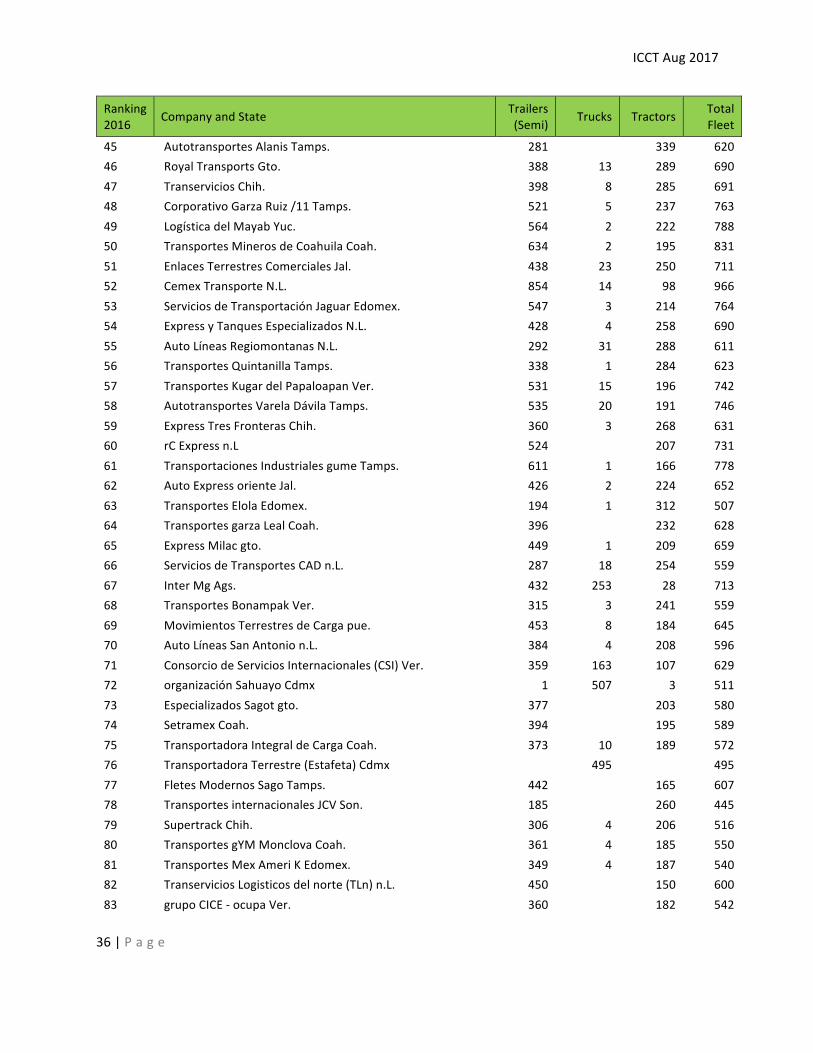
ICCTAug2017
36|P a g e
Ranking2016 CompanyandState Trailers
(Semi) Trucks Tractors TotalFleet
45 AutotransportesAlanisTamps. 281 339 62046 RoyalTransportsGto. 388 13 289 69047 TranserviciosChih. 398 8 285 69148 CorporativoGarzaRuiz/11Tamps. 521 5 237 76349 LogísticadelMayabYuc. 564 2 222 78850 TransportesMinerosdeCoahuilaCoah. 634 2 195 83151 EnlacesTerrestresComercialesJal. 438 23 250 71152 CemexTransporteN.L. 854 14 98 96653 ServiciosdeTransportaciónJaguarEdomex. 547 3 214 76454 ExpressyTanquesEspecializadosN.L. 428 4 258 69055 AutoLíneasRegiomontanasN.L. 292 31 288 61156 TransportesQuintanillaTamps. 338 1 284 62357 TransportesKugardelPapaloapanVer. 531 15 196 74258 AutotransportesVarelaDávilaTamps. 535 20 191 74659 ExpressTresFronterasChih. 360 3 268 63160 rCExpressn.L 524 207 73161 TransportacionesIndustrialesgumeTamps. 611 1 166 77862 AutoExpressorienteJal. 426 2 224 65263 TransportesElolaEdomex. 194 1 312 50764 TransportesgarzaLealCoah. 396 232 62865 ExpressMilacgto. 449 1 209 65966 ServiciosdeTransportesCADn.L. 287 18 254 55967 InterMgAgs. 432 253 28 71368 TransportesBonampakVer. 315 3 241 55969 MovimientosTerrestresdeCargapue. 453 8 184 64570 AutoLíneasSanAntonion.L. 384 4 208 59671 ConsorciodeServiciosInternacionales(CSI)Ver. 359 163 107 62972 organizaciónSahuayoCdmx 1 507 3 51173 EspecializadosSagotgto. 377 203 58074 SetramexCoah. 394 195 58975 TransportadoraIntegraldeCargaCoah. 373 10 189 57276 TransportadoraTerrestre(Estafeta)Cdmx 495 49577 FletesModernosSagoTamps. 442 165 60778 TransportesinternacionalesJCVSon. 185 260 44579 SupertrackChih. 306 4 206 51680 TransportesgYMMonclovaCoah. 361 4 185 55081 TransportesMexAmeriKEdomex. 349 4 187 54082 TranserviciosLogisticosdelnorte(TLn)n.L. 450 150 60083 grupoCICE-ocupaVer. 360 182 542
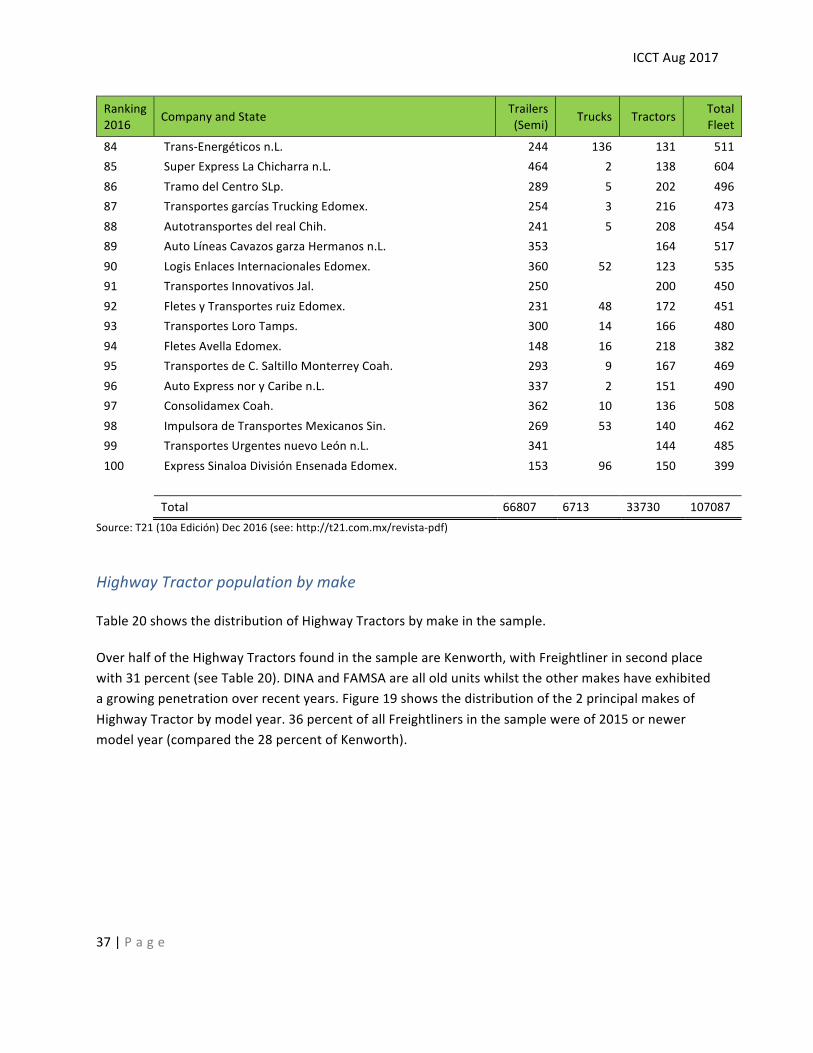
ICCTAug2017
37|P a g e
Ranking2016 CompanyandState Trailers
(Semi) Trucks Tractors TotalFleet
84 Trans-Energéticosn.L. 244 136 131 51185 SuperExpressLaChicharran.L. 464 2 138 60486 TramodelCentroSLp. 289 5 202 49687 TransportesgarcíasTruckingEdomex. 254 3 216 47388 AutotransportesdelrealChih. 241 5 208 45489 AutoLíneasCavazosgarzaHermanosn.L. 353 164 51790 LogisEnlacesInternacionalesEdomex. 360 52 123 53591 TransportesInnovativosJal. 250 200 45092 FletesyTransportesruizEdomex. 231 48 172 45193 TransportesLoroTamps. 300 14 166 48094 FletesAvellaEdomex. 148 16 218 38295 TransportesdeC.SaltilloMonterreyCoah. 293 9 167 46996 AutoExpressnoryCariben.L. 337 2 151 49097 ConsolidamexCoah. 362 10 136 50898 ImpulsoradeTransportesMexicanosSin. 269 53 140 46299 TransportesUrgentesnuevoLeónn.L. 341 144 485100 ExpressSinaloaDivisiónEnsenadaEdomex. 153 96 150 399
Total 66807 6713 33730 107087Source:T21(10aEdición)Dec2016(see:http://t21.com.mx/revista-pdf)
HighwayTractorpopulationbymake
Table20showsthedistributionofHighwayTractorsbymakeinthesample.
OverhalfoftheHighwayTractorsfoundinthesampleareKenworth,withFreightlinerinsecondplacewith31percent(seeTable20).DINAandFAMSAarealloldunitswhilsttheothermakeshaveexhibitedagrowingpenetrationoverrecentyears.Figure19showsthedistributionofthe2principalmakesofHighwayTractorbymodelyear.36percentofallFreightlinersinthesamplewereof2015ornewermodelyear(comparedthe28percentofKenworth).
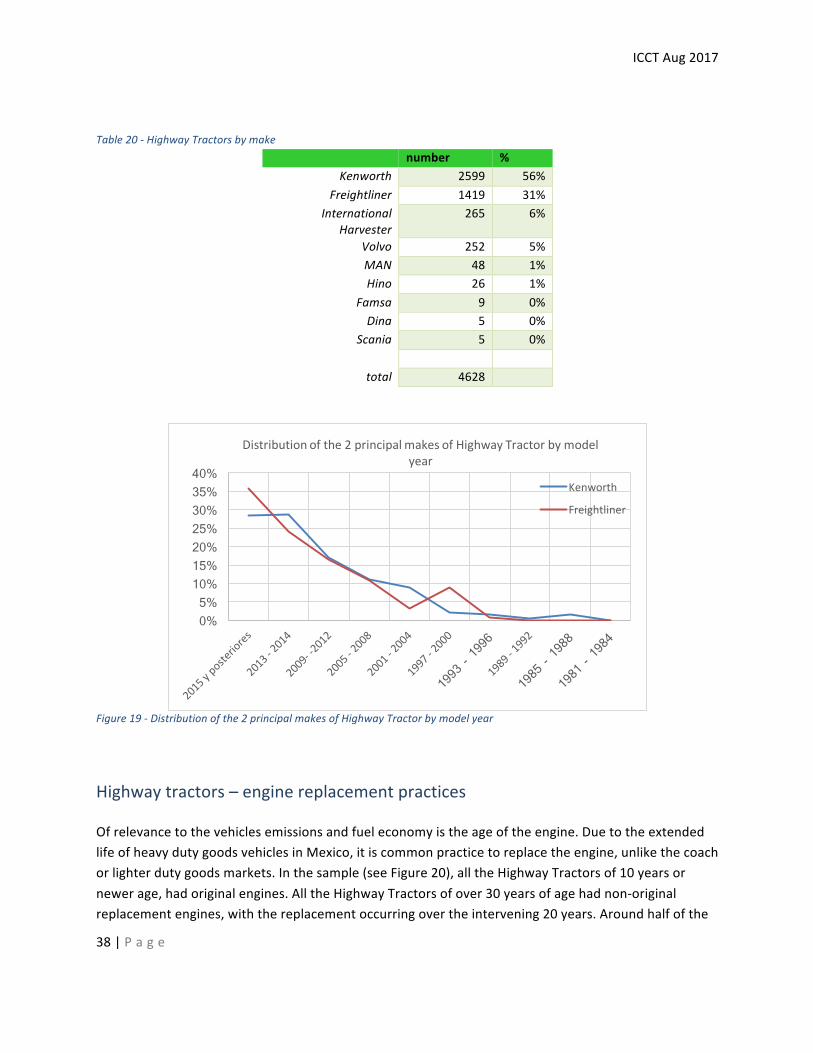
ICCTAug2017
38|P a g e
Table20-HighwayTractorsbymake number %
Kenworth 2599 56%Freightliner 1419 31%
InternationalHarvester
265 6%
Volvo 252 5%MAN 48 1%Hino 26 1%
Famsa 9 0%Dina 5 0%
Scania 5 0%
total 4628
Figure19-Distributionofthe2principalmakesofHighwayTractorbymodelyear
Highwaytractors–enginereplacementpractices
Ofrelevancetothevehiclesemissionsandfueleconomyistheageoftheengine.DuetotheextendedlifeofheavydutygoodsvehiclesinMexico,itiscommonpracticetoreplacetheengine,unlikethecoachorlighterdutygoodsmarkets.Inthesample(seeFigure20),alltheHighwayTractorsof10yearsornewerage,hadoriginalengines.AlltheHighwayTractorsofover30yearsofagehadnon-originalreplacementengines,withthereplacementoccurringovertheintervening20years.Aroundhalfofthe
0% 5%
10% 15% 20% 25% 30% 35% 40%
Distributionofthe2principalmakesofHighwayTractorbymodelyear
Kenworth
Freightliner
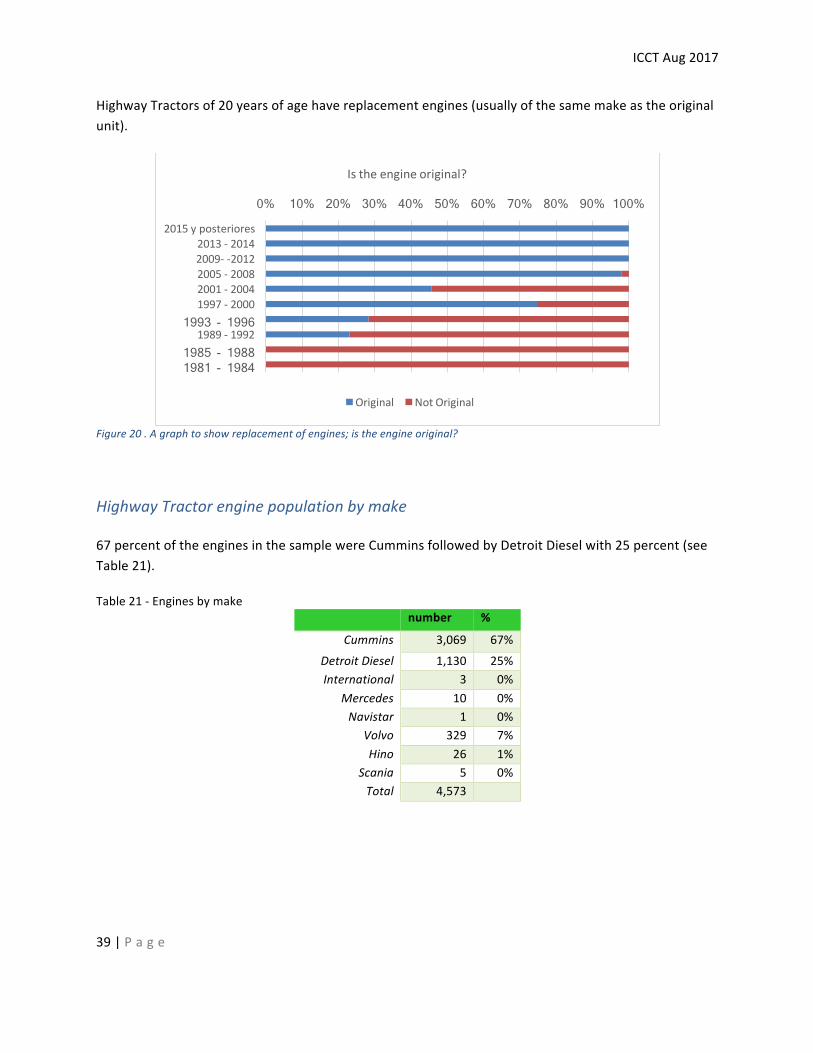
ICCTAug2017
39|P a g e
HighwayTractorsof20yearsofagehavereplacementengines(usuallyofthesamemakeastheoriginalunit).
Figure20.Agraphtoshowreplacementofengines;istheengineoriginal?
HighwayTractorenginepopulationbymake
67percentoftheenginesinthesamplewereCumminsfollowedbyDetroitDieselwith25percent(seeTable21).
Table21-Enginesbymake number %
Cummins 3,069 67%DetroitDiesel 1,130 25%International 3 0%
Mercedes 10 0%Navistar 1 0%
Volvo 329 7%Hino 26 1%
Scania 5 0%Total 4,573
0% 10% 20% 30% 40% 50% 60% 70% 80% 90% 100%
2015yposteriores2013- 20142009- -20122005- 20082001- 20041997- 2000
1993 - 1996 1989- 1992
1985 - 1988 1981 - 1984
Istheengineoriginal?
Original NotOriginal
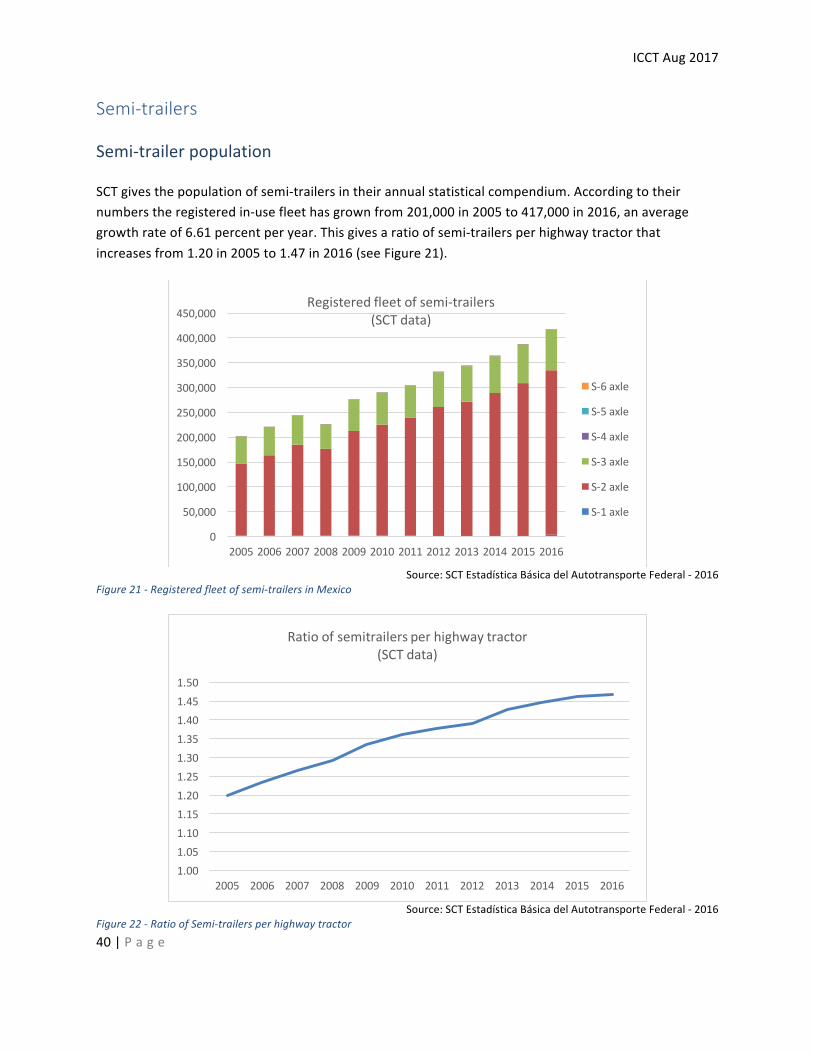
ICCTAug2017
40|P a g e
Semi-trailers
Semi-trailerpopulation
SCTgivesthepopulationofsemi-trailersintheirannualstatisticalcompendium.Accordingtotheirnumberstheregisteredin-usefleethasgrownfrom201,000in2005to417,000in2016,anaveragegrowthrateof6.61percentperyear.Thisgivesaratioofsemi-trailersperhighwaytractorthatincreasesfrom1.20in2005to1.47in2016(seeFigure21).
Source:SCTEstadísticaBásicadelAutotransporteFederal-2016
Figure21-Registeredfleetofsemi-trailersinMexico
Source:SCTEstadísticaBásicadelAutotransporteFederal-2016
Figure22-RatioofSemi-trailersperhighwaytractor
0
50,000
100,000
150,000
200,000
250,000
300,000
350,000
400,000
450,000
2005 2006 2007 2008 2009 2010 2011 2012 2013 2014 2015 2016
Registeredfleetofsemi-trailers(SCTdata)
S-6axle
S-5axle
S-4axle
S-3axle
S-2axle
S-1axle
1.001.051.101.151.201.251.301.351.401.451.50
2005 2006 2007 2008 2009 2010 2011 2012 2013 2014 2015 2016
Ratioofsemitrailersperhighwaytractor(SCTdata)
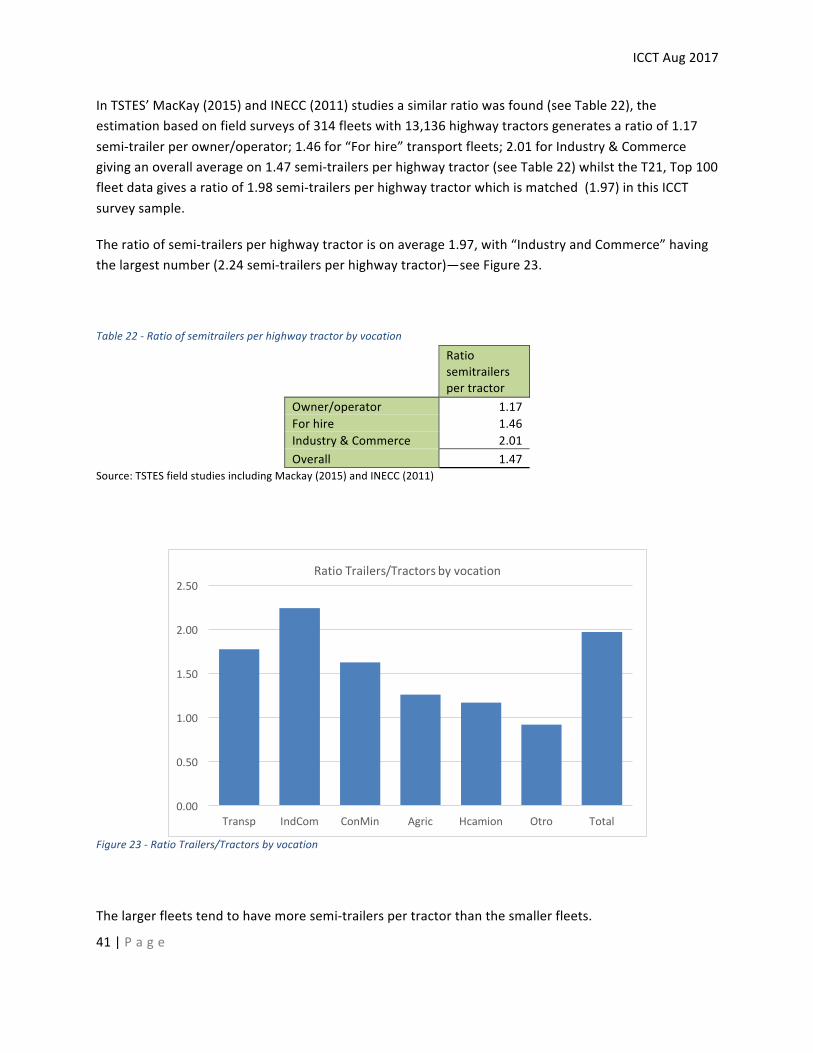
ICCTAug2017
41|P a g e
InTSTES’MacKay(2015)andINECC(2011)studiesasimilarratiowasfound(seeTable22),theestimationbasedonfieldsurveysof314fleetswith13,136highwaytractorsgeneratesaratioof1.17semi-trailerperowner/operator;1.46for“Forhire”transportfleets;2.01forIndustry&Commercegivinganoverallaverageon1.47semi-trailersperhighwaytractor(seeTable22)whilsttheT21,Top100fleetdatagivesaratioof1.98semi-trailersperhighwaytractorwhichismatched(1.97)inthisICCTsurveysample.
Theratioofsemi-trailersperhighwaytractorisonaverage1.97,with“IndustryandCommerce”havingthelargestnumber(2.24semi-trailersperhighwaytractor)—seeFigure23.
Table22-Ratioofsemitrailersperhighwaytractorbyvocation
Ratiosemitrailerspertractor
Owner/operator 1.17Forhire 1.46Industry&Commerce 2.01Overall 1.47
Source:TSTESfieldstudiesincludingMackay(2015)andINECC(2011)
Figure23-RatioTrailers/Tractorsbyvocation
Thelargerfleetstendtohavemoresemi-trailerspertractorthanthesmallerfleets.
0.00
0.50
1.00
1.50
2.00
2.50
Transp IndCom ConMin Agric Hcamion Otro Total
RatioTrailers/Tractorsbyvocation
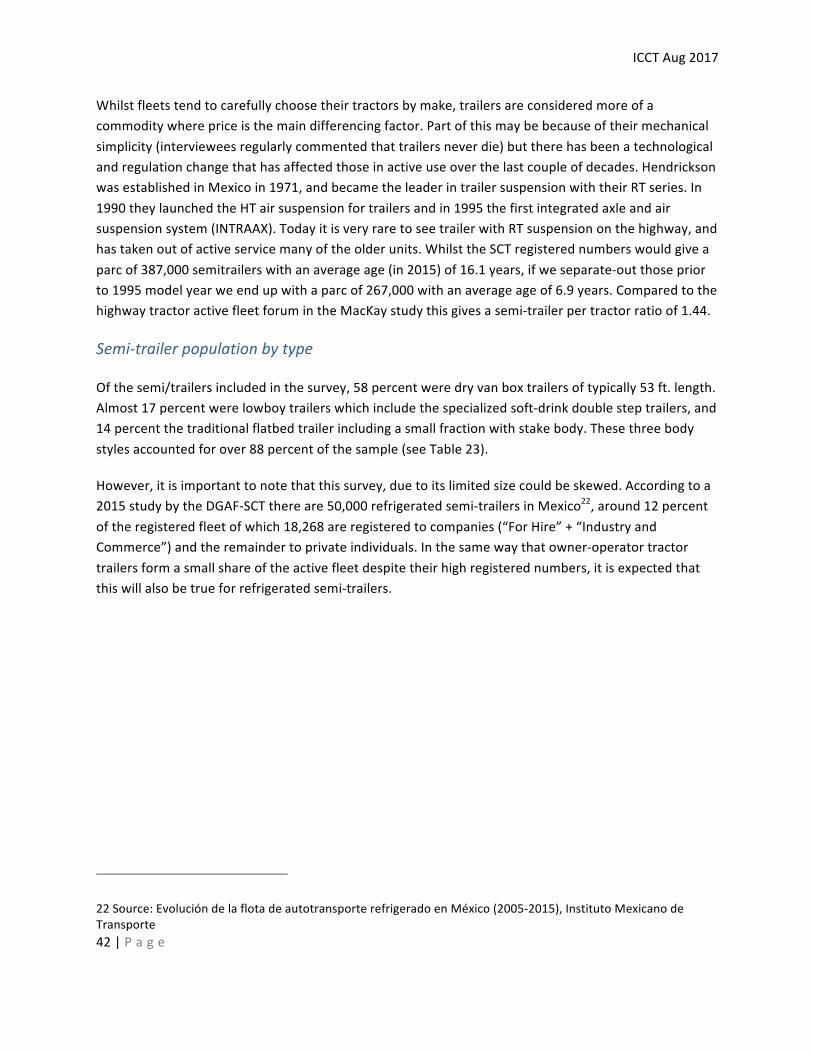
ICCTAug2017
42|P a g e
Whilstfleetstendtocarefullychoosetheirtractorsbymake,trailersareconsideredmoreofacommoditywherepriceisthemaindifferencingfactor.Partofthismaybebecauseoftheirmechanicalsimplicity(intervieweesregularlycommentedthattrailersneverdie)buttherehasbeenatechnologicalandregulationchangethathasaffectedthoseinactiveuseoverthelastcoupleofdecades.HendricksonwasestablishedinMexicoin1971,andbecametheleaderintrailersuspensionwiththeirRTseries.In1990theylaunchedtheHTairsuspensionfortrailersandin1995thefirstintegratedaxleandairsuspensionsystem(INTRAAX).TodayitisveryraretoseetrailerwithRTsuspensiononthehighway,andhastakenoutofactiveservicemanyoftheolderunits.WhilsttheSCTregisterednumberswouldgiveaparcof387,000semitrailerswithanaverageage(in2015)of16.1years,ifweseparate-outthosepriorto1995modelyearweendupwithaparcof267,000withanaverageageof6.9years.ComparedtothehighwaytractoractivefleetforumintheMacKaystudythisgivesasemi-trailerpertractorratioof1.44.
Semi-trailerpopulationbytype
Ofthesemi/trailersincludedinthesurvey,58percentweredryvanboxtrailersoftypically53ft.length.Almost17percentwerelowboytrailerswhichincludethespecializedsoft-drinkdoublesteptrailers,and14percentthetraditionalflatbedtrailerincludingasmallfractionwithstakebody.Thesethreebodystylesaccountedforover88percentofthesample(seeTable23).
However,itisimportanttonotethatthissurvey,duetoitslimitedsizecouldbeskewed.Accordingtoa2015studybytheDGAF-SCTthereare50,000refrigeratedsemi-trailersinMexico22,around12percentoftheregisteredfleetofwhich18,268areregisteredtocompanies(“ForHire”+“IndustryandCommerce”)andtheremaindertoprivateindividuals.Inthesamewaythatowner-operatortractortrailersformasmallshareoftheactivefleetdespitetheirhighregisterednumbers,itisexpectedthatthiswillalsobetrueforrefrigeratedsemi-trailers.
22Source:EvolucióndelaflotadeautotransporterefrigeradoenMéxico(2005-2015),InstitutoMexicanodeTransporte
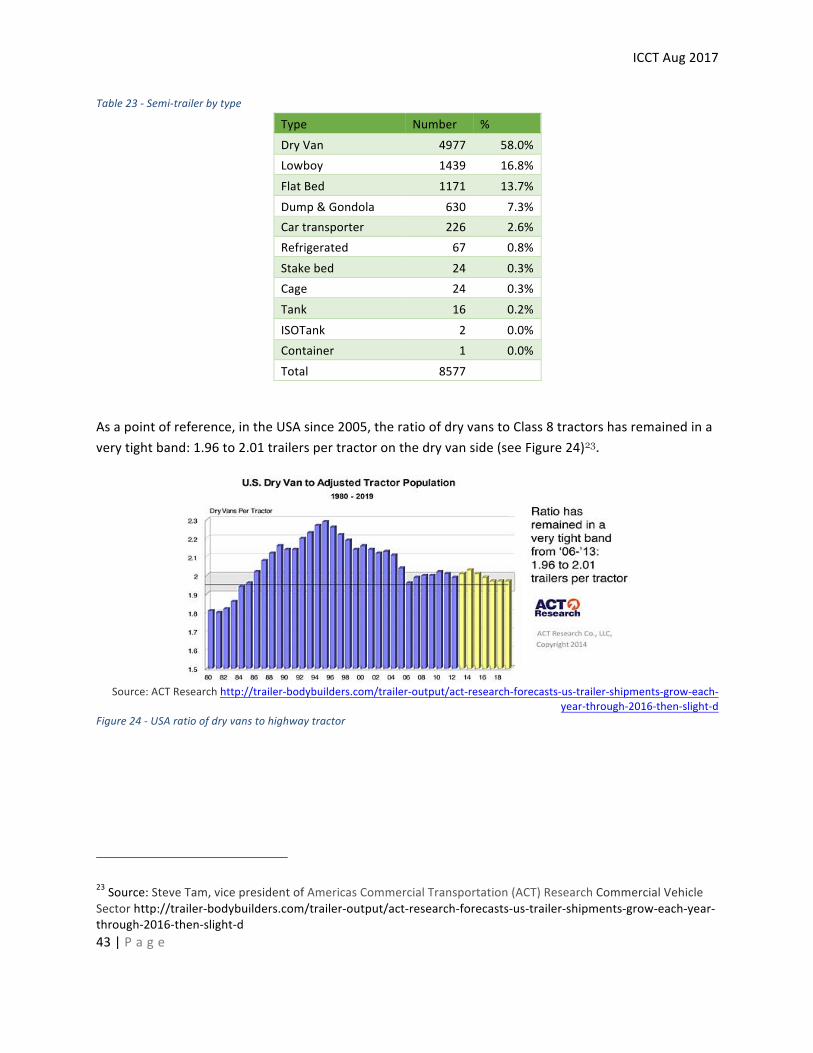
ICCTAug2017
43|P a g e
Table23-Semi-trailerbytype
Type Number %DryVan 4977 58.0%Lowboy 1439 16.8%FlatBed 1171 13.7%Dump&Gondola 630 7.3%Cartransporter 226 2.6%Refrigerated 67 0.8%Stakebed 24 0.3%Cage 24 0.3%Tank 16 0.2%ISOTank 2 0.0%Container 1 0.0%Total 8577
Asapointofreference,intheUSAsince2005,theratioofdryvanstoClass8tractorshasremainedinaverytightband:1.96to2.01trailerspertractoronthedryvanside(seeFigure24)23.
Source:ACTResearchhttp://trailer-bodybuilders.com/trailer-output/act-research-forecasts-us-trailer-shipments-grow-each-
year-through-2016-then-slight-dFigure24-USAratioofdryvanstohighwaytractor
23Source:SteveTam,vicepresidentofAmericasCommercialTransportation(ACT)ResearchCommercialVehicleSectorhttp://trailer-bodybuilders.com/trailer-output/act-research-forecasts-us-trailer-shipments-grow-each-year-through-2016-then-slight-d
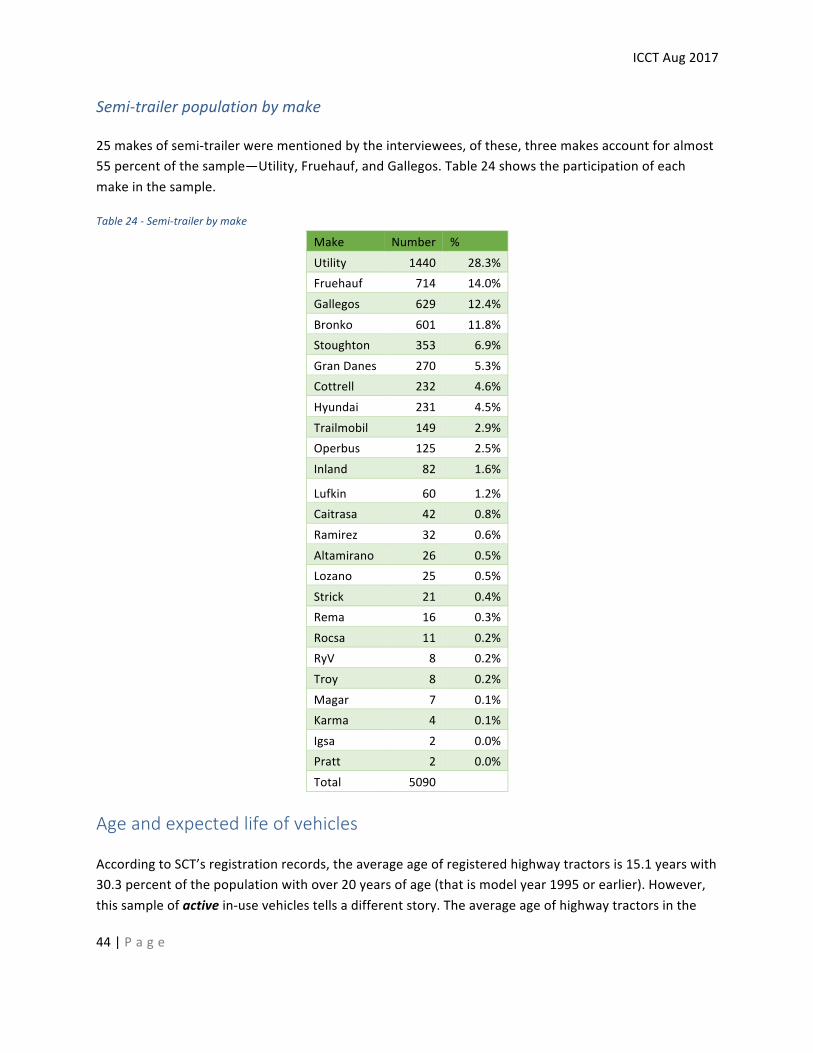
ICCTAug2017
44|P a g e
Semi-trailerpopulationbymake
25makesofsemi-trailerwerementionedbytheinterviewees,ofthese,threemakesaccountforalmost55percentofthesample—Utility,Fruehauf,andGallegos.Table24showstheparticipationofeachmakeinthesample.
Table24-Semi-trailerbymake
Make Number %Utility 1440 28.3%Fruehauf 714 14.0%Gallegos 629 12.4%Bronko 601 11.8%Stoughton 353 6.9%GranDanes 270 5.3%Cottrell 232 4.6%Hyundai 231 4.5%Trailmobil 149 2.9%Operbus 125 2.5%Inland 82 1.6%
Lufkin 60 1.2%Caitrasa 42 0.8%Ramirez 32 0.6%Altamirano 26 0.5%Lozano 25 0.5%Strick 21 0.4%Rema 16 0.3%Rocsa 11 0.2%RyV 8 0.2%Troy 8 0.2%Magar 7 0.1%Karma 4 0.1%Igsa 2 0.0%Pratt 2 0.0%Total 5090
Ageandexpectedlifeofvehicles
AccordingtoSCT’sregistrationrecords,theaverageageofregisteredhighwaytractorsis15.1yearswith30.3percentofthepopulationwithover20yearsofage(thatismodelyear1995orearlier).However,thissampleofactivein-usevehiclestellsadifferentstory.Theaverageageofhighwaytractorsinthe
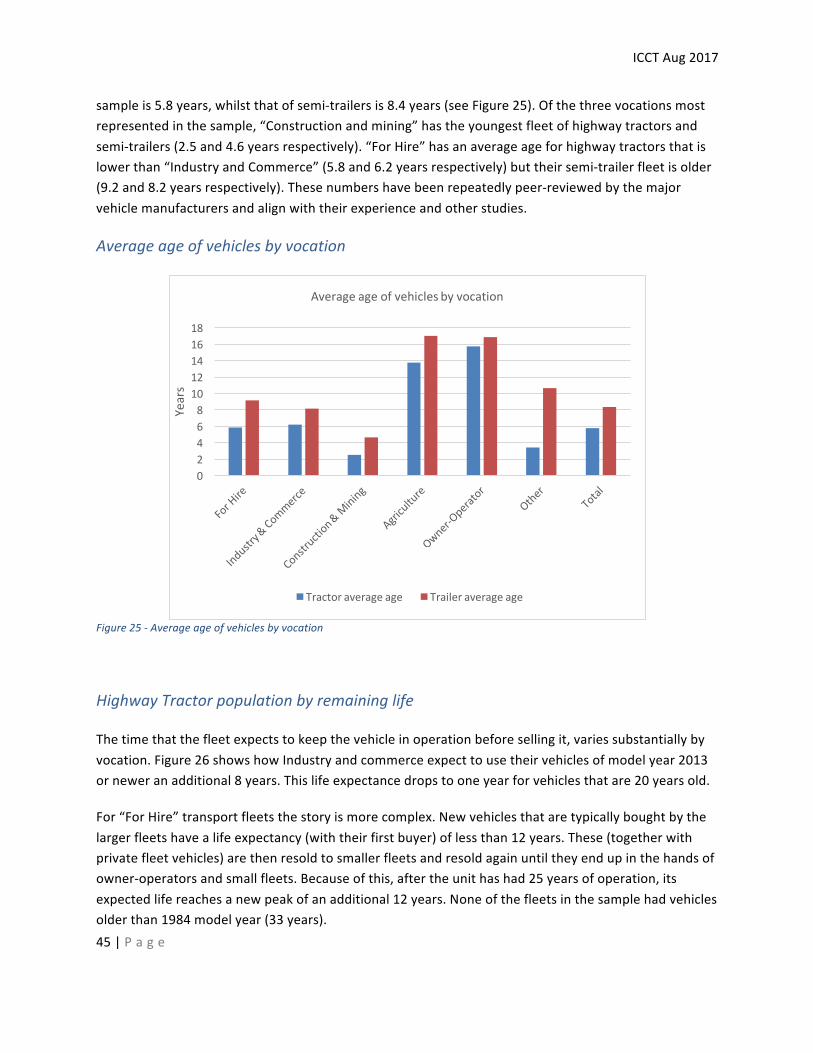
ICCTAug2017
45|P a g e
sampleis5.8years,whilstthatofsemi-trailersis8.4years(seeFigure25).Ofthethreevocationsmostrepresentedinthesample,“Constructionandmining”hastheyoungestfleetofhighwaytractorsandsemi-trailers(2.5and4.6yearsrespectively).“ForHire”hasanaverageageforhighwaytractorsthatislowerthan“IndustryandCommerce”(5.8and6.2yearsrespectively)buttheirsemi-trailerfleetisolder(9.2and8.2yearsrespectively).Thesenumbershavebeenrepeatedlypeer-reviewedbythemajorvehiclemanufacturersandalignwiththeirexperienceandotherstudies.
Averageageofvehiclesbyvocation
Figure25-Averageageofvehiclesbyvocation
HighwayTractorpopulationbyremaininglife
Thetimethatthefleetexpectstokeepthevehicleinoperationbeforesellingit,variessubstantiallybyvocation.Figure26showshowIndustryandcommerceexpecttousetheirvehiclesofmodelyear2013orneweranadditional8years.Thislifeexpectancedropstooneyearforvehiclesthatare20yearsold.
For“ForHire”transportfleetsthestoryismorecomplex.Newvehiclesthataretypicallyboughtbythelargerfleetshavealifeexpectancy(withtheirfirstbuyer)oflessthan12years.These(togetherwithprivatefleetvehicles)arethenresoldtosmallerfleetsandresoldagainuntiltheyendupinthehandsofowner-operatorsandsmallfleets.Becauseofthis,aftertheunithashad25yearsofoperation,itsexpectedlifereachesanewpeakofanadditional12years.Noneofthefleetsinthesamplehadvehiclesolderthan1984modelyear(33years).
024681012141618
Years
Averageageofvehiclesbyvocation
Tractoraverageage Traileraverageage
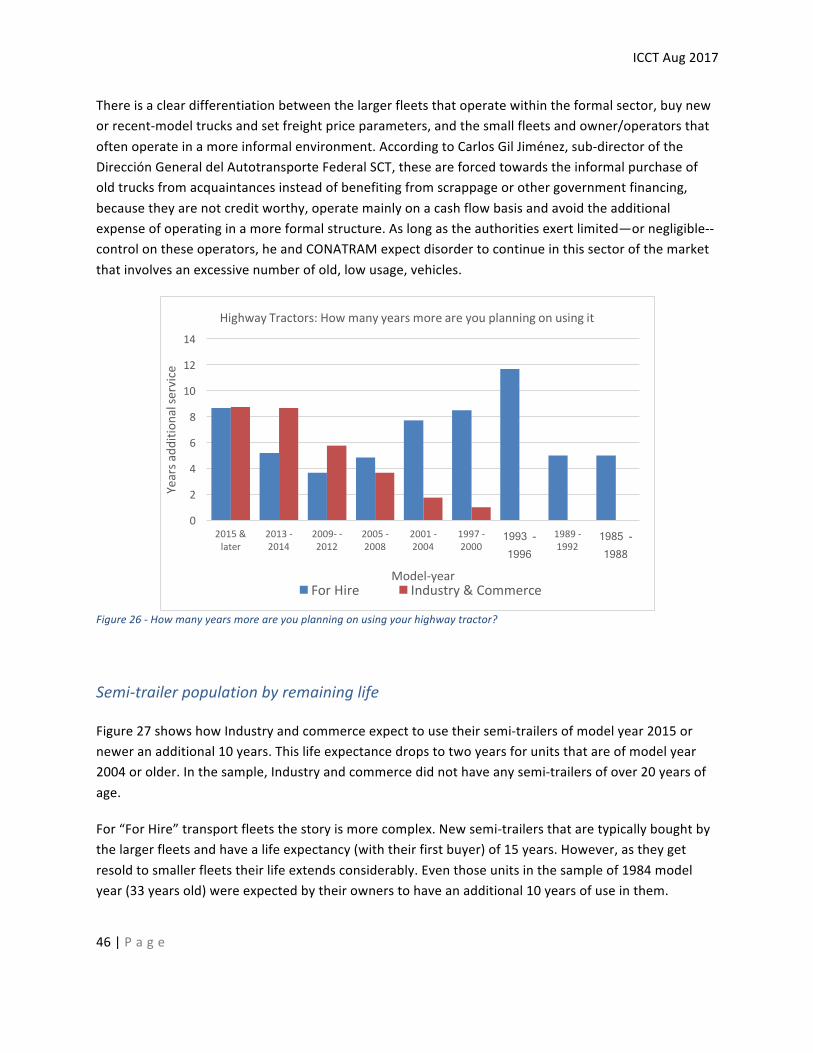
ICCTAug2017
46|P a g e
Thereisacleardifferentiationbetweenthelargerfleetsthatoperatewithintheformalsector,buyneworrecent-modeltrucksandsetfreightpriceparameters,andthesmallfleetsandowner/operatorsthatoftenoperateinamoreinformalenvironment.AccordingtoCarlosGilJiménez,sub-directoroftheDirecciónGeneraldelAutotransporteFederalSCT,theseareforcedtowardstheinformalpurchaseofoldtrucksfromacquaintancesinsteadofbenefitingfromscrappageorothergovernmentfinancing,becausetheyarenotcreditworthy,operatemainlyonacashflowbasisandavoidtheadditionalexpenseofoperatinginamoreformalstructure.Aslongastheauthoritiesexertlimited—ornegligible--controlontheseoperators,heandCONATRAMexpectdisordertocontinueinthissectorofthemarketthatinvolvesanexcessivenumberofold,lowusage,vehicles.
Figure26-Howmanyyearsmoreareyouplanningonusingyourhighwaytractor?
Semi-trailerpopulationbyremaininglife
Figure27showshowIndustryandcommerceexpecttousetheirsemi-trailersofmodelyear2015orneweranadditional10years.Thislifeexpectancedropstotwoyearsforunitsthatareofmodelyear2004orolder.Inthesample,Industryandcommercedidnothaveanysemi-trailersofover20yearsofage.
For“ForHire”transportfleetsthestoryismorecomplex.Newsemi-trailersthataretypicallyboughtbythelargerfleetsandhavealifeexpectancy(withtheirfirstbuyer)of15years.However,astheygetresoldtosmallerfleetstheirlifeextendsconsiderably.Eventhoseunitsinthesampleof1984modelyear(33yearsold)wereexpectedbytheirownerstohaveanadditional10yearsofuseinthem.
0
2
4
6
8
10
12
14
2015&later
2013-2014
2009- -2012
2005-2008
2001-2004
1997-2000
1993 -1996
1989-1992
1985 -1988
Yearsa
ddition
alse
rvice
Model-year
HighwayTractors:Howmanyyearsmoreareyouplanningonusingit
ForHire Industry&Commerce
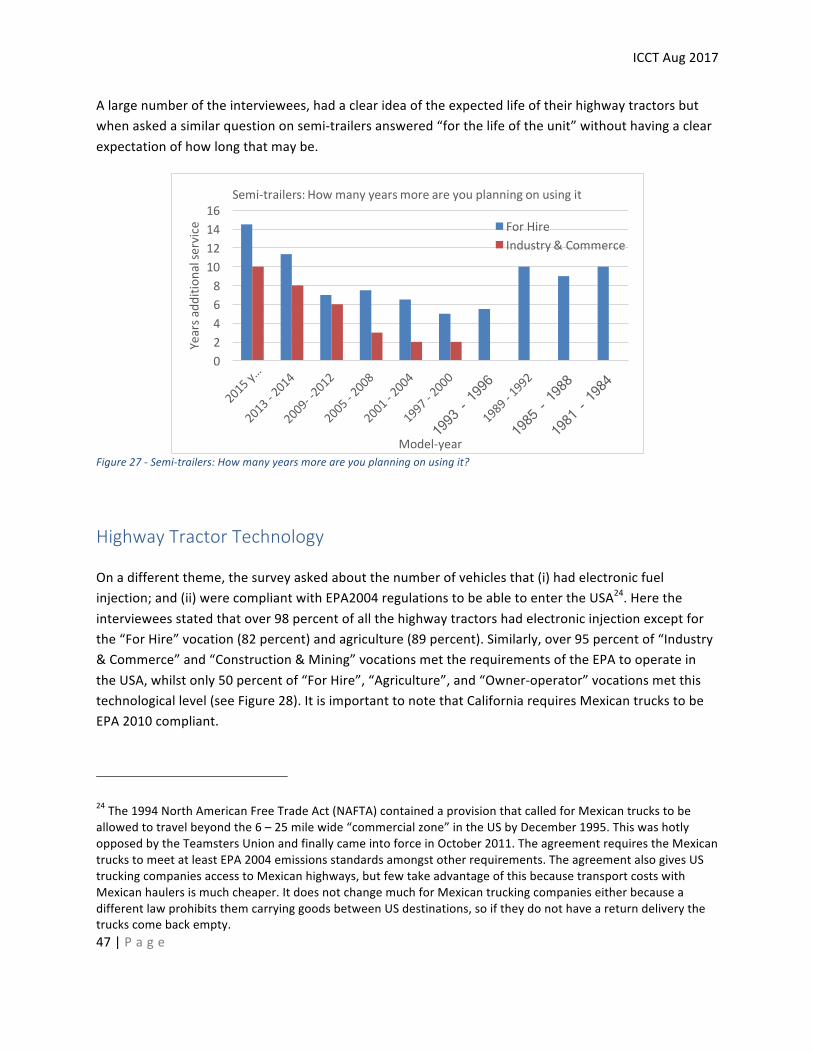
ICCTAug2017
47|P a g e
Alargenumberoftheinterviewees,hadaclearideaoftheexpectedlifeoftheirhighwaytractorsbutwhenaskedasimilarquestiononsemi-trailersanswered“forthelifeoftheunit”withouthavingaclearexpectationofhowlongthatmaybe.
Figure27-Semi-trailers:Howmanyyearsmoreareyouplanningonusingit?
HighwayTractorTechnology
Onadifferenttheme,thesurveyaskedaboutthenumberofvehiclesthat(i)hadelectronicfuelinjection;and(ii)werecompliantwithEPA2004regulationstobeabletoentertheUSA24.Heretheintervieweesstatedthatover98percentofallthehighwaytractorshadelectronicinjectionexceptforthe“ForHire”vocation(82percent)andagriculture(89percent).Similarly,over95percentof“Industry&Commerce”and“Construction&Mining”vocationsmettherequirementsoftheEPAtooperateintheUSA,whilstonly50percentof“ForHire”,“Agriculture”,and“Owner-operator”vocationsmetthistechnologicallevel(seeFigure28).ItisimportanttonotethatCaliforniarequiresMexicantruckstobeEPA2010compliant.
24The1994NorthAmericanFreeTradeAct(NAFTA)containedaprovisionthatcalledforMexicantruckstobeallowedtotravelbeyondthe6–25milewide“commercialzone”intheUSbyDecember1995.ThiswashotlyopposedbytheTeamstersUnionandfinallycameintoforceinOctober2011.TheagreementrequirestheMexicantruckstomeetatleastEPA2004emissionsstandardsamongstotherrequirements.TheagreementalsogivesUStruckingcompaniesaccesstoMexicanhighways,butfewtakeadvantageofthisbecausetransportcostswithMexicanhaulersismuchcheaper.ItdoesnotchangemuchforMexicantruckingcompanieseitherbecauseadifferentlawprohibitsthemcarryinggoodsbetweenUSdestinations,soiftheydonothaveareturndeliverythetruckscomebackempty.
02468
10121416
Yearsa
ddition
alse
rvice
Model-year
Semi-trailers:Howmanyyearsmoreareyouplanningonusingit
ForHireIndustry&Commerce
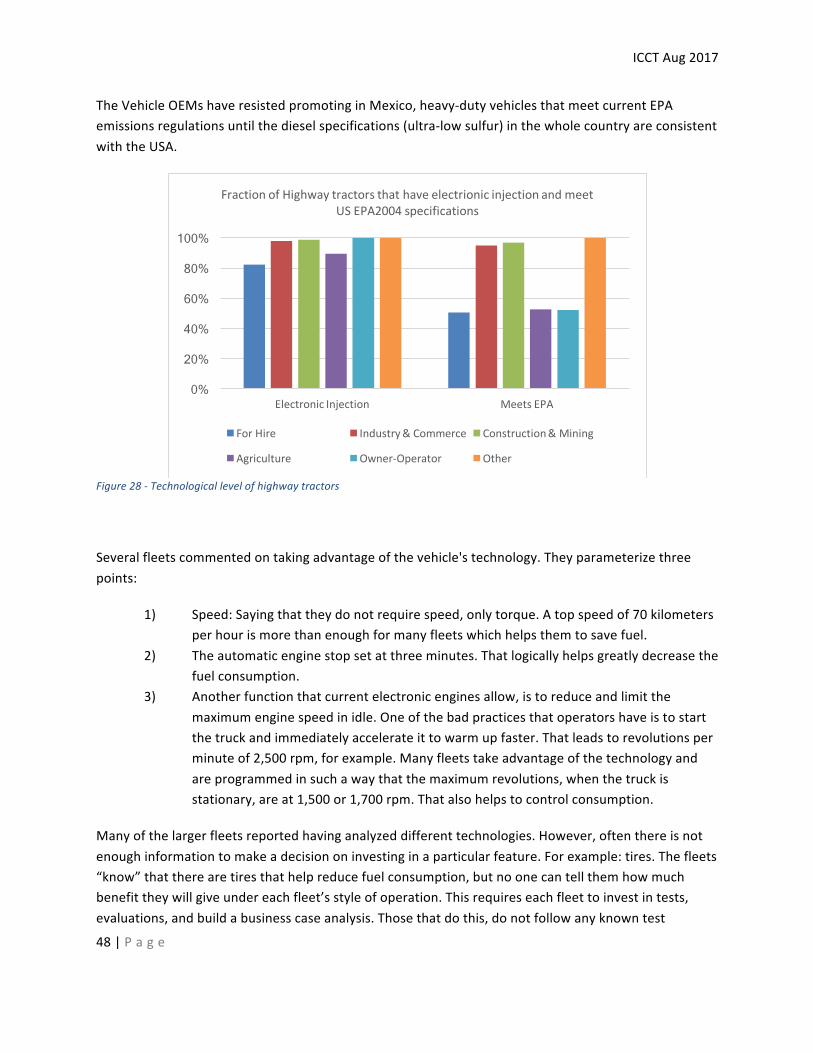
ICCTAug2017
48|P a g e
TheVehicleOEMshaveresistedpromotinginMexico,heavy-dutyvehiclesthatmeetcurrentEPAemissionsregulationsuntilthedieselspecifications(ultra-lowsulfur)inthewholecountryareconsistentwiththeUSA.
Figure28-Technologicallevelofhighwaytractors
Severalfleetscommentedontakingadvantageofthevehicle'stechnology.Theyparameterizethreepoints:
1) Speed:Sayingthattheydonotrequirespeed,onlytorque.Atopspeedof70kilometersperhourismorethanenoughformanyfleetswhichhelpsthemtosavefuel.
2) Theautomaticenginestopsetatthreeminutes.Thatlogicallyhelpsgreatlydecreasethefuelconsumption.
3) Anotherfunctionthatcurrentelectronicenginesallow,istoreduceandlimitthemaximumenginespeedinidle.Oneofthebadpracticesthatoperatorshaveistostartthetruckandimmediatelyaccelerateittowarmupfaster.Thatleadstorevolutionsperminuteof2,500rpm,forexample.Manyfleetstakeadvantageofthetechnologyandareprogrammedinsuchawaythatthemaximumrevolutions,whenthetruckisstationary,areat1,500or1,700rpm.Thatalsohelpstocontrolconsumption.
Manyofthelargerfleetsreportedhavinganalyzeddifferenttechnologies.However,oftenthereisnotenoughinformationtomakeadecisiononinvestinginaparticularfeature.Forexample:tires.Thefleets“know”thattherearetiresthathelpreducefuelconsumption,butnoonecantellthemhowmuchbenefittheywillgiveundereachfleet’sstyleofoperation.Thisrequireseachfleettoinvestintests,evaluations,andbuildabusinesscaseanalysis.Thosethatdothis,donotfollowanyknowntest
0%
20%
40%
60%
80%
100%
ElectronicInjection MeetsEPA
FractionofHighwaytractorsthathaveelectrionicinjectionandmeetUSEPA2004specifications
ForHire Industry&Commerce Construction&Mining
Agriculture Owner-Operator Other
ICCTAug2017
49|P a g e
protocol,andwithoutanythingestablished,donotproduceresultsthatwouldhelpanotherfleetbasetheirdecisions.
Accordingtotheinterviewees,onebenefitofhavingthe“TransporteLimpio”Program,isthatitpushesthemtobeconstantlymeasuring,andthinkingaboutfutureimprovements.However,theprogramcoulddoalotmoreinhelpingfleetsobtaininformationtobasetheirinvestmentdecisionson,withouthavingtodoindividualtesting.
IntheUSA,theTechnology&MaintenanceCouncilofAmericanTruckingAssociations(TMC)providesaccesstoqualitydataonexpectedefficiencyimprovementsandthecostsassociatedwithobtainingthembyestablishingtestprotocols25andhelpinggeneratethatinformation,andparticipatinginforumswherethisinformationisshared.Inmanycasesasingleproductcanbeavailablefromanumberofdifferentsuppliers(suchastraileraerodynamictreatments)andthisTMCtestingisparticularlyusefulinthesecases.
ItwouldbeveryusefulforTransporteLimpiotoprovideaspartoftheprogramsomekindofcalculator,thathelpsfleetswithdeterminingthereturnoninvestmentforthesetechnologies.Mostfleetsarereallylookingforpaybackof18or24months.
Thethemeofbiodieselisalsoimportantandissomethingthefleetsknowlittleabout.Theyknowthatenginemanufacturersonlyallowyoutomix95percentdieseland5percentbio,butbelievethattherecouldbebigbenefitsofgoingtohighermixes.
Tires
Theintervieweeswerequestionedaboutthemakeoftirethattheyuse.ThemostpopularbrandisMichelin(Xone&Duals)with26percentfollowedbyBridgestone(Ecopia)with19percentandinthirdplacethosethatdonotspecifyaparticularmakeoftire(14percent)–seeTable25.
ThepreferencesforMichelinandBridgestonearebasedondurability,prestige,andfueleconomygivingthelowestcostperkm(accordingtothosethatuseeach).Thosethatdonotspecifyabrandormake,lookforlowestcostoftenspecifyingnewradialtiresforthehighwaytractorandretreadedunitsforthesemi-trailer.TheusersofFirestonehighlightthattheycanbeeasilyretreaded,whilsttheusersofGoodyearfocusontheirdurability.TheownersthatchooseChinesetiresdosospecificallybecauseoftheirlowinitialcost.
25Asanexampleofthis,theJointTMC/SAEFuelConsumptionTestProcedure-TypeII(J1321_201202)providesastandardizedtestprocedureforcomparingthein-servicefuelconsumptionoftwoconditionsofatestvehiclethatisespeciallysuitablefortestingtheefficiencygainfromcomponentsinfleetvehiclesofover10,000lbs.GVWoperatingoverrepresentativeroutes.
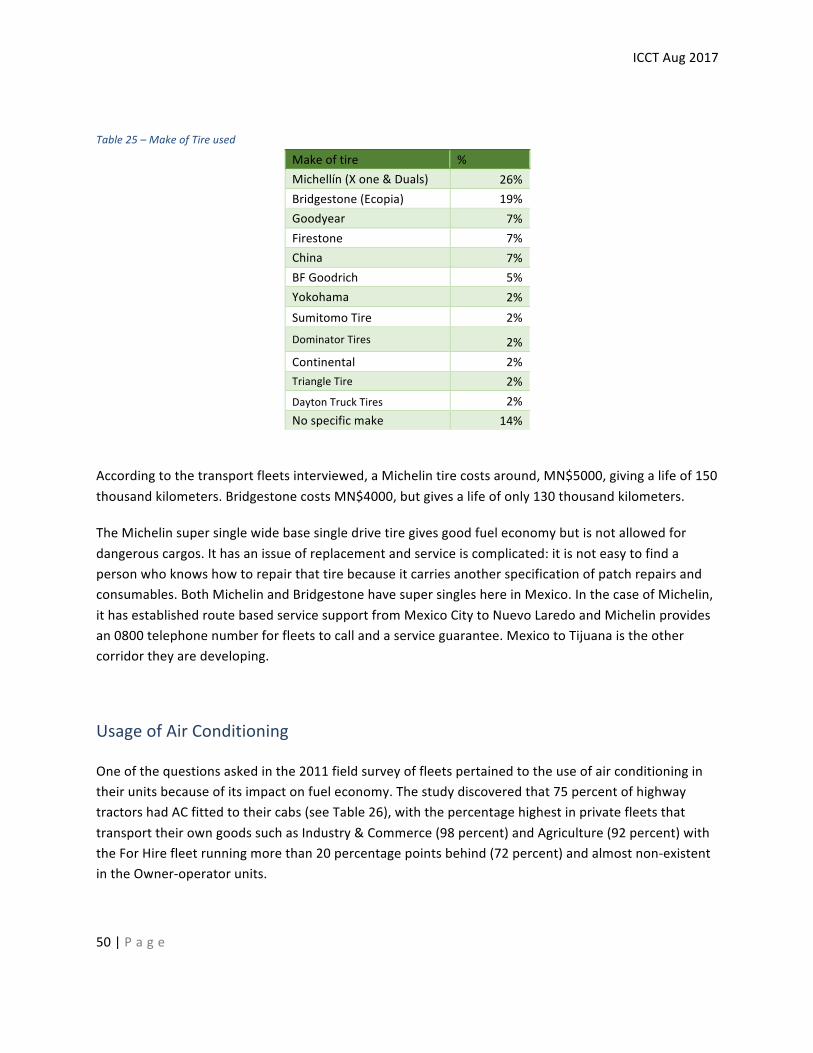
ICCTAug2017
50|P a g e
Table25–MakeofTireused
Makeoftire %Michellín(Xone&Duals) 26%Bridgestone(Ecopia) 19%Goodyear 7%Firestone 7%China 7%BFGoodrich 5%Yokohama 2%SumitomoTire 2%
DominatorTires 2%Continental 2%TriangleTire 2%DaytonTruckTires 2%Nospecificmake 14%
Accordingtothetransportfleetsinterviewed,aMichelintirecostsaround,MN$5000,givingalifeof150thousandkilometers.BridgestonecostsMN$4000,butgivesalifeofonly130thousandkilometers.
TheMichelinsupersinglewidebasesingledrivetiregivesgoodfueleconomybutisnotallowedfordangerouscargos.Ithasanissueofreplacementandserviceiscomplicated:itisnoteasytofindapersonwhoknowshowtorepairthattirebecauseitcarriesanotherspecificationofpatchrepairsandconsumables.BothMichelinandBridgestonehavesupersingleshereinMexico.InthecaseofMichelin,ithasestablishedroutebasedservicesupportfromMexicoCitytoNuevoLaredoandMichelinprovidesan0800telephonenumberforfleetstocallandaserviceguarantee.MexicotoTijuanaistheothercorridortheyaredeveloping.
UsageofAirConditioning
Oneofthequestionsaskedinthe2011fieldsurveyoffleetspertainedtotheuseofairconditioningintheirunitsbecauseofitsimpactonfueleconomy.Thestudydiscoveredthat75percentofhighwaytractorshadACfittedtotheircabs(seeTable26),withthepercentagehighestinprivatefleetsthattransporttheirowngoodssuchasIndustry&Commerce(98percent)andAgriculture(92percent)withtheForHirefleetrunningmorethan20percentagepointsbehind(72percent)andalmostnon-existentintheOwner-operatorunits.
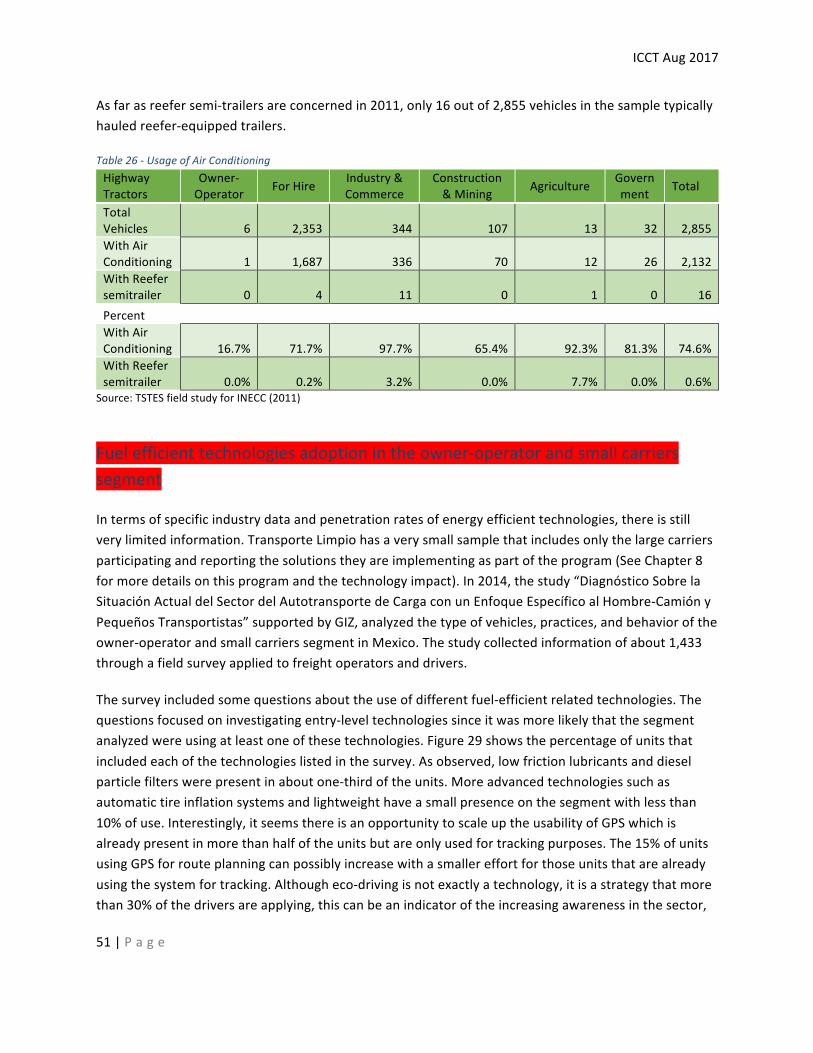
ICCTAug2017
51|P a g e
Asfarasreefersemi-trailersareconcernedin2011,only16outof2,855vehiclesinthesampletypicallyhauledreefer-equippedtrailers.
Table26-UsageofAirConditioningHighwayTractors
Owner-Operator ForHire Industry&
CommerceConstruction&Mining Agriculture Govern
ment Total
TotalVehicles 6 2,353 344 107 13 32 2,855WithAirConditioning 1 1,687 336 70 12 26 2,132WithReefersemitrailer 0 4 11 0 1 0 16Percent WithAirConditioning 16.7% 71.7% 97.7% 65.4% 92.3% 81.3% 74.6%WithReefersemitrailer 0.0% 0.2% 3.2% 0.0% 7.7% 0.0% 0.6%
Source:TSTESfieldstudyforINECC(2011)
Fuelefficienttechnologiesadoptionintheowner-operatorandsmallcarrierssegment
Intermsofspecificindustrydataandpenetrationratesofenergyefficienttechnologies,thereisstillverylimitedinformation.TransporteLimpiohasaverysmallsamplethatincludesonlythelargecarriersparticipatingandreportingthesolutionstheyareimplementingaspartoftheprogram(SeeChapter8formoredetailsonthisprogramandthetechnologyimpact).In2014,thestudy“DiagnósticoSobrelaSituaciónActualdelSectordelAutotransportedeCargaconunEnfoqueEspecíficoalHombre-CamiónyPequeñosTransportistas”supportedbyGIZ,analyzedthetypeofvehicles,practices,andbehavioroftheowner-operatorandsmallcarrierssegmentinMexico.Thestudycollectedinformationofabout1,433throughafieldsurveyappliedtofreightoperatorsanddrivers.
Thesurveyincludedsomequestionsabouttheuseofdifferentfuel-efficientrelatedtechnologies.Thequestionsfocusedoninvestigatingentry-leveltechnologiessinceitwasmorelikelythatthesegmentanalyzedwereusingatleastoneofthesetechnologies.Figure29showsthepercentageofunitsthatincludedeachofthetechnologieslistedinthesurvey.Asobserved,lowfrictionlubricantsanddieselparticlefilterswerepresentinaboutone-thirdoftheunits.Moreadvancedtechnologiessuchasautomatictireinflationsystemsandlightweighthaveasmallpresenceonthesegmentwithlessthan10%ofuse.Interestingly,itseemsthereisanopportunitytoscaleuptheusabilityofGPSwhichisalreadypresentinmorethanhalfoftheunitsbutareonlyusedfortrackingpurposes.The15%ofunitsusingGPSforrouteplanningcanpossiblyincreasewithasmallereffortforthoseunitsthatarealreadyusingthesystemfortracking.Althougheco-drivingisnotexactlyatechnology,itisastrategythatmorethan30%ofthedriversareapplying,thiscanbeanindicatoroftheincreasingawarenessinthesector,
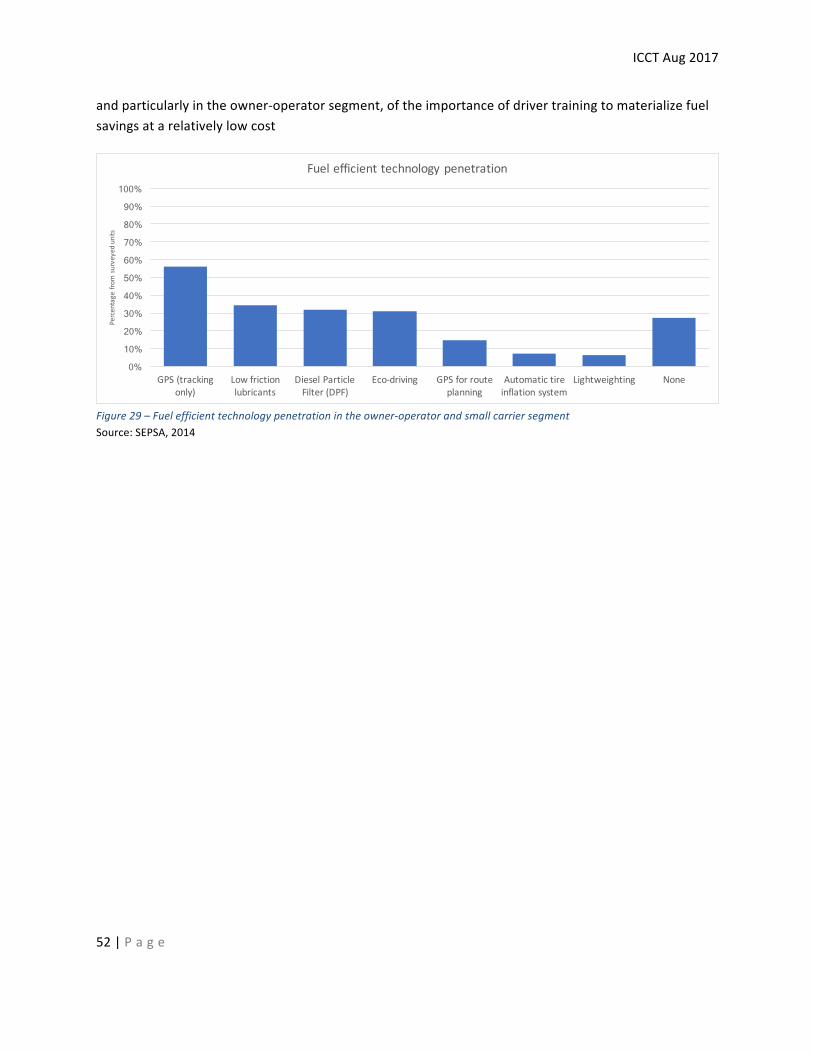
ICCTAug2017
52|P a g e
andparticularlyintheowner-operatorsegment,oftheimportanceofdrivertrainingtomaterializefuelsavingsatarelativelylowcost
Figure29–Fuelefficienttechnologypenetrationintheowner-operatorandsmallcarriersegmentSource:SEPSA,2014
0% 10% 20% 30% 40% 50% 60% 70% 80% 90%
100%
GPS(trackingonly)
Lowfrictionlubricants
DieselParticleFilter(DPF)
Eco-driving GPSforrouteplanning
Automatictireinflationsystem
Lightweighting None
Percentagefrom
surveyedunits
Fuelefficienttechnologypenetration
ICCTAug2017
53|P a g e
Chapter4:-VehiclePurchasing
Thischaptercompilesinformationonhowfleetsbuyhighwaytractorsandsemi-trailers.Itlooksatthesourcesofinformation,advertising,andpublicitythatisusedtopromotesecond-handvehiclesales,howpurchasesarefinanced,andthemotivesforselectingaspecificbrand.
SourceofinformationandpublicityTheOEMdealerisstillthepredominantsourceofinformationonsecond-handhighwaytractorsandsemi-trailers.Fortheformer,theirinfluenceasasourceofinformationonavailablesecond-handvehicleshasincreasedsubstantiallyoverthelast5years(from21to50percent)andforthelatter,ithasincreasedfrom18to48percent.Inbothmarkets,buyingfromaknownfleetkeepsits2ndspotinimportanceaccountingforaround23percentofpurchasesinbothmarketsandoverbothperiods.Thelargesttransportfleetstendtobuynewvehicleson36to48-monthcommercialcreditandoftensellthesevehiclesafter4–5years.Theyarethensold,normallybythefleetsthemselves,andoccasionallybyOEMdealers,tothenextleveloffleet.Verylimitedadvertisingaccompaniesthesesalesasbuyersandsellersareusuallyknowntoeachotherthroughpreviousoperations.Publicitystartstopayaroleinthenextlevelofsalewhenthehighwaytractorhasaround6-8yearsofuse.Thesevehiclesstartappearinginon-lineadverts,usuallypromotedbytheirowner.MotivesforchoosingaspecificmakeofhighwaytractorIntervieweeswereaskedtoratealistofreasonsforchoosingthemakeofhighwaytractorthattheyendedupbuying.73percentofintervieweesrated“FamiliaritywiththeBrand”ashavingthehighestimportancecloselyfollowedbyprice(64-66percent)considering“Priceandavailabilityofspareparts”and“PriceoftheUnit”respectively.43percentoftheintervieweesalsoconsidered“FuelEconomy”important.36to37percentalsograded“Durabilityoftheunitinourroutes”,and“Power/Handling”.Interestinglythepreferenceofthedifferentareasofthefleetreceivedverylowscores.Motivesforchoosingaspecificmakeofsemi-trailerForsemi-trailers,theoverwhelmingreasonforselectingaspecificunitisprice(52percentofinterviewees)followedby“FamiliaritywiththeBrand”(50percent)and“Durabilityinourroutes”(43percent).“Priceandavailabilityofspareparts”cameinfourthplacewith25percentofthesample.
ChapterHighlights
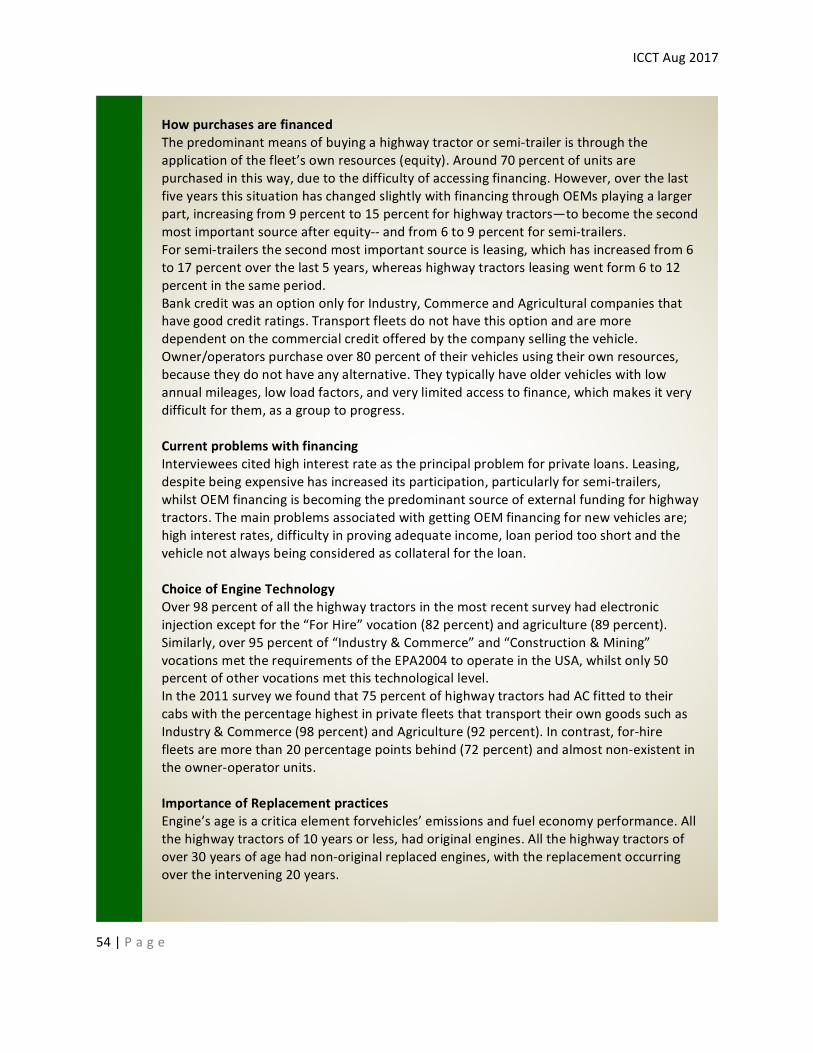
ICCTAug2017
54|P a g e
HowpurchasesarefinancedThepredominantmeansofbuyingahighwaytractororsemi-traileristhroughtheapplicationofthefleet’sownresources(equity).Around70percentofunitsarepurchasedinthisway,duetothedifficultyofaccessingfinancing.However,overthelastfiveyearsthissituationhaschangedslightlywithfinancingthroughOEMsplayingalargerpart,increasingfrom9percentto15percentforhighwaytractors—tobecomethesecondmostimportantsourceafterequity--andfrom6to9percentforsemi-trailers.Forsemi-trailersthesecondmostimportantsourceisleasing,whichhasincreasedfrom6to17percentoverthelast5years,whereashighwaytractorsleasingwentform6to12percentinthesameperiod.BankcreditwasanoptiononlyforIndustry,CommerceandAgriculturalcompaniesthathavegoodcreditratings.Transportfleetsdonothavethisoptionandaremoredependentonthecommercialcreditofferedbythecompanysellingthevehicle.Owner/operatorspurchaseover80percentoftheirvehiclesusingtheirownresources,becausetheydonothaveanyalternative.Theytypicallyhaveoldervehicleswithlowannualmileages,lowloadfactors,andverylimitedaccesstofinance,whichmakesitverydifficultforthem,asagrouptoprogress.CurrentproblemswithfinancingIntervieweescitedhighinterestrateastheprincipalproblemforprivateloans.Leasing,despitebeingexpensivehasincreaseditsparticipation,particularlyforsemi-trailers,whilstOEMfinancingisbecomingthepredominantsourceofexternalfundingforhighwaytractors.ThemainproblemsassociatedwithgettingOEMfinancingfornewvehiclesare;highinterestrates,difficultyinprovingadequateincome,loanperiodtooshortandthevehiclenotalwaysbeingconsideredascollateralfortheloan.ChoiceofEngineTechnologyOver98percentofallthehighwaytractorsinthemostrecentsurveyhadelectronicinjectionexceptforthe“ForHire”vocation(82percent)andagriculture(89percent).Similarly,over95percentof“Industry&Commerce”and“Construction&Mining”vocationsmettherequirementsoftheEPA2004tooperateintheUSA,whilstonly50percentofothervocationsmetthistechnologicallevel.Inthe2011surveywefoundthat75percentofhighwaytractorshadACfittedtotheircabswiththepercentagehighestinprivatefleetsthattransporttheirowngoodssuchasIndustry&Commerce(98percent)andAgriculture(92percent).Incontrast,for-hirefleetsaremorethan20percentagepointsbehind(72percent)andalmostnon-existentintheowner-operatorunits.ImportanceofReplacementpracticesEngine’sageisacriticaelementforvehicles’emissionsandfueleconomyperformance.Allthehighwaytractorsof10yearsorless,hadoriginalengines.Allthehighwaytractorsofover30yearsofagehadnon-originalreplacedengines,withthereplacementoccurringovertheintervening20years.
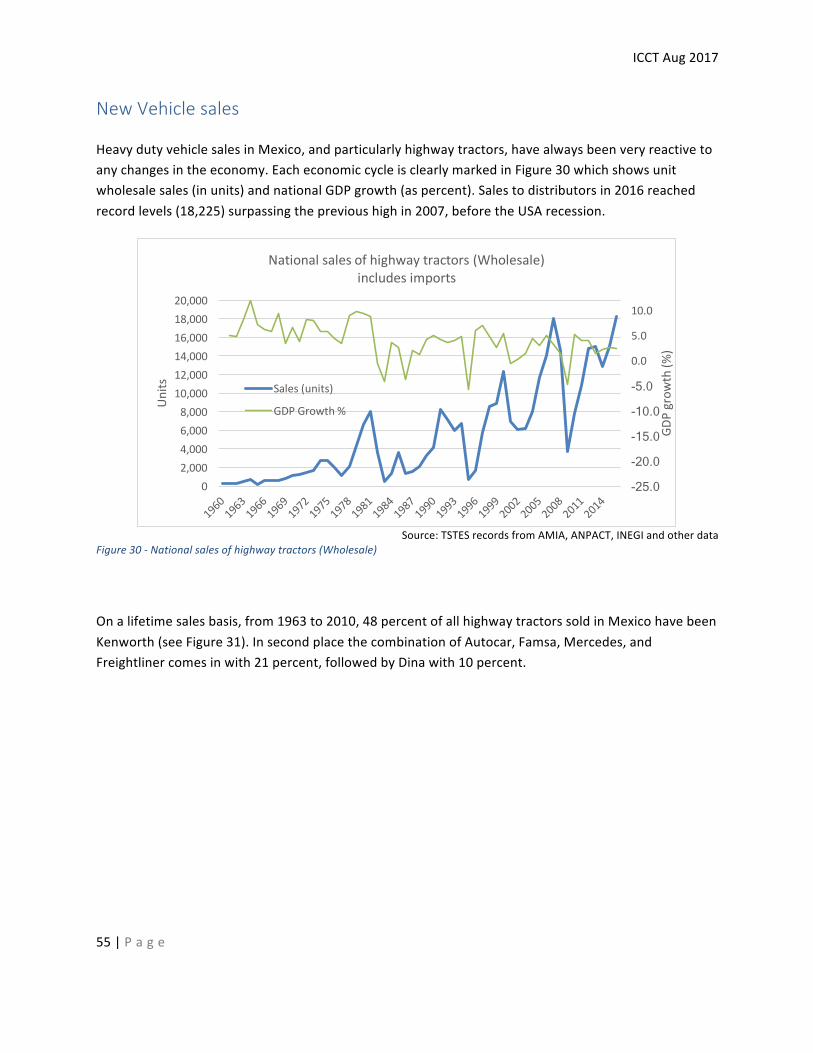
ICCTAug2017
55|P a g e
NewVehiclesales
HeavydutyvehiclesalesinMexico,andparticularlyhighwaytractors,havealwaysbeenveryreactivetoanychangesintheeconomy.EacheconomiccycleisclearlymarkedinFigure30whichshowsunitwholesalesales(inunits)andnationalGDPgrowth(aspercent).Salestodistributorsin2016reachedrecordlevels(18,225)surpassingtheprevioushighin2007,beforetheUSArecession.
Source:TSTESrecordsfromAMIA,ANPACT,INEGIandotherdata
Figure30-Nationalsalesofhighwaytractors(Wholesale)
Onalifetimesalesbasis,from1963to2010,48percentofallhighwaytractorssoldinMexicohavebeenKenworth(seeFigure31).InsecondplacethecombinationofAutocar,Famsa,Mercedes,andFreightlinercomesinwith21percent,followedbyDinawith10percent.
-25.0
-20.0
-15.0
-10.0
-5.0
0.0
5.0
10.0
02,0004,0006,0008,00010,00012,00014,00016,00018,00020,000
GDPgrow
th(%
)
Units
Nationalsalesofhighwaytractors(Wholesale)includesimports
Sales(units)
GDPGrowth%
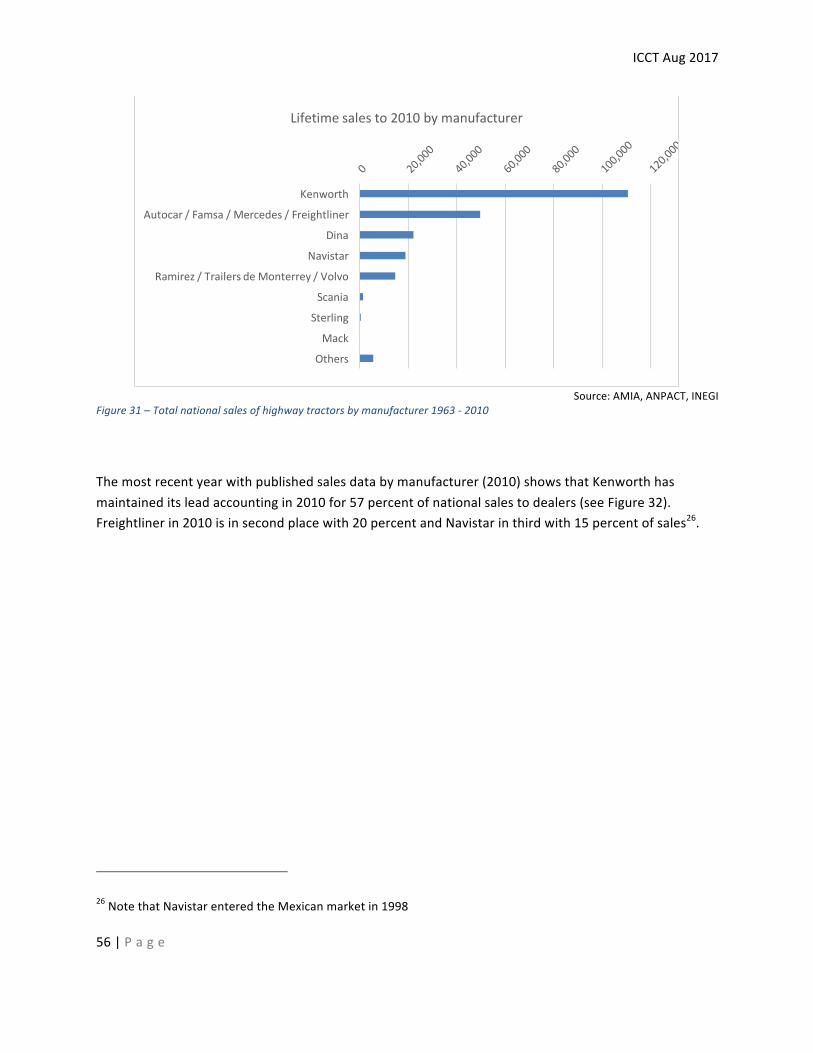
ICCTAug2017
56|P a g e
Source:AMIA,ANPACT,INEGI
Figure31–Totalnationalsalesofhighwaytractorsbymanufacturer1963-2010
Themostrecentyearwithpublishedsalesdatabymanufacturer(2010)showsthatKenworthhasmaintaineditsleadaccountingin2010for57percentofnationalsalestodealers(seeFigure32).Freightlinerin2010isinsecondplacewith20percentandNavistarinthirdwith15percentofsales26.
26NotethatNavistarenteredtheMexicanmarketin1998
Kenworth
Autocar/Famsa/Mercedes/Freightliner
Dina
Navistar
Ramirez/TrailersdeMonterrey/Volvo
Scania
Sterling
Mack
Others
Lifetimesalesto2010bymanufacturer
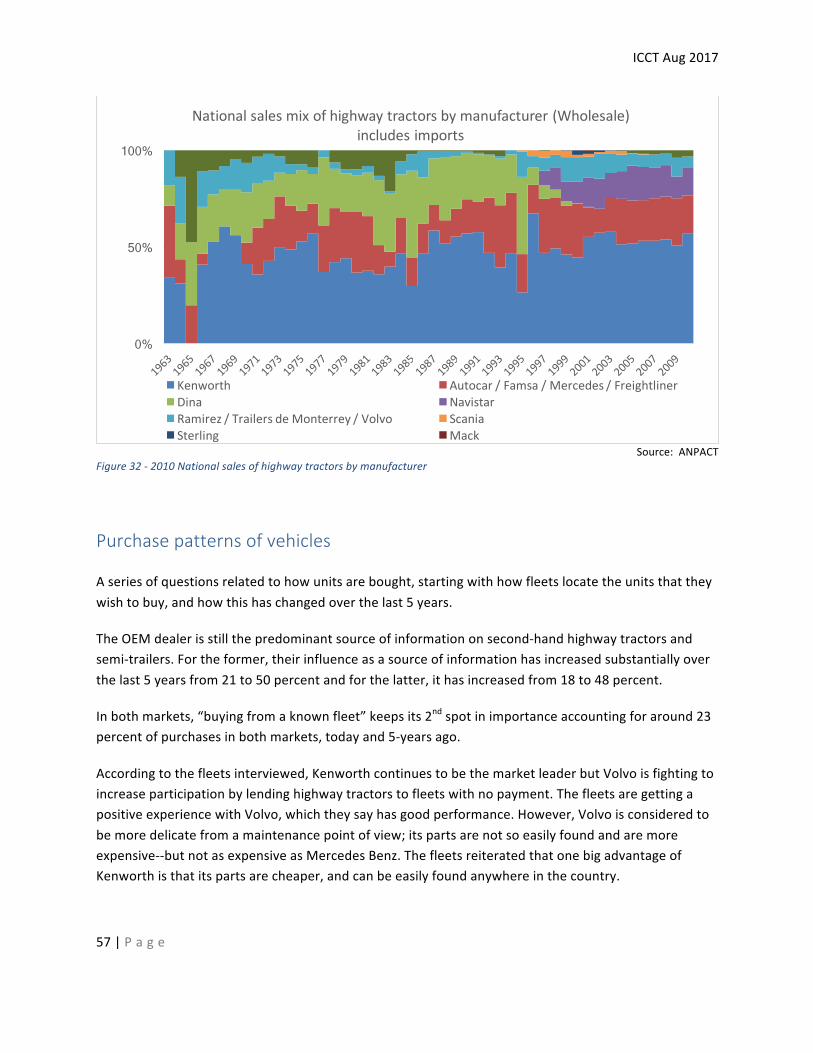
ICCTAug2017
57|P a g e
Source:ANPACT
Figure32-2010Nationalsalesofhighwaytractorsbymanufacturer
Purchasepatternsofvehicles
Aseriesofquestionsrelatedtohowunitsarebought,startingwithhowfleetslocatetheunitsthattheywishtobuy,andhowthishaschangedoverthelast5years.
TheOEMdealerisstillthepredominantsourceofinformationonsecond-handhighwaytractorsandsemi-trailers.Fortheformer,theirinfluenceasasourceofinformationhasincreasedsubstantiallyoverthelast5yearsfrom21to50percentandforthelatter,ithasincreasedfrom18to48percent.
Inbothmarkets,“buyingfromaknownfleet”keepsits2ndspotinimportanceaccountingforaround23percentofpurchasesinbothmarkets,todayand5-yearsago.
Accordingtothefleetsinterviewed,KenworthcontinuestobethemarketleaderbutVolvoisfightingtoincreaseparticipationbylendinghighwaytractorstofleetswithnopayment.ThefleetsaregettingapositiveexperiencewithVolvo,whichtheysayhasgoodperformance.However,Volvoisconsideredtobemoredelicatefromamaintenancepointofview;itspartsarenotsoeasilyfoundandaremoreexpensive--butnotasexpensiveasMercedesBenz.ThefleetsreiteratedthatonebigadvantageofKenworthisthatitspartsarecheaper,andcanbeeasilyfoundanywhereinthecountry.
0%
50%
100%
Nationalsalesmixofhighwaytractorsbymanufacturer(Wholesale)includesimports
Kenworth Autocar/Famsa/Mercedes/FreightlinerDina NavistarRamirez/TrailersdeMonterrey/Volvo ScaniaSterling Mack
ICCTAug2017
58|P a g e
MostFreightlinercustomershavecreditagreementsandareacquiringhighwaytractorsthroughpureorfiscalleaseagreementsinwhichthemanufacturerisresponsibleforkeepingtheunitingoodcondition.Otherpurchasersmakeuseofthetraditionalcreditsystem.Ofthese,thelargercompaniestendtorequesttechnicalandmaintenancetrainingfromthemanufacturer,aspartoftheagreementofcollaborationintheacquisitionoftheunits.
Theintervieweesagreedthissectorneedsaccesstoflexibleloans,withclearoperatingrulesthatareroutinelycompliedwith.Inaddition,theystressedtheimportanceofallowingthevehicleasguaranteeforthepaymentoftheunit.
Owner-operatorsrequireadditionalhelp.Currentlytheyownmainlyvehiclesfrom20tomorethan30yearsofageandtypicallyoperatewithverylowannualmileage(onaverage,aquarteroftheexpectedusageofanewunitinlargefleet)andalowutilizationrate,soitisimpossibleforthemtobuynewunits.Theycanonlyaffordtobuyolderunits,whicharenotsubjecttocreditandareintrinsicallymoreexpensivetooperate,whichfurtherreducestheirpossibleoperatingprofit,limitingfleetrenewalevenfurther.
Severalactionswouldberequiredtoreversethistrend;theavailabilityofasoftcreditsystemcouldallowowner-operatorstoleavebehindtheiroldestvehicles,andbeenticedtobecomemoreefficientorganizationsthatcaneasilycomplywithlawsandregulations.Inaddition,itwouldbeimportanttofixamaximumageforin-useheavydutyvehiclesthatencouragesfleetrenewalandremovesfromcirculationthoseobsoleteandunsafeunits.
UsedVehiclesales
Asdiscussedpreviously,thelargesttransportfleetstendtobuynewvehicleson36to48monthcommercialcreditandoftensellthesevehiclesafter4or5years.Overthisperiodthevehicleismainlycoveredbywarranty,andhasverylimitedmaintenancecostsordowntime.Thentheyaresold,normallybythefleetsthemselves,andoccasionallybyOEMdealers,tothenextleveloffleet.Saleadvertisingisverylimited,asbuyersandsellersareusuallyknowneachotherthroughpreviousoperations.SomefleetsadvertisetheirvehiclesforsaleontheirFacebookpages(forexamplePaqueteriaCastores).
Severallargefleetscommentedthattheyhaveagentswhoknowthateveryyearthefleetwillgettingridofaround30to40highwaytractorsandsetupauctionsforthem.Theseagentsaregivenapercentageofthesaleofeachtruckthatissold.
Howarevehiclesforsalelocated
Publicitystartstopayaroleinthenextlevelofsalewhenthehighwaytractorhasaround6to8yearsofuse.Thesevehiclesstartappearinginon-lineadverts,usuallypromotedbytheirowner.Fivepopular
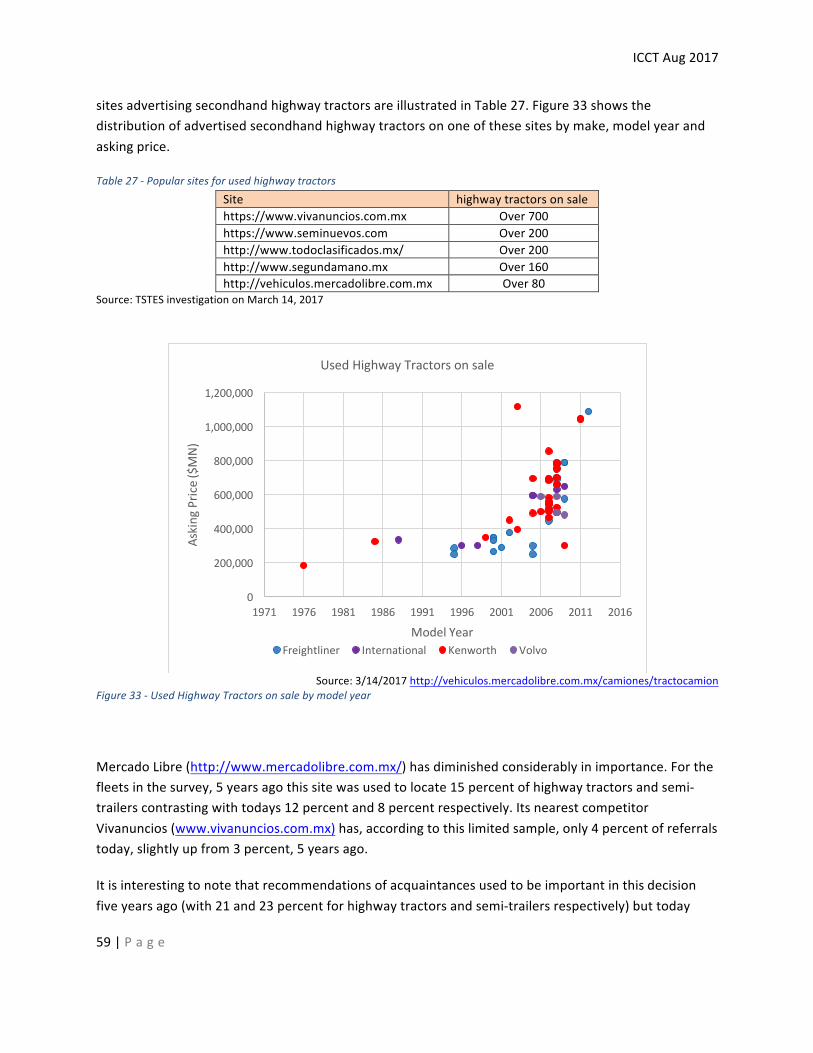
ICCTAug2017
59|P a g e
sitesadvertisingsecondhandhighwaytractorsareillustratedinTable27.Figure33showsthedistributionofadvertisedsecondhandhighwaytractorsononeofthesesitesbymake,modelyearandaskingprice.
Table27-PopularsitesforusedhighwaytractorsSite highwaytractorsonsalehttps://www.vivanuncios.com.mx Over700https://www.seminuevos.com Over200http://www.todoclasificados.mx/ Over200http://www.segundamano.mx Over160http://vehiculos.mercadolibre.com.mx Over80
Source:TSTESinvestigationonMarch14,2017
Source:3/14/2017http://vehiculos.mercadolibre.com.mx/camiones/tractocamion
Figure33-UsedHighwayTractorsonsalebymodelyear
MercadoLibre(http://www.mercadolibre.com.mx/)hasdiminishedconsiderablyinimportance.Forthefleetsinthesurvey,5yearsagothissitewasusedtolocate15percentofhighwaytractorsandsemi-trailerscontrastingwithtodays12percentand8percentrespectively.ItsnearestcompetitorVivanuncios(www.vivanuncios.com.mx)has,accordingtothislimitedsample,only4percentofreferralstoday,slightlyupfrom3percent,5yearsago.
Itisinterestingtonotethatrecommendationsofacquaintancesusedtobeimportantinthisdecisionfiveyearsago(with21and23percentforhighwaytractorsandsemi-trailersrespectively)buttoday
0
200,000
400,000
600,000
800,000
1,000,000
1,200,000
1971 1976 1981 1986 1991 1996 2001 2006 2011 2016
AskingPric
e($MN)
ModelYear
UsedHighwayTractorsonsale
Freightliner International Kenworth Volvo
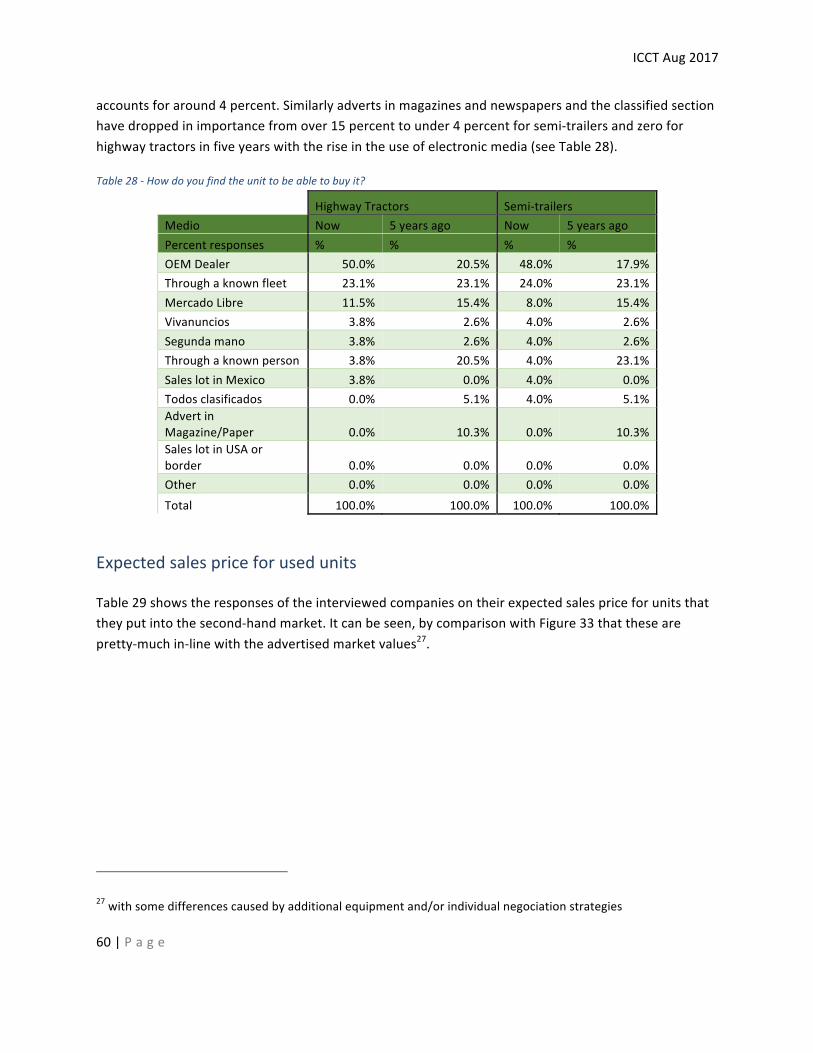
ICCTAug2017
60|P a g e
accountsforaround4percent.Similarlyadvertsinmagazinesandnewspapersandtheclassifiedsectionhavedroppedinimportancefromover15percenttounder4percentforsemi-trailersandzeroforhighwaytractorsinfiveyearswiththeriseintheuseofelectronicmedia(seeTable28).
Table28-Howdoyoufindtheunittobeabletobuyit?
HighwayTractors Semi-trailersMedio Now 5yearsago Now 5yearsagoPercentresponses % % % %OEMDealer 50.0% 20.5% 48.0% 17.9%Throughaknownfleet 23.1% 23.1% 24.0% 23.1%MercadoLibre 11.5% 15.4% 8.0% 15.4%Vivanuncios 3.8% 2.6% 4.0% 2.6%Segundamano 3.8% 2.6% 4.0% 2.6%Throughaknownperson 3.8% 20.5% 4.0% 23.1%SaleslotinMexico 3.8% 0.0% 4.0% 0.0%Todosclasificados 0.0% 5.1% 4.0% 5.1%AdvertinMagazine/Paper 0.0% 10.3% 0.0% 10.3%SaleslotinUSAorborder 0.0% 0.0% 0.0% 0.0%Other 0.0% 0.0% 0.0% 0.0%Total 100.0% 100.0% 100.0% 100.0%
Expectedsalespriceforusedunits
Table29showstheresponsesoftheinterviewedcompaniesontheirexpectedsalespriceforunitsthattheyputintothesecond-handmarket.Itcanbeseen,bycomparisonwithFigure33thatthesearepretty-muchin-linewiththeadvertisedmarketvalues27.
27withsomedifferencescausedbyadditionalequipmentand/orindividualnegociationstrategies
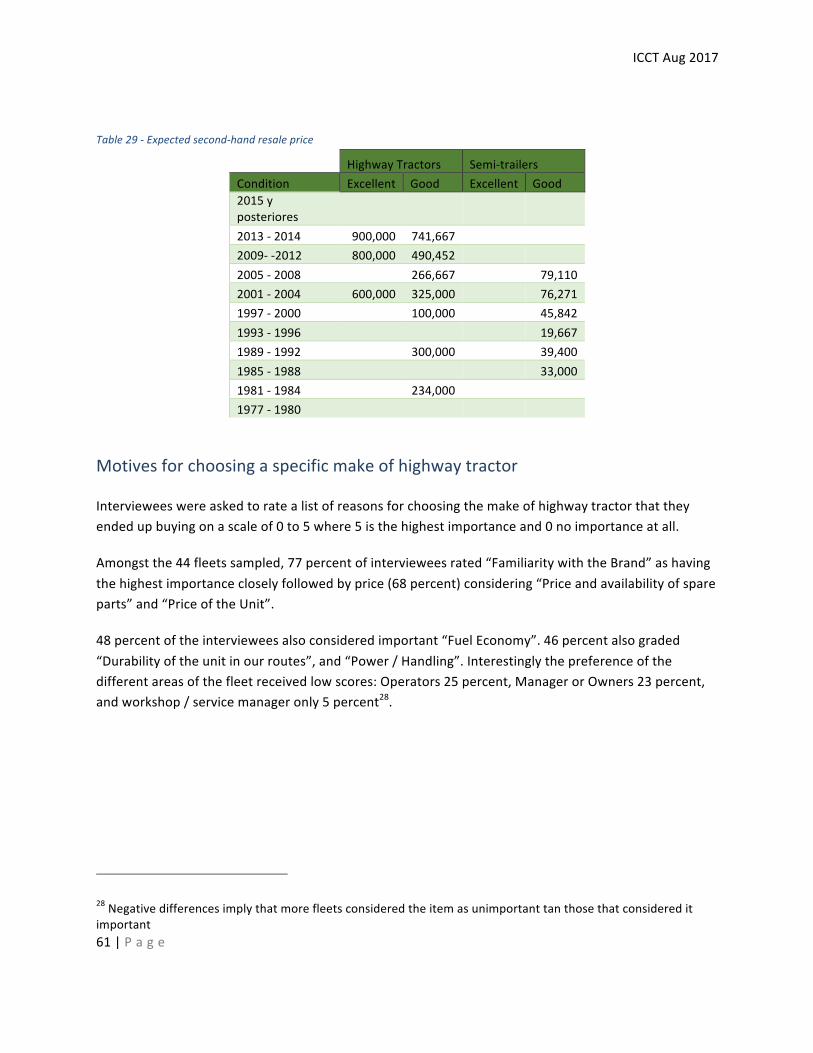
ICCTAug2017
61|P a g e
Table29-Expectedsecond-handresaleprice
HighwayTractors Semi-trailersCondition Excellent Good Excellent Good2015yposteriores 2013-2014 900,000 741,667 2009--2012 800,000 490,452 2005-2008 266,667 79,1102001-2004 600,000 325,000 76,2711997-2000 100,000 45,8421993-1996 19,6671989-1992 300,000 39,4001985-1988 33,0001981-1984 234,000 1977-1980
Motivesforchoosingaspecificmakeofhighwaytractor
Intervieweeswereaskedtoratealistofreasonsforchoosingthemakeofhighwaytractorthattheyendedupbuyingonascaleof0to5where5isthehighestimportanceand0noimportanceatall.
Amongstthe44fleetssampled,77percentofintervieweesrated“FamiliaritywiththeBrand”ashavingthehighestimportancecloselyfollowedbyprice(68percent)considering“Priceandavailabilityofspareparts”and“PriceoftheUnit”.
48percentoftheintervieweesalsoconsideredimportant“FuelEconomy”.46percentalsograded“Durabilityoftheunitinourroutes”,and“Power/Handling”.Interestinglythepreferenceofthedifferentareasofthefleetreceivedlowscores:Operators25percent,ManagerorOwners23percent,andworkshop/servicemanageronly5percent28.
28Negativedifferencesimplythatmorefleetsconsideredtheitemasunimportanttanthosethatconsidereditimportant

ICCTAug2017
62|P a g e
Table30–ReasonsforchoosingthismakeofHighwayTractor
Important Neutral UnimportantRating 4or5 3 0,1,or2
FamiliaritywiththeBrand 77.3% 18.2% 4.5%Priceandavailabilityofspareparts 68.2% 27.3% 4.5%PriceoftheUnit 68.2% 29.5% 2.3%Fueleconomy 47.7% 47.7% 4.5%Durabilityinourroutes 45.5% 45.5% 9.1%Power/Handling 45.5% 47.7% 6.8%Preferenceoftheoperators 25.0% 68.2% 6.8%Peferenceofthefleet(ManagerorOwners) 22.7% 77.3% 0.0%Availabilityofcredit 18.2% 70.5% 11.4%Toretaingoodoperators 9.1% 81.8% 9.1%ContractualObligationsoftheCompany 6.8% 81.8% 11.4%Preferenceoftheworkshop/servicemanager 4.5% 84.1% 11.4%
Motivesforchoosingaspecificmakeofsemi-trailer
Forsemi-trailers,amongstthe44fleetsinterviewed,theoverwhelmingreasonforselectingaspecificunitisprice(57percentofinterviewees)followedby“FamiliaritywiththeBrand”(50percent)andDurabilityinourroutes(46percent).“Priceandavailabilityofspareparts”cameinfourthplacewith32percentofthesample.Allotherreasons,includingpreferencesofoperators,ownersandservicemanagersreceivedlittleimportance(seeTable31).
Table31-ReasonsforchoosingthismakeofSemi-trailer
Important Neutral UnimportantRating 4or5 3% 0,1,or2
UnitPrice 56.8% 38.6% 4.5%FamiliaritywiththeBrand 50.0% 47.7% 2.3%Durabilityinourroutes 45.5% 52.3% 2.3%Priceandavailabilityofspareparts 31.8% 61.4% 6.8%FuelEconomy 18.2% 70.5% 11.4%Power/Handling 18.2% 68.2% 13.6%Preferenceoftheflotilla(managerorowners) 11.4% 88.6% 0.0%Creditavailability 11.4% 79.5% 9.1%Preferenceoftheoperators 9.1% 79.5% 11.4%Preferenceoftheworkshop/servicemanager 4.5% 86.4% 9.1%ContractualObligationsoftheCompany 4.5% 88.6% 6.8%Toretaingoodoperators 2.3% 86.4% 11.4%
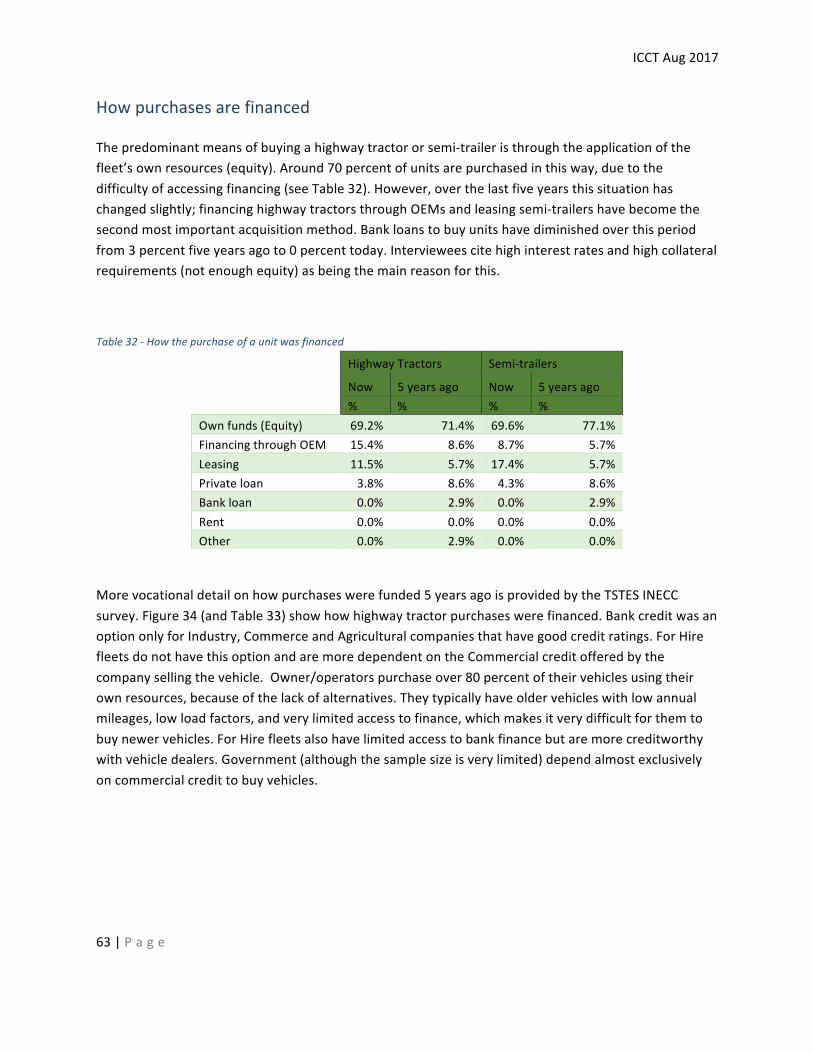
ICCTAug2017
63|P a g e
Howpurchasesarefinanced
Thepredominantmeansofbuyingahighwaytractororsemi-traileristhroughtheapplicationofthefleet’sownresources(equity).Around70percentofunitsarepurchasedinthisway,duetothedifficultyofaccessingfinancing(seeTable32).However,overthelastfiveyearsthissituationhaschangedslightly;financinghighwaytractorsthroughOEMsandleasingsemi-trailershavebecomethesecondmostimportantacquisitionmethod.Bankloanstobuyunitshavediminishedoverthisperiodfrom3percentfiveyearsagoto0percenttoday.Intervieweescitehighinterestratesandhighcollateralrequirements(notenoughequity)asbeingthemainreasonforthis.
Table32-Howthepurchaseofaunitwasfinanced
HighwayTractors Semi-trailers
Now 5yearsago Now 5yearsago % % % %Ownfunds(Equity) 69.2% 71.4% 69.6% 77.1%FinancingthroughOEM 15.4% 8.6% 8.7% 5.7%Leasing 11.5% 5.7% 17.4% 5.7%Privateloan 3.8% 8.6% 4.3% 8.6%Bankloan 0.0% 2.9% 0.0% 2.9%Rent 0.0% 0.0% 0.0% 0.0%Other 0.0% 2.9% 0.0% 0.0%
Morevocationaldetailonhowpurchaseswerefunded5yearsagoisprovidedbytheTSTESINECCsurvey.Figure34(andTable33)showhowhighwaytractorpurchaseswerefinanced.BankcreditwasanoptiononlyforIndustry,CommerceandAgriculturalcompaniesthathavegoodcreditratings.ForHirefleetsdonothavethisoptionandaremoredependentontheCommercialcreditofferedbythecompanysellingthevehicle.Owner/operatorspurchaseover80percentoftheirvehiclesusingtheirownresources,becauseofthelackofalternatives.Theytypicallyhaveoldervehicleswithlowannualmileages,lowloadfactors,andverylimitedaccesstofinance,whichmakesitverydifficultforthemtobuynewervehicles.ForHirefleetsalsohavelimitedaccesstobankfinancebutaremorecreditworthywithvehicledealers.Government(althoughthesamplesizeisverylimited)dependalmostexclusivelyoncommercialcredittobuyvehicles.
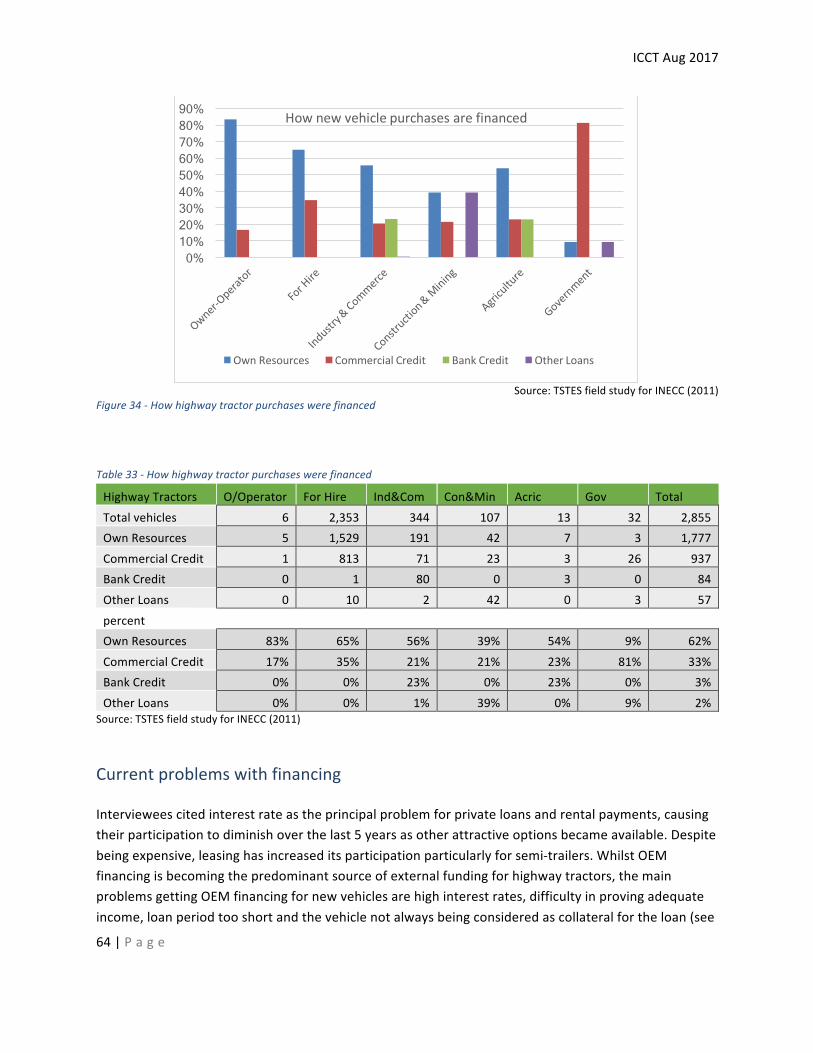
ICCTAug2017
64|P a g e
Source:TSTESfieldstudyforINECC(2011)
Figure34-Howhighwaytractorpurchaseswerefinanced
Table33-Howhighwaytractorpurchaseswerefinanced
HighwayTractors O/Operator ForHire Ind&Com Con&Min Acric Gov TotalTotalvehicles 6 2,353 344 107 13 32 2,855OwnResources 5 1,529 191 42 7 3 1,777CommercialCredit 1 813 71 23 3 26 937BankCredit 0 1 80 0 3 0 84OtherLoans 0 10 2 42 0 3 57percent OwnResources 83% 65% 56% 39% 54% 9% 62%CommercialCredit 17% 35% 21% 21% 23% 81% 33%BankCredit 0% 0% 23% 0% 23% 0% 3%OtherLoans 0% 0% 1% 39% 0% 9% 2%
Source:TSTESfieldstudyforINECC(2011)
Currentproblemswithfinancing
Intervieweescitedinterestrateastheprincipalproblemforprivateloansandrentalpayments,causingtheirparticipationtodiminishoverthelast5yearsasotherattractiveoptionsbecameavailable.Despitebeingexpensive,leasinghasincreaseditsparticipationparticularlyforsemi-trailers.WhilstOEMfinancingisbecomingthepredominantsourceofexternalfundingforhighwaytractors,themainproblemsgettingOEMfinancingfornewvehiclesarehighinterestrates,difficultyinprovingadequateincome,loanperiodtooshortandthevehiclenotalwaysbeingconsideredascollateralfortheloan(see
0% 10% 20% 30% 40% 50% 60% 70% 80% 90% Hownewvehiclepurchasesarefinanced
OwnResources CommercialCredit BankCredit OtherLoans
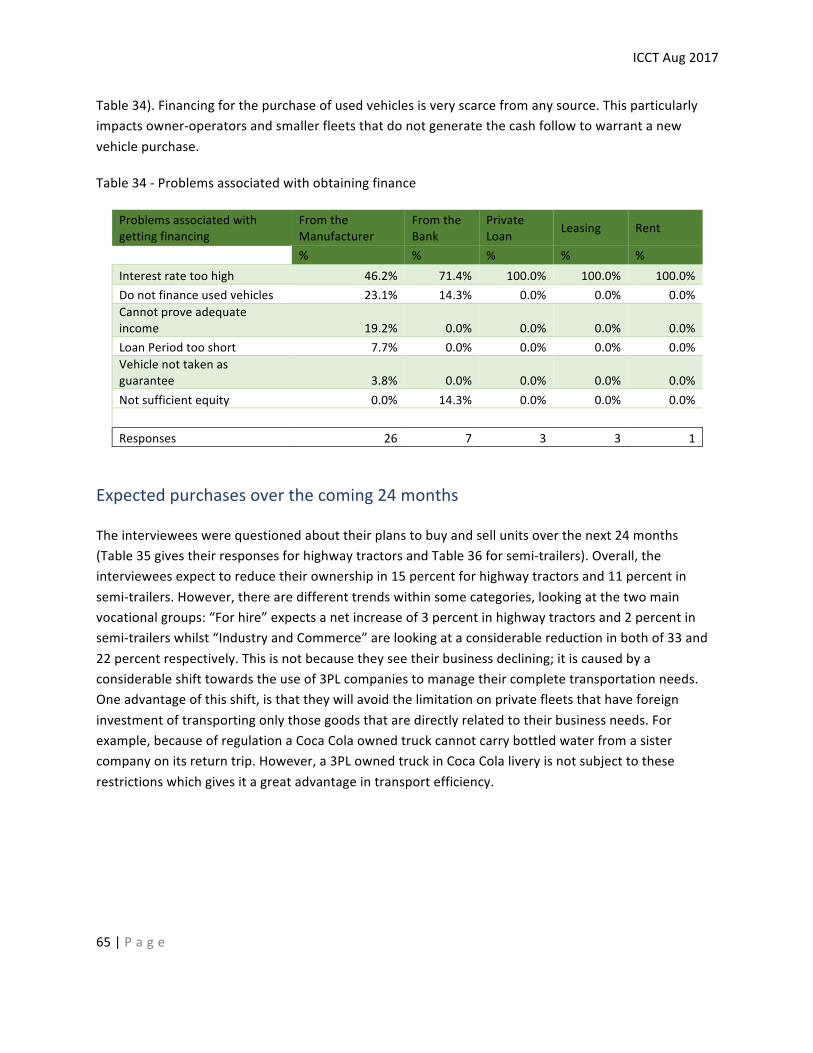
ICCTAug2017
65|P a g e
Table34).Financingforthepurchaseofusedvehiclesisveryscarcefromanysource.Thisparticularlyimpactsowner-operatorsandsmallerfleetsthatdonotgeneratethecashfollowtowarrantanewvehiclepurchase.
Table34-Problemsassociatedwithobtainingfinance
Problemsassociatedwithgettingfinancing
FromtheManufacturer
FromtheBank
PrivateLoan Leasing Rent
% % % % %Interestratetoohigh 46.2% 71.4% 100.0% 100.0% 100.0%Donotfinanceusedvehicles 23.1% 14.3% 0.0% 0.0% 0.0%Cannotproveadequateincome 19.2% 0.0% 0.0% 0.0% 0.0%LoanPeriodtooshort 7.7% 0.0% 0.0% 0.0% 0.0%Vehiclenottakenasguarantee 3.8% 0.0% 0.0% 0.0% 0.0%Notsufficientequity 0.0% 14.3% 0.0% 0.0% 0.0% Responses 26 7 3 3 1
Expectedpurchasesoverthecoming24months
Theintervieweeswerequestionedabouttheirplanstobuyandsellunitsoverthenext24months(Table35givestheirresponsesforhighwaytractorsandTable36forsemi-trailers).Overall,theintervieweesexpecttoreducetheirownershipin15percentforhighwaytractorsand11percentinsemi-trailers.However,therearedifferenttrendswithinsomecategories,lookingatthetwomainvocationalgroups:“Forhire”expectsanetincreaseof3percentinhighwaytractorsand2percentinsemi-trailerswhilst“IndustryandCommerce”arelookingataconsiderablereductioninbothof33and22percentrespectively.Thisisnotbecausetheyseetheirbusinessdeclining;itiscausedbyaconsiderableshifttowardstheuseof3PLcompaniestomanagetheircompletetransportationneeds.Oneadvantageofthisshift,isthattheywillavoidthelimitationonprivatefleetsthathaveforeigninvestmentoftransportingonlythosegoodsthataredirectlyrelatedtotheirbusinessneeds.Forexample,becauseofregulationaCocaColaownedtruckcannotcarrybottledwaterfromasistercompanyonitsreturntrip.However,a3PLownedtruckinCocaColaliveryisnotsubjecttotheserestrictionswhichgivesitagreatadvantageintransportefficiency.
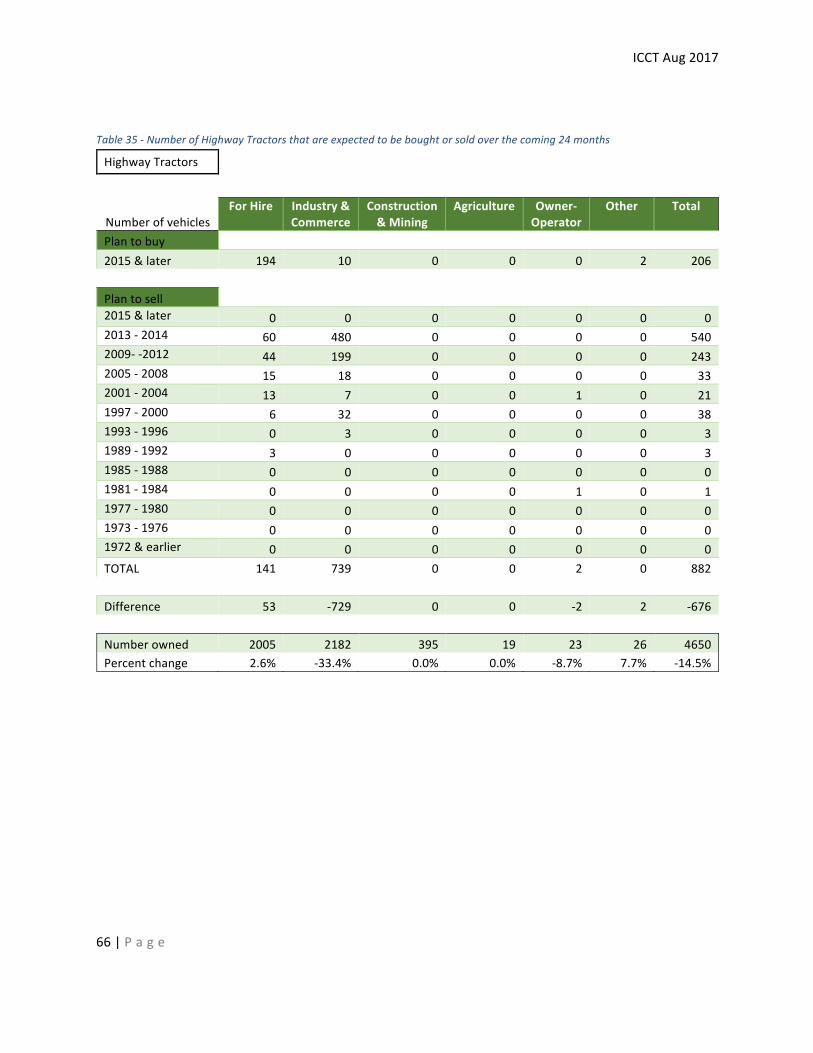
ICCTAug2017
66|P a g e
Table35-NumberofHighwayTractorsthatareexpectedtobeboughtorsoldoverthecoming24months
HighwayTractors
NumberofvehiclesForHire Industry&
CommerceConstruction&Mining
Agriculture Owner-Operator
Other Total
Plantobuy 2015&later 194 10 0 0 0 2 206 Plantosell 2015&later 0 0 0 0 0 0 02013-2014 60 480 0 0 0 0 5402009--2012 44 199 0 0 0 0 2432005-2008 15 18 0 0 0 0 332001-2004 13 7 0 0 1 0 211997-2000 6 32 0 0 0 0 381993-1996 0 3 0 0 0 0 31989-1992 3 0 0 0 0 0 31985-1988 0 0 0 0 0 0 01981-1984 0 0 0 0 1 0 11977-1980 0 0 0 0 0 0 01973-1976 0 0 0 0 0 0 01972&earlier 0 0 0 0 0 0 0TOTAL 141 739 0 0 2 0 882 Difference 53 -729 0 0 -2 2 -676 Numberowned 2005 2182 395 19 23 26 4650Percentchange 2.6% -33.4% 0.0% 0.0% -8.7% 7.7% -14.5%
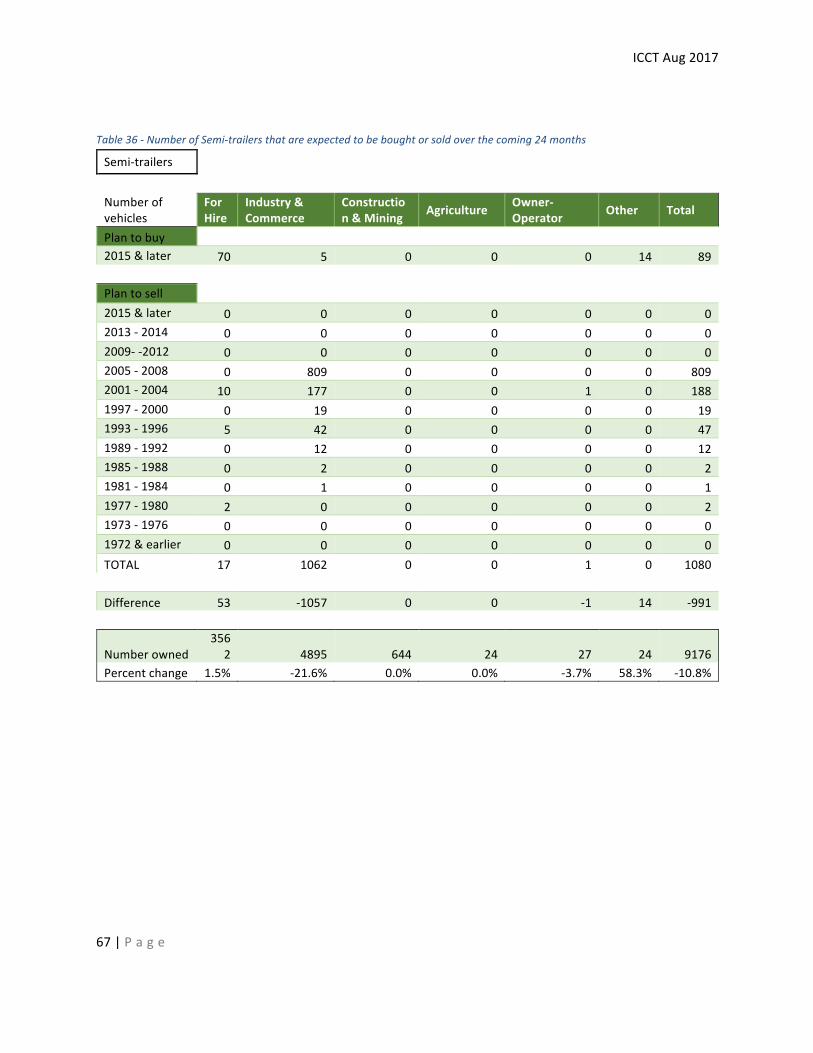
ICCTAug2017
67|P a g e
Table36-NumberofSemi-trailersthatareexpectedtobeboughtorsoldoverthecoming24months
Semi-trailers Numberofvehicles
ForHire
Industry&Commerce
Construction&Mining Agriculture Owner-
Operator Other Total
Plantobuy 2015&later 70 5 0 0 0 14 89 Plantosell 2015&later 0 0 0 0 0 0 02013-2014 0 0 0 0 0 0 02009--2012 0 0 0 0 0 0 02005-2008 0 809 0 0 0 0 8092001-2004 10 177 0 0 1 0 1881997-2000 0 19 0 0 0 0 191993-1996 5 42 0 0 0 0 471989-1992 0 12 0 0 0 0 121985-1988 0 2 0 0 0 0 21981-1984 0 1 0 0 0 0 11977-1980 2 0 0 0 0 0 21973-1976 0 0 0 0 0 0 01972&earlier 0 0 0 0 0 0 0TOTAL 17 1062 0 0 1 0 1080 Difference 53 -1057 0 0 -1 14 -991
Numberowned356
2 4895 644 24 27 24 9176Percentchange 1.5% -21.6% 0.0% 0.0% -3.7% 58.3% -10.8%
ICCTAug2017
68|P a g e
Chapter5:-Tractor-trailerUsageandOperatingCosts
Thischaptercompilesinformationonthehowvarioustypesoffleetsdifferintermsofoperatingpatterns.Itlooksattractor-trailerusage,triplengthandfrequency.Itevaluatesfueleconomyandotheroperatingcosts,withdetailsbyageofvehicleandbyvocation.
HighwaytractorkilometersperyearIngeneralterms,theannualuseofhighwaytractorsisreducedastheirageincreases.Newunitsoperateonaveragearound140,000kmsperyear.Bythetimetheyare20yearsoldthisaverageannualusagehasdroppedtoaround100,000kmsandbythetimetheyare30yearsoldtheannualaverageusageisaround50,000kmsperyear.Thischangeinusageisbroughtaboutbychangesinownership.Theoverallaverageannualmileagepervehicleinthislatestcombinedsampleis131,000kms.IntheMacKaystudy(2015)theaverageannualmileagepervehiclewas128,000kms,whichis12percenthigherthantheaverageintheUSAatthattime.HighwaytractornumberoftripsandtriplengthIndustryandCommerce“IndustryandCommerce”fleetstendtorundailytripsof400to600kmswithnewervehiclesatthehighendofthisscaleandoldervehiclesrunningaround50percentlesstriplengths.Theytendtousehighwaytractorsofupto25yearsold,whilsttherearesomeoutliers.Whenthevehicleisnolongeraptfortheirroutes,theytendtogetsoldtoOwner-operators.Annualmileageforthesevehiclesstartsaround115,000kmsoverthefirst8yearsoflife,anddropstoaround65,000kmsover25years.ForHire“ForHire”fleetstendtooperatealmosthalfthenumberoftripspermonthcomparedto“IndustryandCommerce”fleetsandthisvarieslittlewiththeageofthevehicle.However,theaveragetriplengthdoesgetreducedasthehighwaytractorgrowsolderandispassedfromlargefleetstomediumandsmallerbrethren.Thenewerhighwaytractorsofupto6-8yearsoldin“ForHire”fleetstendtooperateinthelargefleetswithtriplengthsofaround1,500kms.Thesevehiclesthengetpassedtomediumfleetsthattendtorunonsecondaryormoregeographicallychallengingrouteswithanaveragetriplengthof800to900kms.Theoldestvehicles(ofaround30yearsold)tendtobeusedinlowmileage,feeder,andpick-upanddeliveryservice.Asaresult,highwaytractorsin“ForHire”fleetshaveannualmileagesthatstartaround135,000kmsperyear(whichisone-quarterhigherthanIndustryandCommerce)anddroptoone-tenthofthisvalueastheygetolder.WhentheygetabsorbedbyOwner-operators,theirusagetendstochangetofarfewerbutlongertripsgivingsimilarannualmileagesorlesskm.
ChapterHighlights
ICCTAug2017
69|P a g e
Intervieweesinthisvocationreportedforvehiclesover15yearsold,routesof3to7tripspermonthgeneratingannualmileagesof35,000kmsFuelEconomyFueleconomyofhighwaytractorshasimprovedconsiderablyoverrecentyears.Nationwide,onaverage,tractor-trailerfueleconomyinnewunitsis42percentbetterthanin30-yearoldunits.ForHireFor“ForHire”fleetsthelatestsurveyshowsanaveragefueleconomyfora30-year-oldtruckof1.7km/Lcomparedwith2.6km/Lforanewunit.Notethatthetrueefficiencyimprovementisgreaterthanthesenumberssuggestbecausethenewunitstendtobeinlongertripswithhigherroadspeedsthantheirolderbrethren.Manyfleetscommentthatthisdifferenceinfuelconsumptionisalmostsufficienttocoverthemonthlypaymentagainstbuyinganewvehicle.IndustryandCommerceThe“IndustryandCommerce”vocationseessimilarfueleconomiesonoldtrucksthan“ForHire”butlessimprovementwithnewunitsmainlybecauseoftheincreasinguseofdoubles(orfull)withamaximumGVWof66.5tons(withahigherlimitof75.5tonsonroadtypes“ET”and“A”)comparedto38tonsforastandard“T3-S2”rigonclass“B”roads.Itisimportanttonotethatthefueleconomyperkgtransportedisconsiderablyhigherinadoubleconfiguration.Itisinterestingtonotetheimpactofthechangeindrivecycleonfueleconomyasvehiclesgetolderandgetpassedfromprincipalfreightroutestosecondaryorfeederoperationsinsmallfleetsandwithowner-operators.ThenormaldrivecycleinMexicoapplicabletomainrouteoperationgivesanexpectedfueleconomyof3.3km/L(forEUROIII,34–40tonsGCW)whilstthesamevehicleinalighterfeeder-operationdrivecyclewithlowerloadandlesshighwayoperationgivesanexpectedfueleconomyof4.2km/L.Inpractice,lowerfueleconomiesarereporteddueto(i)theuseofdoublesorfulls,(ii)maintenanceanddrivingpractices;and(ii)themoredifficultrouteconditionsonthesecondaryandfeederroutes.OperatingExpensesIncludingoperatorandfuel,at2017prices,expenditureperkilometerincreasesslightlyfromaround10.5pesos/kmoverthefirst6–8yearstoalmost12pesos/kmafter25yearsofuse.ExcludingOperatorandFuel,theFor-Hirefleetshavethelowestaveragecostperkilometer($3.4MN/km)whilstIndustryandCommerceshowanaverageexpenseof$7.5MN/km.Significantdifferencesintheexpensesbyvocationexist.The“ForHire”reportsspendingmorethan“IndustryandCommerce”inLicenses&taxes,andInsurance;andconsiderablylessinTollsandCorrectiveMaintenance.
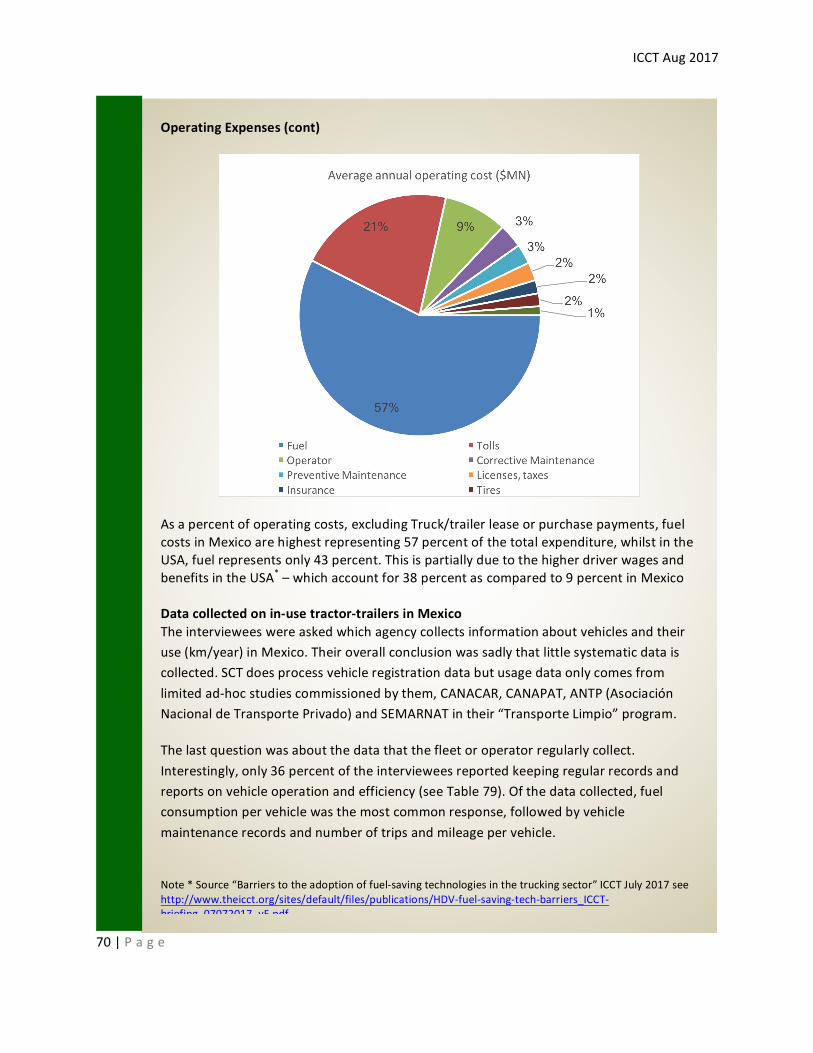
ICCTAug2017
70|P a g e
OperatingExpenses(cont)
Asapercentofoperatingcosts,excludingTruck/trailerleaseorpurchasepayments,fuelcostsinMexicoarehighestrepresenting57percentofthetotalexpenditure,whilstintheUSA,fuelrepresentsonly43percent.ThisispartiallyduetothehigherdriverwagesandbenefitsintheUSA*–whichaccountfor38percentascomparedto9percentinMexicoDatacollectedonin-usetractor-trailersinMexicoTheintervieweeswereaskedwhichagencycollectsinformationaboutvehiclesandtheiruse(km/year)inMexico.Theiroverallconclusionwassadlythatlittlesystematicdataiscollected.SCTdoesprocessvehicleregistrationdatabutusagedataonlycomesfromlimitedad-hocstudiescommissionedbythem,CANACAR,CANAPAT,ANTP(AsociaciónNacionaldeTransportePrivado)andSEMARNATintheir“TransporteLimpio”program.
Thelastquestionwasaboutthedatathatthefleetoroperatorregularlycollect.Interestingly,only36percentoftheintervieweesreportedkeepingregularrecordsandreportsonvehicleoperationandefficiency(seeTable79).Ofthedatacollected,fuelconsumptionpervehiclewasthemostcommonresponse,followedbyvehiclemaintenancerecordsandnumberoftripsandmileagepervehicle.
Note*Source“Barrierstotheadoptionoffuel-savingtechnologiesinthetruckingsector”ICCTJuly2017seehttp://www.theicct.org/sites/default/files/publications/HDV-fuel-saving-tech-barriers_ICCT-briefing_07072017_vF.pdf
ICCTAug2017
71|P a g e
Theroleofthedifferenttypesoffleets
Theon-road,highwaytractor,freighttransportinMexicoisclearlydividedintotwosegments:
• Privatetransport–companiesthathavefleetstotransporttheproductsthattheymanufactureordistribute;and
• ForHire-fleetsthattransportgoodforothers
ArelativelynewmodalityinMexicoarethethird-partylogisticscompanies(3PL)whichprovideseamlesstransportservicestomanufacturersanddistributioncompanies,oftenwithtrucksandpersonnelintheclient’slivery.LogisticscompaniesarenotyetasprevalentinMexicoastheyareintheU.S.fortheyarestillgenerallyconsideredastooexpensivefortheMexicanmarketbuttheyarebeginningtoplayalargerpart,withyear-on-yeargrowthratesthatfarexceedtheaveragefortheMexicantruckingindustry.
Thetraditionaladvantagesofoutsourcingsupplychainmanagementtoa3PLleveragetheirhavingalargerfleetthantheclientcompanybyitselfwouldhave,whichresultsineconomyofscale,andbeingbusinessesthataretotallyfocusedontransport(whereastheclient’sfocusisonhiscoreproductionbusinesswheretransportisbutanecessarypart).Large3PLsalsoprovideflexibleandscalableservicesthataccommodateseasonalityandgrowth.However,evenfora3PLwithlimitedclients,therecanbesignificantadvantages:
• Ascanbeseeninalatersectionofthisstudy,ForHirefleets(whosebusinessistransport)tendtobemoreefficientthanprivatefleets’transportoperations
• Frees-upthecapitalrequirementofowningafleet,releasingvaluableequityandmanagementresources,andconvertingtransportintoavariablecost;and
• AbigthinginMexico,allowsfreighttobemoreeasilycarriedonboththeoutwardandreturnjourneytrips.
PrivatetransportinMexicoincompaniesthathaveforeigninvestment(equity)arenotallowedtotransportgoodsforothercompanies.Thismakesitdifficultforatractor-trailerthatisdeliveringgoodstoadistributioncenterorclient,toswing-byasupplier,orSisterCompanyandgetafullloadforthereturntrip.3PLsarenotsubjecttotheselimitations.
Whilstlargeprofessionallymanagedfleetsneedlittleornogovernmenthelpduetotheirfinancialmuscleandtheirdepthofknowledgeabouttheirownoperations,smallfleetsandowner-operatorsremainanimportantchallenge,particularlyfortheTransporteLimpioandsimilarprograms.
Theowner-operatorsandsmallfleets,representalargeportionoftheregisteredfleet,havetheoldestvehicles,andnotablylowerefficiencythantheirlargerbrethren.Aspreviouslymentionedtheytendtohaveconsiderablylowerannualmileagesandlowerloadfactors,operatingondifficultroutesthatarenotattractivetothelargerfleetsoronlocalfeederoperations.
ICCTAug2017
72|P a g e
Owner-operatorsprovidetransportservicestotheclientswhodonotrequirecontrolssuchasISO900029;andwhopaycash.Theywilloftenchoosetheclientwhopayslessbutpaysfasterbecausemanyexistonacash-flowbasisandliquidityisessential.
Owner-operatorsprovidetransportforlow-valueloads(forexamplefororangesfromMeridatoMexicoCity)thatcannotaffordahighercostservice.Theseareloadsthatwillnevergotothelargecarrier,theywillalwaysgowithwhoeverprovidesthecheapestservice.
Owner-operatorsdonottypicallyparticipateinthemoreformalmarketthatlooksforawellconstitutedcompanythatoffersatrackingsystem,insurance,andalotoffactors,suchascertification,andtheassurancethatthedriverwillmotmesswiththeload.Therearemanyadvantagestohiringawell-establishedcompanyratherthananowner-operator;itisnotthesametransportingorangesasmoving,forexample,cyanide.
Moststakeholdersinterviewed,includinggovernmentagenciessuchastheSMAEMrecognizetheneedforimprovededucationandknowledgedistributiontothesesmalleroperators,toincreasetheirunderstandingofcost/benefitanalysisandotherbasicanalyticaltools.AccordingtointervieweeRafaelTapiaVelázquez,betterinformationandtrainingwouldallowthesmallerenterprisestobetterobservefactors,suchasenergyconsumption,thattheymaynotbecurrentlymonitoring.Transportprograms,includingbutnotlimitedtothescrappage&renewablescheme,wouldbenefitgreatlyfromsmallerenterprisesunderstandingtheprocessandbenefitsofsuchprograms.
Highwaytractorkilometersperyear
Theaveragevehicleusagebyageandvocationwasdeterminedfromfieldsurveysof179fleetsthatowned9601class8highwaytractors.TheresultsofthesesurveysareshowninTable37andFigure35.Theyareofcourselimitedbytheageofthevehiclesineachsample.Forexample,theGovernmentvocationsampledoesnotcontainanyvehiclesofbetween9and28yearsofuse.
Ingeneralterms(notvocationspecific)theannualuseofhighwaytractorsisreducedastheirageincreases(seeFigure35).Newunitsoperateonaveragearound140,000kmsperyear.Bythetimetheyare20yearsoldthisaverageannualusagehasdroppedtoaround100,000kmsandbythetimetheyare30yearsoldtheannualaverageusageisaround50,000kmsperyear.Aswewillseebyvocation,thischangeinusageisbroughtaboutbychangesinownership.
29ISO9000isasetofinternationalstandardsonqualitymanagementandqualityassurancedevelopedtohelpcompanieseffectivelydocumentthequalitysystemelementstobeimplementedtomaintainanefficientqualitysystem.Theyarenotspecifictoanyoneindustryandcanbeappliedtoorganizationsofanysize.
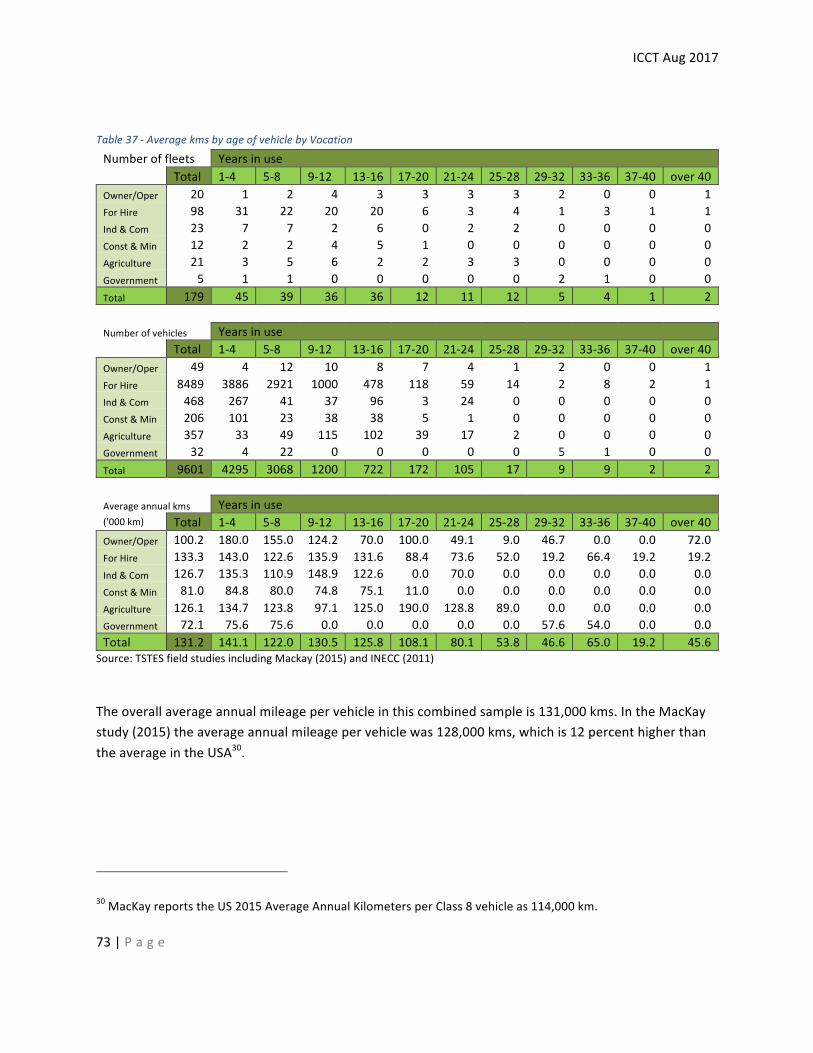
ICCTAug2017
73|P a g e
Table37-AveragekmsbyageofvehiclebyVocation
Numberoffleets Yearsinuse Total 1-4 5-8 9-12 13-16 17-20 21-24 25-28 29-32 33-36 37-40 over40Owner/Oper 20 1 2 4 3 3 3 3 2 0 0 1ForHire 98 31 22 20 20 6 3 4 1 3 1 1Ind&Com 23 7 7 2 6 0 2 2 0 0 0 0Const&Min 12 2 2 4 5 1 0 0 0 0 0 0Agriculture 21 3 5 6 2 2 3 3 0 0 0 0Government 5 1 1 0 0 0 0 0 2 1 0 0Total 179 45 39 36 36 12 11 12 5 4 1 2 Numberofvehicles Yearsinuse Total 1-4 5-8 9-12 13-16 17-20 21-24 25-28 29-32 33-36 37-40 over40Owner/Oper 49 4 12 10 8 7 4 1 2 0 0 1ForHire 8489 3886 2921 1000 478 118 59 14 2 8 2 1Ind&Com 468 267 41 37 96 3 24 0 0 0 0 0Const&Min 206 101 23 38 38 5 1 0 0 0 0 0Agriculture 357 33 49 115 102 39 17 2 0 0 0 0Government 32 4 22 0 0 0 0 0 5 1 0 0Total 9601 4295 3068 1200 722 172 105 17 9 9 2 2 Averageannualkms Yearsinuse('000km) Total 1-4 5-8 9-12 13-16 17-20 21-24 25-28 29-32 33-36 37-40 over40Owner/Oper 100.2 180.0 155.0 124.2 70.0 100.0 49.1 9.0 46.7 0.0 0.0 72.0ForHire 133.3 143.0 122.6 135.9 131.6 88.4 73.6 52.0 19.2 66.4 19.2 19.2Ind&Com 126.7 135.3 110.9 148.9 122.6 0.0 70.0 0.0 0.0 0.0 0.0 0.0Const&Min 81.0 84.8 80.0 74.8 75.1 11.0 0.0 0.0 0.0 0.0 0.0 0.0Agriculture 126.1 134.7 123.8 97.1 125.0 190.0 128.8 89.0 0.0 0.0 0.0 0.0Government 72.1 75.6 75.6 0.0 0.0 0.0 0.0 0.0 57.6 54.0 0.0 0.0Total 131.2 141.1 122.0 130.5 125.8 108.1 80.1 53.8 46.6 65.0 19.2 45.6
Source:TSTESfieldstudiesincludingMackay(2015)andINECC(2011)
Theoverallaverageannualmileagepervehicleinthiscombinedsampleis131,000kms.IntheMacKaystudy(2015)theaverageannualmileagepervehiclewas128,000kms,whichis12percenthigherthantheaverageintheUSA30.
30MacKayreportstheUS2015AverageAnnualKilometersperClass8vehicleas114,000km.
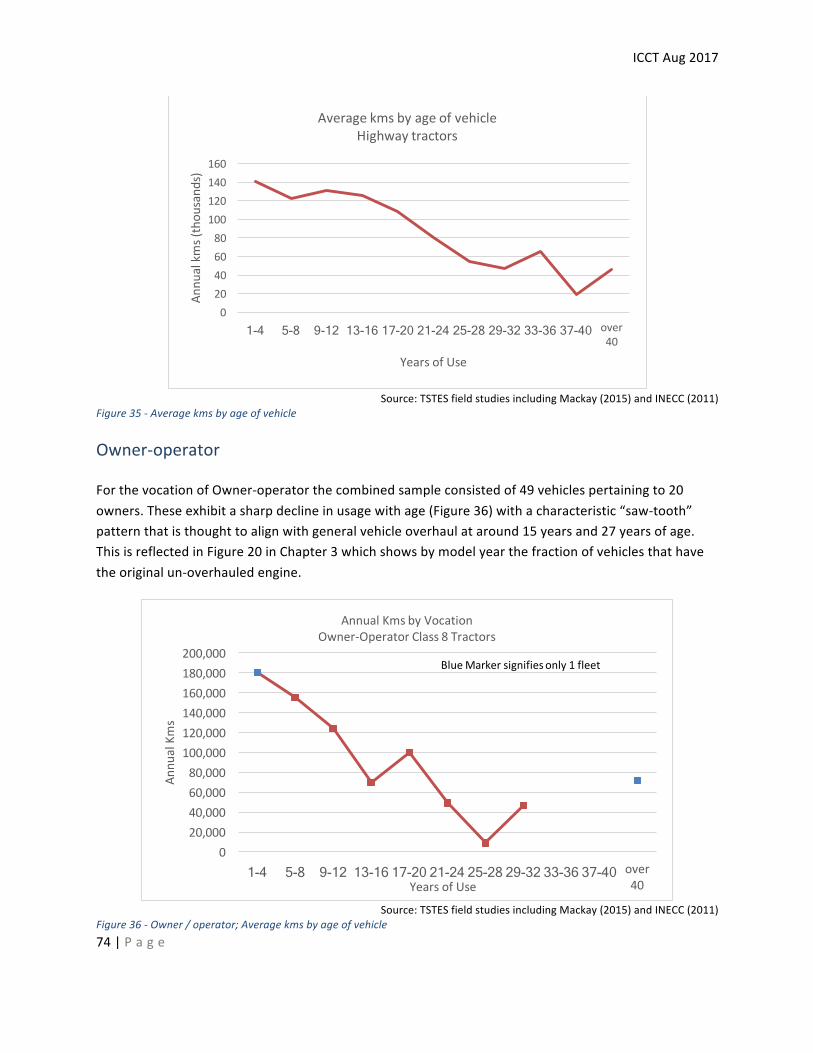
ICCTAug2017
74|P a g e
Source:TSTESfieldstudiesincludingMackay(2015)andINECC(2011)
Figure35-Averagekmsbyageofvehicle
Owner-operator
ForthevocationofOwner-operatorthecombinedsampleconsistedof49vehiclespertainingto20owners.Theseexhibitasharpdeclineinusagewithage(Figure36)withacharacteristic“saw-tooth”patternthatisthoughttoalignwithgeneralvehicleoverhaulataround15yearsand27yearsofage.ThisisreflectedinFigure20inChapter3whichshowsbymodelyearthefractionofvehiclesthathavetheoriginalun-overhauledengine.
Source:TSTESfieldstudiesincludingMackay(2015)andINECC(2011)
Figure36-Owner/operator;Averagekmsbyageofvehicle
020406080
100120140160
1-4 5-8 9-12 13-16 17-20 21-24 25-28 29-32 33-36 37-40 over40
Annu
alkms(thou
sand
s)
YearsofUse
AveragekmsbyageofvehicleHighwaytractors
020,00040,00060,00080,000100,000120,000140,000160,000180,000200,000
1-4 5-8 9-12 13-16 17-20 21-24 25-28 29-32 33-36 37-40 over40
Annu
alKms
YearsofUse
AnnualKmsbyVocationOwner-OperatorClass8Tractors
BlueMarkersignifiesonly1fleet
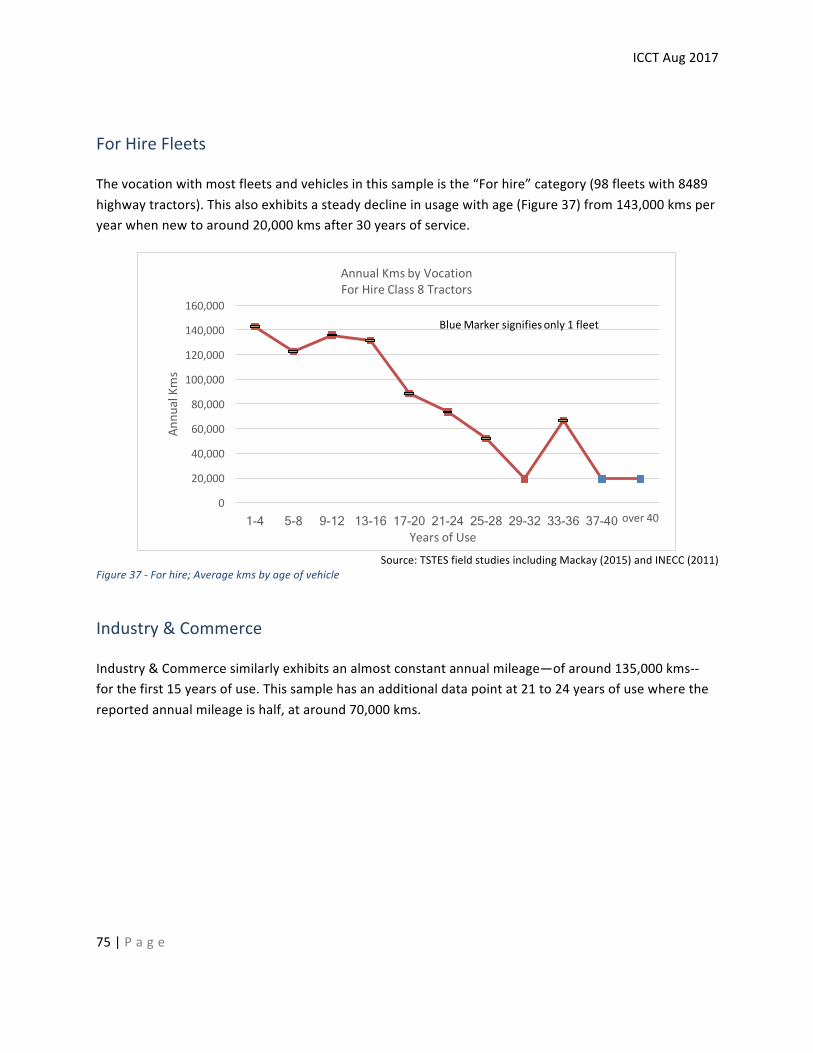
ICCTAug2017
75|P a g e
ForHireFleets
Thevocationwithmostfleetsandvehiclesinthissampleisthe“Forhire”category(98fleetswith8489highwaytractors).Thisalsoexhibitsasteadydeclineinusagewithage(Figure37)from143,000kmsperyearwhennewtoaround20,000kmsafter30yearsofservice.
Source:TSTESfieldstudiesincludingMackay(2015)andINECC(2011)
Figure37-Forhire;Averagekmsbyageofvehicle
Industry&Commerce
Industry&Commercesimilarlyexhibitsanalmostconstantannualmileage—ofaround135,000kms--forthefirst15yearsofuse.Thissamplehasanadditionaldatapointat21to24yearsofusewherethereportedannualmileageishalf,ataround70,000kms.
0
20,000
40,000
60,000
80,000
100,000
120,000
140,000
160,000
1-4 5-8 9-12 13-16 17-20 21-24 25-28 29-32 33-36 37-40 over40
Annu
alKms
YearsofUse
AnnualKmsbyVocationForHireClass8Tractors
BlueMarkersignifiesonly1fleet
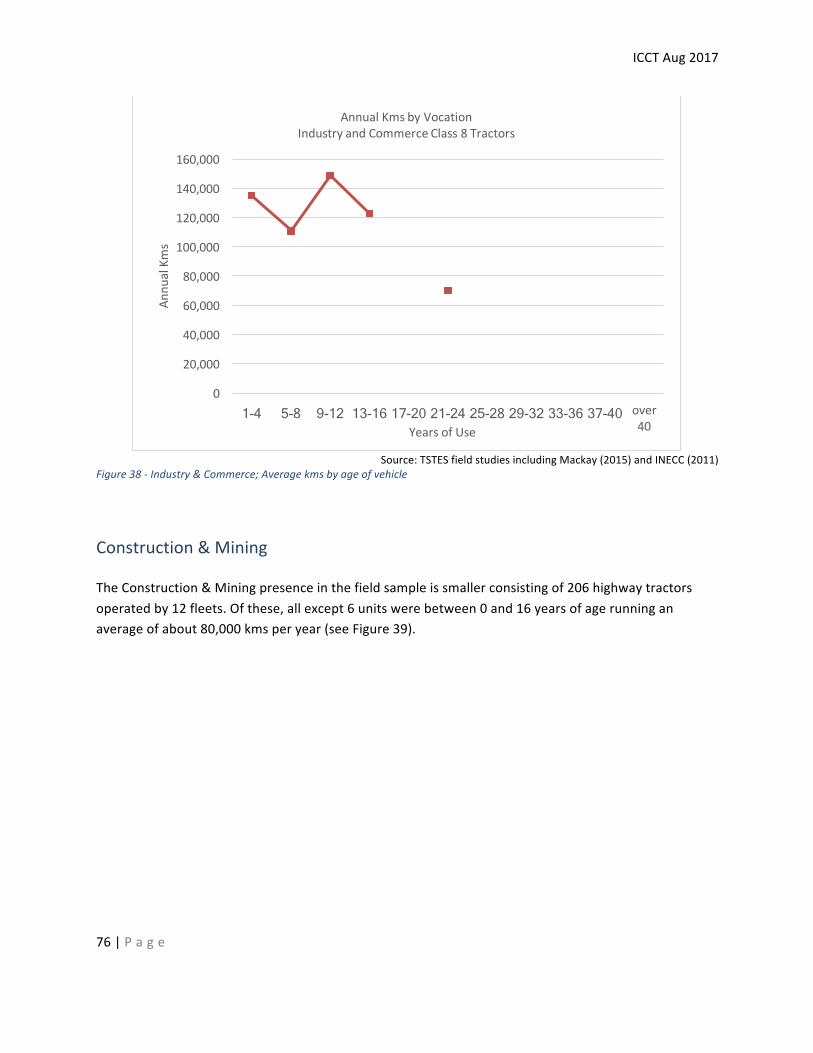
ICCTAug2017
76|P a g e
Source:TSTESfieldstudiesincludingMackay(2015)andINECC(2011)
Figure38-Industry&Commerce;Averagekmsbyageofvehicle
Construction&Mining
TheConstruction&Miningpresenceinthefieldsampleissmallerconsistingof206highwaytractorsoperatedby12fleets.Ofthese,allexcept6unitswerebetween0and16yearsofagerunninganaverageofabout80,000kmsperyear(seeFigure39).
0
20,000
40,000
60,000
80,000
100,000
120,000
140,000
160,000
1-4 5-8 9-12 13-16 17-20 21-24 25-28 29-32 33-36 37-40 over40
Annu
alKms
YearsofUse
AnnualKmsbyVocationIndustryandCommerceClass8Tractors
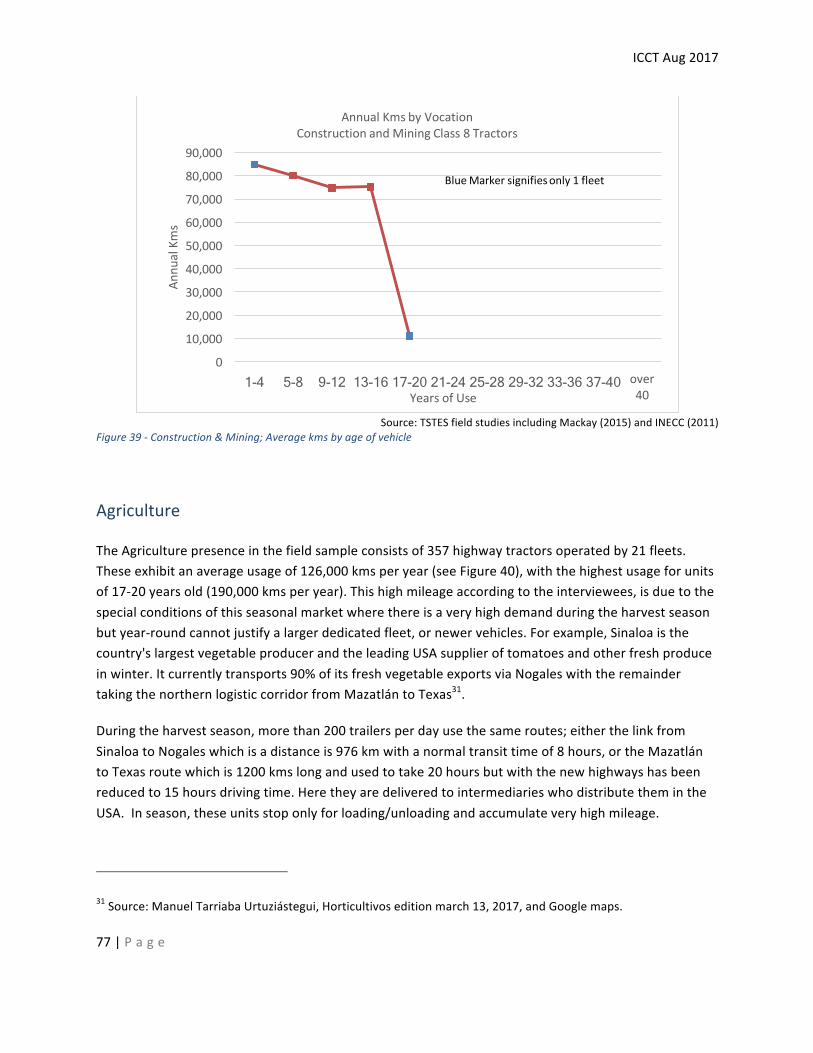
ICCTAug2017
77|P a g e
Source:TSTESfieldstudiesincludingMackay(2015)andINECC(2011)
Figure39-Construction&Mining;Averagekmsbyageofvehicle
Agriculture
TheAgriculturepresenceinthefieldsampleconsistsof357highwaytractorsoperatedby21fleets.Theseexhibitanaverageusageof126,000kmsperyear(seeFigure40),withthehighestusageforunitsof17-20yearsold(190,000kmsperyear).Thishighmileageaccordingtotheinterviewees,isduetothespecialconditionsofthisseasonalmarketwherethereisaveryhighdemandduringtheharvestseasonbutyear-roundcannotjustifyalargerdedicatedfleet,ornewervehicles.Forexample,Sinaloaisthecountry'slargestvegetableproducerandtheleadingUSAsupplieroftomatoesandotherfreshproduceinwinter.Itcurrentlytransports90%ofitsfreshvegetableexportsviaNogaleswiththeremaindertakingthenorthernlogisticcorridorfromMazatlántoTexas31.
Duringtheharvestseason,morethan200trailersperdayusethesameroutes;eitherthelinkfromSinaloatoNogaleswhichisadistanceis976kmwithanormaltransittimeof8hours,ortheMazatlántoTexasroutewhichis1200kmslongandusedtotake20hoursbutwiththenewhighwayshasbeenreducedto15hoursdrivingtime.HeretheyaredeliveredtointermediarieswhodistributethemintheUSA.Inseason,theseunitsstoponlyforloading/unloadingandaccumulateveryhighmileage.
31Source:ManuelTarriabaUrtuziástegui,Horticultivoseditionmarch13,2017,andGooglemaps.
0
10,000
20,000
30,000
40,000
50,000
60,000
70,000
80,000
90,000
1-4 5-8 9-12 13-16 17-20 21-24 25-28 29-32 33-36 37-40 over40
Annu
alKms
YearsofUse
AnnualKmsbyVocationConstructionandMiningClass8Tractors
BlueMarkersignifiesonly1fleet
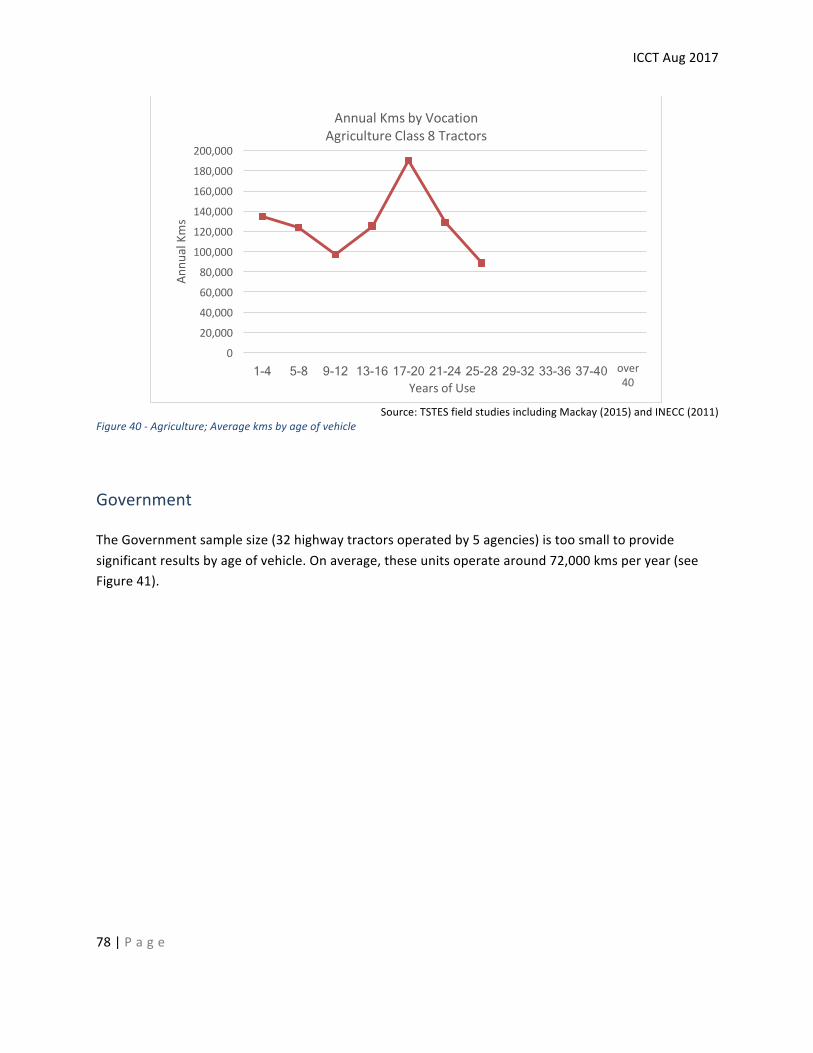
ICCTAug2017
78|P a g e
Source:TSTESfieldstudiesincludingMackay(2015)andINECC(2011)
Figure40-Agriculture;Averagekmsbyageofvehicle
Government
TheGovernmentsamplesize(32highwaytractorsoperatedby5agencies)istoosmalltoprovidesignificantresultsbyageofvehicle.Onaverage,theseunitsoperatearound72,000kmsperyear(seeFigure41).
0
20,000
40,000
60,000
80,000
100,000
120,000
140,000
160,000
180,000
200,000
1-4 5-8 9-12 13-16 17-20 21-24 25-28 29-32 33-36 37-40 over40
Annu
alKms
YearsofUse
AnnualKmsbyVocationAgricultureClass8Tractors
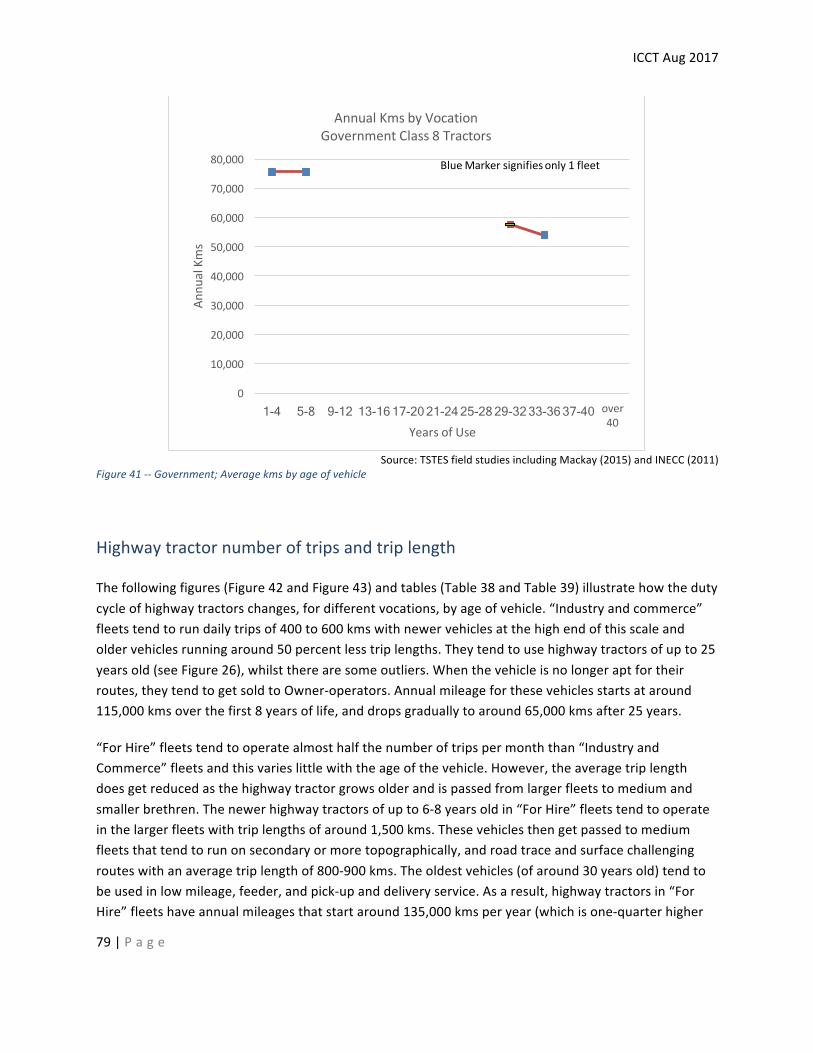
ICCTAug2017
79|P a g e
Source:TSTESfieldstudiesincludingMackay(2015)andINECC(2011)
Figure41--Government;Averagekmsbyageofvehicle
Highwaytractornumberoftripsandtriplength
Thefollowingfigures(Figure42andFigure43)andtables(Table38andTable39)illustratehowthedutycycleofhighwaytractorschanges,fordifferentvocations,byageofvehicle.“Industryandcommerce”fleetstendtorundailytripsof400to600kmswithnewervehiclesatthehighendofthisscaleandoldervehiclesrunningaround50percentlesstriplengths.Theytendtousehighwaytractorsofupto25yearsold(seeFigure26),whilsttherearesomeoutliers.Whenthevehicleisnolongeraptfortheirroutes,theytendtogetsoldtoOwner-operators.Annualmileageforthesevehiclesstartsataround115,000kmsoverthefirst8yearsoflife,anddropsgraduallytoaround65,000kmsafter25years.
“ForHire”fleetstendtooperatealmosthalfthenumberoftripspermonththan“IndustryandCommerce”fleetsandthisvarieslittlewiththeageofthevehicle.However,theaveragetriplengthdoesgetreducedasthehighwaytractorgrowsolderandispassedfromlargerfleetstomediumandsmallerbrethren.Thenewerhighwaytractorsofupto6-8yearsoldin“ForHire”fleetstendtooperateinthelargerfleetswithtriplengthsofaround1,500kms.Thesevehiclesthengetpassedtomediumfleetsthattendtorunonsecondaryormoretopographically,androadtraceandsurfacechallengingrouteswithanaveragetriplengthof800-900kms.Theoldestvehicles(ofaround30yearsold)tendtobeusedinlowmileage,feeder,andpick-upanddeliveryservice.Asaresult,highwaytractorsin“ForHire”fleetshaveannualmileagesthatstartaround135,000kmsperyear(whichisone-quarterhigher
0
10,000
20,000
30,000
40,000
50,000
60,000
70,000
80,000
1-4 5-8 9-12 13-16 17-20 21-24 25-28 29-32 33-36 37-40 over40
Annu
alKms
YearsofUse
AnnualKmsbyVocationGovernmentClass8Tractors
BlueMarkersignifiesonly1fleet
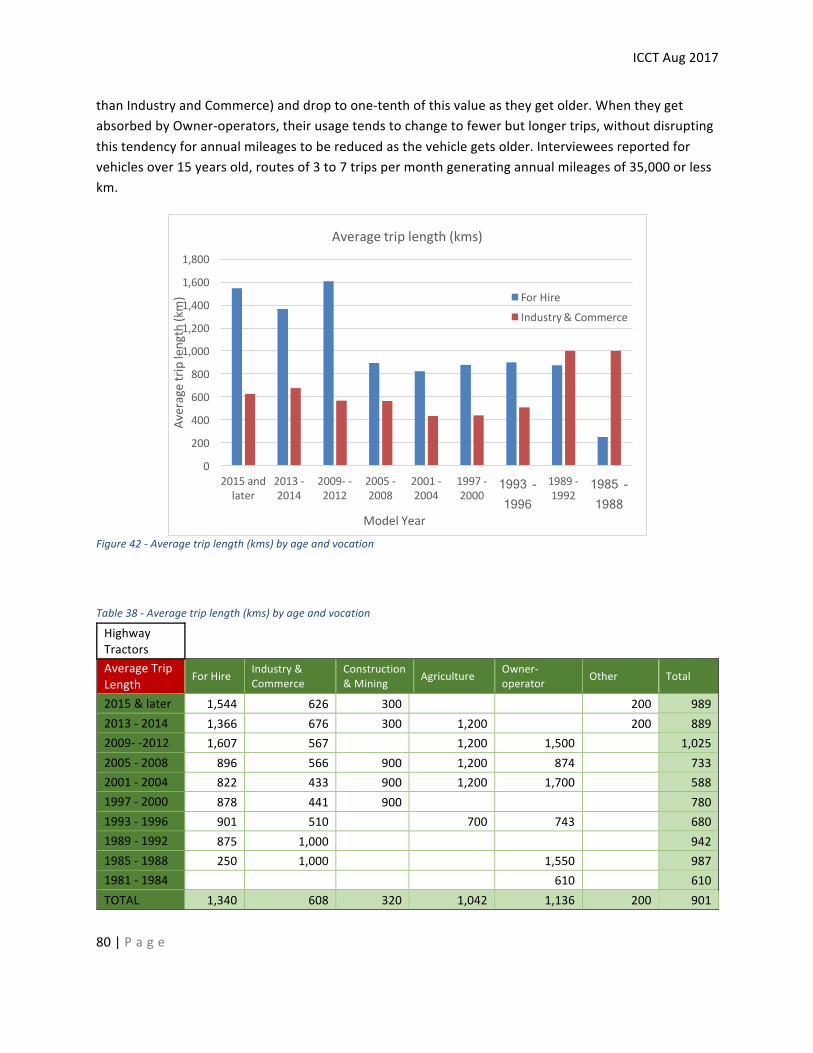
ICCTAug2017
80|P a g e
thanIndustryandCommerce)anddroptoone-tenthofthisvalueastheygetolder.WhentheygetabsorbedbyOwner-operators,theirusagetendstochangetofewerbutlongertrips,withoutdisruptingthistendencyforannualmileagestobereducedasthevehiclegetsolder.Intervieweesreportedforvehiclesover15yearsold,routesof3to7tripspermonthgeneratingannualmileagesof35,000orlesskm.
Figure42-Averagetriplength(kms)byageandvocation
Table38-Averagetriplength(kms)byageandvocation
HighwayTractors AverageTripLength
ForHire Industry&Commerce
Construction&Mining Agriculture Owner-
operator Other Total
2015&later 1,544 626 300 200 9892013-2014 1,366 676 300 1,200 200 8892009--2012 1,607 567 1,200 1,500 1,0252005-2008 896 566 900 1,200 874 7332001-2004 822 433 900 1,200 1,700 5881997-2000 878 441 900 7801993-1996 901 510 700 743 6801989-1992 875 1,000 9421985-1988 250 1,000 1,550 9871981-1984 610 610TOTAL 1,340 608 320 1,042 1,136 200 901
0
200
400
600
800
1,000
1,200
1,400
1,600
1,800
2015andlater
2013-2014
2009- -2012
2005-2008
2001-2004
1997-2000
1993 -1996
1989-1992
1985 -1988
Averagetriplength(km)
ModelYear
Averagetriplength(kms)
ForHire
Industry&Commerce
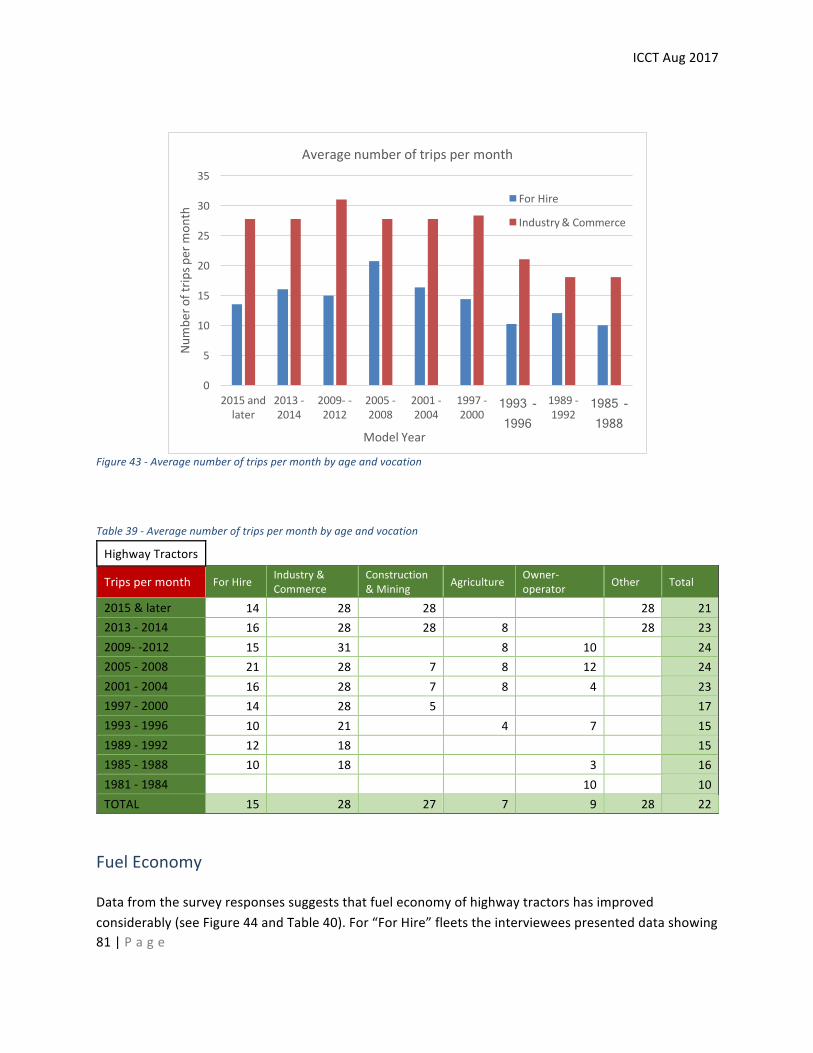
ICCTAug2017
81|P a g e
Figure43-Averagenumberoftripspermonthbyageandvocation
Table39-Averagenumberoftripspermonthbyageandvocation
HighwayTractors
Tripspermonth ForHire Industry&Commerce
Construction&Mining Agriculture Owner-
operator Other Total
2015&later 14 28 28 28 212013-2014 16 28 28 8 28 232009--2012 15 31 8 10 242005-2008 21 28 7 8 12 242001-2004 16 28 7 8 4 231997-2000 14 28 5 171993-1996 10 21 4 7 151989-1992 12 18 151985-1988 10 18 3 161981-1984 10 10TOTAL 15 28 27 7 9 28 22
FuelEconomy
Datafromthesurveyresponsessuggeststhatfueleconomyofhighwaytractorshasimprovedconsiderably(seeFigure44andTable40).For“ForHire”fleetstheintervieweespresenteddatashowing
0
5
10
15
20
25
30
35
2015andlater
2013-2014
2009- -2012
2005-2008
2001-2004
1997-2000
1993 -1996
1989-1992
1985 -1988
Numbe
roftrip
sperm
onth
ModelYear
Averagenumberoftripspermonth
ForHire
Industry&Commerce
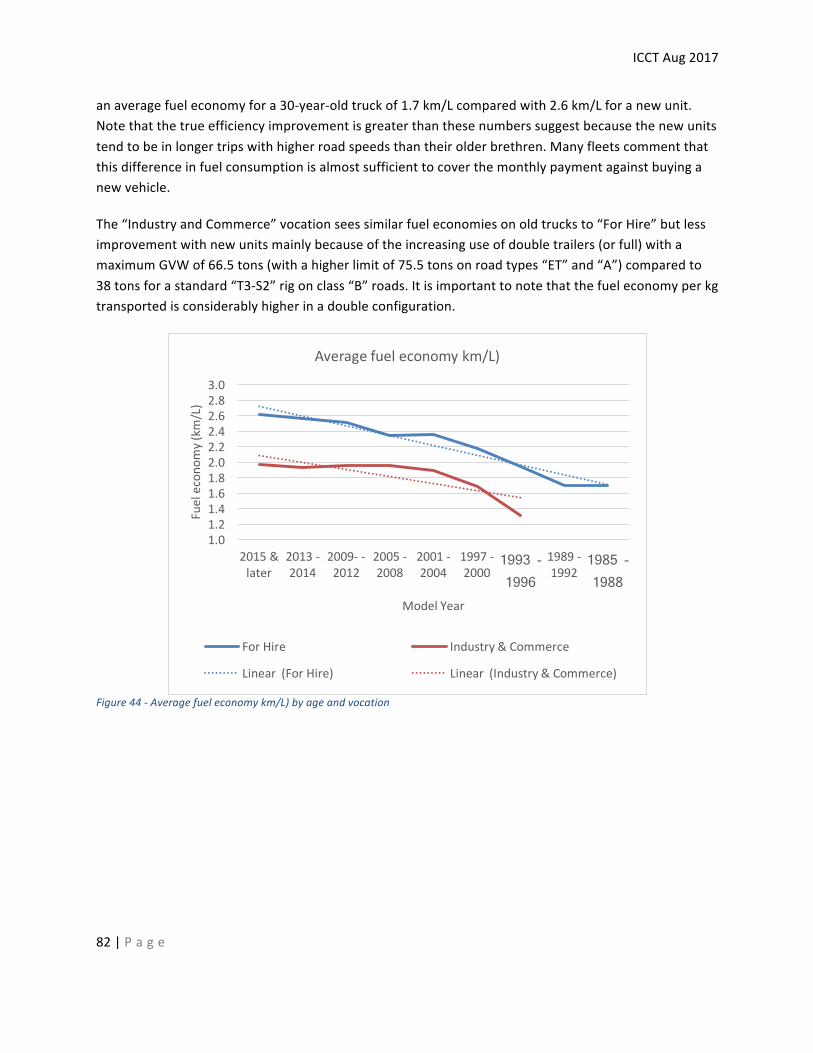
ICCTAug2017
82|P a g e
anaveragefueleconomyfora30-year-oldtruckof1.7km/Lcomparedwith2.6km/Lforanewunit.Notethatthetrueefficiencyimprovementisgreaterthanthesenumberssuggestbecausethenewunitstendtobeinlongertripswithhigherroadspeedsthantheirolderbrethren.Manyfleetscommentthatthisdifferenceinfuelconsumptionisalmostsufficienttocoverthemonthlypaymentagainstbuyinganewvehicle.
The“IndustryandCommerce”vocationseessimilarfueleconomiesonoldtrucksto“ForHire”butlessimprovementwithnewunitsmainlybecauseoftheincreasinguseofdoubletrailers(orfull)withamaximumGVWof66.5tons(withahigherlimitof75.5tonsonroadtypes“ET”and“A”)comparedto38tonsforastandard“T3-S2”rigonclass“B”roads.Itisimportanttonotethatthefueleconomyperkgtransportedisconsiderablyhigherinadoubleconfiguration.
Figure44-Averagefueleconomykm/L)byageandvocation
1.01.21.41.61.82.02.22.42.62.83.0
2015&later
2013-2014
2009- -2012
2005-2008
2001-2004
1997-2000
1993 -1996
1989-1992
1985 -1988
Fuelecono
my(km
/L)
ModelYear
Averagefueleconomykm/L)
ForHire Industry&Commerce
Linear(ForHire) Linear(Industry&Commerce)
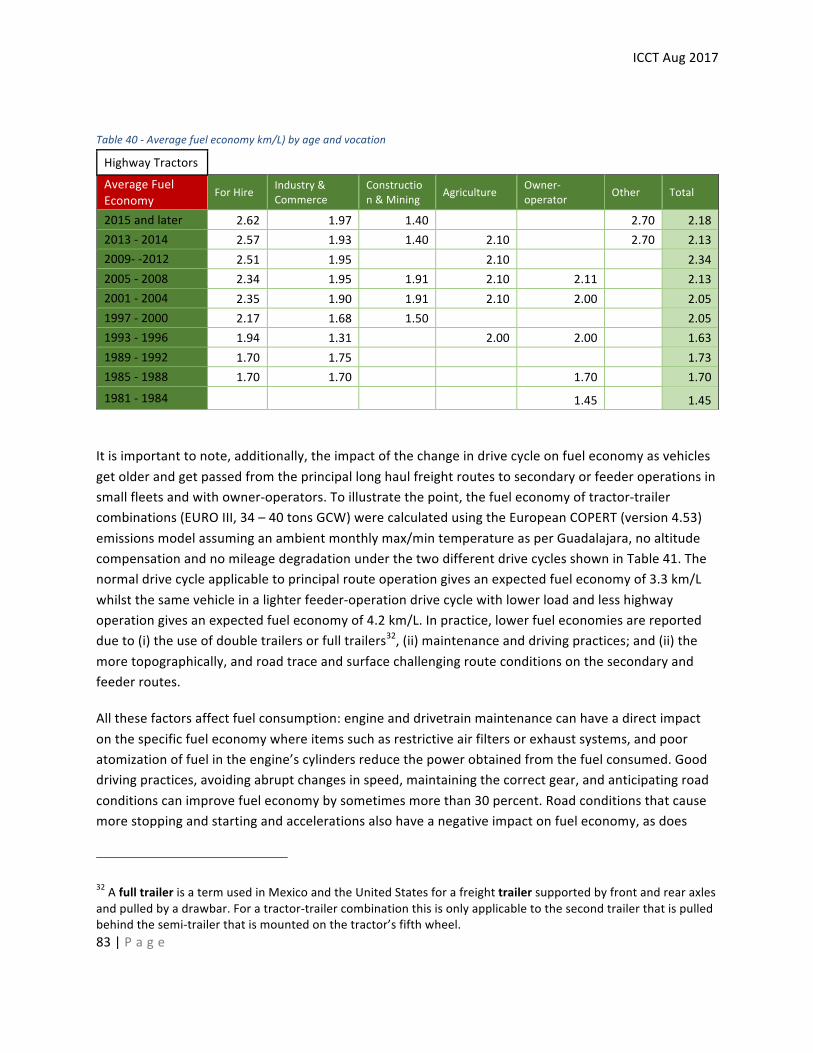
ICCTAug2017
83|P a g e
Table40-Averagefueleconomykm/L)byageandvocation
HighwayTractors AverageFuelEconomy
ForHire Industry&Commerce
Construction&Mining Agriculture Owner-
operator Other Total
2015andlater 2.62 1.97 1.40 2.70 2.182013-2014 2.57 1.93 1.40 2.10 2.70 2.132009--2012 2.51 1.95 2.10 2.342005-2008 2.34 1.95 1.91 2.10 2.11 2.132001-2004 2.35 1.90 1.91 2.10 2.00 2.051997-2000 2.17 1.68 1.50 2.051993-1996 1.94 1.31 2.00 2.00 1.631989-1992 1.70 1.75 1.731985-1988 1.70 1.70 1.70 1.701981-1984 1.45 1.45
Itisimportanttonote,additionally,theimpactofthechangeindrivecycleonfueleconomyasvehiclesgetolderandgetpassedfromtheprincipallonghaulfreightroutestosecondaryorfeederoperationsinsmallfleetsandwithowner-operators.Toillustratethepoint,thefueleconomyoftractor-trailercombinations(EUROIII,34–40tonsGCW)werecalculatedusingtheEuropeanCOPERT(version4.53)emissionsmodelassuminganambientmonthlymax/mintemperatureasperGuadalajara,noaltitudecompensationandnomileagedegradationunderthetwodifferentdrivecyclesshowninTable41.Thenormaldrivecycleapplicabletoprincipalrouteoperationgivesanexpectedfueleconomyof3.3km/Lwhilstthesamevehicleinalighterfeeder-operationdrivecyclewithlowerloadandlesshighwayoperationgivesanexpectedfueleconomyof4.2km/L.Inpractice,lowerfueleconomiesarereporteddueto(i)theuseofdoubletrailersorfulltrailers32,(ii)maintenanceanddrivingpractices;and(ii)themoretopographically,androadtraceandsurfacechallengingrouteconditionsonthesecondaryandfeederroutes.
Allthesefactorsaffectfuelconsumption:engineanddrivetrainmaintenancecanhaveadirectimpactonthespecificfueleconomywhereitemssuchasrestrictiveairfiltersorexhaustsystems,andpooratomizationoffuelintheengine’scylindersreducethepowerobtainedfromthefuelconsumed.Gooddrivingpractices,avoidingabruptchangesinspeed,maintainingthecorrectgear,andanticipatingroadconditionscanimprovefueleconomybysometimesmorethan30percent.Roadconditionsthatcausemorestoppingandstartingandaccelerationsalsohaveanegativeimpactonfueleconomy,asdoes
32AfulltrailerisatermusedinMexicoandtheUnitedStatesforafreighttrailersupportedbyfrontandrearaxlesandpulledbyadrawbar.Foratractor-trailercombinationthisisonlyapplicabletothesecondtrailerthatispulledbehindthesemi-trailerthatismountedonthetractor’sfifthwheel.
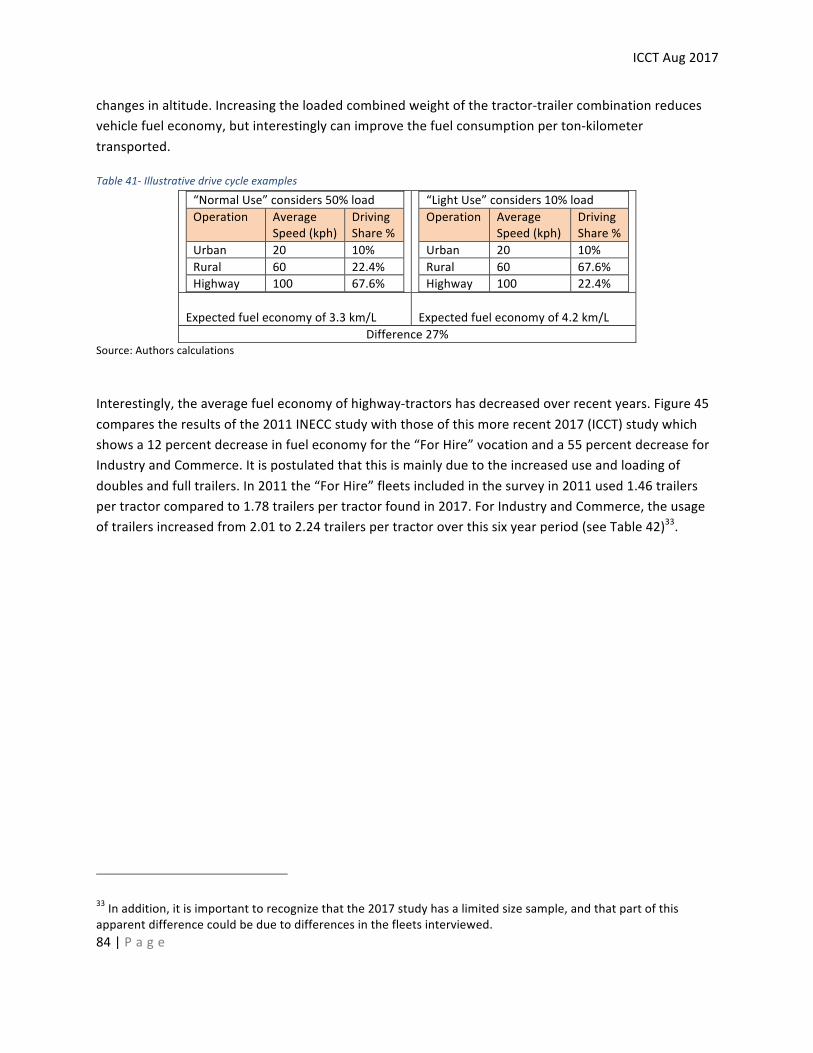
ICCTAug2017
84|P a g e
changesinaltitude.Increasingtheloadedcombinedweightofthetractor-trailercombinationreducesvehiclefueleconomy,butinterestinglycanimprovethefuelconsumptionperton-kilometertransported.
Table41-Illustrativedrivecycleexamples
“NormalUse”considers50%loadOperation Average
Speed(kph)DrivingShare%
Urban 20 10%Rural 60 22.4%Highway 100 67.6%
“LightUse”considers10%loadOperation Average
Speed(kph)DrivingShare%
Urban 20 10%Rural 60 67.6%Highway 100 22.4%
Expectedfueleconomyof3.3km/L
Expectedfueleconomyof4.2km/L
Difference27%Source:Authorscalculations
Interestingly,theaveragefueleconomyofhighway-tractorshasdecreasedoverrecentyears.Figure45comparestheresultsofthe2011INECCstudywiththoseofthismorerecent2017(ICCT)studywhichshowsa12percentdecreaseinfueleconomyforthe“ForHire”vocationanda55percentdecreaseforIndustryandCommerce.Itispostulatedthatthisismainlyduetotheincreaseduseandloadingofdoublesandfulltrailers.In2011the“ForHire”fleetsincludedinthesurveyin2011used1.46trailerspertractorcomparedto1.78trailerspertractorfoundin2017.ForIndustryandCommerce,theusageoftrailersincreasedfrom2.01to2.24trailerspertractoroverthissixyearperiod(seeTable42)33.
33Inaddition,itisimportanttorecognizethatthe2017studyhasalimitedsizesample,andthatpartofthisapparentdifferencecouldbeduetodifferencesinthefleetsinterviewed.
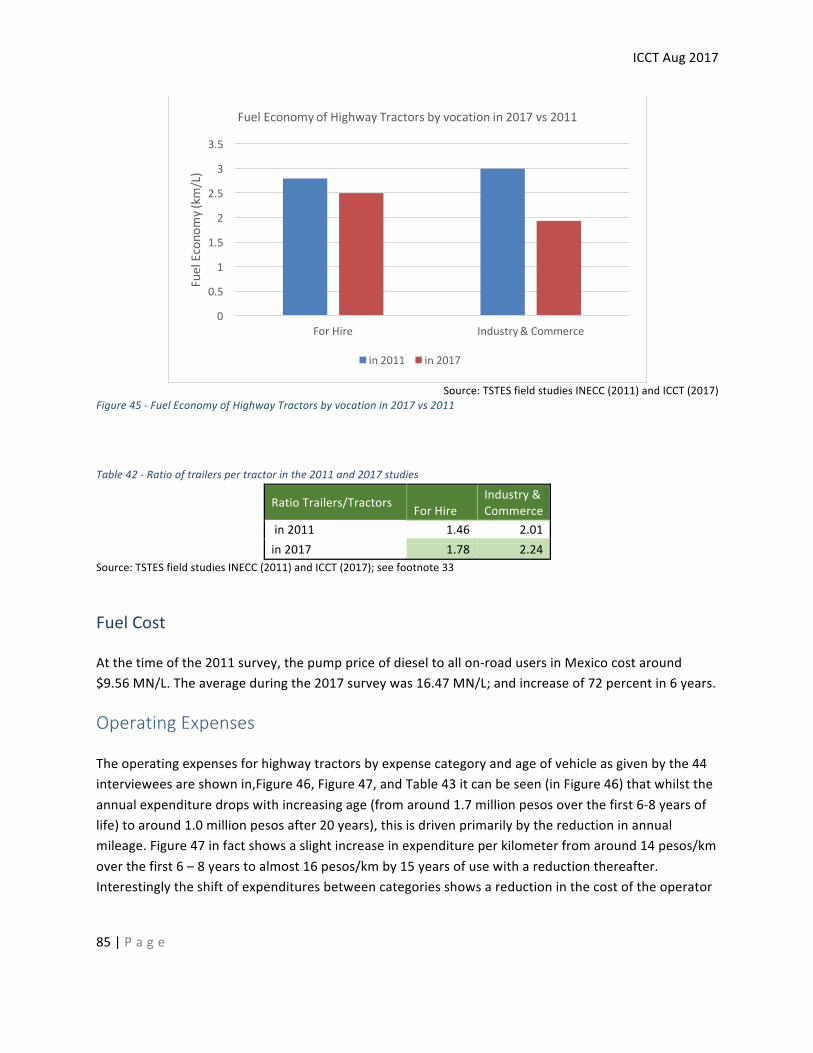
ICCTAug2017
85|P a g e
Source:TSTESfieldstudiesINECC(2011)andICCT(2017)
Figure45-FuelEconomyofHighwayTractorsbyvocationin2017vs2011
Table42-Ratiooftrailerspertractorinthe2011and2017studies
RatioTrailers/Tractors ForHireIndustry&Commerce
in2011 1.46 2.01in2017 1.78 2.24
Source:TSTESfieldstudiesINECC(2011)andICCT(2017);seefootnote33
FuelCost
Atthetimeofthe2011survey,thepumppriceofdieseltoallon-roadusersinMexicocostaround$9.56MN/L.Theaverageduringthe2017surveywas16.47MN/L;andincreaseof72percentin6years.
OperatingExpenses
Theoperatingexpensesforhighwaytractorsbyexpensecategoryandageofvehicleasgivenbythe44intervieweesareshownin,Figure46,Figure47,andTable43itcanbeseen(inFigure46)thatwhilsttheannualexpendituredropswithincreasingage(fromaround1.7millionpesosoverthefirst6-8yearsoflife)toaround1.0millionpesosafter20years),thisisdrivenprimarilybythereductioninannualmileage.Figure47infactshowsaslightincreaseinexpenditureperkilometerfromaround14pesos/kmoverthefirst6–8yearstoalmost16pesos/kmby15yearsofusewithareductionthereafter.Interestinglytheshiftofexpendituresbetweencategoriesshowsareductioninthecostoftheoperator
0
0.5
1
1.5
2
2.5
3
3.5
ForHire Industry&Commerce
FuelEcono
my(km
/L)
FuelEconomyofHighwayTractorsbyvocationin2017vs2011
in2011 in2017
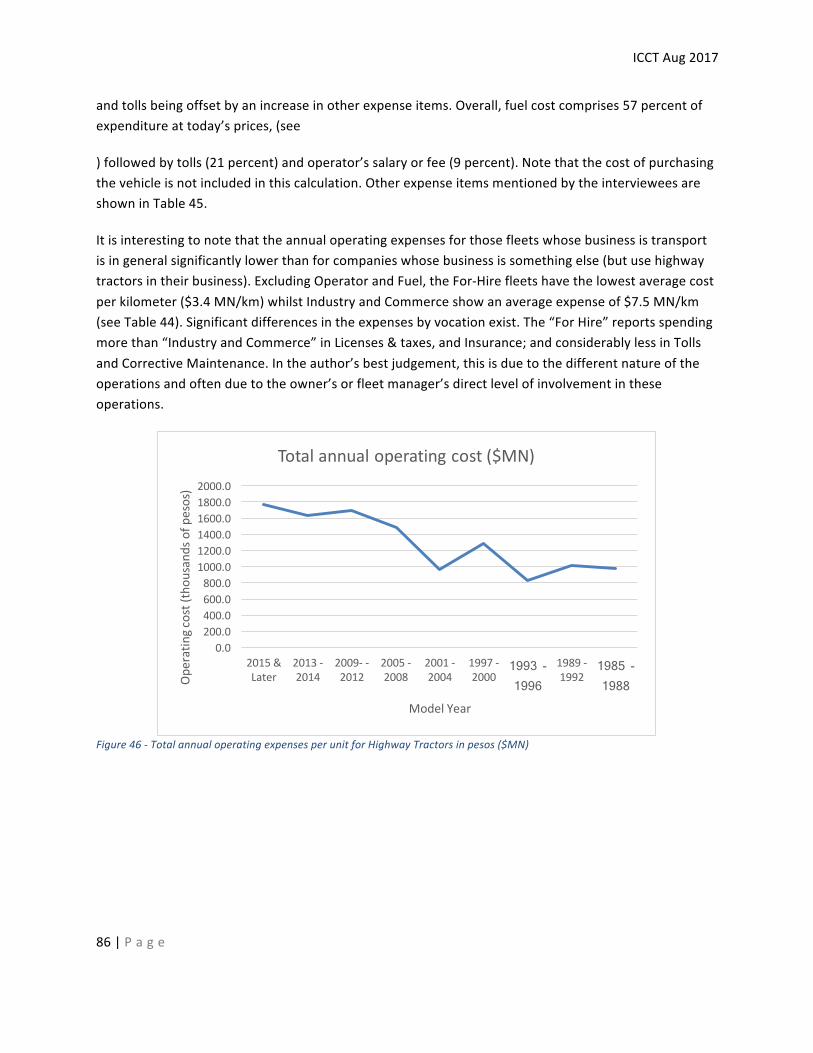
ICCTAug2017
86|P a g e
andtollsbeingoffsetbyanincreaseinotherexpenseitems.Overall,fuelcostcomprises57percentofexpenditureattoday’sprices,(see
)followedbytolls(21percent)andoperator’ssalaryorfee(9percent).Notethatthecostofpurchasingthevehicleisnotincludedinthiscalculation.OtherexpenseitemsmentionedbytheintervieweesareshowninTable45.
Itisinterestingtonotethattheannualoperatingexpensesforthosefleetswhosebusinessistransportisingeneralsignificantlylowerthanforcompanieswhosebusinessissomethingelse(butusehighwaytractorsintheirbusiness).ExcludingOperatorandFuel,theFor-Hirefleetshavethelowestaveragecostperkilometer($3.4MN/km)whilstIndustryandCommerceshowanaverageexpenseof$7.5MN/km(seeTable44).Significantdifferencesintheexpensesbyvocationexist.The“ForHire”reportsspendingmorethan“IndustryandCommerce”inLicenses&taxes,andInsurance;andconsiderablylessinTollsandCorrectiveMaintenance.Intheauthor’sbestjudgement,thisisduetothedifferentnatureoftheoperationsandoftenduetotheowner’sorfleetmanager’sdirectlevelofinvolvementintheseoperations.
Figure46-TotalannualoperatingexpensesperunitforHighwayTractorsinpesos($MN)
0.0200.0400.0600.0800.01000.01200.01400.01600.01800.02000.0
2015&Later
2013-2014
2009- -2012
2005-2008
2001-2004
1997-2000
1993 -1996
1989-1992
1985 -1988 O
peratin
gcost(thou
sand
sofp
esos)
ModelYear
Totalannualoperatingcost($MN)
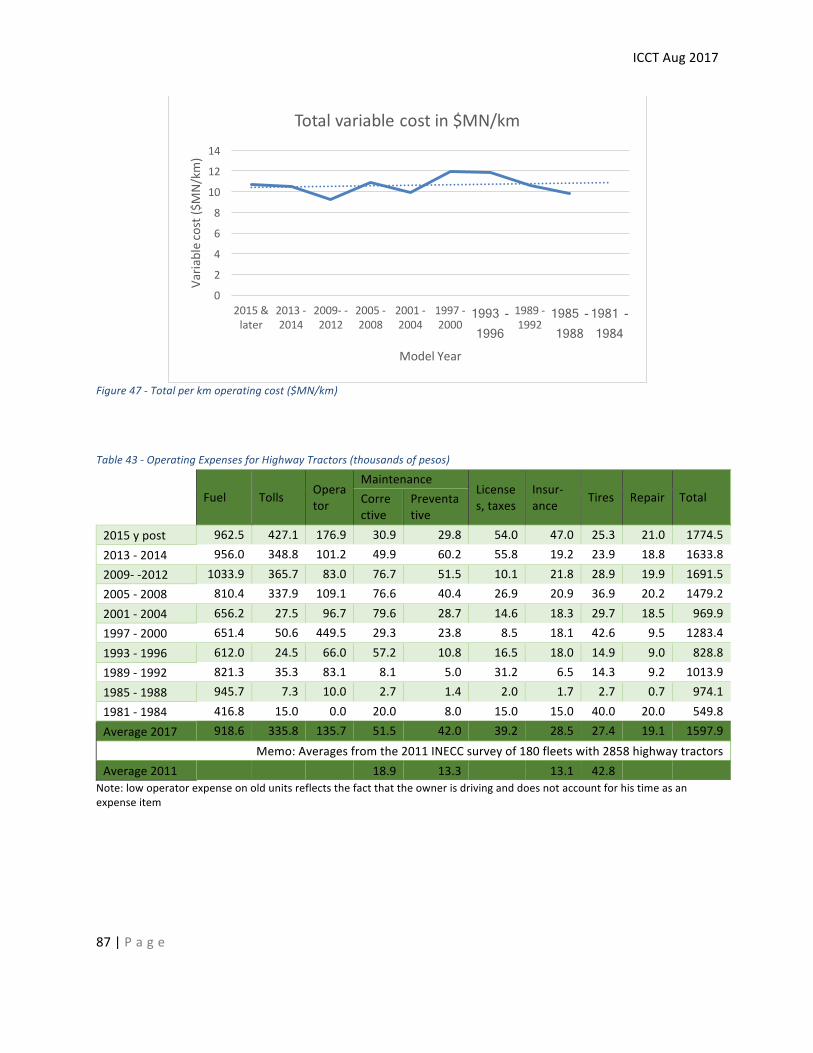
ICCTAug2017
87|P a g e
Figure47-Totalperkmoperatingcost($MN/km)
Table43-OperatingExpensesforHighwayTractors(thousandsofpesos)
Fuel Tolls Opera
tor
MaintenanceLicenses,taxes
Insur-ance Tires Repair Total
Corrective
Preventative
2015ypost 962.5 427.1 176.9 30.9 29.8 54.0 47.0 25.3 21.0 1774.52013-2014 956.0 348.8 101.2 49.9 60.2 55.8 19.2 23.9 18.8 1633.82009--2012 1033.9 365.7 83.0 76.7 51.5 10.1 21.8 28.9 19.9 1691.52005-2008 810.4 337.9 109.1 76.6 40.4 26.9 20.9 36.9 20.2 1479.22001-2004 656.2 27.5 96.7 79.6 28.7 14.6 18.3 29.7 18.5 969.91997-2000 651.4 50.6 449.5 29.3 23.8 8.5 18.1 42.6 9.5 1283.41993-1996 612.0 24.5 66.0 57.2 10.8 16.5 18.0 14.9 9.0 828.81989-1992 821.3 35.3 83.1 8.1 5.0 31.2 6.5 14.3 9.2 1013.91985-1988 945.7 7.3 10.0 2.7 1.4 2.0 1.7 2.7 0.7 974.11981-1984 416.8 15.0 0.0 20.0 8.0 15.0 15.0 40.0 20.0 549.8Average2017 918.6 335.8 135.7 51.5 42.0 39.2 28.5 27.4 19.1 1597.9
Memo:Averagesfromthe2011INECCsurveyof180fleetswith2858highwaytractorsAverage2011 18.9 13.3 13.1 42.8
Note:lowoperatorexpenseonoldunitsreflectsthefactthattheownerisdrivinganddoesnotaccountforhistimeasanexpenseitem
0
2
4
6
8
10
12
14
2015&later
2013-2014
2009- -2012
2005-2008
2001-2004
1997-2000
1993 -1996
1989-1992
1985 -1988
1981 -1984
Varia
blecost($
MN/
km)
ModelYear
Totalvariablecostin$MN/km
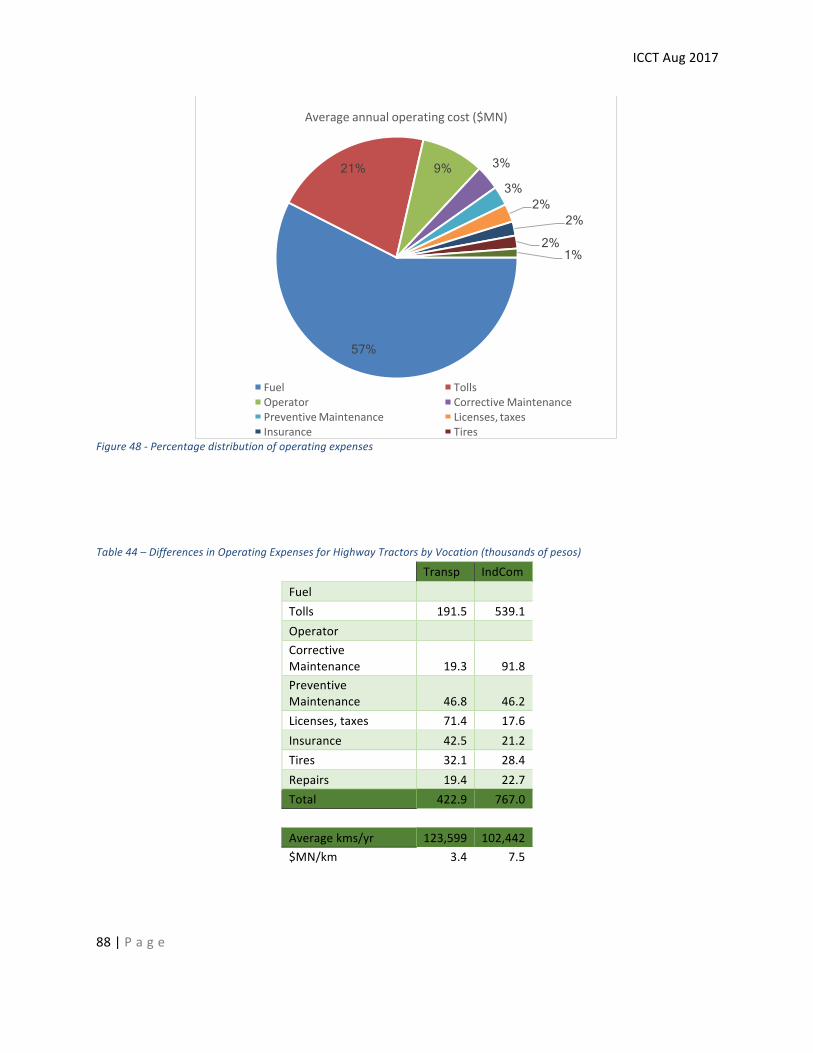
ICCTAug2017
88|P a g e
Figure48-Percentagedistributionofoperatingexpenses
Table44–DifferencesinOperatingExpensesforHighwayTractorsbyVocation(thousandsofpesos)
Transp IndComFuel Tolls 191.5 539.1Operator CorrectiveMaintenance 19.3 91.8PreventiveMaintenance 46.8 46.2Licenses,taxes 71.4 17.6Insurance 42.5 21.2Tires 32.1 28.4Repairs 19.4 22.7Total 422.9 767.0 Averagekms/yr 123,599 102,442$MN/km 3.4 7.5
57%
21% 9% 3%
3% 2%
2% 2%
1%
Averageannualoperatingcost($MN)
Fuel TollsOperator CorrectiveMaintenancePreventiveMaintenance Licenses,taxesInsurance Tires
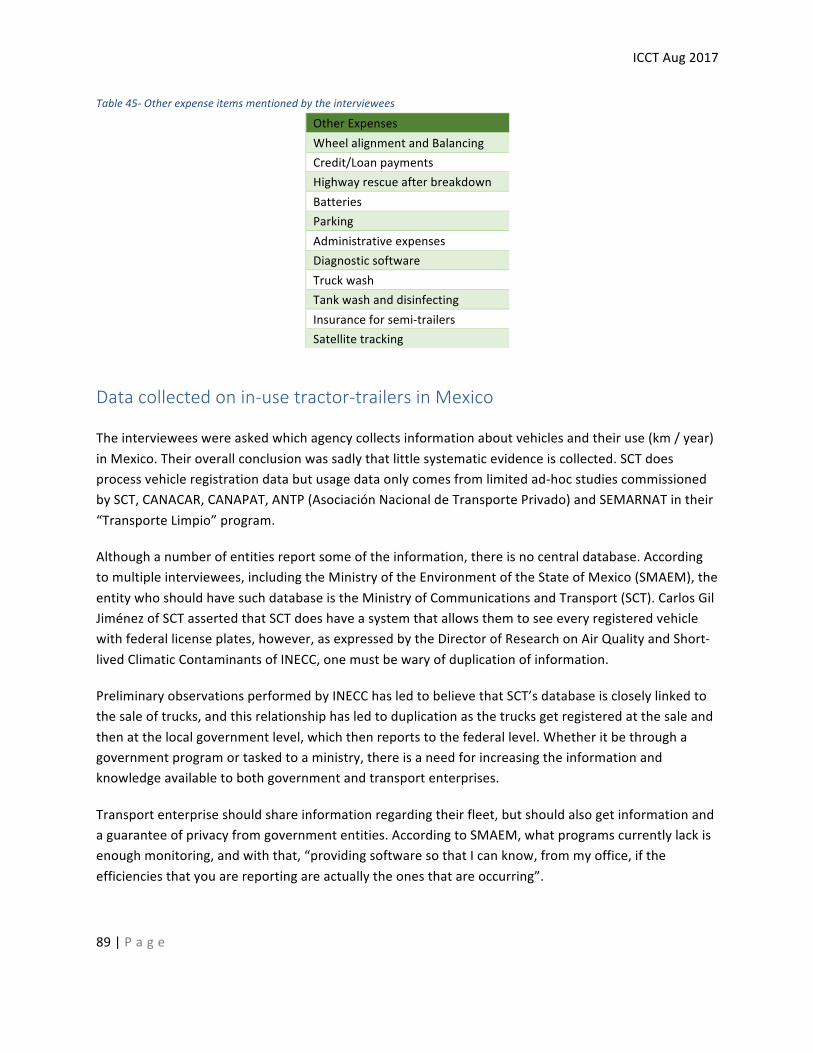
ICCTAug2017
89|P a g e
Table45-Otherexpenseitemsmentionedbytheinterviewees
OtherExpensesWheelalignmentandBalancingCredit/LoanpaymentsHighwayrescueafterbreakdownBatteriesParkingAdministrativeexpensesDiagnosticsoftwareTruckwashTankwashanddisinfectingInsuranceforsemi-trailersSatellitetracking
Datacollectedonin-usetractor-trailersinMexico
Theintervieweeswereaskedwhichagencycollectsinformationaboutvehiclesandtheiruse(km/year)inMexico.Theiroverallconclusionwassadlythatlittlesystematicevidenceiscollected.SCTdoesprocessvehicleregistrationdatabutusagedataonlycomesfromlimitedad-hocstudiescommissionedbySCT,CANACAR,CANAPAT,ANTP(AsociaciónNacionaldeTransportePrivado)andSEMARNATintheir“TransporteLimpio”program.
Althoughanumberofentitiesreportsomeoftheinformation,thereisnocentraldatabase.Accordingtomultipleinterviewees,includingtheMinistryoftheEnvironmentoftheStateofMexico(SMAEM),theentitywhoshouldhavesuchdatabaseistheMinistryofCommunicationsandTransport(SCT).CarlosGilJiménezofSCTassertedthatSCTdoeshaveasystemthatallowsthemtoseeeveryregisteredvehiclewithfederallicenseplates,however,asexpressedbytheDirectorofResearchonAirQualityandShort-livedClimaticContaminantsofINECC,onemustbewaryofduplicationofinformation.
PreliminaryobservationsperformedbyINECChasledtobelievethatSCT’sdatabaseiscloselylinkedtothesaleoftrucks,andthisrelationshiphasledtoduplicationasthetrucksgetregisteredatthesaleandthenatthelocalgovernmentlevel,whichthenreportstothefederallevel.Whetheritbethroughagovernmentprogramortaskedtoaministry,thereisaneedforincreasingtheinformationandknowledgeavailabletobothgovernmentandtransportenterprises.
Transportenterpriseshouldshareinformationregardingtheirfleet,butshouldalsogetinformationandaguaranteeofprivacyfromgovernmententities.AccordingtoSMAEM,whatprogramscurrentlylackisenoughmonitoring,andwiththat,“providingsoftwaresothatIcanknow,frommyoffice,iftheefficienciesthatyouarereportingareactuallytheonesthatareoccurring”.
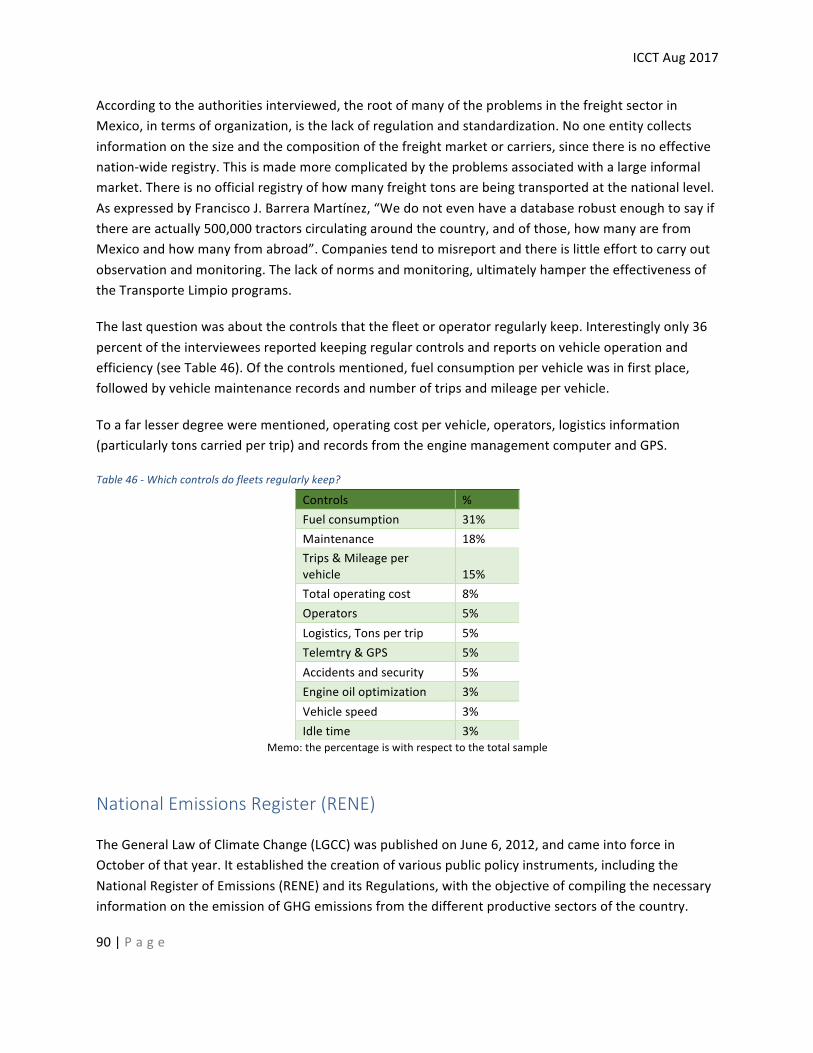
ICCTAug2017
90|P a g e
Accordingtotheauthoritiesinterviewed,therootofmanyoftheproblemsinthefreightsectorinMexico,intermsoforganization,isthelackofregulationandstandardization.Nooneentitycollectsinformationonthesizeandthecompositionofthefreightmarketorcarriers,sincethereisnoeffectivenation-wideregistry.Thisismademorecomplicatedbytheproblemsassociatedwithalargeinformalmarket.Thereisnoofficialregistryofhowmanyfreighttonsarebeingtransportedatthenationallevel.AsexpressedbyFranciscoJ.BarreraMartínez,“Wedonotevenhaveadatabaserobustenoughtosayifthereareactually500,000tractorscirculatingaroundthecountry,andofthose,howmanyarefromMexicoandhowmanyfromabroad”.Companiestendtomisreportandthereislittleefforttocarryoutobservationandmonitoring.Thelackofnormsandmonitoring,ultimatelyhampertheeffectivenessoftheTransporteLimpioprograms.
Thelastquestionwasaboutthecontrolsthatthefleetoroperatorregularlykeep.Interestinglyonly36percentoftheintervieweesreportedkeepingregularcontrolsandreportsonvehicleoperationandefficiency(seeTable46).Ofthecontrolsmentioned,fuelconsumptionpervehiclewasinfirstplace,followedbyvehiclemaintenancerecordsandnumberoftripsandmileagepervehicle.
Toafarlesserdegreewerementioned,operatingcostpervehicle,operators,logisticsinformation(particularlytonscarriedpertrip)andrecordsfromtheenginemanagementcomputerandGPS.
Table46-Whichcontrolsdofleetsregularlykeep?
Controls %Fuelconsumption 31%Maintenance 18%Trips&Mileagepervehicle 15%Totaloperatingcost 8%Operators 5%Logistics,Tonspertrip 5%Telemtry&GPS 5%Accidentsandsecurity 5%Engineoiloptimization 3%Vehiclespeed 3%Idletime 3%
Memo:thepercentageiswithrespecttothetotalsample
NationalEmissionsRegister(RENE)
TheGeneralLawofClimateChange(LGCC)waspublishedonJune6,2012,andcameintoforceinOctoberofthatyear.Itestablishedthecreationofvariouspublicpolicyinstruments,includingtheNationalRegisterofEmissions(RENE)anditsRegulations,withtheobjectiveofcompilingthenecessaryinformationontheemissionofGHGemissionsfromthedifferentproductivesectorsofthecountry.
ICCTAug2017
91|P a g e
Allcompaniesinthefollowingsectorswithannualemissionsthatexceed25,000tCO2e(tonsofCO2equivalent)arerequiredtoreporttheirdirectandindirectemissions34:
• Energy• Industry• Transport• Agricultureandfisheries• Waste,and• TradeandServices.
Thisobligatorylawisaccompaniedbyavoluntaryregister(ProgramaGEIMéxico—seehttp://www.geimexico.org/)inwhichover120companiesareparticipating.
AmongsttheobjectivesofRENEistocreatearobustdatabaseofemissionsthatareverifiedeverythreeyears,andcertifiedtopromotetheinterchangeoncarbonbondsorsaleofcarboncertificates.
34Thegreenhousegasesorcompoundstobereportedare:carbondioxide,methane,nitrousoxide,blackcarbonorsoot,fluorinatedgases,sulfurhexafluoride,nitrogentrifluoride,halogenatedethers,halocarbons,mixturesofthesegasesandothergasesidentifiedbytheIPCCanddesignatedbySemarnat.
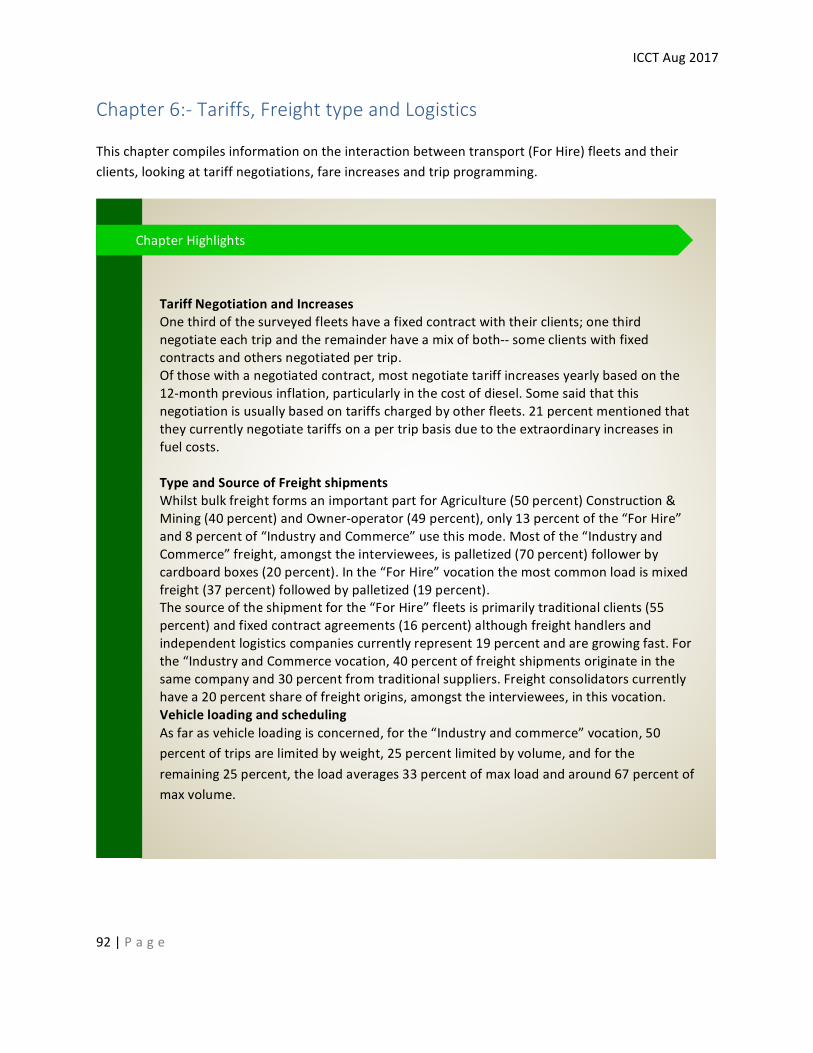
ICCTAug2017
92|P a g e
Chapter6:-Tariffs,FreighttypeandLogistics
Thischaptercompilesinformationontheinteractionbetweentransport(ForHire)fleetsandtheirclients,lookingattariffnegotiations,fareincreasesandtripprogramming.
TariffNegotiationandIncreasesOnethirdofthesurveyedfleetshaveafixedcontractwiththeirclients;onethirdnegotiateeachtripandtheremainderhaveamixofboth--someclientswithfixedcontractsandothersnegotiatedpertrip.Ofthosewithanegotiatedcontract,mostnegotiatetariffincreasesyearlybasedonthe12-monthpreviousinflation,particularlyinthecostofdiesel.Somesaidthatthisnegotiationisusuallybasedontariffschargedbyotherfleets.21percentmentionedthattheycurrentlynegotiatetariffsonapertripbasisduetotheextraordinaryincreasesinfuelcosts.TypeandSourceofFreightshipmentsWhilstbulkfreightformsanimportantpartforAgriculture(50percent)Construction&Mining(40percent)andOwner-operator(49percent),only13percentofthe“ForHire”and8percentof“IndustryandCommerce”usethismode.Mostofthe“IndustryandCommerce”freight,amongsttheinterviewees,ispalletized(70percent)followerbycardboardboxes(20percent).Inthe“ForHire”vocationthemostcommonloadismixedfreight(37percent)followedbypalletized(19percent).Thesourceoftheshipmentforthe“ForHire”fleetsisprimarilytraditionalclients(55percent)andfixedcontractagreements(16percent)althoughfreighthandlersandindependentlogisticscompaniescurrentlyrepresent19percentandaregrowingfast.Forthe“IndustryandCommercevocation,40percentoffreightshipmentsoriginateinthesamecompanyand30percentfromtraditionalsuppliers.Freightconsolidatorscurrentlyhavea20percentshareoffreightorigins,amongsttheinterviewees,inthisvocation.VehicleloadingandschedulingAsfarasvehicleloadingisconcerned,forthe“Industryandcommerce”vocation,50percentoftripsarelimitedbyweight,25percentlimitedbyvolume,andfortheremaining25percent,theloadaverages33percentofmaxloadandaround67percentofmaxvolume.
ChapterHighlights
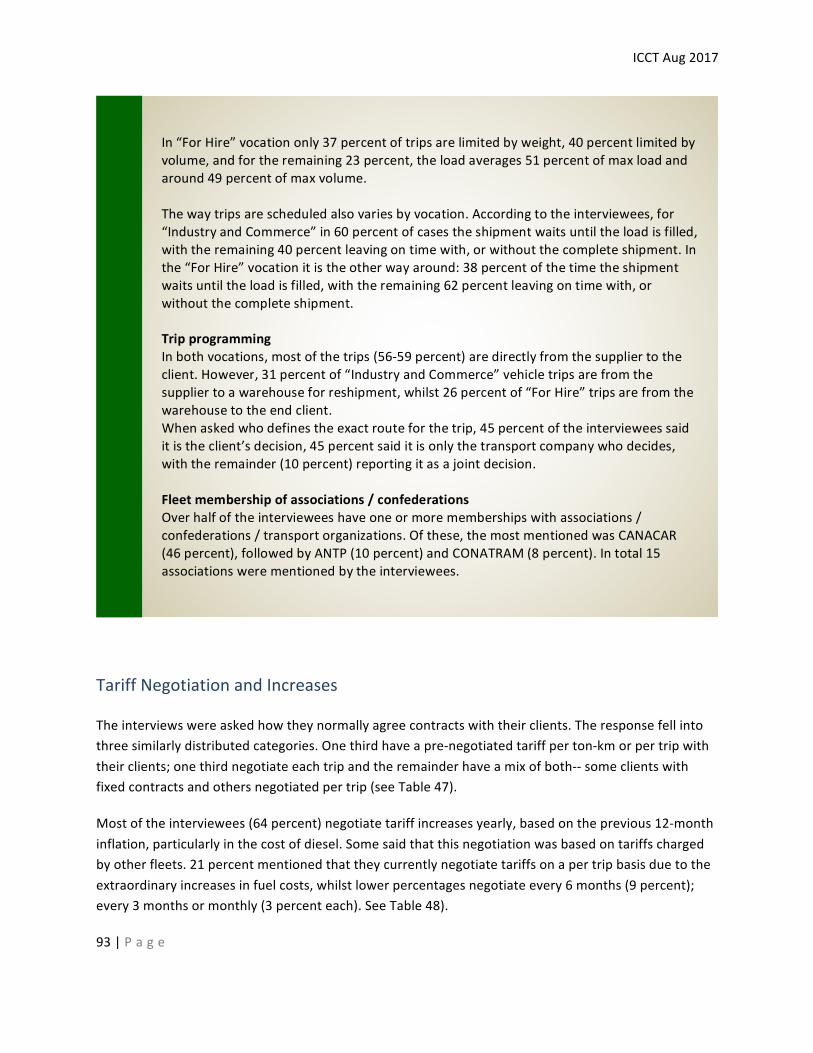
ICCTAug2017
93|P a g e
TariffNegotiationandIncreases
Theinterviewswereaskedhowtheynormallyagreecontractswiththeirclients.Theresponsefellintothreesimilarlydistributedcategories.Onethirdhaveapre-negotiatedtariffperton-kmorpertripwiththeirclients;onethirdnegotiateeachtripandtheremainderhaveamixofboth--someclientswithfixedcontractsandothersnegotiatedpertrip(seeTable47).
Mostoftheinterviewees(64percent)negotiatetariffincreasesyearly,basedontheprevious12-monthinflation,particularlyinthecostofdiesel.Somesaidthatthisnegotiationwasbasedontariffschargedbyotherfleets.21percentmentionedthattheycurrentlynegotiatetariffsonapertripbasisduetotheextraordinaryincreasesinfuelcosts,whilstlowerpercentagesnegotiateevery6months(9percent);every3monthsormonthly(3percenteach).SeeTable48).
In“ForHire”vocationonly37percentoftripsarelimitedbyweight,40percentlimitedbyvolume,andfortheremaining23percent,theloadaverages51percentofmaxloadandaround49percentofmaxvolume.Thewaytripsarescheduledalsovariesbyvocation.Accordingtotheinterviewees,for“IndustryandCommerce”in60percentofcasestheshipmentwaitsuntiltheloadisfilled,withtheremaining40percentleavingontimewith,orwithoutthecompleteshipment.Inthe“ForHire”vocationitistheotherwayaround:38percentofthetimetheshipmentwaitsuntiltheloadisfilled,withtheremaining62percentleavingontimewith,orwithoutthecompleteshipment.TripprogrammingInbothvocations,mostofthetrips(56-59percent)aredirectlyfromthesuppliertotheclient.However,31percentof“IndustryandCommerce”vehicletripsarefromthesuppliertoawarehouseforreshipment,whilst26percentof“ForHire”tripsarefromthewarehousetotheendclient.Whenaskedwhodefinestheexactrouteforthetrip,45percentoftheintervieweessaiditistheclient’sdecision,45percentsaiditisonlythetransportcompanywhodecides,withtheremainder(10percent)reportingitasajointdecision.Fleetmembershipofassociations/confederationsOverhalfoftheintervieweeshaveoneormoremembershipswithassociations/confederations/transportorganizations.Ofthese,themostmentionedwasCANACAR(46percent),followedbyANTP(10percent)andCONATRAM(8percent).Intotal15associationswerementionedbytheinterviewees.
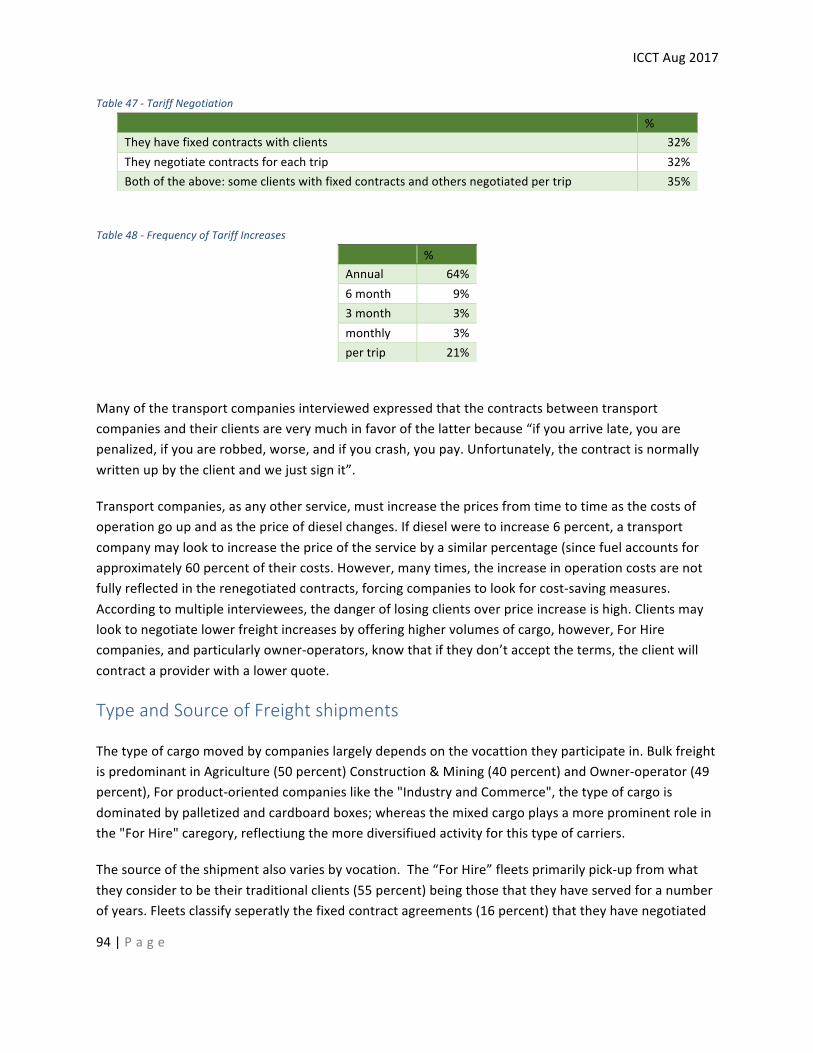
ICCTAug2017
94|P a g e
Table47-TariffNegotiation
%Theyhavefixedcontractswithclients 32%Theynegotiatecontractsforeachtrip 32%Bothoftheabove:someclientswithfixedcontractsandothersnegotiatedpertrip 35%
Table48-FrequencyofTariffIncreases
%Annual 64%6month 9%3month 3%monthly 3%pertrip 21%
Manyofthetransportcompaniesinterviewedexpressedthatthecontractsbetweentransportcompaniesandtheirclientsareverymuchinfavorofthelatterbecause“ifyouarrivelate,youarepenalized,ifyouarerobbed,worse,andifyoucrash,youpay.Unfortunately,thecontractisnormallywrittenupbytheclientandwejustsignit”.
Transportcompanies,asanyotherservice,mustincreasethepricesfromtimetotimeasthecostsofoperationgoupandasthepriceofdieselchanges.Ifdieselweretoincrease6percent,atransportcompanymaylooktoincreasethepriceoftheservicebyasimilarpercentage(sincefuelaccountsforapproximately60percentoftheircosts.However,manytimes,theincreaseinoperationcostsarenotfullyreflectedintherenegotiatedcontracts,forcingcompaniestolookforcost-savingmeasures.Accordingtomultipleinterviewees,thedangeroflosingclientsoverpriceincreaseishigh.Clientsmaylooktonegotiatelowerfreightincreasesbyofferinghighervolumesofcargo,however,ForHirecompanies,andparticularlyowner-operators,knowthatiftheydon’taccepttheterms,theclientwillcontractaproviderwithalowerquote.
TypeandSourceofFreightshipments
Thetypeofcargomovedbycompanieslargelydependsonthevocattiontheyparticipatein.BulkfreightispredominantinAgriculture(50percent)Construction&Mining(40percent)andOwner-operator(49percent),Forproduct-orientedcompanieslikethe"IndustryandCommerce",thetypeofcargoisdominatedbypalletizedandcardboardboxes;whereasthemixedcargoplaysamoreprominentroleinthe"ForHire"caregory,reflectiungthemorediversifiuedactivityforthistypeofcarriers.
Thesourceoftheshipmentalsovariesbyvocation.The“ForHire”fleetsprimarilypick-upfromwhattheyconsidertobetheirtraditionalclients(55percent)beingthosethattheyhaveservedforanumberofyears.Fleetsclassifyseperatlythefixedcontractagreements(16percent)thattheyhavenegotiated
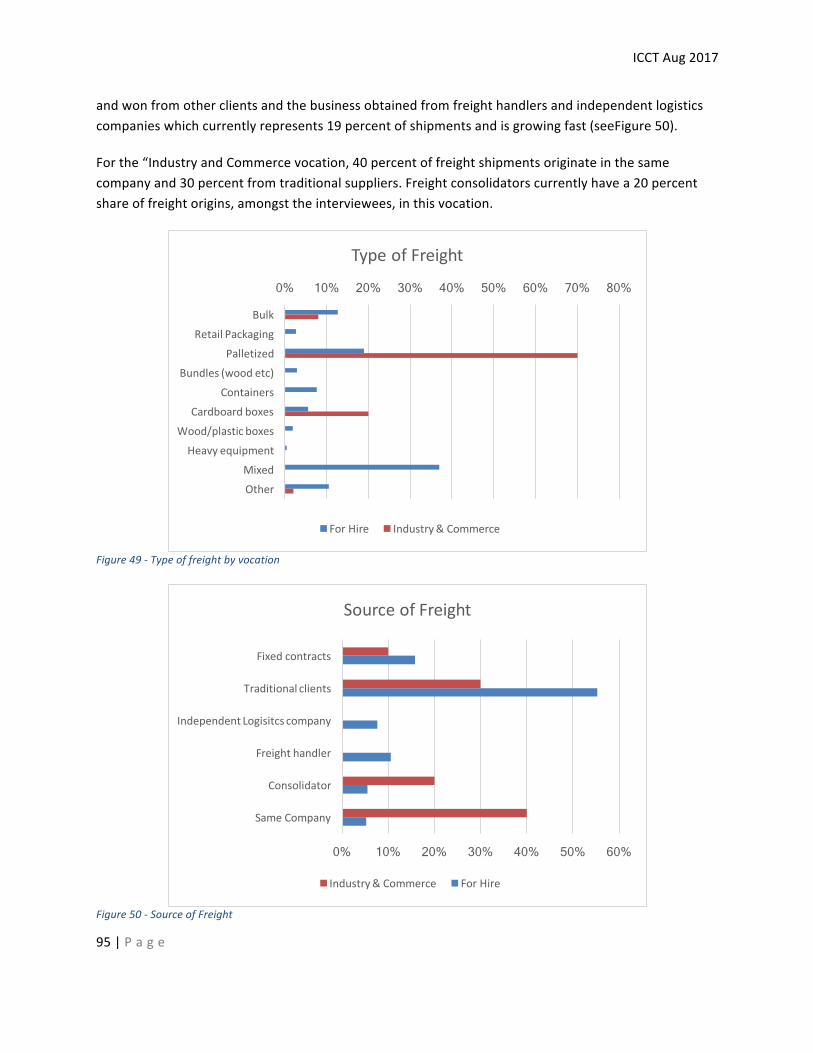
ICCTAug2017
95|P a g e
andwonfromotherclientsandthebusinessobtainedfromfreighthandlersandindependentlogisticscompanieswhichcurrentlyrepresents19percentofshipmentsandisgrowingfast(seeFigure50).
Forthe“IndustryandCommercevocation,40percentoffreightshipmentsoriginateinthesamecompanyand30percentfromtraditionalsuppliers.Freightconsolidatorscurrentlyhavea20percentshareoffreightorigins,amongsttheinterviewees,inthisvocation.
Figure49-Typeoffreightbyvocation
Figure50-SourceofFreight
0% 10% 20% 30% 40% 50% 60% 70% 80%
BulkRetailPackaging
PalletizedBundles(woodetc)
ContainersCardboardboxes
Wood/plasticboxesHeavyequipment
MixedOther
TypeofFreight
ForHire Industry&Commerce
0% 10% 20% 30% 40% 50% 60%
SameCompany
Consolidator
Freighthandler
IndependentLogisitcscompany
Traditionalclients
Fixedcontracts
SourceofFreight
Industry&Commerce ForHire
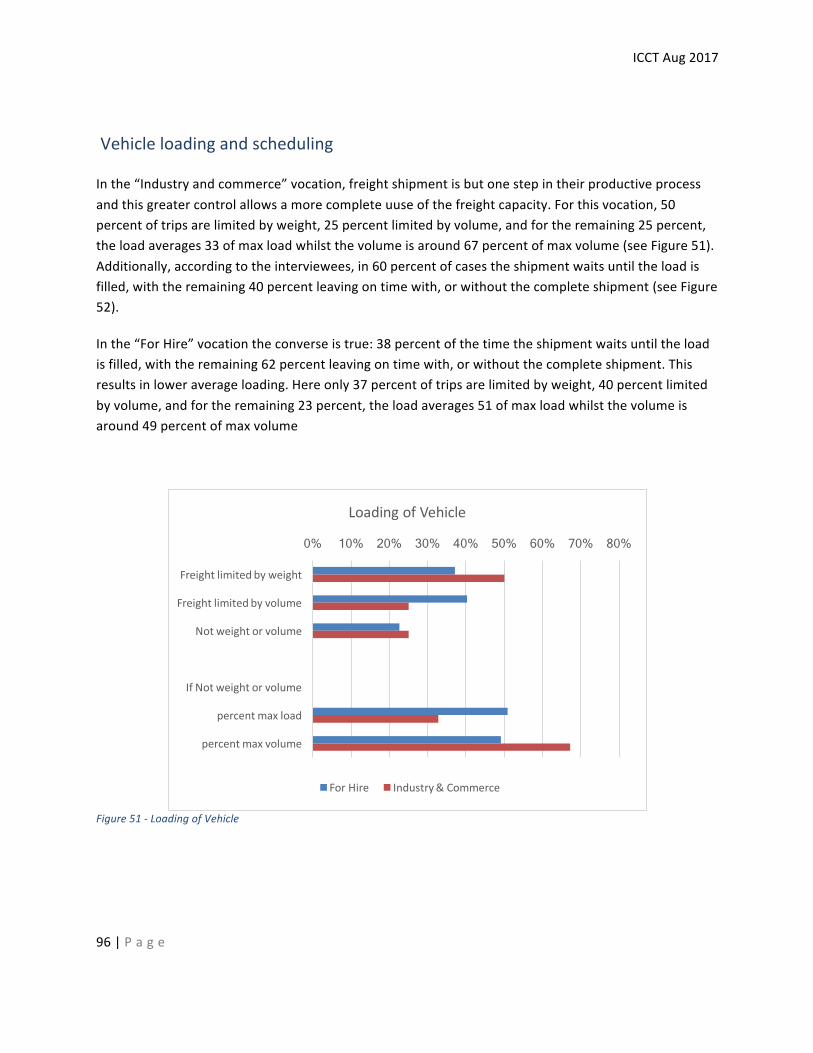
ICCTAug2017
96|P a g e
Vehicleloadingandscheduling
Inthe“Industryandcommerce”vocation,freightshipmentisbutonestepintheirproductiveprocessandthisgreatercontrolallowsamorecompleteuuseofthefreightcapacity.Forthisvocation,50percentoftripsarelimitedbyweight,25percentlimitedbyvolume,andfortheremaining25percent,theloadaverages33ofmaxloadwhilstthevolumeisaround67percentofmaxvolume(seeFigure51).Additionally,accordingtotheinterviewees,in60percentofcasestheshipmentwaitsuntiltheloadisfilled,withtheremaining40percentleavingontimewith,orwithoutthecompleteshipment(seeFigure52).
Inthe“ForHire”vocationtheconverseistrue:38percentofthetimetheshipmentwaitsuntiltheloadisfilled,withtheremaining62percentleavingontimewith,orwithoutthecompleteshipment.Thisresultsinloweraverageloading.Hereonly37percentoftripsarelimitedbyweight,40percentlimitedbyvolume,andfortheremaining23percent,theloadaverages51ofmaxloadwhilstthevolumeisaround49percentofmaxvolume
Figure51-LoadingofVehicle
0% 10% 20% 30% 40% 50% 60% 70% 80%
Freightlimitedbyweight
Freightlimitedbyvolume
Notweightorvolume
IfNotweightorvolume
percentmaxload
percentmaxvolume
LoadingofVehicle
ForHire Industry&Commerce
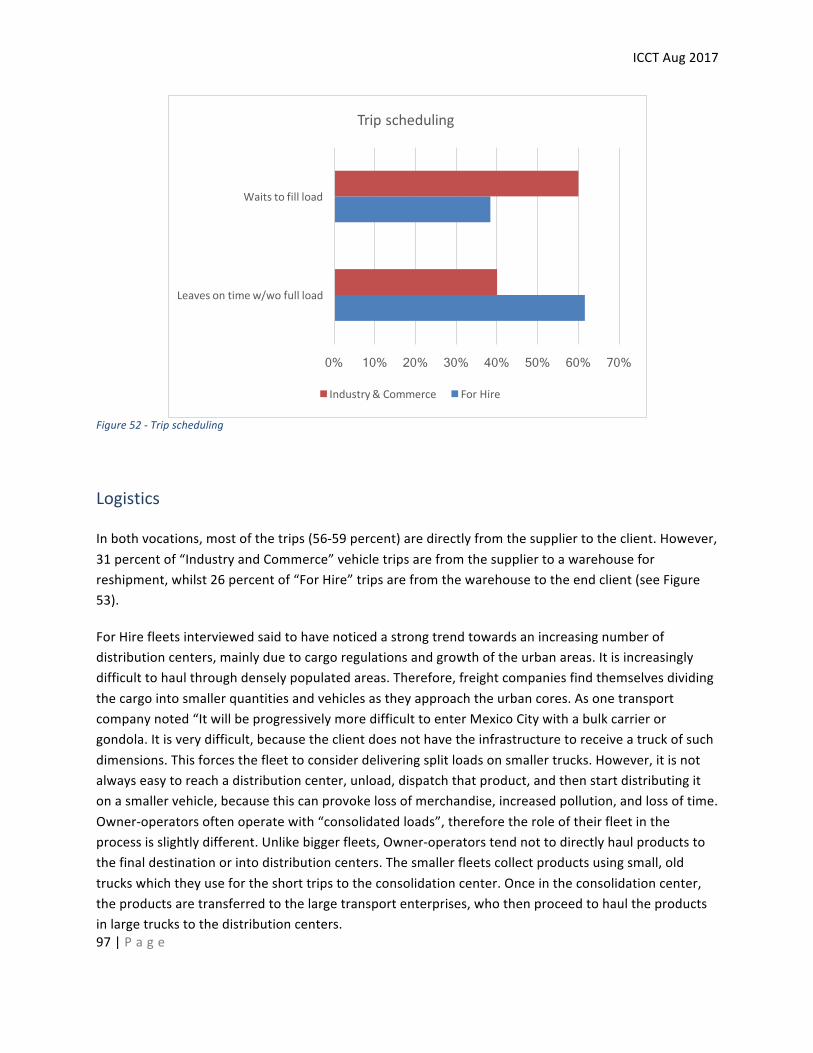
ICCTAug2017
97|P a g e
Figure52-Tripscheduling
Logistics
Inbothvocations,mostofthetrips(56-59percent)aredirectlyfromthesuppliertotheclient.However,31percentof“IndustryandCommerce”vehicletripsarefromthesuppliertoawarehouseforreshipment,whilst26percentof“ForHire”tripsarefromthewarehousetotheendclient(seeFigure53).
ForHirefleetsinterviewedsaidtohavenoticedastrongtrendtowardsanincreasingnumberofdistributioncenters,mainlyduetocargoregulationsandgrowthoftheurbanareas.Itisincreasinglydifficulttohaulthroughdenselypopulatedareas.Therefore,freightcompaniesfindthemselvesdividingthecargointosmallerquantitiesandvehiclesastheyapproachtheurbancores.Asonetransportcompanynoted“ItwillbeprogressivelymoredifficulttoenterMexicoCitywithabulkcarrierorgondola.Itisverydifficult,becausetheclientdoesnothavetheinfrastructuretoreceiveatruckofsuchdimensions.Thisforcesthefleettoconsiderdeliveringsplitloadsonsmallertrucks.However,itisnotalwayseasytoreachadistributioncenter,unload,dispatchthatproduct,andthenstartdistributingitonasmallervehicle,becausethiscanprovokelossofmerchandise,increasedpollution,andlossoftime.Owner-operatorsoftenoperatewith“consolidatedloads”,thereforetheroleoftheirfleetintheprocessisslightlydifferent.Unlikebiggerfleets,Owner-operatorstendnottodirectlyhaulproductstothefinaldestinationorintodistributioncenters.Thesmallerfleetscollectproductsusingsmall,oldtruckswhichtheyusefortheshorttripstotheconsolidationcenter.Onceintheconsolidationcenter,theproductsaretransferredtothelargetransportenterprises,whothenproceedtohaultheproductsinlargetruckstothedistributioncenters.
0% 10% 20% 30% 40% 50% 60% 70%
Leavesontimew/wofullload
Waitstofillload
Tripscheduling
Industry&Commerce ForHire
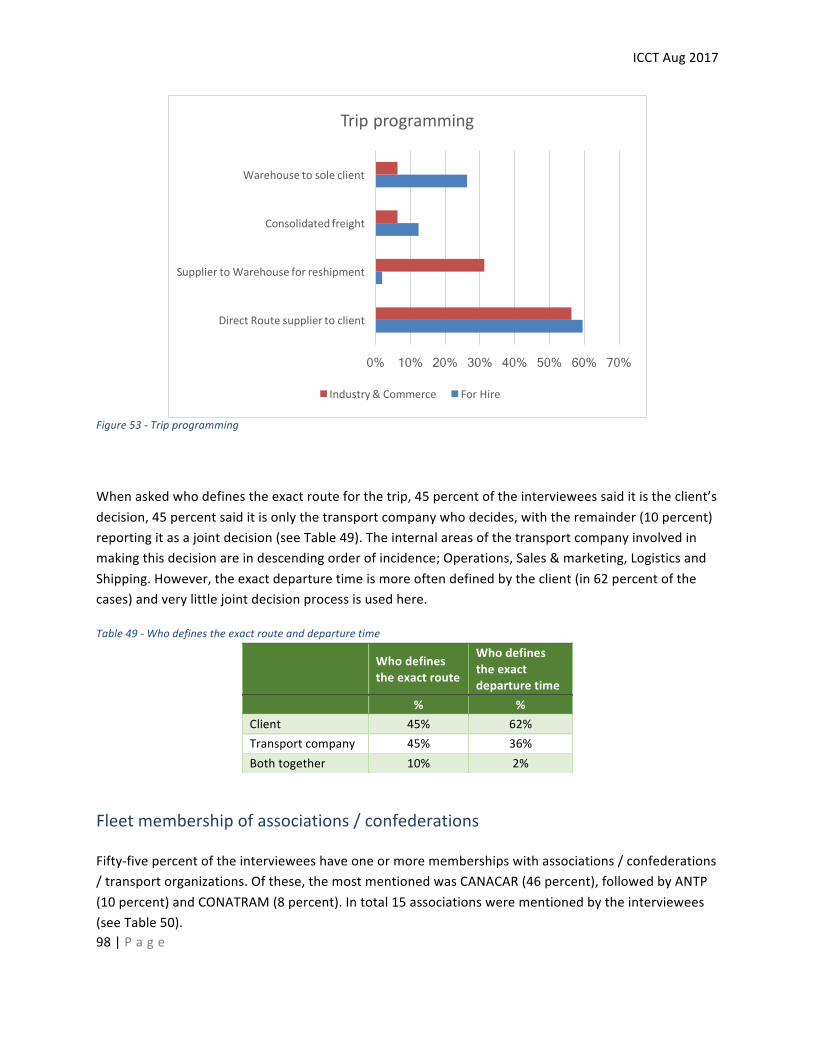
ICCTAug2017
98|P a g e
Figure53-Tripprogramming
Whenaskedwhodefinestheexactrouteforthetrip,45percentoftheintervieweessaiditistheclient’sdecision,45percentsaiditisonlythetransportcompanywhodecides,withtheremainder(10percent)reportingitasajointdecision(seeTable49).Theinternalareasofthetransportcompanyinvolvedinmakingthisdecisionareindescendingorderofincidence;Operations,Sales&marketing,LogisticsandShipping.However,theexactdeparturetimeismoreoftendefinedbytheclient(in62percentofthecases)andverylittlejointdecisionprocessisusedhere.
Table49-Whodefinestheexactrouteanddeparturetime
Whodefinestheexactroute
Whodefinestheexactdeparturetime
% %Client 45% 62%Transportcompany 45% 36%Bothtogether 10% 2%
Fleetmembershipofassociations/confederations
Fifty-fivepercentoftheintervieweeshaveoneormoremembershipswithassociations/confederations/transportorganizations.Ofthese,themostmentionedwasCANACAR(46percent),followedbyANTP(10percent)andCONATRAM(8percent).Intotal15associationswerementionedbytheinterviewees(seeTable50).
0% 10% 20% 30% 40% 50% 60% 70%
DirectRoutesuppliertoclient
SuppliertoWarehouseforreshipment
Consolidatedfreight
Warehousetosoleclient
Tripprogramming
Industry&Commerce ForHire
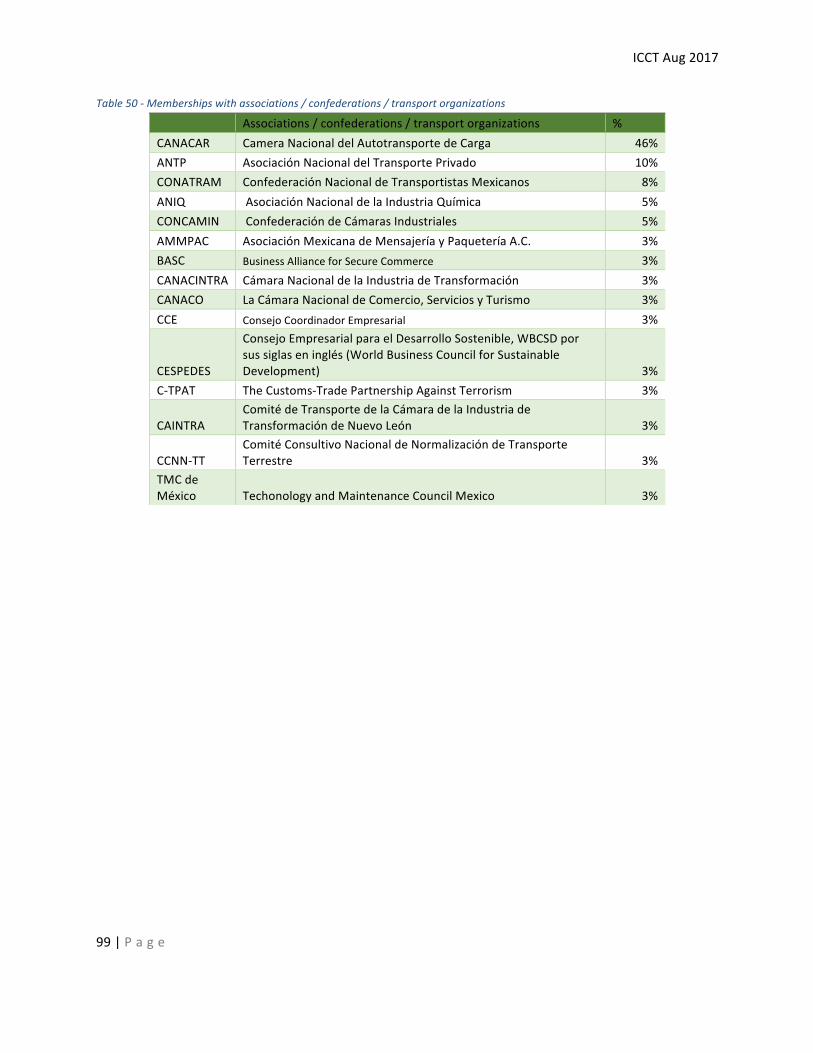
ICCTAug2017
99|P a g e
Table50-Membershipswithassociations/confederations/transportorganizations
Associations/confederations/transportorganizations %CANACAR CameraNacionaldelAutotransportedeCarga 46%ANTP AsociaciónNacionaldelTransportePrivado 10%CONATRAM ConfederaciónNacionaldeTransportistasMexicanos 8%ANIQ AsociaciónNacionaldelaIndustriaQuímica 5%CONCAMIN ConfederacióndeCámarasIndustriales 5%AMMPAC AsociaciónMexicanadeMensajeríayPaqueteríaA.C. 3%BASC BusinessAllianceforSecureCommerce 3%CANACINTRA CámaraNacionaldelaIndustriadeTransformación 3%CANACO LaCámaraNacionaldeComercio,ServiciosyTurismo 3%CCE ConsejoCoordinadorEmpresarial 3%
CESPEDES
ConsejoEmpresarialparaelDesarrolloSostenible,WBCSDporsussiglaseninglés(WorldBusinessCouncilforSustainableDevelopment) 3%
C-TPAT TheCustoms-TradePartnershipAgainstTerrorism 3%
CAINTRAComitédeTransportedelaCámaradelaIndustriadeTransformacióndeNuevoLeón 3%
CCNN-TTComitéConsultivoNacionaldeNormalizacióndeTransporteTerrestre 3%
TMCdeMéxico TechonologyandMaintenanceCouncilMexico 3%
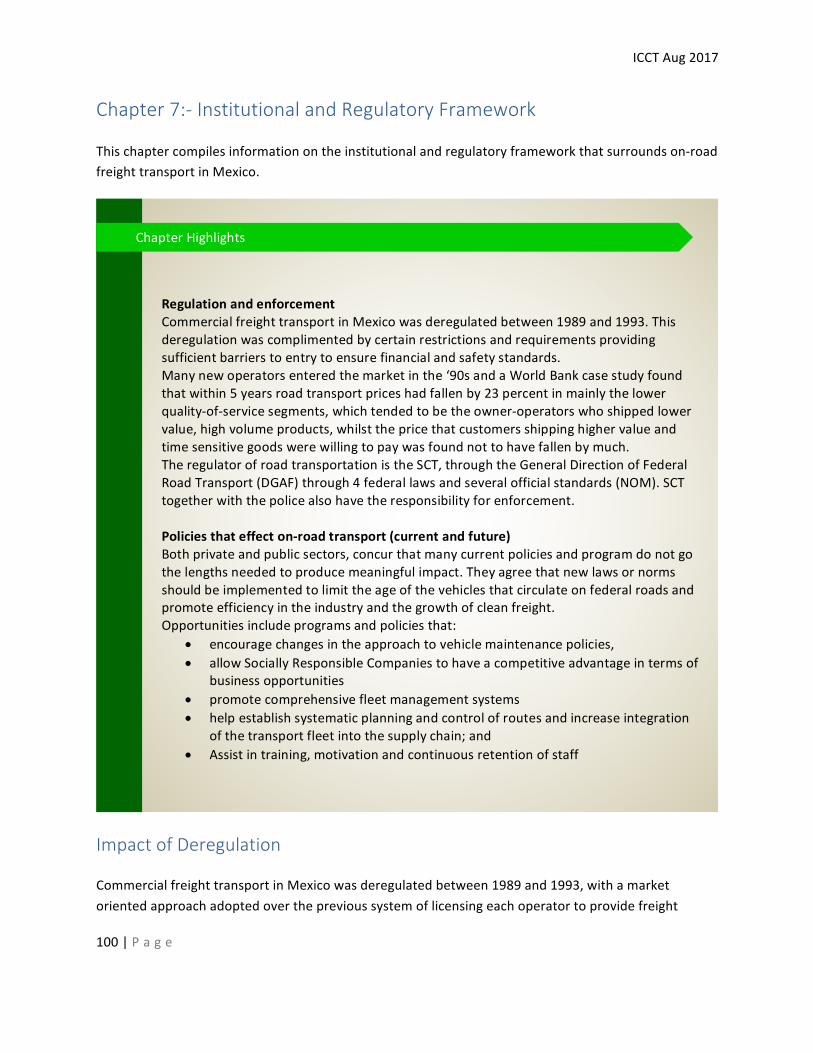
ICCTAug2017
100|P a g e
Chapter7:-InstitutionalandRegulatoryFramework
Thischaptercompilesinformationontheinstitutionalandregulatoryframeworkthatsurroundson-roadfreighttransportinMexico.
ImpactofDeregulation
CommercialfreighttransportinMexicowasderegulatedbetween1989and1993,withamarketorientedapproachadoptedovertheprevioussystemoflicensingeachoperatortoprovidefreight
RegulationandenforcementCommercialfreighttransportinMexicowasderegulatedbetween1989and1993.Thisderegulationwascomplimentedbycertainrestrictionsandrequirementsprovidingsufficientbarrierstoentrytoensurefinancialandsafetystandards.Manynewoperatorsenteredthemarketinthe‘90sandaWorldBankcasestudyfoundthatwithin5yearsroadtransportpriceshadfallenby23percentinmainlythelowerquality-of-servicesegments,whichtendedtobetheowner-operatorswhoshippedlowervalue,highvolumeproducts,whilstthepricethatcustomersshippinghighervalueandtimesensitivegoodswerewillingtopaywasfoundnottohavefallenbymuch.TheregulatorofroadtransportationistheSCT,throughtheGeneralDirectionofFederalRoadTransport(DGAF)through4federallawsandseveralofficialstandards(NOM).SCTtogetherwiththepolicealsohavetheresponsibilityforenforcement.Policiesthateffecton-roadtransport(currentandfuture)Bothprivateandpublicsectors,concurthatmanycurrentpoliciesandprogramdonotgothelengthsneededtoproducemeaningfulimpact.Theyagreethatnewlawsornormsshouldbeimplementedtolimittheageofthevehiclesthatcirculateonfederalroadsandpromoteefficiencyintheindustryandthegrowthofcleanfreight.Opportunitiesincludeprogramsandpoliciesthat:
• encouragechangesintheapproachtovehiclemaintenancepolicies,• allowSociallyResponsibleCompaniestohaveacompetitiveadvantageintermsof
businessopportunities• promotecomprehensivefleetmanagementsystems• helpestablishsystematicplanningandcontrolofroutesandincreaseintegration
ofthetransportfleetintothesupplychain;and• Assistintraining,motivationandcontinuousretentionofstaff
ChapterHighlights
ICCTAug2017
101|P a g e
services.Thisderegulationwascomplimentedbycertainrestrictionsandrequirementsprovidingsufficientbarrierstoentrytoensurefinancialandsafetystandards.
Manynewoperatorsenteredthemarketin1990andaWorldBankcasestudyfoundthatwithin5yearsroadtransportpricesfellby23percent.35Thegreatestdeclinesoccurredinthelowerquality-of-servicesegments,commonlyservedbyowner-operators,whoshippedlowervalueandhighvolumeproducts.Meanwhile,customers’willingnesstopayforshippinghighervalueandtime-sensitivegoodsdidnotfallasmuch.
PresentRegulation
TheregulatorofroadtransportationisSCT,throughtheGeneralDirectionofFederalRoadTransport(DGAF).Thelegalframeworkconsistsprincipallyofthefollowingregulations36:
• FederalLawonRoads,BridgesandMotorizedTransport(LeyFederaldeCamionos,PuentesyAutotransporteFederal,LCPAF)
• LawofGeneralCommunicationRoutes(LeyGeneraldeViasdeCommunicacion,LGVC)• LawofPublic-PrivateAssociations(LeydeAsociacionesPublicoPrividas,LAPP)• FederalLawtoControlChemicalsPrecursors,EssentialChemicalProductsandMachinesto
ElaborateCapsules,PillsandTablets(LeyFederalparaelControldePrecursoresQuimicos,ProductosQuímicosEsencialesyMáquinasparaElaborarCápsulas,TabletasyComprimidos,LGCPQ)
Someoftheselawsaresupportedbyspecificby-lawsandNOMs.Themostimportantofthesespecifyvehicledimensionspermittedtooperateandvehicleequipmentrequirements.
TheOECDreviewofRegulationofFreightTransportinMexico(2017)highlightedcertaingapsintheregulations,themostnotablebeinglackofdrivingandresttimeregulationstoavoiddriverfatigue.
RegulationsregardingthetypeandminimumstandardofvehiclepermittedtobeimportedandfirstregisteredinMexicoarealsosetoutintheNOMs.ThelargenumberofsecondhandimportedvehiclesmakestheapplicationandenforcementofthesafetyandenvironmentalstandardssetoutintheNOMSparticularlyimportant.
NOM-044ofSEMARNATestablishesthemaximumpermissiblelimitsregardingvehicleemissions.Thisregulationiscurrentlyunderrevision,withtheforeseenimprovementsinfuelqualityallowingmorestringentemissionsstandardstobeapplied.
35Source:Dutz,HayriandIbarra(2000),RegulatoryReform,CompetitionandInnovation:ACaseStudyoftheMexicanNationalCompetitionAgencyRoadFreightIndustry,https://openknowledge.worldbank.org/bitstream/handle/10986/22187/WPS2318.pdf?sequence=2&isAllowed=y36ReviewoftheRegulationofFreightTransportinMexico,OECD2017
ICCTAug2017
102|P a g e
RequiredDocumentationandapplicablestandards
FreighttransportinMexicorequirestheoperator/vehicletohaveanumberofdocumentsinorder.
Operator
1. FederaldrivingLicense;normallyType“B”orType“E”forhazardousfreight.2. ProofofPsychophysicalAptitude,(current).3. Non-penalbackgroundcheck4. Logofhoursofserviceofthedriver.(thisisarequirementthatwasnotmentionedbythe
interviewees)
AllVehicles
1. Validcirculationcardforhighwaytractor.2. LicensePlatesandstickerforhighwaytractor.3. ThirdPartyDamageInsurancePolicy,(CivilLiabilityInsurancefor19,000daysofMinimumwage
inforceintheFederalDistrict.ThisequatestoapproximatelyUS$85,000)4. Certificateoflowemissionofpollutants,inforce.5. Certificateofphysicalandmechanicalconditions(IncompliancewithNOM-068-SCT-2-2000.6. Validcirculationcardforthesemi-trailerandthetrailer.7. MetalidentificationplateissuedbytheSCTforthesemi-trailerandthetrailer8. Permitsforconnectivityroutes(betweenhighwaysofahigherweightclass9. Permitsforlocaloperation,toentercitieslikeCelaya,Aguascalientes,Guadalajara10. Permitstooperateinrestrictedzones
Additionalrequirementsforhazardousfreight
11. Ecologicaldamageinsurancepolicy,(Environmentaldamageinsurancefor$900,000.00ThisequatestoapproximatelyUS$50,000)).
12. Documentofshipmentofthetransportedproduct.13. Formatof"Emergencytransportationinformation",indicatingtheactionstobetakeninthe
eventofanaccidentoccurring,accordingtothehazardousmaterialorwasteconcerned.14. Dailytechnicalvisualinspectionformatoftheunit.15. Manifestofdeliverytransportandreception,forthecaseoftransportationofhazardouswaste,
issuedbytheSecretariatofSocialDevelopment16. Authorizationforthecaseofimportandexportofhazardousmaterials,17. Manifestforcasesofspillsofhazardouswastebyaccident.18. Documentalproofoftankcleaning.Cleaningisonlyobligatoryforreasonsofincompatibilityof
theproductstobetransported.19. SignageindicatingtheUnitedNationsnumberofthetransportedproduct,aswellasthe
classificationoftheproduct.
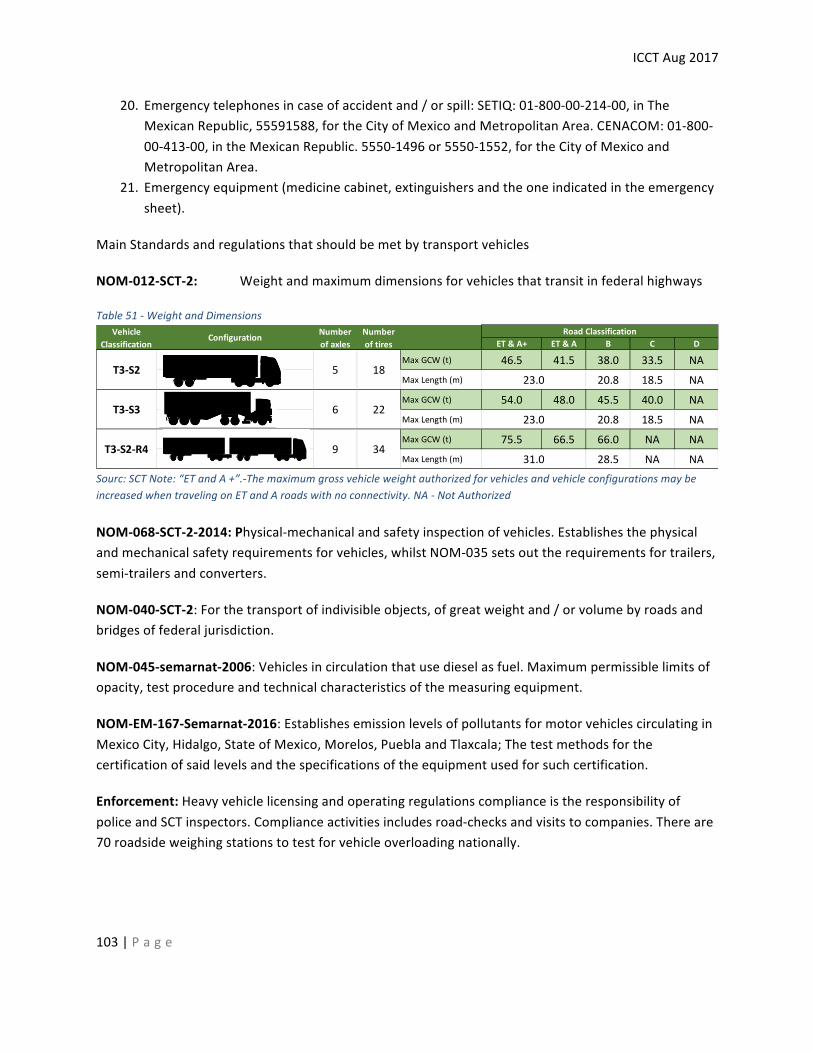
ICCTAug2017
103|P a g e
20. Emergencytelephonesincaseofaccidentand/orspill:SETIQ:01-800-00-214-00,inTheMexicanRepublic,55591588,fortheCityofMexicoandMetropolitanArea.CENACOM:01-800-00-413-00,intheMexicanRepublic.5550-1496or5550-1552,fortheCityofMexicoandMetropolitanArea.
21. Emergencyequipment(medicinecabinet,extinguishersandtheoneindicatedintheemergencysheet).
MainStandardsandregulationsthatshouldbemetbytransportvehicles
NOM-012-SCT-2: Weightandmaximumdimensionsforvehiclesthattransitinfederalhighways
Table51-WeightandDimensions
Sourc:SCTNote:“ETandA+”.-ThemaximumgrossvehicleweightauthorizedforvehiclesandvehicleconfigurationsmaybeincreasedwhentravelingonETandAroadswithnoconnectivity.NA-NotAuthorized
NOM-068-SCT-2-2014:Physical-mechanicalandsafetyinspectionofvehicles.Establishesthephysicalandmechanicalsafetyrequirementsforvehicles,whilstNOM-035setsouttherequirementsfortrailers,semi-trailersandconverters.
NOM-040-SCT-2:Forthetransportofindivisibleobjects,ofgreatweightand/orvolumebyroadsandbridgesoffederaljurisdiction.
NOM-045-semarnat-2006:Vehiclesincirculationthatusedieselasfuel.Maximumpermissiblelimitsofopacity,testprocedureandtechnicalcharacteristicsofthemeasuringequipment.
NOM-EM-167-Semarnat-2016:EstablishesemissionlevelsofpollutantsformotorvehiclescirculatinginMexicoCity,Hidalgo,StateofMexico,Morelos,PueblaandTlaxcala;Thetestmethodsforthecertificationofsaidlevelsandthespecificationsoftheequipmentusedforsuchcertification.
Enforcement:HeavyvehiclelicensingandoperatingregulationscomplianceistheresponsibilityofpoliceandSCTinspectors.Complianceactivitiesincludesroad-checksandvisitstocompanies.Thereare70roadsideweighingstationstotestforvehicleoverloadingnationally.
ET&A+ ET&A B C D
MaxGCW(t) 46.5 41.5 38.0 33.5 NAMaxLength(m) 20.8 18.5 NAMaxGCW(t) 54.0 48.0 45.5 40.0 NAMaxLength(m) 20.8 18.5 NAMaxGCW(t) 75.5 66.5 66.0 NA NAMaxLength(m) 28.5 NA NA
T3-S3
T3-S2-R4
23.0
31.0
5 18
6 22
9 34
Numberofaxles
Numberoftires
VehicleClassification
RoadClassificationConfiguration
23.0T3-S2
ICCTAug2017
104|P a g e
On-roadtransportpolicies(currentandfuture)
Interviewees,fromprivateandpublicsectors,concurthatmanycurrentpoliciesandprogramsfailtoproduceameaningfulimpact.AsexpressedbyJudithTrujilloMachadofromSEMARNAT,“forseveralyearswehavebeenawarethatwemustimplementsometypeofnewlawsornorms,suchaslimitingtheageofthevehiclesthatcirculateonfederalroads.However,thishasnotgainedanytraction.Currentfinancing,scrapping,andotherprogramsarenotdoingenough”.Anideaproposed,withsupportfrommultipletransportfleetsinterviewed,beyondrecognizingcleanfleetswithsomekindofcertificate,istorewardsuchfleetsbyprovidingthemwithcompetitiveadvantages.Onepossiblebenefitcouldbepermittingaccesstocertainurbanmarketsonlytothosefleetswhocomplywithenvironmentalstandards.Limiting‘dirty’fleets’accessintourbancenterswouldbeatransformativedriverforenterprisestochangepracticesandadoptcleanertechnologies.
Anotheropportunityforpolicyimprovementmentionedbyintervieweesistheincreaseofsomesubsidiesandthereductionofothersaffectingthesectornegatively.Accordingtoforeigninvestmentlaws,foreigncompaniescannothaulinter-statefreightinMexico.ThisismeanttoprotecttheMexicanfreightsectorfrombeingover-runbythefinancialstrengthofAmericantransportenterprises.However,accordingtomultipleinterviewees,thelawisredactedinsuchwaythatithampersMexicanfleets.ThelawstatesthatMexicancompanieswithforeigninvestment(privatetransportcompanies)mayonlyhaultheirownmerchandise.Theoutcomeofsuchnormisthatoncethefleethasunloadeditsmerchandise,thereturntripisdonewithanemptytruck,sinceitcanonlyhaulitsownproducts.Thereisasubsidyattachedtothisnorm,essentiallypayingprivatetransportenterprisestoreturnempty.ProfessionalcompaniesinMexicocannotdedicatepartoftheirresourcestofederalpublictransport,becausethelawispoorlyworded.AccordingtoIng.AlexTheissenLongofFEMSALogistics“Thesubsidythatexistsallowsyoutoremainmediocre,sinceyougetpaidforit.Itisasubsidythatmustdisappearbecause,ontopofeverything,itgeneratesfreepollution”.Thissituationiscausingexplosivegrowthamongst3PLsasawayaroundthislaw.Byshiftingtheirfleettoa3PL,CocaColasaidthattheycannowcarrybottledwaterfromasistercompanyontheirreturntrips,somethingthattheyhadbeenrestrictedfromdoing.Allowingprivatecompaniestohaulfreightfromotherprivatecompaniesonreturntripscouldbeacost-effectiveandefficiency-inducingmeasure.Anotherpolicythatrequiresrevision,basedonthecommentsbythetransportenterprisesinterviewed,isthecertificationoftank-truck-washingstations.Thecostassociatedwithcomplyingwiththestandardsnecessaryforcertification,maketruck-washingstationseconomicallyunsustainable.Thecostsresultinhavingfewcertifiedwashingstationswhichinturnleadsininefficienciesintheserviceduetodelays.Asoneofthetransportersstated“thankfully,noonehasbeenabletofullycomplywithalltherequirements.Ifsomeoneweretobeableto,weallhavetobecareful.Becauseofthatone,wewouldallgetfinedaheftyamount,whilestillnotbeabletocomplyourselves”.Althoughthegoalofthepolicyultimatelyistoincreasethestandardinthetransportofdelicatecargosuchascomestibles,thecurrentpolicyisprovingtobetoocostly.
Apolicyproposedbytheinterviewees,inthiscaseINECC,istoexemptenterprisesparticipatinginprogramssuchasTransporteLimpiofromhavingtogothroughvehicleemissionstesting.Regardlessof
ICCTAug2017
105|P a g e
thetypesofpoliciesthatneedtobeimplemented,aspartofanyfuturenorms,theremustbebettermonitoringandmoreprofessional,constantreportingfromtransportenterprises,somethingtheyarewillingtodoiftheinformationiskeptconfidentialandthereisincreasedsupportfromthegovernment.
Opportunitiesforapolicyframeworktopromotethegrowthofcleanfreight
WhenquestionontheneedsandopportunitiesforapolicyframeworktopromotethegrowthofcleanfreightinMexico,transportfleetsofvaryingsizesagreedonthefollowing:
1. Governmententitieswouldbenefitfromencouragingchangesintheapproachtovehiclemaintenancepolicies,encouragingcompaniestowardspreventiveandpredictivepractices.Thisisaproblemspeciallyamongsmallertransportfleetsasmanytimestheylackfinancialcapabilityorforesighttoseethebenefitsofpropermaintenance.ThisshiftinfleetmaintenancepracticesarepartofwhatSEMARNATcalltheprofessionalizationoftransportfleets.AccordingtothedeputydirectorofthetransportsectoratSEMARNAT,“Thereisstillalaginthiswholeissueoftheprofessionalizationofcompanies.Ifwestarttodoit,wewillhavemanybenefits,becausethathasadirecteffectonaspectsfromfuelconsumptiontousingandmaintainingthecorrectpartsofthetrucksaccordingtotheiruse”.
2. ThegovernmentcouldalsocreatepoliciesthatallowSociallyResponsibleCompaniestohaveacompetitiveadvantageintermsofbusinessopportunities.Everyentityintervieweddeclaredthatthecurrentincentiveswerenotenoughandthatonlymore,newer,andmoretangibleincentiveswillbringfleetsonboardcleantransportprograms.Onthetopic,SMAEMsaidoftransportcompaniesofallsizes“theywanttosave,buttheyalsohavetoinvest.Inordertobeabletoinvest,theyhavetobegivenalltypesofincentives;taxincentives,importincentives,evengivingthemaspecialdiscountorpricewhentheyreachindustrialcorridors”.Aspartofthoseincentives,theremustbefinancingsystemstohelpfleetscopewiththecapitalcostsofparticipatinginprogramsthatwouldcertifythemassociallyresponsiblecompanies.
3. Establishacomprehensivefleetmanagementsysteminadditiontostandardizationofvehiclesandsparepartsavailableaccordingtothetypeofoperation.Animportantsteptowardachievingacomprehensivefleetmanagementwouldbetoimplementvehicletrackingandcommunicationsystems.Transportationmanagementcanhelpfillthegapswhentrucksarenotatfullcapacity,andalsooptimizetheloadoftruckthatareatfullcapacity.
4. Establishasystemofplanningandcontrolofroutes,increaseintegrationoftransportfleetintothesupplychain,andestablishlogicalprocessesofloadingandunloadingboxtrailers.LogisticscompaniesarecurrentlyseenbymanyastooexpensiveforalargeportionofthefreightsectorinMexico,however,bothbigandsmallcompanieshaveseenthevalueoflogisticsastheyareanintegralpartofsuccessfultransportationinboththeUnitedStatesandCanada.Thecurrentprocessisslowandresultsininefficienciesintermsoftimeaswellasinefficienciesintermsormerchandiselostordamaged.Basedonthecommentsfrommultipletransportfleets,thesupplychangeis
ICCTAug2017
106|P a g e
notfullyintegratedyet.Thereareinstanceswherethefinaldestinationisnotreadyorcapableofhandlingthecargoasitarrives,creatingcostlylosttime.AsindicatedbyFranciscoJ.BarreraMartínezofSMAEM,“transportfleetswanttoseeamultifunctionalprocesswheretechnologyandmobilitygohand-in-handandwherecitieshelptheprocessofheavydutyvehiclesarrivingtotheloadingandunloadingdocks”.
5. Training,motivation,andcontinuousretentionofstaff.Duringtheinterviews,onetransportfleetdeclared“Iinsistthattrainingstaff,measuringtheeffectivenessofthistrainingandtakingadvantageofnewvehiculartechnologieswillhelpusalot”.Thattransportcompanywasnotaloneintheirassertion.Multipleintervieweesexpressedtheirdesireforincreasedfocusontrainingforoperatorsandotherstaff.Frequently,thereisafearstaffwillleaveafteracompanyhadinvestedresourcesintotheirtraining,however,theconsequencesofuntrainedstaffoutweightheriskofhavingtheindividualleave.Thesenegativeconsequencescanbemoreclearlyseenamongsmallfleetsandowner-operatorswhosufferfromcostlyinefficienciesthatarenottiedtothechoiceoftechnology.Propertrainingandeducationcannotonlyleadtoeconomicbenefits,butalsoleadtoenvironmentalbenefitsandroadsafety.
6. AllintervieweesagreedthatthemovetowardsgreeningfreightishamperedbythegenerallypoorconditionofMexicanhighwaysandtransitsecurity.Thepoorconditionsoftheroutesmakethetransportlessefficient,ascomparedtosimilarunitsinothercountries.Manyofthesmallenterprisesdonotmakeuseofthecorrecttiresorcorrectmaintenance,which,exasperatedbyoverloading,furtherincreasesthenegativeimpactoftheroadsonthestateoffreightinMexico.Intermsofsecurity,asmallenterprise,withlittletonofinancialcapabilities,isfurtherdeterredfrominvestinginefficiency-improvingaccessoriesbytheriskofhavingthosecomponentsstolenbeforethefullreturnoninvestment.
Accordingtomultipleinterviewees,therearesomeessentialdifferencesbetweenthelargetransportfleetsandthesmalltransportfleets.Comprehensivefleetmanagementwouldincreasethestandardofserviceandmakesmallcompaniesmoreprofessionalandcompetitivebytacklingthefollowingessentialdifferences:
• thefrequencyofnewvehiclepurchases,• theknowledgeoftechnologicalneedsaccordingtotheuseofeachtruckunit,• operationalandenergycosts,• availabilityofunits,• thedrivers’leveloftraininginenvironmentalandroaddrivingeducation,• numberofdriversavailableforlongtripswithoutstopstoreduceriskintransportationof
perishables,• capacityofnegotiationfortheacquisitionofunitsandsparepartsinlargevolumes,• strictnessandcontrolledcomplianceinperiodsofmaintenanceofthevehicle,• systemsforoperationscontrol,monitoringandsecurityoftheloadwhileontheroad;and• adherencetonormsandenvironmentalconscience.
ICCTAug2017
107|P a g e
EachofthesedifferencesrepresentbothchallengesandopportunitiesforthefreightsectorinMexico.Ifaddressedproperly,thoseopportunitieswillpositivelydisruptthesector,bolsteringitsgrowthandincreasingitsinternationalcompetitiveness.
ICCTAug2017
108|P a g e
Chapter8:-ProgramadeTransporteLimpioandrelatedprograms
ThischaptercompilesinformationonstandardsandprogramsinMexicothatpromotecleantransport—suchastheProgramadeTransporteLimpio—andlooktomodernizethevehiclefleet.
CurrentpoliciesandprogramsThereareatpresentthreegovernmentalprogramsinMexicowhichaimtopromoteefficiencyandenvironmentalperformanceinthetruckingsector:TheCleanTransportationProgram(TransporteLimpio),theProgramfortheModernizationoftheFederalMotorCarrierFleetandtheFederalMotorCarrierScrappageScheme.TransporteLimpioTransporteLimpioisavoluntaryprogramdevelopedbytheSecretariatofEnvironmentandNaturalResources(SEMARNAT)andtheSecretariatofCommunicationsandTransport(SCT).TransporteLimpioaimstohelpfederalmotorcarrierpermitholders(freightcarriersandusers)toreducetheirfuelconsumption,GHGemissionsandcriteriapollutantsandtheiroperatingcoststhroughtheadoptionofstrategies,bestpracticesandtechnologies.SEMARNATreportsthatsince2008,theprogramhasledtothemitigationof5.3milliontonnesofCO2,withsignificantreductionsinfuelusageacrossthefreightsector.AlthoughTransporteLimpiohasmadeprogress,thereareseveralkeychallengesandbarrierswhichpreventtheprogramfrombeingmoreeffective:
• Limitedbudgetandoutreach• Consolidationandscope• Marketing• Financing• RegulatoryIssues• Technologyevaluation
Thereareseveralareasthatofferconsiderablepotentialtostrengthentheprogram:• LeverageofthefutureemissionsstandardNOM-044• Increasemarketingandawareness• Improvedatacollectionandrecovery• Increasefinancingoptionsforcarriers• ImprovelinksbetweenTransporteLimpioandFleetModernisationandScrappage
programs• FurtherhomologationwithSmartWay
ChapterHighlights
ICCTAug2017
109|P a g e
ProgramfortheModernisationoftheFederalMotorCarrierFleetTheProgramfortheModernisationoftheFederalMotorCarrierFleethasbeendevelopedandpromotedbytheSCTandNAFIN.Theprogramprovidesfundingandtaxincentivesfortheacquisitionofmoreefficientandloweremissionvehicles,whicharenewornearlynew(upto6yearsold).Toincreasethedistributionofcreditandthusencouragetherenewalofmoreunits,FederalGovernmentprovidessupporttointerestedfinancialintermediaries.Asof2012,approximately48,019loweremissionvehicleshavebeenfinancedunderthescheme.Thebiggestchallengeassociatedwiththisprogramistheinabilityforsmallcarriersandowner-operatorstomeetcreditrequirements.Duetoseasonalcashflowsamongstsmallercarriers,thisoftenleadstothemnotmeetingrequirements.Further,therequirementsforcreditstabilityareoftenconsideredunachievableandexpensive,suchasdocumentaryevidenceofeconomicsolvency.FederalMotorCarrierScrappageSchemeTheMexicanScrappageSchemeisoperatedagainbyMexicangovernment,andpromotesthereplacementofoldtrucks(over10yearsold)withincentivestowardstheirscrappage,withthemaximumincentivebeingapproximately15percentofthevalueofanewunit.Between2004and2014,morethan22,000truckshavebeenscrapped,andapproximately1.5milliontonsofCO2hasbeenmitigated.InMay2015,theschemewasupdated,bringingthemaximumfinancialincentivetoapproximately$250,000MXN.Thechallengesfacedunderthescrappageschemearelinkedcloselytothatofthefleetrenewalscheme,largelyduetoalackoffundingwithintheprogram.Thishasledtoincentivesoftenbeingbelowvalueofoldunitleadingtooperatorssellingtheiroldunitsratherthanscrapping.Additionally,thelackoflineagebetweentheFleetModernizationProgramhasledtomorevehiclesenteringthefleetthanbeingscrapped.FuturepoliciesandprogramsMexicanOfficialStandardNOM-044ThenewversionofNOM-044wasexpectedtoenterasfromJan,1,2019buthasbeendelayedprincipallyduetothenecessityofnationwideavailabilityofultra-lowsulfurdieselfuel,neededforEPA2010/Euro6vehicles,supersedingthecurrentEuro2/3standard.Theupdatebasicallystatesthatfrom1January2019,limitsequivalenttoEUROVI/EPA2010mustbemet.However,EUROIV/EPA2004vehicleswillstillbeallowedtobemarketedforsixmonthsafterthatdateandvehiclesthatcomplywithlimitsequivalenttoEUROVmaybemarketedfortwoyears(until1January2021).Inparallel,MexicoalsointendstodevelopanenergyefficiencystandardforheavyvehiclesrelatedtothenewUSrequirementsthatarecurrentlyinflux.
ICCTAug2017
110|P a g e
Currentpoliciesandprograms
ThereareatpresentthreegovernmentalprogramsinMexicowhichaimtopromoteefficiencyandenvironmentalperformanceinthetruckingsector:TheCleanTransportationProgram(TransporteLimpio),theProgramfortheModernizationoftheFederalMotorCarrierFleetandtheFederalMotorCarrierScrappageScheme.
TransporteLimpio
TransporteLimpioisavoluntaryprogramdevelopedbytheSecretariatofEnvironmentandNaturalResources(SEMARNAT)andtheSecretariatofCommunicationsandTransport(SCT).TransporteLimpioismodelledaftertheUSA’sEnvironmentalProtectionAgency(EPA)SmartWayprogram.
TransporteLimpioaimstohelpfederalmotorcarrierpermitholders(freightcarriersandusers)toreducetheirfuelconsumption,GHGemissionsandcriteriapollutants,andtheiroperatingcoststhroughtheadoptionofstrategies,bestpractices,andtechnologies37.
PurposeofTransporteLimpio
Theprogramprovidesrecognitionforcarrier’sparticipation,especiallythoseimplementingplansandmeetingfuelsavingtargets.Moreimportantly,theprogramenablesdatacollectiontobetterunderstandthecurrentstatusofthecarrier’sfleet.Thismeasurementleadsthetransportfleettomakedecisions,toevaluatefuelconsumption,routes,operators,andhandling.TheinformationcollectedthroughTransporteLimpioinformsthetruckselectionprocessandtheirsuitabilityfortheexpecteddutycycleandroute,byevaluatingspecificcharacteristicssuchasthetorque,differentialpitch,transmissionandwheelortiresize.Theprogrampromotesthefleettomakethesemeasurementsandimproveitsfuelconsumption,underitsowntypeofoperationandroutes.
37SEMARNAT,2015http://www.semarnat.gob.mx/temas/gestion-ambiental/calidad-del-aire/transporte-limpio
FederalRoadFreightTransportNAMA(forowneroperatorsandsmallerfleetcarriers)TheFederalRoadFreightTransportNAMA(Nationallyappropriatemitigationaction)isaprogramcurrentlybeingdevelopedundertheMexican-GermanNAMAProgram.ThemainaimoftheNAMAistoimprovetheenergyefficiencyoftheRoadtransportsectorthroughmeasuressimilartothecurrentfederalsuiteofprograms,focusinglargelyonowneroperators(upto5vehicles)andsmallfleetcarriers(upto30vehicles).
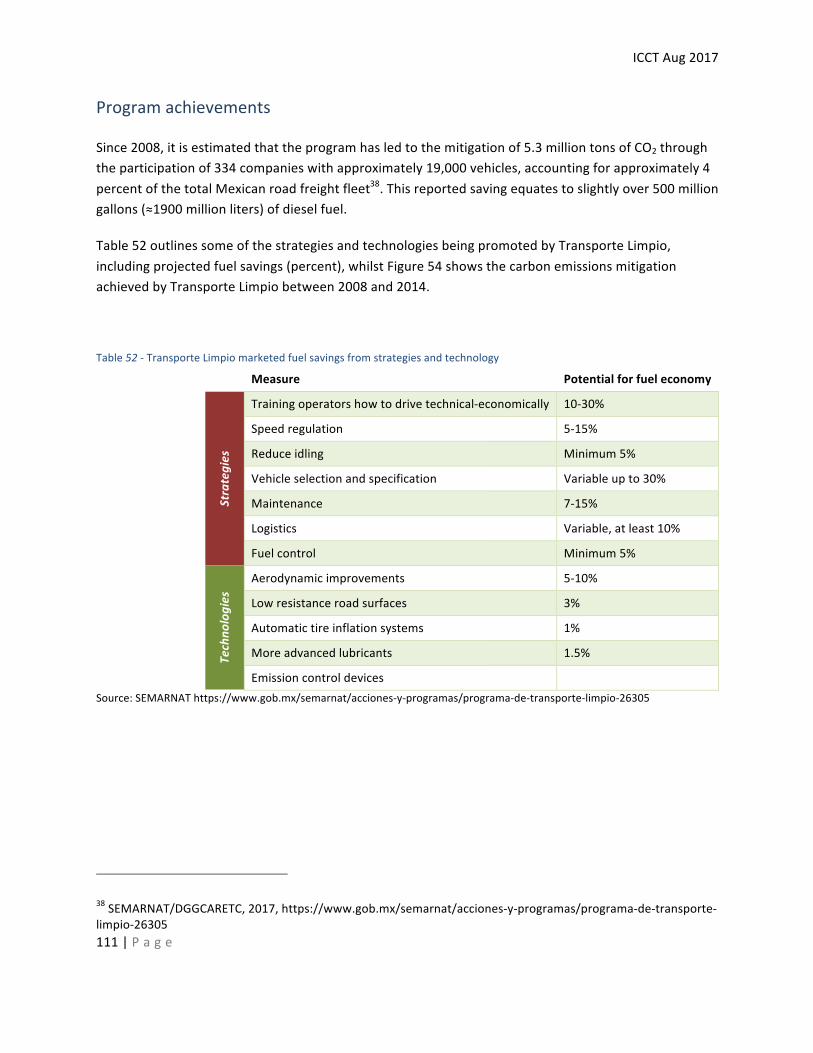
ICCTAug2017
111|P a g e
Programachievements
Since2008,itisestimatedthattheprogramhasledtothemitigationof5.3milliontonsofCO2throughtheparticipationof334companieswithapproximately19,000vehicles,accountingforapproximately4percentofthetotalMexicanroadfreightfleet38.Thisreportedsavingequatestoslightlyover500milliongallons(≈1900millionliters)ofdieselfuel.
Table52outlinessomeofthestrategiesandtechnologiesbeingpromotedbyTransporteLimpio,includingprojectedfuelsavings(percent),whilstFigure54showsthecarbonemissionsmitigationachievedbyTransporteLimpiobetween2008and2014.
Table52-TransporteLimpiomarketedfuelsavingsfromstrategiesandtechnology
Measure Potentialforfueleconomy
Strategies
Trainingoperatorshowtodrivetechnical-economically 10-30%
Speedregulation 5-15%
Reduceidling Minimum5%
Vehicleselectionandspecification Variableupto30%
Maintenance 7-15%
Logistics Variable,atleast10%
Fuelcontrol Minimum5%
Techno
logies
Aerodynamicimprovements 5-10%
Lowresistanceroadsurfaces 3%
Automatictireinflationsystems 1%
Moreadvancedlubricants 1.5%
Emissioncontroldevices Source:SEMARNAThttps://www.gob.mx/semarnat/acciones-y-programas/programa-de-transporte-limpio-26305
38SEMARNAT/DGGCARETC,2017,https://www.gob.mx/semarnat/acciones-y-programas/programa-de-transporte-limpio-26305
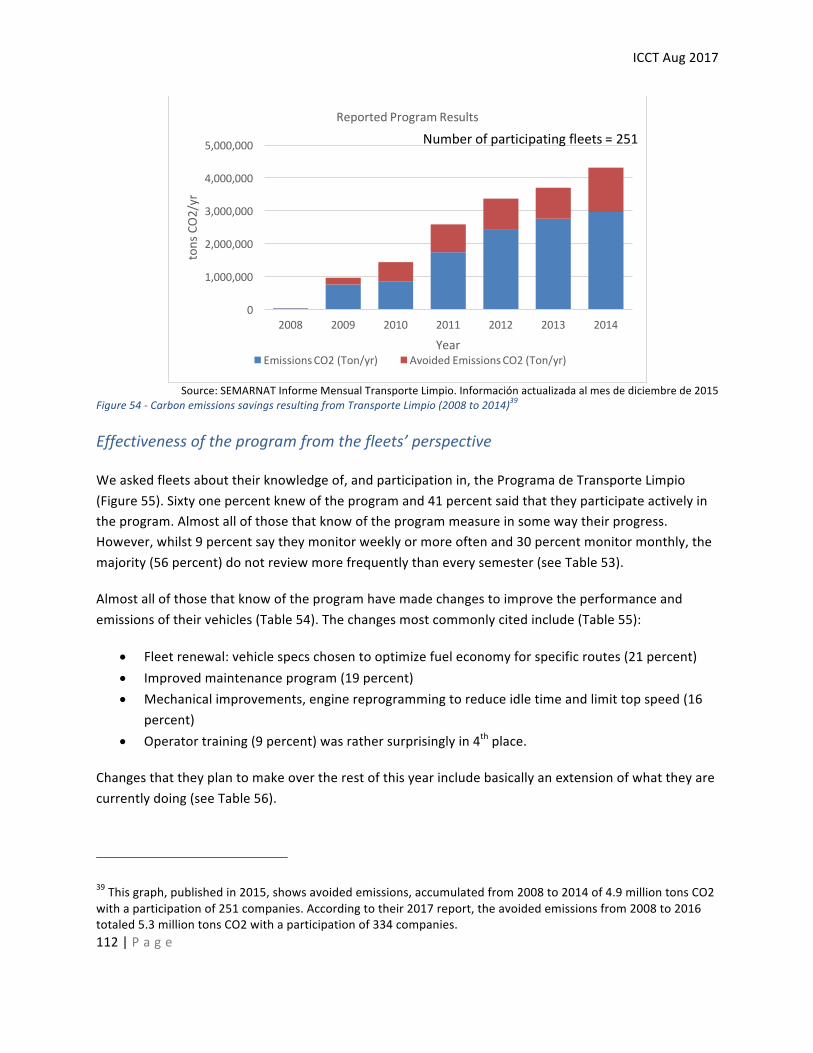
ICCTAug2017
112|P a g e
Source:SEMARNATInformeMensualTransporteLimpio.Informaciónactualizadaalmesdediciembrede2015
Figure54-CarbonemissionssavingsresultingfromTransporteLimpio(2008to2014)39
Effectivenessoftheprogramfromthefleets’perspective
Weaskedfleetsabouttheirknowledgeof,andparticipationin,theProgramadeTransporteLimpio(Figure55).Sixtyonepercentknewoftheprogramand41percentsaidthattheyparticipateactivelyintheprogram.Almostallofthosethatknowoftheprogrammeasureinsomewaytheirprogress.However,whilst9percentsaytheymonitorweeklyormoreoftenand30percentmonitormonthly,themajority(56percent)donotreviewmorefrequentlythaneverysemester(seeTable53).
Almostallofthosethatknowoftheprogramhavemadechangestoimprovetheperformanceandemissionsoftheirvehicles(Table54).Thechangesmostcommonlycitedinclude(Table55):
• Fleetrenewal:vehiclespecschosentooptimizefueleconomyforspecificroutes(21percent)• Improvedmaintenanceprogram(19percent)• Mechanicalimprovements,enginereprogrammingtoreduceidletimeandlimittopspeed(16
percent)• Operatortraining(9percent)wasrathersurprisinglyin4thplace.
Changesthattheyplantomakeovertherestofthisyearincludebasicallyanextensionofwhattheyarecurrentlydoing(seeTable56).
39Thisgraph,publishedin2015,showsavoidedemissions,accumulatedfrom2008to2014of4.9milliontonsCO2withaparticipationof251companies.Accordingtotheir2017report,theavoidedemissionsfrom2008to2016totaled5.3milliontonsCO2withaparticipationof334companies.
0
1,000,000
2,000,000
3,000,000
4,000,000
5,000,000
2008 2009 2010 2011 2012 2013 2014
tonsCO2/yr
Year
ReportedProgramResults
EmissionsCO2(Ton/yr) AvoidedEmissionsCO2(Ton/yr)
Numberofparticipatingfleets=251
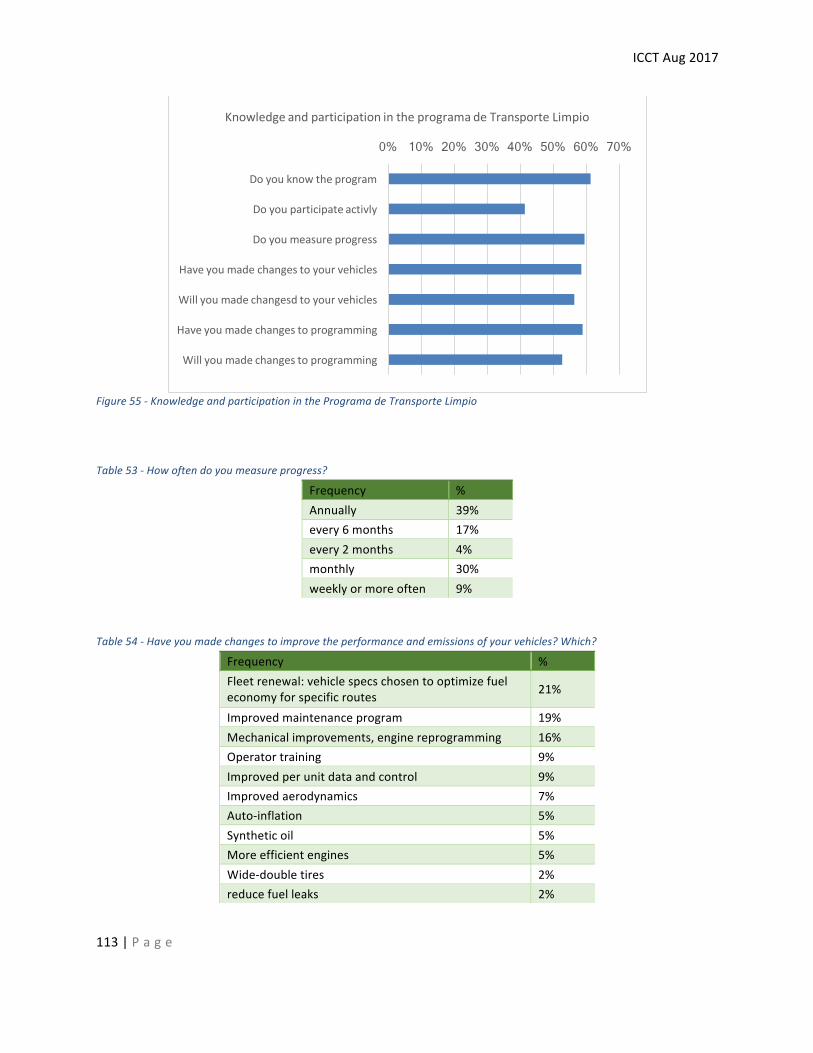
ICCTAug2017
113|P a g e
Figure55-KnowledgeandparticipationintheProgramadeTransporteLimpio
Table53-Howoftendoyoumeasureprogress?
Frequency %Annually 39%every6months 17%every2months 4%monthly 30%weeklyormoreoften 9%
Table54-Haveyoumadechangestoimprovetheperformanceandemissionsofyourvehicles?Which?
Frequency %Fleetrenewal:vehiclespecschosentooptimizefueleconomyforspecificroutes 21%
Improvedmaintenanceprogram 19%Mechanicalimprovements,enginereprogramming 16%Operatortraining 9%Improvedperunitdataandcontrol 9%Improvedaerodynamics 7%Auto-inflation 5%Syntheticoil 5%Moreefficientengines 5%Wide-doubletires 2%reducefuelleaks 2%
0% 10% 20% 30% 40% 50% 60% 70%
Doyouknowtheprogram
Doyouparticipateactivly
Doyoumeasureprogress
Haveyoumadechangestoyourvehicles
Willyoumadechangesdtoyourvehicles
Haveyoumadechangestoprogramming
Willyoumadechangestoprogramming
KnowledgeandparticipationintheprogramadeTransporteLimpio
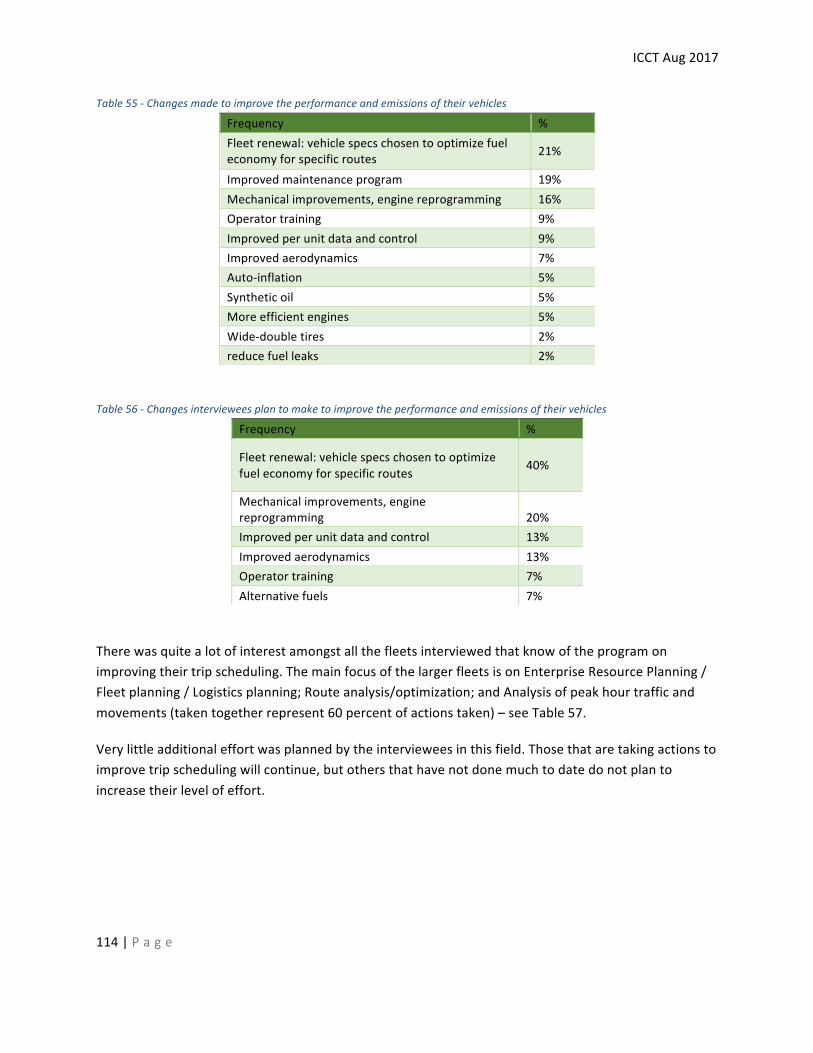
ICCTAug2017
114|P a g e
Table55-Changesmadetoimprovetheperformanceandemissionsoftheirvehicles
Frequency %Fleetrenewal:vehiclespecschosentooptimizefueleconomyforspecificroutes 21%
Improvedmaintenanceprogram 19%Mechanicalimprovements,enginereprogramming 16%Operatortraining 9%Improvedperunitdataandcontrol 9%Improvedaerodynamics 7%Auto-inflation 5%Syntheticoil 5%Moreefficientengines 5%Wide-doubletires 2%reducefuelleaks 2%
Table56-Changesintervieweesplantomaketoimprovetheperformanceandemissionsoftheirvehicles
Frequency %
Fleetrenewal:vehiclespecschosentooptimizefueleconomyforspecificroutes 40%
Mechanicalimprovements,enginereprogramming 20%Improvedperunitdataandcontrol 13%Improvedaerodynamics 13%Operatortraining 7%Alternativefuels 7%
Therewasquitealotofinterestamongstallthefleetsinterviewedthatknowoftheprogramonimprovingtheirtripscheduling.ThemainfocusofthelargerfleetsisonEnterpriseResourcePlanning/Fleetplanning/Logisticsplanning;Routeanalysis/optimization;andAnalysisofpeakhourtrafficandmovements(takentogetherrepresent60percentofactionstaken)–seeTable57.
Verylittleadditionaleffortwasplannedbytheintervieweesinthisfield.Thosethataretakingactionstoimprovetripschedulingwillcontinue,butothersthathavenotdonemuchtodatedonotplantoincreasetheirlevelofeffort.
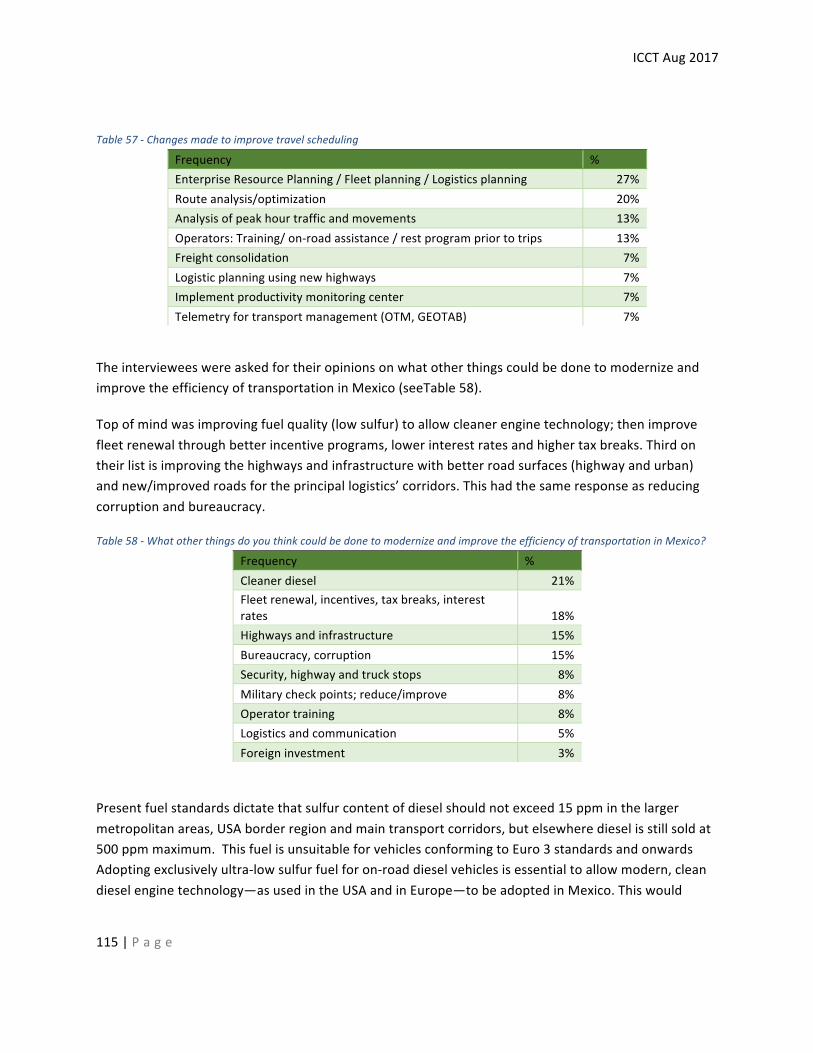
ICCTAug2017
115|P a g e
Table57-Changesmadetoimprovetravelscheduling
Frequency %EnterpriseResourcePlanning/Fleetplanning/Logisticsplanning 27%Routeanalysis/optimization 20%Analysisofpeakhourtrafficandmovements 13%Operators:Training/on-roadassistance/restprogrampriortotrips 13%Freightconsolidation 7%Logisticplanningusingnewhighways 7%Implementproductivitymonitoringcenter 7%Telemetryfortransportmanagement(OTM,GEOTAB) 7%
TheintervieweeswereaskedfortheiropinionsonwhatotherthingscouldbedonetomodernizeandimprovetheefficiencyoftransportationinMexico(seeTable58).
Topofmindwasimprovingfuelquality(lowsulfur)toallowcleanerenginetechnology;thenimprovefleetrenewalthroughbetterincentiveprograms,lowerinterestratesandhighertaxbreaks.Thirdontheirlistisimprovingthehighwaysandinfrastructurewithbetterroadsurfaces(highwayandurban)andnew/improvedroadsfortheprincipallogistics’corridors.Thishadthesameresponseasreducingcorruptionandbureaucracy.
Table58-WhatotherthingsdoyouthinkcouldbedonetomodernizeandimprovetheefficiencyoftransportationinMexico?
Frequency %Cleanerdiesel 21%Fleetrenewal,incentives,taxbreaks,interestrates 18%Highwaysandinfrastructure 15%Bureaucracy,corruption 15%Security,highwayandtruckstops 8%Militarycheckpoints;reduce/improve 8%Operatortraining 8%Logisticsandcommunication 5%Foreigninvestment 3%
Presentfuelstandardsdictatethatsulfurcontentofdieselshouldnotexceed15ppminthelargermetropolitanareas,USAborderregionandmaintransportcorridors,butelsewheredieselisstillsoldat500ppmmaximum.ThisfuelisunsuitableforvehiclesconformingtoEuro3standardsandonwardsAdoptingexclusivelyultra-lowsulfurfuelforon-roaddieselvehiclesisessentialtoallowmodern,cleandieselenginetechnology—asusedintheUSAandinEurope—tobeadoptedinMexico.Thiswould
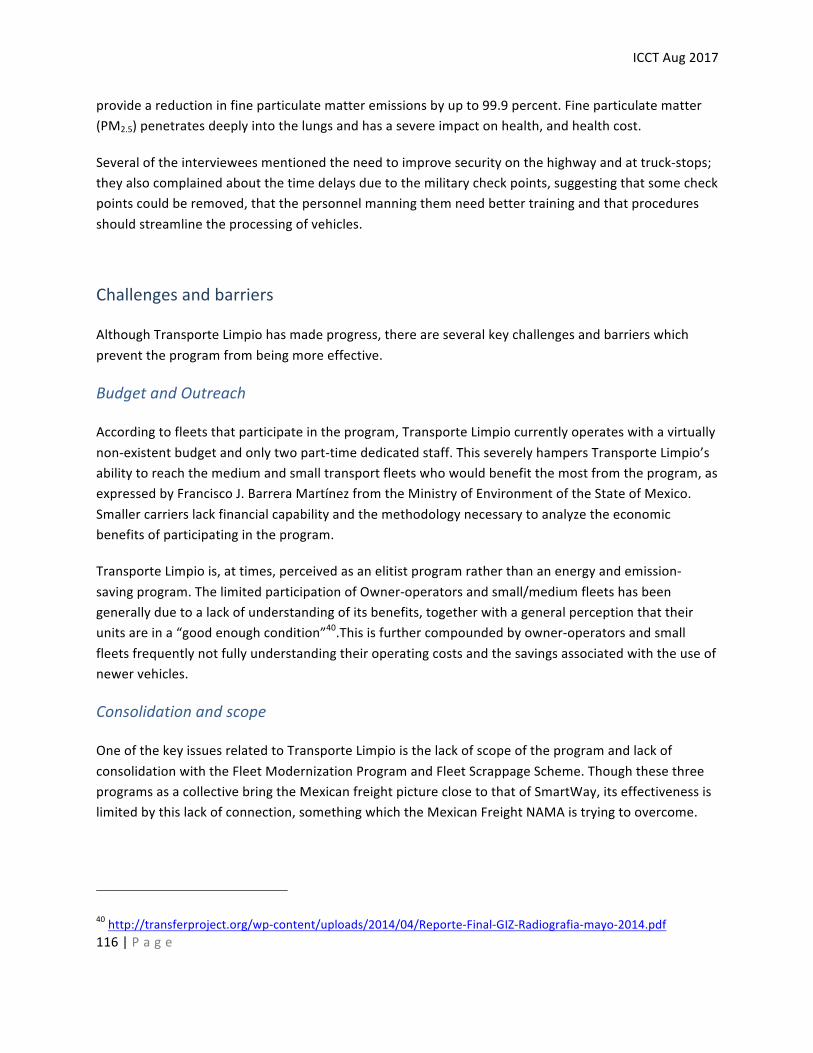
ICCTAug2017
116|P a g e
provideareductioninfineparticulatematteremissionsbyupto99.9percent.Fineparticulatematter(PM2.5)penetratesdeeplyintothelungsandhasasevereimpactonhealth,andhealthcost.
Severaloftheintervieweesmentionedtheneedtoimprovesecurityonthehighwayandattruck-stops;theyalsocomplainedaboutthetimedelaysduetothemilitarycheckpoints,suggestingthatsomecheckpointscouldberemoved,thatthepersonnelmanningthemneedbettertrainingandthatproceduresshouldstreamlinetheprocessingofvehicles.
Challengesandbarriers
AlthoughTransporteLimpiohasmadeprogress,thereareseveralkeychallengesandbarrierswhichpreventtheprogramfrombeingmoreeffective.
BudgetandOutreach
Accordingtofleetsthatparticipateintheprogram,TransporteLimpiocurrentlyoperateswithavirtuallynon-existentbudgetandonlytwopart-timededicatedstaff.ThisseverelyhampersTransporteLimpio’sabilitytoreachthemediumandsmalltransportfleetswhowouldbenefitthemostfromtheprogram,asexpressedbyFranciscoJ.BarreraMartínezfromtheMinistryofEnvironmentoftheStateofMexico.Smallercarrierslackfinancialcapabilityandthemethodologynecessarytoanalyzetheeconomicbenefitsofparticipatingintheprogram.
TransporteLimpiois,attimes,perceivedasanelitistprogramratherthananenergyandemission-savingprogram.ThelimitedparticipationofOwner-operatorsandsmall/mediumfleetshasbeengenerallyduetoalackofunderstandingofitsbenefits,togetherwithageneralperceptionthattheirunitsareina“goodenoughcondition”40.Thisisfurthercompoundedbyowner-operatorsandsmallfleetsfrequentlynotfullyunderstandingtheiroperatingcostsandthesavingsassociatedwiththeuseofnewervehicles.
Consolidationandscope
OneofthekeyissuesrelatedtoTransporteLimpioisthelackofscopeoftheprogramandlackofconsolidationwiththeFleetModernizationProgramandFleetScrappageScheme.ThoughthesethreeprogramsasacollectivebringtheMexicanfreightpictureclosetothatofSmartWay,itseffectivenessislimitedbythislackofconnection,somethingwhichtheMexicanFreightNAMAistryingtoovercome.
40http://transferproject.org/wp-content/uploads/2014/04/Reporte-Final-GIZ-Radiografia-mayo-2014.pdf
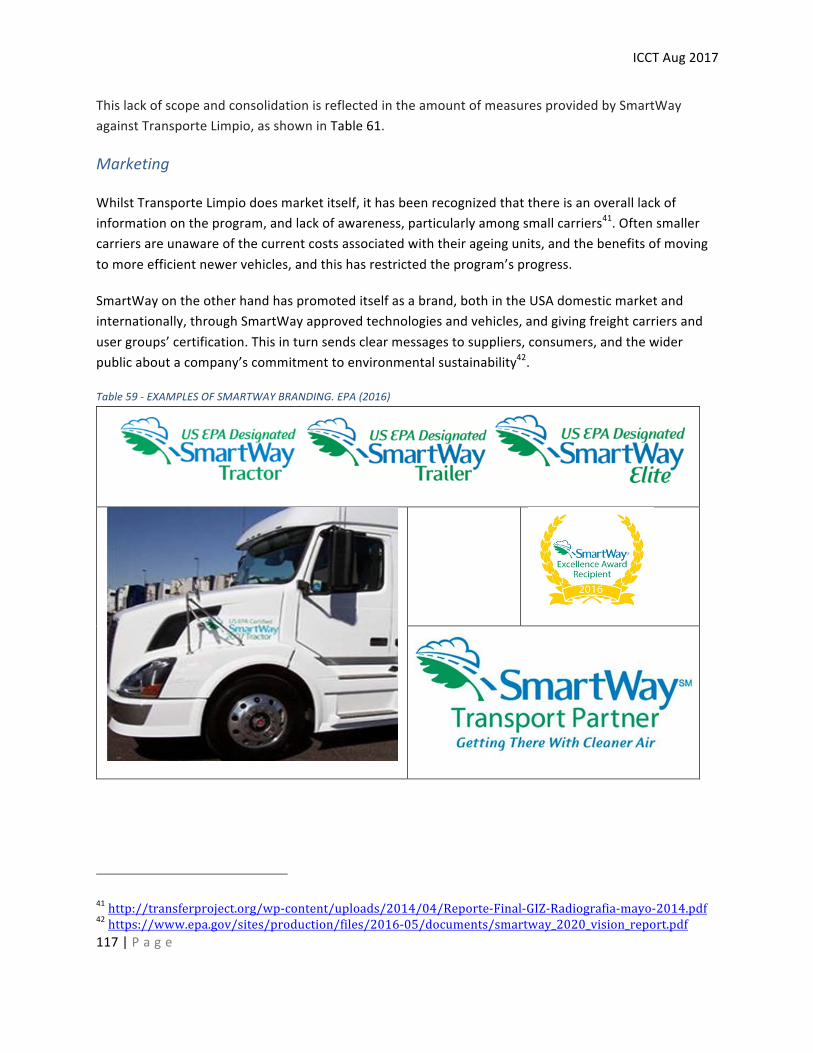
ICCTAug2017
117|P a g e
ThislackofscopeandconsolidationisreflectedintheamountofmeasuresprovidedbySmartWayagainstTransporteLimpio,asshowninTable61.
Marketing
WhilstTransporteLimpiodoesmarketitself,ithasbeenrecognizedthatthereisanoveralllackofinformationontheprogram,andlackofawareness,particularlyamongsmallcarriers41.Oftensmallercarriersareunawareofthecurrentcostsassociatedwiththeirageingunits,andthebenefitsofmovingtomoreefficientnewervehicles,andthishasrestrictedtheprogram’sprogress.
SmartWayontheotherhandhaspromoteditselfasabrand,bothintheUSAdomesticmarketandinternationally,throughSmartWayapprovedtechnologiesandvehicles,andgivingfreightcarriersandusergroups’certification.Thisinturnsendsclearmessagestosuppliers,consumers,andthewiderpublicaboutacompany’scommitmenttoenvironmentalsustainability42.
Table59-EXAMPLESOFSMARTWAYBRANDING.EPA(2016)
41http://transferproject.org/wp-content/uploads/2014/04/Reporte-Final-GIZ-Radiografia-mayo-2014.pdf42https://www.epa.gov/sites/production/files/2016-05/documents/smartway_2020_vision_report.pdf
ICCTAug2017
118|P a g e
Financing
TransporteLimpio(andtheFederalFleetModernisationandScrappageschemes)alsocomparespoorlytoSmartWayintermsoffinancing.Overall,theschemereceiveslownationalfunding43,whichcouldexplainitsoveralllackofmeasuresandscope,andabilitytomarketitself.Additionally,therearealackoffinancialinroadsforcarriers,andthosewhicharepresentarenotreadilyaccessibletosmallercarriersduetorestrictionssuchasproofofeconomicsolvency.Furtherasidentifiedby44.interestratesonunpaidbalancesinMexicofluctuatearound20percent,whereasintheUSAtheyareonaveragearound3percent,whichagainpresentsabarrier.
RegulatoryIssues
ThelastandpossiblythemostcriticalchallengeforTransporteLimpioisregulatory.SomesourceshaveacknowledgedthatprogramssuchasTransporteLimpiowerenotapriorityontheMexicangovernment’senvironmentalagenda,potentiallycontributingtoalackoffundingandmarketing45.Further,laxemissionscontrolandtesting46hasallowedcarrierstocontinueusingvehicleswhicharemorepollutingandlessfuelefficient,andthusreinforcesaperceptionthattheirvehiclesaresuitable47.
Technologyevaluation
Speakingontheexperienceswithnewequipmenttoreduceenergyconsumption,SEMARNATdisclosed“Wedonotreallyevaluatethetechnologies.ThetechnologiesthatwepromotearethosethatcomefromtheUnitedStates,butwedonotreallyevaluatewhatpotentialorbenefitstheycanhavehereinMexico”..SincecurrentlytherearenotstandardsfromtestbeingdonebyprogramssuchasTransporteLimpio,fleetshavebeenrunningtesttofigureoutwhatcombinationoftechnologiescangivethemostcost-savingwhenoperatinginMexicanhighwaysandconditions.Energy-reducingtechnologiesalreadyexistintheMexicanfreightsector,however,theuseofthetechnologyisnotstandardized,andtheresultsfromfleettestingthetechnologiesisnotwidelyspreadwithinthesector.Accordingtooneoftheinterviewees“Ofallthetestswehavehad,onlyautomatictireinflationsystemsistheonethathasgivenusthereturnofinvestmentinashorttime”,whichisausefulandspecificpieceofinformationthatwouldnotbeavailabletoothertransportenterprisesthroughgovernmentprogramssuchasTransporteLimpiosincetheyonlyinformationtheprogramreceivesfromfleetsisongeneralfuelconsumption,furtherhighlightingtheneedformoremonitoring,moretechnologytesting,andincreasedatasharing.
43CTSEMBARQ.(2009b).FinalreportMEDEC.TransportSector.WorldBank.44http://ccap.org/assets/Schmid-Freight-Transport-NAMAs-in-COL-and-MEX.pdf45http://mexico.itdp.org/wp-content/uploads/Oportunidades-Crecimiento-Verde-Mexico-ed.-transporte1.pdf46CTSEMBARQ.(2009b).FinalreportMEDEC.TransportSector.WorldBank.47http://transferproject.org/wp-content/uploads/2014/04/Reporte-Final-GIZ-Radiografia-mayo-2014.pdf
ICCTAug2017
119|P a g e
Technologyadoption
TheuseofnewtechnologiesrepresentsamajorchallengeforthefreightsectorinMexico.Extraequipmentontrucksrepresentnotonlyextrainvestmentoneachtruck,butalsoextrarisk.Transportcompaniesfindthemselvestakingintoconsiderationmultiplefactorswhenconsideringinvestingonextraequipment.Onesuchfactoriswhattheyrefertoas“steal-ability”:theriskandpotentialcostofhavingtheequipmentorthetruckstolen.
Areasforfuturedevelopment
Mostfleetsinterviewedagreedthatthefirststeptowardsmakingtheprogrammorerobustandwithbettercoverageisincreasingthequalityandquantityofmonitoringanddatacollection.Currently,TransporteLimpioevaluatesparticipatingfleetsbasedonthedatathateachwishestoshare.Itgivesrecognitiontothosewhocomplywithcertainspecifications.Thepresentgoalistorewardcompaniesforgoodsustainableenvironmentalpractice,arguingthatsociallyresponsiblecompanieswillbemoreappealingtocustomers.However,theprogramisinneedofstrengthening.Intervieweesagreethatthecompensationsshouldbegreaterand,asAlexTheissenLongofFEMSAputit,“itisnolongerenoughforcompaniestojustsignup”.Thereshouldbeincreasedeffortsfrom,both,theprogram(SEMARNAT)andtheparticipantstoimprovefreightconditions.AspointedoutbyRafaelTapiaVelázquezofBIMBO,thepotentialbenefitsofarobustTransporteLimpioprogramarepalpable.Arobustprogramwouldreducetheamountoffuelrequiredperunitofgoodstransportedandtherebyreducetheneedtoimportfuel,andimproveairquality.
Thereareanumberofareasthatofferconsiderablepotential:
1. LeverageofthefutureemissionsstandardNOM-044o Couldbeusedasanincentiveforcarrierstorenewtheirvehicles.o Couldbeleveragedtobetterregulateolderfreightvehicles.
2. IncreasemarketingofTransporteLimpio
o Increasefreightsectorawarenessofthescheme–particularlyamongstowner-operatorsandsmallercarriers(under30vehicles)
o Increaseawarenessofthebenefitsofthescheme,throughmaterialssuchascarbonandfuelsavingscalculators,whichcanbemadeavailabletosuppliers.
o Increasepartnerrecognition–similartotheSmartWayapprovalsystem.o Increasebrandpromotiontoincreasepublicandmarketawareness.
3. Improvedatacollectionandrecovery
o FurtherdeveloptheFLEETmodelforMexicanapplication.o Increasedatarecoveryfromtechnologies–whichmayencourageinvestment.
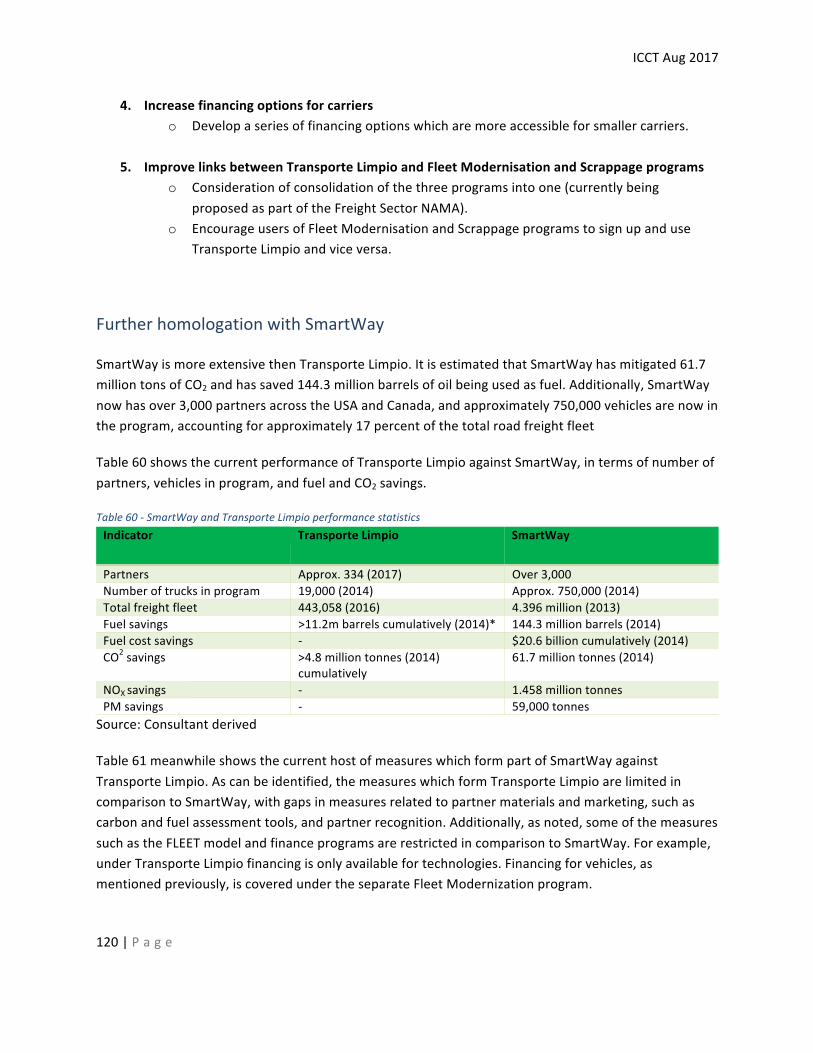
ICCTAug2017
120|P a g e
4. Increasefinancingoptionsforcarrierso Developaseriesoffinancingoptionswhicharemoreaccessibleforsmallercarriers.
5. ImprovelinksbetweenTransporteLimpioandFleetModernisationandScrappageprograms
o Considerationofconsolidationofthethreeprogramsintoone(currentlybeingproposedaspartoftheFreightSectorNAMA).
o EncourageusersofFleetModernisationandScrappageprogramstosignupanduseTransporteLimpioandviceversa.
FurtherhomologationwithSmartWay
SmartWayismoreextensivethenTransporteLimpio.ItisestimatedthatSmartWayhasmitigated61.7milliontonsofCO2andhassaved144.3millionbarrelsofoilbeingusedasfuel.Additionally,SmartWaynowhasover3,000partnersacrosstheUSAandCanada,andapproximately750,000vehiclesarenowintheprogram,accountingforapproximately17percentofthetotalroadfreightfleet
Table60showsthecurrentperformanceofTransporteLimpioagainstSmartWay,intermsofnumberofpartners,vehiclesinprogram,andfuelandCO2savings.
Table60-SmartWayandTransporteLimpioperformancestatisticsIndicator TransporteLimpio SmartWay
Partners Approx.334(2017) Over3,000Numberoftrucksinprogram 19,000(2014) Approx.750,000(2014)Totalfreightfleet 443,058(2016) 4.396million(2013)Fuelsavings >11.2mbarrelscumulatively(2014)* 144.3millionbarrels(2014)Fuelcostsavings - $20.6billioncumulatively(2014)CO2savings >4.8milliontonnes(2014)
cumulatively61.7milliontonnes(2014)
NOXsavings - 1.458milliontonnesPMsavings - 59,000tonnesSource:Consultantderived
Table61meanwhileshowsthecurrenthostofmeasureswhichformpartofSmartWayagainstTransporteLimpio.Ascanbeidentified,themeasureswhichformTransporteLimpioarelimitedincomparisontoSmartWay,withgapsinmeasuresrelatedtopartnermaterialsandmarketing,suchascarbonandfuelassessmenttools,andpartnerrecognition.Additionally,asnoted,someofthemeasuressuchastheFLEETmodelandfinanceprogramsarerestrictedincomparisontoSmartWay.Forexample,underTransporteLimpiofinancingisonlyavailablefortechnologies.Financingforvehicles,asmentionedpreviously,iscoveredundertheseparateFleetModernizationprogram.
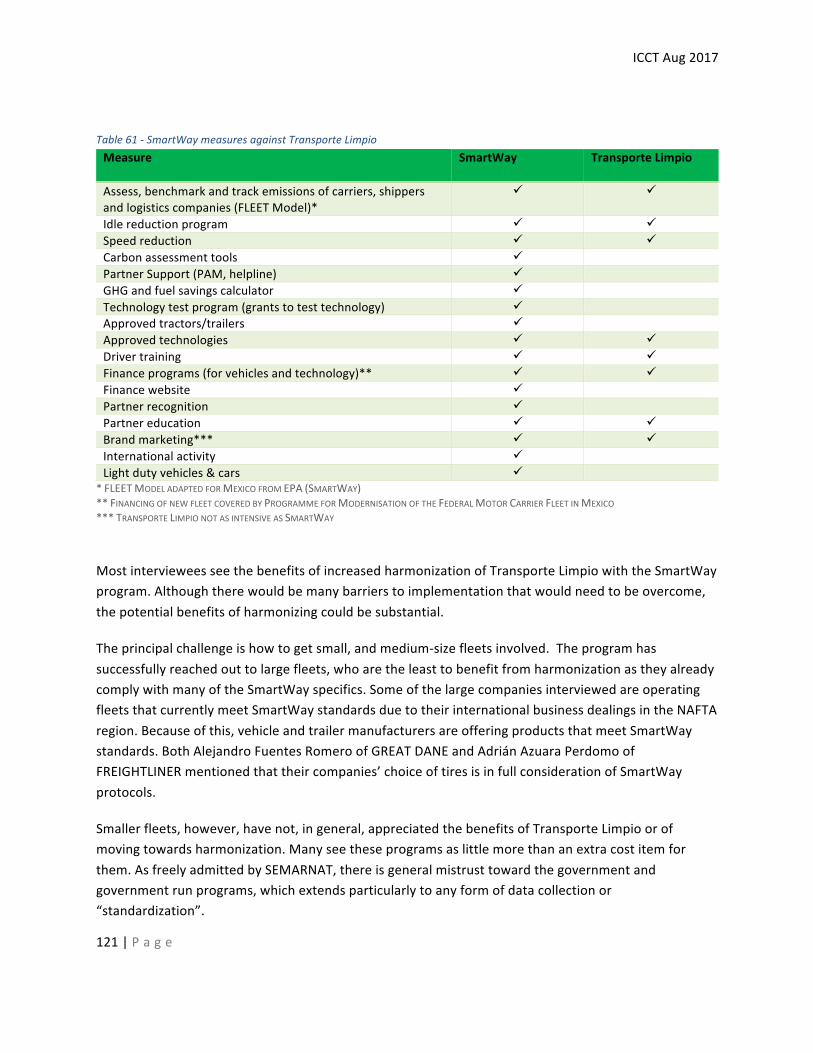
ICCTAug2017
121|P a g e
Table61-SmartWaymeasuresagainstTransporteLimpioMeasure SmartWay TransporteLimpio
Assess,benchmarkandtrackemissionsofcarriers,shippersandlogisticscompanies(FLEETModel)*
ü ü
Idlereductionprogram ü üSpeedreduction ü üCarbonassessmenttools ü PartnerSupport(PAM,helpline) ü GHGandfuelsavingscalculator ü Technologytestprogram(grantstotesttechnology) ü Approvedtractors/trailers ü Approvedtechnologies ü üDrivertraining ü üFinanceprograms(forvehiclesandtechnology)** ü üFinancewebsite ü Partnerrecognition ü Partnereducation ü üBrandmarketing*** ü üInternationalactivity ü Lightdutyvehicles&cars ü
*FLEETMODELADAPTEDFORMEXICOFROMEPA(SMARTWAY)**FINANCINGOFNEWFLEETCOVEREDBYPROGRAMMEFORMODERNISATIONOFTHEFEDERALMOTORCARRIERFLEETINMEXICO***TRANSPORTELIMPIONOTASINTENSIVEASSMARTWAY
MostintervieweesseethebenefitsofincreasedharmonizationofTransporteLimpiowiththeSmartWayprogram.Althoughtherewouldbemanybarrierstoimplementationthatwouldneedtobeovercome,thepotentialbenefitsofharmonizingcouldbesubstantial.
Theprincipalchallengeishowtogetsmall,andmedium-sizefleetsinvolved.Theprogramhassuccessfullyreachedouttolargefleets,whoaretheleasttobenefitfromharmonizationastheyalreadycomplywithmanyoftheSmartWayspecifics.SomeofthelargecompaniesinterviewedareoperatingfleetsthatcurrentlymeetSmartWaystandardsduetotheirinternationalbusinessdealingsintheNAFTAregion.Becauseofthis,vehicleandtrailermanufacturersareofferingproductsthatmeetSmartWaystandards.BothAlejandroFuentesRomeroofGREATDANEandAdriánAzuaraPerdomoofFREIGHTLINERmentionedthattheircompanies’choiceoftiresisinfullconsiderationofSmartWayprotocols.
Smallerfleets,however,havenot,ingeneral,appreciatedthebenefitsofTransporteLimpioorofmovingtowardsharmonization.Manyseetheseprogramsaslittlemorethananextracostitemforthem.AsfreelyadmittedbySEMARNAT,thereisgeneralmistrusttowardthegovernmentandgovernmentrunprograms,whichextendsparticularlytoanyformofdatacollectionor“standardization”.
ICCTAug2017
122|P a g e
HarmonizationcouldprovidethemethodstomeasurethedataandthestandardizationthatthefreightsectorinMexicosodirelyrequires.Inordertoaddresstheissueofmistrusttowardsgovernmentalentities,FranciscoJ.BarreraMartínezoftheMinistryofEnvironmentfortheStateofMexicoproposedtheestablishmentofanindependentresearchorganizationwithlittleornogovernmentalties.Thisorganizationorgroupwouldbetaskedwiththemanagement,upkeepandoverseeingofthetransportsectorinaccordancetostandardizedpracticesandmethodologies.ThegroupwouldserveasthefocalpointofdatagatheringfortheimplementationoftheTransporteLimpioprogramsaswellasgeneraltransportsectorresearch.Currentlytherearenoplansforcreatingsuchgrouporclarityonhowtofundit.
HowfarcanTransporteLimpiogointhenext10years
SEMARANTexpressedtheirobjectiveofincreasingtheamountofcompaniesinvolvedintheprogramby15percentbutthisislimitedbythesparsefundingandpersonneldedicatedtotheprogram.Thelargetransportcompaniesintervieweddonotbelievethegoaltobeambitiousenough.OtherprogramswithintheNAFTAregion,suchasSmartWay,haveup-to-datetoolsandsetstandardsandmethodologieswhichtheycanapplyacrosstheU.S.Apercentageincreaseinprogramparticipationwillnotbesufficientinitsmitigationactions.Basedonglobalfreighttrends,andaccordingtotheinterviewees,inthenextdecadetheTransporteLimpioprogramshould,attheveryleast,aimtoestablishfueleconomystandards,amodelyearcap,andcriterionforcompaniestostarttoenactafleetrenewalsystem.Anoverallgoalfortheincomingyearsmustbetocalculateanddisperseknowledgeontherealcostsofparticipatingornotintheprogram,simplifyingandimprovingdatacollection.
Leveragethetri-lateralSmartWayautomotivesectorpilot.
Apilotprojectisplannedforthenear-termandwillbeadministeredbytheAutomotiveIndustryActionGroup.TheprimaryobjectiveistofocusonautomotivecompanieswithoperationsacrossCanada,theUSA,andMexicoanddevelopaframeworkformoreharmonizedusedofSmartWaytoolsandprocesses.
Wecouldfindnoevidenceofhighwaytractorsbeingconsideredorinvolvedinthisprogram.
ProgramfortheModernizationoftheFederalMotorCarrierFleet
TheProgramfortheModernizationoftheFederalMotorCarrierFleethasbeendevelopedandpromotedbytheSCTandtheMexicandevelopmentbankNAFIN(NacionalFinanciera).Theprogram
ICCTAug2017
123|P a g e
providesfundingandtaxincentivesfortheacquisitionofnewornearlynew(upto6yearsold)truckstoimprovethefleetefficiencyandreduceitsemissions.Toincreasethedistributionofcreditandthusencouragetherenewalofmoreunits,FederalGovernmentprovidessupporttofinancialintermediaries.Asof2012,approximately48,019loweremissionvehicleshavebeenfinancedunderthescheme48
Challengesandbarriers
ThebiggestchallengeassociatedwiththeFleetModernizationProgramistheinabilityforsmallcarriersandowner-operatorstomeetcreditrequirements.Thisismainlyduetoseasonalcashflows,thedifficultytokeepoperation’srecordsandtoshowevidenceoneconomicsolvency49.
Taxcredits,whilstusefultothelargerfleetsandprivatecompaniesarenotmuchofanincentivetothoseowner-operatorswhoparticipateintheinformalsectoroftheeconomy,orarebarelymakingaprofit.
Allintervieweesagreedthattheincentiveshavetobeincreased,possiblylinkedtocarbonbonds.FEMSAproposedthatitwouldbebettertosplitthepayment:halftotheonewhoissellingthepre-ownedtruck,andtheotherhalftotheOwner-operator.Thiscouldincentivizethefleetwhosoldthepre-ownedtruck,andboughtanewone,andalsotheOwner-operatorwhoboughtthepre-ownedtruckanddeliveredthescrap.
Manyalsocommentedontheneedforalawtolimittheageofheavydutytruckswithfederalplates,similartowhathasbeenimplementedforalongtimeoncoaches50.Theapplicationofthelawcouldbegradual:Forexample,thatsays,"Withinayearalltrucksover20yearsinMexicowillnolongerbeabletocirculate.Intwoyears’time,themaximumagecouldbereducedto19years,andsoon”.Thiswouldhelpfueleconomy,emissions,safetyandslowlymovetheowner-operatorsandsmallerfeederlinesintotheformalsector.
Mostintervieweescommentedthatgovernmentprogramsthatgivecredittorenovateunitsorbuymoreunitsandexpandthefleetusuallycomewithdisadvantageousconditionsandhighinterestrates.TheycommentedthatPACCARorKENWOTHforexamplegiveamuchbetterdeal,withmorefacilitiesandaprocessthatisnotsocumbersome.Fleetsrarelychoosetoparticipateingovernmentplansiftheyhaveotheroptionsbecauseoftheassociatedbarriersandcosts.
48http://mexico.itdp.org/wp-content/uploads/Altas-emisiones-Baja-eficiencia.pdf49http://transferproject.org/wp-content/uploads/2015/12/GIZ-TRANSfer-Documento-NAMA-Autotransporte-Federal-Carga.pdf50Coacheshaveamaximumagelimitof10or15yearsaccordingtothetypeofservicetheyprovideSee:http://dof.gob.mx/nota_detalle.php?codigo=5387322&fecha=31/03/2015
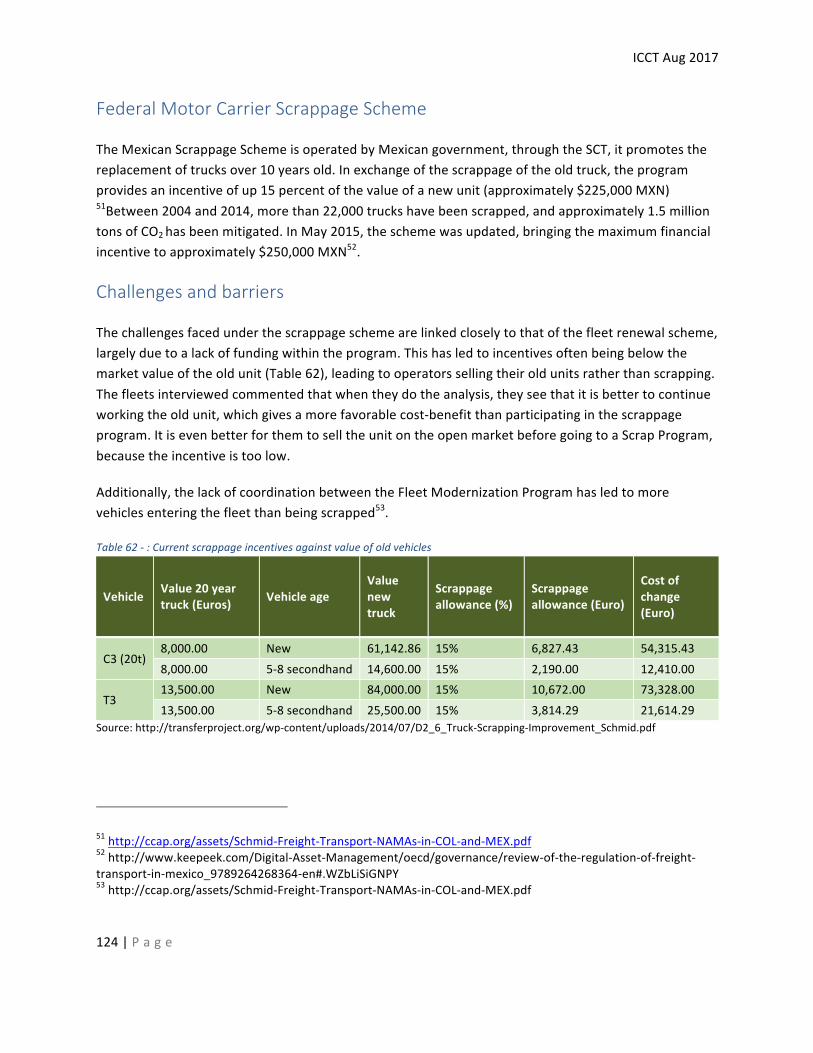
ICCTAug2017
124|P a g e
FederalMotorCarrierScrappageScheme
TheMexicanScrappageSchemeisoperatedbyMexicangovernment,throughtheSCT,itpromotesthereplacementoftrucksover10yearsold.Inexchangeofthescrappageoftheoldtruck,theprogramprovidesanincentiveofup15percentofthevalueofanewunit(approximately$225,000MXN)51Between2004and2014,morethan22,000truckshavebeenscrapped,andapproximately1.5milliontonsofCO2hasbeenmitigated.InMay2015,theschemewasupdated,bringingthemaximumfinancialincentivetoapproximately$250,000MXN52.
Challengesandbarriers
Thechallengesfacedunderthescrappageschemearelinkedcloselytothatofthefleetrenewalscheme,largelyduetoalackoffundingwithintheprogram.Thishasledtoincentivesoftenbeingbelowthemarketvalueoftheoldunit(Table62),leadingtooperatorssellingtheiroldunitsratherthanscrapping.Thefleetsinterviewedcommentedthatwhentheydotheanalysis,theyseethatitisbettertocontinueworkingtheoldunit,whichgivesamorefavorablecost-benefitthanparticipatinginthescrappageprogram.ItisevenbetterforthemtoselltheunitontheopenmarketbeforegoingtoaScrapProgram,becausetheincentiveistoolow.
Additionally,thelackofcoordinationbetweentheFleetModernizationProgramhasledtomorevehiclesenteringthefleetthanbeingscrapped53.
Table62-:Currentscrappageincentivesagainstvalueofoldvehicles
Vehicle Value20yeartruck(Euros) Vehicleage
Valuenewtruck
Scrappageallowance(%)
Scrappageallowance(Euro)
Costofchange(Euro)
C3(20t)8,000.00 New 61,142.86 15% 6,827.43 54,315.438,000.00 5-8secondhand 14,600.00 15% 2,190.00 12,410.00
T313,500.00 New 84,000.00 15% 10,672.00 73,328.0013,500.00 5-8secondhand 25,500.00 15% 3,814.29 21,614.29
Source:http://transferproject.org/wp-content/uploads/2014/07/D2_6_Truck-Scrapping-Improvement_Schmid.pdf
51http://ccap.org/assets/Schmid-Freight-Transport-NAMAs-in-COL-and-MEX.pdf52http://www.keepeek.com/Digital-Asset-Management/oecd/governance/review-of-the-regulation-of-freight-transport-in-mexico_9789264268364-en#.WZbLiSiGNPY53http://ccap.org/assets/Schmid-Freight-Transport-NAMAs-in-COL-and-MEX.pdf
ICCTAug2017
125|P a g e
Futurepoliciesandprograms
MexicanOfficialStandardNOM-044
TheMexicanStandardNOM-044-SEMARNAT-2006whichdefinesmaximumpollutantemissionsfromheavydutyenginesandvehiclesisunderrevision.ThenewversionofNOM-044isexpectedtoenterineffectonJanuary,1,2019afterseveralyearsofdelays,whichwereprimarilyduetothelackofavailabilityofultra-lowsulfurdieselfuelnationwide.
TheupdatetoNOM-044statesthatfrom1January2019,limitsequivalenttoEUROVI/EPA2010mustbemet.However,EUROIV/EPA2004vehicleswillstillbeallowedtobemarketedforsixmonthsafterthatdateandvehiclesthatcomplywithlimitsequivalenttoEUROVmaybemarketedfortwoyears(until1January2021)54.
WhilstNOM-044doesnotdirectlytargetGHGemissions,itwillreduceclimateimpactsintwoways.First,themoremodernizedEUROVIandEPA2010enginesaremoreefficientthanEuroIVandUS2004engines,whichareusingtechnologiesthatareroughly15yearsold.Moreover,theupdatedNOM044standardwillrequiretheuseofdieselparticulatefilers(DPFs),whichisawell-establishedaftertreatmentsystemthatgenerallyreduceparticulatematter(PM)emissionsby95percentormore.Blackcarbonisapotentshort-livedclimateforcerandisakeyconstituentofPMemissions.Thus,inadditiontothesignificanthealthbenefitsprovidedbythereducedPMemissions,DPFsalsoresultinasubstantialdecreaseofblackcarbonemissionsandtheassociatedclimatewarmingimpacts.
InadditiontotheseNOM044developments,Mexicoalsointendstodevelopanenergyefficiencystandardforheavydutyvehiclestoimprovefuelefficiency49.ThisstandardislikelytobebasedontheUSregulation,whichiscurrentlyinfluxduetolegalchallengesfromindustry.TheEPA’sintentiontodefinefuelefficiencystandardsforthetractor-trailercombinationhasreceivedheavynegativelobbyingfromtheindustrymainlybecausethetractorandtrailerunitsareproducedbydifferentmanufacturerswhichmakescombinedcertificationmorecomplicated.Inaddition,thecurrentpoliticalframeworkislikelytoleadtoadelayinimplementation.
54The2006publicationoftheNOMallowedSEMARNAT,inJanuary2017,toevaluatethenationalavailabilityofultralow-sulfurdieselinordertodetermineiftheconditionsexistforcompliancewiththeBstandards.Thisevaluationwasdeemedinsufficientandthestandardwasdelayedby12months.Similarly,aprovisionwasenactedtoallowmanufacturerstosellexistinginventoriesofvehiclesthatwereproducedduringtheapplicationofstandardAforuptosixmonthsaftertheimplementationofstandardB.Theintentwastoprovideareasonableperiodoftransitionwhileprotectingagainststockpilingofoldinventory.
ICCTAug2017
126|P a g e
FederalRoadFreightTransportNAMA(forowneroperatorsandsmallerfleetcarriers)
TheFederalRoadFreightTransportNAMA(Nationallyappropriatemitigationaction)isaprogramcurrentlybeingdevelopedundertheMexican-GermanNAMAProgram.ThemainaimoftheNAMAistoimprovetheenergyefficiencyoftheroadtransportsectorthroughmeasuressimilartothecurrentfederalsuiteofprograms,focusinglargelyonowneroperators(upto5vehicles)andsmallfleetcarriers(upto30vehicles).Theseinclude:
1. Ecodrivingcoursesandtraining-fordriversaspartofbi-annualSCTcourses–expectedCO2savingof2-3.5milliontons/year55.Thisprograminvolves:• Creationofanationalnetworkoftrainers/trainingcenters• Creationofanonlinetrainingplatform• Developmentofprogramevaluationandmonitoringfortraining• Developmentoftrainingmaterialsandtechnicalguidance• Greenlicense–certificationof‘professionalism’fordrivers,goodunitstatusand
consumptionofcleanerfuels49.2. Technologicalimprovements–suchasaerodynamicimprovementsandautotireinflation
systems–expectedCO2savingof0.3-1milliontons/year553. Modernisationofvehiclefleet–viascrappageandrenovationofroadtransportfleet–
expectedCO2savingof2milliontons/year(average)55
TheprogramisexpectedtocostUS$19.76milliontoimplement56,andwillcomplementthefutureMexicanemissionstandardNOM-044.UndertheNAMA,financingwouldalsobeavailableforfuelsavingstechnologiesandnewvehicles,withsomecreditguaranteesforsmallenterprises
55https://unfccc.int/files/cooperation_support/nama/application/pdf/mexico_nama_final.pdf56http://www.nama-database.org/index.php/Freight_transport_NAMA
ICCTAug2017
127|P a g e
Chapter9:-Fuelefficiencyandemissionsstandards
ThischaptercompilesinformationonfuelefficiencyandcritierapollutantemissionsstandardsinMexicoandintheUSA.
InMexicoNewVehiclesThecurrentapplicableemissionsstandardfornewhighwaytractorswithdieselenginesis:NOM-044-SEMARNAT-2006whichrequirescompliancewithEUROIV/EPA2004.TheUSHeavydutydieselvehicleemissionsstandardcomplianceforEPA2010isavailableinthismarketbutnotyetgenerallyadoptedandnotenforced.
Theupdatetotheheavy-dutydieselemissionsstandard,whichwillsoonbepublished,basicallystatesthatfrom1January2019,limitsequivalenttoEUROVI/EPA2010mustbemet.However,EUROIV/EPA2004vehicleswillstillbeallowedtobemarketedforsixmonthsafterthatdateandvehiclesthatcomplywithlimitsequivalenttoEUROVmaybemarketedfortwoyears(until1January2021).
TheproposedstandardsrequiretheinstallationandoperationoffullOn-BoardDiagnostic(OBD)systemsonallnewvehicles.
In-usevehiclesThecurrentemissionsstandardfortheverificationofin-usedieselvehiclesistheNOM-045-SEMARNAT-2006fornationalcoverageandNOM-EM-167-SEMARNAT-2016specificallyforvehiclescirculatinginMexicoCity,Hidalgo,StateofMexico,Morelos,PueblaandTlaxcala.Thesestandardslimitexhausrtopacitiy,whensubjectedtoafree-accelerationtestprocedure
FuelefficiencystanardThereiscurrentlynofuelefficiencystandardapplicabletohighwaytractorsinMexico
ChapterHighlights
ICCTAug2017
128|P a g e
EmissionstandardsfornewheavydutydieselvehiclesinMexico
Thecurrentapplicableemissionsstandardfornewhighwaytractorswithdieselenginesis:NOM-044-SEMARNAT-2006
Emissionsstandardsforbothlight-andheavy-dutyvehicleswerefirstestablishedin1988andbecameeffectiveinmodelyear1993(NOM-044-ECOL-1993).ThestandardNOM-044-SEMARNAT-2006wasadoptedin2006asanupdatetoNOM-044-SEMARNAT-1993,anditestablishesemissionlimitsfortotalhydrocarbons,non-methanehydrocarbons,carbonmonoxide,nitrogenoxides,particles,andopacityfornewheavy-dutydieselengines.NOM-044iscurrentlyunderrevision.ThenewversionofNOM-044isexpectedtoenterasfromJan,1,2019butmaysufferaone-yeardelay.
IntheUSATheUSimplementedstrictemissionsstandardsforHeavydutydieselvehiclesin2010(EUROVI/EPA2010)andhasfocusedonimprovingfueleconomyinthissegmentovermorerecentyears.
IntheU.S.,averagetractor-trailerfuelconsumptionratesfortheentirefleetareapproximately2.6km/L(6mpg)comparedto2.9km/LfoundinthesesurveysinMexico.Significantdifferencesinaveragevehiclespeed,vehicleloadingandaltitudecanaccountforthis.
ForthenewestU.S.models,fuelconsumptionistypicallybetween2.8and3.0km/L(6.5–7mpg).Afleet-wideanalysisdonefortheEuropeanCommissionestimatestractor-trailerfuelconsumptionatroughly3.2km/L,however,thereisnotsufficientinformationtosaydefinitelyiftheU.S.orEUhasmoreefficienttrucks.
TheU.S.setstandardsbeginningin2014modelyearwithmorestringentstandardsfollowingin2017modelyear.TheserepresentanoverallfuelconsumptionandCO2emissionsreductionupto23percentfromthetractorsandtheenginesinstalledinthemwhencomparedtoabaseline2010modelyeartractorandenginewithoutidleshutdowntechnology.Phase2standardswouldbeintroducedoveralongterm,startingin2021andculminatein2027.Thestandardsdifferbycabtypeandroofheightandareplannedtoachieveafurther24percentreductioninCO2emissionsandfuelconsumption.However,thepresentgovernmenthasmadepublicitsintentiontoreviewandrevisetheselimits.
ICCTAug2017
129|P a g e
DieselEngineStandards
1993-2014
Emissionstandardsfornewheavy-dutydieselenginesfirstbecameeffectiveinmodelyear1993andwerebasedonUS1991andlaterrequirements,includingtheUSEnvironmentalProtectionAgency(EPA)FTPtransienttestcycle.StandardsforMY1993-1998wereequivalenttoUSAstandardsandcompliancecouldbedemonstratedthroughcertificationbyUSEPA.UnderNOM-044,enginesinMexicoareprovidedcomplianceoptionsandcanmeetEuropeanstandards,asmeasuredontheofficialEuropeantestcycles(ETC57andESC58),asanalternativetotheEPA-basedstandards;compliancewithstandardscanbedemonstratedthrough:
• Letterorproofissuedbymotormanufacturer,includinginvoiceofthetestinglaboratory,• CertificateorproofissuedbytheEnvironmentalProtectionAuthorityofthecountryoforiginor
countryofcertification,or• CertificateissuedbyCertificationBodiesforthecountryoforiginorcountryofcertification.
In2006,thestandardNOM-044-SEMARNAT-2006wasadoptedasanupdatetoNOM-044-ECOL-1993.Itestablishesemissionlimitsfortotalhydrocarbons,non-methanehydrocarbons,carbonmonoxide,nitrogenoxides,particles,andopacityfornewheavy-dutydieselengines.ThestandardallowscompliancewitheitherUS2004orEuroIVequivalentstandards.Theemissionstandardscompliancetimelineandcurrentequivalentlimitvaluesofthe1993and2006standardsareoutlinedbelow.
MandatorycompliancewithEPA2004/EuroIVstandardsbeganinJuly2008,however,therelevantstandardwasmodifiedin2011bySEMARNATtoextendtheregulatorytimelineforcompliancewithEPA2004/EuroIVstandardstoJune2014.
57TheETCtestcycleisusedforemissioncertificationofheavy-dutydieselenginesinEuropestartingintheyear2000(Directive1999/96/ECofDecember13,1999).TheESCandETCcyclesreplacetheearlierR-49test.TheETCcyclewasdevelopedbasedonrealroadcyclemeasurementsofheavydutyvehicles58TheESCtestcyclewasintroduced,togetherwiththeETC(EuropeanTransientCycle)andtheELR(EuropeanLoadResponse)tests,foremissioncertificationofheavy-dutydieselenginesinEuropestartingfromtheyear2000(Directive1999/96/ECofDecember13,1999).TheESCisa13-mode,steady-stateprocedurethatreplacestheR-49test.
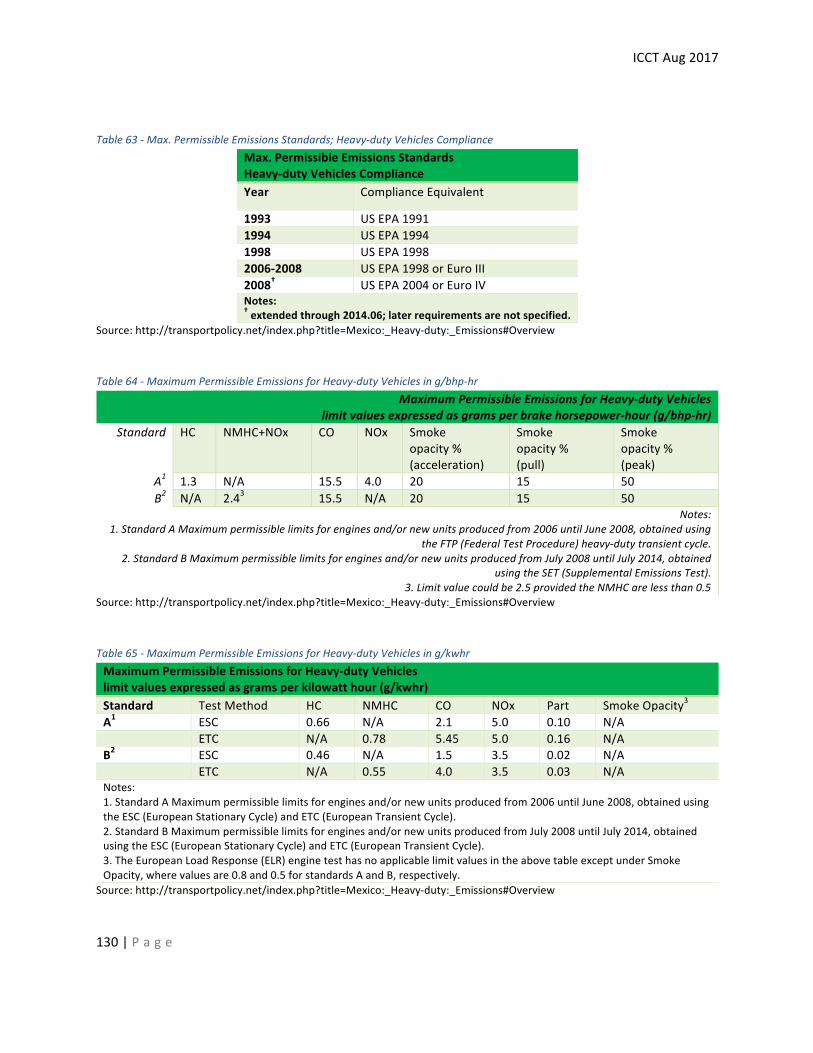
ICCTAug2017
130|P a g e
Table63-Max.PermissibleEmissionsStandards;Heavy-dutyVehiclesComplianceMax.PermissibleEmissionsStandardsHeavy-dutyVehiclesComplianceYear ComplianceEquivalent
1993 USEPA19911994 USEPA19941998 USEPA19982006-2008 USEPA1998orEuroIII2008† USEPA2004orEuroIVNotes:†extendedthrough2014.06;laterrequirementsarenotspecified.
Source:http://transportpolicy.net/index.php?title=Mexico:_Heavy-duty:_Emissions#Overview
Table64-MaximumPermissibleEmissionsforHeavy-dutyVehiclesing/bhp-hrMaximumPermissibleEmissionsforHeavy-dutyVehicles
limitvaluesexpressedasgramsperbrakehorsepower-hour(g/bhp-hr)Standard HC NMHC+NOx CO NOx Smoke
opacity%(acceleration)
Smokeopacity%(pull)
Smokeopacity%(peak)
A1 1.3 N/A 15.5 4.0 20 15 50B2 N/A 2.43 15.5 N/A 20 15 50
Notes:1.StandardAMaximumpermissiblelimitsforenginesand/ornewunitsproducedfrom2006untilJune2008,obtainedusing
theFTP(FederalTestProcedure)heavy-dutytransientcycle.2.StandardBMaximumpermissiblelimitsforenginesand/ornewunitsproducedfromJuly2008untilJuly2014,obtained
usingtheSET(SupplementalEmissionsTest).3.Limitvaluecouldbe2.5providedtheNMHCarelessthan0.5
Source:http://transportpolicy.net/index.php?title=Mexico:_Heavy-duty:_Emissions#Overview
Table65-MaximumPermissibleEmissionsforHeavy-dutyVehiclesing/kwhrMaximumPermissibleEmissionsforHeavy-dutyVehicleslimitvaluesexpressedasgramsperkilowatthour(g/kwhr)Standard TestMethod HC NMHC CO NOx Part SmokeOpacity3A1 ESC 0.66 N/A 2.1 5.0 0.10 N/A ETC N/A 0.78 5.45 5.0 0.16 N/AB2 ESC 0.46 N/A 1.5 3.5 0.02 N/A ETC N/A 0.55 4.0 3.5 0.03 N/ANotes:1.StandardAMaximumpermissiblelimitsforenginesand/ornewunitsproducedfrom2006untilJune2008,obtainedusingtheESC(EuropeanStationaryCycle)andETC(EuropeanTransientCycle).2.StandardBMaximumpermissiblelimitsforenginesand/ornewunitsproducedfromJuly2008untilJuly2014,obtainedusingtheESC(EuropeanStationaryCycle)andETC(EuropeanTransientCycle).3.TheEuropeanLoadResponse(ELR)enginetesthasnoapplicablelimitvaluesintheabovetableexceptunderSmokeOpacity,wherevaluesare0.8and0.5forstandardsAandB,respectively.
Source:http://transportpolicy.net/index.php?title=Mexico:_Heavy-duty:_Emissions#Overview
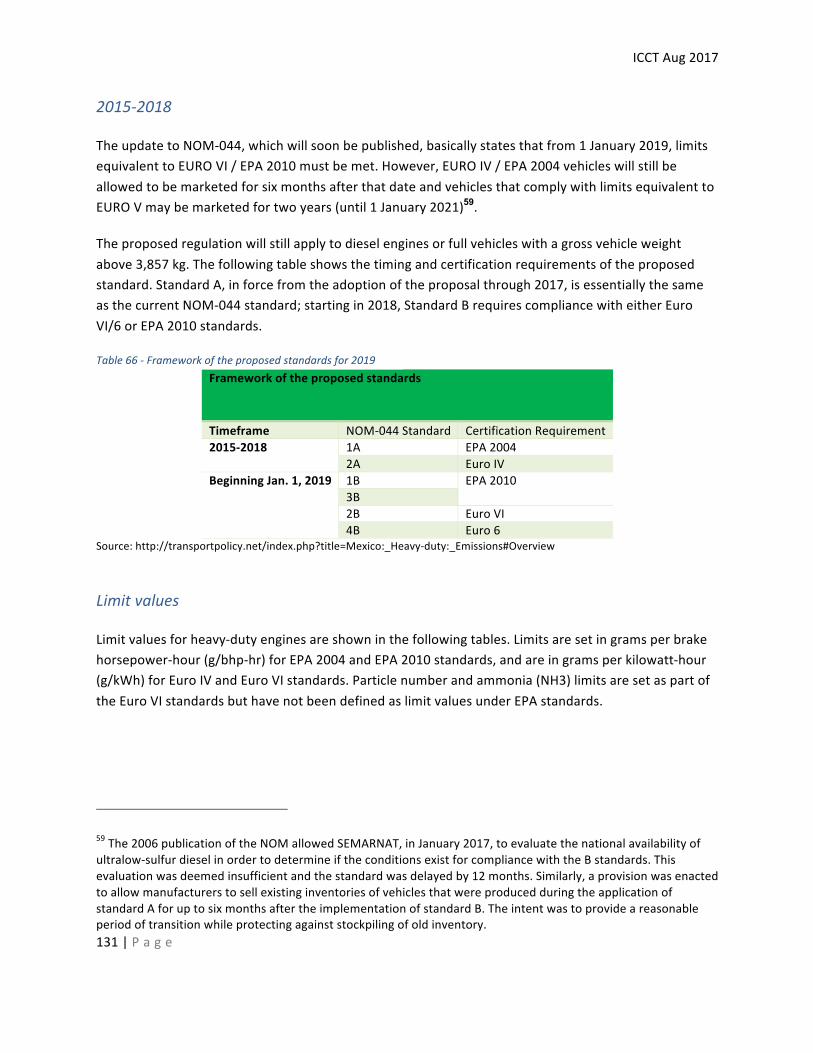
ICCTAug2017
131|P a g e
2015-2018
TheupdatetoNOM-044,whichwillsoonbepublished,basicallystatesthatfrom1January2019,limitsequivalenttoEUROVI/EPA2010mustbemet.However,EUROIV/EPA2004vehicleswillstillbeallowedtobemarketedforsixmonthsafterthatdateandvehiclesthatcomplywithlimitsequivalenttoEUROVmaybemarketedfortwoyears(until1January2021)59.
Theproposedregulationwillstillapplytodieselenginesorfullvehicleswithagrossvehicleweightabove3,857kg.Thefollowingtableshowsthetimingandcertificationrequirementsoftheproposedstandard.StandardA,inforcefromtheadoptionoftheproposalthrough2017,isessentiallythesameasthecurrentNOM-044standard;startingin2018,StandardBrequirescompliancewitheitherEuroVI/6orEPA2010standards.
Table66-Frameworkoftheproposedstandardsfor2019Frameworkoftheproposedstandards
Timeframe NOM-044Standard CertificationRequirement2015-2018 1A EPA2004
2A EuroIVBeginningJan.1,2019 1B EPA2010
3B2B EuroVI4B Euro6
Source:http://transportpolicy.net/index.php?title=Mexico:_Heavy-duty:_Emissions#Overview
Limitvalues
Limitvaluesforheavy-dutyenginesareshowninthefollowingtables.Limitsaresetingramsperbrakehorsepower-hour(g/bhp-hr)forEPA2004andEPA2010standards,andareingramsperkilowatt-hour(g/kWh)forEuroIVandEuroVIstandards.Particlenumberandammonia(NH3)limitsaresetaspartoftheEuroVIstandardsbuthavenotbeendefinedaslimitvaluesunderEPAstandards.
59The2006publicationoftheNOMallowedSEMARNAT,inJanuary2017,toevaluatethenationalavailabilityofultralow-sulfurdieselinordertodetermineiftheconditionsexistforcompliancewiththeBstandards.Thisevaluationwasdeemedinsufficientandthestandardwasdelayedby12months.Similarly,aprovisionwasenactedtoallowmanufacturerstosellexistinginventoriesofvehiclesthatwereproducedduringtheapplicationofstandardAforuptosixmonthsaftertheimplementationofstandardB.Theintentwastoprovideareasonableperiodoftransitionwhileprotectingagainststockpilingofoldinventory.
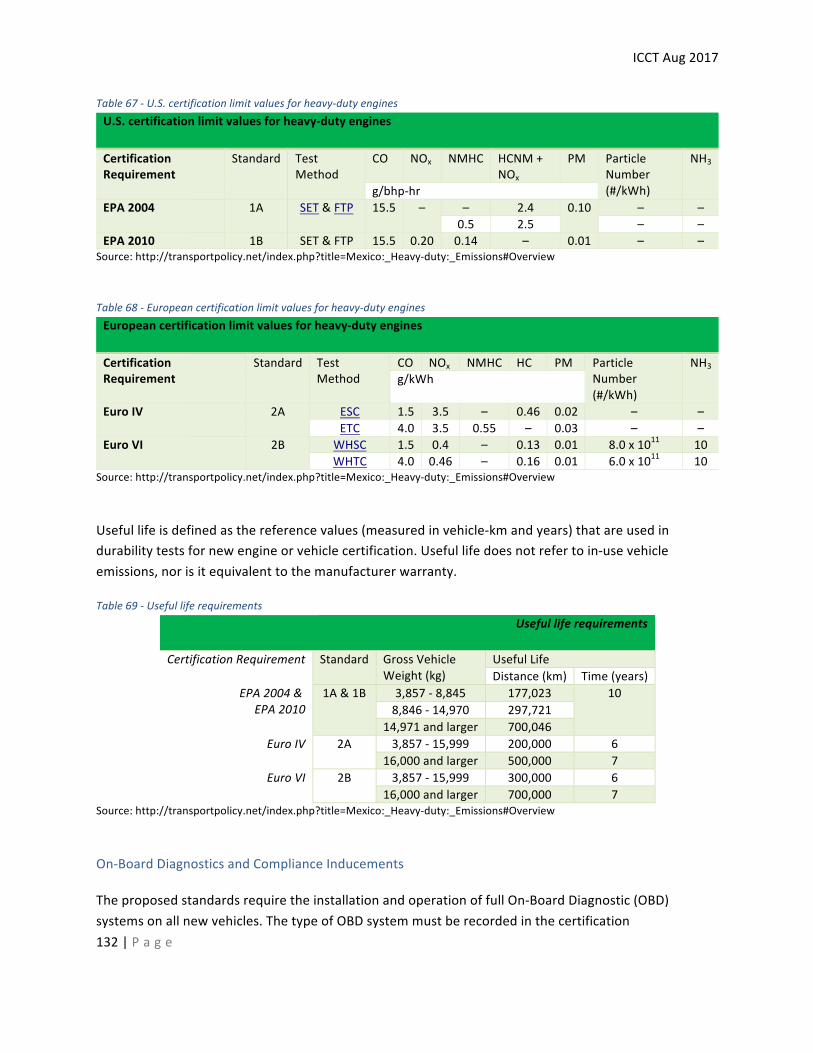
ICCTAug2017
132|P a g e
Table67-U.S.certificationlimitvaluesforheavy-dutyenginesU.S.certificationlimitvaluesforheavy-dutyengines
CertificationRequirement
Standard TestMethod
CO NOx NMHC HCNM+NOx
PM ParticleNumber(#/kWh)
NH3
g/bhp-hrEPA2004 1A SET&FTP 15.5 – – 2.4 0.10 – –
0.5 2.5 – –EPA2010 1B SET&FTP 15.5 0.20 0.14 – 0.01 – –
Source:http://transportpolicy.net/index.php?title=Mexico:_Heavy-duty:_Emissions#Overview
Table68-Europeancertificationlimitvaluesforheavy-dutyenginesEuropeancertificationlimitvaluesforheavy-dutyengines
CertificationRequirement
Standard TestMethod
CO NOx NMHC HC PM ParticleNumber(#/kWh)
NH3g/kWh
EuroIV 2A ESC 1.5 3.5 – 0.46 0.02 – –ETC 4.0 3.5 0.55 – 0.03 – –
EuroVI 2B WHSC 1.5 0.4 – 0.13 0.01 8.0x10¹¹ 10WHTC 4.0 0.46 – 0.16 0.01 6.0x10¹¹ 10
Source:http://transportpolicy.net/index.php?title=Mexico:_Heavy-duty:_Emissions#Overview
Usefullifeisdefinedasthereferencevalues(measuredinvehicle-kmandyears)thatareusedindurabilitytestsfornewengineorvehiclecertification.Usefullifedoesnotrefertoin-usevehicleemissions,norisitequivalenttothemanufacturerwarranty.
Table69-UsefulliferequirementsUsefulliferequirements
CertificationRequirement Standard GrossVehicleWeight(kg)
UsefulLifeDistance(km) Time(years)
EPA2004&EPA2010
1A&1B 3,857-8,845 177,023 108,846-14,970 297,721
14,971andlarger 700,046EuroIV 2A 3,857-15,999 200,000 6
16,000andlarger 500,000 7EuroVI 2B 3,857-15,999 300,000 6
16,000andlarger 700,000 7Source:http://transportpolicy.net/index.php?title=Mexico:_Heavy-duty:_Emissions#Overview
On-BoardDiagnosticsandComplianceInducements
TheproposedstandardsrequiretheinstallationandoperationoffullOn-BoardDiagnostic(OBD)systemsonallnewvehicles.ThetypeofOBDsystemmustberecordedinthecertification
ICCTAug2017
133|P a g e
documentation.AppendixBoftheproposalprovidesadetailedexplanationofthegeneralsystemrequirementsandattendantdocumentation.AsbothEPAandEurostandardsrequirethefullphase-inofOBDsystemsbefore2019,theproposalreliesoncertificationdocumentationastheprimaryproofofcompliancewithOBDrequirements.Similarly,theproposalrequiresthatnewvehiclesandenginesthatuseareagentforNOx-reducingSCRsystemsarealsoequippedwithoperatingalertsanddriverinducementstoensurethecorrectfunctioningofthesesystems.Thesefail-safesincludelights,auditoryalarmsandrequirementstosafelylimitvehicleoperationinthecaseofimproperuse,suchaspoor-qualitydieselexhaustfluid(DEF)orinsufficientDEFsupply.
EmissionstandardsforIn-useHeavyDutydieselvehiclesinMexico.
Thecurrentemissionsstandardfortheverificationofin-usedieselvehiclesistheNOM-045-SEMARNAT-2006fornationalcoverageandNOM-EM-167-SEMARNAT-2016specificallyforvehiclescirculatinginMexicoCity,Hidalgo,StateofMexico,Morelos,PueblaandTlaxcala.
NOM-EM-167-SEMARNAT-2016coversallin-usevehicleemissionstestinginthesestates.TheprincipalprogramsareoperatedbyMexicoCity(www.sedema.cdmx.gob.mx)andtheStateofMexico(sma.edomex.gob.mx),whodevelopedthisstandardinconjunctionwithSEMARNATtoprovideamorestringenttest,addthereviewofon-boarddiagnosisofvehiclesandtheiremissions,andestablishthecharacteristicsofremotesensingdevices.
NOM-045-SEMARNAT-2006wasantecededbyNOM-045-SEMARNAT-1996(publishedonApril22,1997)whichreplacedNOM-CCAT-008-ECOL/199360.Forallthesestandards,theapplicabletestforheavydutydieselvehiclesisastaticverificationofexhaustopacitylevelswiththeengineunderfreeacceleration.
60ThatwasrenamedtoNOM-045-ECOL-1993onNovember29,1994
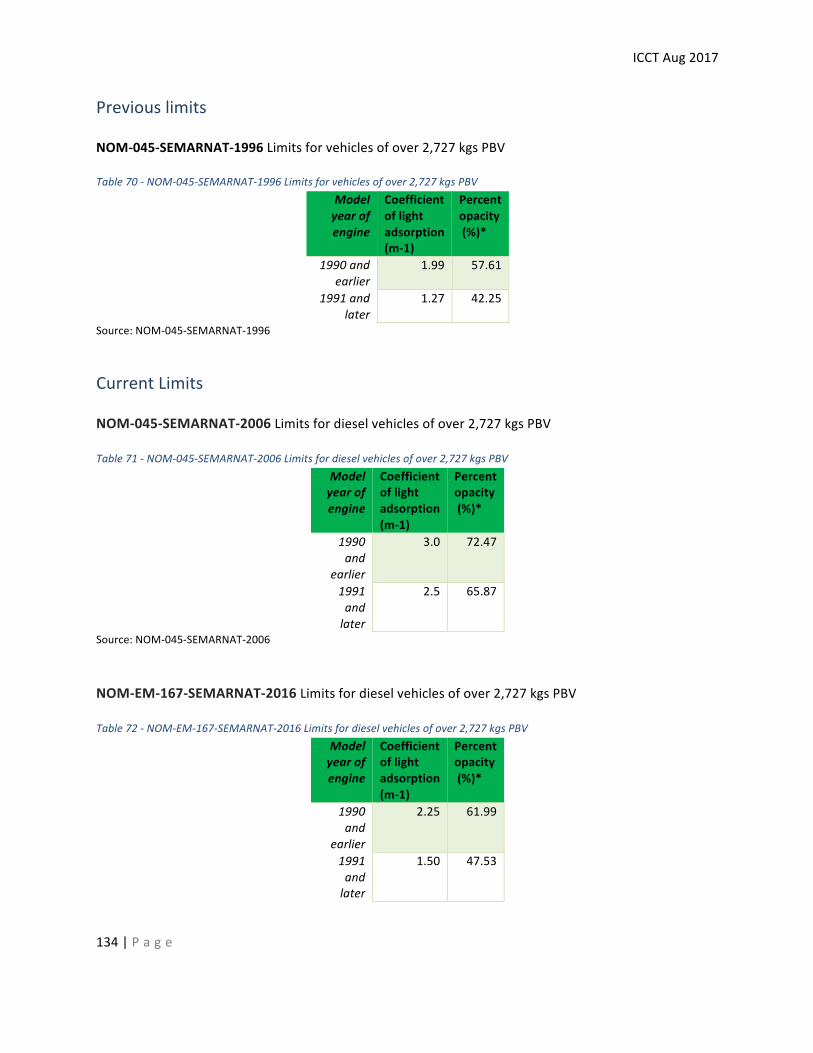
ICCTAug2017
134|P a g e
Previouslimits
NOM-045-SEMARNAT-1996Limitsforvehiclesofover2,727kgsPBV
Table70-NOM-045-SEMARNAT-1996Limitsforvehiclesofover2,727kgsPBVModelyearofengine
Coefficientoflightadsorption(m-1)
Percentopacity(%)*
1990andearlier
1.99 57.61
1991andlater
1.27 42.25
Source:NOM-045-SEMARNAT-1996
CurrentLimits
NOM-045-SEMARNAT-2006Limitsfordieselvehiclesofover2,727kgsPBV
Table71-NOM-045-SEMARNAT-2006Limitsfordieselvehiclesofover2,727kgsPBVModelyearofengine
Coefficientoflightadsorption(m-1)
Percentopacity(%)*
1990and
earlier
3.0 72.47
1991andlater
2.5 65.87
Source:NOM-045-SEMARNAT-2006
NOM-EM-167-SEMARNAT-2016Limitsfordieselvehiclesofover2,727kgsPBV
Table72-NOM-EM-167-SEMARNAT-2016Limitsfordieselvehiclesofover2,727kgsPBVModelyearofengine
Coefficientoflightadsorption(m-1)
Percentopacity(%)*
1990and
earlier
2.25 61.99
1991andlater
1.50 47.53
ICCTAug2017
135|P a g e
Source:NOM-EM-167-SEMARNAT-2016
Testprocedure
ThetestprocedureinalltheseversionsoftheNOMconsistsinaprocedurewherebywiththevehiclestationary,theengine,israpidlyacceleratedthreetimesfromitsidlespeedtoitsgovernedspeed.Themaximumopacitymeasuresduringthisaccelerationisaveragedoverthethreetestsandcomparedtotheapplicablelimit.
ThisOfficialMexicanStandardpartiallyagreeswiththeAmericanStandardSAE-J-1667.-Snap-accelerationsmoketestprocedureforheavy-dutydiesel-poweredvehiclesIssued1996-02.ItusestheInstantaneousAccelerationOpacityTestProcedureforDieselEngineHeavyVehicles,February1996.U.S.A.
TestFrequency
Vehiclesarerequiredtobetestedinanofficialtestcentereverysemester
TestFacilities
Almostallhighwaytractorsusefederal(SCT)licenseplates.ThesehavetobetestedeverysixmonthsinatestcenterauthorizedbySCTofwhichthereare250authorizedinthecountry61.
ForvehiclestocirculateinMexicoCity,Hidalgo,StateofMexico,Morelos,PueblaandTlaxcala,thetestmustbecarriedoutinanSCT-authorizedtestcenterthatcomplieswithNOM-EM-167-SEMARNAT-2016.155ofthe272SCT-licensedtestcentersmeetthisrequirement.MexicoCityhas7centersauthorizedtotesthighwaytractors
TestEffectiveness
Thefreeaccelerationopacitytesthasbeeninuseformanyyears.Itisalowcostandeasytesttoperformbutsuffersfromcertainlimitations:
• Thetestcycle(snapaccelerationfromidletoratedrpm)isnotonethatrepresentsnormaldrivingconditions.Thus,itsresultshavelittleornocorrelationwithcriticaldriveconditionswhenthevehicleislikelytoemitsmoke(suchasluggingupahill,fullyloaded.
• Theprincipalhealthdamageofdieselvehiclesiscausedbyfineparticleemissions(PM2.5).Thereislittleornocorrelationbetweentheseandopacity.
61plusanadditional22thatservetheneedsofspecificprivatecompanies/organizations
ICCTAug2017
136|P a g e
• Theopacitylevelmeasuredinthetestisdependentonhowfastthetesteracceleratestheengine.Thus,testerscanreducethereadingbyacceleratingslower,andthistestcycleisnotconducivetorepeatableimpartialresults.
• Manymodernelectronically-governedenginesdonotallowthiscycletoberun.Theenginemanagementcomputercanrestrictthisfreeaccelerationtestcycle.
Gasoline-enginelightdutyvehiclesoriginallyusedastaticemissionstest(BAR’90),butthiswaschangedtoadynamometer-baseddynamictest,toaddresssimilarissuesoftestrepeatability,transparencyandtorestricttheinfluencethatthetestoperatorcanexertonthetestresults.Thereisongoingdiscussionofmovingdieseltestingalsotoadynamometerbutthisisalongwayfromgettingwrittenintoanewversionofthestandard.
TestResults
SCTdoesnotpublishtestresultsorstatistics.MexicoCityandtheStateofMexicodopublishresultstoresearchersforanalysisbutlittleisavailableforhighwaytractors,andcurrentopacitytestingresultsdonotgiveanyusefulindicationofthevehicleson-roademissions.
FuelefficiencystandardsintheUSA
IntheU.S.,averagetractor-trailerfuelconsumptionratesfortheentirefleetareapproximately2.6km/L(6mpg)comparedto2.9km/LfoundinthesesurveysinMexico.Significantdifferencesinaveragevehiclespeed,vehicleloadingandaltitudecanaccountforthis.
ForthenewestU.S.models,fuelconsumptionistypicallybetween2.8and3.0km/L(6.5–7mpg).Afleet-wideanalysisdonefortheEuropeanCommissionestimatestractor-trailerfuelconsumptionatroughly3.2km/L,however,thereisnotsufficientinformationtosaydefinitelyiftheU.S.orEUhasmoreefficienttrucks.
TheNorthAmericanCouncilforFreightEfficiency(NACFE)summarizedtruckfleetfuelconsumptionbasedonitsdatasetincluding40,783tractorsand125,711trailersfromseven,generallyfor-hirecarriers,twoprivatefleetsandoneprimarilyleasingfleet.Thisstudyshowedaveragefuelconsumptionacrossalltenfleetswas2.8km/Lin2012and2.7km/Lin201062.
TheU.S.EnvironmentalProtectionAgency(EPA)andtheDepartmentofTransportation’sNationalHighwayTrafficSafetyAdministration(NHTSA)setstandardsbeginningin2014modelyearwithmorestringentstandardsfollowingin2017modelyear.Table73presentstheagencies’respectivestandardsforcombinationtractormanufacturersforthe2017modelyear.Thestandardsrepresentanoverallfuel
62Source:ICCT2015,Literaturereview:real-worldfuelconsumptionofheavy-dutyvehiclesintheUnitedStates,China,andtheEuropeanUnion,BenSharpeandRachelMuncrief
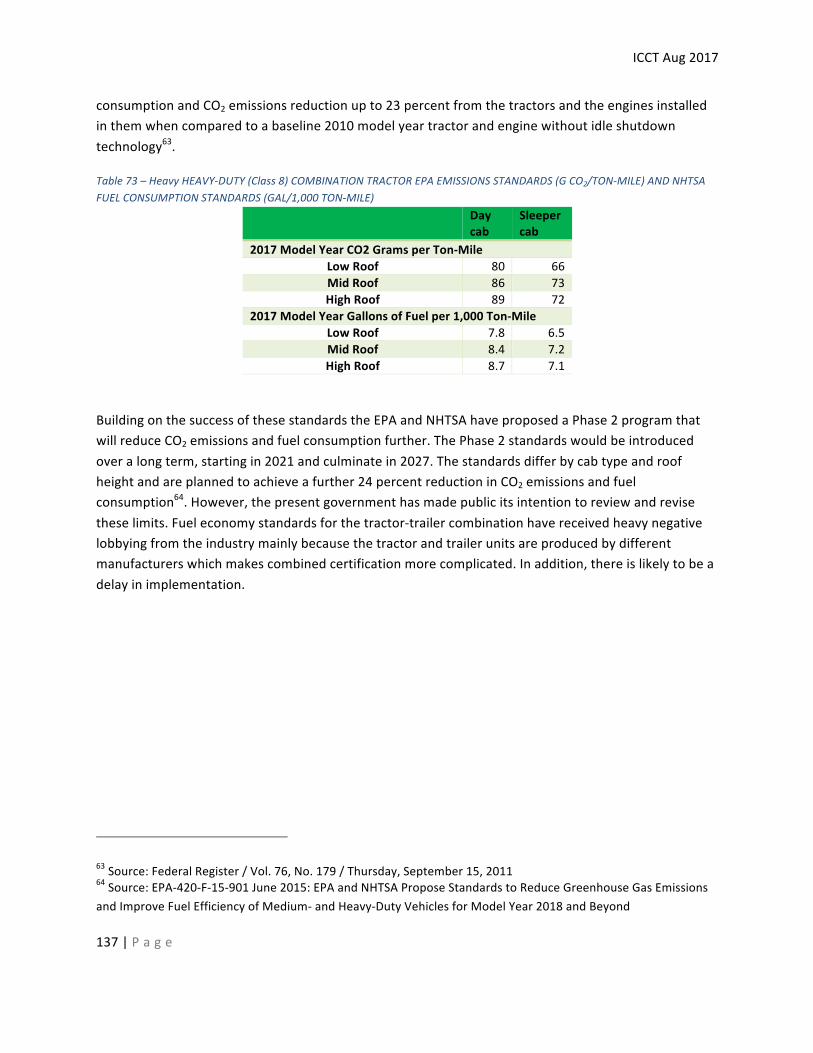
ICCTAug2017
137|P a g e
consumptionandCO2emissionsreductionupto23percentfromthetractorsandtheenginesinstalledinthemwhencomparedtoabaseline2010modelyeartractorandenginewithoutidleshutdowntechnology63.
Table73–HeavyHEAVY-DUTY(Class8)COMBINATIONTRACTOREPAEMISSIONSSTANDARDS(GCO2/TON-MILE)ANDNHTSAFUELCONSUMPTIONSTANDARDS(GAL/1,000TON-MILE)
Daycab
Sleepercab
2017ModelYearCO2GramsperTon-MileLowRoof 80 66MidRoof 86 73HighRoof 89 72
2017ModelYearGallonsofFuelper1,000Ton-MileLowRoof 7.8 6.5MidRoof 8.4 7.2HighRoof 8.7 7.1
BuildingonthesuccessofthesestandardstheEPAandNHTSAhaveproposedaPhase2programthatwillreduceCO2emissionsandfuelconsumptionfurther.ThePhase2standardswouldbeintroducedoveralongterm,startingin2021andculminatein2027.Thestandardsdifferbycabtypeandroofheightandareplannedtoachieveafurther24percentreductioninCO2emissionsandfuelconsumption64.However,thepresentgovernmenthasmadepublicitsintentiontoreviewandrevisetheselimits.Fueleconomystandardsforthetractor-trailercombinationhavereceivedheavynegativelobbyingfromtheindustrymainlybecausethetractorandtrailerunitsareproducedbydifferentmanufacturerswhichmakescombinedcertificationmorecomplicated.Inaddition,thereislikelytobeadelayinimplementation.
63Source:FederalRegister/Vol.76,No.179/Thursday,September15,201164Source:EPA-420-F-15-901June2015:EPAandNHTSAProposeStandardstoReduceGreenhouseGasEmissionsandImproveFuelEfficiencyofMedium-andHeavy-DutyVehiclesforModelYear2018andBeyond
ICCTAug2017
138|P a g e
ANNEX:
ApproachandMethodology
Thisprojectinvolvedthecollection,useandanalysisofdatafromthreetypesofsource:
a) Informationfrompubliclyavailablesourcesb) Marketdataandanalysesfrompreviousworkc) Newinterviewdata
a) Informationavailablefrompublicsources
Goodinformationisavailablefrompublicsourcesthatwillbeusedinthisanalysis.Examplesinclude:
Vehiclesales
The“AsociaciónMexicanadeDistribuidoresdeAutomotores”(AMDA),the“AsociaciónMexicanadeLaIndustriaAutomotriz”(AMIA),the“AsociaciónNacionaldeProductoresdeAutobuses,Camionesy
Tractocamiones.”(ANPACT)togetherwiththe“SecretaríadeComunicacionesyTransportes”(SCT)andthe“InstitutoMexicanodelTransporteprovidedataonnewclass8vehiclessales(includingtrailers),thebreakdownintermsofdomesticproductionversusimportsandaguidetovehiclecharacteristicsandtechnologybaseline.
OverallFreightSystem
TheNorthAmericanTransportationStatisticsDatabasemanagedinMexicobythe“SecretaríadeComunicacionesyTransportes”isthemainsourceofdatafortheUnitedStates,Canada,andMexico.Datatablesaredividedupinto12categories,includingacountryoverview,transportationflows,safety,environment,trade,andinfrastructure.Thiswillbeourmainsourceofdatafordomesticfreightactivityandmerchandiseflows,allowingtherelativeimportanceofon-roadfreighttobeevaluated,bothintermsofitsrelationshiptototalnationalfreightflowsandallowingaMexico/US/Canadacomparison.Thedisaggregationbytypeofvehicleisnotmaintaineduptodateinthedatabase(mostrecentdatais2009),andhastobecomplementedwithdatafromsurveys(seebelow)
In-useVehicles
Inthesamevein,the“DirecciónGeneraldeAutotransporteFederal”(DGAF)providesstatisticsonheavydutyvehicleregistration(exceptfortherelativelyfewClass8highwaytractorsonstate-plates)butneedsdatafromsurveystobeabletodifferentiatethosethatarereallyincommercialuseonacontinuousbasis.
ICCTAug2017
139|P a g e
TherearenoreliableGovernmentalorInstitutionalfiguresshowingthevehiclepopulationinMexicobyvocationandfleetsizeandwehavealwaysmeasuredsignificantdiscrepanciesbetweenvehiclepopulationnumbersderivedfromregistrationdataandtheactivefleetthatisinrealityfoundoperatinginthecountry.Whilstthetotalnumberofvehiclesthatwefindissurprisinglycongruentwithofficialnumberstherearesignificantdifferencesinsub-classificationamongstfleetuseofoldervehicles,whichtendtoberelegatedtoowner-drivers.Typicallytrucksgetamajorrebuildafter20-25years(maybewithsecond-handtrucksandpartsthatcomeintoMexicofromtheUSA)anditwouldseemthattheyareusuallyseenbytheirownersasnewertruckseventhoughtheycontinuetouseoldregistrationpapers.InMexicothereisnoagerestrictionforfreightvehicles.Between1951and1990thetotalnumberofClass8vehiclessoldinMexicowas139,756;sofortheregistrationnumberstobevalidin-usevehicles,itwouldmeanthateverytrucksoldsince1951wouldhavetobestillinservice,whichwouldbehighlyunlikelyandnotsubstantiatedbyourregular,extensivefleetinterviews(seebelow).
MobileSourceEmissions
TheINECCstudy“ElaboracióndelInventarioNacionaldeEmisionesdeFuentesMóvilesparaMéxico2013yproyección2030medianteelusodelmodeloMOVES”andotherrecentmobilesourceemissionsinventorystudieswillbeusedasabasisforestimatingtheGHGandcriteriaemissionsfromClass8tractortrailers.TheanalysiswillusetheEFFECTemissionsmodule(COPERTIV)calibratedtonationalinventoriesfollowingthe“GuiaMethodologicaparalaestimacióndeemisionesvehiculares“developedbytheINECC,SEMARNAT,andWesternGovernors’Association.ThisExcel-basedvehiclefuelconsumptionandemissionsmodelwasdevelopedbyJohnRogersfortheWorldBank,hasbeenusedinpeer-reviewedstudiesinover18countriesandisfreelyavailablefromtheWorldBank,whoalsooffersfree,self-pacedon-linetraining.
b) InformationavailablefrompreviousstudiesconductedbyTSTES
TSTEShasperformedalotofdetailedstudiesinthisfieldoverrecentyearswhichprovideasolidbasisforthepresentanalysis.
MacKayDataMacseriesofstudies
TSTESconductsadetailedstudyoftheheavydutyfleetutilization(includingClass8highwaytractorsandtrailers)andrepairpracticesinMexicoeveryfouryearssince1992forMackay&Company,Lombard,Illinoiswhoprovideittoheavydutyvehiclemanufacturersandcomponentsuppliers.Thestudyishighlydetailedandextensiveinvolvingcomplexquestionnairesofaround11pagescontainingquestionsrelatingtoaround300differentcomponentcategoriescontaining1130discretevariables.Itrequiresperson-to-personinterviewsofdifferentmanagerswithineachfleetsorganizationtovalidate
ICCTAug2017
140|P a g e
fromtheirrecordsvehicleusageandmaintenancepractices.Thisinformationisanalyzedbyfleetvocation,sizeoffleet,typeandageofvehicle.
Themostrecentstudywas2015.MacKayispermittingustosharethevehiclefleetdatafromthisstudywithyouprovidedthatitisreferencedtoMackay&Co.
TSTES/INECCin-usefleetstudies
In2011,TSTESperformedanation-widestudyfortheINECCentitled“Caracterizacióndelaflotamexicanadevehículos”.Theobjectiveofthisstudywastocharacterizethecompositionofthefleetofheavyvehicles,defineenergyefficiencyindicators,andevaluatethecostsandbenefitstothefleetoperatorderivedfromtheuseandpossessionofheavydutyvehicles.Thestudyfedintotheclimatechangeanalysistoimprovethedataonthisimportantsector.
Thisstudyinvolvedface-to-faceinterviewswith599fleetsofwhich86owned/used4,819Class8heavydutyhighwaytractors.Afurtheranalysisin2012focusedonthe“longtail”ofsmallfleetsandowneroperators.Itinvolved318operators/fleetsofwhich46ownedatotalof2856Class8highwaytractors.
ThestudiesarepubliclyavailableandtheirdatanicelycomplementthefieldworkoftheDataMacseriesformanyoftheanswersrequiredinthepresentstudy.
GIZScrappageStudy
This2014two-partstudyperformedbyTSTESlookedatcommercialvehiclescrappageprogramsinMexico,andcomparedtothoseinothercountries.Assuchitprovidesanimportantinsightintotheoperationoftheseprogramsandwhatwouldbeneededtomakethemmoreeffective.
ThestudyinvolvedinterviewswithallthescrappagecentersinMexico(thathandledheavydutyvehicles)lookingattheprocess,paperworkinvolved,prices,publicity,controlbySHCP-SAT,SCT,SEMARNAT,otherFederalandStateauthorities.Itinvestigatedthenumberofvehiclesthathadgonedownthisroute,thecomplexityforthevehicleownerandtheinvolvementofOEMDistributorsinthescrappageschemes.Itlookedatthefinancialviabilityoftheexistingscrappageprogramsandhowthiscouldbeimproved.
Thestudiesarealsopubliclyavailableandprovideusefulinputtosomeofthequestionsposedinthisstudy.
c) Newfieldsurveyandinterviewdata
Whilsttheinformationdescribedaboveprovidesanswerstomanyofthequestionsinthisstudy,additionalfieldworkwasrequired(i)tofillgaps,(ii)refreshsomeoftheolderinformation,and(iii)
ICCTAug2017
141|P a g e
validatewherepreviousfindingsarestillfunctional.Thiswasconductedinaseriesofface-to-faceinterviewsasdescribedbelow:
1. Person-to-personinterviewswithasampleoffleetsandsmalloperatorstoquantifyresponses.2. Person-to-personinterviewswithotherstakeholderstocapturetheiropiniononthewiderange
ofthemescoveredbythiswork.
Whilstthefleetsurvey(item1above)werestructuredtoquantifyresults,anopeninterviewguidewasusedwiththeothers(item2above),togeneratemainlyqualitativeinformation.
HowtheactivepopulationofHighwayTractorswasdetermined
Theregisteredpopulationofvehiclestakenfromtheemissionoflicenseplatesmaygivevalidnumbersforthetotalparcinexistence,butcannotgiveinformationonthosethatarereallyinactiveuse.Forthis,otherdatasourcesareneeded.
TSTEShasconductedadetailedstudyoftheheavydutyfleetutilization(includingClass8highwaytractorsandtrailers)andrepairpracticesinMexicoeveryfouryearssince1992forMackay&Company,Lombard,Illinoiswhoprovideittoheavydutyvehiclemanufacturersandcomponentsuppliers.Thestudyishighlydetailedandextensive,involvingcomplexquestionnairesofaround11pagescontainingquestionsrelatingtoaround300differentcomponentcategoriescontaining1130discretevariables.Itrequiresperson-to-personinterviewsofdifferentmanagerswithineachfleets’organizationtovalidatefromtheirrecordsvehicleusageandmaintenancepractices.Thisinformationisanalyzedbyfleetvocation,sizeoffleet,type,andageofvehicle.
Themostrecentstudywas2015.MacKayispermittingustosharethevehiclefleetdatafromthisstudywithyouprovidedthatitisreferenced(cited)toMackay&Co.65
Theuseofthesefindingsisimportantbecauseitistheonlystudythatclearlyidentifiestheactualactivein-usevehiclefleet,ascomparedtothelicenseplatestatisticscollatedbySCTofregisteredheavydutyvehicles.
Thestudyinvolvesaverydetailedface-to-faceinterviewwith37066fleetsofallsizesdistributedin9localities(seeTable74)and8vocations(seeTable75).Ofthesein2015,132fleetsown/operateatotalof7,370Class8HighwayTractors.TheotherfleetsinthesampleoperatedheavydutyvehiclesbutnotClass8HighwayTractors.Figure56showsthenumberoffleetsinthissamplebyfleetsize.
65PleaseciteasSource:Mackay&Company,Lombard,Illinois–DataMac-Mexico201566Thenumberofinterviewsshownforface-to-faceandtelephonearefromthe2015studyresults
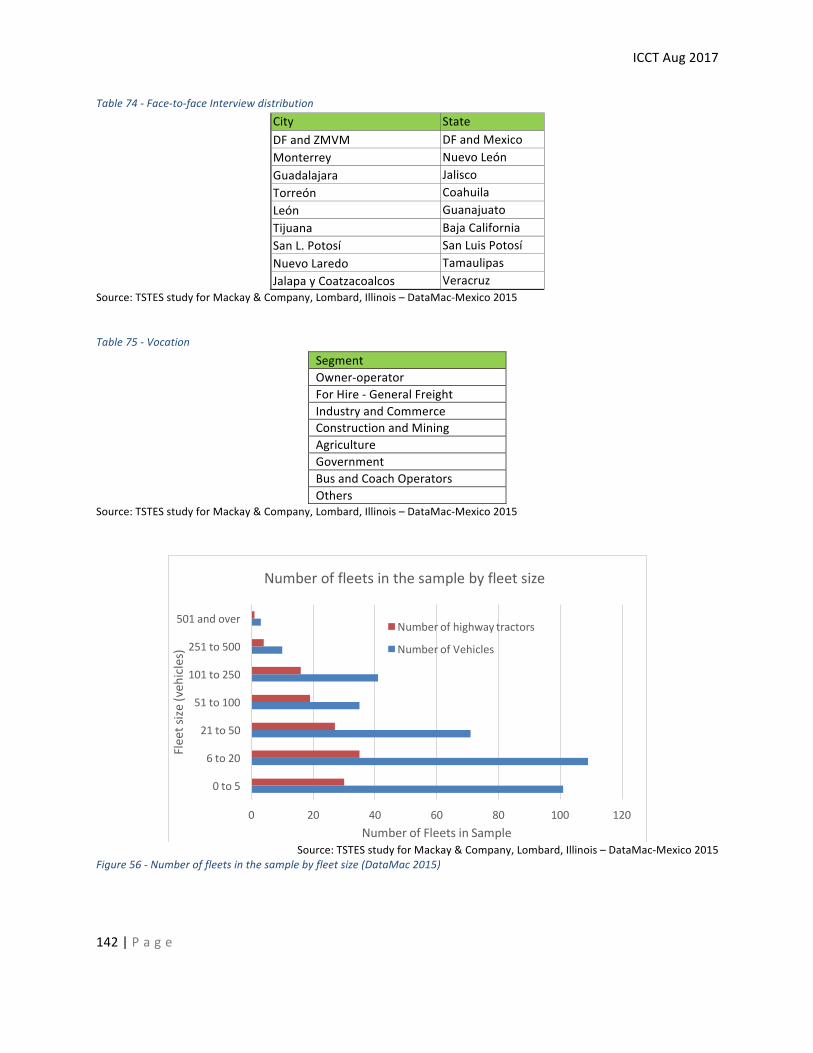
ICCTAug2017
142|P a g e
Table74-Face-to-faceInterviewdistributionCity StateDFandZMVM DFandMexicoMonterrey NuevoLeónGuadalajara JaliscoTorreón CoahuilaLeón GuanajuatoTijuana BajaCaliforniaSanL.Potosí SanLuisPotosíNuevoLaredo TamaulipasJalapayCoatzacoalcos Veracruz
Source:TSTESstudyforMackay&Company,Lombard,Illinois–DataMac-Mexico2015
Table75-VocationSegmentOwner-operatorForHire-GeneralFreightIndustryandCommerceConstructionandMiningAgricultureGovernmentBusandCoachOperatorsOthers
Source:TSTESstudyforMackay&Company,Lombard,Illinois–DataMac-Mexico2015
Source:TSTESstudyforMackay&Company,Lombard,Illinois–DataMac-Mexico2015
Figure56-Numberoffleetsinthesamplebyfleetsize(DataMac2015)
0 20 40 60 80 100 120
0to5
6to20
21to50
51to100
101to250
251to500
501andover
NumberofFleetsinSample
Fleetsize
(veh
icles)
Numberoffleetsinthesamplebyfleetsize
Numberofhighwaytractors
NumberofVehicles
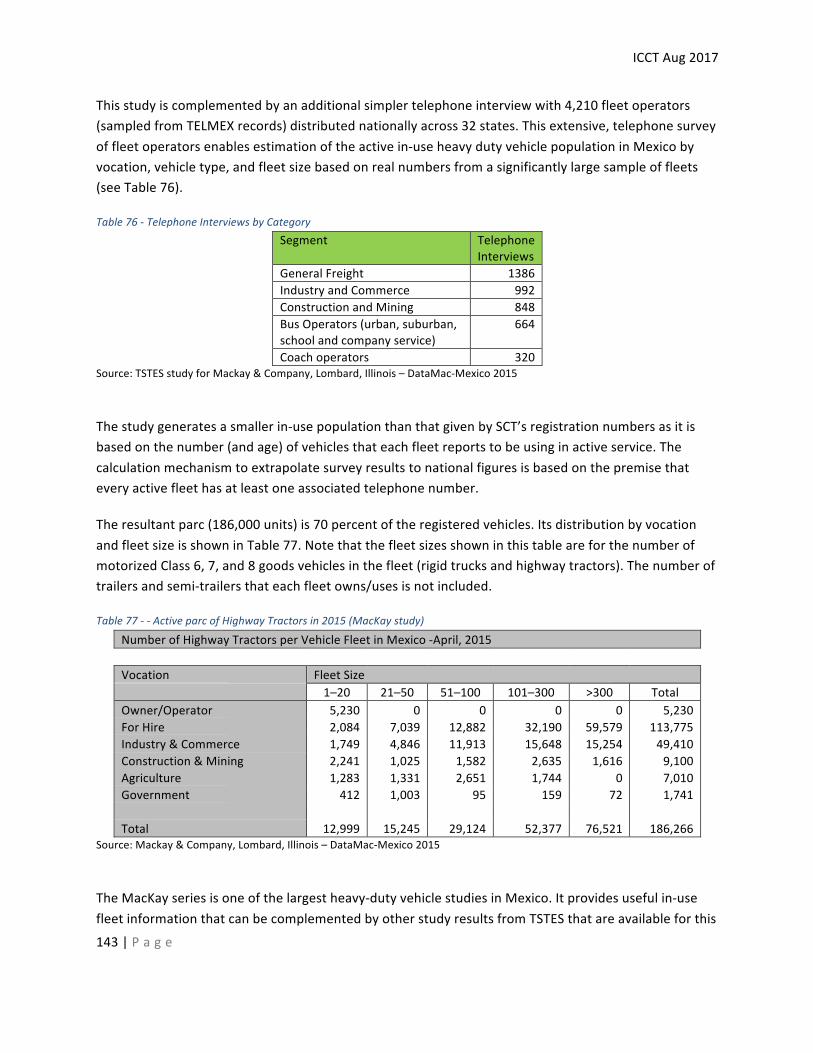
ICCTAug2017
143|P a g e
Thisstudyiscomplementedbyanadditionalsimplertelephoneinterviewwith4,210fleetoperators(sampledfromTELMEXrecords)distributednationallyacross32states.Thisextensive,telephonesurveyoffleetoperatorsenablesestimationoftheactivein-useheavydutyvehiclepopulationinMexicobyvocation,vehicletype,andfleetsizebasedonrealnumbersfromasignificantlylargesampleoffleets(seeTable76).
Table76-TelephoneInterviewsbyCategorySegment Telephone
InterviewsGeneralFreight 1386IndustryandCommerce 992ConstructionandMining 848BusOperators(urban,suburban,schoolandcompanyservice)
664
Coachoperators 320Source:TSTESstudyforMackay&Company,Lombard,Illinois–DataMac-Mexico2015
Thestudygeneratesasmallerin-usepopulationthanthatgivenbySCT’sregistrationnumbersasitisbasedonthenumber(andage)ofvehiclesthateachfleetreportstobeusinginactiveservice.Thecalculationmechanismtoextrapolatesurveyresultstonationalfiguresisbasedonthepremisethateveryactivefleethasatleastoneassociatedtelephonenumber.
Theresultantparc(186,000units)is70percentoftheregisteredvehicles.ItsdistributionbyvocationandfleetsizeisshowninTable77.NotethatthefleetsizesshowninthistableareforthenumberofmotorizedClass6,7,and8goodsvehiclesinthefleet(rigidtrucksandhighwaytractors).Thenumberoftrailersandsemi-trailersthateachfleetowns/usesisnotincluded.
Table77--ActiveparcofHighwayTractorsin2015(MacKaystudy)
NumberofHighwayTractorsperVehicleFleetinMexico-April,2015 Vocation FleetSize 1–20 21–50 51–100 101–300 >300 TotalOwner/Operator 5,230 0 0 0 0 5,230ForHire 2,084 7,039 12,882 32,190 59,579 113,775Industry&Commerce 1,749 4,846 11,913 15,648 15,254 49,410Construction&Mining 2,241 1,025 1,582 2,635 1,616 9,100Agriculture 1,283 1,331 2,651 1,744 0 7,010Government 412 1,003 95 159 72 1,741 Total 12,999 15,245 29,124 52,377 76,521 186,266
Source:Mackay&Company,Lombard,Illinois–DataMac-Mexico2015
TheMacKayseriesisoneofthelargestheavy-dutyvehiclestudiesinMexico.Itprovidesusefulin-usefleetinformationthatcanbecomplementedbyotherstudyresultsfromTSTESthatareavailableforthis
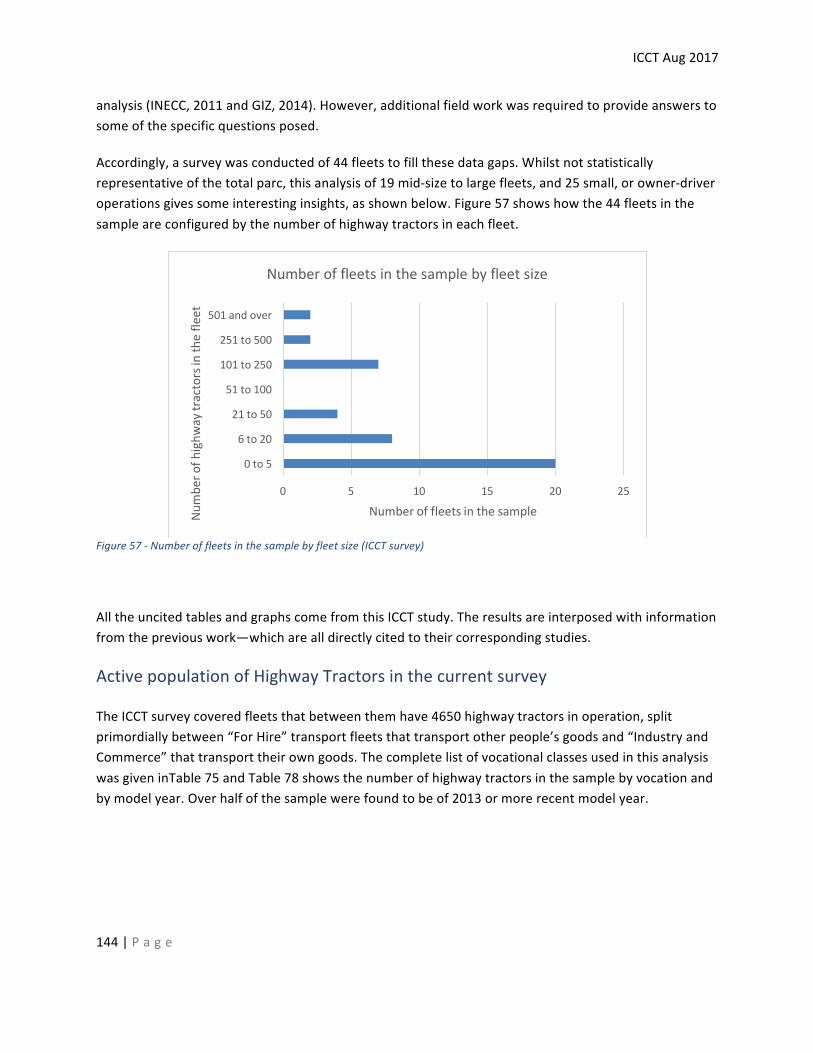
ICCTAug2017
144|P a g e
analysis(INECC,2011andGIZ,2014).However,additionalfieldworkwasrequiredtoprovideanswerstosomeofthespecificquestionsposed.
Accordingly,asurveywasconductedof44fleetstofillthesedatagaps.Whilstnotstatisticallyrepresentativeofthetotalparc,thisanalysisof19mid-sizetolargefleets,and25small,orowner-driveroperationsgivessomeinterestinginsights,asshownbelow.Figure57showshowthe44fleetsinthesampleareconfiguredbythenumberofhighwaytractorsineachfleet.
Figure57-Numberoffleetsinthesamplebyfleetsize(ICCTsurvey)
AlltheuncitedtablesandgraphscomefromthisICCTstudy.Theresultsareinterposedwithinformationfromthepreviouswork—whicharealldirectlycitedtotheircorrespondingstudies.
ActivepopulationofHighwayTractorsinthecurrentsurvey
TheICCTsurveycoveredfleetsthatbetweenthemhave4650highwaytractorsinoperation,splitprimordiallybetween“ForHire”transportfleetsthattransportotherpeople’sgoodsand“IndustryandCommerce”thattransporttheirowngoods.ThecompletelistofvocationalclassesusedinthisanalysiswasgiveninTable75andTable78showsthenumberofhighwaytractorsinthesamplebyvocationandbymodelyear.Overhalfofthesamplewerefoundtobeof2013ormorerecentmodelyear.
0 5 10 15 20 25
0to5
6to20
21to50
51to100
101to250
251to500
501andover
NumberoffleetsinthesampleNumbe
rofh
ighw
aytractorsinth
efle
et
Numberoffleetsinthesamplebyfleetsize
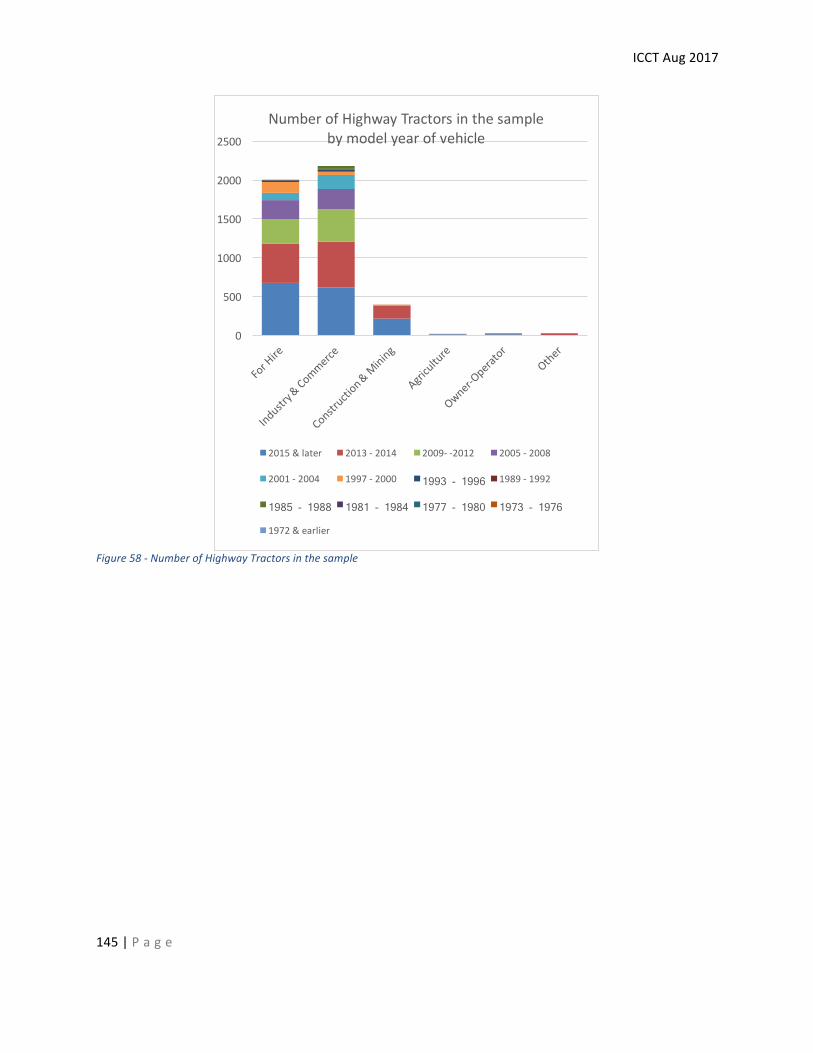
ICCTAug2017
145|P a g e
Figure58-NumberofHighwayTractorsinthesample
0
500
1000
1500
2000
2500
NumberofHighwayTractorsinthesamplebymodelyearofvehicle
2015&later 2013- 2014 2009- -2012 2005- 2008
2001- 2004 1997- 2000 1993 - 1996 1989- 1992
1985 - 1988 1981 - 1984 1977 - 1980 1973 - 1976
1972&earlier
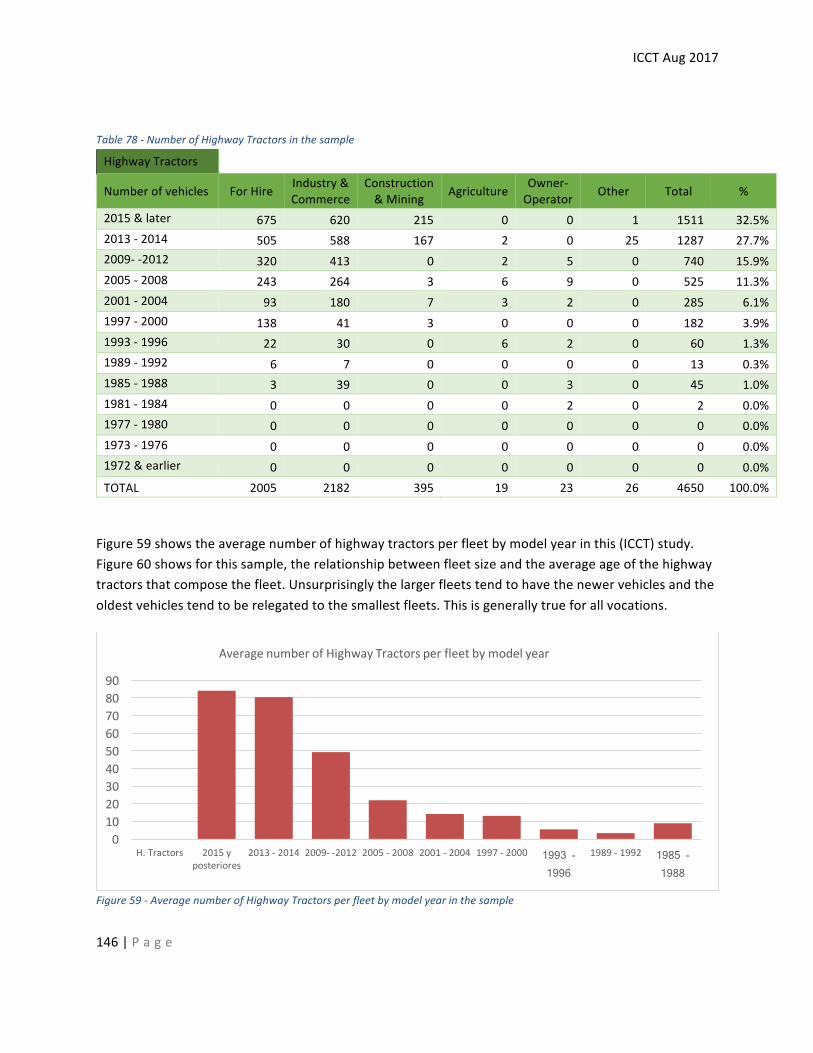
ICCTAug2017
146|P a g e
Table78-NumberofHighwayTractorsinthesample
HighwayTractors
Numberofvehicles ForHire Industry&Commerce
Construction&Mining Agriculture Owner-
Operator Other Total %
2015&later 675 620 215 0 0 1 1511 32.5%2013-2014 505 588 167 2 0 25 1287 27.7%2009--2012 320 413 0 2 5 0 740 15.9%2005-2008 243 264 3 6 9 0 525 11.3%2001-2004 93 180 7 3 2 0 285 6.1%1997-2000 138 41 3 0 0 0 182 3.9%1993-1996 22 30 0 6 2 0 60 1.3%1989-1992 6 7 0 0 0 0 13 0.3%1985-1988 3 39 0 0 3 0 45 1.0%1981-1984 0 0 0 0 2 0 2 0.0%1977-1980 0 0 0 0 0 0 0 0.0%1973-1976 0 0 0 0 0 0 0 0.0%1972&earlier 0 0 0 0 0 0 0 0.0%TOTAL 2005 2182 395 19 23 26 4650 100.0%
Figure59showstheaveragenumberofhighwaytractorsperfleetbymodelyearinthis(ICCT)study.Figure60showsforthissample,therelationshipbetweenfleetsizeandtheaverageageofthehighwaytractorsthatcomposethefleet.Unsurprisinglythelargerfleetstendtohavethenewervehiclesandtheoldestvehiclestendtoberelegatedtothesmallestfleets.Thisisgenerallytrueforallvocations.
Figure59-AveragenumberofHighwayTractorsperfleetbymodelyearinthesample
0102030405060708090
H.Tractors 2015yposteriores
2013- 2014 2009- -2012 2005- 2008 2001- 2004 1997- 2000 1993 -1996
1989- 1992 1985 -1988
AveragenumberofHighwayTractorsperfleetbymodelyear
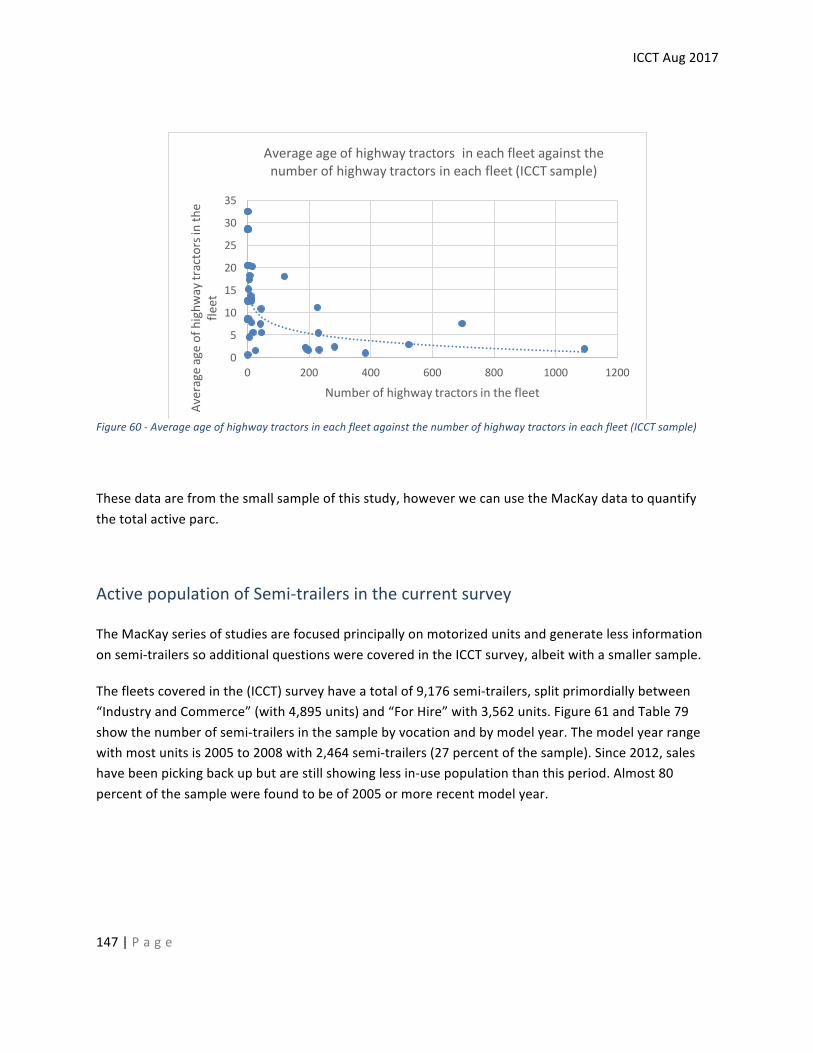
ICCTAug2017
147|P a g e
Figure60-Averageageofhighwaytractorsineachfleetagainstthenumberofhighwaytractorsineachfleet(ICCTsample)
Thesedataarefromthesmallsampleofthisstudy,howeverwecanusetheMacKaydatatoquantifythetotalactiveparc.
ActivepopulationofSemi-trailersinthecurrentsurvey
TheMacKayseriesofstudiesarefocusedprincipallyonmotorizedunitsandgeneratelessinformationonsemi-trailerssoadditionalquestionswerecoveredintheICCTsurvey,albeitwithasmallersample.
Thefleetscoveredinthe(ICCT)surveyhaveatotalof9,176semi-trailers,splitprimordiallybetween“IndustryandCommerce”(with4,895units)and“ForHire”with3,562units.Figure61andTable79showthenumberofsemi-trailersinthesamplebyvocationandbymodelyear.Themodelyearrangewithmostunitsis2005to2008with2,464semi-trailers(27percentofthesample).Since2012,saleshavebeenpickingbackupbutarestillshowinglessin-usepopulationthanthisperiod.Almost80percentofthesamplewerefoundtobeof2005ormorerecentmodelyear.
0
5
10
15
20
25
30
35
0 200 400 600 800 1000 1200
Averageageofhighw
aytractorsinth
efle
et
Numberofhighwaytractorsinthefleet
Averageageofhighwaytractorsineachfleetagainstthenumberofhighwaytractorsineachfleet(ICCTsample)
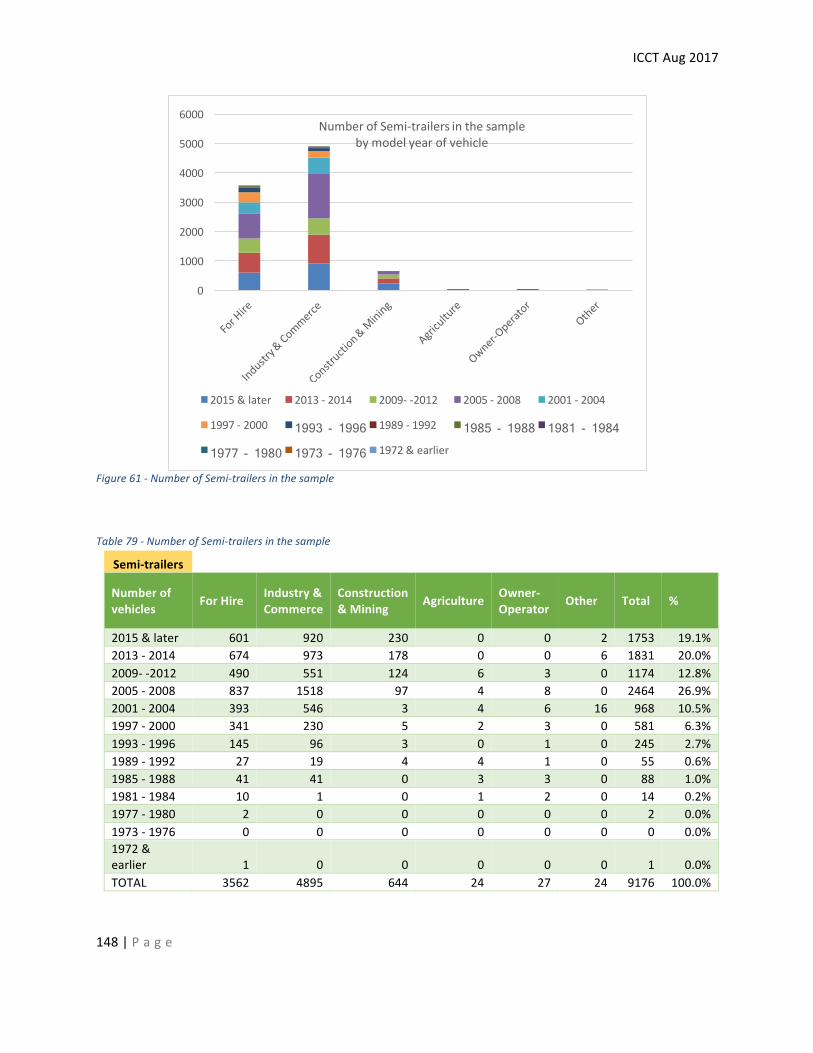
ICCTAug2017
148|P a g e
Figure61-NumberofSemi-trailersinthesample
Table79-NumberofSemi-trailersinthesample
Semi-trailers
Numberofvehicles ForHire Industry&
CommerceConstruction&Mining Agriculture Owner-
Operator Other Total %
2015&later 601 920 230 0 0 2 1753 19.1%2013-2014 674 973 178 0 0 6 1831 20.0%2009--2012 490 551 124 6 3 0 1174 12.8%2005-2008 837 1518 97 4 8 0 2464 26.9%2001-2004 393 546 3 4 6 16 968 10.5%1997-2000 341 230 5 2 3 0 581 6.3%1993-1996 145 96 3 0 1 0 245 2.7%1989-1992 27 19 4 4 1 0 55 0.6%1985-1988 41 41 0 3 3 0 88 1.0%1981-1984 10 1 0 1 2 0 14 0.2%1977-1980 2 0 0 0 0 0 2 0.0%1973-1976 0 0 0 0 0 0 0 0.0%1972&earlier 1 0 0 0 0 0 1 0.0%TOTAL 3562 4895 644 24 27 24 9176 100.0%
0
1000
2000
3000
4000
5000
6000NumberofSemi-trailersinthesample
bymodelyearofvehicle
2015&later 2013- 2014 2009- -2012 2005- 2008 2001- 2004
1997- 2000 1993 - 1996 1989- 1992 1985 - 1988 1981 - 1984
1977 - 1980 1973 - 1976 1972&earlier
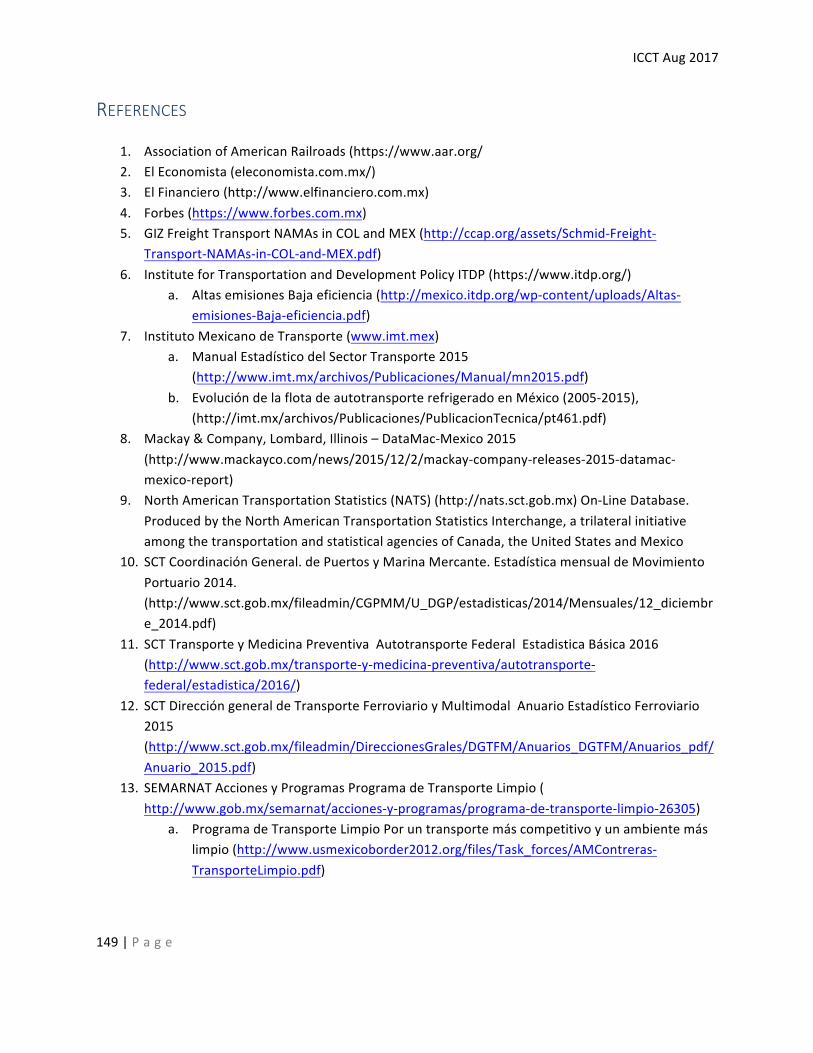
ICCTAug2017
149|P a g e
REFERENCES
1. AssociationofAmericanRailroads(https://www.aar.org/2. ElEconomista(eleconomista.com.mx/)3. ElFinanciero(http://www.elfinanciero.com.mx)4. Forbes(https://www.forbes.com.mx)5. GIZFreightTransportNAMAsinCOLandMEX(http://ccap.org/assets/Schmid-Freight-
Transport-NAMAs-in-COL-and-MEX.pdf)6. InstituteforTransportationandDevelopmentPolicyITDP(https://www.itdp.org/)
a. AltasemisionesBajaeficiencia(http://mexico.itdp.org/wp-content/uploads/Altas-emisiones-Baja-eficiencia.pdf)
7. InstitutoMexicanodeTransporte(www.imt.mex)a. ManualEstadísticodelSectorTransporte2015
(http://www.imt.mx/archivos/Publicaciones/Manual/mn2015.pdf)b. EvolucióndelaflotadeautotransporterefrigeradoenMéxico(2005-2015),
(http://imt.mx/archivos/Publicaciones/PublicacionTecnica/pt461.pdf)8. Mackay&Company,Lombard,Illinois–DataMac-Mexico2015
(http://www.mackayco.com/news/2015/12/2/mackay-company-releases-2015-datamac-mexico-report)
9. NorthAmericanTransportationStatistics(NATS)(http://nats.sct.gob.mx)On-LineDatabase.ProducedbytheNorthAmericanTransportationStatisticsInterchange,atrilateralinitiativeamongthetransportationandstatisticalagenciesofCanada,theUnitedStatesandMexico
10. SCTCoordinaciónGeneral.dePuertosyMarinaMercante.EstadísticamensualdeMovimientoPortuario2014.(http://www.sct.gob.mx/fileadmin/CGPMM/U_DGP/estadisticas/2014/Mensuales/12_diciembre_2014.pdf)
11. SCTTransporteyMedicinaPreventivaAutotransporteFederalEstadisticaBásica2016(http://www.sct.gob.mx/transporte-y-medicina-preventiva/autotransporte-federal/estadistica/2016/)
12. SCTDireccióngeneraldeTransporteFerroviarioyMultimodalAnuarioEstadísticoFerroviario2015(http://www.sct.gob.mx/fileadmin/DireccionesGrales/DGTFM/Anuarios_DGTFM/Anuarios_pdf/Anuario_2015.pdf)
13. SEMARNATAccionesyProgramasProgramadeTransporteLimpio(http://www.gob.mx/semarnat/acciones-y-programas/programa-de-transporte-limpio-26305)
a. ProgramadeTransporteLimpioPoruntransportemáscompetitivoyunambientemáslimpio(http://www.usmexicoborder2012.org/files/Task_forces/AMContreras-TransporteLimpio.pdf)
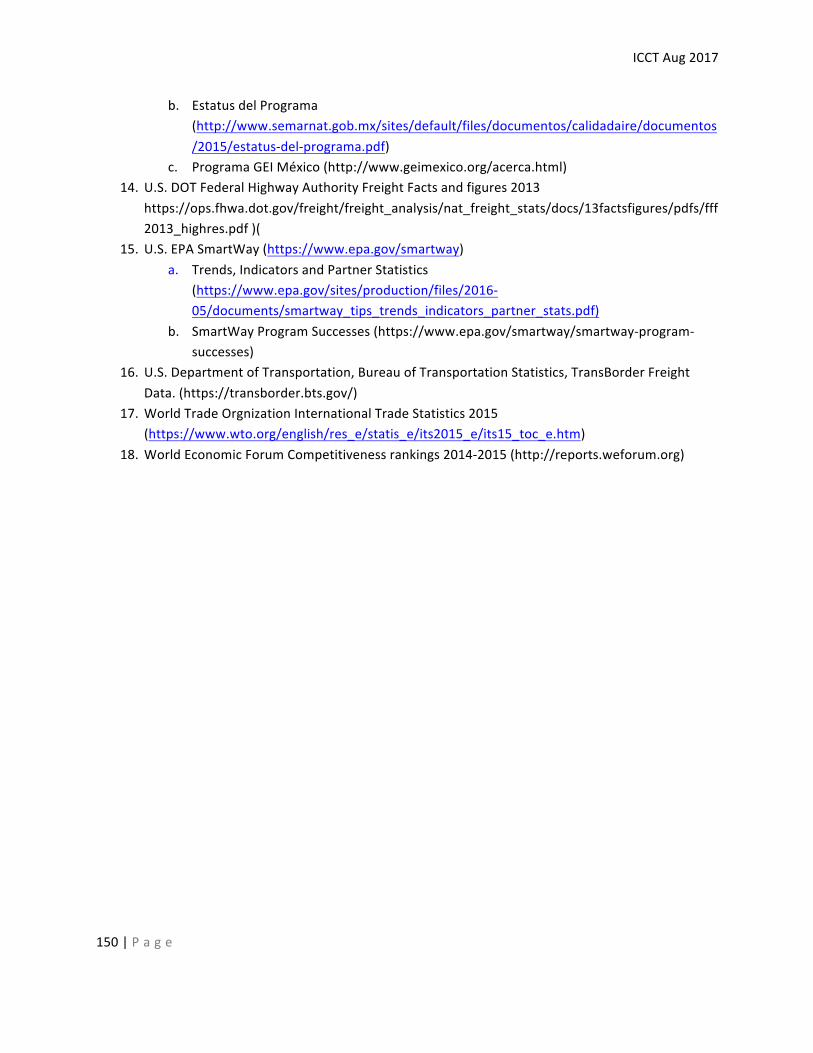
ICCTAug2017
150|P a g e
b. EstatusdelPrograma(http://www.semarnat.gob.mx/sites/default/files/documentos/calidadaire/documentos/2015/estatus-del-programa.pdf)
c. ProgramaGEIMéxico(http://www.geimexico.org/acerca.html)14. U.S.DOTFederalHighwayAuthorityFreightFactsandfigures2013
https://ops.fhwa.dot.gov/freight/freight_analysis/nat_freight_stats/docs/13factsfigures/pdfs/fff2013_highres.pdf)(
15. U.S.EPASmartWay(https://www.epa.gov/smartway)a. Trends,IndicatorsandPartnerStatistics
(https://www.epa.gov/sites/production/files/2016-05/documents/smartway_tips_trends_indicators_partner_stats.pdf)
b. SmartWayProgramSuccesses(https://www.epa.gov/smartway/smartway-program-successes)
16. U.S.DepartmentofTransportation,BureauofTransportationStatistics,TransBorderFreightData.(https://transborder.bts.gov/)
17. WorldTradeOrgnizationInternationalTradeStatistics2015(https://www.wto.org/english/res_e/statis_e/its2015_e/its15_toc_e.htm)
18. WorldEconomicForumCompetitivenessrankings2014-2015(http://reports.weforum.org)