Embed Size (px)
Citation preview

MEXICO CITY METROPOLITAN AREA:THE LARGEST MEGACITY
IN AN UNSUSTAINABLE PATH
CECILIA TORTAJADATHIRD WORLD CENTRE FOR
WATER MANAGEMENT, MEXICO

Metropolitan Area of Mexico City
• Area of 4,925 km2
1,484 km2 in Mexico City3,441 km2 in State of Mexico
• 0.3% of land and 22-25% ofpopulation16 boroughs of Mexico City34 municipalities of State of Mexico
• 45% of commercial, servicesand industrial activities
• 32% of the GDP

Population density, Metropolitan Area of Mexico City
Density population
Federal DistrictBoundary
MunicipalityBoundary
13,065 – 17,718 people km -2
7,597 – 13,064 people km -2
3,857 – 7,596 people km-2
2,091 – 3,856 people km -2
153 – 2,990 people km -2
0
10,000
20,000
30,000
1910 1920 1930 1940 1950 1960 1970 1980 1990 2000
year
thou
sand
Population growth
Federal District
State ofMexico
0
10
20
30
40
50
60
70
1910 1920 1930 1940 1950 1960 1970 1980 1990 2000
year
m3 da
y-1
Water dem ands
N

Water needs, Metropolitan Area of Mexico City
9 million people in Mexico City (95.3% have access to water)14 million in State of Mexico (84.2% have access to water)
364 l/person/day in Mexico City230 l/person/day in State of Mexico
290 l/person/day(including industries, services,
unauthorized uses and leakages of 30-40%)

Sources for drinking water for the Metropolitan Area (m3/s)
Mexico City State of Mexico
Total %
INTERNALSOURCES
20.0 25.2 45.2 68.5
Wells 19.0 24.8 43.8 66.4
Rivers andsprings
1.0 0.4 1.4 2.1
EXTERNAL SOURCES
14.8 6.0 20.8 31.5
Cutzamala 9.9 5.0 14.9 22.6
Lerma 4.9 1.0 5.9 8.9
TOTAL 34.8(52.7%)
31.2(47.3%)
66.0 100.0
Source: DGCOH, 1997; CAEM, 2002.

Groundwater abstraction from the aquifer
• Abstraction of 45- 48 m3/s • Natural recharge rate - 20 m3/s
Overexplotation - 25-28 m3/s • Lowering of the water table
and land subsidence at the rate of 10-40 cm/year in some parts of the city

External sources of water
Lerma River 1942 – 4 m3/s 1965-1976 – 14 m3/s
6 m3/sCutzamala System
1982 – 4 m3/s1985 – 6 m3/s1993 – 9 m3/s $ 23 million/m3
1997 – 14 m3/s
Water has to be transferred from more than 150 km away, pumped to a height of more than 1000 m. It requires 102 pumping stations, 17 tunnels and 8 km of canals, becoming a very energy-expensive operation

2800
1600
2600
2400
2200
2000
1800
Elev
atio
n(m
sl)
Colorines Dam, P.P. 1Valle de Bravo Dam, P.P. 2
P.P. 3
P.P. 4Chilesdo Dam, P.P. 5
Villa Victoria DamWater Treatment Plant
P.P. 6
DamPumping plant (P.P.)Piezometric line
De las Cruces Mountains
Tuxpan Dam
El BosqueDam
ZitácuaroCity
Ixtapan del OroDam
ColorinesDam
El Tule Dam
Valle de Bravo Dam
ChilesdoDam
Villa VictoriaDam
Temascaltepec River
Toluca City
Mexico City
Emiliano Zapata Tank
Tank No. 3
PericosTank
Sta. Isabel Tank
Stabilization PondDonato Guerra
Teuhtli Tank
Cerro GordoTank
La CalderaTank
Coacalco Tank
BarrientosTank
Water TreatmentPlant
Source: Tortajada, 2003.

Cutzamala System - Cost
Only the construction of Cutzalama system ($1300 million) was higher than the national investment in the entire public sector in Mexico in 1996, including:
• education ($700 million) • health and social security ($400 million) • agriculture, livestock and rural development
($105 million) • tourism ($50 million) and • marine sector ($60 million).
Source: CNA, 1997.

Infrastructure for water distribution, State of Mexico, 2004
5,259 l/s are distributed to 10 municipalities of the metropolitan area
60.8 km (42%) out of 143.4 km have been constructed

Land subsidence in the Federal District
Period1976 - 1985
50 cm
100 cm1900 – 1937 : 3-5 cm/year
1938 – 1947 : 16 cm/year
1948 – 1957 : 35 cm/year
1954 – NO EXTRACTION FROM WELLS IN THE MEXICO CITY SUB-BASIN
FROM 1957 – 5 cm/year
150 cm
200 cm
250 cm
Period1985 - 1987
10 cm
20 cm
30 cm
40 cm
Source: INEGI, 2004.

Abstraction of water (m3)/subsidencein Mexico City
•Damages to the infrastructures for water supply and sewerage systems
•Construction of costly pumping systems to remove rainwater and wastewater from the City
•Degradation of groundwater quality
Source: Lesser & Cortés, 1998.

Subsidence in Mexico City
City centre, 10 cm
Airport, 20-25 cm
Source: Mazari-Hiriart et al., 2001.

Problems...
Flooding
Difference in levels between some parts of the City and the collectors
Inability of the overall system to pump all the water out of the City in rainy season
Due to the subsidence of the City, downtown is 7 m below the highest point of the Grand Canal, which makes it difficult for the water to be pumped out of the area

Problems...
Pollution of groundwater
Faecal coliformsBacterias such as Aeromonas, Pseudomonas, Staphylococcusand Vibrio in the southern and eastern part of the City
Helicobacter pylory, related to ulcers and stomach cancer in the aquifer in the area of Xochimilco and in water of Cutzamala before being treated.

Volumes of water abstracted in Mexico City(million m3/year)
0
100
200
300
400
500
600
700
800
Surface water Groundwater
Agriculture
Agroindustry
Rural
Aquaculture
Services
Industrial
Livestock
Urban
Multiple
Energy
Comercial activities
Source: CNA, 2004.

Volumes of water abstracted in State of Mexico(million m3/year)
0
200
400
600
800
1,000
1,200
1,400
1,600
1,800
2,000
Surface water Groundwater
Agriculture
Agroindustry
Rural
Aquaculture
Services
Industrial
Livestock
Urban
Multiple
Energy
Comercial activities
Source: CNA, 2004.

Total volume of water abstracted (million m3/year) and number of concessions
USE MEXICO CITY STATE OF MEXICO
CONCESSIONS VOLUME ABSTRACTED
CONCESSIONS VOLUME ABSTRACTED
AGRICULTURE 2 0.37 1,729 872
AGROINDUSTRY 0 0 1 0.012
DOMESTIC (one user) 3 0.017 159 5.6
AQUACULTURE 2 0.2 153 142
SERVICES 42 5.2 84 21.6
INDUSTRIAL 157 29.3 503 145.9
LIVESTOCK 0 0 82 4.1
URBAN 1 1,089.6 1,865 1,157
MULTIPLE 4 0.7 482 201.4
ENERGY 0 0 4 1,998.9
COMMERCIAL ACTIVITIES
0 0 0 0
Source: CNA, 2004.

Total volume of wastewater discharged (million m3/year) and number of concessions
USE MEXICO CITY STATE OF MEXICO
CONCESSIONS VOLUME DISCHARGED
CONCESSIONS VOLUME DISCHARGED
AGRICULTURE 0 0 261 4.2
AGROINDUSTRY 0 0 0 0
DOMESTIC (one user) 0 0 89 0.04
AQUACULTURE 0 0 3 0.02
SERVICES 22 1.18 282 2.38
INDUSTRIAL 8 0.6 22 0.002
LIVESTOCK 0 0 11 0.16
URBAN 1 744.3 4 0.004
MULTIPLE 0 0 3482 0.003
ENERGY 0 0 0 0
COMMERCIAL ACTIVITIES
0 0 14 0.001
TOTAL 31 745.48 689 6.81Source: CNA, 2004.

Wastewater discharges (m3/s)
USE MEXICO CITY STATE OF MEXICO
CONCESSIONS VOLUME DISCHARGED
CONCESSIONS VOLUME DISCHARGED
TOTAL 31 745.48 689 6.81
23.63 m3/s 0.2159 m3/s
23.85 m3/s45-50 m3/s
Irrigation of 90,000 ha in the Mezquital Valley

Subsidence in D.F. and Infrastructure problems
Federal District
2
3 4 5
6
6.8
7.2810
345
6.8
6
2 6.2
345
54
3
1910Mexico City Tequisquiac Tunnel
1950
Grand CanalSlope 19 cm/km
Gravity Sewage System
Slope 12 cm/km
Pumping Sewage System
1970
1990
Slope ≈0
InterceptorsCentral Deep Drainage
Slope 10 cm/km
Pumping Sewage System
Pumping Sewage System
Source: National Research Council, 1995.

Water Management Constraints
• Old infrastructure• Over-explotation of the aquifer (land subsidence)• Dependence on water supply from outside sources• About 30-40% of water is lost from the distribution
networks due to leakages which could provide water to 4 million people
• Metering is almost non-existent (flat rates)• Only about 18-20% of users pay their water bills• Institutional arrangements

STRATEGY FOR WATERMANAGEMENT FOR MEXICO CITY, 1992
Water supplyFinancial self-sufficiency
Metered serviceProgramme on leakages detection

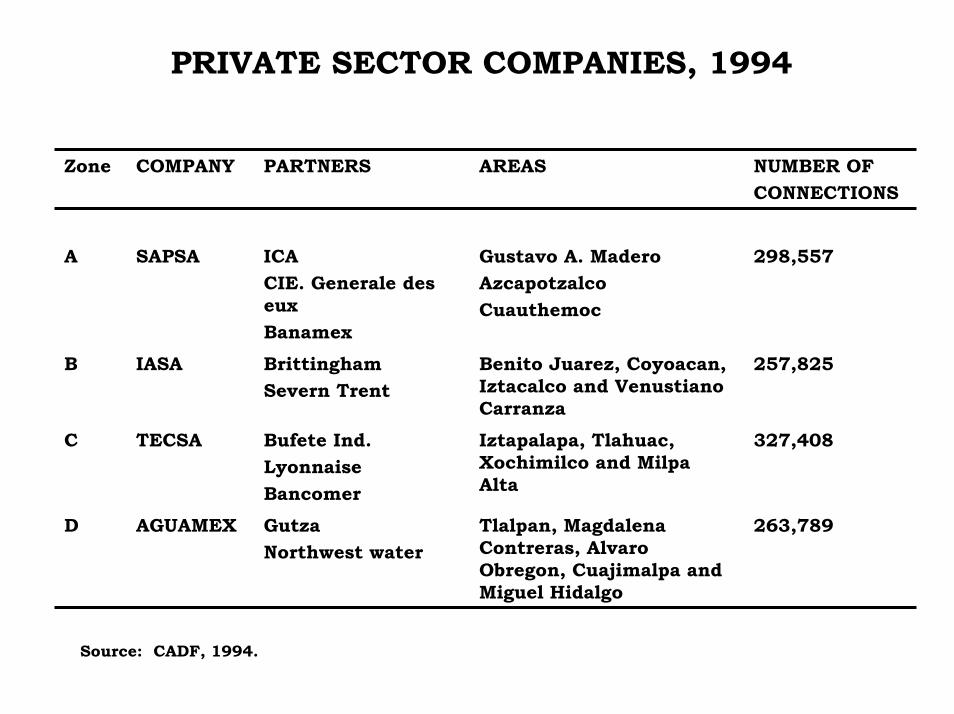
PRIVATE SECTOR COMPANIES, 1994
Zone COMPANY PARTNERS AREAS NUMBER OFCONNECTIONS
A SAPSA ICACIE. Generale des euxBanamex
Gustavo A. MaderoAzcapotzalcoCuauthemoc
298,557
B IASA BrittinghamSevern Trent
Benito Juarez, Coyoacan, Iztacalco and VenustianoCarranza
257,825
C TECSA Bufete Ind.LyonnaiseBancomer
Iztapalapa, Tlahuac, Xochimilco and Milpa Alta
327,408
D AGUAMEX GutzaNorthwest water
Tlalpan, Magdalena Contreras, Alvaro Obregon, Cuajimalpa andMiguel Hidalgo
263,789
Source: CADF, 1994.

ACTIVITIES
1. SERVICE TO CLIENTS: METERS, READING, DISTRIBUTION OF BILLS, COLLECTION OF FEES, INFORMATION OFFICES.
2. HUMAN RESOURCES AND SYSTEMS (QUALITY CONTROL).
3. TECHNICAL SERVICES: STATISTICS OF USERS AND NETWORKS, REPLACEMENT OF METERS.
4. OPERATIONS: MAINTENANCE OF METERS AND PIPES (LEAK DETECTION AND REPAIR).

RESULTS
UPDATE LIST OF USERS AND CONNECTIONS
COMPUTARIZED SYSTEM (USERS, CONNECTIONS, METERS INSTALLED, CONSUMPTION, BILLS, COLLECTION OF FEES, DEBTS).
PROGRAMME ON LEAKES DETECTION.
NO EXCEMPTIONS (EDUCATION AND HEALTH SECTOR).
DISCOUNTS: RETIRED PESONNEL HAS ONE-YEAR RENEWABLE DISCOUNTS. PEOPLE FROM DISTANT PLACES WITH NO REGULAR SERVICE.

METERS FOR DRINKING WATER, D.F., 1994-2002
*METER A, CHEAPER. INSTALLED IN AREAS WHERE THE ECONOMIC RETURN WAS NOT ASSURED.
METERS(THOUSANDS)
TOTAL
TYPE A* TYPE B1994 205.2 0.0 205.21995 198.8 20.4 219.21996 173.6 139.1 312.71997 197.6 116.8 314.41998 37.8 47.9 85.71999 38.7 11.2 49.92000 31.4 10.1 41.52001 23.8 3.5 27.32002 7.2 1.4 8.6TOTAL 914.1 350.4 1264.5

Efficiency indicators for drinking water managementin Mexico City
1996 1997 1998 1999 2000 2001
VOLUME OF DELIVERED WATER(MILLION OF m3)
686.6 690.6 691.9 720.2 752.8 752.2
USERS WITH BILL(THOUSANDS)
1,477.5 1,620.2 1,644.0 1,681.1 1,7020.0 1,769.1
NO. OF BILLS FOR METERED SERVICE(THOUSANDS)
725.6 1,260.6 1,408.3 1,505.1 1,552.8 1,582.7
CHARGED WATER (BILLION PESOS)
1.1 1.5 2.1 4.6 2.8 3.2
BILLED WATER (BILLION PESOS)
1.7 2.4 2.7 7.2 3.5 3.8

WATER TARIFFS FOR FEDERAL DISTRICT, 2004(dollars / m3)
Lowest limitsm3/2 months
Highest limitm3/2 months
Minimum payment
010.120.130.150.170.190.1120.1180.1240.1420.1600.1960.11500.1
102030507090120180240420660960
1 500beyond
0.11.12.55.011.818.728.557.8131.9238.3605.9177.0
1 948.53 545.8

PRICES FOR DOMESTIC USE IN STATE OF MEXICO1994-2002 (PESOS/M3/BYMONTLY)
GROUP A WITH METER
(0 to 25m3)
GROUP BWITH METER
(0 to 25m3)
GROUP AWITHOUT METER
Group BWITHOUT METER
1994 0.56 0.45 47.82 38.3
1995 0.63 0.5 53.56 42.9
1996 0.88 0.7 74.98 60.06
1997 1.01 0.81 85.5 69.5
1998 1.16 1.02 99.8 87.39
1999 1.31 1.15 112.65 98.51
2000 1.44 1.26 123.93 108.39
2001 1.53 1.37 131.94 117.19
2002 1.69 1.46 137.83 118.27
Source: CAEM, 2002; 1994-2002: Ley de Hacienda del Estado de México; 1999-2002: Código Financiero del Estado de México y Municipios.

Metropolitan Area ofMexico City
Munich
290 l/person/day 128 l/person/day
25 million people 1.4 million customers
48 m3/s wastewater200-340 m3/s rain
6.5 m3/s wastewater15 m3/s rain
6% water treated 100% water treated
0.16 EUR 1,22 EUR