Embed Size (px)
Citation preview

Agricultural Economics Report No. 337
Mexican Market for Five North DakotaValue-Added Agricultural Products
Rebecca L. LeitchWilliam C. Nelson
SDepartment of Agricultural Economics 0 Northern Plains International Research ProgramNorth Dakota State University * Fargo, ND 58105-5636
October 1995

Table of Contents
List of Tables ..........
List of Appendix Tables .. . . . . . . . . ........
List of Figures ........ ......... . .....
Highlights ........ ... .. .. ....
Introduction . . . . . . . . . . . . . . . . . . . . ..
Purpose . . . . . . . . . . . . . . . . . . . . . . .
Selection of Products .. . . . . . . . . .........
NAFTA and Historical Trade With Mexico ....
Distribution Channels ... . . . . . . . ..........Supermarkets, Discount Warehouses and Wholesale MarketsAbarrotes . . . . . . . . . . . . . . . . . . . . . .Restaurant Chains and Fast Food Chains .. . . ....Hotels, Upscale Restaurants and Convenience Stores .Government Stores .........Traditional Neighborhood Stores ...........Institutional Sector . ..... . . . . ... . ...
Mexican Peso Devaluation and Its Implications For U.S.Exporters . . . . . . . . . . . . . . . . . . . . .
Procedure . . . . . . . . . . . . . . . . . . . . . . . .
Mexican Market for Beef .. . . . . . . . ........
Mexican Market for Processed (Deli) Meats .. . ... .
Mexican Market for Processed Edible Beans and Vegetables
Mexican Market for Breakfast Cereals ....
Mexican Market for Grain-Based Snacks .. . . . .....
Competition . . . . . . . . . . . . . . . . . . . . . . .
Implications for U.S. Exporters .............Beef . . . . . . . . . . . . . . . . . . . . . . . .Processed (Deli) Meats ............. ..Processed Edible Beans and Vegetables ....Breakfast Cereals .. . . . . . . .........Grain-Based Snacks .. . . . . . . . ........
Summary and Conclusions .. . . . . . . . ........
References . . . . . . . . . . . . . . . . . . . . . . .
Appendix Tables . . . . . . . . . . . . . . . . . . . . .
. iii
. iii
iv
.. v
. . 2
. . 2
. . 2
. . 4. 5
. . 5
. . 5
. . 5
. . 6
. . 6
. . 6
. . 6
. . . 7
. . . 8
. . 11
S. 13
S. 17
. . 18
S. 22
S. 22S. 22S. 23S. 23S. 23
. . 24
S. 24
S. 25
. . 27


List of Tables
No. Page
1. Livestock Inventory, Mexico, 1993, 1994, andForecast 1995 . . . . . . . . . . . . . . . . . . . . 8
2. Mexican Market for Beef Products, 1989, 1990, 1993and Forecast 2000 . . . . . . . . . . . . . . . . . . 9
3. Mexican Edible Bean Production and Consumption,1993, 1994, and Forecast 1995 ........... 14
4. Mexican Consumption of Cookies and Crackers 1991to 1993 and 1993 Per Capita Consumption . . . . .. 20
List of Appendix Tables
A. U.S. Exports of Beef to Mexico, 1990 to 1994 . . . . .. .27
B. U.S. Exports of Processed (Deli) Meats to Mexico,1990 to 1994 .. ............. ... . . 27
C. U.S. Exports of Edible Beans to Mexico, 1990 to 1994 . . 28
D. U.S. Exports of Breakfast Cereals to Mexico, 1990to 1994 . . . . . . . . . . . . . . . . . . . . .. . 28
E. U.S. Exports of Grain-Based Snack Foods to Mexico,1990 to 1994 . ............. ...... . 29
iii

List of Figures
No. Page
1. U.S. exports of fresh or chilled beef to Mexico,1990 to 1994 .......... . .. ... ... .. . 10
2. U.S. exports of frozen beef to Mexico, 1990 to 1994 . . 11
3. U.S. exports of processed (deli) meats to Mexico,1990 to 1994 . .......... . ....... . 12
4. U.S. exports of processed edible beans to Mexico,1990 to 1994 . . . . . . . . . . . . . . . . . . . 15
5. U.S. exports of raw edible beans to Mexico,1990 to 1994 . . . . . . . . . . . . . . . . . . . 16
6. U.S. exports of breakfast cereals to Mexico,1990 to 1994 . . . . . . . . . . . . . . . . . . . 18
7. U.S. exports of grain-based snack foods to Mexico,1990 to 1994 . . . . . . . .. . . . . . ... . . . 20
8. U.S. exports of grain-based snack foods to Mexico,1990 to 1994 ......... . . . ...... . . 21
iv

Highlights
Five value-added food products were selected from an initiallist of ten products identified in the 1995 North AmericanMarketing Initiative Opportunity Scan by Senechal, Jorgenson,Hale & Company as products with high potential for export toMexico. The five products included beef, breakfast cereals,processed (deli) meats, processed edible beans and grain-basedsnack foods.
-The recent peso devaluation coupled with Mexico's antiquatedfood distribution infrastructure will make export sales achallenge for any U.S. exporter. However, Mexico's economy isexpected to recover in the near future, improving consumerpurchasing power and resulting in an increase in demand forconsumer-ready food products. The implementation of NAFTA onJanuary 1, 1994 is also expected to have a positive impact onexport opportunities in Mexico.
Of the five identified product categories, several showedgood potential for export opportunities, especially once theMexican economy recovers. Those products with the best exportpotential included boneless cuts of beef; snack foods includingcorn chips, potato chips, and popcorn; and, on a small scale,frozen vegetables. Products with little or no increased exportpotential included processed (deli) meats, processed ediblebeans, and breakfast cereals.
V

MEXICAN MARKET FOR FIVE SELECTED NORTH DAKOTAVALUE-ADDED AGRICULTURAL PRODUCTS
Rebecca L. Leitch and William C. Nelson'
Introduction
Agriculture continues to play a vital role in North Dakota'seconomic base as it remains the most important sector generatingnew income in the state. However, falling farm numbers haveresulted in declines in the level of direct farm employment andin small town retail trade. Despite declines in farm numbers,many alternative jobs have been created in the agricultureindustry, including jobs in agricultural processing andmarketing, agricultural input manufacturing, and farm relatedwholesale and retail trade (Leistritz and Coon 1994).
Self-sufficiency once was the goal of diversified farmers,villages and regions; However, the efficiencies of large-scalespecialized production, processing and transportation systemshave made the self-sufficient unit a very expensive entity tomaintain. Large urban centers are importers of food, fiber andother raw materials and exporters of finished goods. The systemof specialization is now world-wide with countries becoming knownby the characteristics of their exports. A few countries likeJapan and the Netherlands are known for exporting high technologyand high quality products, while others primarily export rawmaterials for others to process and refine.
The United States contains both economies - high technologyexports like computers and aircraft, and unprocessed productssuch as wheat and other agricultural products. Production andexport of high technology products has generated above-averageincomes and broadly based economic growth.
As we have seen in North Dakota, production and export ofunprocessed agricultural products does not stop the decline ofrural communities or the decline in regional population. Farmsproducing the products need less labor, fewer local inputs andare no longer dependent upon local buyers of their product.
Potential for generation of additional jobs and income inNorth Dakota's agricultural sector lies in the export of value-added agricultural products beyond our borders. It is the samerationale that led to the formation of the North Dakota StateMill & Elevator, American Crystal Sugar Cooperative and Dakota
1 Research assistant and professor, respectively, Departmentof Agricultural Economics, North Dakota State University, Fargo.

Growers Pasta. The more value which can be profitably added tothe product prior to sale out of state, the more benefits, incomeand jobs are captured by the people of North Dakota.
Purpose
The 1995 North American Marketing Initiative OpportunityScan by Senechal, Jorgenson, Hale & Company identified a numberof.value-added products with high potential for export to Mexico.Little quantitative information was provided on the trends ofconsumption, production, imports, etc., for these products.
The focus of this study was on the Mexican markets for fivevalue-added agricultural products identified by Senechal,Jorgenson, Hale & Company. The five products include:
1. beef,2. breakfast cereals,3. processed (deli) meats,4. processed edible beans, and5. grain-based snack foods.
Specific objectives include:
1. characterize potential demand for imports by Mexico forselected value-added agricultural products,
2. identify market structure, competition, and distributionchannels for the selected products, and
3. summarize the potential for North Dakota businesses toenter or expand imports to Mexico.
Selection of Products
These products were selected to represent a diverse mix ofthe products identified in the Senechal scan. They representboth intermediate and final levels of processing, both grains andlivestock, and both cereals and legumes. They representindustries which are relatively open to enter, i.e. beef, andwhich are quite closed, i.e., breakfast cereals.
NAFTA and Historical Trade With Mexico
The North American Free Trade Agreement (NAFTA), implementedon January 1, 1994, eliminated import tariffs on many food andagricultural products. Those products whose tariffs were noteliminated upon implementation of the agreement will have theirtariffs gradually reduced over a period from five to 10 years.Although Mexico has been an important trading partner, thesigning of NAFTA greatly increases the potential of Mexico as an
2

importer of Northern Plains products. During the first sixmonths of NAFTA implementation, U.S. exports to Mexico grew atover twice the rate of exports to the rest of the world.Unilateral lowering of tariffs through NAFTA have generated sharpgrowth in Mexico's retailing and consumer goods industry (U.S.International Trade Administration 1995).
Trade between the United States and Mexico increased from$58 billion in 1990 to an estimated $95.7 billion in 1994. U.S.food and agricultural exports expanded from $2.2 billion in 1988to $4.5 billion in 1994, a 105 percent increase (U.S.Agricultural Trade Office 1995e). Since 1986 Mexico has been thethird largest U.S. export market after Canada and Japan (U.S.International Trade Administration 1995). Mexico now accountsfor 9 percent of total U.S. exports (U.S. Agricultural TradeOffice 1994). The North American Free Trade Agreement isexpected to generate even further increases in bilateral trade.
Mexico's population is estimated to be 90 million with anannual growth rate of about 2 percent. The population isexpected to reach 100 million by the year 2000. Mexico is anexceptionally young country with nearly half of its citizensbelow the age of 20.
Sixty-one percent of Mexico's households live in poverty;however, 22 percent of the population, totalling nearly 20million people and growing, have the purchasing power and desireto purchase imported consumer-ready products (U.S. AgriculturalTrade Office 1995e). The remaining 17 percent of Mexico'spopulation fall into the lower middle income class. Mexico'srapid population growth and rising prosperity along with alimited agricultural resource base could increase food demandgreatly during the late 1990s (American Embassy 1994).
Consumer-ready products are leading the way in the growth ofexports of agricultural product to Mexico. This growth is drivenby three main factors:
- the increasing openness of the Mexican market,- the improving affluence and changing tastes of Mexican
consumers, and- the modernization of the food distribution network
(U.S. Agricultural Trade Office 1995e).
In addition', Mexico does not produce enough food on its ownto feed its young and growing population. It also does not havethe infrastructure necessary to produce most consumer-readyproducts (U.S. Agricultural Trade Office 1994). Therefore,Mexico must rely increasingly on imports.
There is a strong preference on the part of Mexicanconsumers for U.S. goods of many types. The advantages of
3

importing from the U.S. include more rapid delivery times, easeof communications, expectations for better follow-up andtechnical support, and familiarity with U.S. products (U.S.International Trade Administration 1995a).
The Mexican processed food industry has about 2,750companies of all sizes and about 15 maquiladoras operating inapproximately 80 cities (U.S. International Trade Administration1995b). A maquiladora is a firm operating under Mexico's maquilaprogram. This program was designed to allow the temporary importon a duty-free basis of equipment and inputs for processing inMexico and the subsequent exports of the products covered(Hinkelman 1994).
A currency devaluation in late 1994 was expected tonegatively impact U.S. exports to Mexico in the short-run. Thedevaluation resulted in decreased purchasing power due to highinterest rates and inflation. Taxes and government revenues werealso raised in an attempt to achieve a budget surplus (U.S.Department of Commerce 1995a). These impacts led to a decline inMexican imports of U.S. goods in the short-run; however, theexpected economic recovery combined with the effects of the NAFTAshow indications of great potential for U.S. exporters.
Distribution Channels
Mexico's food distribution system is outdated andinefficient. Virtually all of the food products imported intoMexico are purchased through Mexican-based distributors orimporters. Only a small number of major retailers and major foodservice chains circumvent the distributors/importers and importdirectly from U.S. exporters. Therefore, U.S. exporters do nothave much choice other than to use the services of the Mexicanfood distributors/importers. These distributors/importersmaintain regular contact with buyers, interface with thegovernment, handle the necessary paperwork and insure thatservice is maintained (U.S. Agricultural Trade Office 1995).
As Mexico's economy recovers and grows, the operation of itsfood distribution system may improve. U.S. exporters may be ableto export directly to the Mexican food sector without having touse the services of import middlemen. Implementation of NAFTAmay also simplify trade transactions.
Food products are distributed through a number of meansincluding supermarkets, discount warehouse markets, wholesalemarkets, mom-and-pop grocery stores (known as abarrotes),restaurant chains, fast-food chains, hotels and upscalerestaurants, convenience stores, government-owned stores, andtraditional neighborhood markets known as mercados and tianguis.The Mexican institutional sector, including hospitals and
4

schools, is also a large food distributorship (U.S. AgriculturalTrade Office 1994).
Supermarkets, Discount Warehouses and Wholesale Markets
Supermarkets in Mexico tend to cater to consumers from thehigher socio-economic classes, and most upscale supermarkets areas modern as U.S. stores. These stores are concentrated in themajor cities and have outlet stores in secondary cities.Mexico's supermarket sector is expanding rapidly with many ofMexico's major supermarket chains entering into alliances withU.S. retailers. Discount warehouse markets are also expanding innumber and make supermarket shopping accessible to an even widerrange of consumer classes. Wholesale markets, known as Centralde Abastos, are available in each Mexican city. These marketsare the distribution centers for virtually all of Mexico'shorticultural production and imports (U.S. Agricultural TradeOffice 1994).
Abarrotes
There are estimated to be more than 200,000 abarrotes inMexico. Abarrotes, small mom-and-pop stores, are where themajority of Mexican consumers purchase their groceries. Thesestores are the primary outlets for groceries in communitiesoutside of the major cities. Refrigeration is very limited andsometimes nonexistent in these stores (U.S. Agricultural TradeOffice 1994).
Restaurant Chains and Fast Food Chains
Restaurant chains cater mainly to businessmen at lunchtimeand families at dinner time. The major restaurant chains useimported products purchased through local distributors. Fast-food chains are the fastest growing component of Mexico's foodservice sector with the majority of fast-food chains affiliatedwith or owned by U.S. companies. Fast-food chains affiliatedwith U.S. companies are more likely to import through their ownsources and channels. Fast-food is costly by Mexican standards,so short-term growth in this sector may be limited (U.S.Agricultural Trade Office 1994).
Hotels, Upscale Restaurants and Convenience Stores
Hotels and upscale restaurants are big users of importedfoods; however, they likely purchase individually throughwholesalers who specialize in this sector. The major five-starhotels and upscale restaurants are concentrated in the resort
5

areas of Cancun and Acapulco and in the larger cities of MexicoCity, Guadalajara and Monterrey. U.S. style convenience storesare growing in number in Mexico, especially in urban areas.These stores carry an assortment of consumer-ready food items(U.S. Agricultural Trade Office 1994).
Government Stores
Federal government-owned stores, or DICONSA stores, areshopped primarily by lower income consumers. In many ruralMexican communities, these stores represent the only retail foodoutlet. There are about 20,000 of these stores in rural Mexicoand about 5,000 on the fringes of major cities. Bulk commoditiessuch as beans, rice, masa, and flour are sold in these stores.Imported commodities sold in these stores are purchased by thecentral office in Mexico City (U.S. Agricultural Trade Office1994).
Traditional Neighborhood Stores
Mercados and tianguis are two types of traditional marketsin Mexico. Mercados are permanent covered neighborhood marketswith merchants selling beef, poultry, cheese, fruits andvegetables. Tianguis are mobile outdoor markets that travelamong neighborhoods selling a wide variety of food and non-fooditems (U.S. Agricultural Trade Office 1994).
Institutional Sector
Mexico's institutional sector is large. Buyers for thissector usually purchase goods from Mexican-based suppliers ratherthan purchasing directly from U.S. exporters. However, there isgreat potential for U.S. exporters in this sector. The Mexicangovernment has an extensive school lunch program, and manyfactories and businesses provide meals to their workers (U.S.Agricultural Trade Office 1994).
Mexican Peso Devaluation and Its Implications For U.S. Exporters
On December 20, 1994 the Government of Mexico (GOM) wasforced to expand the limit of its exchange rate band under thepressure of depleting foreign exchange reserves. A large currentaccount deficit along with a trade deficit led to the decline inforeign exchange reserves. Other contributing factors includedmore attractive interest rates outside Mexico, increasedinvestment opportunities in other developing countries, anduncertainties over a rebel movement in the southern state ofChiapas, resulting in diminished investment flows. The result of
6

the exchange rate band expansion was a 13.2 percent devaluationof the Mexican peso. Since then the peso has devalued from its3.3 pesos/dollar to as high as 8.0 pesos/dollar, reflecting lackof confidence in the markets (U.S. Department of Commerce 1995a).
U.S. exports to Mexico fell dramatically in the firstquarter of 1995; however, demand for U.S. goods is expected torise as the peso stabilizes. The markets have calmed somewhatsince the devaluation as a result of the announcement of theU.S.-led international financing package, a revised economicausterity program announced by the GOM, and an increase inMexico's balance of trade.
The peso has recovered to about 6.7 pesos/dollar, butinterest rates in the private sector remain high. As a result,purchasing activities by manufacturers and consumers have fallendramatically. In addition, the GOM announced in mid-March thatit would attempt to achieve a 4.4 percent budget surplus byincreasing taxes and government revenues. Gasoline prices wereraised by 35 percent while electricity prices were raised by 20percent (U.S. Department of Commerce 1995a). These priceincreases will make transportation and storage of export productsmore expensive, especially if the products are perishable andrequire refrigeration.
Another area affected by the peso devaluation, and that U.S.exporters should be aware of, is financing and payments forshipments. High interest rates make trade financing more crucialand increase the risk to exporters. Exporters may experiencecanceled orders and difficulty in collecting on open account andother non-letter of credit shipments (U.S. Department of Commerce1995a).
The full ramifications of the devaluation and economicrecovery plan will not be known for some time. Short-termexpectations have been dampened; however, long-term opportunitiesin the Mexican market remain attractive to U.S. companies.Mexico's geographic proximity, large population, and the benefitsgenerated by NAFTA create a large, permanent marketplace for U.S.goods and services (U.S. Department of Commerce 1995a).
Procedure
Trade statistics were collected from the National Trade DataBank. Market information was provided by the U.S. AgriculturalTrade and U.S. Meat Export Federation Offices in Mexico City, inaddition to information collected from various associations andorganizations affiliated with each product. A library search wasalso conducted.
7

Mexican Market for Beef
Mexico is the U.S.'s third largest, and most rapidlygrowing, market for exported beef and veal products. Japan andCanada are first and second, respectively. The U.S. supplies allcuts of beef, but dominates the high quality market. Australiaand New Zealand are the main competitors for the lower qualitybeef cuts (U.S. Agricultural Trade Office 1995d).
Beef raised domestically in Mexico is sold primarily throughtraditional markets such as butcher shops and public markets, butconsumers are increasingly purchasing their meat products,especially the higher quality cuts, from supermarkets. Beefimported from the U.S. is more likely to be sold in Mexicansupermarket and food service sectors (U.S. Agricultural TradeOffice 1995d). Domestic production of boxed beef is negligiblewhile beef carcasses are sold non-chilled in local markets whichlack cold storage and cooler facilities (American Embassy 1994a).
The number of cattle raised in Mexico is expected to declinein 1995 due to high slaughter rates and a reduced calf cropresulting from a severe drought affecting the main northerncattle regions (Table 1). In addition, tuburculosis has been aproblem in the Mexican livestock sector.
Table 1. Livestock Inventory, Mexico 1993, 1994, andForecast 1995
ForecastYear 1993 1994 1995
-- - - - 000 head- - - --
Beef cow beginning stocks 12,850 13,000 13,000
Calf crop 9,850 9,500 9,050
Cow slaughter 1,620 1,630 1,620
Calf slaughter 1,700 1,730 1,700
Source: American Embassy, Mexico City, Mexico. LivestockAnnual Report. 1994a.
Consumption of beef by Mexican consumers has been relativelyflat the last several years, but is expected to rebound to about5 percent growth per year. Per capita consumption of beefincreased from 13.2 kilos per capita in 1989 to 15.0 kilos percapita in 1993 (Table 2) (U.S. Agricultural Trade Office 1995d).With reduced domestic production and increasing beef consumption,it appears that Mexican beef producers may not be able to provide
8

the quantity of beef demanded by consumers. Therefore, Mexicomust rely increasingly on imports of beef.
Table 2. Mexican Market for Beef Products, 1989, 1990, 1993and Forecast 2000
ForecastYear 1989 1990 1993 2000
- --- - - 000 metric tons -- - - -
Production 1,163 1,114 1,257 1,350
Imports 10 49 94 400
Consumption 1,173 1,163 1,351 1,750
Per capitaconsumption (kilos) 13.2 13.1 15.0 19.0
Source: U.S. Agricultural Trade Office, The Mexican Market forBeef and Beef Products, Mexico City, Mexico. 1995.
Officials of the U.S. Agricultural Trade Office in MexicoCity believed that the Mexican beef industry will not be able tocompete in the long-term with U.S. beef producers because ofhigher feed costs and inefficiencies in herd management.However, domestic producers may continue to maintain a share ofthe beef market because Mexican consumers are accustomed toMexican grass-fed beef and generally prefer its taste and textureto U.S. grain-fed beef (U.S. Agricultural Trade Office 1995d).
Elimination of trade restrictions by NAFTA will lead toincreased imports of U.S. beef. In addition, U.S. exports ofbeef to Mexico should increase because of competitive prices andhigher quality meat while beef from non-NAFTA countries is stillsubject to high import tariffs. Furthermore, market promotionprograms for U.S. red meats conducted in Mexico by the U.S. MeatExport Federation have opened niche markets. Exportopportunities exist in the medium- and long-terms for increasedmeat sales as a result of these campaigns. Meat sales are alsoexpected to increase with the anticipated growth of the Mexicaneconomy. As a result, 1995 beef imports into Mexico are expectedto increase to a level approximately equal to their earlier peakin 1993 of 136,000 metric tons (American Embassy 1994a).
As a result of the peso devaluation in late 1994, U.S. redmeat exports declined by approximately 70 percent from lateDecember 1994 through January 1995 (U.S. Meat Export Federation1995). However, long-term prospects for continued growth appearto be good. Domestic beef prices may increase due to local
9

inflation resulting from the devaluation, closing the gap withimported beef prices (U.S. Agricultural Trade Office 1995d).
The National Trade Data Bank provides trade statistics oncategories of beef (U.S. Department of Commerce 1995). Two broadcategories of beef exports include fresh or chilled beef andfrozen beef. Each of these categories is further subdivided intothree subdivisions: carcasses and half-carcasses, boneless cuts,and bone-in cuts. Carcasses and half-carcasses are furthersubdivided into veal carcasses and all other carcasses. Bonelessand bone-in cuts are subdivided into processed and nonprocessedcuts (Figures 1 and 2) (Appendix Table A).
30000
25000
20000
r 15000
10000
5000
01990 1991 1992
'Year1993 1994
Figure 1. U.S. exports of fresh or chilled beef to Mexico, 1990to 1994.
Veal full or 1/2 carcassesAll other full or 1/2 carcasses
----- Boneless cuts, processed......... Boneless cuts, not processed-..-..-- Bone-in, processed-.- - - Bone-in, not processed
-
I
-
-
0 . pp0 000. o, 0 OOIW'.0000 0 mw . osmo ...won-···
-L.
a
I
I

16000
14000
12000
10000
§ 8000
6000
4000
2000
01 94
Year
SVeal full or 1/2 carcasses-------- All other full or 1/2 carcasses------ -Boneless cuts, processed............ Boneless cuts, not processed-------- Bone-in cuts, processed
-- - Bone-in cuts
Figure 2. U.S. exports of frozen beef to Mexico, 1990 to 1994.
The term "processed" cuts refers to beef cuts which havebeen ground or comminuted, diced or cut into shapes for stew meator similar uses, rolled or skewered, or specially processed intofancy cuts, special shapes, or otherwise made ready forparticular uses by the retail consumer (U.S. International TradeCommission 1994). Exports of both fresh or chilled and frozenboneless unprocessed beef cuts have increased since 1993 withboneless processed beef showing an overall increase in exportsover the time period of 1990 to 1994.
Mexican Market for Processed (Deli) Meats
Processed or deli meats fall into the harmonizing codecategory of sausages and similar products of meat, meat offal orblood. Figure 3 (Appendix Table B) presents U.S. exports ofprocessed meats to Mexico from 1990 to 1994. "Processed" meat inthis instance refers to meat products which have undergone
11

processing in addition to the cutting processes of beef describedin the previous section.
18000
16000-
14000
12000
-10000
8000
6000
4000
2000 O
O-1991 1992
Year1993 1994
Processed (deli) meats
Figure 3. U.S. exports of processed (deli) meats to Mexico,1990 to 1994.
Processed meats, or deli meats, includes meat products thathave been homogenized, preserved, or otherwise prepared to makeready for consumer use (U.S. International Trade Commission1994). These products may contain seasonings or flavorings,preservatives, or fillers. Examples of processed meats includesandwich meats, hot dogs, ham, sausages, bacon, and the like.This category includes meat products made from beef, pork,poultry, liver, blood, or meat offal.
The U.S. accounts for about two-thirds of the pork productsimported by Mexico. Most of this volume is frozen pork purchasedby Mexican sausage and meat processors for making ham and delimeats. Canada and Denmark provide competition with the U.S. on asmall, but increasing, scale. Canadian pork is perceived to be
12
1990
CO1

higher quality than U.S. pork and imports from Canada are mainlyhigher value cuts (U.S. Agricultural Trade Office 1995c).
Exports of processed (deli) meats to Mexico have beenincreasing at a steady rate from 1990 through 1994 (Figure 3).However, projections made in the American Embassy LivestockAnnual Report indicate that Mexican sausage companies may beginimporting greater quantities of unprocessed meats, specificallypork and pork variety meats, to compete against the risingsausage imports (American Embassy 1994a).
Mexican Market for Processed Edible Beans and Vegetables
It is difficult to estimate the Mexican market potential forprocessed edible beans since there are no official marketstatistics available for this food item. The only U.S. beanvarieties with any market potential in Mexico are black beans andpinto beans. Mexico raises its own preferred bean varieties andMexican consumers generally do not care for other varieties fromthe U.S. (Lehrer 1995). Pinto beans are currently priced lowerthan black beans. The FOB price of pinto beans, mid-bridgeLaredo, Texas, was $550 per metric ton as of March 1, 1995 withblack beans priced at $802 per metric ton (American Embassy1995).
Mexico has been nearly self sufficient in production of dryedible beans, producing 5 percent of the world's dry beanproduction in 1992 (Lucier 1994). Mexico requires imports onlyin years of short crops (Lehrer 1995). Dry edible beanproduction in Mexico is expected to be 1.34 million metric tonsin the 1994/95 marketing year, and 1.35 million metric tons inthe 1995/96 marketing year. Higher Mexican domestic prices fordry edible beans and increased producer incentives offered underthe PROCAMPO (Mexico's farm policy reform program) may lead toincreased domestic output, which may result in a decline inimports of beans from the U.S. (American Embassy 1995).
Alternatively, U.S. exports of edible beans to Mexico couldpotentially increase in the future as the Mexican economyimproves and as tariff reductions under NAFTA make U.S. beansmore competitively priced. With potential increases of U.S.beans entering the market, Mexican bean producers may switch tohigher priced cash crops (Fossum 1995).
The average area planted to dry beans in Mexico from 1984 to1991 was 4.7 million acres with an average production level of798,000 metric tons of beans for the same time period. Landcosts in Mexico are high, with a price of $3,200 per acre in 1994for land in the state of Sinaloa, a prime agricultural area.Bean crops in this state are irrigated without exception. Waterrights cost about $30 per crop per year, with two crops grown per
13

year. Land in Chihuahua, another agricultural area, costs about$2,500 per acre for land with surface water access and about $800per acre for dry land (McGill 1994).
Processed beans would likely be in the form of a canned ordehydrated bean product. The Mexican processed bean industry hassuffered from a lack of modernization due to the availability ofcheap labor. Canned bean products have not been readily acceptedby Mexican consumers and are not expected to become a staple fooditem any time soon. Canned bean products cost about $1 per poundin the early 1994 (McGill 1994). Mexican consumers tend toprefer the traditional method of preparing meals of edible beans,purchasing raw beans at open air markets (Fossum 1995).
The consumption of edible beans in Mexico is comprised of 95percent dry beans and 5 percent processed beans (canned,dehydrated). Because of the peso devaluation, there is virtuallyno market for imported processed beans in Mexico (Lehrer 1995).The Mexican per capita consumption of dry edible beans, 15kilograms (33 pounds) per year, is one of the highest in theworld. Dry bean consumption is expected to increase by about 3.8percent to 1.35 million metric tons in marketing year 1994/95 andby 3.7 percent to 1.4 million metric tons in marketing year1995/96 (Table 3). Since dry beans are a staple food item inMexico, it is expected that consumption will increase as lowerand middle income consumers switch back to beans because of thepeso devaluation which has led to a decline in their purchasingpower (American Embassy 1995). Upper class citizens, withgreater purchasing power, would likely be the only group topurchase processed beans in Mexico. However, this group is small(Fossum 1995).
Table 3. Mexican Edible Bean Production and Consumption 1993,1994, and Forecast 1995.
ForecastMarketing Year 1993/94 1994/95 1995/96
- - - 000 metric tons - - -
Production 1,300 1,340 1,350
Imports 75 40 75
Consumption 1,300 1,350 1,400
Exports 37 30 30
Source: American Embassy, Mexico City, Mexico. Grain andFeed Annual Report. 1995.
14

The categories of edible beans included in the NationalTrade Data Bank include many bean varieties. The species ofedible beans included in each category are the Vigna species andthe Phaseolus species. The Vigna species includes asparagusbeans, azuki beans, and mung beans. These are all Asian beans,and, therefore, it is assumed there are little or none of thesebeans exported from the U.S. The Phaseolus species includes navybeans and pinto beans in addition to french beans, green beans,haricot beans, kidney beans, runner beans, salad beans, snapbeans, string beans, and wax beans. U.S. exports of processededible bean products and dry edible beans to Mexico are presentedin Figures 4 and 5 (Appendix Table C).
I C10rr
800
S600
400
200
01
'Year
Frozen, prepared or preserved without vinegar or acetic acidFrozen, uncooked or cooked by steaming or boilingNot frozen, shelled, canned driedNot frozen, shelled, not canned dried
Figure 4. U.S. exports of processed edible beans to Mexico,1990 to 1994.
15
I ...........

1991 1992Year
- - - Navy beans---- -Pinto beans
Figure 5. U.S. exports of dry edible beans to Mexico, 1990 to1994.
In addition to processed edible beans, processed fruits andvegetables are potential export food items. Although Mexicanstatistics are imprecise, production of processed fruits andvegetables in 1993 was estimated at about $445 million and wasgrowing at about 14 percent per year. Domestic production iscontrolled by about 30 Mexican processors that account for 90percent of domestic production (U.S. Agricultural Trade Office1995a).
Consumption of processed fruits and vegetables in Mexico hasbeen increasing by about 38 percent per year (U.S. AgriculturalTrade Office 1995a). This marked increase in consumption may bedue to the increased domestic quantity supplied as a result ofincreased domestic production and imports, growing affluence andchanging taste preferences among Mexican consumers, andmodernization of retail food outlets.
16
120000
100000
80000
S60000
C>40000-
20000 -
0
1990 1993 1994
I-r
I
-
- OEM=
h
LI
4% 4
I -
%..FI

The import market for processed fruits and vegetables inMexico is growing rapidly with imports increasing at about 45percent per year. In 1993, Mexico imported $64 million ofprocessed vegetables. The U.S. controlled 79 percent of Mexico'simport market for processed vegetables with export sales toMexico of $51 million. The fastest growing competitor with theU.S. for processed vegetables is Spain (U.S. Agricultural TradeOffice 1995a).
The most important imported processed vegetables in Mexicoinclude potatoes, canned sauces, sweet corn, mushrooms, olives,and canned tomatoes. Potatoes were the fastest growing vegetableimport (U.S. Agricultural Trade Office 1995a). Excluding olives,the remainder of the vegetables listed are potential exportproducts that can be raised and processed in North Dakota.
The 1995 tariff rate on mushrooms, potatoes, vegetablepreserves and sweet corn is 16 percent. Under the tariffreduction schedule prescribed under NAFTA, the pre-NAFTA tariffrate is to be reduced in ten equal yearly stages, beginningJanuary 1, 1994, and tariffs will be completely eliminated byJanuary 1, 2003 (U.S. Agricultural Trade Office 1995a). Thislowering of tariffs should escalate future U.S. exports ofprocessed fruits and vegetables to Mexico.
Market information on frozen vegetables is only availablefor sweet corn, green beans, mixed vegetables, and a category ofother vegetables. In recent years, these products have becomeincreasing popular, especially among the middle and upperclasses. Unfortunately, since these products are relatively new,accurate information about total Mexican consumption is notavailable (U.S. Agricultural Trade Office 1994a).
Generally, most vegetable products in Mexico are purchasedfresh at local markets. The import market for frozen vegetableshas been relatively small since frozen vegetables are largelysupplied domestically by Mexican food processors. However,Mexican food production facilities are not as technicallyadvanced or as large as U.S. facilities. In spite of theseconditions, domestic production is increasing rapidly. Mexicanimports of frozen vegetables have been increasing, but on arelatively small scale. Competition from Mexican processors,combined with an inadequate transportation system and the lack oflocal refrigeration facilities make it difficult for importers tocompete (U.S. Agricultural Trade Office 1994a).
Mexican Market for Breakfast Cereals
Few statistics and little market information is available onthe market for breakfast cereals in Mexico. This information islikely highly proprietary due to the structure of this industry.
17

The breakfast cereal industry is dominated by five large foodprocessing companies including Kellog's, Ralston's, Post, Quaker,and General Mills. According to researchers in the U.S.D.A.Foreign Agricultural Service, the U.S. Congress does not approvemarket studies by the Foreign Agricultural Service because of theindustry structure (U.S. Department of Agriculture 1995). U.S.exports of breakfast cereals to Mexico increased 251 percent from1990 to 1994 (Figure 6)(Appendix Table D). However, this growthhas likely been among the large cereal processors.
14000
12000
10000
8000
6000
4000
2000
01990 1991 1992 1993
Year
-Breakfast cereals- - ---- -Precooked or otherwise prepared, frozen----- Precooked or otherwise prepared, not frozen
1994
IFigure 6. U.S. exports of breakfast cereals to Mexico, 1990
to 1994.
Mexican Market for Grain-Based Snacks
Imports of snack foods by Mexico (including corn chips,potato chips, popcorn, peanuts, and mixed nuts) expanded from $50million in 1992 to over $69 million in 1993 and have beenexpanding at over 20 percent per year, with the U.S. maintaininga 98 percent market share (U.S. Agricultural Trade Office 1995e).
18
.

The U.S. is by far the dominant supplier for all snack foodsimported into Mexico; however, Bimbo, a Mexican food processor,along with Marinela, a wholly-owned subsidiary, dominate nearly80 percent of the retail shelf space for sweetbreads and cookies(U.S. Agricultural Trade Office 1995b).
Retail outlets for snack foods include supermarkets,convenience stores, and small mom and pop stores (abarrotes).Shelf-space for snack foods in supermarkets is limited, butexpanding rapidly. Convenience stores also have limited shelf-space for snack foods items; however, what shelf-space there isavailable is typically stocked with consumer-ready items,including snack foods. Snack food items of all types are alsoprevalent in abarrotes (U.S. Agricultural Trade Office 1995e).
The U.S. controls the Mexican corn chip import market with98 percent of total Mexican imports. Germany and Canada provideminimal competition with the U.S. for corn chips. The U.S. alsodominates the Mexican domestic market, where the largest Mexicansnack producer, Sabritas, is owned by Frito Lay (Pepsico).Barcel (Bimbo), a Mexican snack food processor, and a few smallerMexican companies provide the balance of the competition. TheMexican market for corn chips is expected to expand by 15 to 20percent per year through the end of the decade (U.S. AgriculturalTrade Office 1995e).
The U.S. also dominates the market for potato chips inMexico, supplying virtually 100 percent of the import market;competition is limited to nonexistent. Market growth for potatochips in Mexico is expected to be 10 to 15 percent per year.With popcorn, the U.S. controls 98 percent of the Mexican importmarket. U.S. exports of popcorn to Mexico are expected to growat a minimum of 10 to 15 percent per year in the foreseeablefuture. Canada is the strongest competitor for popcorn. Mexicancompetitors include brands of the Sabritas and Barcel companies(U.S. Agricultural Trade Office 1995e).
Although reliable statistics on the Mexican market forsnacks such as cookies and crackers are not available, estimatesmade by officials of the U.S. Agricultural Trade Office in MexicoCity indicate declining consumption of cookies and crackers overthe period from 1991 to 1993 (Table 4) (U.S. Agricultural TradeOffice 1995b).
Mixed nuts snacks include almonds, pistachios, sweet peas,nuts, peanuts, and pumpkin seeds (U.S. Agricultural Trade Office1995d). Focusing on North Dakota products, sweet peas andpumpkin seeds could be considered potential export items. U.S.exports of grain-based snack foods to Mexico are presented inFigures 7 and 8 (Appendix Table E).
19

Table 4. Mexican Consumption of Cookies and Crackers 1991 to1993 and 1993 Per Capita Consumption
1993 Per capita1991 1992 1993 consumption
-(000) metric tons- (kg)
Cookies & crackers 241 238 217 2.4
Source: U.S. Agricultural Trade Office, The Mexican Market forBakery Products, Mexico City, Mexico. 1995.
1UUU
800
• 600
400
200
01
Year94
SCorn chips------ Crispbread--- G- ingerbread and the like............ Rusks
Figure 7. U.S. exports of grain-based snack foods to Mexico, 1990to 1994.
20

12000
10000
8000
S6000
4000
2000
01
Year
Sweet biscuits, waffles and wafers, frozen--------- Sweet biscuits, waffles and wafers, not frozen------ -Potato chips
Figure 8. U.S. exports of grain-based snack foods to Mexico, 1990to 1994.
Mexican imports of U.S. corn chips fluctuated greatly in the1990 to 1994 time period. A drop in imports is observed from1990 to 1991 followed by an increase in imports from 1991 to1992. A decline from 1992 to 1993 was followed by an slightincrease in 1994. Rusks and crispbread have shown a generalincrease in imports since 1992 while imports of gingerbread andthe like have remained relatively flat. Imports of U.S. potatochips also increased dramatically since 1992.
Over the last three years, Mexican preference for U.S.bakery products such as sweet biscuits, cakes, and cookies hasincreased because of the wide variety available in supermarkets.Opportunities continue to be strong, especially for frozenproducts (U.S. International Trade Administration 1995c).
21
Competition
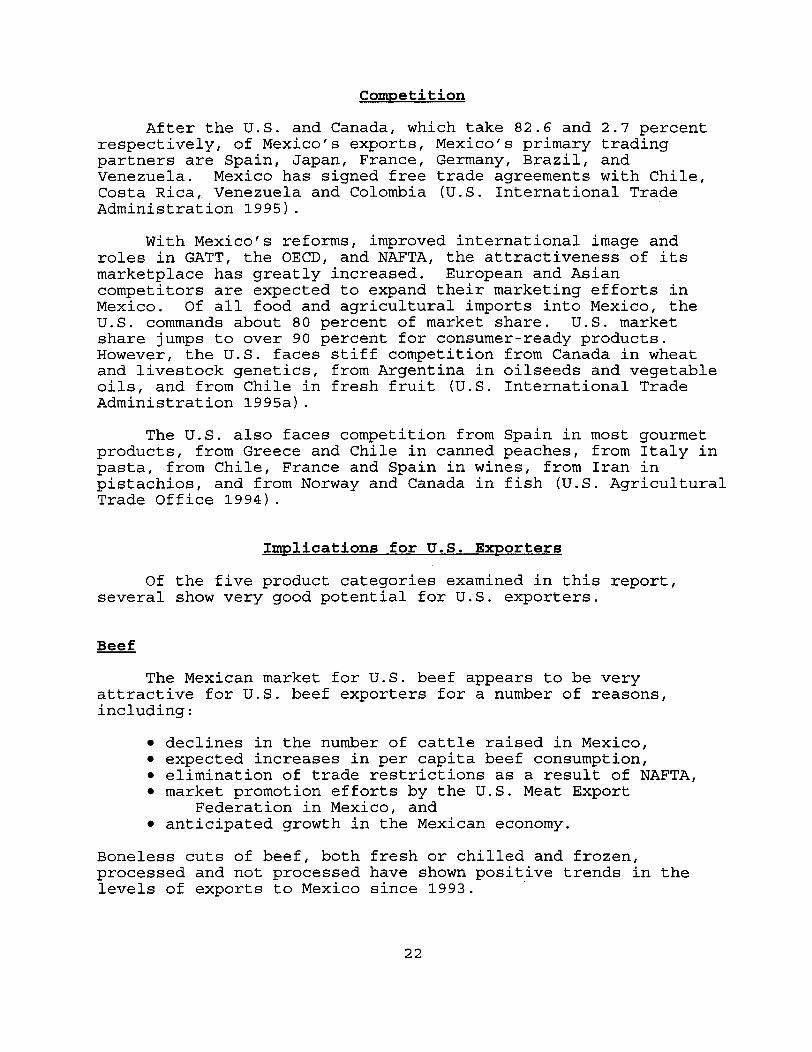
After the U.S. and Canada, which take 82.6 and 2.7 percentrespectively, of Mexico's exports, Mexico's primary tradingpartners are Spain, Japan, France, Germany, Brazil, andVenezuela. Mexico has signed free trade agreements with Chile,Costa Rica, Venezuela and Colombia (U.S. International TradeAdministration 1995).
With Mexico's reforms, improved international image androles in GATT, the OECD, and NAFTA, the attractiveness of itsmarketplace has greatly increased. European and Asiancompetitors are expected to expand their marketing efforts inMexico. Of all food and agricultural imports into Mexico, theU.S. commands about 80 percent of market share. U.S. marketshare jumps to over 90 percent for consumer-ready products.However, the U.S. faces stiff competition from Canada in wheatand livestock genetics, from Argentina in oilseeds and vegetableoils, and from Chile in fresh fruit (U.S. International TradeAdministration 1995a).
The U.S. also faces competition from Spain in most gourmetproducts, from Greece and Chile in canned peaches, from Italy inpasta, from Chile, France and Spain in wines, from Iran inpistachios, and from Norway and Canada in fish (U.S. AgriculturalTrade Office 1994).
Implications for U.S. Exporters
Of the five product categories examined in this report,several show very good potential for U.S. exporters.
Beef
The Mexican market for U.S. beef appears to be veryattractive for U.S. beef exporters for a number of reasons,including:
* declines in the number of cattle raised in Mexico,* expected increases in per capita beef consumption,* elimination of trade restrictions as a result of NAFTA,* market promotion efforts by the U.S. Meat Export
Federation in Mexico, and* anticipated growth in the Mexican economy.
Boneless cuts of beef, both fresh or chilled and frozen,processed and not processed have shown positive trends in thelevels of exports to Mexico since 1993.
22

Processed (Deli) Meats
U.S. exports of processed (deli) meats to Mexico increasedsteadily over the period of 1990 to 1994. However, exports ofprocessed meats are expected to level off, or decline, due tocompetition from Canada for pork and anticipated increases inproduction of processed meats by Mexican sausage companies.Consequently, the export potential of processed meats to Mexicomay not be as attractive as the potential for beef if theseexpectations of competition and Mexican production becomereality.
Processed Edible Beans and Vegetables
Mexican market potential for U.S. exporters of processededible beans is difficult to estimate due to the lack of specificmarket statistics. Mexican per capita consumption of dry ediblebeans is expected to increase. This increase, however, maylikely be an increase in consumption of dry beans rather thanprocessed, consumer-ready beans as lower and middle incomeconsumers switch back to beans as a staple food item with thedecline in their purchasing power resulting from the pesodevaluation. In addition, farm policy reform programs in Mexicomay lead to increased Mexican production of beans resulting in adecline in imports from the U.S. For these reasons, thepotential to export processed edible beans to Mexico appears tobe less than promising.
Processed and frozen vegetables appear to have slightlybetter export potential than processed edible beans, but only ona small scale. Mexican production of processed fruits andvegetables was growing at a rate of about 14 percent per year in1993 with consumption increasing at around 38 percent per year.The gap between domestic production and increasing consumptionhas been met by increasing imports, with the U.S. controllingabout 79 percent of Mexico's imports of processed vegetables.Domestic production is increasing, however, and inadequatetransportation and refrigeration may make it difficult forimporters to compete.
Breakfast Cereals
The U.S. breakfast cereal industry is dominated by fivemajor food companies. Due to the nature of this industry, itwould be extremely difficult for smaller, independent cerealproducers to compete without a specialty product to differentiatethem from the major cereal processors.
23

Grain-Based Snacks
The U.S. is the dominant supplier of all snack foodsimported by Mexico. Items with good potential for expansion inthe Mexican market include corn chips, expected to grow at a rateof 15 to 20 percent per year; potato chips, expected to grow at10 to 15 percent per year; and popcorn, expected to grow at 10 to15 percent per year. Mexican consumption of cookies and crackersdeclined from 1991 to 1993, but may increase in the future withthe anticipated growth in Mexico's economy. U.S. exports ofrusks, crispbread, and potato chips to Mexico have beenincreasing since 1992 (see Appendix Table E).
Summary and Conclusions
This brief review of Mexican markets reveals severalopportunities for North Dakota processors and potentialprocessors. These include boneless cuts of beef (both chilledand frozen), deli meats, vegetables, and grain-based snacks.Based on recent trends and opinions of persons in the industry,imports of these items into Mexico will increase.
As published data do not provide sufficient detail, directcontact with importers/distributors in Mexico and more specificdetailed market research must occur prior to making any decisionconcerning entry into the Mexican market. In addition, contactwith American brokers experienced in the Mexican market andpreparation of marketing and business plans is recommended.
Changes in the Mexican market are occurring rapidly;therefore, this study has a short shelf life. However, asinterest and specific requests occur, updates can be done quicklydue to the investment in this study.
24

References
American Embassy. 1994. Agricultural Situation Report forMexico. USDA/FAS, Mexico City, Mexico. Report Code MX4064.
American Embassy. 1994a. Livestock Annual Report. USDA/FAS,Mexico City, Mexico. Report Code: MX4053.
American Embassy. 1995. Grain and Feed Annual Report.USDA/FAS, Mexico City, Mexico. Report Code: MX5023.
Fossum, Bob. 1995. General Manager, Johnstown Bean Company,Johnstown, ND. Personal interview.
Hinkelman, Edward G., Series Editor. 1994. Mexico Business: thePortable Encyclopedia For Doing Business in Mexico. WorldTrade Press, San Rafael, CA.
Lehrer, Marvin. 1995. Director, U.S. Agricultural Trade Office,Mexico City, Mexico. Fax communication.
Leistritz, F.L. and Randal C. Coon. 1994. "The Role ofAgriculture in the North Dakota Economy." North Dakota FarmResearch, Winter.
Lucier, Gary. 1994. "Economic Trends in World and U.S. DryEdible Beans." Michigan Dry Bean Digest, 18(3):18-21.
McGill, John A., Jr. 1994. "Mexico-Michigan Bean ConnectionContinues to Grow." Michigan Dry Bean Digest, 18(3):11-14.
Office of Business Analysis. 1995. National Trade Data Bank.Economics and Statistics Administration, U.S. Department ofCommerce, Washington, D.C.
Senechal, Jorgenson, Hale & Company. 1995. North AmericanMarketing Initiative Opportunity Scan. Danvers, MA.
U.S. Agricultural Trade Office. 1994. Market Briefs: SellingU.S. Food and Agricultural Products in Mexico. U.S.Department of Agriculture, Foreign Agricultural Service,Mexico City, Mexico.
U.S. Agricultural Trade Office. 1994a. Market Briefs: TheMexican Market for Frozen Foods. United States Departmentof Agriculture, Foreign Agricultural Service, Mexico City,Mexico.
U.S. Agricultural Trade Office. 1995. Building a Food ProductsDistribution System in Mexico. United States Department ofAgriculture, Foreign Agricultural Service, Mexico City,Mexico.
25

U.S. Agricultural Trade Office. 1995a. Market Briefs: TheMexican Market for Processed Fruits & Vegetables. UnitedStates Department of Agriculture, Foreign AgriculturalService, Mexico City, Mexico.
U.S. Agricultural Trade Office. 1995b. Market Briefs: TheMexican Market for Bakery Products. United StatesDepartment of Agriculture, Foreign Agricultural Service,Mexico City, Mexico.
U.S. Agricultural Trade Office. 1995c. Market Briefs: TheMexican Market for Pork and Products. United StatesDepartment of Agriculture, Foreign Agricultural Service,Mexico City, Mexico.
U.S. Agricultural Trade Office. 1995d. Market Briefs: TheMexican Market for Beef and Beef Products. United StatesDepartment of Agriculture, Foreign Agricultural Service,Mexico City, Mexico.
U.S. Agricultural Trade Office. 1995e. Market Briefs: TheMexican Market for Snack Foods. United States Department ofAgriculture, Foreign Agricultural Service, Mexico City,Mexico.
U.S. Department of Agriculture. 1995. Personal communication.Grain and Feed Division, Foreign Agricultural Service,Washington, D.C.
U.S. Department of Commerce. 1995a. Implications for U.S.Exporters of the Devaluation and Economic Situation inMexico. NAFTA Facts, Document #4008. Washington, D.C.
U.S. International Trade Administration. 1995. "Mexico:Economic Trends and Outlooks." Country Commercial Guides.U.S. Department of Commerce. Washington, D.C.
U.S. International Trade Administration. 1995a. "Mexico:Commercial Overview." Country Commercial Guides. U.S.Department of Commerce. Washington, D.C.
U.S. International Trade Administration. 1995b. "Mexico:Processed Foods." Market Research Reports, Report CodeISA9308, U.S. Department of Commerce. Washington, D.C.
U.S. International Trade Administration. 1995c. "Mexico: Dataon Best Prospects." Country Commercial Guides. U.S.Department of Commerce. Washington, D.C.
U.S. International Trade Commission. 1994. Harmonized TariffSchedule of the United States. USITC Publication 2690, U.S.Government Printing Office, Washington, D.C.
U.S. Meat Export Federation. 1995. Noticarnes. 2(1).
26

Appendix Tables
Table A. U.S. Exports of Beef to Mexico, 1990
1990 1991 1992
to 1994.
1993 1994
- - - - - - - - - - - - KG/Year -
Fresh or chilled beef
Full & 1/2 carcasses
Veal
All other
Boneless cutsProcessed
Not processedBone-in cuts
ProcessedNot processed
Frozen beef
Full & 1/2 carcasses
Veal
All other
Boneless cuts
Processed
Not processedBone-in cuts
Processed
Not processed
90,218
14,572,727
613,462
23,838,547
197,180
20,269,771
238,173 1,314,481 5,659,244
1,679,966 6,619,057 12,587,199
591,512 2,819,876 5,223,470
1,000,607 1,372,792 1,940,201
787
1,852,499
97,757
5,528,433
650,234 2,327,074
6,153,174 14,590,216
151,406
1,165,024
609,276
3,920,137
31,610
1,035,632
2,425,606
14,727,209
668,213
3,273,318
259,983
9,704,122
2,844,592
12,199,694
83,026
9,427,561
9,965,629
28,751,418
841,175 2,081,863
1,520,339 3,180,415
9,718 279
645,704 423,383
2,523,511 4,132,151
5,773,058 10,659,404
286,418 378,262
1,742,490 1,469,816
Source: Office of Business Analysis. 1995. National Trade DataBank. Economics and Statistics Administration, U.S.Department of Commerce, Washington, D.C.
Table B. U.S. Exports of Processed (Deli) Meats to Mexico, 1990to 1994.
1990 1991 1992 1993 1994
- - - - - - - - - - - - - KG/Year - - - - - - - - - - - -
Processed meats 1,734,372 6,736,754 7,183,146 13,570,450 16,325,046
Source: Office of Business Analysis. 1995. National Trade DataBank. Economics and Statistics Administration, U.S.Department of Commerce, Washington, D.C.
27
__

Table C. U.S. Exports of Edible Beans to Mexico, 1990 to 1994a.
1990 1991 1992 1993 1994
- - KG/Year - - - - -
Frozen BeansPrepared or preservedotherwise than byvinegar or acetic acid
Uncooked or cooked bysteaming or boiling inwater
Not Frozen BeansPrepared or preservedotherwise than byvinegar or acetic acid
Shelled, canned dried
Shelled, other thancanned dried
Dried Shelled Beans, Not Seed
Navy beans
Pinto beans
75,360 159,337 61,273 3,459 45,127
390,808 202,422 338,594 213,954 234,241
872,481 220,835 65,786 198,549 262,012
119,931 368,820 121,914 117,752 396,923
538,146 432,771 191,526 715,231 1,266,284
115,686,764 30,311,443 15,780,707 10,670,507 14,138,648
a Statistics were not available for beans, frozen or not frozen,which were prepared or preserved with vinegar or acetic acid.
Source: Office of Business Analysis. 1995. National Trade DataBank. Economics and Statistics Administration, U.S.Department of Commerce, Washington, D.C.
Table D. U.S. Exports of Breakfast Cereals to Mexico, 1990 to1994.
1990 1991 1992 1993 1994
- - - - - - - - -- -- - KG/Year - - - - - - - - - - -
Breakfast cerealsa 3,826,649 2,637,855 11,669,823 10,224,505 13,446,787
Precooked or otherwise preparedb
Frozen 73,576 27,249 8,093 24,106 33,180
Not frozen 145,634 207,303 441,677 1,241,506 2,043,693
a Prepared foods obtained by the swelling or roasting of cerealsor cereal products (for example, cornflakes); cereals otherthan corn, in grain form, precooked or otherwise prepared.
b Other than corn (maize).Source: Office of Business Analysis. 1995. National Trade Data
Bank. Economics and Statistics Administration, U.S.Department of Commerce, Washington, D.C.
28
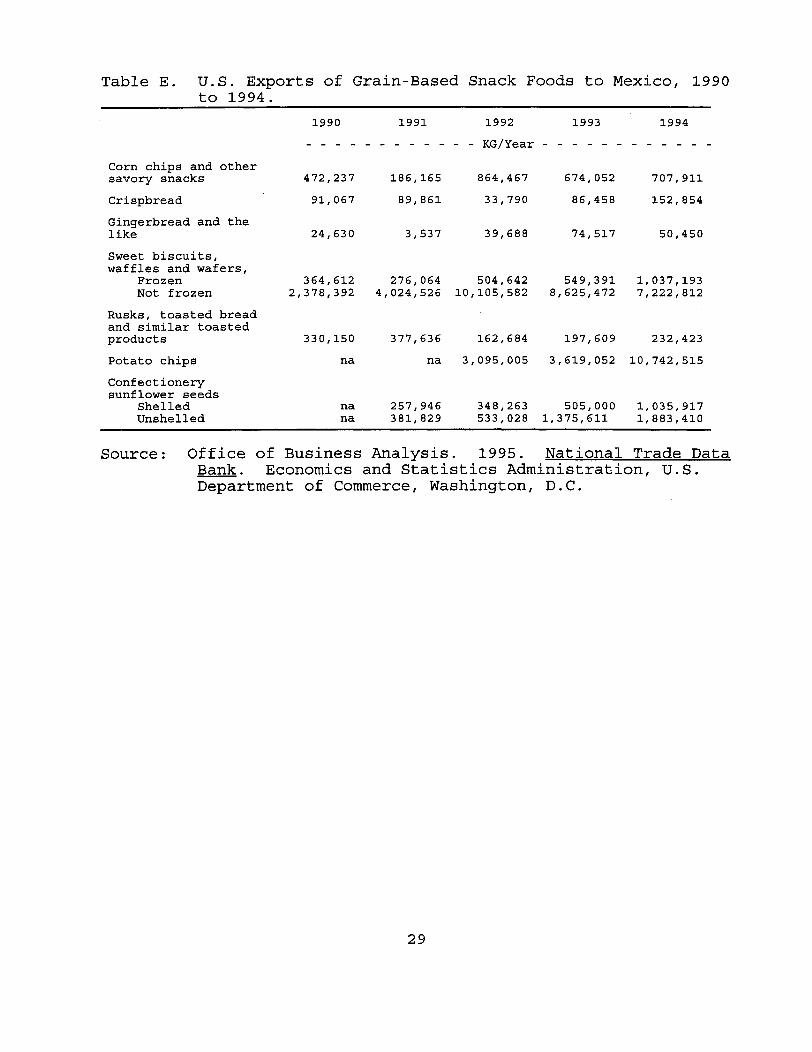
U.S. Exports of Grain-Based Snack Foods to Mexico, 1990to 1994.
1990 1991 1992 1993 1994
Corn chips and othersavory snacks
Crispbread
Gingerbread and thelike
Sweet biscuits,waffles and wafers,
FrozenNot frozen
Rusks, toasted breadand similar toastedproducts
Potato chips
Confectionerysunflower seeds
ShelledUnshelled
- - - - - - - - - - KG/Year - - - - - -
472,237 186,165 864,467 674,052 707,911
91,067
24,630
89,861
3,537
33,790
39,688
364,612 276,064 504,6422,378,392 4,024,526 10,105,582
86,458 152,854
74,517 50,450
549,391 1,037,1938,625,472 7,222,812
330,150 377,636 162,684 197,609 232,423
na na 3,095,005 3,619,052 10,742,515
na 257,946 348,263 505,000na 381,829 533,028 1,375,611
1,035,9171,883,410
Source: Office of Business Analysis. 1995. National Trade DataBank. Economics and Statistics Administration, U.S.Department of Commerce, Washington, D.C.
29
Table E