Embed Size (px)
Citation preview
This PDF is a selection from a published volume from theNational Bureau of Economic Research
Volume Title: Mexican Immigration to the United States
Volume Author/Editor: George J. Borjas, editor
Volume Publisher: University of Chicago Press
Volume ISBN: 0-226-06632-0; 978-0-226-06632-5
Volume URL: http://www.nber.org/books/borj06-1
Conference Date: February 11-12, 2005
Publication Date: May 2007
Title: Gender and Assimilation Among Mexican Americans
Author: Francine D. Blau, Lawrence M. Kahn
URL: http://www.nber.org/chapters/c0096
2.1 Introduction
A steady flow of new immigration has led the foreign-born share of theU.S. population to rise from 4.8 percent in 1970 to 11.1 percent in 2000.Perhaps more dramatically, the percentage of the accumulated foreign-born population that came from Europe or Northern America fell from70.4 to 18.5 percent between 1970 and 2000, with a corresponding increasein the Asian and Latin American share from 28.3 percent in 1970 to 78.2percent in 2000 (see the U.S. Bureau of the Census Web site at http://www.census.gov). By far, the largest source of immigration in recent years hasbeen Mexico. For instance, from 1991 to 2000, 24.7 percent (2.25 million)of the 9.095 million immigrants to the United States came from Mexico,with the next largest source, the Philippines, sending only 5.5 percent(504,000) of the total. And Mexican immigration has been growing in bothabsolute and relative terms as immigration from Mexico was 454,000 (13.7percent of the total) in 1961–1970.1 By 2003, people of Mexican heritage
57
2Gender and Assimilation among Mexican Americans
Francine D. Blau and Lawrence M. Kahn
Francine D. Blau is the Frances Perkins Professor of Industrial and Labor Relations andLabor Economics at Cornell University, and a research associate of the National Bureau ofEconomic Research. Lawrence M. Kahn is professor of labor economics and collective bar-gaining at Cornell University.
The authors thank the Russell Sage Foundation for research support. We are grateful toJoseph Altonji; George Borjas; Darren Lubotsky; an anonymous referee and participants atthe NBER Mexican Immigration Conference (February 2005) and Preconference (August2004) in Cambridge, Massachusetts for helpful comments and suggestions; Chris Woodrufffor providing us with tabulations of Mexican Census data; and Fidan Kurtulus for collectinglabor force participation data. Portions of this paper were written while the authors were vis-iting fellows in the economics department of Princeton University, supported by the Indus-trial Relations Section. We are very grateful for this support.
1. These figures are taken from U.S. Department of Homeland Security, Office of Immi-gration Statistics (2003), table 2.
comprised fully 8.2 percent of the U.S. adult population, a figure that isabout 70 percent as large as the incidence of the black non-Hispanic pop-ulation (11.7 percent).2
In addition to making up a large and growing portion of the U.S. popu-lation, Mexican Americans are, on average, poorer and less educated thanU.S. residents of European heritage (Browne 1999; Cobb-Clark and Hilde-brand 2004). Since it is well known that poverty in the United States fallsdisproportionately on women and children (Blank 1997), a study of genderand labor market outcomes of Mexican Americans could yield importantinsights into this issue. And, of particular relevance to the issues consid-ered in this paper, Mexican Americans come from an origin country witha much more traditional division of labor in the family and lower relativeand absolute female human capital levels than the United States. For ex-ample, female labor force participation rates remain considerably lower in Mexico than in the United States, although the difference has declinedin recent years: the Mexican female participation rate was 15.6 percent in1970 and 39.4 percent in 2000, compared to rates of 41.5 and 58.8 percentin the United States (see the International Labour Organization [ILO] Website at http://www.laborsta.ilo.org).3 Fertility was higher in Mexico than inthe United States, although, in this case, the difference has declined con-siderably in recent years, reflecting a sharp drop in fertility in Mexico: thetotal fertility rate in Mexico was 6.5 total births per woman as of 1970 and2.8 as of 1998, compared to U.S. rates of 2.5 and 2.1. Adult illiteracy ratesfor women in Mexico were 22 percent in 1980 and 11 percent in 1998, com-pared to male rates of 14 percent and 7 percent, respectively; for the UnitedStates, illiteracy was below 5 percent in all cases (Blau, Ferber and Winkler2002, 384–85). Moreover, according to Mexican Census data for 1990,among those age sixteen–sixty-five, men averaged 7.0 years of schooling,compared to only 6.4 for women.4 Educational attainment rose for bothmen and women in Mexico between 1990 and 2000: in 2000, men averaged8.1 years and women 7.6 years. These are of course much lower than aver-age U.S. schooling levels of thirteen–fourteen years for men and womenaccording to Current Population Survey (CPS) data. And, while women’sschooling in Mexico grew very slightly faster than men’s between 1990 and
58 Francine D. Blau and Lawrence M. Kahn
2. This is based on data from the March 2003 Current Population Survey.3. Especially in developing countries, participation rates may be an incomplete measure of
economic activity because they often do not count subsistence and family-based activities, al-though it might be argued that an indicator focusing on market-based work is not altogetherinappropriate in that it is this type of involvement that is most important in the United States.A measure that implicitly adjusts for these problems (at least to the extent that they affect menand women similarly) is the ratio of female to male participation rates. It tells a similar storyto the female participation rates: these ratios were .227 (Mexico) and .531 (United States) in1970, and .472 (Mexico) and .781 (United States) in 2000.
4. We are grateful to Chris Woodruff for supplying this information from the Mexicancensus.
2000, a noticeable gender gap in educational attainment among Mexicansremained. In light of these large differences between the labor market sta-tus and preparedness of women in Mexico and those in the United States,Mexico represents a potentially interesting case in which to examine the as-similation of women into the U.S. labor market. Do Mexican immigrantfamilies exhibit a more traditional division of labor than U.S. families asMexican residents do? To what extent do gender patterns in labor marketattachment and success among Mexican Americans converge to U.S.-native patterns within and across generations?
In this paper, we use the March CPS Annual Demographic Files for1994–2003 to study the assimilation of Mexican American women andmen, including both Mexican immigrants and the native born of Mexicanheritage. While many analyses of immigration use the decennial censuses,we employ the CPS files because, since 1994, the Current Population Sur-veys contain information not only on immigration status but also on thebirthplace of respondents’ parents, thus allowing for intergenerationalcomparisons. Data on parents’ birthplace have not been available in thecensus since 1970. The outcomes we consider include marriage and fertil-ity, labor supply, unemployment, wages, and occupation and industry dis-tribution. The repeated cross-sections in the CPS allow us to examine is-sues of assimilation among immigrants from a variety of arrival cohortsusing the synthetic cohort approach proposed in Borjas (1985). Moreover,we also study assimilation across generations by analyzing these outcomesfor second- and third-generation Mexican Americans. Examining progressacross generations provides a more comprehensive study of assimilationthan the traditional immigration literature that has, for the most part, fo-cused on success at arrival and over time in the United States for those bornin other countries. The children of immigrants may do considerably betterin the United States than the immigrants themselves, and their fortunesneed to be taken into account in evaluating the experience of immigrants(Card, DiNardo, and Estes 2000; Card 2004).
We begin by examining outcomes for all Mexican American adults andthen consider married individuals separately. This enables us to confirmour aggregate findings for this group—one that is most likely to manifesttraditional labor market patterns. Moreover, while, for the most part, re-search on immigrants has studied the behavior of individuals, analyzingimmigrant behavior in a family context makes sense in general and may beparticularly relevant to understanding women’s assimilation. Baker andBenjamin (1997) propose a family investment model in which, upon ar-rival, husbands invest in their human capital, while wives work to providethe family with liquidity during this investment period. With increasedtime in the destination country, husbands’ labor supply increases rapidlydue to their growing skills, while wives’ labor supply falls off in part be-cause they originally took dead-end jobs upon arrival in order to finance
Gender and Assimilation among Mexican Americans 59
their husbands’ investments in human capital. Baker and Benjamin pro-vide some evidence consistent with this model using data on Canada overthe 1986–1991 period. However, using data for the United States from the1980 and 1990 U.S. Censuses, Blau et al. (2003) did not find evidence con-sistent with the family migration model.5 Specifically, they find that immi-grant husbands and wives both worked less than comparable natives uponarrival and that both had positive assimilation profiles in labor supply,eventually overtaking the labor supply of comparable natives.
In the family migration model, married women are clearly secondaryearners in the immigrant family. The Blau et al. (2003) results for theUnited States suggest more similar economic behavior of men and womenwithin the immigrant family.6 Blau et al. report that labor supply assimila-tion patterns for men and women in the United States were very similar foreach major sending region, including the Central American region definedto include Mexico. However, as a group coming from a source country withhighly traditional gender roles, it is possible that patterns for Mexican im-migrants would more closely approximate the family investment modelthan immigrants from Central America generally or other regions. Thus,we reexamine this question here. In addition, we include more recent dataand study more dependent variables in the current paper, such as marriage,education, unemployment, occupational and industrial segregation, andfertility, than in this earlier work.
2.2 Recent Research on Labor Market Outcomes for Mexican Americans
Several authors have recently examined the assimilation of MexicanAmericans into the U.S. labor market both within and between genera-tions, although none has specifically studied gender differences in the as-similation process or assessed the relevance of the family migration modelfor Mexican Americans. Trejo (1997, 2003), for example, studied humancapital and wages for men of Mexican origin versus white non-Hispanicnative men for 1979 and 1989. He found that although men of Mexicanorigin earned considerably less than whites, most of these differences were
60 Francine D. Blau and Lawrence M. Kahn
5. Studies by Long (1980), Duleep and Sanders (1993), and Macpherson and Stewart(1989) for the United States are all at least partially consistent with the idea that married im-migrant women are more likely to work while their husbands are investing in human capital.However, unlike Blau et al. (2003), each of these studies is based on a single cross section ofdata.
6. In a recent paper, Duleep and Dowhan (2002) use matched Social Security earnings and1994 CPS data to track the longitudinal earnings growth of immigrant versus native women.They find that more recent immigrant cohorts’ earnings start low relative to natives’ but risequickly with time in the United States and eventually catch up to natives’. In contrast, earliercohorts’ initial earnings were at least as high as natives’ but then either increased only a littleor actually dropped. The results for the more recent cohorts are similar to the changes inhourly earnings reported by Baker and Benjamin (1997) for Canada and Blau et al. (2003) forthe United States.
explained by the former’s relatively low human capital levels. Moreover,while both the relative human capital levels and the return to investment inhuman capital rose between the first and second generations, this progressstalled between the second and third generations (Trejo 1997, 2003). Across-sectional study of the wages of men and women for a sample of indi-viduals of Mexican origin by Livingston and Kahn (2002) also found someprogress of immigrants between the first and second generations that ap-parently stalled in the third generation.
Corcoran, Heflin, and Reyes (1999) summarize trends in labor marketoutcomes for Mexican American women using census data to compareoutcomes for Mexican American women and white non-Hispanic womenover the 1970–1990 period. They find that the relative wages and employ-ment attachment of Mexican Americans fell over the 1980s, probably re-flecting, in part, the growing immigrant share among Mexican Americanwomen. They also find that, in the cross section, long-term immigrants(i.e., those with over ten years of U.S. residence) had better wage outcomesand higher employment levels than short-term immigrants, while MexicanAmerican women born in the United States had higher wages and em-ployment incidence than long-term immigrants, although they still laggedconsiderably behind white non-Hispanic women in this regard. These find-ings suggest assimilation across generations and either assimilation amongimmigrants with more time in the United States or declining labor marketsuccess among more recent cohorts of immigrants.
Baker (1999) provides some additional descriptive information on de-mographic patterns using the 1970, 1980, and 1990 Censuses. Specifically,while immigrant Mexican American women were in each year roughlyequally likely as white non-Hispanic women to be married, U.S.-born Mex-ican American women were less likely to be married than white non-Hispanic women. Moreover, Mexican immigrants had more children thanwhite non-Hispanics and so did U.S.-born Mexican American women.However, these Mexican-white differentials in fertility were smaller forU.S.-born Mexican Americans and also fell progressively from 1970 to1990 for each nativity group. Relative fertility levels were thus falling forMexican American women over time and across generations.
Unlike the earlier work that studied only men or only women, we ex-plicitly analyze gender differences in demographic and labor market out-comes for Mexican Americans. And, in contrast to the descriptive studies,we explicitly analyze assimilation in a regression context and may thus es-timate how much assimilation occurs in the first generation with exposureto the U.S. economy and labor market as well as identify the impact of mea-sured covariates versus behavioral changes in the assimilation of MexicanAmericans, both within and across generations. Moreover, unlike the Liv-ingston and Kahn (2002) study of Mexican-origin workers, we make ex-plicit comparisons with a native base group and also examine a much wider
Gender and Assimilation among Mexican Americans 61
array of outcomes than their focus on hourly earnings. And, in contrast toall of these studies, we also examine the family context in which these out-comes occur. This means, for example, controlling for family related var-iables in analyzing individual outcomes. Thus, in addition, by makingexplicit gender comparisons, we are able to arrive at conclusions aboutassimilation with respect to gender roles.
2.3 Data and Descriptive Patterns
We use the 1994–2003 March CPS Annual Demographic Supplementfiles to study gender and Mexican American assimilation. These files con-tain information on the respondent’s country of birth, the country(ies) ofbirth of his or her mother and father, and whether the individual is of Mex-ican origin. We can thus construct samples of Mexican immigrants, sec-ond-generation Mexican Americans (defined as individuals who were bornin the United States who had at least one parent born in Mexico), and U.S.-born individuals of Mexican origin whose parents were both born in theUnited States (the third generation). Our comparison group comprisesthird-generation, U.S.-born non-Hispanic whites (non-Hispanic whites).Using ten years of pooled cross-sectional data provides us with fairly largesamples of Mexican Americans in each generation (see table 2A.1) and al-lows us to distinguish the impact of immigrant cohort from that of time inthe United States (Borjas 1985).7
Our analyses of intergenerational mobility compare outcomes for immi-grants with those of second- and third-generation Mexican Americans.Immigrants observed as of 1994–2003, the time window of our data, maynot be representative of the parents of second-generation Mexican Amer-icans also observed at that time, although there is likely to be some overlap.By using the same data to observe all three generations, we are in effect as-suming that contemporary Mexican immigrants are in some sense similarto those of the 1950s, 1960s, and 1970s, when the parents of many of thesecond-generation Mexican Americans in our sample would have been inthe prime working ages. An alternative would be to use data for an earlierperiod to observe outcomes for the first generation. Each approach hasstrengths and weaknesses, and recent research suggests they may not pro-
62 Francine D. Blau and Lawrence M. Kahn
7. As in all analyses based on pooled cross-section data, we cannot observe return migra-tion. Results may be biased if those who remain in the United States are a self-selected groupof more or less successful immigrants. In addition, there may be recall errors and ambiguitiesof interpretation among respondents to the CPS question on when they arrived in the UnitedStates, as immigrants may enter and leave the United States several times. In a paper analyz-ing such issues using a recently developed data base that allows one to correct for such fac-tors (the New Immigrant Survey Pilot [NISP]), Redstone and Massey (2004) find that tradi-tional analyses of wages and years of U.S. experience yield similar results under the censusand NISP definition of years in the United States.
duce the same estimates of intergenerational assimilation. For example,Smith (2003) finds more apparent progress in wages and schooling acrossgenerations among Hispanic Americans when he pools census and CPSdata for the 1940–1997 period than when he bases his estimate on a singlecross-section (the 1970 Census).
Looking at one cross-section (or, in our case, a single ten-year period)may yield a biased estimate of intergenerational assimilation if unmea-sured immigrant cohort characteristics have changed. On the other hand,as Trejo (1997) points out, the time series approach may also be problem-atic. Between the 1950s–1970s and 1994–2003, there were many legal andeconomic changes that themselves could have influenced the economicsuccess of Mexican American immigrants. Trejo specifically mentions thepassage of the Civil Rights Act of 1964, which outlawed discriminationbased on national origin (as well as race and sex). Thus, part of any apparentprogress of Mexican Americans in general or Mexican American womenin particular across generations between earlier years and the current pe-riod may have been due to changes in the legal and social environment thatimpacted all generations rather than to assimilation of the second genera-tion. Working in the opposite direction, we may note that rising returns to education and unmeasured skills probably had an independent effectlowering the relative fortunes of most Mexican Americans in the 1990s rel-ative to the earlier period. This development would cause us to underesti-mate true intergenerational assimilation.8 Finally, the prohibition of sexdiscrimination by the Civil Rights Act is also relevant to our study as we are interested in gender differences in outcomes, as are the considerablechanges in social norms and attitudes about gender roles that have oc-curred since the earlier period. These developments could have had a dif-ferential impact on Mexican American women’s labor force behavior andoutcomes relative to a native reference group, although the direction of thisbias is unclear. Taking into account these considerations, our approach tomeasuring the intergenerational assimilation of Mexican Americans is tocompare all three generations under the same legal, economic, and socialenvironment: the 1994–2003 period. However, by looking at estimated im-migrant cohort effects, we will be able to simulate outcomes for the immi-grants from an earlier cohort and also to assess the extent to which resultsare sensitive to which immigrant cohort is used in the simulation.
In interpreting our findings for assimilation across generations, specialcaution is warranted regarding the third generation. While first- and sec-ond-generation individuals may be objectively identified in terms of theirown or their parents’ place of birth, third-generation Mexican Americans
Gender and Assimilation among Mexican Americans 63
8. For analyses of the returns to education and unmeasured skills in the context of immi-grant assimilation, see LaLonde and Topel (1992) and Borjas (1995).
must identify themselves as of Mexican origin. If there is self-selection inreporting, results may be biased.9 For example, if among third-generationMexican Americans, those who self-identify as of Mexican origin are lesswell assimilated than those who do not, assimilation of third-generationMexican Americans relative to the native-born, non-Hispanic referencegroup will be understated.10
Table 2.1 contains some descriptive information on demographic andlabor market outcomes for Mexican Americans and non-Hispanic white–third-generation Americans. The entries in table 2.1 are predicted levels ofthese outcomes from regressions controlling for ethnicity or generation, aquartic in age and year. We control for age even at this descriptive stage be-cause there are age differences across samples due to past immigrationpatterns, and we wish to describe Mexican American–non-Hispanic whitecontrasts net of this compositional factor.11 The following regression wasestimated separately by gender:
(1) yit � b0 � b1ageit � b2age2it � b3age3
it � b4age4it � c1Meximmit
� c2Mexsecgenit � c3Mexthirdgenit � dt � uit ,
where i indexes individuals, and t indexes survey years, and y is a demo-graphic or labor market outcome, age is the person’s age in years, Meximm,Mexsecgen, and Mexthird are, respectively, dummy variables for Mexicanimmigrants, and second- and third-generation Mexican Americans, d is ayear effect, and u is a disturbance term. We define a second-generationMexican American as someone born in the United States who had at leastone parent who was born in Mexico. Two versions of equation (1) were es-timated: (a) one which included all immigrants and (b) one which includedonly those who migrated to the United States at age eighteen or older(adult immigrants).12 We show results for adult immigrants, in addition tothose for all immigrants, because those who migrated as children are likelyto be more assimilated to U.S. labor markets than those who migrated as
64 Francine D. Blau and Lawrence M. Kahn
9. Of course, as noted previously, even for immigrants biases may arise due to self-selectionin return migration, recall bias, and ambiguities in defining length of residence in the UnitedStates.
10. For a fuller consideration of these issues, see, for example, Duncan and Trejo (chap. 7in this volume), who find some indirect evidence consistent with the idea that more assimi-lated Mexican Americans are less likely to self-identify as having a Mexican heritage.
11. Within each of the ethnicity or generation subsamples (i.e., third-generation non-Hispanic whites, Mexican immigrants, and second- and third-generation Mexican Ameri-cans), the average age of men and women was similar, but average age varied across sub-samples. Non-Hispanic whites averaged thirty-nine years of age, Mexican immigrantsthirty-four–thirty-five years (thirty-eight–thirty-nine years for adult immigrants), second-generation Mexican Americans thirty-two years, and third-generation Mexican Americansthirty-four–thirty-five years.
12. Results for second- and third-generation Mexican Americans are based on regressionsthat include all immigrants, although the findings were similar in regressions with the immi-grant sample restricted to adult migrants.
(continued )
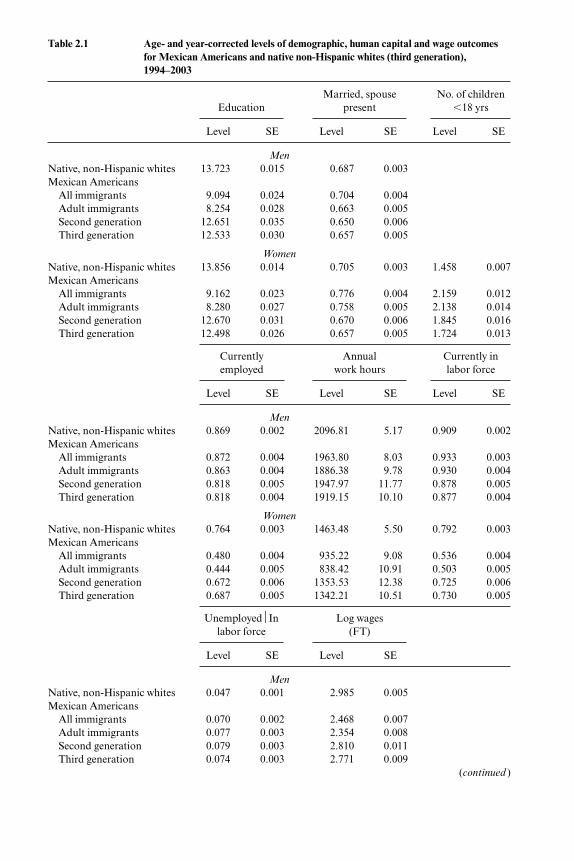
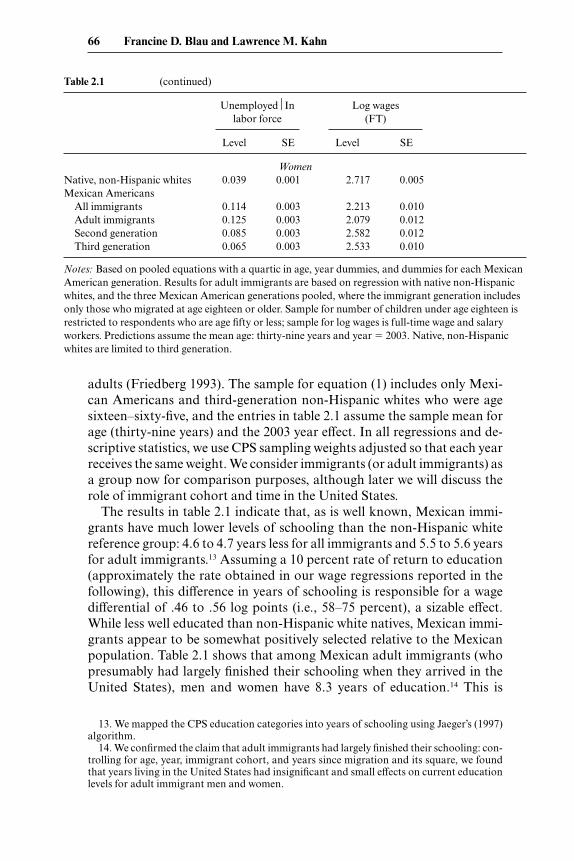
Table 2.1 Age- and year-corrected levels of demographic, human capital and wage outcomesfor Mexican Americans and native non-Hispanic whites (third generation),1994–2003
Married, spouse No. of children Education present �18 yrs
Level SE Level SE Level SE
Men
Native, non-Hispanic whites 13.723 0.015 0.687 0.003Mexican Americans
All immigrants 9.094 0.024 0.704 0.004Adult immigrants 8.254 0.028 0.663 0.005Second generation 12.651 0.035 0.650 0.006Third generation 12.533 0.030 0.657 0.005
Women
Native, non-Hispanic whites 13.856 0.014 0.705 0.003 1.458 0.007Mexican Americans
All immigrants 9.162 0.023 0.776 0.004 2.159 0.012Adult immigrants 8.280 0.027 0.758 0.005 2.138 0.014Second generation 12.670 0.031 0.670 0.006 1.845 0.016Third generation 12.498 0.026 0.657 0.005 1.724 0.013
Currently Annual Currently in employed work hours labor force
Level SE Level SE Level SE
Men
Native, non-Hispanic whites 0.869 0.002 2096.81 5.17 0.909 0.002Mexican Americans
All immigrants 0.872 0.004 1963.80 8.03 0.933 0.003Adult immigrants 0.863 0.004 1886.38 9.78 0.930 0.004Second generation 0.818 0.005 1947.97 11.77 0.878 0.005Third generation 0.818 0.004 1919.15 10.10 0.877 0.004
Women
Native, non-Hispanic whites 0.764 0.003 1463.48 5.50 0.792 0.003Mexican Americans
All immigrants 0.480 0.004 935.22 9.08 0.536 0.004Adult immigrants 0.444 0.005 838.42 10.91 0.503 0.005Second generation 0.672 0.006 1353.53 12.38 0.725 0.006Third generation 0.687 0.005 1342.21 10.51 0.730 0.005
Unemployed⏐In Log wages labor force (FT)
Level SE Level SE
Men
Native, non-Hispanic whites 0.047 0.001 2.985 0.005Mexican Americans
All immigrants 0.070 0.002 2.468 0.007Adult immigrants 0.077 0.003 2.354 0.008Second generation 0.079 0.003 2.810 0.011Third generation 0.074 0.003 2.771 0.009
adults (Friedberg 1993). The sample for equation (1) includes only Mexi-can Americans and third-generation non-Hispanic whites who were agesixteen–sixty-five, and the entries in table 2.1 assume the sample mean forage (thirty-nine years) and the 2003 year effect. In all regressions and de-scriptive statistics, we use CPS sampling weights adjusted so that each yearreceives the same weight. We consider immigrants (or adult immigrants) asa group now for comparison purposes, although later we will discuss therole of immigrant cohort and time in the United States.
The results in table 2.1 indicate that, as is well known, Mexican immi-grants have much lower levels of schooling than the non-Hispanic whitereference group: 4.6 to 4.7 years less for all immigrants and 5.5 to 5.6 yearsfor adult immigrants.13 Assuming a 10 percent rate of return to education(approximately the rate obtained in our wage regressions reported in thefollowing), this difference in years of schooling is responsible for a wagedifferential of .46 to .56 log points (i.e., 58–75 percent), a sizable effect.While less well educated than non-Hispanic white natives, Mexican immi-grants appear to be somewhat positively selected relative to the Mexicanpopulation. Table 2.1 shows that among Mexican adult immigrants (whopresumably had largely finished their schooling when they arrived in theUnited States), men and women have 8.3 years of education.14 This is
66 Francine D. Blau and Lawrence M. Kahn
13. We mapped the CPS education categories into years of schooling using Jaeger’s (1997)algorithm.
14. We confirmed the claim that adult immigrants had largely finished their schooling: con-trolling for age, year, immigrant cohort, and years since migration and its square, we foundthat years living in the United States had insignificant and small effects on current educationlevels for adult immigrant men and women.
Women
Native, non-Hispanic whites 0.039 0.001 2.717 0.005Mexican Americans
All immigrants 0.114 0.003 2.213 0.010Adult immigrants 0.125 0.003 2.079 0.012Second generation 0.085 0.003 2.582 0.012Third generation 0.065 0.003 2.533 0.010
Notes: Based on pooled equations with a quartic in age, year dummies, and dummies for each MexicanAmerican generation. Results for adult immigrants are based on regression with native non-Hispanicwhites, and the three Mexican American generations pooled, where the immigrant generation includesonly those who migrated at age eighteen or older. Sample for number of children under age eighteen isrestricted to respondents who are age fifty or less; sample for log wages is full-time wage and salaryworkers. Predictions assume the mean age: thirty-nine years and year � 2003. Native, non-Hispanicwhites are limited to third generation.
Table 2.1 (continued)
Unemployed⏐In Log wages labor force (FT)
Level SE Level SE
higher than the reported years of schooling for men and women in Mexicoobtained from Mexican census data for 1990 and 2000: 7.0–8.1 years formales and 6.4–7.6 for females. Moreover, in contrast to the situation inMexico, Mexican men and women immigrants in the United States havethe same educational attainment.15
While Mexican Americans lag behind native non-Hispanic whites, thereis considerable convergence in education across generations; second-generation Mexican Americans have only 1.07 (males) to 1.19 (females)years less education than the non-Hispanic white reference group, whilethe differentials for the third generation are 1.19 (males) to 1.36 (females)years. The apparent cessation of convergence toward non-Hispanic whites’education levels after the second generation is consistent with earlieranalyses of labor market outcomes for Mexican Americans discussed inthe preceding. In both the second and third generations, the MexicanAmerican educational shortfall relative to non-Hispanic whites is statisti-cally significantly smaller for men than women, and this gender differenceincreases from the second to the third generations (from 0.07 to 0.17).However, the magnitude of the gender difference in convergence is small—only 0.1 years, and educational attainment of Mexican American men andwomen within each generation is virtually identical, in contrast to the 0.5–0.6 year male advantage in Mexico.
Table 2.1 shows that, overall, both immigrant men and immigrantwomen are significantly more likely to be married, spouse present (mar-ried) than are non-Hispanic white natives; however, among adult immi-grants, men are less likely to be married than the non-Hispanic white ref-erence group, while women are still more likely to be married. This suggeststhat immigration may be disruptive of marriage for Mexican men—eitherby delaying marriage or causing spouses to live apart—but not for women.Mexican immigrant women are 5 to 7 percentage points more likely to bemarried than native non-Hispanic whites. The higher marriage rates ofMexican immigrant women are consistent with a greater adherence to tra-ditional gender roles in this population but may also be related to a ten-dency to migrate jointly with their husbands or to reunite families, perhapsas tied movers. By the second and third generations, however, MexicanAmericans of both sexes are significantly less likely to be married thannon-Hispanic whites, with differentials of 3–5 percentage points. As dis-cussed by Angrist (2002), reductions across generations in the likelihood ofmarriage may be due to marital search problems and the desire to marry
Gender and Assimilation among Mexican Americans 67
15. The conclusion that Mexican immigrants are positively selected with respect to educa-tion has been challenged by Ibarraran and Lubotsky (chap. 5 in this volume), who suggestnegative selection. On the other hand, Chiquiar and Hanson (2005) find that Mexican immi-grants come from the middle- and upper-middle portions of the educational distribution, sug-gesting mildly positive selection. For our purposes, the most interesting finding is that edu-cational attainment of male and female Mexican immigrants is the same, while in Mexico,men have somewhat more education than women. Thus, Mexican female immigrants are rel-atively positively selected.
within one’s own ethnic group.16 On the other hand, the discrepancy maybe explained by measured characteristics, for example, the lower levels ofeducation of U.S.-born Mexican Americans. The following regressionanalysis will shed light on this.
Table 2.1 also presents results for number of own (biological or adopted)children under age eighteen living in the family. While it would be more ac-curate to have information on number of children ever born, by restrictingthe age sample for this variable to women no older than fifty and evaluat-ing the variable at age thirty-nine, we are likely to obtain a fairly good in-dicator of cross-group differences in fertility.17 Because children who livewith only one parent are much more likely to live with their mothers thantheir fathers, we restrict our examination of fertility differences to women.Perhaps reflecting higher fertility rates in the source country, Mexican im-migrant women have more children than non-Hispanic whites, and, al-though this differential declines across generations, it remains positiveeven in the third generation. As noted earlier, as of 1998, the total fertilityrate for women in Mexico averaged 2.8, while in the United States, the fer-tility rate was 2.1, a difference of 0.7. While our measure is constructedquite differently, we obtain a very similar differential between Mexican im-migrants and non-Hispanic whites: Mexican immigrant women average2.14 to 2.16 children, roughly 0.7 more than the corresponding figure forwhite non-Hispanic women of 1.46. (The gap between the number of ownchildren for Mexican immigrant women and all women residing in theUnited States was also 0.7.) The gap had fallen to 0.39 by the second and0.27 by the third generation, suggesting an intergenerational assimilationof roughly 60 percent.
When we stratified the analysis of the number of children by marital sta-tus, we found similar patterns across the generations. For all generations,among either single or married individuals, Mexican Americans have morechildren, with a declining differential across generations; moreover, themagnitude of the Mexican American–non-Hispanic white differential wassimilar for married and single women. In addition, Mexican Americanwomen were more likely than non-Hispanic whites to be single parents,with significant differentials for immigrant (5.3 percentage points), adultimmigrant (4.5 percentage points), second-generation (9.6 percentagepoints), and third-generation Mexican Americans (9.0 percentage points).We expect having larger numbers of children to be associated with lesslabor market attachment and lower wage offers for Mexican Americanversus non-Hispanic white women (Blau, Ferber, and Winkler 2002; Wald-fogel 1998).
68 Francine D. Blau and Lawrence M. Kahn
16. The disproportionately high marriage incidence among immigrant women shown intables 2.1 and 2.2 for Mexican immigrants is similar to what Angrist (2002) finds for immi-grants in general.
17. Results were similar when the age range was unrestricted.
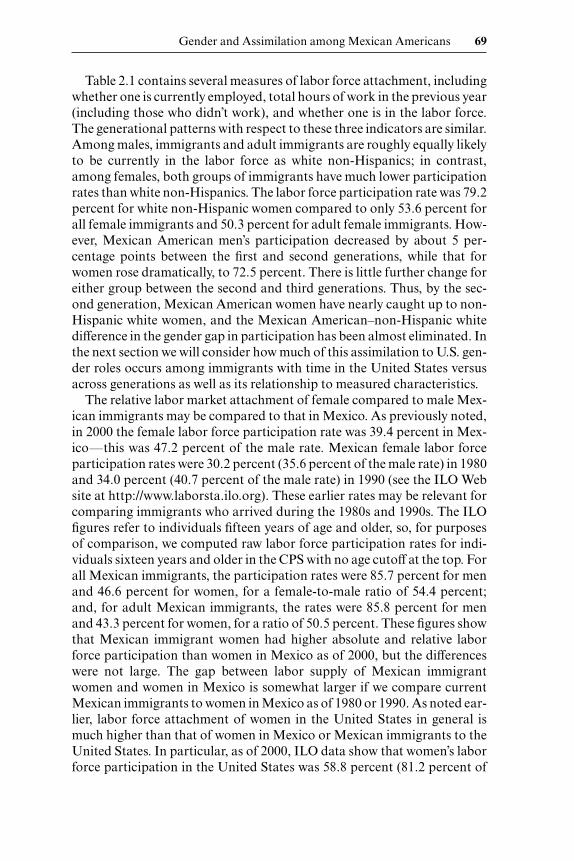
Table 2.1 contains several measures of labor force attachment, includingwhether one is currently employed, total hours of work in the previous year(including those who didn’t work), and whether one is in the labor force.The generational patterns with respect to these three indicators are similar.Among males, immigrants and adult immigrants are roughly equally likelyto be currently in the labor force as white non-Hispanics; in contrast,among females, both groups of immigrants have much lower participationrates than white non-Hispanics. The labor force participation rate was 79.2percent for white non-Hispanic women compared to only 53.6 percent forall female immigrants and 50.3 percent for adult female immigrants. How-ever, Mexican American men’s participation decreased by about 5 per-centage points between the first and second generations, while that forwomen rose dramatically, to 72.5 percent. There is little further change foreither group between the second and third generations. Thus, by the sec-ond generation, Mexican American women have nearly caught up to non-Hispanic white women, and the Mexican American–non-Hispanic whitedifference in the gender gap in participation has been almost eliminated. Inthe next section we will consider how much of this assimilation to U.S. gen-der roles occurs among immigrants with time in the United States versusacross generations as well as its relationship to measured characteristics.
The relative labor market attachment of female compared to male Mex-ican immigrants may be compared to that in Mexico. As previously noted,in 2000 the female labor force participation rate was 39.4 percent in Mex-ico—this was 47.2 percent of the male rate. Mexican female labor forceparticipation rates were 30.2 percent (35.6 percent of the male rate) in 1980and 34.0 percent (40.7 percent of the male rate) in 1990 (see the ILO Website at http://www.laborsta.ilo.org). These earlier rates may be relevant forcomparing immigrants who arrived during the 1980s and 1990s. The ILOfigures refer to individuals fifteen years of age and older, so, for purposesof comparison, we computed raw labor force participation rates for indi-viduals sixteen years and older in the CPS with no age cutoff at the top. Forall Mexican immigrants, the participation rates were 85.7 percent for menand 46.6 percent for women, for a female-to-male ratio of 54.4 percent;and, for adult Mexican immigrants, the rates were 85.8 percent for menand 43.3 percent for women, for a ratio of 50.5 percent. These figures showthat Mexican immigrant women had higher absolute and relative laborforce participation than women in Mexico as of 2000, but the differenceswere not large. The gap between labor supply of Mexican immigrantwomen and women in Mexico is somewhat larger if we compare currentMexican immigrants to women in Mexico as of 1980 or 1990. As noted ear-lier, labor force attachment of women in the United States in general ismuch higher than that of women in Mexico or Mexican immigrants to theUnited States. In particular, as of 2000, ILO data show that women’s laborforce participation in the United States was 58.8 percent (81.2 percent of
Gender and Assimilation among Mexican Americans 69
the male rate). This is suggestive of a strong effect of source country pat-terns on Mexican immigrants in the United States. The observed differ-ences between Mexican immigrants and source-country patterns could bea selection effect if migration is selective of relatively more market-orientedwomen from Mexico; alternatively, exposure to the U.S. labor market maybring Mexican immigrant women into the labor force. In the following, wepursue the latter issue in more detail.
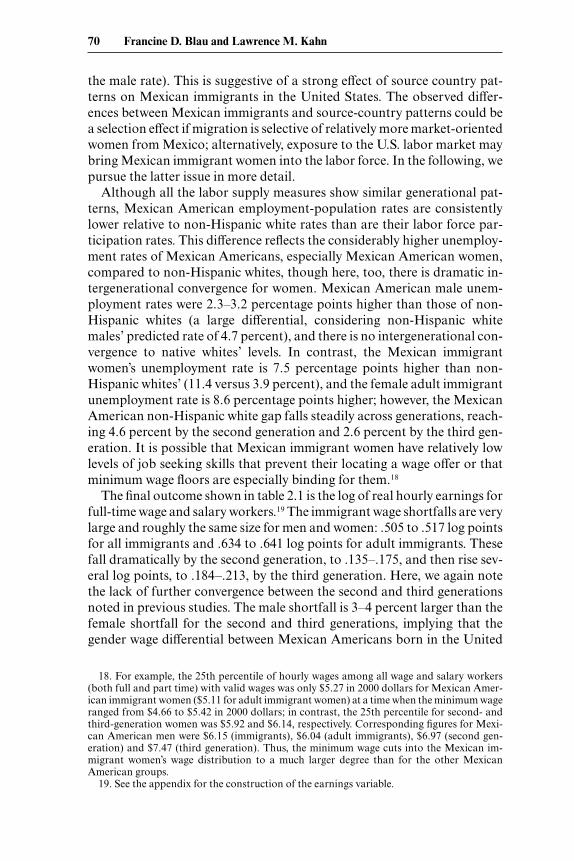
Although all the labor supply measures show similar generational pat-terns, Mexican American employment-population rates are consistentlylower relative to non-Hispanic white rates than are their labor force par-ticipation rates. This difference reflects the considerably higher unemploy-ment rates of Mexican Americans, especially Mexican American women,compared to non-Hispanic whites, though here, too, there is dramatic in-tergenerational convergence for women. Mexican American male unem-ployment rates were 2.3–3.2 percentage points higher than those of non-Hispanic whites (a large differential, considering non-Hispanic whitemales’ predicted rate of 4.7 percent), and there is no intergenerational con-vergence to native whites’ levels. In contrast, the Mexican immigrantwomen’s unemployment rate is 7.5 percentage points higher than non-Hispanic whites’ (11.4 versus 3.9 percent), and the female adult immigrantunemployment rate is 8.6 percentage points higher; however, the MexicanAmerican non-Hispanic white gap falls steadily across generations, reach-ing 4.6 percent by the second generation and 2.6 percent by the third gen-eration. It is possible that Mexican immigrant women have relatively lowlevels of job seeking skills that prevent their locating a wage offer or thatminimum wage floors are especially binding for them.18
The final outcome shown in table 2.1 is the log of real hourly earnings forfull-time wage and salary workers.19 The immigrant wage shortfalls are verylarge and roughly the same size for men and women: .505 to .517 log pointsfor all immigrants and .634 to .641 log points for adult immigrants. Thesefall dramatically by the second generation, to .135–.175, and then rise sev-eral log points, to .184–.213, by the third generation. Here, we again notethe lack of further convergence between the second and third generationsnoted in previous studies. The male shortfall is 3–4 percent larger than thefemale shortfall for the second and third generations, implying that thegender wage differential between Mexican Americans born in the United
70 Francine D. Blau and Lawrence M. Kahn
18. For example, the 25th percentile of hourly wages among all wage and salary workers(both full and part time) with valid wages was only $5.27 in 2000 dollars for Mexican Amer-ican immigrant women ($5.11 for adult immigrant women) at a time when the minimum wageranged from $4.66 to $5.42 in 2000 dollars; in contrast, the 25th percentile for second- andthird-generation women was $5.92 and $6.14, respectively. Corresponding figures for Mexi-can American men were $6.15 (immigrants), $6.04 (adult immigrants), $6.97 (second gen-eration) and $7.47 (third generation). Thus, the minimum wage cuts into the Mexican im-migrant women’s wage distribution to a much larger degree than for the other MexicanAmerican groups.
19. See the appendix for the construction of the earnings variable.
States is somewhat smaller than among non-Hispanic whites; this is a fairlygeneral pattern among minorities (Blau, Ferber, and Winkler 2002).
2.4 Assimilation within and across Generations: Basic Regression Results
One of our key objectives is to compare the degree to which MexicanAmerican men and women assimilate to U.S. labor market and family pat-terns, both within and between generations. While table 2.1 provides someimportant descriptive information on demographic and labor market out-comes for immigrants and later generations, in this section we present theresults of regression analyses for selected dependent variables that allow us to more explicitly examine assimilation by controlling for the effect ofyears since migration on immigrants’ outcomes and by including addi-tional covariates which control for the human capital and locational char-acteristics of Mexican Americans. This specification enables us to estimatehow much assimilation occurs in the first generation with exposure to theU.S. economy and labor market as well as to identify the impact of mea-sured covariates versus behavioral changes in the assimilation of MexicanAmericans, both within and across generations.
Specifically, to capture the assimilation of immigrants, we augmentequation (1) by replacing the immigrant dummy variable with a full set ofimmigrant arrival cohort dummies and an indicator of years since migra-tion and its square. The cohort variables refer to arrival before 1961; 1961–1970; 1971–1980; 1981–1990; 1991–1996; and 1997–2002. As previouslynoted, because we are pooling ten years of data, we can in principle distin-guish the effects of different arrival cohorts from that of time in the UnitedStates as in Borjas (1985). In our basic models, we also control for humancapital (years of schooling)20 and location (eight Census region dummies,a metropolitan statistical area [MSA] dummy, and dummies for Californiaand Texas, the two states with the largest incidence of Mexican Americansin the population),21 in addition to a quartic in age and year dummies (asin the preceding). For comparison, we also estimate models with only theage and year controls, in effect allowing human capital and region to beendogenous.
With respect to immigrants, the two specifications allow us to compareimmigrants both to third-generation non-Hispanic whites in general andalso to those with similar measured characteristics, with the former com-parison including both compositional and behavioral differences and the
Gender and Assimilation among Mexican Americans 71
20. Ibarraran and Lubotsky (chap. 5 in this volume) suggest that the U.S. Census overstateseducational attainment for Mexican immigrants. If this is true, then the results we show in fig-ures 2.1–2.9 with full controls may be biased. However, we note that all of our estimated im-migrant assimilation profiles have similar slopes whether or not we control for education.Thus, our basic conclusions about the direction and magnitude of immigrant assimilation arelikely to be robust with respect to possible measurement error in immigrant education.
21. California and Texas dummies were used by Trejo (1997, 2003) in his analyses of Mex-ican American men.
latter attempting to isolate the effect of behavioral differences. Similarly,looking across generations, comparison of the two specifications allows usto make inferences about the degree to which assimilation in labor marketand family outcomes occurs through changes in the education and loca-tion variables versus behavioral changes. Table 2.2 shows regression resultscontrolling for education and location as well as year, while table 2A.2shows corresponding results for models that control only for age and year.Means of the explanatory variables are shown in table 2A.3. To assist in theinterpretation of the regression results, figures 2.1–2.6 show implied as-similation profiles for Mexican Americans. Immigrant outcomes are usu-ally evaluated for the 1971–1980 arrival cohort. We chose this cohort be-cause it likely contains a large number of the parents of second-generationMexican Americans in our 1994–2003 sample period. However, where rele-vant, we also discuss other arrival cohorts, particularly the 1980s cohort,as this was a period of rapidly rising returns to education, a factor thatworked against the labor market success of Mexican Americans.
Turning first to the incidence of marriage shown in table 2.2 and figure2.1, we see that, upon arrival, Mexican immigrant men are less likely andMexican immigrant women more likely than otherwise similar non-Hispanic white natives to be married, spouse present. There is some as-similation for both sexes, with substantial male assimilation into marriageamong immigrants with time in the United States and some reduction overtime in females’ likelihood of being married. This pattern suggests that, formales, immigration may be disruptive of marriage (either by delaying mar-riage or causing a temporary separation from their wives), whereas mar-riage may play a positive role in immigration decision of women, with someperhaps arriving as tied movers. Despite assimilation toward the lowermarriage incidence of natives with similar characteristics, female immi-grants continue to be more likely to be married, spouse present, than thenative reference group for all cohorts. For example, the 1971–1980 arrivalcohort of immigrant women has an 18.2 percentage point higher incidenceof marriage upon arrival in the United States than the native referencegroup and continued to have an 8.4 percentage point advantage aftertwenty years of residence. Given their positive assimilation, male immi-grants in this cohort were projected to overtake their native counterpartsafter eight years and to have an 11.0 percentage point higher incidence ofmarriage after twenty years. Thus, both male and female immigrants arecharacterized by more traditional marriage patterns than natives. The re-gression results suggest, however, that full assimilation to the marriagepatterns of otherwise similar third-generation non-Hispanic whites has oc-curred by the second generation in which Mexican Americans of bothsexes are roughly equally likely to be married as comparable natives; by thethird generation, Mexican-American women are actually slightly (3 per-centage points) less likely to be married than the reference group.
Assimilation rates are similar when we do not control for education and
72 Francine D. Blau and Lawrence M. Kahn
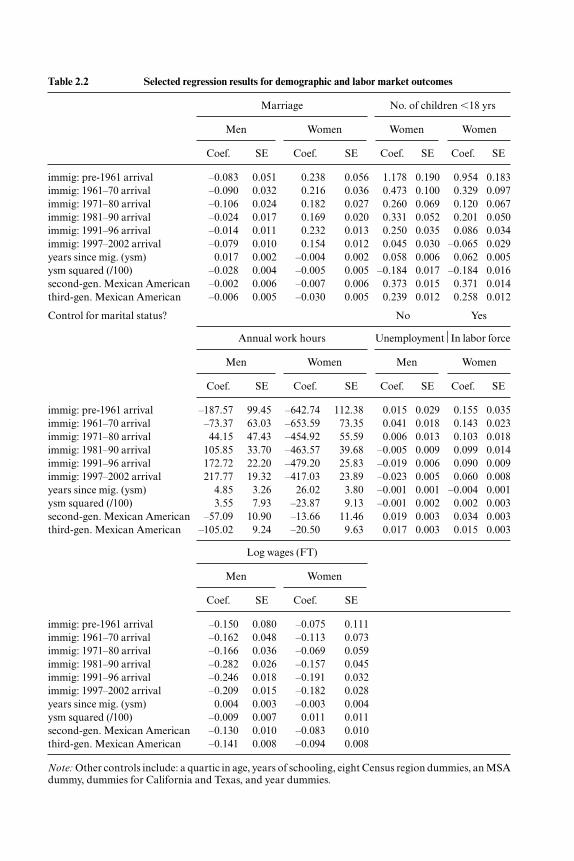
Table 2.2 Selected regression results for demographic and labor market outcomes
Marriage No. of children �18 yrs
Men Women Women Women
Coef. SE Coef. SE Coef. SE Coef. SE
immig: pre-1961 arrival –0.083 0.051 0.238 0.056 1.178 0.190 0.954 0.183immig: 1961–70 arrival –0.090 0.032 0.216 0.036 0.473 0.100 0.329 0.097immig: 1971–80 arrival –0.106 0.024 0.182 0.027 0.260 0.069 0.120 0.067immig: 1981–90 arrival –0.024 0.017 0.169 0.020 0.331 0.052 0.201 0.050immig: 1991–96 arrival –0.014 0.011 0.232 0.013 0.250 0.035 0.086 0.034immig: 1997–2002 arrival –0.079 0.010 0.154 0.012 0.045 0.030 –0.065 0.029years since mig. (ysm) 0.017 0.002 –0.004 0.002 0.058 0.006 0.062 0.005ysm squared (/100) –0.028 0.004 –0.005 0.005 –0.184 0.017 –0.184 0.016second-gen. Mexican American –0.002 0.006 –0.007 0.006 0.373 0.015 0.371 0.014third-gen. Mexican American –0.006 0.005 –0.030 0.005 0.239 0.012 0.258 0.012
Control for marital status? No Yes
Annual work hours Unemployment⏐In labor force
Men Women Men Women
Coef. SE Coef. SE Coef. SE Coef. SE
immig: pre-1961 arrival –187.57 99.45 –642.74 112.38 0.015 0.029 0.155 0.035immig: 1961–70 arrival –73.37 63.03 –653.59 73.35 0.041 0.018 0.143 0.023immig: 1971–80 arrival 44.15 47.43 –454.92 55.59 0.006 0.013 0.103 0.018immig: 1981–90 arrival 105.85 33.70 –463.57 39.68 –0.005 0.009 0.099 0.014immig: 1991–96 arrival 172.72 22.20 –479.20 25.83 –0.019 0.006 0.090 0.009immig: 1997–2002 arrival 217.77 19.32 –417.03 23.89 –0.023 0.005 0.060 0.008years since mig. (ysm) 4.85 3.26 26.02 3.80 –0.001 0.001 –0.004 0.001ysm squared (/100) 3.55 7.93 –23.87 9.13 –0.001 0.002 0.002 0.003second-gen. Mexican American –57.09 10.90 –13.66 11.46 0.019 0.003 0.034 0.003third-gen. Mexican American –105.02 9.24 –20.50 9.63 0.017 0.003 0.015 0.003
Log wages (FT)
Men Women
Coef. SE Coef. SE
immig: pre-1961 arrival –0.150 0.080 –0.075 0.111immig: 1961–70 arrival –0.162 0.048 –0.113 0.073immig: 1971–80 arrival –0.166 0.036 –0.069 0.059immig: 1981–90 arrival –0.282 0.026 –0.157 0.045immig: 1991–96 arrival –0.246 0.018 –0.191 0.032immig: 1997–2002 arrival –0.209 0.015 –0.182 0.028years since mig. (ysm) 0.004 0.003 –0.003 0.004ysm squared (/100) –0.009 0.007 0.011 0.011second-gen. Mexican American –0.130 0.010 –0.083 0.010third-gen. Mexican American –0.141 0.008 –0.094 0.008
Note: Other controls include: a quartic in age, years of schooling, eight Census region dummies, an MSAdummy, dummies for California and Texas, and year dummies.
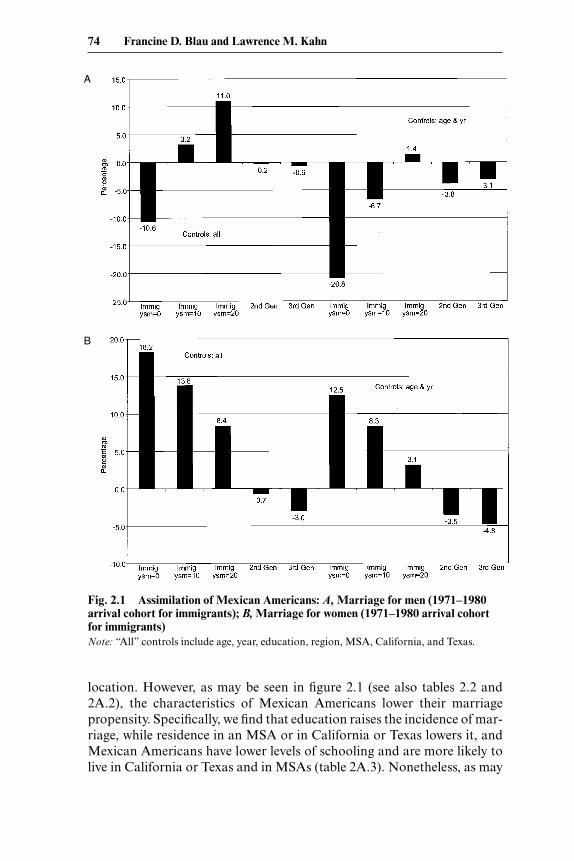
location. However, as may be seen in figure 2.1 (see also tables 2.2 and2A.2), the characteristics of Mexican Americans lower their marriagepropensity. Specifically, we find that education raises the incidence of mar-riage, while residence in an MSA or in California or Texas lowers it, andMexican Americans have lower levels of schooling and are more likely tolive in California or Texas and in MSAs (table 2A.3). Nonetheless, as may
74 Francine D. Blau and Lawrence M. Kahn
Fig. 2.1 Assimilation of Mexican Americans: A, Marriage for men (1971–1980arrival cohort for immigrants); B, Marriage for women (1971–1980 arrival cohortfor immigrants)Note: “All” controls include age, year, education, region, MSA, California, and Texas.
A
B
be seen in panel B of figure 2.1, female immigrants in the 1971–1980 arrivalcohort remain more likely to be married than natives, even when these con-trols are omitted. (This is the case for other arrival cohorts as well.) Con-sidering subsequent generations, it appears that education and locationfactors, rather than a dearth of prospective partners, are sufficient to ac-count for the lower raw marriage rates of second- and third-generationMexican Americans compared to third-generation non-Hispanic whitesobserved in table 2.1 and figure 2.1, since, as we have seen, the MexicanAmerican–non-Hispanic white differences are virtually eliminated whenwe control for these factors.
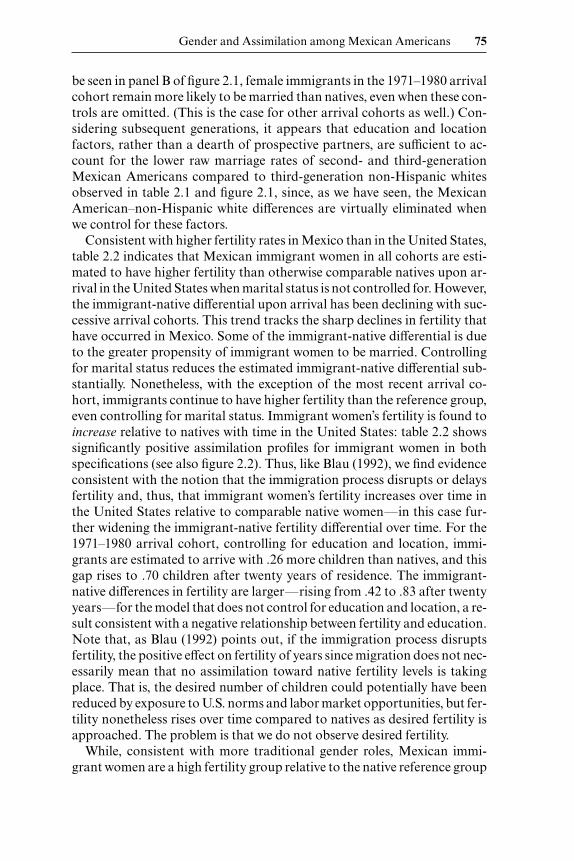
Consistent with higher fertility rates in Mexico than in the United States,table 2.2 indicates that Mexican immigrant women in all cohorts are esti-mated to have higher fertility than otherwise comparable natives upon ar-rival in the United States when marital status is not controlled for. However,the immigrant-native differential upon arrival has been declining with suc-cessive arrival cohorts. This trend tracks the sharp declines in fertility thathave occurred in Mexico. Some of the immigrant-native differential is dueto the greater propensity of immigrant women to be married. Controllingfor marital status reduces the estimated immigrant-native differential sub-stantially. Nonetheless, with the exception of the most recent arrival co-hort, immigrants continue to have higher fertility than the reference group,even controlling for marital status. Immigrant women’s fertility is found toincrease relative to natives with time in the United States: table 2.2 showssignificantly positive assimilation profiles for immigrant women in bothspecifications (see also figure 2.2). Thus, like Blau (1992), we find evidenceconsistent with the notion that the immigration process disrupts or delaysfertility and, thus, that immigrant women’s fertility increases over time inthe United States relative to comparable native women—in this case fur-ther widening the immigrant-native fertility differential over time. For the1971–1980 arrival cohort, controlling for education and location, immi-grants are estimated to arrive with .26 more children than natives, and thisgap rises to .70 children after twenty years of residence. The immigrant-native differences in fertility are larger—rising from .42 to .83 after twentyyears—for the model that does not control for education and location, a re-sult consistent with a negative relationship between fertility and education.Note that, as Blau (1992) points out, if the immigration process disruptsfertility, the positive effect on fertility of years since migration does not nec-essarily mean that no assimilation toward native fertility levels is takingplace. That is, the desired number of children could potentially have beenreduced by exposure to U.S. norms and labor market opportunities, but fer-tility nonetheless rises over time compared to natives as desired fertility isapproached. The problem is that we do not observe desired fertility.
While, consistent with more traditional gender roles, Mexican immi-grant women are a high fertility group relative to the native reference group
Gender and Assimilation among Mexican Americans 75
with no direct evidence of assimilation towards native levels, there is clearevidence of intergenerational assimilation of Mexican American fertilitytoward non-Hispanic white levels. Mexican American fertility does remainhigher, however: .37 higher for the second generation and .24 higher for thethird generation, even controlling for measured covariates. These differ-ences relative to non-Hispanic whites are only slightly affected by whetherwe control for education (and location), presumably reflecting the smallereducation differentials relative to non-Hispanic whites for Mexican Amer-icans born in the United States compared to Mexican immigrants.
As may be seen in table 2.2 and figure 2.3, upon arrival, the labor supplypatterns of Mexican immigrants are much more traditional than those ofotherwise similar natives in the reference group. We focus here on annualwork hours, including those who worked zero hours as this variable sum-marizes both labor force participation and work intensity. Upon arrival,immigrant women’s annual hours are considerably lower than those of thereference group, while, for cohorts arriving after 1970, men’s annual hoursare somewhat higher. More recent cohorts of immigrant men increased thehours differential compared to the native reference group, ceteris paribus,while, consistent with rising female labor force participation in Mexico, thegap for women decreased a bit, though the pattern is much less pronouncedthan we found for fertility, and the shortfall compared to the native refer-ence group remains sizable. Unlike our results for marriage and fertility,however, we find substantial assimilation of immigrant women to the na-tive reference group’s labor supply patterns. Despite their initially higherlevels, male hours show some positive assimilation as well.
76 Francine D. Blau and Lawrence M. Kahn
Fig. 2.2 Assimilation of Mexican Americans: Number of children < eighteen forwomen (1971–1980 arrival cohort for immigrants)Note: “All” controls include age, year, education, region, MSA, California, and Texas.
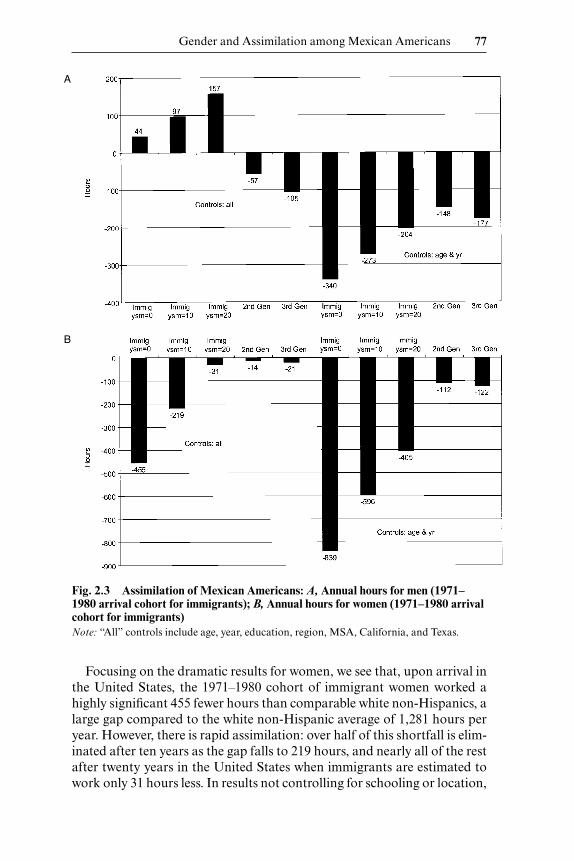
Focusing on the dramatic results for women, we see that, upon arrival inthe United States, the 1971–1980 cohort of immigrant women worked ahighly significant 455 fewer hours than comparable white non-Hispanics, alarge gap compared to the white non-Hispanic average of 1,281 hours peryear. However, there is rapid assimilation: over half of this shortfall is elim-inated after ten years as the gap falls to 219 hours, and nearly all of the restafter twenty years in the United States when immigrants are estimated towork only 31 hours less. In results not controlling for schooling or location,
Gender and Assimilation among Mexican Americans 77
A
B
Fig. 2.3 Assimilation of Mexican Americans: A, Annual hours for men (1971–1980 arrival cohort for immigrants); B, Annual hours for women (1971–1980 arrivalcohort for immigrants)Note: “All” controls include age, year, education, region, MSA, California, and Texas.
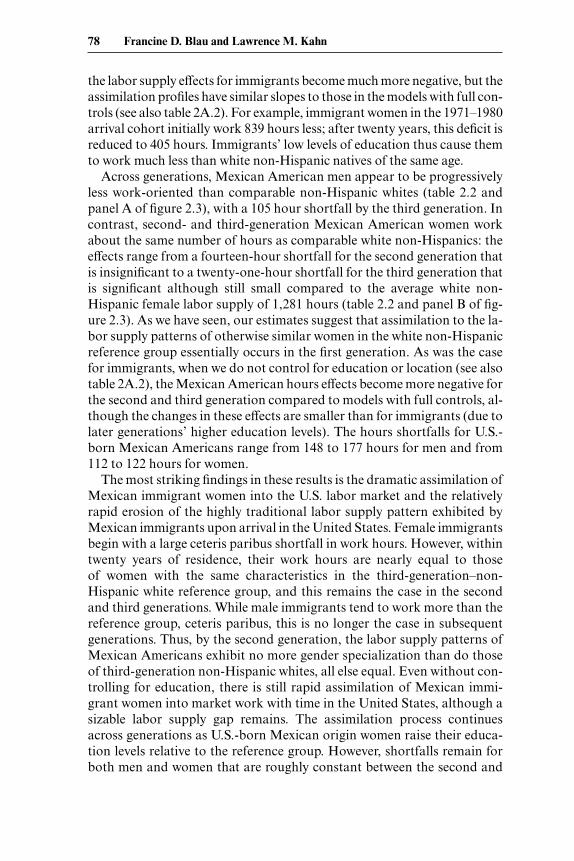
the labor supply effects for immigrants become much more negative, but theassimilation profiles have similar slopes to those in the models with full con-trols (see also table 2A.2). For example, immigrant women in the 1971–1980arrival cohort initially work 839 hours less; after twenty years, this deficit isreduced to 405 hours. Immigrants’ low levels of education thus cause themto work much less than white non-Hispanic natives of the same age.
Across generations, Mexican American men appear to be progressivelyless work-oriented than comparable non-Hispanic whites (table 2.2 andpanel A of figure 2.3), with a 105 hour shortfall by the third generation. Incontrast, second- and third-generation Mexican American women workabout the same number of hours as comparable white non-Hispanics: theeffects range from a fourteen-hour shortfall for the second generation thatis insignificant to a twenty-one-hour shortfall for the third generation thatis significant although still small compared to the average white non-Hispanic female labor supply of 1,281 hours (table 2.2 and panel B of fig-ure 2.3). As we have seen, our estimates suggest that assimilation to the la-bor supply patterns of otherwise similar women in the white non-Hispanicreference group essentially occurs in the first generation. As was the casefor immigrants, when we do not control for education or location (see alsotable 2A.2), the Mexican American hours effects become more negative forthe second and third generation compared to models with full controls, al-though the changes in these effects are smaller than for immigrants (due tolater generations’ higher education levels). The hours shortfalls for U.S.-born Mexican Americans range from 148 to 177 hours for men and from112 to 122 hours for women.
The most striking findings in these results is the dramatic assimilation ofMexican immigrant women into the U.S. labor market and the relativelyrapid erosion of the highly traditional labor supply pattern exhibited byMexican immigrants upon arrival in the United States. Female immigrantsbegin with a large ceteris paribus shortfall in work hours. However, withintwenty years of residence, their work hours are nearly equal to those of women with the same characteristics in the third-generation–non-Hispanic white reference group, and this remains the case in the secondand third generations. While male immigrants tend to work more than thereference group, ceteris paribus, this is no longer the case in subsequentgenerations. Thus, by the second generation, the labor supply patterns ofMexican Americans exhibit no more gender specialization than do thoseof third-generation non-Hispanic whites, all else equal. Even without con-trolling for education, there is still rapid assimilation of Mexican immi-grant women into market work with time in the United States, although asizable labor supply gap remains. The assimilation process continuesacross generations as U.S.-born Mexican origin women raise their educa-tion levels relative to the reference group. However, shortfalls remain forboth men and women that are roughly constant between the second and
78 Francine D. Blau and Lawrence M. Kahn
third generations, suggesting a lack of further convergence in annual hoursbeyond the second generation, a pattern noted in previous work and forother dependent variables.
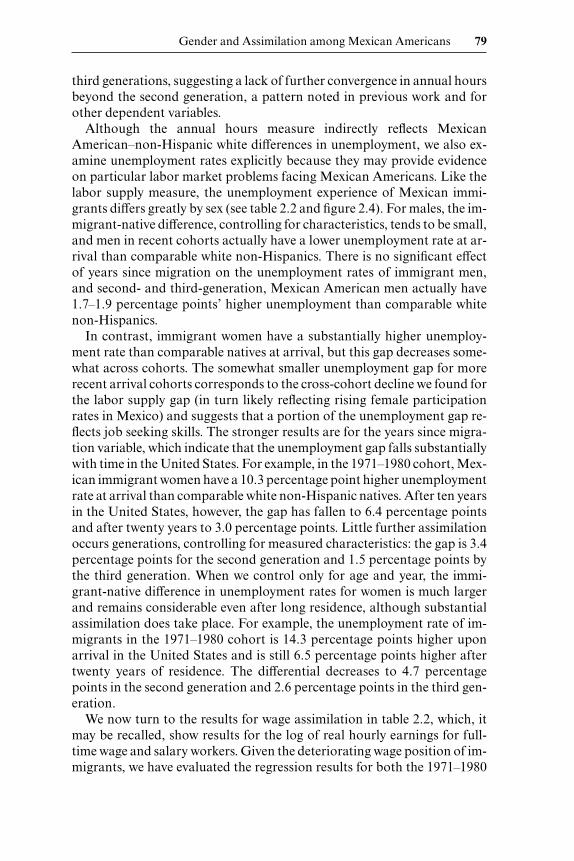
Although the annual hours measure indirectly reflects MexicanAmerican–non-Hispanic white differences in unemployment, we also ex-amine unemployment rates explicitly because they may provide evidenceon particular labor market problems facing Mexican Americans. Like thelabor supply measure, the unemployment experience of Mexican immi-grants differs greatly by sex (see table 2.2 and figure 2.4). For males, the im-migrant-native difference, controlling for characteristics, tends to be small,and men in recent cohorts actually have a lower unemployment rate at ar-rival than comparable white non-Hispanics. There is no significant effectof years since migration on the unemployment rates of immigrant men,and second- and third-generation, Mexican American men actually have1.7–1.9 percentage points’ higher unemployment than comparable whitenon-Hispanics.
In contrast, immigrant women have a substantially higher unemploy-ment rate than comparable natives at arrival, but this gap decreases some-what across cohorts. The somewhat smaller unemployment gap for morerecent arrival cohorts corresponds to the cross-cohort decline we found forthe labor supply gap (in turn likely reflecting rising female participationrates in Mexico) and suggests that a portion of the unemployment gap re-flects job seeking skills. The stronger results are for the years since migra-tion variable, which indicate that the unemployment gap falls substantiallywith time in the United States. For example, in the 1971–1980 cohort, Mex-ican immigrant women have a 10.3 percentage point higher unemploymentrate at arrival than comparable white non-Hispanic natives. After ten yearsin the United States, however, the gap has fallen to 6.4 percentage pointsand after twenty years to 3.0 percentage points. Little further assimilationoccurs generations, controlling for measured characteristics: the gap is 3.4percentage points for the second generation and 1.5 percentage points bythe third generation. When we control only for age and year, the immi-grant-native difference in unemployment rates for women is much largerand remains considerable even after long residence, although substantialassimilation does take place. For example, the unemployment rate of im-migrants in the 1971–1980 cohort is 14.3 percentage points higher uponarrival in the United States and is still 6.5 percentage points higher aftertwenty years of residence. The differential decreases to 4.7 percentagepoints in the second generation and 2.6 percentage points in the third gen-eration.
We now turn to the results for wage assimilation in table 2.2, which, itmay be recalled, show results for the log of real hourly earnings for full-time wage and salary workers. Given the deteriorating wage position of im-migrants, we have evaluated the regression results for both the 1971–1980
Gender and Assimilation among Mexican Americans 79
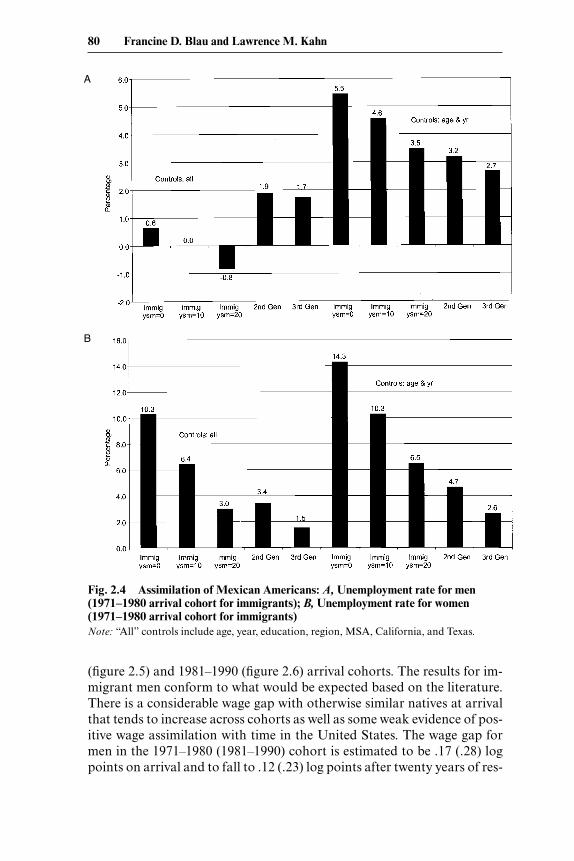
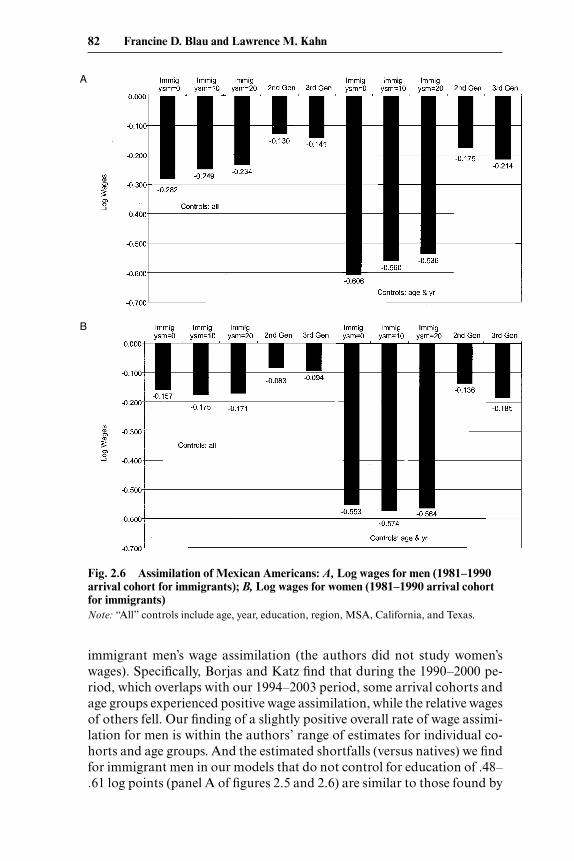
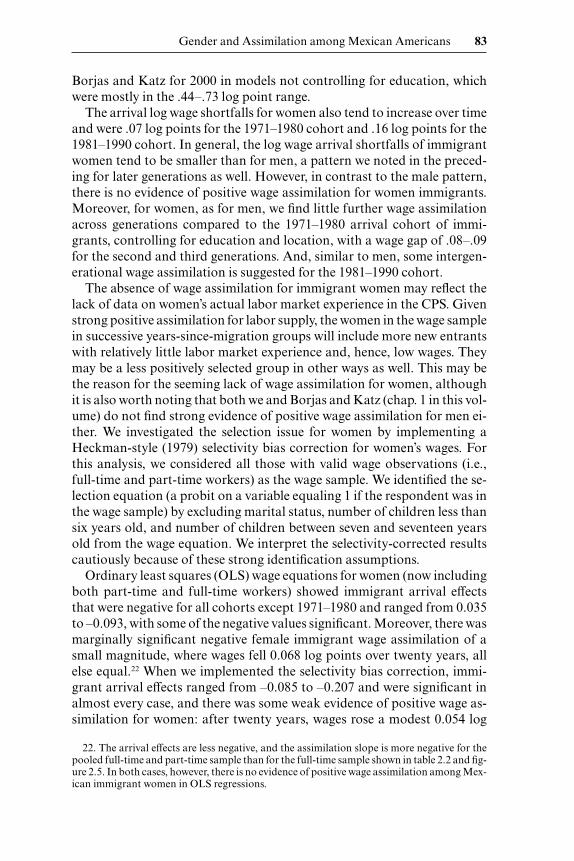
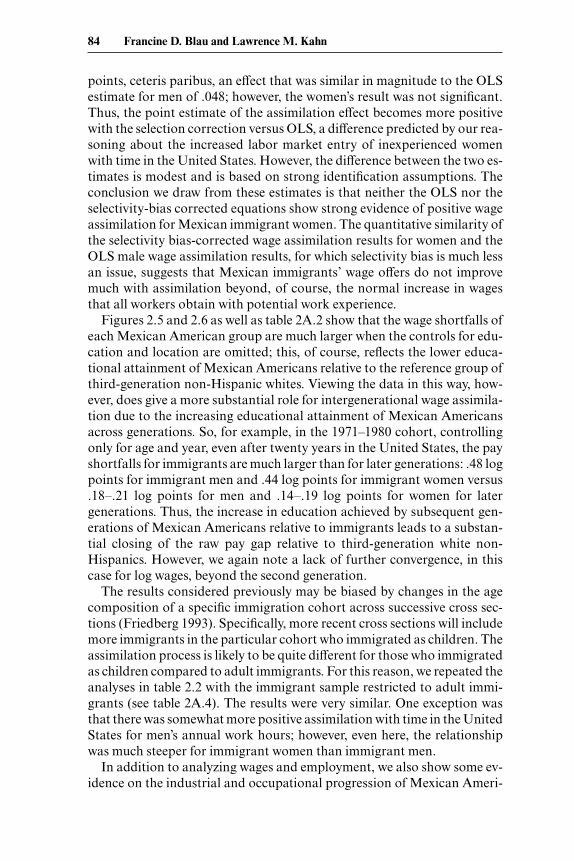
(figure 2.5) and 1981–1990 (figure 2.6) arrival cohorts. The results for im-migrant men conform to what would be expected based on the literature.There is a considerable wage gap with otherwise similar natives at arrivalthat tends to increase across cohorts as well as some weak evidence of pos-itive wage assimilation with time in the United States. The wage gap formen in the 1971–1980 (1981–1990) cohort is estimated to be .17 (.28) logpoints on arrival and to fall to .12 (.23) log points after twenty years of res-
80 Francine D. Blau and Lawrence M. Kahn
A
B
Fig. 2.4 Assimilation of Mexican Americans: A, Unemployment rate for men(1971–1980 arrival cohort for immigrants); B, Unemployment rate for women(1971–1980 arrival cohort for immigrants)Note: “All” controls include age, year, education, region, MSA, California, and Texas.
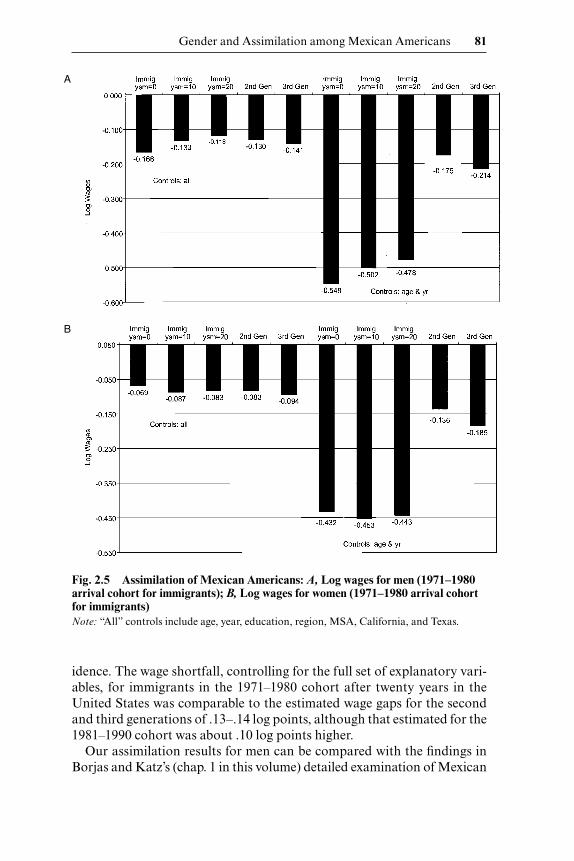
idence. The wage shortfall, controlling for the full set of explanatory vari-ables, for immigrants in the 1971–1980 cohort after twenty years in theUnited States was comparable to the estimated wage gaps for the secondand third generations of .13–.14 log points, although that estimated for the1981–1990 cohort was about .10 log points higher.
Our assimilation results for men can be compared with the findings inBorjas and Katz’s (chap. 1 in this volume) detailed examination of Mexican
Gender and Assimilation among Mexican Americans 81
A
B
Fig. 2.5 Assimilation of Mexican Americans: A, Log wages for men (1971–1980arrival cohort for immigrants); B, Log wages for women (1971–1980 arrival cohortfor immigrants)Note: “All” controls include age, year, education, region, MSA, California, and Texas.
immigrant men’s wage assimilation (the authors did not study women’swages). Specifically, Borjas and Katz find that during the 1990–2000 pe-riod, which overlaps with our 1994–2003 period, some arrival cohorts andage groups experienced positive wage assimilation, while the relative wagesof others fell. Our finding of a slightly positive overall rate of wage assimi-lation for men is within the authors’ range of estimates for individual co-horts and age groups. And the estimated shortfalls (versus natives) we findfor immigrant men in our models that do not control for education of .48–.61 log points (panel A of figures 2.5 and 2.6) are similar to those found by
82 Francine D. Blau and Lawrence M. Kahn
A
B
Fig. 2.6 Assimilation of Mexican Americans: A, Log wages for men (1981–1990arrival cohort for immigrants); B, Log wages for women (1981–1990 arrival cohortfor immigrants)Note: “All” controls include age, year, education, region, MSA, California, and Texas.
Borjas and Katz for 2000 in models not controlling for education, whichwere mostly in the .44–.73 log point range.
The arrival log wage shortfalls for women also tend to increase over timeand were .07 log points for the 1971–1980 cohort and .16 log points for the1981–1990 cohort. In general, the log wage arrival shortfalls of immigrantwomen tend to be smaller than for men, a pattern we noted in the preced-ing for later generations as well. However, in contrast to the male pattern,there is no evidence of positive wage assimilation for women immigrants.Moreover, for women, as for men, we find little further wage assimilationacross generations compared to the 1971–1980 arrival cohort of immi-grants, controlling for education and location, with a wage gap of .08–.09for the second and third generations. And, similar to men, some intergen-erational wage assimilation is suggested for the 1981–1990 cohort.
The absence of wage assimilation for immigrant women may reflect thelack of data on women’s actual labor market experience in the CPS. Givenstrong positive assimilation for labor supply, the women in the wage samplein successive years-since-migration groups will include more new entrantswith relatively little labor market experience and, hence, low wages. Theymay be a less positively selected group in other ways as well. This may bethe reason for the seeming lack of wage assimilation for women, althoughit is also worth noting that both we and Borjas and Katz (chap. 1 in this vol-ume) do not find strong evidence of positive wage assimilation for men ei-ther. We investigated the selection issue for women by implementing aHeckman-style (1979) selectivity bias correction for women’s wages. Forthis analysis, we considered all those with valid wage observations (i.e.,full-time and part-time workers) as the wage sample. We identified the se-lection equation (a probit on a variable equaling 1 if the respondent was inthe wage sample) by excluding marital status, number of children less thansix years old, and number of children between seven and seventeen yearsold from the wage equation. We interpret the selectivity-corrected resultscautiously because of these strong identification assumptions.
Ordinary least squares (OLS) wage equations for women (now includingboth part-time and full-time workers) showed immigrant arrival effectsthat were negative for all cohorts except 1971–1980 and ranged from 0.035to –0.093, with some of the negative values significant. Moreover, there wasmarginally significant negative female immigrant wage assimilation of asmall magnitude, where wages fell 0.068 log points over twenty years, allelse equal.22 When we implemented the selectivity bias correction, immi-grant arrival effects ranged from –0.085 to –0.207 and were significant inalmost every case, and there was some weak evidence of positive wage as-similation for women: after twenty years, wages rose a modest 0.054 log
Gender and Assimilation among Mexican Americans 83
22. The arrival effects are less negative, and the assimilation slope is more negative for thepooled full-time and part-time sample than for the full-time sample shown in table 2.2 and fig-ure 2.5. In both cases, however, there is no evidence of positive wage assimilation among Mex-ican immigrant women in OLS regressions.
points, ceteris paribus, an effect that was similar in magnitude to the OLSestimate for men of .048; however, the women’s result was not significant.Thus, the point estimate of the assimilation effect becomes more positivewith the selection correction versus OLS, a difference predicted by our rea-soning about the increased labor market entry of inexperienced womenwith time in the United States. However, the difference between the two es-timates is modest and is based on strong identification assumptions. Theconclusion we draw from these estimates is that neither the OLS nor theselectivity-bias corrected equations show strong evidence of positive wageassimilation for Mexican immigrant women. The quantitative similarity ofthe selectivity bias-corrected wage assimilation results for women and theOLS male wage assimilation results, for which selectivity bias is much lessan issue, suggests that Mexican immigrants’ wage offers do not improvemuch with assimilation beyond, of course, the normal increase in wagesthat all workers obtain with potential work experience.
Figures 2.5 and 2.6 as well as table 2A.2 show that the wage shortfalls ofeach Mexican American group are much larger when the controls for edu-cation and location are omitted; this, of course, reflects the lower educa-tional attainment of Mexican Americans relative to the reference group ofthird-generation non-Hispanic whites. Viewing the data in this way, how-ever, does give a more substantial role for intergenerational wage assimila-tion due to the increasing educational attainment of Mexican Americansacross generations. So, for example, in the 1971–1980 cohort, controllingonly for age and year, even after twenty years in the United States, the payshortfalls for immigrants are much larger than for later generations: .48 logpoints for immigrant men and .44 log points for immigrant women versus.18–.21 log points for men and .14–.19 log points for women for latergenerations. Thus, the increase in education achieved by subsequent gen-erations of Mexican Americans relative to immigrants leads to a substan-tial closing of the raw pay gap relative to third-generation white non-Hispanics. However, we again note a lack of further convergence, in thiscase for log wages, beyond the second generation.
The results considered previously may be biased by changes in the agecomposition of a specific immigration cohort across successive cross sec-tions (Friedberg 1993). Specifically, more recent cross sections will includemore immigrants in the particular cohort who immigrated as children. Theassimilation process is likely to be quite different for those who immigratedas children compared to adult immigrants. For this reason, we repeated theanalyses in table 2.2 with the immigrant sample restricted to adult immi-grants (see table 2A.4). The results were very similar. One exception wasthat there was somewhat more positive assimilation with time in the UnitedStates for men’s annual work hours; however, even here, the relationshipwas much steeper for immigrant women than immigrant men.
In addition to analyzing wages and employment, we also show some ev-idence on the industrial and occupational progression of Mexican Ameri-
84 Francine D. Blau and Lawrence M. Kahn
cans within and across generations. Sectoral representation can be an im-portant indicator of the degree of integration into American society. Table2A.5 shows the distributions of workers across occupations and indus-tries.23 We distinguish immigrants according to whether they migrated asadults, and we also show separate statistics for immigrants who were in theUnited States at least ten years. Comparing these long-term immigrants tothe overall immigrant sample shows the combined effects of time in theUnited States as well as selective return migration and changing cohortcharacteristics.
Looking first at industry distribution, one of the most dramatic differ-ences between Mexican immigrants and the white non-Hispanic referencegroup is that Mexican immigrants, especially men, are much more likely to work in agriculture. However, by the second generation, the MexicanAmerican female incidence of farm work is virtually the same as for non-Hispanic whites, while that for Mexican American men is only slightlyhigher than that of non-Hispanic white men. And by the third generation,male agricultural employment is virtually indistinguishable from that ofnon-Hispanic whites. There is also a dramatic cross-generation movementof Mexican American women out of nondurable manufacturing intohealth and education services. A similar but less dramatic developmentalso characterizes the movement of Mexican-American men across gener-ations out of construction.
Regarding occupations, there is a notable movement across generationsof Mexican American men out of personal service, farmworker, and oper-ative jobs into managerial and professional jobs. For women, there is a dra-matic move out of operative and personal service jobs into managerial,professional, and, especially, clerical occupations. While most of this oc-cupational movement occurs across generations, there appears also to besome upgrading of immigrants with time in the United States, as suggestedby the results for long-term versus all immigrants. Of course, these latterdifferences may also be due to cohort effects or selective return migration.
Tables 2.3 and 2.4 summarize the impact of these occupational and in-dustrial shifts on segregation indexes by gender (table 2.3) and by ethnicity(table 2.4).24 Looking first at table 2.3, we see that differences in industrysegregation by gender between Mexican Americans and the non-Hispanic
Gender and Assimilation among Mexican Americans 85
23. In 2003, there was a major change in CPS occupation and industry codes based on thechanges in these codes adopted in the 2000 Census. Crosswalk information available at theCensus Web site (http://www.census.gov/hhes/www/ioindex/crosswalks.html) was used to as-sign incumbents in the 2003 CPS to the 1990 Census categories employed in earlier CPSs onthe basis of the category into which the largest number of individuals in their detailed occu-pation or industry would have been allocated.
24. The segregation index is defined, for example for gender, as the fraction of the male or female work force that would have to change jobs in order to achieve parity. It is equal to .5 � Σi⏐mi – fi⏐, where i represents sector (occupation or industry), and mi and fi are, respec-tively, the proportions of the total male and female work force employed in sector i. As else-where, the reference group for the analysis by ethnicity is white non-Hispanic natives.
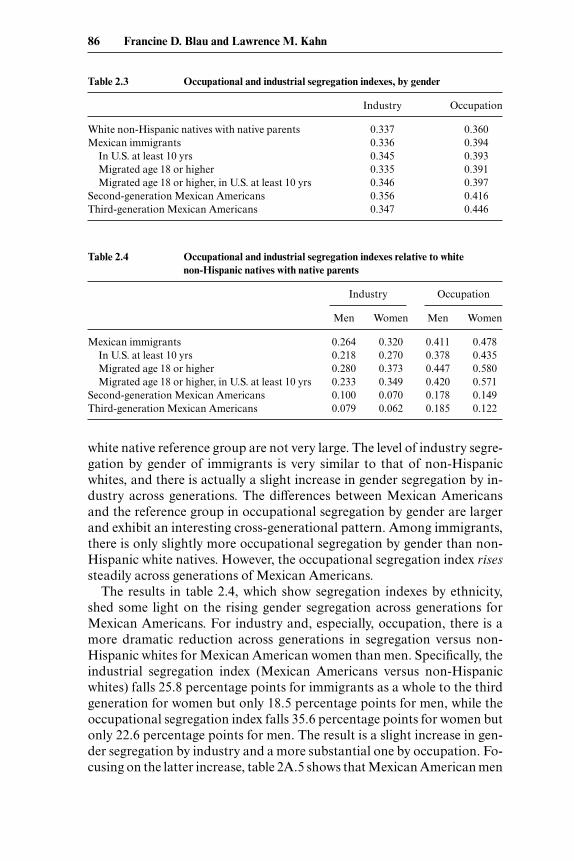
white native reference group are not very large. The level of industry segre-gation by gender of immigrants is very similar to that of non-Hispanicwhites, and there is actually a slight increase in gender segregation by in-dustry across generations. The differences between Mexican Americansand the reference group in occupational segregation by gender are largerand exhibit an interesting cross-generational pattern. Among immigrants,there is only slightly more occupational segregation by gender than non-Hispanic white natives. However, the occupational segregation index rises
steadily across generations of Mexican Americans.The results in table 2.4, which show segregation indexes by ethnicity,
shed some light on the rising gender segregation across generations forMexican Americans. For industry and, especially, occupation, there is amore dramatic reduction across generations in segregation versus non-Hispanic whites for Mexican American women than men. Specifically, theindustrial segregation index (Mexican Americans versus non-Hispanicwhites) falls 25.8 percentage points for immigrants as a whole to the thirdgeneration for women but only 18.5 percentage points for men, while theoccupational segregation index falls 35.6 percentage points for women butonly 22.6 percentage points for men. The result is a slight increase in gen-der segregation by industry and a more substantial one by occupation. Fo-cusing on the latter increase, table 2A.5 shows that Mexican American men
86 Francine D. Blau and Lawrence M. Kahn
Table 2.3 Occupational and industrial segregation indexes, by gender
Industry Occupation
White non-Hispanic natives with native parents 0.337 0.360Mexican immigrants 0.336 0.394
In U.S. at least 10 yrs 0.345 0.393Migrated age 18 or higher 0.335 0.391Migrated age 18 or higher, in U.S. at least 10 yrs 0.346 0.397
Second-generation Mexican Americans 0.356 0.416Third-generation Mexican Americans 0.347 0.446
Table 2.4 Occupational and industrial segregation indexes relative to white non-Hispanic natives with native parents
Industry Occupation
Men Women Men Women
Mexican immigrants 0.264 0.320 0.411 0.478In U.S. at least 10 yrs 0.218 0.270 0.378 0.435Migrated age 18 or higher 0.280 0.373 0.447 0.580Migrated age 18 or higher, in U.S. at least 10 yrs 0.233 0.349 0.420 0.571
Second-generation Mexican Americans 0.100 0.070 0.178 0.149Third-generation Mexican Americans 0.079 0.062 0.185 0.122
have moved into white-collar jobs to a lesser extent than Mexican Ameri-can women. For example, table 2A.5 shows that 11.8 percent of Mexicanimmigrant men and 28.0 percent of Mexican immigrant women worked inmanagerial, professional, clerical, or sales jobs; by the third generation,these figures were 34.7 percent for men and fully 68.8 percent for women.25
2.5 The Family Migration Model: Regression Results
Our data can be used to study the relevance of the family migrationmodel for Mexican American immigrants. This exercise is additionally ofinterest because it enables us to ascertain whether we obtain similar find-ings to those in the preceding when we focus on married individuals and ex-plicitly take into account spouses’ characteristics. To address these ques-tions, we constructed a file using the CPS data that consisted of marriedindividuals for whom we could identify the ethnicity and nativity of bothhusband and wife. We restricted the sample to women (men) who were ofMexican origin and to a reference group of women (men) who were them-selves third-generation white non-Hispanics and were married to third-generation white non-Hispanics. (The latter constitute the reference cate-gory in the female and male regressions.) Recall that the family migrationmodel asserts that immigrant women upon arrival work to support theirhusbands’ human capital investments but later reduce their labor supply.This model thus implies positive cohort arrival effects and negative assim-ilation profiles for women’s work hours; in addition, the model suggeststhat women do not invest in their own human capital, implying perhapsless positively sloped wage assimilation profiles for women than men.
As may be seen in table 2.5, Mexican Americans of both sexes have avery high probability—82 to 83 percent—of having a Mexican Americanspouse. This incidence is particularly high for immigrants, with 92 percentof both men and women having a spouse who is of Mexican origin. Fully84 percent of female immigrants and 79 percent of male immigrants havespouses who are themselves Mexican immigrants. Although we do notknow when these marriages took place, the higher percentage of femalethan male Mexican immigrants whose spouse is a Mexican immigrant isconsistent with our preceding finding that immigration tends to be a fam-ily decision for women and that the incidence of being married (spousepresent) is high upon arrival in the United States. Of course, marriages to
Gender and Assimilation among Mexican Americans 87
25. Tables 2.4 and 2A.5 also show that the occupation and industry distribution of adultimmigrants is more dissimilar to non-Hispanic whites than is the case for immigrants in gen-eral and that, among immigrants, there is more integration (relative to non-Hispanic whites)among long-term immigrants than for the immigrant group as a whole. (This latter pattern isespecially pronounced for the “all immigrants” group.) These patterns for adult immigrantsare consistent with their larger educational shortfalls, while those for long-term immigrantsmay be due to assimilation, cohort effects, or selective return migration.
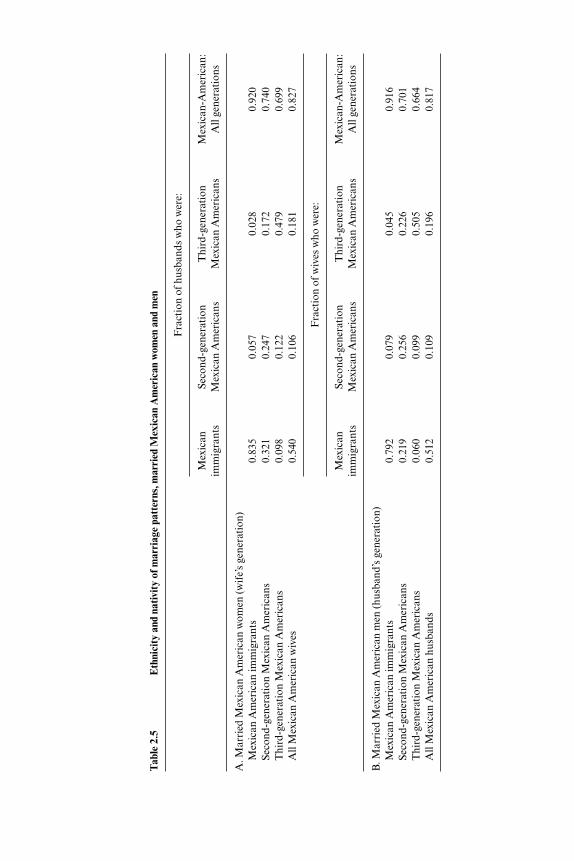
Tab
le 2
.5E
thni
city
and
nat
ivit
y of
mar
riag
e pa
tter
ns, m
arri
ed M
exic
an A
mer
ican
wom
en a
nd m
en
Fra
ctio
n of
hus
band
s w
ho w
ere:
Mex
ican
Seco
nd-g
ener
atio
n T
hird
-gen
erat
ion
Mex
ican
-Am
eric
an:
imm
igra
nts
Mex
ican
Am
eric
ans
Mex
ican
Am
eric
ans
All
gene
rati
ons
A. M
arri
ed M
exic
an A
mer
ican
wom
en (w
ife’
s ge
nera
tion
)M
exic
an A
mer
ican
imm
igra
nts
0.83
50.
057
0.02
80.
920
Seco
nd-g
ener
atio
n M
exic
an A
mer
ican
s0.
321
0.24
70.
172
0.74
0T
hird
-gen
erat
ion
Mex
ican
Am
eric
ans
0.09
80.
122
0.47
90.
699
All
Mex
ican
Am
eric
an w
ives
0.54
00.
106
0.18
10.
827
Fra
ctio
n of
wiv
es w
ho w
ere:
Mex
ican
Seco
nd-g
ener
atio
n T
hird
-gen
erat
ion
Mex
ican
-Am
eric
an:
imm
igra
nts
Mex
ican
Am
eric
ans
Mex
ican
Am
eric
ans
All
gene
rati
ons
B. M
arri
ed M
exic
an A
mer
ican
men
(hus
band
’s ge
nera
tion
)M
exic
an A
mer
ican
imm
igra
nts
0.79
20.
079
0.04
50.
916
Seco
nd-g
ener
atio
n M
exic
an A
mer
ican
s0.
219
0.25
60.
226
0.70
1T
hird
-gen
erat
ion
Mex
ican
Am
eric
ans
0.06
00.
099
0.50
50.
664
All
Mex
ican
Am
eric
an h
usba
nds
0.51
20.
109
0.19
60.
817
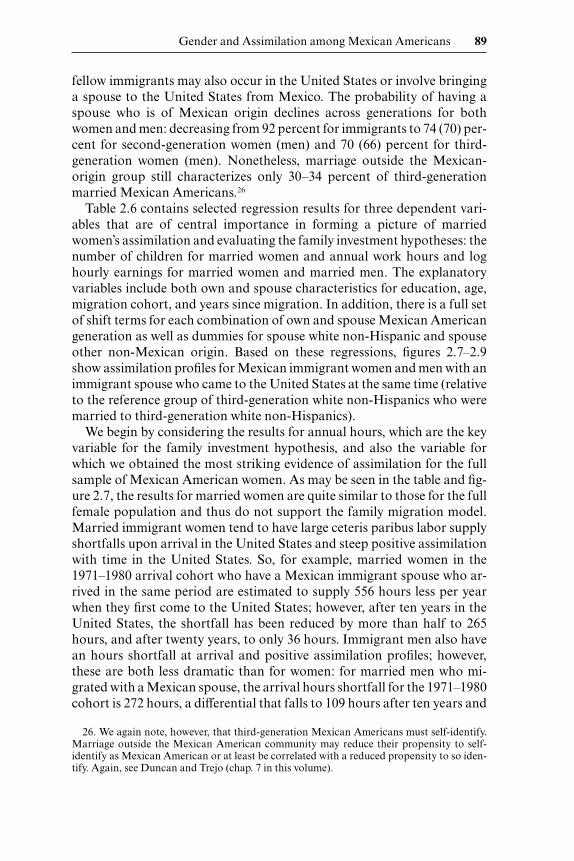
fellow immigrants may also occur in the United States or involve bringinga spouse to the United States from Mexico. The probability of having aspouse who is of Mexican origin declines across generations for bothwomen and men: decreasing from 92 percent for immigrants to 74 (70) per-cent for second-generation women (men) and 70 (66) percent for third-generation women (men). Nonetheless, marriage outside the Mexican-origin group still characterizes only 30–34 percent of third-generationmarried Mexican Americans.26
Table 2.6 contains selected regression results for three dependent vari-ables that are of central importance in forming a picture of marriedwomen’s assimilation and evaluating the family investment hypotheses: thenumber of children for married women and annual work hours and loghourly earnings for married women and married men. The explanatoryvariables include both own and spouse characteristics for education, age,migration cohort, and years since migration. In addition, there is a full setof shift terms for each combination of own and spouse Mexican Americangeneration as well as dummies for spouse white non-Hispanic and spouseother non-Mexican origin. Based on these regressions, figures 2.7–2.9show assimilation profiles for Mexican immigrant women and men with animmigrant spouse who came to the United States at the same time (relativeto the reference group of third-generation white non-Hispanics who weremarried to third-generation white non-Hispanics).
We begin by considering the results for annual hours, which are the keyvariable for the family investment hypothesis, and also the variable forwhich we obtained the most striking evidence of assimilation for the fullsample of Mexican American women. As may be seen in the table and fig-ure 2.7, the results for married women are quite similar to those for the fullfemale population and thus do not support the family migration model.Married immigrant women tend to have large ceteris paribus labor supplyshortfalls upon arrival in the United States and steep positive assimilationwith time in the United States. So, for example, married women in the1971–1980 arrival cohort who have a Mexican immigrant spouse who ar-rived in the same period are estimated to supply 556 hours less per yearwhen they first come to the United States; however, after ten years in theUnited States, the shortfall has been reduced by more than half to 265hours, and after twenty years, to only 36 hours. Immigrant men also havean hours shortfall at arrival and positive assimilation profiles; however,these are both less dramatic than for women: for married men who mi-grated with a Mexican spouse, the arrival hours shortfall for the 1971–1980cohort is 272 hours, a differential that falls to 109 hours after ten years and
Gender and Assimilation among Mexican Americans 89
26. We again note, however, that third-generation Mexican Americans must self-identify.Marriage outside the Mexican American community may reduce their propensity to self-identify as Mexican American or at least be correlated with a reduced propensity to so iden-tify. Again, see Duncan and Trejo (chap. 7 in this volume).
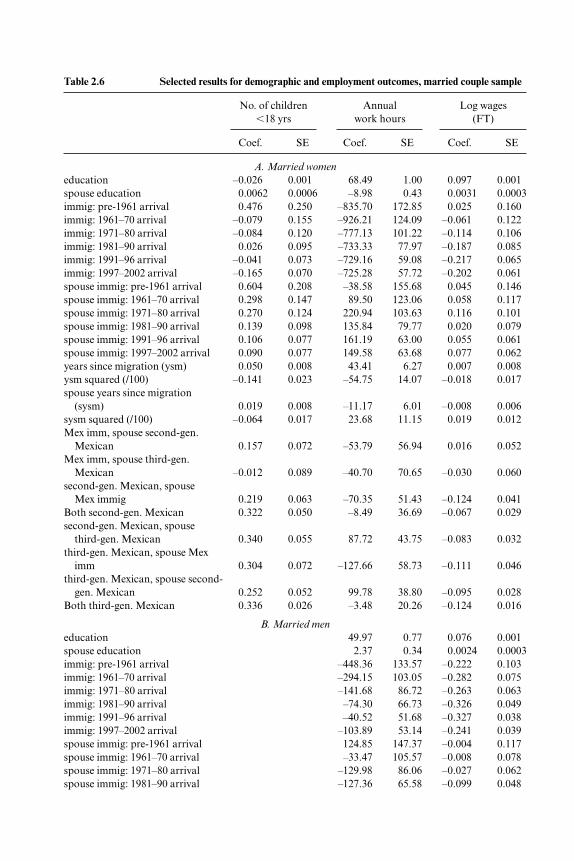
Table 2.6 Selected results for demographic and employment outcomes, married couple sample
No. of children Annual Log wages �18 yrs work hours (FT)
Coef. SE Coef. SE Coef. SE
A. Married women
education –0.026 0.001 68.49 1.00 0.097 0.001spouse education 0.0062 0.0006 –8.98 0.43 0.0031 0.0003immig: pre-1961 arrival 0.476 0.250 –835.70 172.85 0.025 0.160immig: 1961–70 arrival –0.079 0.155 –926.21 124.09 –0.061 0.122immig: 1971–80 arrival –0.084 0.120 –777.13 101.22 –0.114 0.106immig: 1981–90 arrival 0.026 0.095 –733.33 77.97 –0.187 0.085immig: 1991–96 arrival –0.041 0.073 –729.16 59.08 –0.217 0.065immig: 1997–2002 arrival –0.165 0.070 –725.28 57.72 –0.202 0.061spouse immig: pre-1961 arrival 0.604 0.208 –38.58 155.68 0.045 0.146spouse immig: 1961–70 arrival 0.298 0.147 89.50 123.06 0.058 0.117spouse immig: 1971–80 arrival 0.270 0.124 220.94 103.63 0.116 0.101spouse immig: 1981–90 arrival 0.139 0.098 135.84 79.77 0.020 0.079spouse immig: 1991–96 arrival 0.106 0.077 161.19 63.00 0.055 0.061spouse immig: 1997–2002 arrival 0.090 0.077 149.58 63.68 0.077 0.062years since migration (ysm) 0.050 0.008 43.41 6.27 0.007 0.008ysm squared (/100) –0.141 0.023 –54.75 14.07 –0.018 0.017spouse years since migration
(sysm) 0.019 0.008 –11.17 6.01 –0.008 0.006sysm squared (/100) –0.064 0.017 23.68 11.15 0.019 0.012Mex imm, spouse second-gen.
Mexican 0.157 0.072 –53.79 56.94 0.016 0.052Mex imm, spouse third-gen.
Mexican –0.012 0.089 –40.70 70.65 –0.030 0.060second-gen. Mexican, spouse
Mex immig 0.219 0.063 –70.35 51.43 –0.124 0.041Both second-gen. Mexican 0.322 0.050 –8.49 36.69 –0.067 0.029second-gen. Mexican, spouse
third-gen. Mexican 0.340 0.055 87.72 43.75 –0.083 0.032third-gen. Mexican, spouse Mex
imm 0.304 0.072 –127.66 58.73 –0.111 0.046third-gen. Mexican, spouse second-
gen. Mexican 0.252 0.052 99.78 38.80 –0.095 0.028Both third-gen. Mexican 0.336 0.026 –3.48 20.26 –0.124 0.016
B. Married men
education 49.97 0.77 0.076 0.001spouse education 2.37 0.34 0.0024 0.0003immig: pre-1961 arrival –448.36 133.57 –0.222 0.103immig: 1961–70 arrival –294.15 103.05 –0.282 0.075immig: 1971–80 arrival –141.68 86.72 –0.263 0.063immig: 1981–90 arrival –74.30 66.73 –0.326 0.049immig: 1991–96 arrival –40.52 51.68 –0.327 0.038immig: 1997–2002 arrival –103.89 53.14 –0.241 0.039spouse immig: pre-1961 arrival 124.85 147.37 –0.004 0.117spouse immig: 1961–70 arrival –33.47 105.57 –0.008 0.078spouse immig: 1971–80 arrival –129.98 86.06 –0.027 0.062spouse immig: 1981–90 arrival –127.36 65.58 –0.099 0.048
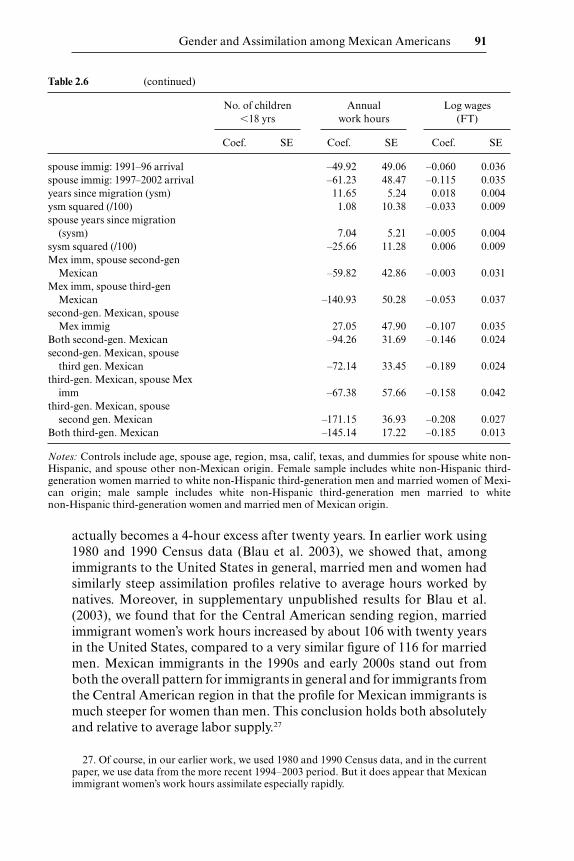
actually becomes a 4-hour excess after twenty years. In earlier work using1980 and 1990 Census data (Blau et al. 2003), we showed that, amongimmigrants to the United States in general, married men and women hadsimilarly steep assimilation profiles relative to average hours worked bynatives. Moreover, in supplementary unpublished results for Blau et al.(2003), we found that for the Central American sending region, marriedimmigrant women’s work hours increased by about 106 with twenty yearsin the United States, compared to a very similar figure of 116 for marriedmen. Mexican immigrants in the 1990s and early 2000s stand out fromboth the overall pattern for immigrants in general and for immigrants fromthe Central American region in that the profile for Mexican immigrants ismuch steeper for women than men. This conclusion holds both absolutelyand relative to average labor supply.27
Gender and Assimilation among Mexican Americans 91
27. Of course, in our earlier work, we used 1980 and 1990 Census data, and in the currentpaper, we use data from the more recent 1994–2003 period. But it does appear that Mexicanimmigrant women’s work hours assimilate especially rapidly.
spouse immig: 1991–96 arrival –49.92 49.06 –0.060 0.036spouse immig: 1997–2002 arrival –61.23 48.47 –0.115 0.035years since migration (ysm) 11.65 5.24 0.018 0.004ysm squared (/100) 1.08 10.38 –0.033 0.009spouse years since migration
(sysm) 7.04 5.21 –0.005 0.004sysm squared (/100) –25.66 11.28 0.006 0.009Mex imm, spouse second-gen
Mexican –59.82 42.86 –0.003 0.031Mex imm, spouse third-gen
Mexican –140.93 50.28 –0.053 0.037second-gen. Mexican, spouse
Mex immig 27.05 47.90 –0.107 0.035Both second-gen. Mexican –94.26 31.69 –0.146 0.024second-gen. Mexican, spouse
third gen. Mexican –72.14 33.45 –0.189 0.024third-gen. Mexican, spouse Mex
imm –67.38 57.66 –0.158 0.042third-gen. Mexican, spouse
second gen. Mexican –171.15 36.93 –0.208 0.027Both third-gen. Mexican –145.14 17.22 –0.185 0.013
Notes: Controls include age, spouse age, region, msa, calif, texas, and dummies for spouse white non-Hispanic, and spouse other non-Mexican origin. Female sample includes white non-Hispanic third-generation women married to white non-Hispanic third-generation men and married women of Mexi-can origin; male sample includes white non-Hispanic third-generation men married to whitenon-Hispanic third-generation women and married men of Mexican origin.
Table 2.6 (continued)
No. of children Annual Log wages �18 yrs work hours (FT)
Coef. SE Coef. SE Coef. SE
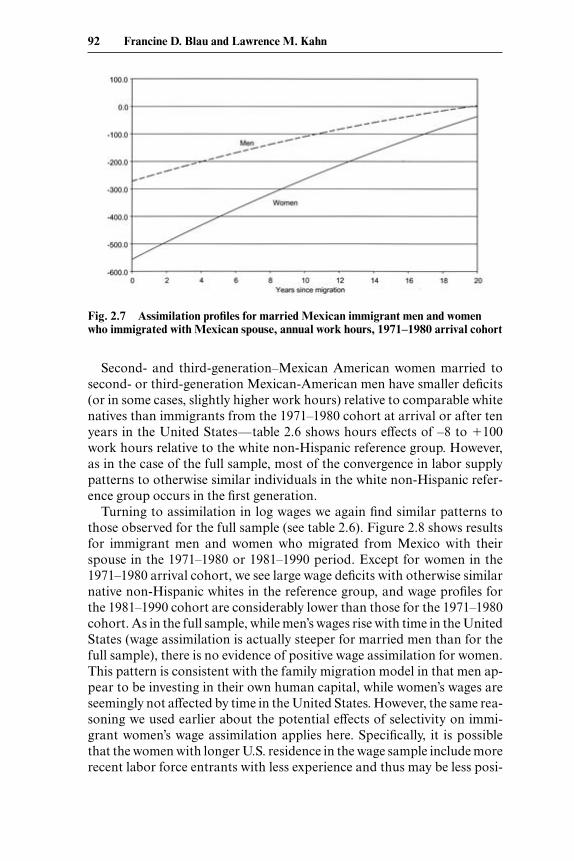
Second- and third-generation–Mexican American women married tosecond- or third-generation Mexican-American men have smaller deficits(or in some cases, slightly higher work hours) relative to comparable whitenatives than immigrants from the 1971–1980 cohort at arrival or after tenyears in the United States—table 2.6 shows hours effects of –8 to �100work hours relative to the white non-Hispanic reference group. However,as in the case of the full sample, most of the convergence in labor supplypatterns to otherwise similar individuals in the white non-Hispanic refer-ence group occurs in the first generation.
Turning to assimilation in log wages we again find similar patterns tothose observed for the full sample (see table 2.6). Figure 2.8 shows resultsfor immigrant men and women who migrated from Mexico with theirspouse in the 1971–1980 or 1981–1990 period. Except for women in the1971–1980 arrival cohort, we see large wage deficits with otherwise similarnative non-Hispanic whites in the reference group, and wage profiles forthe 1981–1990 cohort are considerably lower than those for the 1971–1980cohort. As in the full sample, while men’s wages rise with time in the UnitedStates (wage assimilation is actually steeper for married men than for thefull sample), there is no evidence of positive wage assimilation for women.This pattern is consistent with the family migration model in that men ap-pear to be investing in their own human capital, while women’s wages areseemingly not affected by time in the United States. However, the same rea-soning we used earlier about the potential effects of selectivity on immi-grant women’s wage assimilation applies here. Specifically, it is possiblethat the women with longer U.S. residence in the wage sample include morerecent labor force entrants with less experience and thus may be less posi-
92 Francine D. Blau and Lawrence M. Kahn
Fig. 2.7 Assimilation profiles for married Mexican immigrant men and womenwho immigrated with Mexican spouse, annual work hours, 1971–1980 arrival cohort
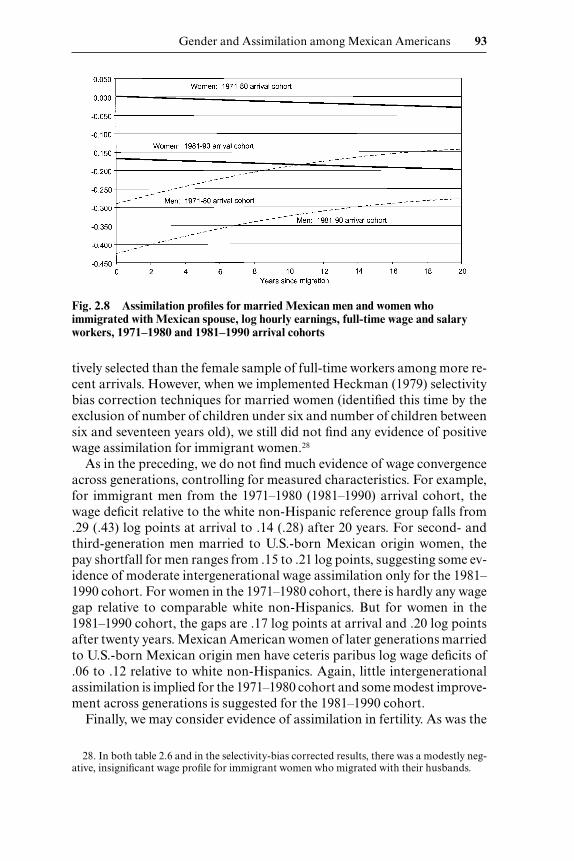
tively selected than the female sample of full-time workers among more re-cent arrivals. However, when we implemented Heckman (1979) selectivitybias correction techniques for married women (identified this time by theexclusion of number of children under six and number of children betweensix and seventeen years old), we still did not find any evidence of positivewage assimilation for immigrant women.28
As in the preceding, we do not find much evidence of wage convergenceacross generations, controlling for measured characteristics. For example,for immigrant men from the 1971–1980 (1981–1990) arrival cohort, thewage deficit relative to the white non-Hispanic reference group falls from.29 (.43) log points at arrival to .14 (.28) after 20 years. For second- andthird-generation men married to U.S.-born Mexican origin women, thepay shortfall for men ranges from .15 to .21 log points, suggesting some ev-idence of moderate intergenerational wage assimilation only for the 1981–1990 cohort. For women in the 1971–1980 cohort, there is hardly any wagegap relative to comparable white non-Hispanics. But for women in the1981–1990 cohort, the gaps are .17 log points at arrival and .20 log pointsafter twenty years. Mexican American women of later generations marriedto U.S.-born Mexican origin men have ceteris paribus log wage deficits of.06 to .12 relative to white non-Hispanics. Again, little intergenerationalassimilation is implied for the 1971–1980 cohort and some modest improve-ment across generations is suggested for the 1981–1990 cohort.
Finally, we may consider evidence of assimilation in fertility. As was the
Gender and Assimilation among Mexican Americans 93
28. In both table 2.6 and in the selectivity-bias corrected results, there was a modestly neg-ative, insignificant wage profile for immigrant women who migrated with their husbands.
Fig. 2.8 Assimilation profiles for married Mexican men and women whoimmigrated with Mexican spouse, log hourly earnings, full-time wage and salaryworkers, 1971–1980 and 1981–1990 arrival cohorts
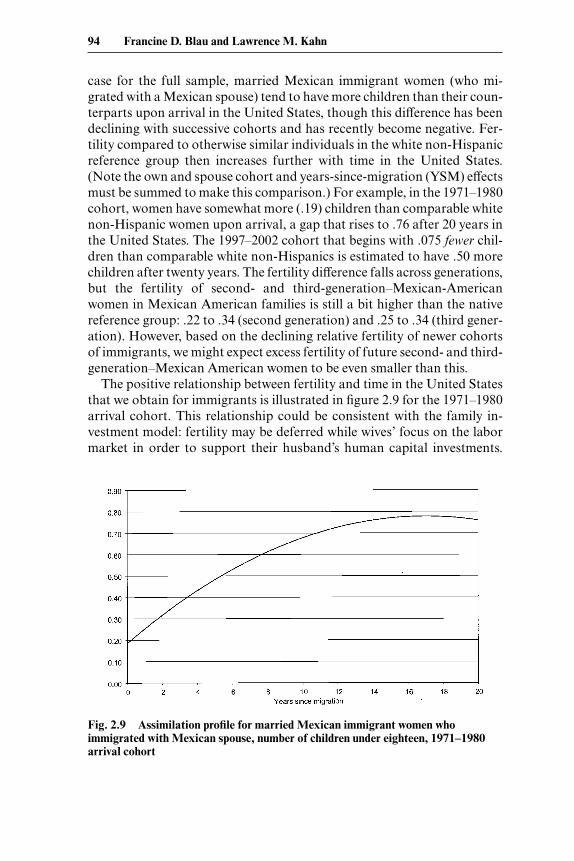
case for the full sample, married Mexican immigrant women (who mi-grated with a Mexican spouse) tend to have more children than their coun-terparts upon arrival in the United States, though this difference has beendeclining with successive cohorts and has recently become negative. Fer-tility compared to otherwise similar individuals in the white non-Hispanicreference group then increases further with time in the United States.(Note the own and spouse cohort and years-since-migration (YSM) effectsmust be summed to make this comparison.) For example, in the 1971–1980cohort, women have somewhat more (.19) children than comparable whitenon-Hispanic women upon arrival, a gap that rises to .76 after 20 years inthe United States. The 1997–2002 cohort that begins with .075 fewer chil-dren than comparable white non-Hispanics is estimated to have .50 morechildren after twenty years. The fertility difference falls across generations,but the fertility of second- and third-generation–Mexican-Americanwomen in Mexican American families is still a bit higher than the nativereference group: .22 to .34 (second generation) and .25 to .34 (third gener-ation). However, based on the declining relative fertility of newer cohortsof immigrants, we might expect excess fertility of future second- and third-generation–Mexican American women to be even smaller than this.
The positive relationship between fertility and time in the United Statesthat we obtain for immigrants is illustrated in figure 2.9 for the 1971–1980arrival cohort. This relationship could be consistent with the family in-vestment model: fertility may be deferred while wives’ focus on the labormarket in order to support their husband’s human capital investments.
94 Francine D. Blau and Lawrence M. Kahn
Fig. 2.9 Assimilation profile for married Mexican immigrant women whoimmigrated with Mexican spouse, number of children under eighteen, 1971–1980arrival cohort
However, this is unlikely given the strong positive assimilation that we havefound for wives’ labor supply. In light of this, we believe that the pattern offertility most likely represents a disruption of fertility due to immigration.One factor leading the family to defer fertility may be a desire to postponeat least some childbearing to a time when the family is on a firmer financialfooting. But, again, given the labor supply patterns we observe, this is likelyto be a time when both spouses are faring better in terms of labor marketincomes.
2.6 Conclusions
This paper has examined gender and the labor market and demographicassimilation of Mexican Americans, both within and across generations.Published data show a much more traditional gender division of labor inthe family in Mexico than in the United States, with women in Mexico hav-ing considerably lower labor force participation and higher fertility thanthose in the United States as well as lower education both absolutely andrelative to Mexican men. Our data suggest that these source country pat-terns strongly influence the outcomes and behavior of Mexican immi-grants on arrival in the United States. Both male and female immigrantshave much lower levels of education than the native reference group (third-generation non-Hispanic whites), although immigrants of both sexes havesomewhat higher levels of education than the average for Mexico and gen-der differences in educational attainment among immigrants are minimal.Educational attainment of Mexican American men and women increasessubstantially between the first and second generations, but not beyond.Controlling for education and other characteristics including location onarrival in the United States, immigrant women are more likely to be mar-ried with spouse present and have higher fertility and much lower laborsupply than the native reference group. The key question then is how thesepatterns change with time in the United States of immigrants and over thesecond and third generations.
Our most striking finding is the dramatic assimilation in labor supply forfemale immigrants with time in the United States. For example, upon ar-rival in the United States, the 1971–1980 cohort of Mexican women had aceteris paribus shortfall of 455 hours relative to non-Hispanic whites; thisfell to 219 hours after ten years of residence and 31 hours after twentyyears. The gap remained small in the second and third generations. Con-sistent with a more traditional division of labor in the first generation, im-migrant men’s annual hours tended to be somewhat higher than those ofnon-Hispanic whites upon arrival, all else equal, and showed moderatepositive assimilation with time in the United States. In contrast, MexicanAmerican men in later generations actually have somewhat lower labor
Gender and Assimilation among Mexican Americans 95
supply than natives. Taking the male and female results together, MexicanAmerican–non-Hispanic white differences in gender specialization in la-bor supply are very small for long-term immigrants and are entirely elimi-nated by the second generation.
When we do not control for education and other characteristics, how-ever, immigrants, as a low education group, have hours shortfalls relativeto non-Hispanic whites for both men and women; the gaps are quite sizablefor women and remain large, even with positive assimilation in hours. Inthe case of women, particularly, there is assimilation between the first andsecond generation, due to rising educational attainment, but no furtherprogress between the second and third generation.
Wage differences between female immigrants and non-Hispanic whites,controlling for other factors, are far less marked than labor supply differ-ences and tend to be smaller than the immigrant–non-Hispanic white wagegap for men, though both show a deteriorating wage position of immi-grants beginning in the 1980s. While male wage gaps decline modestly withexposure to the U.S. labor market, in contrast to the labor supply results,we find no evidence of positive wage assimilation for women. This may re-flect the limitations of the synthetic cohort approach. Positive assimilationin employment means that, as years since migration increase, the wagesample likely includes more new labor market entrants and may be lesspositively selected in other ways as well. We present some evidence basedon a correction for selectivity bias that is consistent with this reasoning, al-though wage assimilation, even based on these analyses, is quite moderate.For both men and women, rising educational attainment in subsequentgenerations contributes to a considerable narrowing of the raw wage gapwith non-Hispanic whites, but we again find no evidence of convergencebeyond the second generation. The lack of further assimilation betweenthe second and third generation thus characterizes our findings for educa-tion, labor supply, and wages and mirrors results from some earlier studiesof Mexican Americans.
Results for assimilation on the demographic outcomes are also mixed.Over time in the United States, female immigrants assimilate toward thenative reference group but remain more likely to be married, ceterisparibus. While male immigrants are actually less likely to be married withspouse present than otherwise similar non-Hispanic whites upon arrival,their marriage incidence increases with time in the United States and, afterlong residence, they are predicted to be more likely to be married than na-tives. Across generations, both male and female immigrants assimilate tothe patterns in the native non-Hispanic white reference group, controllingfor characteristics including education, and are no more likely to be mar-ried. When controls for education and other characteristics are omitted,second- and third-generation–Mexican-American men and women areboth less likely to be married than non-Hispanic whites.
96 Francine D. Blau and Lawrence M. Kahn
While immigrant women have higher fertility than non-Hispanic whites,all else equal, the immigrant-native differential upon arrival has been de-clining with successive arrival cohorts, reflecting sharp declines in fertilityin the source country. In contrast to the findings for marriage, however, wefind no evidence that the higher fertility of Mexican immigrant women onarrival assimilates toward native levels. Rather, the gap tends to increasestill further with time in the United States; this is consistent with the hy-pothesis that that immigration disrupts or delays immigrant women’s fer-tility, causing their relative fertility to rise with residence in the UnitedStates and counterbalancing or obscuring whatever assimilation mighthave otherwise taken place. These disruptions may be due to men arrivingin the United States before their wives, delayed courtship, or delayed mar-riage. Unfortunately we don’t have data on the time of marriage that mightallow us to distinguish among these explanations. While the size of theMexican American–non-Hispanic white fertility differential declinesacross generations, it is not eliminated.
Finally, we separately examined results for married men and women andconfirmed our findings based on the full sample, including the dramatic as-similation in labor supply of immigrant women, for this group. This meansfurther that we did not support the family investment model, which has re-cently been proposed as a model of the immigrant assimilation process ina family context (e.g., Baker and Benjamin 1997). This view holds that,upon arrival, immigrant husbands invest in their human capital, whilewives work to provide the family with liquidity during the investment pe-riod. The model predicts rapid positive assimilation in labor supply forhusbands and decreases in wives’ labor supply over time relative to the na-tive reference group. On the contrary, we found positive assimilation in la-bor supply for both immigrant husbands and wives, with dramaticallyfaster assimilation for wives.
Appendix
Creation of Hourly Earnings Variable
To analyze hourly earnings, we restrict our sample to wage and salaryworkers who were employed full time (defined as those with at least thirty-five usual weekly work hours). Wage and salary workers were defined asthose with zero self-employment and zero farm self-employment income inthe prior year who were wage and salary workers for their longest job dur-ing that year. The CPS reports two wage and salary income variables: onefor the main job and one for all other jobs. The main job values were top-coded at $99,000 for 1994 and 1995; $150,000 for 1996–2002; and $200,000
Gender and Assimilation among Mexican Americans 97
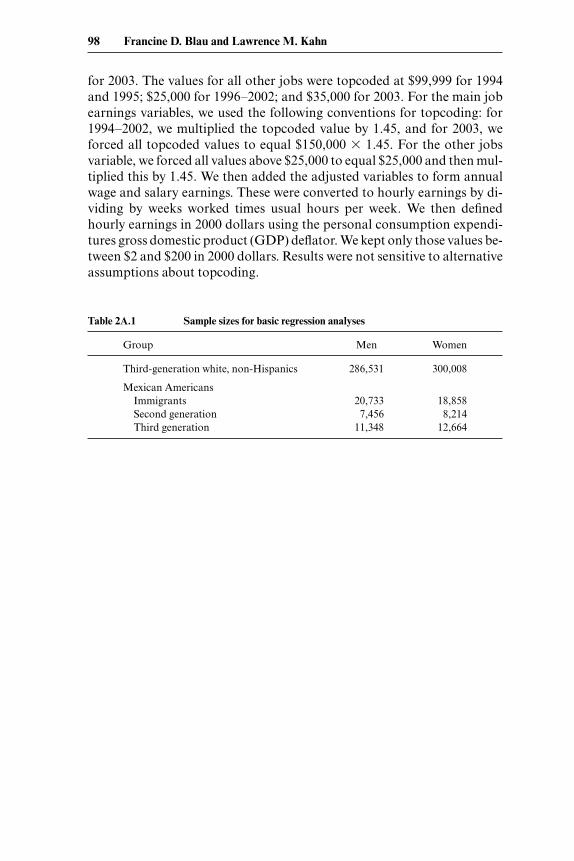
for 2003. The values for all other jobs were topcoded at $99,999 for 1994and 1995; $25,000 for 1996–2002; and $35,000 for 2003. For the main jobearnings variables, we used the following conventions for topcoding: for1994–2002, we multiplied the topcoded value by 1.45, and for 2003, weforced all topcoded values to equal $150,000 � 1.45. For the other jobsvariable, we forced all values above $25,000 to equal $25,000 and then mul-tiplied this by 1.45. We then added the adjusted variables to form annualwage and salary earnings. These were converted to hourly earnings by di-viding by weeks worked times usual hours per week. We then definedhourly earnings in 2000 dollars using the personal consumption expendi-tures gross domestic product (GDP) deflator. We kept only those values be-tween $2 and $200 in 2000 dollars. Results were not sensitive to alternativeassumptions about topcoding.
98 Francine D. Blau and Lawrence M. Kahn
Table 2A.1 Sample sizes for basic regression analyses
Group Men Women
Third-generation white, non-Hispanics 286,531 300,008
Mexican AmericansImmigrants 20,733 18,858Second generation 7,456 8,214Third generation 11,348 12,664
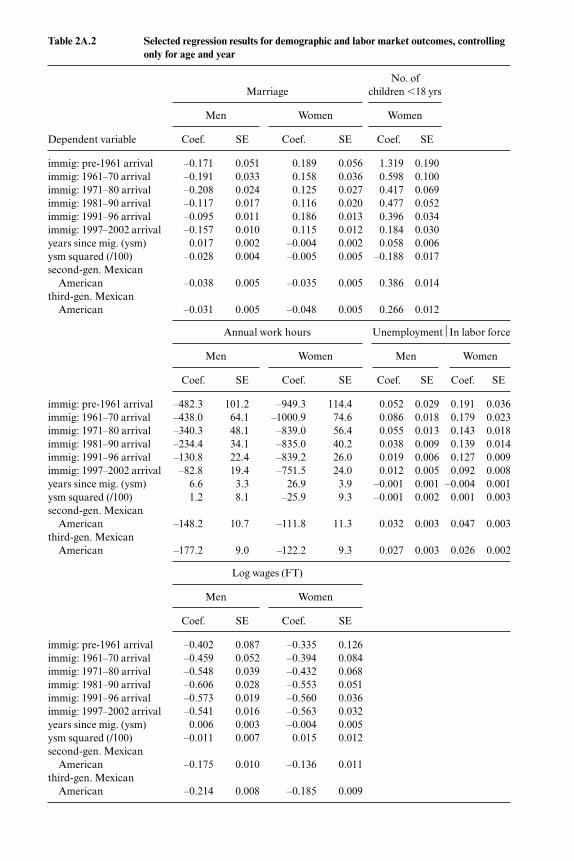
Table 2A.2 Selected regression results for demographic and labor market outcomes, controllingonly for age and year
No. of Marriage children �18 yrs
Men Women Women
Dependent variable Coef. SE Coef. SE Coef. SE
immig: pre-1961 arrival –0.171 0.051 0.189 0.056 1.319 0.190immig: 1961–70 arrival –0.191 0.033 0.158 0.036 0.598 0.100immig: 1971–80 arrival –0.208 0.024 0.125 0.027 0.417 0.069immig: 1981–90 arrival –0.117 0.017 0.116 0.020 0.477 0.052immig: 1991–96 arrival –0.095 0.011 0.186 0.013 0.396 0.034immig: 1997–2002 arrival –0.157 0.010 0.115 0.012 0.184 0.030years since mig. (ysm) 0.017 0.002 –0.004 0.002 0.058 0.006ysm squared (/100) –0.028 0.004 –0.005 0.005 –0.188 0.017second-gen. Mexican
American –0.038 0.005 –0.035 0.005 0.386 0.014third-gen. Mexican
American –0.031 0.005 –0.048 0.005 0.266 0.012
Annual work hours Unemployment⏐In labor force
Men Women Men Women
Coef. SE Coef. SE Coef. SE Coef. SE
immig: pre-1961 arrival –482.3 101.2 –949.3 114.4 0.052 0.029 0.191 0.036immig: 1961–70 arrival –438.0 64.1 –1000.9 74.6 0.086 0.018 0.179 0.023immig: 1971–80 arrival –340.3 48.1 –839.0 56.4 0.055 0.013 0.143 0.018immig: 1981–90 arrival –234.4 34.1 –835.0 40.2 0.038 0.009 0.139 0.014immig: 1991–96 arrival –130.8 22.4 –839.2 26.0 0.019 0.006 0.127 0.009immig: 1997–2002 arrival –82.8 19.4 –751.5 24.0 0.012 0.005 0.092 0.008years since mig. (ysm) 6.6 3.3 26.9 3.9 –0.001 0.001 –0.004 0.001ysm squared (/100) 1.2 8.1 –25.9 9.3 –0.001 0.002 0.001 0.003second-gen. Mexican
American –148.2 10.7 –111.8 11.3 0.032 0.003 0.047 0.003third-gen. Mexican
American –177.2 9.0 –122.2 9.3 0.027 0.003 0.026 0.002
Log wages (FT)
Men Women
Coef. SE Coef. SE
immig: pre-1961 arrival –0.402 0.087 –0.335 0.126immig: 1961–70 arrival –0.459 0.052 –0.394 0.084immig: 1971–80 arrival –0.548 0.039 –0.432 0.068immig: 1981–90 arrival –0.606 0.028 –0.553 0.051immig: 1991–96 arrival –0.573 0.019 –0.560 0.036immig: 1997–2002 arrival –0.541 0.016 –0.563 0.032years since mig. (ysm) 0.006 0.003 –0.004 0.005ysm squared (/100) –0.011 0.007 0.015 0.012second-gen. Mexican
American –0.175 0.010 –0.136 0.011third-gen. Mexican
American –0.214 0.008 –0.185 0.009
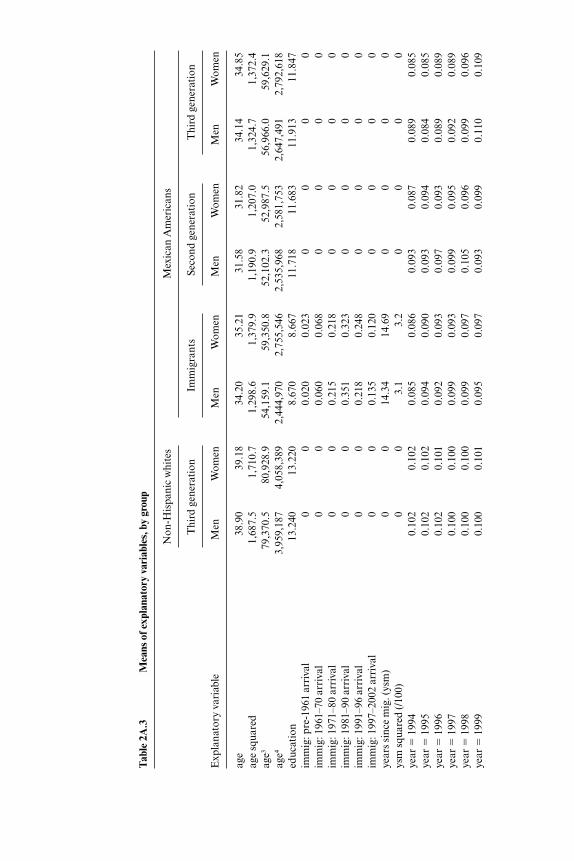
Tab
le 2
A.3
Mea
ns o
f exp
lana
tory
var
iabl
es, b
y gr
oup
Non
-His
pani
c w
hite
sM
exic
an A
mer
ican
s
Thi
rd g
ener
atio
nIm
mig
rant
sSe
cond
gen
erat
ion
Thi
rd g
ener
atio
n
Exp
lana
tory
var
iabl
eM
enW
omen
Men
Wom
enM
enW
omen
Men
Wom
en
age
38.9
039
.18
34.2
035
.21
31.5
831
.82
34.1
434
.85
age
squa
red
1,68
7.5
1,71
0.7
1,29
8.6
1,37
9.9
1,19
0.9
1,20
7.0
1,32
4.7
1,37
2.4
age3
79,3
70.5
80,9
28.9
54,1
59.1
59,3
50.8
52,1
02.3
52,9
87.5
56,9
66.0
59,6
29.1
age4
3,95
9,18
74,
058,
389
2,44
4,97
02,
755,
546
2,53
5,96
82,
581,
753
2,64
7,49
12,
792,
618
educ
atio
n13
.240
13.2
208.
670
8.66
711
.718
11.6
8311
.913
11.8
47im
mig
: pre
-196
1 ar
riva
l0
00.
020
0.02
30
00
0im
mig
: 196
1–70
arr
ival
00
0.06
00.
068
00
00
imm
ig: 1
971–
80 a
rriv
al0
00.
215
0.21
80
00
0im
mig
: 198
1–90
arr
ival
00
0.35
10.
323
00
00
imm
ig: 1
991–
96 a
rriv
al0
00.
218
0.24
80
00
0im
mig
: 199
7–20
02 a
rriv
al0
00.
135
0.12
00
00
0ye
ars
sinc
e m
ig. (
ysm
)0
014
.34
14.6
90
00
0ys
m s
quar
ed (/
100)
00
3.1
3.2
00
00
year
� 1
994
0.10
20.
102
0.08
50.
086
0.09
30.
087
0.08
90.
085
year
� 1
995
0.10
20.
102
0.09
40.
090
0.09
30.
094
0.08
40.
085
year
� 1
996
0.10
20.
101
0.09
20.
093
0.09
70.
093
0.08
90.
089
year
� 1
997
0.10
00.
100
0.09
90.
093
0.09
90.
095
0.09
20.
089
year
� 1
998
0.10
00.
100
0.09
90.
097
0.10
50.
096
0.09
90.
096
year
� 1
999
0.10
00.
101
0.09
50.
097
0.09
30.
099
0.11
00.
109
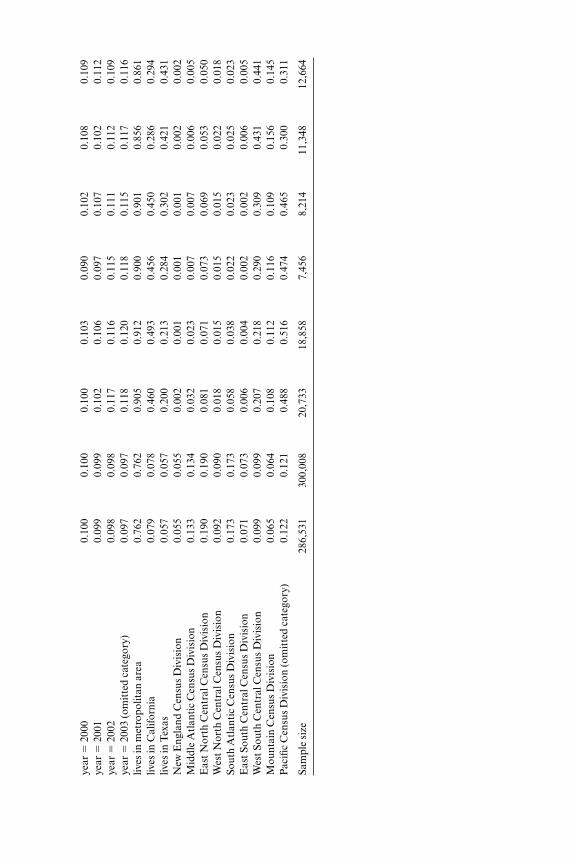
year
� 2
000
0.10
00.
100
0.10
00.
103
0.09
00.
102
0.10
80.
109
year
� 2
001
0.09
90.
099
0.10
20.
106
0.09
70.
107
0.10
20.
112
year
� 2
002
0.09
80.
098
0.11
70.
116
0.11
50.
111
0.11
20.
109
year
� 2
003
(om
itte
d ca
tego
ry)
0.09
70.
097
0.11
80.
120
0.11
80.
115
0.11
70.
116
lives
in m
etro
polit
an a
rea
0.76
20.
762
0.90
50.
912
0.90
00.
901
0.85
60.
861
lives
in C
alifo
rnia
0.07
90.
078
0.46
00.
493
0.45
60.
450
0.28
60.
294
lives
in T
exas
0.05
70.
057
0.20
00.
213
0.28
40.
302
0.42
10.
431
New
Eng
land
Cen
sus
Div
isio
n0.
055
0.05
50.
002
0.00
10.
001
0.00
10.
002
0.00
2M
iddl
e A
tlan
tic
Cen
sus
Div
isio
n0.
133
0.13
40.
032
0.02
30.
007
0.00
70.
006
0.00
5E
ast N
orth
Cen
tral
Cen
sus
Div
isio
n0.
190
0.19
00.
081
0.07
10.
073
0.06
90.
053
0.05
0W
est N
orth
Cen
tral
Cen
sus
Div
isio
n0.
092
0.09
00.
018
0.01
50.
015
0.01
50.
022
0.01
8So
uth
Atl
anti
c C
ensu
s D
ivis
ion
0.17
30.
173
0.05
80.
038
0.02
20.
023
0.02
50.
023
Eas
t Sou
th C
entr
al C
ensu
s D
ivis
ion
0.07
10.
073
0.00
60.
004
0.00
20.
002
0.00
60.
005
Wes
t Sou
th C
entr
al C
ensu
s D
ivis
ion
0.09
90.
099
0.20
70.
218
0.29
00.
309
0.43
10.
441
Mou
ntai
n C
ensu
s D
ivis
ion
0.06
50.
064
0.10
80.
112
0.11
60.
109
0.15
60.
145
Pac
ific
Cen
sus
Div
isio
n (o
mit
ted
cate
gory
)0.
122
0.12
10.
488
0.51
60.
474
0.46
50.
300
0.31
1
Sam
ple
size
286,
531
300,
008
20,7
3318
,858
7,45
68,
214
11,3
4812
,664
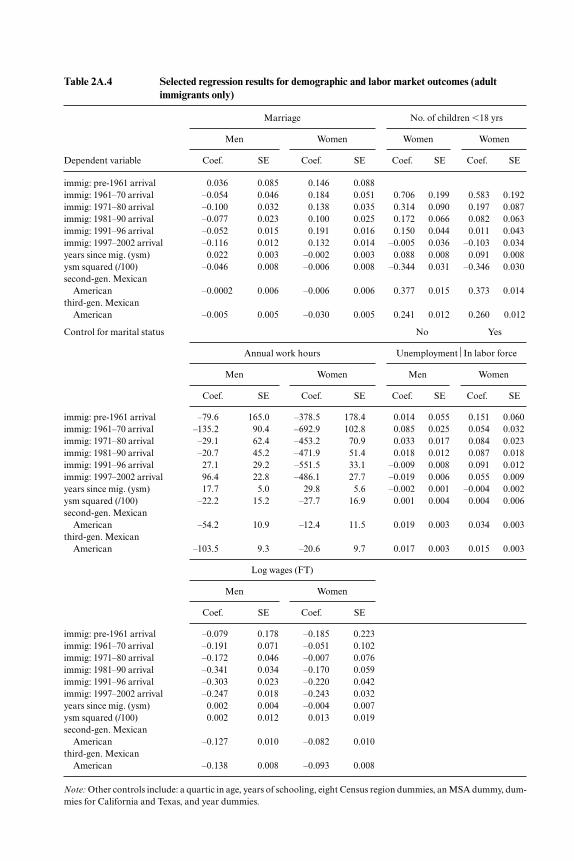
Table 2A.4 Selected regression results for demographic and labor market outcomes (adultimmigrants only)
Marriage No. of children �18 yrs
Men Women Women Women
Dependent variable Coef. SE Coef. SE Coef. SE Coef. SE
immig: pre-1961 arrival 0.036 0.085 0.146 0.088immig: 1961–70 arrival –0.054 0.046 0.184 0.051 0.706 0.199 0.583 0.192immig: 1971–80 arrival –0.100 0.032 0.138 0.035 0.314 0.090 0.197 0.087immig: 1981–90 arrival –0.077 0.023 0.100 0.025 0.172 0.066 0.082 0.063immig: 1991–96 arrival –0.052 0.015 0.191 0.016 0.150 0.044 0.011 0.043immig: 1997–2002 arrival –0.116 0.012 0.132 0.014 –0.005 0.036 –0.103 0.034years since mig. (ysm) 0.022 0.003 –0.002 0.003 0.088 0.008 0.091 0.008ysm squared (/100) –0.046 0.008 –0.006 0.008 –0.344 0.031 –0.346 0.030second-gen. Mexican
American –0.0002 0.006 –0.006 0.006 0.377 0.015 0.373 0.014third-gen. Mexican
American –0.005 0.005 –0.030 0.005 0.241 0.012 0.260 0.012
Control for marital status No Yes
Annual work hours Unemployment⏐In labor force
Men Women Men Women
Coef. SE Coef. SE Coef. SE Coef. SE
immig: pre-1961 arrival –79.6 165.0 –378.5 178.4 0.014 0.055 0.151 0.060immig: 1961–70 arrival –135.2 90.4 –692.9 102.8 0.085 0.025 0.054 0.032immig: 1971–80 arrival –29.1 62.4 –453.2 70.9 0.033 0.017 0.084 0.023immig: 1981–90 arrival –20.7 45.2 –471.9 51.4 0.018 0.012 0.087 0.018immig: 1991–96 arrival 27.1 29.2 –551.5 33.1 –0.009 0.008 0.091 0.012immig: 1997–2002 arrival 96.4 22.8 –486.1 27.7 –0.019 0.006 0.055 0.009years since mig. (ysm) 17.7 5.0 29.8 5.6 –0.002 0.001 –0.004 0.002ysm squared (/100) –22.2 15.2 –27.7 16.9 0.001 0.004 0.004 0.006second-gen. Mexican
American –54.2 10.9 –12.4 11.5 0.019 0.003 0.034 0.003third-gen. Mexican
American –103.5 9.3 –20.6 9.7 0.017 0.003 0.015 0.003
Log wages (FT)
Men Women
Coef. SE Coef. SE
immig: pre-1961 arrival –0.079 0.178 –0.185 0.223immig: 1961–70 arrival –0.191 0.071 –0.051 0.102immig: 1971–80 arrival –0.172 0.046 –0.007 0.076immig: 1981–90 arrival –0.341 0.034 –0.170 0.059immig: 1991–96 arrival –0.303 0.023 –0.220 0.042immig: 1997–2002 arrival –0.247 0.018 –0.243 0.032years since mig. (ysm) 0.002 0.004 –0.004 0.007ysm squared (/100) 0.002 0.012 0.013 0.019second-gen. Mexican
American –0.127 0.010 –0.082 0.010third-gen. Mexican
American –0.138 0.008 –0.093 0.008
Note: Other controls include: a quartic in age, years of schooling, eight Census region dummies, an MSA dummy, dum-mies for California and Texas, and year dummies.
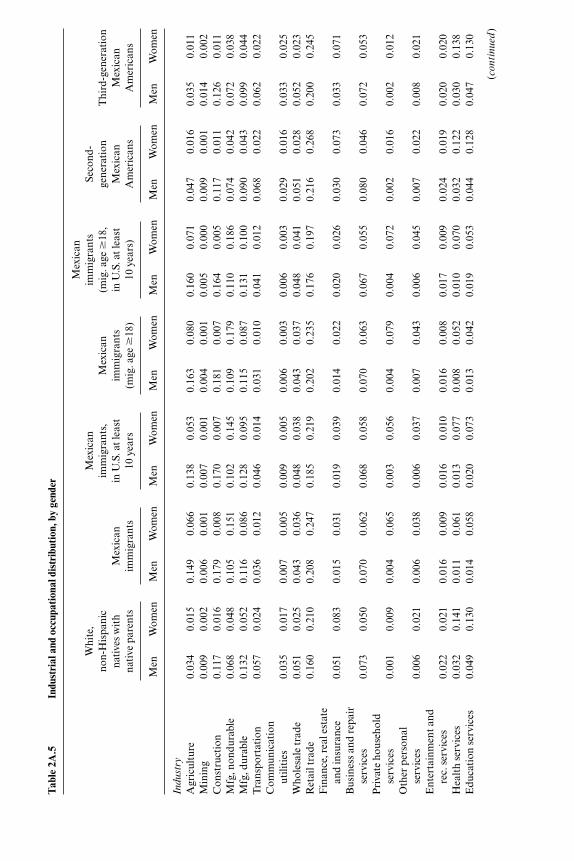
Tab
le 2
A.5
Indu
stri
al a
nd o
ccup
atio
nal d
istr
ibut
ion,
by
gend
er
Mex
ican
W
hite
, M
exic
an
imm
igra
nts
Seco
nd-
non-
His
pani
c im
mig
rant
s,
Mex
ican
(m
ig.a
ge �
18,
gene
rati
on
Thi
rd-g
ener
atio
n na
tive
s w
ith
Mex
ican
in
U.S
. at l
east
im
mig
rant
s in
U.S
. at l
east
M
exic
an
Mex
ican
na
tive
par
ents
imm
igra
nts
10ye
ars
(mig
.age
�18
)10
year
s)A
mer
ican
sA
mer
ican
s
Men
Wom
enM
enW
omen
Men
Wom
enM
enW
omen
Men
Wom
enM
enW
omen
Men
Wom
en
Indust
ry
Agr
icul
ture
0.03
40.
015
0.14
90.
066
0.13
80.
053
0.16
30.
080
0.16
00.
071
0.04
70.
016
0.03
50.
011
Min
ing
0.00
90.
002
0.00
60.
001
0.00
70.
001
0.00
40.
001
0.00
50.
000
0.00
90.
001
0.01
40.
002
Con
stru
ctio
n0.
117
0.01
60.
179
0.00
80.
170
0.00
70.
181
0.00
70.
164
0.00
50.
117
0.01
10.
126
0.01
1M
fg, n
ondu
rabl
e0.
068
0.04
80.
105
0.15
10.
102
0.14
50.
109
0.17
90.
110
0.18
60.
074
0.04
20.
072
0.03
8M
fg, d
urab
le0.
132
0.05
20.
116
0.08
60.
128
0.09
50.
115
0.08
70.
131
0.10
00.
090
0.04
30.
099
0.04
4T
rans
port
atio
n0.
057
0.02
40.
036
0.01
20.
046
0.01
40.
031
0.01
00.
041
0.01
20.
068
0.02
20.
062
0.02
2C
omm
unic
atio
n ut
iliti
es0.
035
0.01
70.
007
0.00
50.
009
0.00
50.
006
0.00
30.
006
0.00
30.
029
0.01
60.
033
0.02
5W
hole
sale
trad
e0.
051
0.02
50.
043
0.03
60.
048
0.03
80.
043
0.03
70.
048
0.04
10.
051
0.02
80.
052
0.02
3R
etai
l tra
de0.
160
0.21
00.
208
0.24
70.
185
0.21
90.
202
0.23
50.
176
0.19
70.
216
0.26
80.
200
0.24
5F
inan
ce, r
eal e
stat
e an
d in
sura
nce
0.05
10.
083
0.01
50.
031
0.01
90.
039
0.01
40.
022
0.02
00.
026
0.03
00.
073
0.03
30.
071
Bus
ines
s an
d re
pair
se
rvic
es0.
073
0.05
00.
070
0.06
20.
068
0.05
80.
070
0.06
30.
067
0.05
50.
080
0.04
60.
072
0.05
3P
riva
te h
ouse
hold
se
rvic
es0.
001
0.00
90.
004
0.06
50.
003
0.05
60.
004
0.07
90.
004
0.07
20.
002
0.01
60.
002
0.01
2O
ther
per
sona
l se
rvic
es0.
006
0.02
10.
006
0.03
80.
006
0.03
70.
007
0.04
30.
006
0.04
50.
007
0.02
20.
008
0.02
1E
nter
tain
men
t and
re
c. s
ervi
ces
0.02
20.
021
0.01
60.
009
0.01
60.
010
0.01
60.
008
0.01
70.
009
0.02
40.
019
0.02
00.
020
Hea
lth
serv
ices
0.03
20.
141
0.01
10.
061
0.01
30.
077
0.00
80.
052
0.01
00.
070
0.03
20.
122
0.03
00.
138
Edu
cati
on s
ervi
ces
0.04
90.
130
0.01
40.
058
0.02
00.
073
0.01
30.
042
0.01
90.
053
0.04
40.
128
0.04
70.
130
(co
nti
nu
ed)
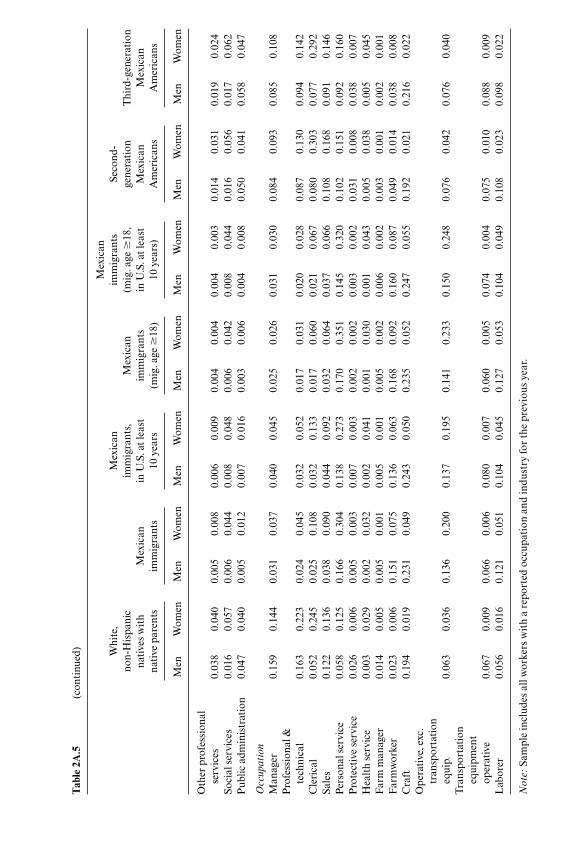
Oth
er p
rofe
ssio
nal
serv
ices
0.03
80.
040
0.00
50.
008
0.00
60.
009
0.00
40.
004
0.00
40.
003
0.01
40.
031
0.01
90.
024
Soci
al s
ervi
ces
0.01
60.
057
0.00
60.
044
0.00
80.
048
0.00
60.
042
0.00
80.
044
0.01
60.
056
0.01
70.
062
Pub
lic a
dmin
istr
atio
n0.
047
0.04
00.
005
0.01
20.
007
0.01
60.
003
0.00
60.
004
0.00
80.
050
0.04
10.
058
0.04
7
Occ
upati
on
Man
ager
0.15
90.
144
0.03
10.
037
0.04
00.
045
0.02
50.
026
0.03
10.
030
0.08
40.
093
0.08
50.
108
Pro
fess
iona
l &
tech
nica
l0.
163
0.22
30.
024
0.04
50.
032
0.05
20.
017
0.03
10.
020
0.02
80.
087
0.13
00.
094
0.14
2C
leri
cal
0.05
20.
245
0.02
50.
108
0.03
20.
133
0.01
70.
060
0.02
10.
067
0.08
00.
303
0.07
70.
292
Sale
s0.
122
0.13
60.
038
0.09
00.
044
0.09
20.
032
0.06
40.
037
0.06
60.
108
0.16
80.
091
0.14
6P
erso
nal s
ervi
ce0.
058
0.12
50.
166
0.30
40.
138
0.27
30.
170
0.35
10.
145
0.32
00.
102
0.15
10.
092
0.16
0P
rote
ctiv
e se
rvic
e0.
026
0.00
60.
005
0.00
30.
007
0.00
30.
002
0.00
20.
003
0.00
20.
031
0.00
80.
038
0.00
7H
ealt
h se
rvic
e0.
003
0.02
90.
002
0.03
20.
002
0.04
10.
001
0.03
00.
001
0.04
30.
005
0.03
80.
005
0.04
5F
arm
man
ager
0.01
40.
005
0.00
50.
001
0.00
50.
001
0.00
50.
002
0.00
60.
002
0.00
30.
001
0.00
20.
001
Far
mw
orke
r0.
023
0.00
60.
151
0.07
50.
136
0.06
30.
168
0.09
20.
160
0.08
70.
049
0.01
40.
038
0.00
8C
raft
0.19
40.
019
0.23
10.
049
0.24
30.
050
0.23
50.
052
0.24
70.
055
0.19
20.
021
0.21
60.
022
Ope
rati
ve, e
xc.
tran
spor
tati
on
equi
p.0.
063
0.03
60.
136
0.20
00.
137
0.19
50.
141
0.23
30.
150
0.24
80.
076
0.04
20.
076
0.04
0T
rans
port
atio
n eq
uipm
ent
oper
ativ
e0.
067
0.00
90.
066
0.00
60.
080
0.00
70.
060
0.00
50.
074
0.00
40.
075
0.01
00.
088
0.00
9L
abor
er0.
056
0.01
60.
121
0.05
10.
104
0.04
50.
127
0.05
30.
104
0.04
90.
108
0.02
30.
098
0.02
2
No
te:
Sam
ple
incl
udes
all
wor
kers
wit
h a
repo
rted
occ
upat
ion
and
indu
stry
for
the
prev
ious
yea
r.
Tab
le 2
A.5
(con
tinu
ed)
Mex
ican
W
hite
, M
exic
an
imm
igra
nts
Seco
nd-
non-
His
pani
c im
mig
rant
s,
Mex
ican
(m
ig.a
ge �
18,
gene
rati
on
Thi
rd-g
ener
atio
n na
tive
s w
ith
Mex
ican
in
U.S
. at l
east
im
mig
rant
s in
U.S
. at l
east
M
exic
an
Mex
ican
na
tive
par
ents
imm
igra
nts
10ye
ars
(mig
.age
�18
)10
year
s)A
mer
ican
sA
mer
ican
s
Men
Wom
enM
enW
omen
Men
Wom
enM
enW
omen
Men
Wom
enM
enW
omen
Men
Wom
en
References
Angrist, Joshua. 2002. How do sex ratios affect marriage and labor markets? Evi-dence from America’s second generation. Quarterly Journal of Economics 117(3): 997–1038.
Baker, Michael, and Dwayne Benjamin. 1997. The role of the family in immigrants’labor-market activity: An evaluation of alternative explanations. American Eco-nomic Review 87 (4): 705–27.
Baker, Susan Gonzalez. 1999. Mexican-origin women in southwestern labor mar-kets. In Latinas and African American women at work, ed. Irene Browne, 244–69.New York: Russell Sage Foundation.
Blank, Rebecca M. 1997. It takes a nation: A new agenda for fighting poverty. NewYork: Russell Sage Foundation.
Blau, Francine D. 1992. The fertility of immigrant women: Evidence from high-fertility source countries. In Immigration and the work force: Economic conse-quences for the United States and source areas, ed. George J. Borjas and RichardB. Freeman, 93–133. Chicago: University of Chicago Press.
Blau, Francine D., Marianne A. Ferber, and Anne E. Winkler. 2002. The econom-ics of women, men, and work. 4th ed. Upper Saddle River, NJ: Prentice Hall.
Blau, Francine D., Lawrence M. Kahn, Joan Moriarty, and Andre Souza. 2003.The role of the family in immigrants’ labor-market activity: An evaluation of al-ternative explanations: Comment. American Economic Review 93 (1): 429–47.
Borjas, George J. 1985. Assimilation, changes in cohort quality, and the earnings ofimmigrants. Journal of Labor Economics 3 (4): 463–89.
———. 1995. Assimilation and changes in cohort quality revisited: What hap-pened to immigrant earnings in the 1980s? Journal of Labor Economics 13 (2):201–45.
Browne, Irene, ed. 1999. Latinas and African American Women at work. New York:Russell Sage Foundation.
Card, David. 2004. Is the new immigration really so bad? IZA Discussion Paper no.1119. Bonn, Germany: Institute for the Study of Labor, April.
Card, David, John DiNardo, and Eugena Estes. 2000. The more things change: Im-migrants and the children of immigrants in the 1940s, the 1970s, and the 1990s.In Issues in the economics of immigration, ed. George J. Borjas, 227–69. Chicago:University of Chicago Press.
Chiquiar, Daniel, and Gordon Hanson. 2005. International migration, self-selection, and the distribution of wages: Evidence from Mexico and the UnitedStates. Journal of Political Economy 113 (2): 239–81.
Cobb-Clark, Deborah A., and Vincent Hildebrand. 2004. The wealth of MexicanAmericans. IZA Discussion Paper no. 1150. Bonn, Germany: Institute for theStudy of Labor, May.
Corcoran, Mary, Colleen M. Heflin, and Belinda C. Reyes. 1999. The economicprogress of Mexican and Puerto Rican women. In Latinas and African Americanwomen at work, ed. Irene Browne, 105–38. New York: Russell Sage Foundation.
Duleep, Harriet Orcutt, and Daniel J. Dowhan. 2002. Revisiting the family invest-ment model with longitudinal data: The earnings growth of immigrant and U.S.-born women. IZA Discussion Paper no. 568. Bonn, Germany: Institute for theStudy of Labor, September.
Duleep, Harriet Orcutt, and Seth Sanders. 1993. The decision to work by marriedimmigrant women. Industrial and Labor Relations Review 46 (4): 677–90.
Friedberg, Rachel M. 1993. Immigration and the labor market. PhD diss. Massa-chusetts Institute of Technology.
Gender and Assimilation among Mexican Americans 105
Heckman, James J. 1979. Sample selection bias as a specification error. Economet-rica 47:153–62.
International Labour Organization. International Labour Organization Web site.http://www.laborsta.ilo.org.
Jaeger, David A. 1997. Reconciling the old and new Census Bureau education ques-tions: Recommendations for researchers. Journal of Business & Economic Statis-tics 15 (3): 300–309.
LaLonde, Robert J., and Robert H. Topel. 1992. The assimilation of immigrants inthe U.S. labor market. In Immigration and the work force: Economic consequencesfor the United States and source areas, ed. George J. Borjas and Richard B. Free-man, 67–92. Chicago: University of Chicago Press.
Livingston, Gretchen, and Joan R. Kahn. 2002. An American dream unfulfilled:The limited mobility of Mexican Americans. Social Science Quarterly 83 (4):1003–1012.
Long, James E. 1980. The effect of Americanization on earnings: Some evidencefor women. Journal of Political Economy 88 (3): 620–29.
Macpherson, David A., and James B. Stewart. 1989. The labor force participationand earnings profiles of married immigrant females. Quarterly Review of Eco-nomics and Business 29 (3): 57–72.
Redstone, Ilana, and Douglas S. Massey. 2004. Coming to stay: An analysis of theU.S. Census question on immigrants’ year of arrival. Demography 41 (4): 721–38.
Smith, James P. 2003. Assimilation across the Latino generations. American Eco-nomic Review 93 (2): 315–19.
Trejo, Stephen J. 1997. Why do Mexican Americans earn low wages? Journal of Po-litical Economy 105 (6): 1235–68.
———. 2003. Intergenerational progress of Mexican-origin workers in the U.S. la-bor market. Journal of Human Resources 38 (3): 467–89.
U.S. Bureau of the Census. 2000. Industry and occupation 2000: Crosswalks Website. http://www.census.gov/hhes/www/ioindex/crosswalks.html.
U.S. Department of Homeland Security, Office of Immigration Statistics. 2003.Yearbook of immigration statistics 2002. Washington, DC: Office of ImmigrationStatistics.
Waldfogel, Jane. 1998. Understanding the “family gap” in pay for women with chil-dren. Journal of Economic Perspectives 12 (1): 137–56.
106 Francine D. Blau and Lawrence M. Kahn


![Mexican Immigration and American Obligations[1] (1)Mexican Immigration and American Obligations Rogers M. Smith The triggers for these reflections are the controversies over immigration](https://img.pdfslide.us/doc/110x75/5f0b47387e708231d42fb9de/mexican-immigration-and-american-obligations1-1-mexican-immigration-and-american.jpg)