Embed Size (px)
DESCRIPTION
MEXICAN AGRICULTURAL TRADE UNDER NAFTA: AN ASSESSMENT AFTER FIVE YEARS OF IMPLEMENTATION Andrés Rosenzweig San Diego, California February 2000. WHY THE ANALYSIS OF TRADE FLOWS WITH NAFTA ARE IMPORTANT. Contribution to the overall trade balance. Identification of technological changes. - PowerPoint PPT Presentation
Citation preview

MEXICAN
AGRICULTURAL TRADE
UNDER NAFTA:
AN ASSESSMENT
AFTER FIVE YEARS OF
IMPLEMENTATION
Andrés Rosenzweig
San Diego, California
February 2000

WHY THE ANALYSIS OF TRADE FLOWS WITH NAFTA ARE IMPORTANT
Contribution to the overall trade balance.
Identification of technological changes.
Indicator of sector performance.
Assessment of the vulnerability of the trade balance to “shocks”
Responsiveness of exports to competitive advantages
HOW TO FOLLOW MEXICAN TRADE PERFORMANCE
Main sources of information:
BANXICO
SICM
INEGI
Main problems:
Degree of aggregation of data
Consistency of time series
Consistency with WTO definitions
Time consuming for processing data bases
Performance of primary sector and processed products.
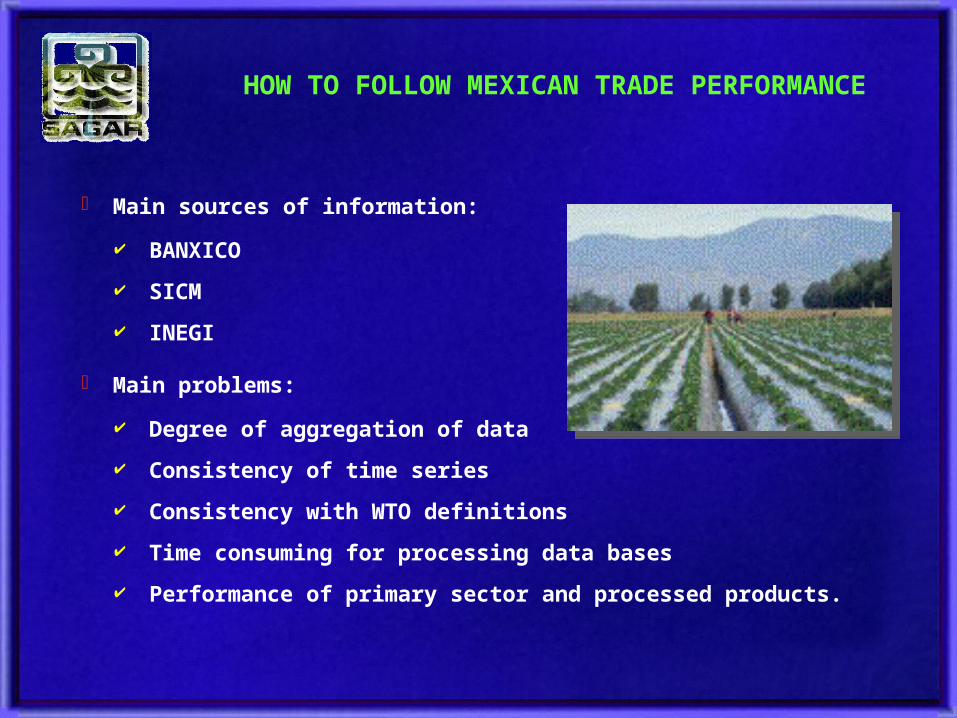
A PROPOSAL TO MANAGE SICM DATABASE
Forages
Cereals
Oilseeds
Vegetables
Fruits
Dried vegetables
Tubers
Industrial products
Flowers
Other crops
Bovine
Swine
Poultry
Ovine
Goat
Dairy
Eggs
Honey
Other livestockproducts
Agriculture Livestock
PRIMARY PROCESSED PRODUCTS
AGRI - FOOD
Goat derivatives
Bovine derivatives
Ovine derivatives
Swine derivatives
Agriculture Livestock
Cereal derivatives
Oilseed derivatives
Vegetable derivatives
Fruit derivatives
Dried vegetables derivatives
Tuber preparations
Industrial crops derivatives
Wines, spiritous and alcoholic beverages
Other preparations based on agricultural raw materials
Other industrial preparations based on llivestock products
Poultry derivatives
Dairy preparations
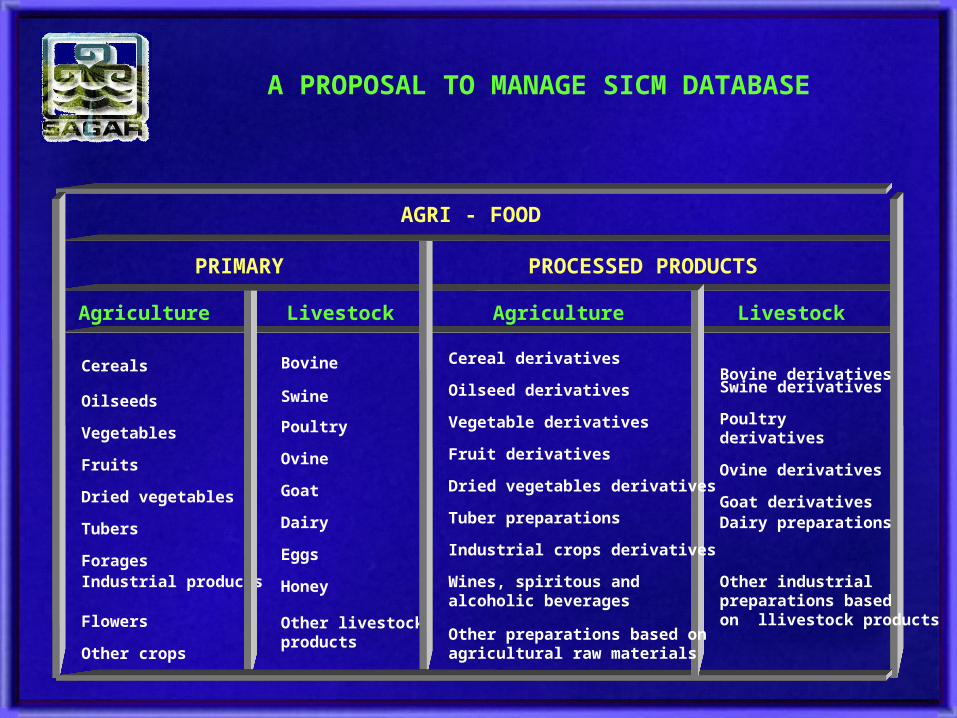
BASIC DEFINITIONS
Agriculture and livestock Trade
Balance
Exports (A)AgricultureLivestock
Imports (B)AgricultureLivestock
Concept Concept
Processed food, beverages and tobacco
Trade Balance
Exports (C) Processed agricultural products Processed livestock products
Imports (D) Processed agricultural products Processed livestock products
Concept
Agrifood Trade Balance
Exports (A+C)AgricultureLivestock
Imports (B+D)AgricultureLivestock

AN EXAMPLE TO USERS
P 3 2 Meat offal of fowls, no cut in pieces
P 3 3 Meat offal of fowls, in pieces
P 3 4 Other fowl pieces
P Livestock
P 3 Poultry
P 3 1 Live fowls
19921990 1991 1992 1993 1994 1995 1996 1997 1998
(3,000)
(1,000)
1,000
3,000
5,000
7,000
9,000
11,000
13,000
1990 1991 1993 1994 1995 1996 1997 1998
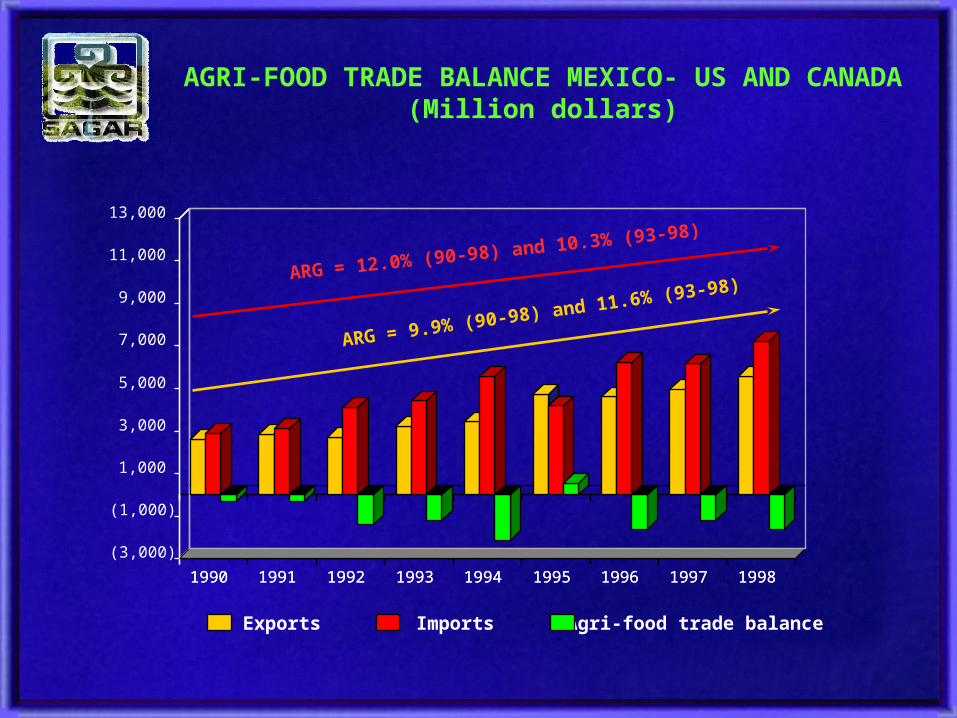
ARG = 9.9% (90-98) and 11.6% (93-98)ARG = 12.0% (90-98) and 10.3% (93-98)
Exports Imports Agri-food trade balance
AGRI-FOOD TRADE BALANCE MEXICO- US AND CANADA
(Million dollars)

AGRI-FOOD TRADE BALANCE MEXICO- US AND CANADA
(Million dollars)
Agriculture and Livestock Trade Balance
107 90 (613) (250) (1,001) 951 (1,313) (732) (951)
Exports 2,103 2,240 2,103 2,483 2,559 3,620 3,174 3,400 3,704
Imports 1,996 2,150 2,716 2,733 3,560 2,669 4,488 4,132 4,655
Processed Foods, Beverages
and Tobacco Trade balance(395) (403) (797) (934) (1,135) (423) (317) (465) (672)
Exports 523 586 612 750 890 1,103 1,423 1,577 1,883
Imports 919 989 1,409 1,685 2,024 1,526 1,740 2,042 2,555
YEAR 1990 1991 1992 1993 1994 1995 1996 1997 1998
Source: SECOFI.
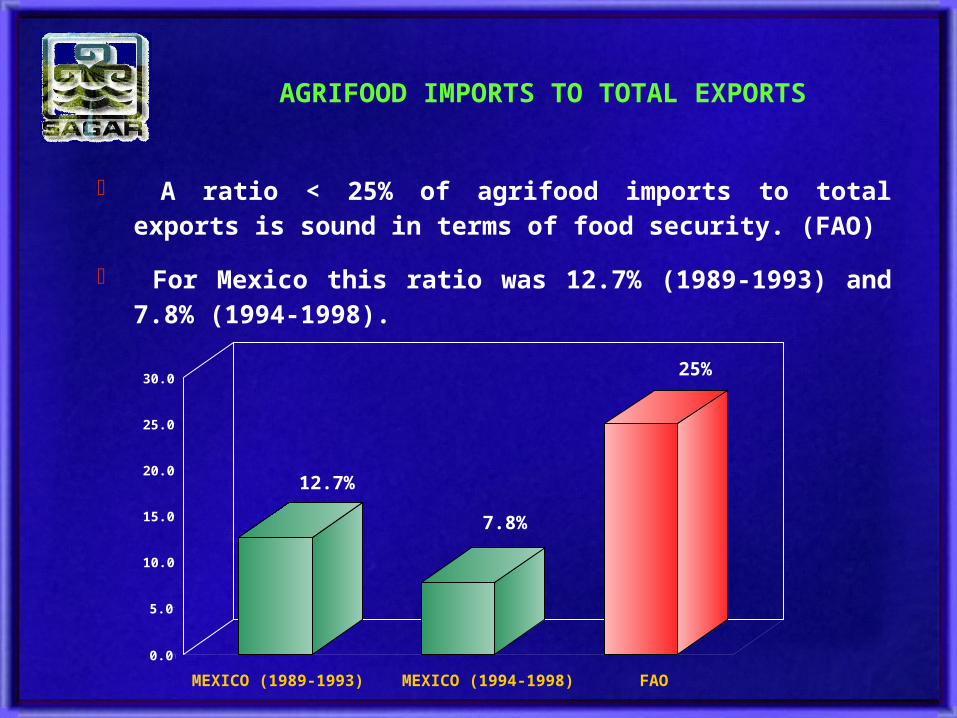
AGRIFOOD IMPORTS TO TOTAL EXPORTS
A ratio < 25% of agrifood imports to total exports is sound in terms of food security. (FAO)
For Mexico this ratio was 12.7% (1989-1993) and 7.8% (1994-1998).
MEXICO (1994-1998)
0.0
5.0
10.0
15.0
20.0
25.0
30.0
MEXICO (1989-1993) FAO
25%
7.8%
12.7%

PERFORMANCE OF GDP
The performarce of the primary sector (agriculture and livestock) in terms of trade and production has not been as good as the processed food and beverages sector.
Deficit sector as share in totalagri-food deficit
1990-1992 20.7
1996-1998 67.3
79.2
32.7
1993-1998
BEVERAGE AND
GDP average rate of growth */ 1.2% 3.2%
SECTORTOBACCO SECTOR
* / Source: INEGI
PRIMARY PROCESSED FOOD,

TRADE BALANCE MEXICO - US AND CANADA(Million dollars)
90
Agriculture
Livestock
Agriculture Processedproducts
Livestock Processedproducts
91 92 93 94 95 96 97 98Average
90-98
364 672 87 283 -130 1,051
-257
-227
-168
-582
-178
-225
-700
-474
-322
-534
-539
-396
-870
-680
-455
-100
-67
-356
-594
-719
-10
-308
-110
-354
276
-1,227
-260
-412
257
-670
-283
-333
305
-1037
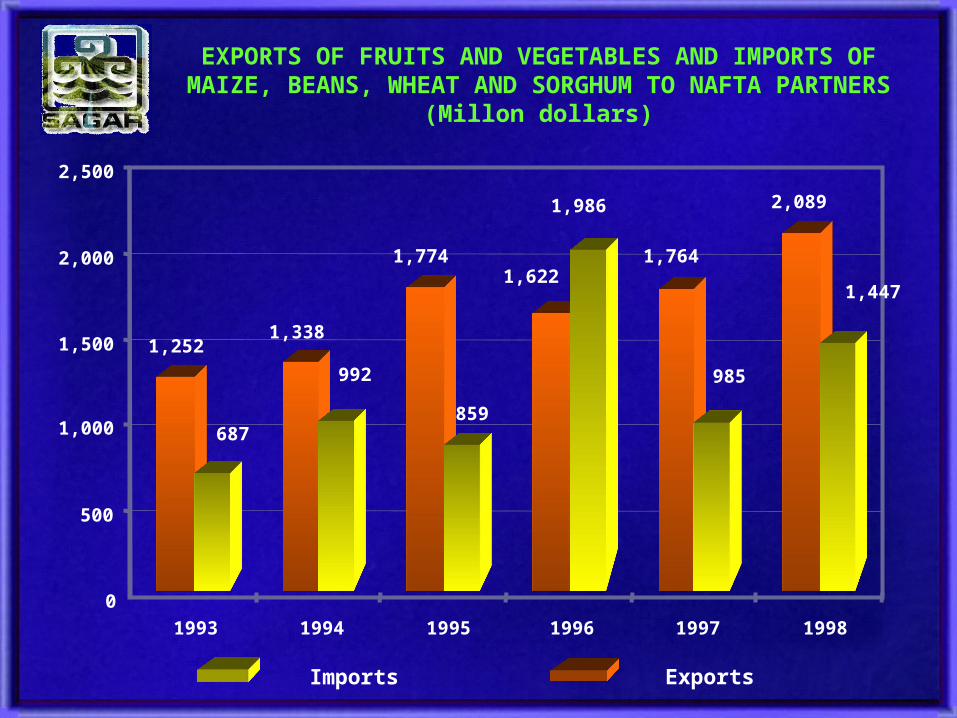
EXPORTS OF FRUITS AND VEGETABLES AND IMPORTS OF MAIZE, BEANS, WHEAT AND SORGHUM TO NAFTA
PARTNERS(Millon dollars)
0
500
1,000
1,500
2,000
2,500
1993 1994 1995 1996 1997 1998
1,338
1,774
2,089
1,7641,622
1,252
Exports
992 985
1,986
687
1,447
859
Imports
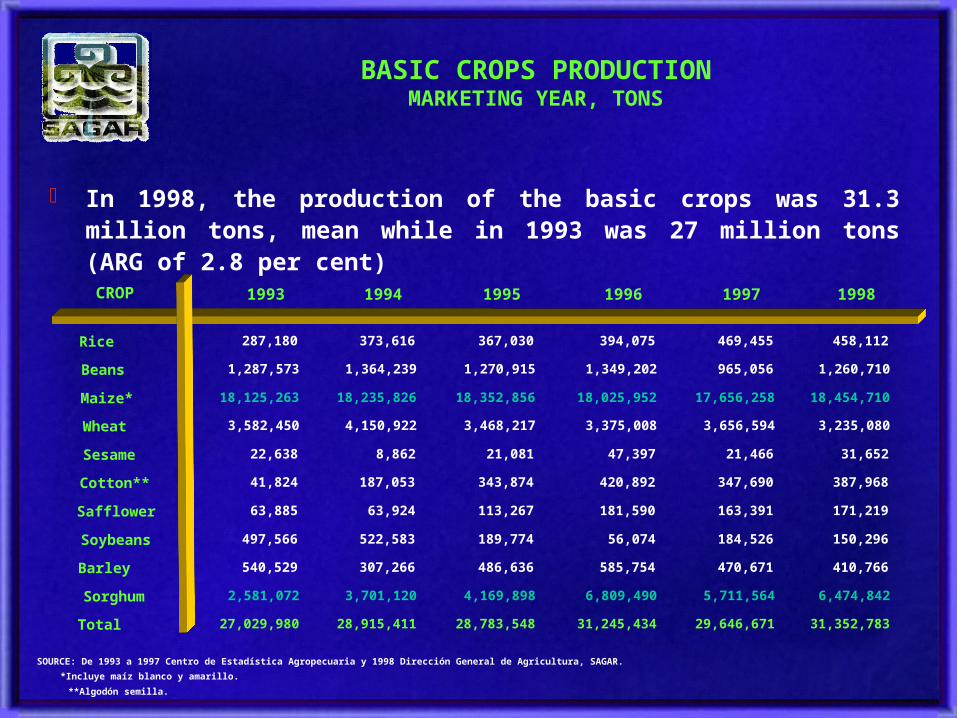
BASIC CROPS PRODUCTIONMARKETING YEAR, TONS
In 1998, the production of the basic crops was 31.3 million tons, mean while in 1993 was 27 million tons (ARG of 2.8 per cent)
1993 1994 1995 1996 1997 1998
287,180 373,616 367,030 394,075 469,455 458,112
1,287,573 1,364,239 1,270,915 1,349,202 965,056 1,260,710
18,125,263 18,235,826 18,352,856 18,025,952 17,656,258 18,454,710
3,582,450 4,150,922 3,468,217 3,375,008 3,656,594 3,235,080
22,638 8,862 21,081 47,397 21,466 31,652
41,824 187,053 343,874 420,892 347,690 387,968
63,885 63,924 113,267 181,590 163,391 171,219
497,566 522,583 189,774 56,074 184,526 150,296
540,529 307,266 486,636 585,754 470,671 410,766
2,581,072 3,701,120 4,169,898 6,809,490 5,711,564 6,474,842
27,029,980 28,915,411 28,783,548 31,245,434 29,646,671 31,352,783
CROP
Rice
Beans
Maize*
Wheat
Sesame
Cotton**
Safflower
Soybeans
Barley
Sorghum
Total
SOURCE: De 1993 a 1997 Centro de Estadística Agropecuaria y 1998 Dirección General de Agricultura, SAGAR.
*Incluye maíz blanco y amarillo.
**Algodón semilla.
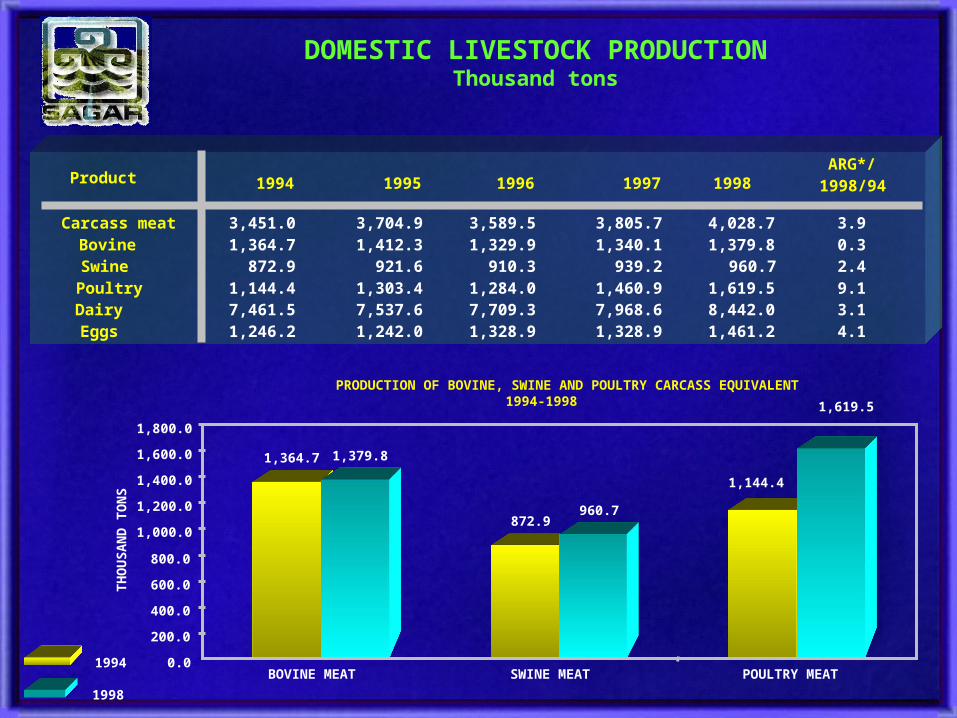
DOMESTIC LIVESTOCK PRODUCTIONThousand tons
1,364.7
872.9
1,144.4
1,379.8
960.7
1,619.5
PRODUCTION OF BOVINE, SWINE AND POULTRY CARCASS EQUIVALENT1994-1998
0.0
200.0
400.0
600.0
800.0
1,000.0
1,200.0
1,400.0
1,600.0
1,800.0
BOVINE MEAT SWINE MEAT POULTRY MEAT
TH
OU
SA
ND
TO
NS
1994
1998
3,451.0 3,704.9 3,589.5 3,805.7 4,028.7 3.91,364.7 1,412.3 1,329.9 1,340.1 1,379.8 0.3
872.9 921.6 910.3 939.2 960.7 2.41,144.4 1,303.4 1,284.0 1,460.9 1,619.5 9.17,461.5 7,537.6 7,709.3 7,968.6 8,442.0 3.11,246.2 1,242.0 1,328.9 1,328.9 1,461.2 4.1
1994 1995 1996 1997 1998ARG*/
Product 1998/94
Carcass meatBovineSwinePoultryDairy Eggs
CONCLUSIONS
Mexico and NAFTA partners are complementary in agriculture.
Access to foreign markets will not be the most important constraint for exports
Need to overcome structural problems.
Schemes for a better integration between primary sector and food processing industries.