Embed Size (px)
Citation preview

MeVis Medical Solutions
(CDAX, Software/IT)
CO M M E N T Published 29.08.2016 08:15 1
A n a l y s t
Harald Hof [email protected]
+49 40 309537-125
Value Indicators: EUR Share data: Description:
DCF: 24.81
Bloomberg: M3V GR
Reuters: M3VG
ISIN: DE000A0LBFE4
A leading supplier of software for visual-based medical equipment
Market Snapshot: EUR m Shareholders: Risk Profile (WRe): 2016e
Hold
EUR 25.00 (EUR 22.00)
Price EUR 30.00
Downside -16.7 %
Market cap: 54.6
No. of shares (m): 1.8
EV: 27.8
Freefloat MC: 12.8
Ø Trad. Vol. (30d): 7.85 th
Freefloat 23.5 %
Varian Medical Systems 73.5 %
Oppenheim Asset Manag. 3.0 %
Beta: 1.6
Price / Book: 1.6 x
Equity Ratio: 74 %
Profitability enhanced; Guidance increased
Stated Figures Q2/2016: Comment on Figures: FY End: 31.12. in EUR m
Q2 16
Q2 16e
Q2 15 yoy
6M 16
6M 16e
6M 15 yoy
Sales 3.8 3.6 3.7 2 % 7.7 7.5 7.1 7 %
EBITDA 1.6 1.3 1.6 0 % 3.2 2.9 2.7 20 %
Margin 41.1 % 35.7 % 41.8 % 41.6 % 39.0 % 37.4 %
EBIT 1.1 0.6 1.1 2 % 2.3 1.8 1.6 41 %
Margin 29.2 % 17.0 % 29.1 % 29.9 % 24.0 % 22.8 %
EPS 0.88 0.82 0.35 151 % 1.06 1.01 0.72 47 %
� Q2 sales and EBIT were reported in line with previous year, however, figures were better than assumed. MeVis shows a stable operating business, despite the expected change of its business model.
� Nevertheless, an improvement in H1 sales and EBIT was achieved in Q1 already.
� A tax effect is the main reason for the strong increase in EPS. As the fiscal unity became effective at the beginning of 2016, just capital income taxes in the sum of five thousand euros were charged.
It has actually been expected since 2014 that the changed business model should become visible in the reported figures. This has not
happened up to now. However, a generally positive picture was drawn as sales of software and licenses business were reported stable (-2.5%
yoy in H1). In addition, the sales split shows an increase in sales (+25% yoy in H1) from maintenance activities based on software service
contracts which were closed in the past. Despite Hologic’s aim to transform the cooperation, figures do not yet show a meaningful development
towards the new business model. For the moment, it is assumed that the transformation will take more time than initially predicted after the
announcement in early 2014. Hence, MeVis is expected to remain a profitable company at almost 30% EBIT margins.
The Annual General Meeting voted for a change in the fiscal year to adapt Varian’s accounting period. Therefore, MeVis’s fiscal years will
begin on October 1 and end on September 30. Up until then the fiscal year corresponded to the calendar year. Against this backdrop, 2016
represents a short fiscal year of just nine months (January 1, 2016 until September 30, 2016). Based on the shorter fiscal year, management
has already released an updated guidance for this nine month period in 2016. Now sales of EUR 11.5m to 12m and an EBIT of EUR 3.5m to
4m are guided. While sales are expected to remain stable, an increased profitability is expected. As costs which occurred in the context of
Varian’s take-over will fall away, EBIT margin should improve.
Taking the updated model and smaller adjustments into account, a fair value of EUR 25 per share is derived (DCF-based). Hold.
Changes in Estimates: Comment on Changes: FY End: 31.12. in EUR m
2016e (old)
+ / - 2017e (old)
+ / - 2018e (old)
+ / -
Sales 14.4 -20.3 % 13.9 0.0 % 10.7 0.0 %
EBITDA 4.6 3.7 % 4.0 0.0 % 1.5 0.0 %
EBIT 2.5 39.7 % 2.3 0.0 % 0.2 0.0 %
EBT 2.6 38.1 % 2.4 0.0 % 0.3 0.0 %
Net income 2.6 38.1 % 2.4 0.0 % 0.3 0.0 %
� In accordance with the AGM’s approval, we changed our assumptions for 2016. The period from January to September is a short fiscal year in order to adapt Varian’s accounting period.
Rel. Performance vs CDAX:
1 month: -1.2 %
6 months: 11.3 %
Year to date: 28.4 %
Trailing 12 months: 25.2 %
Company events:
17.11.16 Q3
FY End: 31.12. in EUR m
CAGR (15-18e) 2012 2013 2014 2015 2016e 2017e 2018e
Sales -12.6 % 13.3 14.6 13.1 16.0 11.5 13.9 10.7
Change Sales yoy -2.4 % 9.4 % -10.3 % 22.3 % -28.2 % 20.6 % -22.9 %
Gross profit margin 114.1 % 104.9 % 104.3 % 96.2 % 97.0 % 95.0 % 95.0 %
EBITDA -38.8 % 6.0 6.1 5.6 6.4 4.8 4.0 1.5
Margin 44.6 % 41.8 % 42.7 % 40.0 % 41.6 % 28.7 % 13.7 %
EBIT -65.6 % 3.0 4.1 3.9 4.5 3.5 2.3 0.2
Margin 22.3 % 27.8 % 29.7 % 27.9 % 30.6 % 16.7 % 1.7 %
Net income -65.3 % 2.2 3.7 3.7 6.7 3.6 2.4 0.3
EPS -65.1 % 1.26 2.15 2.16 3.76 2.02 1.35 0.16
EPS adj. -65.1 % 1.26 2.15 2.16 3.76 2.02 1.35 0.16
DPS 0.0 % 0.00 0.00 0.04 0.95 0.95 0.95 0.95
Dividend Yield n.a. n.a. 0.3 % 4.4 % 3.2 % 3.2 % 3.2 %
FCFPS 1.56 3.39 1.90 3.61 2.85 1.73 0.64
FCF / Market cap 23.9 % 26.4 % 12.2 % 16.8 % 9.3 % 5.7 % 2.1 %
EV / Sales 0.2 x 0.8 x 1.3 x 0.8 x 2.4 x 1.9 x 2.5 x
EV / EBITDA 0.4 x 2.0 x 3.1 x 2.1 x 5.8 x 6.7 x 18.4 x
EV / EBIT 0.9 x 3.0 x 4.5 x 3.0 x 7.9 x 11.5 x 148.3 x
P / E 5.2 x 6.0 x 7.2 x 5.7 x 14.9 x 22.2 x 186.8 x
P / E adj. 5.2 x 6.0 x 7.2 x 5.7 x 14.9 x 22.2 x 186.8 x
FCF Yield Potential 123.0 % 35.5 % 15.2 % 58.9 % 17.2 % 15.0 % 4.7 %
Net Debt -8.7 -9.8 -9.3 -25.0 -26.8 -28.0 -27.5
ROCE (NOPAT) 17.0 % 25.4 % 15.5 % 40.9 % 42.2 % 30.1 % 2.6 % Guidance: 2016e: Sales EUR 14.5-15m; EBIT EUR 2.5-3m

MeVis Medical Solutions
CO M M E N T Published 29.08.2016 2
Sales development in EUR m
Source: Warburg Research
Sales by types 2015; in %
Source: Warburg Research
EBIT development in EUR m
Source: Warburg Research
Company Background
� The origin of MeVis Medical Solutions AG, which was set up in 1998, dates back to 1992, when the CeVis (Center for Complex
Systems and Visualization) was founded at the University of Bremen.
� The public company was founded with the aim of developing commercially successful disease-oriented products based on successes
in scientific research and to market these.
� Since its foundation, MeVis has been active in the area of computer-aided, image-based medical diagnostics and therapy.
� MeVis has successfully risen to become a globally-leading provider of software solutions for medical imaging. This development is
mainly based on the success in the area of digital mammography.
� Together with products by Hologic and Siemens, MeVis's solutions dominate this segment today. Furthermore, MeVis has a broad
portfolio of new products.
Competitive Quality
� MeVis follows a strategy of early market presence in the new areas of image-based medical technology. In focus here are mass
market products.
� The ability to be an early market entrant differentiates MeVis from competitors.
� MeVis maintains long-term and interdisciplinary cooperation agreements with more than 100 hospitals and leading R&D centres in
Germany, Europe, the US and Asia.
� MeVis fosters partnerships with the globally leading medical technology OEMs, for instance Siemens and Hologic.
EBT development in EUR m
Source: Warburg Research
Sales by segments 2015; in %
Source: Warburg Research
Net income development in EUR m
Source: Warburg Research

MeVis Medical Solutions
CO M M E N T Publ ished 29 .08 .2016 3
DCF model
Detailed forecast period Transitional period Term. Value
Figures in EUR m 2016e 2017e 2018e 2019e 2020e 2021e 2022e 2023e 2024e 2025e 2026e 2027e 2028e
Sales 11.5 13.9 10.7 12.9 10.0 9.0 8.5 8.3 8.5 8.7 8.9 9.1 n.a.
Sales change -28.2 % 20.6 % -22.9 % 20.6 % -22.9 % -9.5 % -5.5 % -3.0 % 2.3 % 2.5 % 2.5 % 2.5 % n.a. 2.5 %
EBIT 3.5 2.3 0.2 2.2 0.2 -0.3 -0.3 -0.2 0.3 1.7 2.0 2.0 n.a.
EBIT-margin 30.6 % 16.7 % 1.7 % 16.7 % 1.7 % -3.7 % -3.3 % -2.6 % 3.3 % 20.0 % 22.0 % 22.0 % n.a.
Tax rate (EBT) 0.0 % 0.0 % 0.0 % 0.0 % 0.0 % 0.0 % 0.0 % 0.0 % 0.0 % 0.0 % 0.0 % 0.0 % n.a.
NOPAT 3.5 2.3 0.2 2.2 0.2 -0.3 -0.3 -0.2 0.3 1.7 2.0 2.0 n.a.
Depreciation 1.3 1.7 1.3 1.5 1.2 1.1 1.0 1.0 0.9 1.0 0.9 0.8 n.a.
in % of Sales 11.0 % 12.0 % 12.0 % 12.0 % 12.0 % 12.0 % 12.0 % 12.0 % 11.0 % 11.0 % 10.0 % 9.0 % n.a.
Changes in provisions 0.0 0.0 0.0 -0.6 0.0 0.0 0.0 0.0 0.0 0.0 0.0 0.0 n.a.
Change in Liquidity from
- Working Capital -0.7 0.3 -0.4 0.4 -0.4 -0.1 -0.1 0.0 0.0 0.0 0.0 0.0 n.a.
- Capex 0.5 0.7 0.8 1.0 0.8 0.7 0.7 0.7 0.7 0.7 0.7 0.7 n.a.
Capex in % of Sales 4.3 % 4.9 % 7.6 % 8.0 % 8.0 % 8.0 % 8.0 % 8.0 % 8.0 % 8.0 % 8.0 % 8.0 % n.a.
Other 0.0 0.0 0.0 0.0 0.0 0.0 0.0 0.0 0.0 0.0 0.0 0.0 n.a.
Free Cash Flow (WACC Model)
5.0 3.0 1.1 1.6 1.0 0.2 0.1 0.2 0.5 2.0 2.1 2.1 n.a. 2
PV of FCF 4.8 2.6 0.8 1.2 0.6 0.1 0.1 0.1 0.2 0.8 0.7 0.7 n.a. 8 share of PVs 39.80 % 24.18 % 36.02 %
Model parameter Valuation (m)
Derivation of WACC: Derivation of Beta: Present values 2028e 13
Terminal Value 8
Debt ratio 0.00 % Financial Strength 1.00 Financial liabilities 0
Cost of debt (after tax) 6.0 % Liquidity (share) 1.80 Pension liabilities 1
Market return 7.00 % Cyclicality 1.80 Hybrid capital 0
Risk free rate 1.50 % Transparency 1.80 Minority interest 0
Others 1.80 Market val. of investments 0
Liquidity 25 No. of shares (m) 1.8
WACC 10.52 % Beta 1.64 Equity Value 45 Value per share (EUR) 24.81
Sensitivity Value per Share (EUR)
Terminal Growth Delta EBIT-margin
Beta WACC 1.75 % 2.00 % 2.25 % 2.50 % 2.75 % 3.00 % 3.25 % Beta WACC -1.5 pp -1.0 pp -0.5 pp +0.0 pp +0.5 pp +1.0 pp +1.5 pp
1.82 11.5 % 23.49 23.57 23.65 23.74 23.84 23.94 24.04 1.82 11.5 % 22.91 23.18 23.46 23.74 24.02 24.30 24.58
1.73 11.0 % 23.95 24.04 24.14 24.24 24.35 24.47 24.60 1.73 11.0 % 23.37 23.66 23.95 24.24 24.54 24.83 25.12
1.69 10.8 % 24.19 24.30 24.40 24.52 24.64 24.77 24.91 1.69 10.8 % 23.62 23.92 24.22 24.52 24.82 25.12 25.42
1.64 10.5 % 24.46 24.57 24.69 24.81 24.94 25.08 25.24 1.64 10.5 % 23.89 24.20 24.50 24.81 25.12 25.42 25.73
1.59 10.3 % 24.74 24.86 24.99 25.12 25.27 25.42 25.59 1.59 10.3 % 24.18 24.49 24.81 25.12 25.44 25.75 26.07
1.55 10.0 % 25.03 25.17 25.31 25.46 25.62 25.79 25.97 1.55 10.0 % 24.49 24.81 25.13 25.46 25.78 26.10 26.43
1.46 9.5 % 25.69 25.85 26.02 26.20 26.39 26.60 26.83 1.46 9.5 % 25.17 25.51 25.86 26.20 26.54 26.89 27.23
� The DCF model bases on the assumption of declining revenues and earnings in the years to come.
� Operating leverage is expected to be burdened by lower sales volumes.
� Main aspect is the changed business model with Hologic (2018 onwards).
� Revenues with clients beside Hologic are not impacted by the transformation process.

MeVis Medical Solutions
CO M M E N T Published 29.08.2016 4
Valuation
2012 2013 2014 2015 2016e 2017e 2018e
Price / Book 0.5 x 0.8 x 0.9 x 1.1 x 1.6 x 1.5 x 1.6 x
Book value per share ex intangibles 3.44 6.26 8.50 11.10 12.02 12.97 12.44
EV / Sales 0.2 x 0.8 x 1.3 x 0.8 x 2.4 x 1.9 x 2.5 x
EV / EBITDA 0.4 x 2.0 x 3.1 x 2.1 x 5.8 x 6.7 x 18.4 x
EV / EBIT 0.9 x 3.0 x 4.5 x 3.0 x 7.9 x 11.5 x 148.3 x
EV / EBIT adj.* 0.9 x 3.0 x 4.5 x 3.0 x 7.9 x 11.5 x 148.3 x
P / FCF 4.2 x 3.8 x 8.2 x 6.0 x 10.6 x 17.5 x 46.9 x
P / E 5.2 x 6.0 x 7.2 x 5.7 x 14.9 x 22.2 x 186.8 x
P / E adj.* 5.2 x 6.0 x 7.2 x 5.7 x 14.9 x 22.2 x 186.8 x
Dividend Yield n.a. n.a. 0.3 % 4.4 % 3.2 % 3.2 % 3.2 %
Free Cash Flow Yield Potential 123.0 % 35.5 % 15.2 % 58.9 % 17.2 % 15.0 % 4.7 %
*Adjustments made for: -

MeVis Medical Solutions
CO M M E N T Published 29.08.2016 5
Consolidated profit & loss In EUR m 2012 2013 2014 2015 2016e 2017e 2018e
Sales 13.3 14.6 13.1 16.0 11.5 13.9 10.7
Change Sales yoy -2.4 % 9.4 % -10.3 % 22.3 % -28.2 % 20.6 % -22.9 %
Increase / decrease in inventory 0.0 0.0 0.0 0.0 0.0 0.0 0.0
Own work capitalised 2.4 1.4 1.2 0.0 0.0 0.0 0.0
Total Sales 15.8 16.0 14.3 16.0 11.5 13.9 10.7
Material Expenses 0.5 0.7 0.6 0.6 0.3 0.7 0.5
Gross profit 15.2 15.3 13.7 15.4 11.2 13.2 10.2
Gross profit margin 114.1 % 104.9 % 104.3 % 96.2 % 97.0 % 95.0 % 95.0 %
Personnel expenses 8.1 7.9 7.0 7.4 5.3 7.5 7.3
Other operating income 1.1 0.5 1.0 1.1 0.4 0.4 0.4
Other operating expenses 2.3 1.9 2.0 2.7 1.5 2.1 1.8
Unfrequent items 0.0 0.0 0.0 0.0 0.0 0.0 0.0
EBITDA 6.0 6.1 5.6 6.4 4.8 4.0 1.5
Margin 44.6 % 41.8 % 42.7 % 40.0 % 41.6 % 28.7 % 13.7 %
Depreciation of fixed assets 0.5 0.4 0.2 0.1 0.2 0.3 0.2
EBITA 5.5 5.7 5.4 6.3 4.6 3.7 1.3
Amortisation of intangible assets 2.5 1.9 1.5 1.8 1.0 1.4 1.1
Goodwill amortization 0.0 0.0 0.0 0.0 0.0 0.0 0.0
EBIT 3.0 4.1 3.9 4.5 3.5 2.3 0.2
Margin 22.3 % 27.8 % 29.7 % 27.9 % 30.6 % 16.7 % 1.7 %
EBIT adj. 3.0 4.1 3.9 4.5 3.5 2.3 0.2
Interest income 0.1 0.1 0.2 0.2 0.1 0.1 0.1
Interest expenses 0.3 0.1 0.0 0.0 0.0 0.0 0.0
Other financial income (loss) -0.3 -0.2 0.9 0.3 0.0 0.0 0.0
EBT 2.4 3.8 4.9 5.0 3.6 2.4 0.3
Margin 17.7 % 26.3 % 37.8 % 30.9 % 31.4 % 17.4 % 2.6 %
Total taxes 0.2 0.1 1.2 -1.8 0.0 0.0 0.0
Net income from continuing operations 2.2 3.7 3.7 6.7 3.6 2.4 0.3
Income from discontinued operations (net of tax) 0.0 0.0 0.0 0.0 0.0 0.0 0.0
Net income before minorities 2.2 3.7 3.7 6.7 3.6 2.4 0.3
Minority interest 0.0 0.0 0.0 0.0 0.0 0.0 0.0
Net income 2.2 3.7 3.7 6.7 3.6 2.4 0.3
Margin 16.2 % 25.4 % 28.4 % 42.1 % 31.4 % 17.4 % 2.6 %
Number of shares, average 1.7 1.7 1.7 1.8 1.8 1.8 1.8
EPS 1.26 2.15 2.16 3.76 2.02 1.35 0.16
EPS adj. 1.26 2.15 2.16 3.76 2.02 1.35 0.16
*Adjustments made for:
Guidance: 2016e: Sales EUR 14.5-15m; EBIT EUR 2.5-3m
Financial Ratios 2012 2013 2014 2015 2016e 2017e 2018e
Total Operating Costs / Sales 73.5 % 68.1 % 66.5 % 60.0 % 58.4 % 71.3 % 86.3 %
Operating Leverage n.a. 3.9 x 0.4 x 0.7 x 0.8 x -1.7 x 4.0 x
EBITDA / Interest expenses 17.2 x 57.5 x 253.9 x 291.3 x n.a. n.a. n.a.
Tax rate (EBT) 8.3 % 3.5 % 24.9 % -36.0 % 0.0 % 0.0 % 0.0 %
Dividend Payout Ratio 0.0 % 0.0 % 1.9 % 25.3 % 47.1 % 70.5 % 603.8 %
Sales per Employee 113,110 135,185 116,884 142,982 102,679 123,856 95,544
Sales, EBITDA in EUR m
Source: Warburg Research
Operating Performance in %
Source: Warburg Research
Performance per Share
Source: Warburg Research
MeVis Medical Solutions
CO M M E N T Published 29.08.2016 6
Consolidated balance sheet In EUR m 2012 2013 2014 2015 2016e 2017e 2018e
Assets
Goodwill and other intangible assets 16.8 15.7 15.6 13.9 13.2 12.2 11.8
thereof other intangible assets 6.2 5.0 5.0 3.2 2.6 1.6 1.1
thereof Goodwill 10.6 10.6 10.6 10.6 10.6 10.6 10.6
Property, plant and equipment 0.3 0.5 0.4 0.3 0.2 0.2 0.2
Financial assets 0.3 1.2 1.6 1.7 1.7 1.7 1.7
Other long-term assets 0.0 0.0 0.0 0.9 1.6 1.8 1.8
Fixed assets 17.5 17.4 17.6 16.8 16.7 15.9 15.5
Inventories 0.2 0.0 0.0 0.1 0.1 0.1 0.1
Accounts receivable 3.9 2.0 2.7 2.8 2.5 3.0 2.3
Liquid assets 8.7 9.8 9.3 25.6 27.4 28.6 28.1
Other short-term assets 0.7 4.8 8.7 0.2 0.2 0.2 0.2
Current assets 13.4 16.6 20.7 28.7 30.3 32.0 30.7
Total Assets 30.9 34.0 38.3 45.5 47.0 47.9 46.2
Liabilities and shareholders' equity
Subscribed capital 1.8 1.8 1.8 1.8 1.8 1.8 1.8
Capital reserve 28.1 9.8 9.8 8.2 8.2 8.2 8.2
Retained earnings 0.0 0.0 0.0 0.4 4.0 6.4 6.7
Other equity components -7.1 14.9 18.7 23.3 20.7 19.0 17.3
Shareholders' equity 22.8 26.4 30.3 33.7 34.7 35.5 34.0
Minority interest 0.0 0.0 0.0 0.0 0.0 0.0 0.0
Total equity 22.8 26.4 30.3 33.7 34.7 35.5 34.0
Provisions 0.8 0.4 0.5 0.6 0.6 0.6 0.6
thereof provisions for pensions and similar obligations 0.0 0.0 0.0 0.6 0.6 0.6 0.6
Financial liabilities (total) 0.0 0.0 0.0 0.0 0.0 0.0 0.0
thereof short-term financial liabilities 0.0 0.0 0.0 0.0 0.0 0.0 0.0
Accounts payable 1.1 0.8 0.6 0.6 1.0 1.2 0.9
Other liabilities 6.2 6.3 6.9 10.6 10.6 10.6 10.6
Liabilities 8.1 7.6 8.0 11.8 12.3 12.5 12.2
Total liabilities and shareholders' equity 30.9 34.0 38.3 45.5 47.0 47.9 46.2
Financial Ratios 2012 2013 2014 2015 2016e 2017e 2018e
Efficiency of Capital Employment
Operating Assets Turnover 4.1 x 8.4 x 5.2 x 6.1 x 6.4 x 6.7 x 6.4 x
Capital Employed Turnover 0.9 x 0.9 x 0.6 x 1.8 x 1.4 x 1.9 x 1.6 x
ROA 12.4 % 21.3 % 21.1 % 40.0 % 21.6 % 15.1 % 1.8 %
Return on Capital
ROCE (NOPAT) 17.0 % 25.4 % 15.5 % 40.9 % 42.2 % 30.1 % 2.6 %
ROE 9.9 % 15.1 % 13.1 % 21.0 % 10.6 % 6.9 % 0.8 %
Adj. ROE 9.9 % 15.1 % 13.1 % 21.0 % 10.6 % 6.9 % 0.8 %
Balance sheet quality
Net Debt -8.7 -9.8 -9.3 -25.0 -26.8 -28.0 -27.5
Net Financial Debt -8.7 -9.8 -9.3 -25.6 -27.4 -28.6 -28.1
Net Gearing -38.1 % -37.0 % -30.6 % -74.1 % -77.2 % -79.0 % -80.7 %
Net Fin. Debt / EBITDA n.a. n.a. n.a. n.a. n.a. n.a. n.a.
Book Value / Share 13.2 15.4 17.6 18.8 19.4 19.8 19.0
Book value per share ex intangibles 3.4 6.3 8.5 11.1 12.0 13.0 12.4
ROCE Development
Source: Warburg Research
Net debt in EUR m
Source: Warburg Research
Book Value per Share in EUR
Source: Warburg Research
MeVis Medical Solutions
CO M M E N T Published 29.08.2016 7
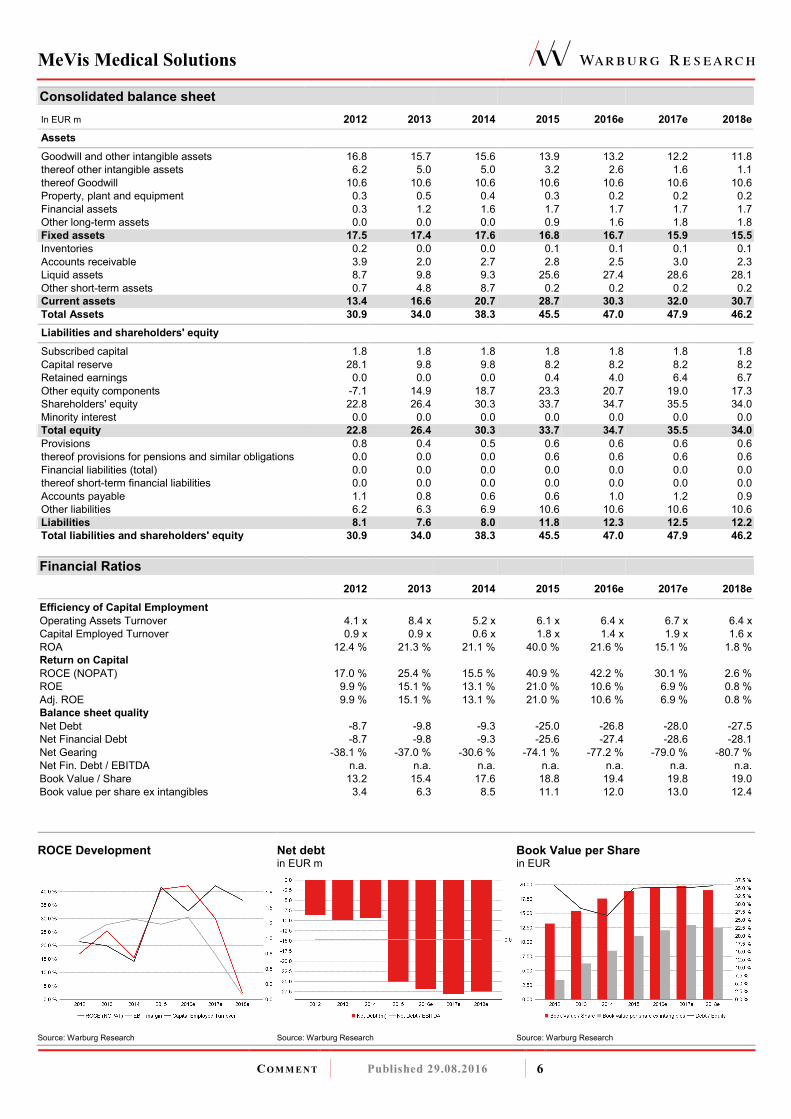
Consolidated cash flow statement In EUR m 2012 2013 2014 2015 2016e 2017e 2018e
Net income 3.1 3.7 3.7 6.7 3.6 2.4 0.3
Depreciation of fixed assets 0.5 0.2 0.2 0.1 0.2 0.3 0.2
Amortisation of goodwill 0.0 0.0 0.0 0.0 0.0 0.0 0.0
Amortisation of intangible assets 2.5 1.9 1.5 1.8 1.0 1.4 1.1
Increase/decrease in long-term provisions -0.4 -0.3 0.0 0.6 0.0 0.0 0.0
Other non-cash income and expenses 0.1 0.6 -0.3 -3.5 0.0 0.0 0.0
Cash Flow 5.7 6.1 5.2 5.8 4.9 4.1 1.6
Increase / decrease in inventory 0.1 0.2 0.0 0.0 0.0 0.0 0.0
Increase / decrease in accounts receivable 0.1 1.0 -0.2 -0.5 0.3 -0.5 0.7
Increase / decrease in accounts payable -0.6 0.4 -0.1 1.2 0.4 0.2 -0.3
Increase / decrease in other working capital positions 0.0 0.0 0.0 0.0 0.0 0.0 0.0
Increase / decrease in working capital (total) -0.4 1.6 -0.3 0.8 0.7 -0.3 0.4
Net cash provided by operating activities 5.3 7.7 4.8 6.6 5.6 3.8 2.0
Investments in intangible assets -2.5 -1.5 -1.5 0.0 -0.4 -0.4 -0.6
Investments in property, plant and equipment -0.1 -0.4 -0.1 -0.1 -0.1 -0.3 -0.2
Payments for acquisitions -1.4 0.0 0.0 0.0 0.0 0.0 0.0
Financial investments 0.9 0.0 0.0 0.0 0.0 0.0 0.0
Income from asset disposals 0.0 -3.7 -3.5 8.0 0.0 0.0 0.0
Net cash provided by investing activities -3.1 -5.6 -5.0 7.9 -0.5 -0.7 -0.8
Change in financial liabilities 0.0 -0.1 0.0 0.0 0.0 0.0 0.0
Dividends paid 0.0 0.0 0.0 -0.1 -1.7 -1.7 -1.7
Purchase of own shares 0.0 0.0 0.0 0.0 0.0 0.0 0.0
Capital measures 0.0 0.0 0.0 0.0 0.0 0.0 0.0
Other 0.0 0.0 0.0 1.7 0.0 0.0 0.0
Net cash provided by financing activities 0.0 -0.1 0.0 1.6 -1.7 -1.7 -1.7
Change in liquid funds 2.1 2.1 -0.2 16.1 3.4 1.4 -0.5
Effects of exchange-rate changes on cash -0.1 -0.1 0.2 0.2 0.0 0.0 0.0
Cash and cash equivalent at end of period 8.1 10.1 9.3 25.6 29.0 30.4 29.9
Financial Ratios 2012 2013 2014 2015 2016e 2017e 2018e
Cash Flow
FCF 2.7 5.8 3.3 6.5 5.1 3.1 1.2
Free Cash Flow / Sales 20.1 % 40.0 % 25.0 % 40.4 % 44.4 % 22.4 % 10.8 %
Free Cash Flow Potential 3.2 4.4 2.7 8.0 4.8 4.0 1.3
Free Cash Flow / Net Profit 124.3 % 157.5 % 88.1 % 96.0 % 141.2 % 128.5 % 408.8 %
Interest Received / Avg. Cash 0.8 % 1.1 % 2.2 % 0.9 % 0.4 % 0.4 % 0.4 %
Interest Paid / Avg. Debt 14.7 % n.a. n.a. n.a. n.a. n.a. n.a.
Management of Funds
Investment ratio 19.5 % 12.7 % 11.9 % 0.7 % 4.3 % 4.9 % 7.6 %
Maint. Capex / Sales 19.1 % 11.3 % 12.9 % 1.4 % 5.2 % 4.3 % 7.5 %
Capex / Dep 87.3 % 92.8 % 92.1 % 6.0 % 39.1 % 40.7 % 63.4 %
Avg. Working Capital / Sales 24.2 % 14.3 % 12.9 % 14.0 % 17.0 % 12.6 % 15.9 %
Trade Debtors / Trade Creditors 341.2 % 255.9 % 472.0 % 501.3 % 250.0 % 250.0 % 255.6 %
Inventory Turnover 3.0 x n.a. n.a. 6.1 x 3.5 x 6.9 x 5.4 x
Receivables collection period (days) 107 50 76 63 79 79 78
Payables payment period (days) 780 422 333 330 1,058 631 614
Cash conversion cycle (Days) -621 n.a. n.a. -260 -929 -567 -531
CAPEX and Cash Flow in EUR m
Source: Warburg Research
Free Cash Flow Generation
Source: Warburg Research
Working Capital
Source: Warburg Research

MeVis Medical Solutions
CO M M E N T Published 29.08.2016 8
LEGAL DISCLAIMER
This research report (“investment recommendation” or “recommendation”) was prepared by the Warburg Research GmbH, a fully owned subsidiary of
the M.M.Warburg & CO (AG & Co.) KGaA and is passed on by the M.M.Warburg & CO (AG & Co.) KGaA. It contains selected information and does not
purport to be complete. The report is based on publicly available information and data ("the information") believed to be accurate and complete.
Warburg Research GmbH neither examines the information for accuracy and completeness, nor guarantees its accuracy and completeness. Possible
errors or incompleteness of the information do not constitute grounds for liability of M.M.Warburg & CO (AG & Co.) KGaA or Warburg Research GmbH
for damages of any kind whatsoever, and M.M.Warburg & CO (AG & Co.) KGaA and Warburg Research GmbH are not liable for indirect and/or direct
and/or consequential damages. In particular, neither M.M.Warburg & CO (AG & Co.) KGaA nor Warburg Research GmbH are liable for the statements,
plans or other details contained in these analyses concerning the examined companies, their affiliated companies, strategies, economic situations,
market and competitive situations, regulatory environment, etc. Although due care has been taken in compiling this research report, it cannot be
excluded that it is incomplete or contains errors. M.M.Warburg & CO (AG & Co.) KGaA and Warburg Research GmbH, their shareholders and
employees are not liable for the accuracy and completeness of the statements, estimations and the conclusions derived from the information contained
in this document. Provided a research report is being transmitted in connection with an existing contractual relationship, i.e. financial advisory or similar
services, the liability of M.M.Warburg & CO (AG & Co.) KGaA and Warburg Research GmbH shall be restricted to gross negligence and wilful
misconduct. In case of failure in essential tasks, M.M.Warburg & CO (AG & Co.) KGaA and Warburg Research GmbH are liable for normal negligence.
In any case, the liability of M.M.Warburg & CO (AG & Co.) KGaA and Warburg Research GmbH is limited to typical, expectable damages. This
research report does not constitute an offer or a solicitation of an offer for the purchase or sale of any security. Partners, directors or employees of
M.M.Warburg & CO (AG & Co.) KGaA, Warburg Research GmbH or affiliated companies may serve in a position of responsibility, i.e. on the board of
directors of companies mentioned in the report. Opinions expressed in this report are subject to change without notice. All rights reserved.
COPYRIGHT NOTICE
This work including all its parts is protected by copyright. Any use beyond the limits provided by copyright law without permission is prohibited and
punishable. This applies, in particular, to reproductions, translations, microfilming, and storage and processing on electronic media of the entire content
or parts thereof.
DISCLOSURE ACCORDING TO §34B OF THE GERMAN SECURITIES TRADING ACT (WHPG), THE ORDINANCE ON THE ANALYSIS OF FINANCIAL INSTRUMENTS (FINANV) AND MAR INCL. COMMISSION DELEGATED REGULATION (EU) 2016/958
The valuation underlying the investment recommendation for the company analysed here is based on generally accepted and widely used methods of
fundamental analysis, such as e.g. DCF Model, Free Cash Flow Potential, Peer Group Comparison or Sum of the Parts Model. The result of this
fundamental valuation is modified to take into consideration the analyst’s assessment as regards the expected development of investor sentiment and
its impact on the share price.
Independent of the applied valuation methods, there is the risk that the price target will not be met, for instance because of unforeseen changes in
demand for the company’s products, changes in management, technology, economic development, interest rate development, operating and/or
material costs, competitive pressure, supervisory law, exchange rate, tax rate etc. For investments in foreign markets and instruments there are further
risks, generally based on exchange rate changes or changes in political and social conditions.
This commentary reflects the opinion of the relevant author at the point in time of its compilation. A change in the fundamental factors underlying the
valuation can mean that the valuation is subsequently no longer accurate. Whether, or in what time frame, an update of this commentary follows is not
determined in advance.
Additional internal and organisational arrangements to prevent or to deal with conflicts of interest have been implemented. Among these are the spatial
separation of Warburg Research GmbH from M.M.Warburg & CO (AG & Co.) KGaA and the creation of areas of confidentiality. This prevents the
exchange of information, which could form the basis of conflicts of interest for Warburg Research in terms of the analysed issuers or their financial
instruments.
The analysts of Warburg Research GmbH do not receive a gratuity – directly or indirectly – from the investment banking activities of M.M.Warburg &
CO (AG & Co.) KGaA or of any company within the Warburg Group.
All prices of financial instruments given in this financial analysis are the closing prices on the last stock-market trading day before the publication date
stated, unless another point in time is explicitly stated.
M.M.Warburg & CO (AG & Co.) KGaA and Warburg Research GmbH are subject to the supervision of the Federal Financial Supervisory Authority,
BaFin. M.M.Warburg & CO (AG & Co.) KGaA is additionally subject to the supervision of the European Central Bank (ECB).
SOURCES
All data and consensus estimates have been obtained from FactSet except where stated otherwise.
MeVis Medical Solutions
CO M M E N T Published 29.08.2016 9
Additional information for clients in the United States
1. This research report (the “Report”) is a product of Warburg Research GmbH, Germany, a fully owned subsidiary of M.M.Warburg & CO (AG & Co.)
KGaA, Germany (in the following collectively “Warburg”). Warburg is the employer of the research analyst(s), who have prepared the Report. The
research analyst(s) reside outside the United States and are not associated persons of any U.S. regulated broker-dealer and therefore are not subject
to the supervision of any U.S. regulated broker-dealer.
2. The Report is provided in the United States for distribution solely to "major U.S. institutional investors" under Rule 15a-6 of the U.S. Securities
Exchange Act of 1934.
3. Any recipient of the Report should effect transactions in the securities discussed in the Report only through J.P.P. Euro-Securities, Inc., Delaware.
4. J.P.P. Euro-Securities, Inc. does not accept or receive any compensation of any kind for the dissemination of the research reports from Warburg.
Reference in accordance with section 34b of the German Securities Trading Act (WpHG), the Ordinance on the Analysis of Financial Instruments (FinAnV), MAR and Commission Delegated Regulation (EU) regarding possible conflicts of interest with companies analysed:
-1- Warburg Research, or an affiliated company, or an employee of one of these companies responsible for the compilation of the research, hold
a share of more than 5% of the equity capital of the analysed company.
-2- Warburg Research, or an affiliated company, within the last twelve months participated in the management of a consortium for an issue in
the course of a public offering of such financial instruments, which are, or the issuer of which is, the subject of the financial analysis.
-3- Companies affiliated with Warburg Research manage financial instruments, which are, or the issuers of which are, subject of the financial
analysis, in a market based on the provision of buy or sell contracts.
-4-
Warburg Research, or an affiliated company, reached an agreement with the issuer to provide investment services and the relevant
agreement was in force in the last 12 months or an obligation to pay or to receive compensation existed for this period based on the
agreement - provided that this disclosure does not result in the disclosure of confidential business information.
-5- The company compiling the analysis or an affiliated company had reached an agreement on the compilation of the financial analysis with
the analysed company.
-6- Companies affiliated with Warburg Research regularly trade financial instruments of the analysed company or derivatives of these.
-6a- Warburg Research, or an affiliated company, holds a net long position of more than 0.5% of the total issued share capital of the analysed
company.
-6b- Warburg Research, or an affiliated company, holds a net short position of more than 0.5% of the total issued share capital of the analysed
company.
-6c- The issuer holds shares of more than 5% of the total issued capital of Warburg Research or an affiliated company.
-7- The company preparing the analysis as well as its affiliated companies and employees have other important interests in relation to the
analysed company, such as, for example, the exercising of mandates at analysed companies.
This report has been made accessible to the company analysed.
Company Disclosure Link to the historical price targets and rating changes (last 12 months)
MeVis Medical Solutions 3, 5, 6, 7 http://www.mmwarburg.com/disclaimer/disclaimer_en/DE000A0LBFE4.htm

MeVis Medical Solutions
CO M M E N T Published 29.08.2016 10
INVESTMENT RECOMMENDATION
Investment recommendation: expected direction of the share price development of the financial instrument up to the given price target in the opinion of
the analyst who covers this financial instrument.
-B- Buy: The price of the analysed financial instrument is expected to rise over the next 12 months.
-H- Hold: The price of the analysed financial instrument is expected to remain mostly flat over the next 12
months.
-S- Sell: The price of the analysed financial instrument is expected to fall over the next 12 months.
“-“ Rating suspended: The available information currently does not permit an evaluation of the company.
WARBURG RESEARCH GMBH – ANALYSED RESEARCH UNIVERSE BY RATING
Rating Number of stocks % of Universe
Buy 116 61
Hold 66 35
Sell 7 4
Rating suspended 1 1
Total 190 100
WARBURG RESEARCH GMBH – ANALYSED RESEARCH UNIVERSE BY RATING J
J taking into account only those companies which were provided with major investment services in the last twelve months.
Rating Number of stocks % of Universe
Buy 25 69
Hold 10 28
Sell 1 3
Rating suspended 0 0
Total 36 100
PRICE AND RATING HISTORY MEVIS MEDICAL SOLUTIONS AS OF 29.08.2016
Markings in the chart show rating changes by Warburg Research
GmbH in the last 12 months. Every marking details the date and
closing price on the day of the rating change.
MeVis Medical Solutions
CO M M E N T Published 29.08.2016 11
EQUITIES Roland Rapelius +49 40 3282-2673 Head of Equities [email protected] RESEARCH Michael Heider +49 40 309537-280 Andreas Pläsier +49 40 309537-246 Head of Research [email protected] Banks, Financial Services [email protected]
Henner Rüschmeier +49 40 309537-270 Jochen Reichert +49 40 309537-130 Head of Research [email protected] Telco, Internet, Media [email protected]
Lucas Boventer +49 40 309537-290 J. Moritz Rieser +49 40 309537-260 Renewables, Internet, Media [email protected] Real Estate [email protected]
Christian Cohrs +49 40 309537-175 Arash Roshan Zamir +49 40 309537-155 Engineering, Logistics [email protected] Cap. Goods, Renewables [email protected]
Felix Ellmann +49 40 309537-120 Malte Schaumann +49 40 309537-170 Software, IT [email protected] Technology [email protected]
Jörg Philipp Frey +49 40 309537-258 Oliver Schwarz +49 40 309537-250 Retail, Consumer Goods [email protected] Chemicals, Agriculture [email protected]
Harald Hof +49 40 309537-125 Marc-René Tonn +49 40 309537-259 Medtech [email protected] Automobiles, Car Suppliers [email protected]
Ulrich Huwald +49 40 309537-255 Björn Voss +49 40 309537-254 Health Care, Pharma [email protected] Steel, Car Suppliers [email protected]
Thilo Kleibauer +49 40 309537-257 Alexander Wahl +49 40 309537-230 Retail, Consumer Goods [email protected] Other [email protected]
Eggert Kuls +49 40 309537-256 Andreas Wolf +49 40 309537-140 Engineering [email protected] Software, IT [email protected] INSTITUTIONAL EQUITY SALES Holger Nass +49 40 3282-2669 Marie-Therese Grübner +49 40 3282-2630 Head of Equity Sales, USA [email protected] France, Switzerland [email protected]
Klaus Schilling +49 40 3282-2664 Michael Kriszun +49 40 3282-2695 Dep. Head of Equity Sales, GER [email protected] United Kingdom [email protected]
Tim Beckmann +49 40 3282-2665 Marc Niemann +49 40 3282-2660 United Kingdom [email protected] Germany [email protected]
Lyubka Bogdanova +49 69 5050-7411 Fabian Roggemann +49 40 3282-2667 United Kingdom, Australia [email protected] USA [email protected]
Jens Buchmüller +49 69 5050-7415 Sanjay Oberoi +49 69 5050-7410 Scandinavia, Austria [email protected] United Kingdom [email protected]
Paul Dontenwill +49 40 3282-2666 Juliane Willenbruch +49 40 3282-2694 USA [email protected] Roadshow/Marketing [email protected]
Matthias Fritsch +49 40 3282-2696 United Kingdom [email protected]
SALES TRADING Oliver Merckel +49 40 3282-2634 Jörg Treptow +49 40 3262-2658 Head of Sales Trading [email protected] Sales Trading [email protected] Michael Ilgenstein +49 40 3282-2700 Jan Walter +49 40 3262-2662 Sales Trading [email protected] Sales Trading [email protected] Bastian Quast +49 40 3282-2701 Sales Trading [email protected] MACRO RESEARCH Carsten Klude +49 40 3282-2572 Dr. Christian Jasperneite +49 40 3282-2439 Macro Research [email protected] Investment Strategy [email protected] Our research can be found under: Warburg Research research.mmwarburg.com/en/index.html Thomson www.thomson.com Bloomberg MMWA GO Reuters www.knowledge.reuters.com FactSet www.factset.com Capital IQ www.capitaliq.com For access please contact:
Andrea Schaper +49 40 3282-2632 Kerstin Muthig +49 40 3282-2703 Sales Assistance [email protected] Sales Assistance [email protected]


![F Z l j ] h j h ^ k d i ^ Z ] h ] b d h g n j g p b b «От ...old.goruno-dubna.ru/deiatelnost/Konferncii/29.08.2016/AvgGPK2016.pdfАдминистрации города Дубны](https://img.pdfslide.us/doc/110x75/5f0460c27e708231d40dad9b/f-z-l-j-h-j-h-k-d-i-z-h-b-d-h-g-n-j-g-p-b-b-oldgoruno-dubnarudeiatelnostkonferncii29082016.jpg)


![timerate.ch · Wikipedia Cross-lingual Image Analysis 29.08.2016 21:29:42] Input. Enter full URL to](https://img.pdfslide.us/doc/110x75/5f9ebe8036978c73752ca6d7/wikipedia-cross-lingual-image-analysis-29082016-212942-input-enter-full-url.jpg)