Embed Size (px)
Citation preview

UC BerkeleyFisher Center Working Papers
TitleState and Metropolitan Area Impacts of the Offshore Outsourcing of Business Services and IT
Permalinkhttps://escholarship.org/uc/item/44v0s3c0
AuthorKroll, Cynthia A.
Publication Date2005-06-27
eScholarship.org Powered by the California Digital LibraryUniversity of California

State and Metropolitan Area Impacts of the Offshoring of Business Services and IT
Cynthia A. Kroll, Senior Regional Economist Fisher Center for Real Estate and Urban Economics
Haas School of Business, University of California Berkeley
THIS PAPER IS PRELIMINARY AND IS NOT FOR QUOTATION WITHOUT THE AUTHOR’S PERMISSION
Contact information: Fisher Center for Real Estate and Urban Economics Haas School of Business, F602-#6105 University of California Berkeley, CA 94720-6105 (510) 643-6112 [email protected] http://staff.haas.berkeley.edu/kroll/ The research reported here is part of a larger research project being undertaken by the Fisher Center for Real Estate and Urban Economics. Many of the concepts and approaches have been developed through discussion among the senior researchers on the project, including myself, Professor Dwight M. Jaffee, and Dr. Ashok Deo Bardhan. Doctoral economics students Daniel Hicks and Eric Justin Chaney contributed to the development of the data, including the indices used in the analysis.
© Cynthia A. Kroll

State and Metropolitan Area Impacts of the Offshore Outsourcing of Business Services and IT
Cynthia A. Kroll, Senior Regional Economist
Fisher Center for Real Estate and Urban Economics Haas School of Business, University of California Berkeley
Abstract
This paper addresses the impact at the metropolitan level of increasing trade in white-collar economic activities. The paper first refines the definition of white-collar occupations at-risk to offshoring. Applying this definition to the national job base shows that close to 15 million people, or 11.7% of the employed labor force, are in white-collar occupations at-risk to offshoring. While not all of these jobs will be offshored, the number of jobs is of similar order of magnitude to the manufacturing sector, and the proportions offshored could be similar as well. For metropolitan areas, the analysis shows that places with high shares of the labor force employed in at-risk white-collar occupations tend to have larger populations, a more highly educated workforce, and higher earnings. Despite these advantages, between 2001 and 2003 these places had slower employment growth, in both at-risk occupations and overall, and to some extent lower wage growth than places with fewer at-risk jobs. A more detailed look at the San Jose metropolitan area—Silicon Valley—shows that the occupation profile is changing--a possible sign of restructuring. Despite heavy jobs losses, incomes are rising in the MSA as routine jobs are lost (to offshoring and other factors), but the most advanced technical activities remain. Policy responses to white-collar offshoring at the state level have addressed the politically prominent issues rather than the major problems likely to emerge from the process. Policy responses need to focus on worker and business assistance, maintaining competitive strengths, and positioning the community, local firms, and the labor force to participate in future growth opportunities.
© Cynthia A. Kroll

State and Metropolitan Area Impacts of the Offshoring of Business Services and IT
Business services and business processes outsourcing and offshoring (BSO, BPO)
have been given extensive attention over the past year in the popular press, trade publications, academic literature, and government legislatures. Attention has been paid to the speed at which it is happening, the extent to which it is happening, the job categories most affected, and the ways that government might deal with the phenomenon, its welfare effects and other consequences.
While this emergence of newly tradable occupations is clearly a global
phenomenon, much of the attention has come at the state and local level. It is within the metropolitan level that sudden shifts in services occupations are most readily observed. It is within state legislatures that the greatest variety of measures have been proposed.
This paper examines how the global phenomenon of increasingly tradable
services is being experienced at the state and metropolitan level. Central topics include (i) whether the changes accompanying internationally traded services are likely to be spread unevenly across states and metropolitan areas, (ii) what types of metropolitan areas are most vulnerable to employment and income shifts from international trade in services, and (iii) what are the most likely consequences for these areas, and are there opportunities as well as negative impacts? The paper also takes a preliminary look at the state and local policy framework for coping with the offshoring/outsourcing phenomenon, examining what types of actions below the national level are most likely to address impacts effectively at the state and local level.
The discussion begins with the definition of terms, which have been used very
loosely in the debate on this topic. A brief review follows of existing evidence on the size and scope of the offshoring/outsourcing phenomenon. Section 3 describes a methodology for identifying levels of vulnerability to BPO or information technology outsourcing/offshoring (ITO) and the data used to analyze metropolitan areas. Section 4 describes a typology of states and metropolitan areas with respect to international trade in services, and uses occupations and industry data to allocate states and metro areas into these categories. The implications of falling within different regional types, in terms of potential problems and opportunities, is addressed in Section 5. Section 6 discusses the policy context for responding to these conditions and changes, while section 7 summarizes the findings of this paper.
1. Definitions of Offshoring and Outsourcing in the Context of White Collar and Services Jobs
There is no doubt that global trade is changing, and that the crux of this change is
the growing mobility of jobs that were once considered non-tradable across national
1

boundaries. The key concepts about which the debate centers are, first, the concepts of offshoring and outsourcing, and second, white-collar jobs and services jobs.
Figure 1Forms of Offshore and Outsourced Production
Offshore Outsourcing
Domestic Outsourcing
Between Firms
Offshore Branch/ Affiliate
Domestic Branch
Within Firm
Foreign Production
Domestic Production
The terms offshoring and outsourcing have been used very loosely in the whole
debate. The two concepts are closely related, but the differences are important, as illustrated in Figure 1. Outsourcing occurs when a firm purchases goods or services from outside the firm that were once produced within the firm. (Row 2 of Figure 1.) Outsourcing has been increasing in the US, within both manufacturing and nonmanufacturing sectors and of both goods and services inputs. Outsourcing gives a firm more flexibility on when and how it expands or contracts. It can give a firm access to expertise without the cost of maintaining that expertise in-house. A firm can get services done through outsourcing without the added costs of health care and other benefits normally given to a full-time employee. Outsourcing can occur domestically or across international borders. (See Harrison and Kelley 1993, Scope and Apte 1995.)
Offshoring occurs when a company obtains goods or services that were once
produced in-house from across international borders. The inputs may be obtained from another firm (offshore outsourcing) or from a foreign branch or subsidiary of the firm (as with many multinational enterprises). (This is the right-hand column of Figure 1). The outsourcing debate that has dominated the headlines is in-fact a debate over offshoring, whether the institutional arrangement is through outsourcing or within-firm.
Offshoring has been a fact of manufacturing sectors for at least 3 decades. A
typical firm “product cycle” is described by Vernon (1979). Bluestone and Harrison (1982) describe the impacts on US manufacturing sectors, blue-collar workers, and communities, as heavy manufacturing sectors began to globalize. Saxenian (1994)
2

describes the evolution of offshoring to more complex global production networks within the semiconductor industry, while Bardhan, Jaffee and Kroll (2004) follow this evolution to a wider range of high-tech sectors, including services activities within the computer cluster. Briefly, firms historically developed their manufacturing process and new products close to home. As the market for the product would mature, routine production could be located distant from headquarters administration and R&D centers, either in less costly domestic locations or in foreign locations. The distant production could be done either by a firm branch or affiliate or by an outside contractor. While cost savings were often an initial driver, specialized production centers, often established with the help of the receiving country’s national industrial policy and education expenditures, became a further force in the globalization of manufacturing industries.
The degree of offshoring in manufacturing varies widely. The percent of inputs
that have been imported from abroad range from well over 50 percent for some fabricated metals industries to close to zero percent for some food and processed agricultural products.1 Manufacturing sectors that offshored in the 1980s and 1990s tended to shed production jobs, while white-collar jobs expanded and the gap between blue- and white-collar wages widened (Bardhan and Howe, 1998).
Since the middle of the 1990s, offshore production has become increasingly
important in services or white-collar activities. Several factors were in play in bringing this about. Technical change, and telecommunications improvements in particular, were an essential element, allowing the near-instantaneous transmittal of information between distant places. Political and economic reforms also played a role. The technological improvements occurred at a time when the large economies of Russia, China and India were lifting restrictions on entrepreneurial activity within the country and were allowing more active participation of foreign firms.2 In the developed world, competitive pressures in capitalist economies led to a cost reduction orientation for many producers who also shared an interest in expanding markets abroad. Large wage disparities between the developed and developing countries, and strong technical education within the developing and restructuring countries provided an attractive opportunity to move more-skilled jobs offshore.3
Offshoring of nonmanufacturing jobs has a different profile than the earlier
periods of offshoring, as shown in Figure 2. Manufacturing offshoring initially involved primarily blue-collar jobs. It led to manufacturing industries in the US where production activities were largely done offshore and administrative, professional, and more skilled technical jobs remained onshore. Opportunities in nonmanufacturing jobs might grow, and the income gap between white-collar and blue-collar jobs widen. Offshoring began to transition from blue-collar to white-collar jobs within manufacturing. For example,
1 Based on calculations of data provided by Robert Feenstra (data described in Feenstra 1996). 2 Grossman and Helpman (2002) analyze the factors that influence the degree of outsourcing, and Bardan and Guhatakurta (2004) more generally show the role of openness in the economy in encouraging trade between a US economy (California) and other parts of the world. 3 Dossani 2003 describes the growth of offshore production located in India, and Bardhan and Kroll 2003b describes the role of software outsourcing in Russia.
3

software jobs related to hardware production at Hewlett Packard were among the early technical white-collar jobs that were placed offshore. Since the late 1990s, a different type of offshoring has evolved. It is most commonly referred to as “services” offshoring, but this label relates to the occupations—primarily white-collar—as much as to industrial sectors. Indeed, offshoring of white-collar jobs is occurring in many different industrial sectors, including manufacturing, sometimes removing small numbers of selective jobs from a wide range of industries. Once the communications systems are in place, white-collar jobs become much more quickly mobile than were blue-collar jobs. Capital investments are lower and logistics simpler for the offshoring of white-collar work.
Figure 2Two Types of Offshoring
• Primarily blue-collar jobs• Primarily in manufacturing• Similar and contiguous skills,
occupations affected, leading to “hollowing” out of manufacturing
• Wage and production networks driven
• Led to spillover increases in services employment
• Led to increased inequality between Blue and White Collar occupations
• High capital investment required; logistically and structurally complex
• Primarily white-collar jobs• Occurring across industries, including
services jobs within manufacturing.• Dissimilar, unrelated skills and
occupations affected, leading to “pockmarking” of many sectors across the economy
• Driven by wages, English language, Institutional adaptability and compatibility
• May lead to changing occupation mix within services
• May lead to increased inequality within White Collar occupations
• Low capital requirements; logistically simpler
Manufacturing Offshoring Services Offshoring
Source: Modified from Bardhan and Kroll (2003) and various later presentations.
2. Scale and Scope of White Collar Offshoring Offshoring of US white-collar jobs has been regularly covered in the media over the past two years, and its importance is widely debated among economists and political scientists. Points of view vary from alarmist (Dobbs 2004), to cautionary (Samuelson 2004), to promotional (Drezner 2004, Bhagwati 2004). Earlier studies of manufacturing offshoring have shown that it can cause severe displacement in industrial sectors and sector dependent geographic areas (Naponen, Graham and Markusen 1993), but at the same time can lead to net gains in employment and income nationwide and to the growth of new industries (the interaction of offshored computer manufacturing and onshore software development is discussed in Bardhan, Jaffee and Kroll 2004).
4

Current discussions of white-collar offshoring are occurring in a vacuum of good data, with discussion over the magnitude of the effect often obscured by wide variations in definitions of the process (which can range from being strictly limited to offshore outsourcing to much broader examinations of structural changes of which outsourcing and offshoring are one or two pieces).
Probably the most frequently cited forecast of the scale of white-collar offshoring is a report by John McCarthy of Forrester Research in the range of 3.3 million jobs over the first decade and a half of the 21st century (through 2015). This estimate is based on observations of growth in India, interviews of client companies, and assumptions by the authors (McCarthy, Dash, Liddell, Ross and Temkin 2002; McCarthy, Ross, Martorelli and Mines 2004). This is among the more conservative forecasts of the rate of outflow of white-collar jobs. A Goldman Sachs study released in 2003 estimated that the number could be close to twice the Forrester estimate, with up to 6 million services jobs offshored within a decade, although the author estimates that annual losses to date have been closer to the Forrester estimates.4
Taking a different approach, Bardhan and Kroll (2003) examine the types of
white-collar jobs that have been offshoring, develop a list of characteristics required to make offshoring possible, and identify occupational categories, as defined by the Bureau of Labor Statistics, that could be moved offshore. Their initial estimates of an “outer envelope” finds over 14 million white-collar jobs, or 11% of the employed US labor force, in categories at-risk to white-collar offshoring. The authors are quick to note that this is not a prediction of what will go. If, as in manufacturing, there was a net loss of one fourth of these jobs, the impact would fall within the ranges estimated by Forrester and by Goldman Sachs. In manufacturing, this shift occurred over a twenty-year period. To put this in a wider perspective, between 1979 and 2003, US manufacturing employment dropped by over 25%, to 14.3 million, of which about 70% were in blue-collar, “production” occupations. Over the same period manufacturing output rose by about 40 percent in real terms, imports grew from 16% to 20% of total personal consumption expenditures, and US total wage and salary employment rose by 45 percent.
A number of authors point out, correctly, that all of the studies that make
estimates of the level of services or white-collar offshoring are taking a partial view of a process that could be a net benefit overall to the economy. Global Insight (2004), using econometric analysis and a set of assumptions, finds that real GDP and total employment are higher under a scenario with information technology offshoring (ITO) than without, although jobs within IT are reduced temporarily. McKinsey Global Institute (2003) estimates that while offshoring may cost the US 200,000 services jobs annually, for every dollar spent abroad on services offshoring, $1.12-$1.14 is returned to the US economy. Their report notes that many of these gains do not go to the wage labor force, but argue that the return is sufficient to provide a source of funding for some adjustment programs.
At this stage, the academic economists enter the debate. Bhagwati (2004),
Bhagwati, Panagariya and Srinivasan (2004), and a number of basic trade theory texts, 4 Tilton 2003.
5

present theoretical arguments in favor of free trade and in particular of offshoring services jobs. Samuelson (2004) argues that a shift in competitive advantage (e.g. increasing numbers of highly trained workers in China) could ultimately shift the terms of trade and lead to a net reduction in benefits from trade. He points particularly to the wage vulnerability of workers in occupations that may be offshored. In more empirical work, Amiti and Wei (2004) point out that services offshore outsourcing remains small relative to total employment, and that many developed countries benefit more from “insourcing” than they lose (in terms of employment) from outsourcing.
With such diverse arguments, it is hard to draw a consistent set of conclusions
from the discussions to date on offshoring of white-collar jobs. However, a few points seem undisputed:
• White collar jobs are increasingly becoming a part of a global labor market • US companies participating in this process in general are benefiting from
lower costs, wider access to skills, and increased profits • While net benefits to the economy may be positive, dislocation can be severe
within the occupational groups most vulnerable to offshoring. • Mechanisms have not yet been developed to redistribute the benefits of
offshoring at a level sufficient to compensate the dislocated white-collar workers.
For the most part, academic and industry discussions have not addressed the geographic implications of offshoring of white-collar jobs, for different parts of the United States. This discussion has been heavily covered in the press, however, where a whole series of articles cropped up over the past year asking what offshoring could mean for the local metropolis. (See, for example, Kirby and Shinal 2004, Bjorhus 2004, Larson, Higuera and Kamman 2004). 3. Characteristics of Importable White-Collar Occupations
In examining the distribution of offshoring impacts on industries and metropolitan areas, we begin with the methodology outlined in Bardhan and Kroll (2003), expanding on the definitions to include occupations identified by authors such as Lachman (2004). White-collar occupations at-risk to offshoring share a number of characteristics, including:
• No face-to-face contacts with customers • Information the major component of the “product” • Work via remote communications: telecommunications and Internet • Low set-up barriers
Positions are also more vulnerable to offshoring if they have: • Low social networking requirements • High wage differentials, compared to the receiving country • Tasks reducible to a set of instructions, with a measurable output
6

Table 1 Services Occupations At-Risk to Outsourcing
Occupation Code Occupation Title
15-0000 Computer and Mathematical Occupations: Includes the following 14 occupations:
15-1011 Computer and information scientists, research 15-1021 Computer programmers 15-1031 Computer software engineers, applications 15-1032 Computer software engineers, systems software 15-1041 Computer support specialists 15-1051 Computer systems analysts 15-1061 Database administrators 15-1071 Network and computer systems administrators 15-1081 Network systems and data communications analysts 15-2011 Actuaries 15-2021 Mathematicians 15-2031 Operations research analysts 15-2041 Statisticians 15-2091 Mathematical technicians Medical, Legal and Sales 23-2011 Paralegals and Legal Assistants 29-2034 Radiologic Technologists and Technicians 31-9094 Medical Transcriptionists 41-9041 Telemarketers Graphics, Design and Writing Occupations 17-1021 Cartographers and Photogrammetrists 17-3011 Architectural and Civil Drafters 27-1021 Commercial and Industrial Designers 27-1024 Graphic Designers 27-3042 Technical Writers 27-3091 Interpreters and Translators Business and Finance Support 13-1031 Claims Adjusters, Examiners, and Investigators 13-1051 Cost Estimators 13-1072 Compensation, Benefits, and Job Analysis Specialists 13-1111 Management Analysts 13-2011 Accountants and Auditors
7

Table 1 Services Occupations At-Risk to Outsourcing
Occupation Code Occupation Title 13-2031 Budget Analysts 13-2041 Credit Analysts 13-2051 Financial Analysts 13-2053 Insurance Underwriters 13-2082 Tax Preparers Office Support
43-1011 First-Line Supervisors/Managers of Office and Administrative Support Workers
43-2011 Switchboard Operators, Including Answering Service 43-2021 Telephone Operators 43-3011 Bill and Account Collectors 43-3021 Billing and Posting Clerks and Machine Operators 43-3031 Bookkeeping, Accounting, and Auditing Clerks 43-3051 Payroll and Timekeeping Clerks 43-3061 Procurement Clerks 43-4011 Brokerage Clerks 43-4021 Correspondence Clerks 43-4041 Credit Authorizers, Checkers, and Clerks 43-4051 Customer Service Representatives 43-4111 Interviewers, Except Eligibility and Loan 43-4131 Loan Interviewers and Clerks 43-4151 Order Clerks 43-4161 Human Resources Assistants, Except Payroll and Timekeeping 43-5061 Production, Planning, and Expediting Clerks 43-9011 Computer Operators 43-9021 Data Entry Keyers 43-9031 Desktop Publishers 43-9041 Insurance Claims and Policy Processing Clerks 43-9111 Statistical Assistants Source: Selected by the author and associates at the Fisher Center for Real Estate and Urban Economics, from the US Bureau of Labor Statistics, Occupation Employment Statistics(OES) listing of occupations.
8
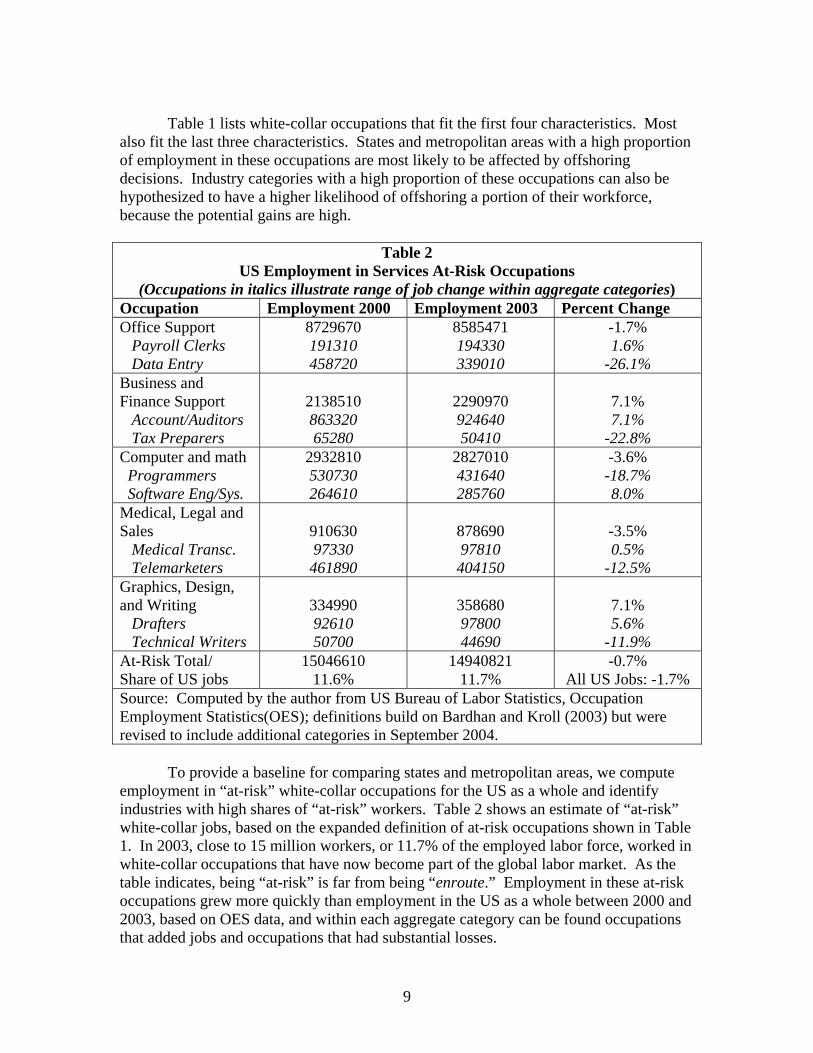
Table 1 lists white-collar occupations that fit the first four characteristics. Most
also fit the last three characteristics. States and metropolitan areas with a high proportion of employment in these occupations are most likely to be affected by offshoring decisions. Industry categories with a high proportion of these occupations can also be hypothesized to have a higher likelihood of offshoring a portion of their workforce, because the potential gains are high.
Table 2 US Employment in Services At-Risk Occupations
(Occupations in italics illustrate range of job change within aggregate categories) Occupation Employment 2000 Employment 2003 Percent Change Office Support Payroll Clerks Data Entry
8729670 191310 458720
8585471 194330 339010
-1.7% 1.6%
-26.1% Business and Finance Support Account/Auditors Tax Preparers
2138510 863320 65280
2290970 924640 50410
7.1% 7.1%
-22.8% Computer and math Programmers Software Eng/Sys.
2932810 530730 264610
2827010 431640 285760
-3.6% -18.7% 8.0%
Medical, Legal and Sales Medical Transc. Telemarketers
910630 97330 461890
878690 97810 404150
-3.5% 0.5%
-12.5% Graphics, Design, and Writing Drafters Technical Writers
334990 92610 50700
358680 97800 44690
7.1% 5.6%
-11.9% At-Risk Total/ Share of US jobs
15046610 11.6%
14940821 11.7%
-0.7% All US Jobs: -1.7%
Source: Computed by the author from US Bureau of Labor Statistics, Occupation Employment Statistics(OES); definitions build on Bardhan and Kroll (2003) but were revised to include additional categories in September 2004.
To provide a baseline for comparing states and metropolitan areas, we compute
employment in “at-risk” white-collar occupations for the US as a whole and identify industries with high shares of “at-risk” workers. Table 2 shows an estimate of “at-risk” white-collar jobs, based on the expanded definition of at-risk occupations shown in Table 1. In 2003, close to 15 million workers, or 11.7% of the employed labor force, worked in white-collar occupations that have now become part of the global labor market. As the table indicates, being “at-risk” is far from being “enroute.” Employment in these at-risk occupations grew more quickly than employment in the US as a whole between 2000 and 2003, based on OES data, and within each aggregate category can be found occupations that added jobs and occupations that had substantial losses.
9

In comparing the job growth experience for employment in at-risk categories with
the growth experience of the US as a whole, it is important to keep in mind that many of these occupations are in what are normally the fastest growing sectors of the economy. For example, between 1990 and 1998 (prior to the dot-com boom), total nonfarm employment in the US grew by 14.2 percent, employment in the information sector grew by 18.2 percent, and professional and business services employment grew by 37.5%.5 Furthermore, for the job categories that had substantial losses, their vulnerability to offshoring is likely to be only part of the story. Many of these occupations may still be adjusting to overhiring in dot-com boom, and the characteristics that make these occupations vulnerable to offshoring also make them vulnerable to other types of “productivity improvements” such as automation and process innovations.
Table 3 shows the industries at the 4-digit NAICS level that are most heavily
dominated by these types of white-collar occupations, and those that have the smallest representation of white-collar occupations at-risk to offshoring. Not surprisingly, those with the highest proportions of employees in white-collar at-risk categories are in sectors such as information, finance and insurance, and professional and business services—6.4 million workers are employed in industrial sectors where 45% or more of the labor force is in occupation categories that have recently become tradable. The least affected industries, with 2% or fewer of the labor force in the newly at-risk categories, are primarily personal service and retail occupations.6 Because of the change from SIC to NAICS codes, and the levels at which data is collected for different industries, comparative data is available only for the 2002 to 2003 period. This snapshot of the post-recession, post-dot-com economic recovery period shows the beginnings of employment growth in some of the 4-digit information sectors most heavily hit by the dot-com bust, but significant job losses continuing in many of the finance, insurance, and professional and business service sectors. Some of the low risk industries, particularly the restaurants, which comprise the bulk of the employment, were also showing continued job loss.
5 A similar comparison for occupations is more difficult because of changing definitions of occupational codes over time. 6 Because this paper focuses on white-collar offshoring in newly tradable occupations, industries in the manufacturing sector do not show up as high-risk, but may have high shares of jobs at-risk to offshoring because of the blue-collar jobs within their occupation profile. Sector 3361, motor vehicle manufacturing, for example, may be at low risk for white-collar job offshoring, because of its low employment basis in those occupations, but be at higher risk of loss of jobs through manufacturing offshoring or even import competition.
10

Table 3 Industries with Highest and Lowest Shares of At-Risk Occupations, US, 2003
4 digit NAICS code NAICS Title 2002 2003
Change, 2002-2003 (%)
Percent At-Risk
Industries with Highest Shares Employed in White-Collar At-Risk Occupations
5415 Computer Systems Design and Related Services 1120160 1119150 -0.1% 66.4%
5614 Business Support Services 758960 753310 -0.7% 65.8%
5412 Accounting, Tax Preparation, Bookkeeping, and Payroll Services 787650 800410 1.6% 63.5%
5112 Software Publishers 241880 244550 1.1% 63.2%5241 Insurance Carriers 1305150 1289850 -1.2% 59.0%
5182 Data Processing, Hosting, and Related Services 286290 295370 3.2% 57.6%
5181 Internet Service Providers and Web Search Portals 124330 130640 5.1% 55.7%
5223 Activities Related to Credit Intermediation 282450 264750 -6.3% 49.6%
5222 Nondepository Credit Intermediation 728730 697160 -4.3% 47.2%
5242 Agencies, Brokerages, and Other Insurance Related Activities 833900 826960 -0.8% 45.0%
Industries with Lowest Shares Employed in White-Collar At-Risk Occupations 4471 Gasoline Stations 887730 889130 0.2% 2.0%7223 Special Food Services 526210 532300 1.2% 1.7%4482 Shoe Stores 179500 180350 0.5% 1.7%
1151 Support Activities for Crop Production 280570 284340 1.3% 1.6%
3361 Motor Vehicle Manufacturing 268910 268280 -0.2% 1.5%6244 Child Day Care Services 728630 720640 -1.1% 1.4%
4854 School and Employee Bus Transportation 176630 174440 -1.2% 1.0%
7224 Drinking Places (Alcoholic Beverages) 380610 387740 1.9% 0.7%
7221 Full-Service Restaurants 4060200 3982650 -1.9% 0.6%7222 Limited-Service Eating Places 3608990 3558120 -1.4% 0.4%
Note: Includes only industries with 50,000 or more employees. Source: Computed by author and Fisher Center for Real Estate and Urban Economics research staff, from Bureau of Labor Statistics OES data.
11

Table 4 Typology of States by Occupations At-Risk to Services Offshoring
Share of At-Risk Occupations*
Technical Concentration
Office Support Concentration
Business/ Finance
High-Risk States (1.1+)
Virginia (1.93) Colorado (1.61) New Jersey (1.36) Connecticut (1.20)
South Dakota (1.40) Delaware (1.32) Connecticut (1.12)
Connecticut (1.62) Delaware (1.49) Virginia (1.39) Colorado (1.11)
Moderate-Risk (1.04-1.09)
Maryland (1.70) Massachusetts (1.49) Washington (1.48) Utah (1.12)
Utah (1.20 Arizona (1.14)
Arizona (1.28) Maryland (1.18) Massachusetts (1.16)
Average-Risk States (0.97-1.03)*
California (1.20) Minnesota (1.18) Georgia (1.17)
Florida (1.10) [Nebraska (1.08) Texas (1.05) Missouri (1.04)]#
New York (1.17) Rhode Island (1.17) Minnesota (1.10)
Below Average (0.91-0.96)
Illinois, Kansas, Pennsylvania, Oregon, Vermont, Wisconsin
Low-Risk States (0.9-)
Ohio, Oklahoma, North Carolina, New Hampshire, Iowa, Michigan, Idaho, Tennessee, North Dakota, Kentucky, Alabama, South Carolina, Indiana, New Mexico, West Virginia, Maine, Nevada, Arkansas, Hawaii, Montana, Alaska, Louisiana, Mississippi, Wyoming
* The index used to rank states is the ratio of the state share of employment in the occupation to the US share of employment in the occupation. If the ratio is above 1.1 in one area of concentration, the state is placed in that column. These divisions are made for all states with average at-risk levels or above. Almost all of the states in the below average and low risk categories had indices below 1 in all concentrations. States in the below average and low-risk states are listed in descending order of index level, from 0.96 for Illinois, to 0.57 for Wyoming. # For these average-risk states, no concentration had an index of 1.1 or above; indices for these states are included if they are over 1.0. Source: Author calculations from BLS occupations data. 4. State and Metropolitan Level Differences in Vulnerability to White-Collar
Offshoring
Many of the white-collar occupations listed in Table 1 are not “local serving” but serve as part of a community or region’s export base. As such, they are spread unevenly among geographic regions. Table 4 presents a profile of the 50 United States, identifying the level of job concentration in at-risk occupations in the state, and for states with average concentration or above, the types of at-risk jobs characterizing that concentration. States are ranked among 5 categories ranging from Low-Risk to High-Risk, based on an index of the share of jobs in at-risk categories in the state relative to the
12

share nationwide. States with a ratio of 1.1 or higher (in this case, with at least 12.9% of employment in at-risk white-collar occupations) are ranked as high-risk. States with an index of 1.04 to 1.09 are moderate-risk states, and so forth.
Almost half of the states have an index of 0.9 or below, putting them in the lowest
risk category. Many of these are smaller states, states with large agricultural or resource bases, or states with a large recreation component. A few are from the older manufacturing belt, and may be at risk to offshoring, but more of blue-collar than of white-collar jobs. Many of these states have aspired to diversify their economies with the types of occupations that now could raise their at-risk levels. The moderate to high-risk states fall into three general categories. Several border or are in commute distance of the most concentrated metropolitan centers in the US and have acted as back office locations for those centers (for example, New Jersey, Virginia, Connecticut, Maryland and Delaware). Several others are among the most successful high-tech economies in the nation (Colorado, Massachusetts, Washington). The third group (Arizona, South Dakota, and Utah) encompasses states that have a high concentration of more remote back office businesses. States in the first two categories have relatively high incomes and highly educated populations, but some have experienced serious employment downturns in the past because of earlier periods of industry restructuring.
Even states with average to below average risk indices may contain metropolitan
areas with high shares of workers in at-risk white-collar occupations. We have created at-risk indices for the 195 metropolitan areas in the US with populations of at least 100,000.7 Because of missing data for smaller occupation categories, the index used is based on a subset of 28 at-risk occupations, but includes about 80 percent of employment in the 57 occupations shown in Table 1.8 Table 5 shows the metropolitan areas with the very highest and very lowest at-risk indices (either 1.2 and above, meaning 14 percent or more of the employed workers are in white-collar occupations defined as being at-risk of offshoring; or 0.8 or below, meaning the area has below 10.2 percent of workers in occupations classified as at-risk).
Thirty-six, or 18 percent of the metropolitan areas fall into the highest risk category we have defined for metropolitan areas. Most of these are large metropolitan areas, with a population of at least half a million. While only one third of all metropolitan areas are of this size, almost 60 percent of the highest risk metropolitan areas are large. One sixth of the 195 metro areas are in the 250,000 to 500,000 range, but these constitute only 11 percent of high risk metro areas, while small metro areas are over 50 percent of the total base but 31 percent of the high risk metros.
7 OES data have many gaps for smaller metropolitan areas, and are thus more likely to give an inaccurate estimate of the share of at-risk jobs in places with a population below100,000. 8 The 28 occupation codes included in the modified at-risk index are: 13-1051, 13-1111, 13-2011, the 14 codes included in aggregate category 15-0000, 41-9041, 43-1011, 43-2011, 43-3011, 43-3021, 43-3031, 43-3051, 43-4051, 43-4151, 43-4161, and 43-9021. The at risk index levels reported here for the metropolitan areas are based on the 2001 data, because the index construction still involved some occupation level estimates which were complex and time consuming, and the 2001 index was needed for regression work reported later in the data. State indices discussed earlier use the 2003 data, which was the most current available at the time of the analysis.
13

In contrast, of the 43 metropolitan areas with very low shares of at-risk white-
collar jobs, 37 (87 percent) are small metropolitan areas. Mid-sized metropolitan areas account for 9 percent of the lowest risk places, while only 5 percent of the low risk places are large metropolitan areas. This is probably good news for most policy makers, as the smaller metropolitan areas with high shares of at-risk jobs may have fewer resources for attracting alternative economic activities than do larger metropolitan centers.
Table 5 Typology of Metropolitan Areas with Occupations At-Risk to Services Offshoring
Size Category (Employment)
High Share (Business/Tech)
High Share (Office Support)
High Share (Mixed/Other)
Low Share
500,000+ Austin, TX Bergen-Passaic, NJ Boston, MA Hartford, CT Middlesex, NJ Raleigh Durham, NC San Francisco, CA San Jose, CA Seattle, WA Washington DC
Jacksonville, FL Tampa, FL
Atlanta, GA Columbus, OH Dallas, TX Denver, CO Ft. Lauderdale, FL Kansas City, MO Phoenix, AZ Sacramento, CA Salt Lake City, UT
Las Vegas, NV-AZ Riverside-S.B., CA
250,000 – 499,999
Madison, WI Des Moines, IA Omaha, NE-IA Wilmington-New., DE-MD
Fresno, CA Gary, IN Greenville, SC Knoxville, TN
100,000 – 249,999
Boulder, CO Colorado Springs, CO Dutchess Co., NY Lowell, MA Tallahassee, FL Trenton, NJ
Sioux Falls, SD
Cedar Rapids, IA Jersey City, NJ Provo-Orem, UT Stamford-Norwalk, CT
(largest 10, of 37) El Paso, TX Charleston, SC Bakersfield, CA Youngstown-Warren, OH Tacoma, WA P Lancaster, PA Mobile, AL Kalamazoo-Battle Creek, MI Stockton-Lodi, CA Augusta-Aiken, GA-SC
Note: High share have a ratio of 1.2 or higher compared to US share; Low share have a ratio of 0.8 or lower compared to US Share. Source: Computed from Bureau of Labor Statistics Occupations data.
14

Like states with higher shares of at-risk occupations, metropolitan areas with high
shares of at-risk populations on average have affluent profiles. As shown in Figure 3, a metropolitan area with a high share of at-risk jobs is also likely to have higher wages and a more educated labor force.
Figure 3Educational Attainment and Wage Levels for MSAs with
Low, Middle and High Shares of At-Risk White-Collar Jobs
05
1015202530354045
Percent with BA degree orhigher
Wage Level ($1,000s)
Low ShareMediumHigh Share
Source: Author, using data from the US Bureau of the Census, Bureau of LaborStatistics OES files, and authors risk indices.
High-risk metro areas include those with strong technology or financial bases (San Jose, Boston), cities with large back-office operations (Tampa, Sioux Falls), and cities with a diversified set of business services (Dallas, Phoenix). Some government centers also show up in the high-risk categories (Washington DC, Sacramento). Because of the government component to their employed workforce and current sentiments against offshoring or even domestic outsourcing of government work, these centers may be more cushioned from the effects of white-collar offshoring than their occupation-employment shares alone suggest.
At the same time, there are some characteristics of high-risk places that may make
them early focuses of offshoring activity. For example, the high wage bases of high-risk metropolitan areas may be viewed as an unnecessary cost by firms. As shown in Table 6, two-thirds of the high-risk metro areas have high wage bases overall, and for many at-risk occupations. In contrast, the metro areas with lower shares of at-risk jobs are much more likely to have below average wages.
15

Table 6
Index of Relative Wages in Selected At-Risk White-Collar Occupations, High and Low Risk Metropolitan Areas
MSA 00-0000: all occupations
13-2011: accountants and auditors
15-1021: computer programmers
15-1032: computer software engineers/ systems
17-3011: Architectural and civil drafters
31-9094: Medical transcription-ists
41-9041: Telemarket-ers
43-3051: Payroll and timekeeping clerks
43-9011: Computer Operators
43-9021: Data entry keyers
US Mean Salary Level $ 36,210 $ 55,430 $ 64,510 $ 78,400 $ 39,190 $ 28,270 $ 22,590 $ 30,670 $ 31,870 $ 23,590 High Share of At-Risk: % Above Average Wages 67.6% 43.2% 52.8% 42.4% 51.4% 77.8% 65.7% 62.2% 65.7% 58.3%Phoenix-Mesa, AZ MSA 0.96 0.89 0.91 0.95 0.88 1.03 0.93 0.85 0.88 0.97Sacramento, CA PMSA 1.10 1.02 1.02 1.13 1.06 1.14 1.01 1.18 1.18 1.14San Francisco, CA PMSA 1.39 1.24 1.26 1.10 1.34 1.22 1.26 1.42 1.46 1.24San Jose, CA PMSA 1.49 1.36 1.31 1.24 1.15 1.27 1.77 1.45 1.21 1.23
Boulder-Longmont, CO PMSA 1.23 0.92 1.11 1.08 1.03 1.16 1.05 1.11 0.99 1.05
Colorado Springs, CO MSA 1.03 0.93 1.07 1.00 1.01 1.12 0.83 1.03 1.03 0.92Denver, CO PMSA 1.13 1.12 1.07 0.98 1.00 1.21 1.02 1.14 1.09 1.07Hartford, CT MSA 1.19 1.11 1.04 0.92 1.10 1.13 0.94 1.18 1.07 1.13
16

Table 6 Index of Relative Wages in Selected At-Risk White-Collar Occupations, High and Low Risk Metropolitan Areas
MSA 00-0000: all occupations
13-2011: accountants and auditors
15-1021: computer programmers
15-1032: computer software engineers/ systems
17-3011: Architectural and civil drafters
31-9094: Medical transcription-ists
41-9041: Telemarket-ers
43-3051: Payroll and timekeeping clerks
43-9011: Computer Operators
43-9021: Data entry keyers
Stamford-Norwalk, CT PMSA 1.45 1.27 1.20 0.99 1.09 1.14 1.41 1.34 1.15 1.26
Wilmington-Newark, DE-MD PMSA 1.09 0.86 1.17 0.96 1.16 1.07 #N/A 1.03 0.98 1.00
Washington, DC-MD-VA-WV PMSA 1.27 1.10 1.03 1.06 0.98 1.20 1.14 1.08 1.07 1.10Ft. Lauderdale, FL 0.96 0.96 1.00 0.96 1.07 1.12 0.95 0.99 0.98 0.95Jacksonville, FL MSA 0.93 0.95 1.31 1.00 0.88 0.81 1.10 0.92 0.99 0.97Tallahassee, FL MSA 0.96 0.71 0.82 0.80 0.85 1.06 1.46 0.88 1.01 0.89
Tampa-St. Petersburg-Clearwater, FL 0.88 1.09 0.92 0.91 0.96 1.02 1.03 0.94 1.02 0.94Atlanta, GA MSA 1.07 0.95 0.96 0.94 1.03 1.01 1.07 1.09 1.13 1.07Cedar Rapids, IA 0.96 0.99 0.90 #N/A 0.83 0.95 0.88 0.93 #N/A 0.90Des Moines, IA MSA 0.99 0.88 0.84 0.91 0.98 0.92 0.93 1.05 0.89 1.00Bloomington-Normal, IL MSA 0.94 0.81 0.98 #N/A 0.93 1.01 0.92 1.02 0.94 0.92
17
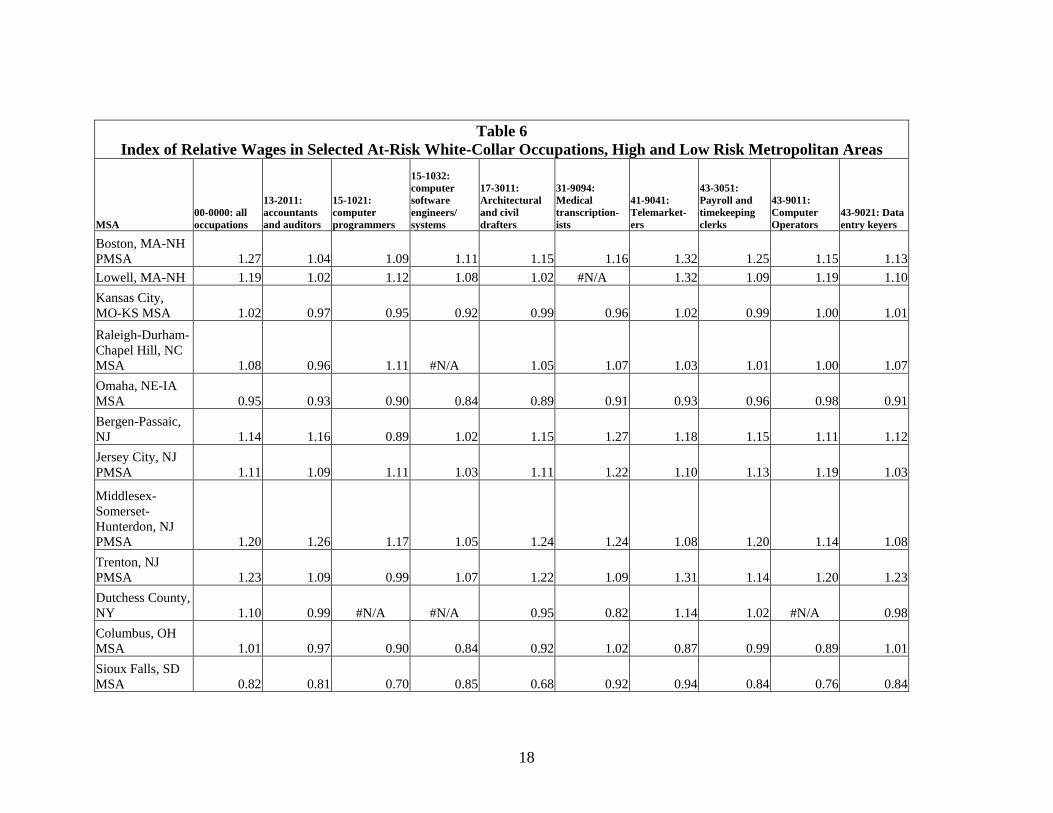
Table 6 Index of Relative Wages in Selected At-Risk White-Collar Occupations, High and Low Risk Metropolitan Areas
MSA 00-0000: all occupations
13-2011: accountants and auditors
15-1021: computer programmers
15-1032: computer software engineers/ systems
17-3011: Architectural and civil drafters
31-9094: Medical transcription-ists
41-9041: Telemarket-ers
43-3051: Payroll and timekeeping clerks
43-9011: Computer Operators
43-9021: Data entry keyers
Boston, MA-NH PMSA 1.27 1.04 1.09 1.11 1.15 1.16 1.32 1.25 1.15 1.13Lowell, MA-NH 1.19 1.02 1.12 1.08 1.02 #N/A 1.32 1.09 1.19 1.10Kansas City, MO-KS MSA 1.02 0.97 0.95 0.92 0.99 0.96 1.02 0.99 1.00 1.01
Raleigh-Durham-Chapel Hill, NC MSA 1.08 0.96 1.11 #N/A 1.05 1.07 1.03 1.01 1.00 1.07Omaha, NE-IA MSA 0.95 0.93 0.90 0.84 0.89 0.91 0.93 0.96 0.98 0.91Bergen-Passaic, NJ 1.14 1.16 0.89 1.02 1.15 1.27 1.18 1.15 1.11 1.12Jersey City, NJ PMSA 1.11 1.09 1.11 1.03 1.11 1.22 1.10 1.13 1.19 1.03
Middlesex-Somerset-Hunterdon, NJ PMSA 1.20 1.26 1.17 1.05 1.24 1.24 1.08 1.20 1.14 1.08Trenton, NJ PMSA 1.23 1.09 0.99 1.07 1.22 1.09 1.31 1.14 1.20 1.23Dutchess County, NY 1.10 0.99 #N/A #N/A 0.95 0.82 1.14 1.02 #N/A 0.98Columbus, OH MSA 1.01 0.97 0.90 0.84 0.92 1.02 0.87 0.99 0.89 1.01Sioux Falls, SD MSA 0.82 0.81 0.70 0.85 0.68 0.92 0.94 0.84 0.76 0.84
18

Table 6 Index of Relative Wages in Selected At-Risk White-Collar Occupations, High and Low Risk Metropolitan Areas
MSA 00-0000: all occupations
13-2011: accountants and auditors
15-1021: computer programmers
15-1032: computer software engineers/ systems
17-3011: Architectural and civil drafters
31-9094: Medical transcription-ists
41-9041: Telemarket-ers
43-3051: Payroll and timekeeping clerks
43-9011: Computer Operators
43-9021: Data entry keyers
Austin-San Marcos, TX MSA 1.04 0.93 1.06 1.01 0.91 1.09 0.95 1.00 1.19 1.02Dallas, TX PMSA 1.05 1.07 1.16 0.96 1.04 1.30 1.08 0.97 1.09 0.98Provo-Orem, UT 0.87 0.83 0.85 0.76 1.05 0.72 1.15 0.93 1.02 0.84Salt Lake City-Ogden, UT MSA 0.95 0.85 0.84 0.91 0.86 1.00 0.95 0.99 0.99 #N/A
Seattle-Bellevue-Everett, WA PMSA 1.21 1.14 1.24 1.04 0.94 1.17 1.08 1.14 1.13 1.10Madison, WI MSA 1.03 0.94 0.87 0.74 0.98 1.02 #N/A 1.00 0.81 0.99 Low Share of At-Risk; % Above Average Wages 6.7% 20.0% 13.3% 21.4% 26.7% 33.3% 46.2% 33.3% 40.0% 33.3%
Mobile, AL 0.84 0.74 0.69 0.85 1.00 0.88 0.82 0.84 0.85 0.96
Fresno, CA MSA 0.92 0.93 0.93 1.12 0.89 1.01 1.03 0.94 1.07 1.03
Riverside-San Bernardino, CA PMSA 0.98 1.00 1.09 0.84 0.97 1.05 1.17 1.02 1.00 1.04
19

Table 6 Index of Relative Wages in Selected At-Risk White-Collar Occupations, High and Low Risk Metropolitan Areas
MSA 00-0000: all occupations
13-2011: accountants and auditors
15-1021: computer programmers
15-1032: computer software engineers/ systems
17-3011: Architectural and civil drafters
31-9094: Medical transcription-ists
41-9041: Telemarket-ers
43-3051: Payroll and timekeeping clerks
43-9011: Computer Operators
43-9021: Data entry keyers
Stockton-Lodi, CA 0.98 1.02 0.81 0.77 0.94 1.18 2.20 1.06 0.95 1.01Augusta-Aiken, GA-SC 0.90 0.83 0.73 0.79 1.03 0.95 #N/A 0.85 1.02 0.89Gary, IN 0.93 0.95 0.79 0.86 0.90 0.91 #N/A 1.00 0.96 0.92Kalamazoo-Battle Creek, MI 0.98 1.00 0.83 1.01 0.95 0.92 0.94 1.04 0.95 0.94Youngstown-Warren, OH 0.90 0.97 0.77 0.99 1.03 0.89 0.92 0.86 0.96 1.00Las Vegas, NV-AZ MSA 0.92 0.96 0.90 0.77 1.04 1.26 0.92 0.94 0.96 1.03Lancaster, PA 0.90 0.88 0.80 0.91 0.92 0.87 1.00 0.92 0.94 0.94
Charleston-North Charleston, SC 0.87 0.83 0.67 0.75 0.96 1.00 1.01 0.94 1.06 0.95
Greenville-Spartanburg-Anderson, SC MSA 0.88 0.81 0.89 0.73 1.03 1.00 0.92 0.93 1.09 0.91Knoxville, TN 0.87 0.85 0.85 0.85 0.85 0.91 0.80 0.91 0.89 0.91El Paso, TX 0.77 0.89 0.90 1.02 0.89 0.85 1.32 0.83 0.83 0.86Tacoma, WA 1.01 1.11 1.01 #N/A 0.96 1.09 1.09 1.09 1.07 0.98Source: Author calculations from Bureau of Labor Statistics, OES May 2003 data.
20

These differences in characteristics among places with high and low levels of risk are statistically significant, as shown in Table 7. A model using the share of employment in at-risk services occupations as the dependent variable finds significant differences by education (percent of adult population with bachelor’s degree or higher) and wage level (median wage for all occupations in 2001), as well as size (total employment, 2001), share of employment in production occupations, and growth during the 1995 to 2000 expansionary period. Places with a high share of employment in at-risk services occupations tend to have a larger employment base, a more highly educated population, higher wages, and a smaller production workforce. These places also were likely to have had a higher rate of growth during the economic expansion of the 1990 to 1995 period. Regional dummy variables were also significant, showing lower shares, overall, in the northeast and the pacific coast.
Table 7 Statistical Results on Factors Related to Share of Employment in At-Risk
Services Occupations Number of observations = 186 F( 12, 173) = 26.62 Prob > F = 0.0000 R-squared = 0.6487 Adj R-squared = 0.6243 Root MSE = .01312 Coef. Std. Err. t P>|t| [95% Conf. Interval] Bachelors Degree 0.001602 0.000244 6.57 0.000 0.001121 0.002083Employment size 3.19E-06 1.67E-06 1.91 0.058 -1.03E-07 6.48E-06Median Annual Salary 1.29E-06 5.22E-07 2.48 0.014 2.65E-07 2.32E-06Share employed in production occupations -0.06869 0.028457 -2.41 0.017 -0.12486 -0.01252Percent change in employment , 1995-2000 0.040507 0.018317 2.21 0.028 0.004353 0.07666Regional Dummies: D1NE -0.01529 0.004964 -3.08 0.002 -0.02509 -0.00549D2NAt -0.00988 0.004317 -2.29 0.023 -0.0184 -0.00135D3ENC -0.01419 0.004438 -3.2 0.002 -0.02294 -0.00543D5SAt -0.00449 0.003612 -1.24 0.216 -0.01162 0.002641D6ESC -0.00325 0.004767 -0.68 0.496 -0.01266 0.006161D7WSC -0.00398 0.00417 -0.96 0.341 -0.01221 0.004247D9PAC -0.02015 0.004239 -4.75 0.000 -0.02852 -0.01179Constant 0.02593 0.011107 2.33 0.021 0.004008 0.047852Source: Author, using Stata 7.
21

5. What is Vulnerability Likely to Mean?
As noted in Section 3, levels of job growth vary, both among “tradable services” occupations and among industries with high shares of these occupations. Nevertheless, there is ample evidence that disruption will be an important factor for this segment of the labor force, and that this disruption will follow a different geographic pattern than earlier periods of manufacturing restructuring.
Mass layoff data gives evidence that the changes in services employment are not
simply cyclical, while Trade Adjustment Act (TAA) and NAFTA worker dislocation data indicate that the geographic incidence of effects varies by type of sector affected. Figure 4 shows layoff trends for a manufacturing sector (computers) and two sectors that are primarily made up of white-collar workers (information and professional/technical services, as shown previously in Table 3). The layoff experience is quite different among the three sectors. The computer sector shows a combination of the recession and dot-com boom and bust, with a sharp jump in layoffs in 2001, and a subsequent tapering off in the next couple of years. In contrast, layoffs in the information sector and to some extent in the professional and business sector, have continued to rise, despite an overall recovery in the economy. The official counts from these statistics suggest that the share attributable to offshoring is very small (see Bureau of Labor Statistics 2004). However, the method of collecting the information identifies only a fraction of layoffs that are potentially due to offshoring.
Figure 4Mass Layoffs: Computers, Information, Prof/Tech,1996-2003
0
20000
40000
60000
80000
100000
120000
140000
1996 1997 1998 1999 2000 2001 2002 2003
Computer Information Prof/Tech
Source: US Bureau of Labor Statistics, Mass Layoff Data.
TAA/NAFTA certifications suggest that at least for some industrial sectors, the
share of jobs lost to offshoring is significant. As shown in Figure 5, TAA/NAFTA certifications were equivalent to over one third of the net job loss in the computer sector between 1998 and 2003 and for more than one in eighth of the net job loss in the
22
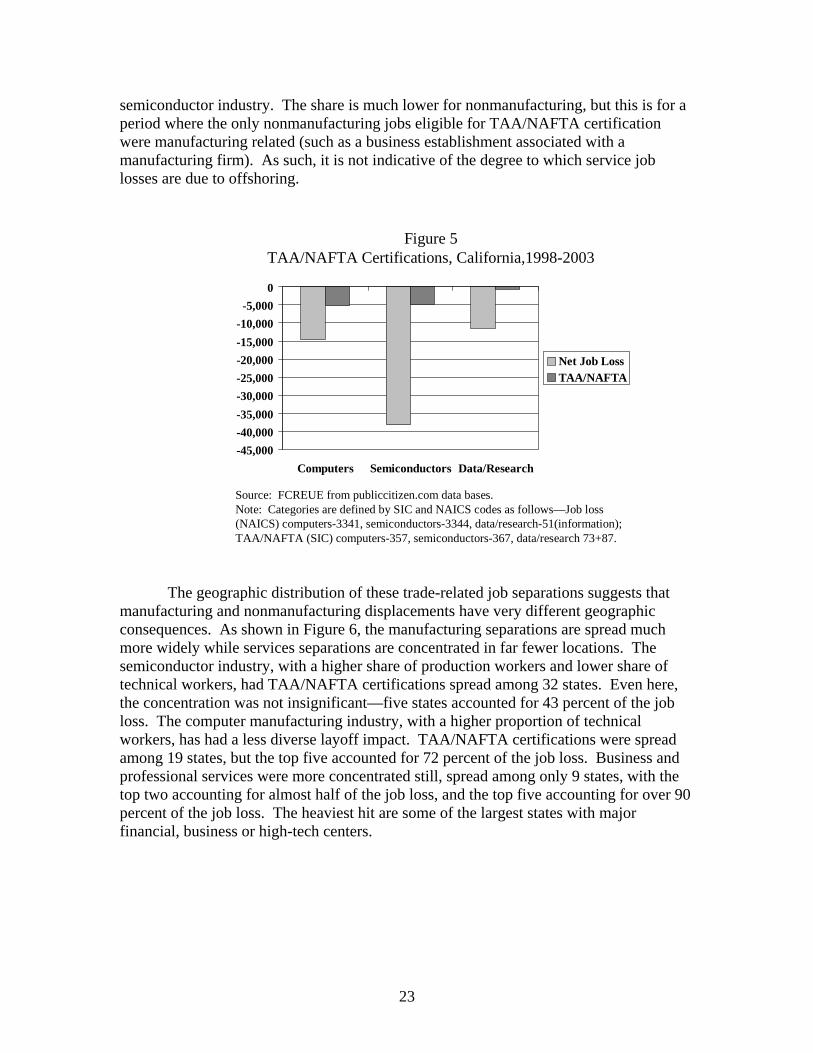
semiconductor industry. The share is much lower for nonmanufacturing, but this is for a period where the only nonmanufacturing jobs eligible for TAA/NAFTA certification were manufacturing related (such as a business establishment associated with a manufacturing firm). As such, it is not indicative of the degree to which service job losses are due to offshoring.
Figure 5TAA/NAFTA Certifications, California,1998-2003
-45,000-40,000-35,000-30,000-25,000-20,000-15,000-10,000-5,000
0
Computers Semiconductors Data/Research
Net Job LossTAA/NAFTA
Source: FCREUE from publiccitizen.com data bases.Note: Categories are defined by SIC and NAICS codes as follows—Job loss (NAICS) computers-3341, semiconductors-3344, data/research-51(information); TAA/NAFTA (SIC) computers-357, semiconductors-367, data/research 73+87.
The geographic distribution of these trade-related job separations suggests that manufacturing and nonmanufacturing displacements have very different geographic consequences. As shown in Figure 6, the manufacturing separations are spread much more widely while services separations are concentrated in far fewer locations. The semiconductor industry, with a higher share of production workers and lower share of technical workers, had TAA/NAFTA certifications spread among 32 states. Even here, the concentration was not insignificant—five states accounted for 43 percent of the job loss. The computer manufacturing industry, with a higher proportion of technical workers, has had a less diverse layoff impact. TAA/NAFTA certifications were spread among 19 states, but the top five accounted for 72 percent of the job loss. Business and professional services were more concentrated still, spread among only 9 states, with the top two accounting for almost half of the job loss, and the top five accounting for over 90 percent of the job loss. The heaviest hit are some of the largest states with major financial, business or high-tech centers.
23

Figure 6TAA/NAFTA Certifications by State
SICs 357, 367 and 73+87, 2003-2004(Q1)
Related Services (73 + 87)
Semiconductor Mfg. (367)
Computer Mfg. (357)
Top 5: 92%9 States
Top 5: 43%32 States
Top 5: 72%19 States
Texas 10%N. Carolina 10%Virginia 7%
N. Carolina 16%California 7%Kentucky 9%
Tennessee 18%Pennsylvania 8%N. Carolina 10%
New York 24%Massachusetts 8%Texas 20%
California 24%Texas 12%South Dakota 26%
States with Largest Shares of Employees
Source: FCREUE from publiccitizen.com data bases.
We analyzed employment and wage changes between 2001 and 2003 for the 195
metropolitan areas described earlier. Looking at the median rate of change for both employment and wages by risk category, there appears to be a relationship between the level of risk and the rate of change of employment and wages. Although tradable occupations at the US level are not necessarily growing more slowly or suffering higher wage losses than nontradable occupations, metropolitan areas with high shares of tradable occupations are seeing higher job losses or slower job gains than low-risk or medium-risk places, and their wages are growing more slowly. This is true for the overall employment and wage levels of the metropolitan area, and for many of the individual high-risk occupations within the high-share metropolitan areas, as shown in Table 8.
Statistical tests confirm the relationship between employment growth and
concentration in at-risk occupations. However, they do not clearly indicate that the relationship is due to offshoring activity. In all three regressions shown in Table 9, the dependent variable is the percent change in employment from 2001 to 2003. In regression I about 45% of the variation among places is explained by previous growth and the share of employment in the government sector (both positive factors), and having a high share of at-risk services employment and/or of production workers (negative factors) as well as a highly educated population and a diversified salary base (also both negatively associated with the level of growth). Adding regional dummies makes little difference to the results (regression II). Disaggregating the at-risk share to various occupation types (business support, computer-related, office support, and telemarketing) somewhat improves the fit of the model. In this model, only the computer related and telemarketer variables are significant. This opens up a number of possible interpretations. For example, the significance of the computer occupations share may well reflect the imploding of the tech/dot-com bubble more than any offshoring effects.
24

Telemarketing could well be in part an offshoring effect, but the lack of significance of business support and office support shares suggests that any offshoring impacts in these occupations are being offset by growth in domestic demand for these workers.
Table 8 Median Rate of Growth, 2001-2003, by At-Risk Category
Median Rate of Growth Occupation Code Occupation Name Low (0.8-) High (1.2+) Medium (0.9-1.1)
Employment 00-0000 All Occupations 1.0% -0.7% 0.5%13-2011 Accountants and Auditors 4.2% 4.5% 6.5%15-1021 Computer Programmers -9.7% -16.2% 1.5%15-1032 Computer Software Engineers--Systems 13.4% 14.2% 11.6%17-3011 Architectural and Civil Drafters 23.1% 4.1% 0.0%31-9094 Medical Transcriptionists 11.8% 5.1% 5.9%41-9041 Telemarketers 2.8% -11.4% 0.9%43-3051 Payroll and Timekeeping Clerks 1.5% 1.9% 6.1%43-9011 Computer Operators -14.7% -10.4% -9.1%43-9021 Data Entry Keyers -5.1% -17.6% -11.5%
Annual Salaries 00-0000 All Occupations 5.8% 6.8% 6.6%13-2011 Accountants and Auditors 9.7% 7.8% 10.3%15-1021 Computer Programmers 5.1% 1.4% 4.2%15-1032 Computer Software Engineers--Systems 6.8% 5.9% 3.9%17-3011 Architectural an Civil Drafters 0.8% 2.6% 3.8%31-9094 Medical Transcriptionists 5.0% 3.4% 5.2%41-9041 Telemarketers 8.7% 2.2% 5.2%43-3051 Payroll and Timekeeping Clerks 4.9% 3.9% 4.1%43-9011 Computer Operators 4.4% 3.0% 2.8%43-9021 Data Entry Keyers 5.5% 4.1% 3.5% Source: Author's analysis using Bureau of Labor Statistics OES data.
25

Table 9
Statistical Tests of the Effects of Concentration in Services Employment At-Risk to Offshoring and Other Factors on Employment Growth
I II III Dependent Variable-Percent Change in total MSA employment 2001-2003
Aggregated at-risk
Aggregated at-risk with regional dummies
At-risk by type with regional dummies
Emp Growth 1995-2001 0.1090624** 0.1255781** 0.1539349** At-Risk Share, 2001 -0.3649284** -0.3401679** A-R Share, Bus Support 0.7725398 A-R Share, Computers -1.076953** A-R Share, Off Support 0.0464099 A-R Share, Telemarketers -0.1357604** Bachelors -0.0014669** -0.0014221** -0.0009925# Ind Share-Gov't 0.1331793** 0.1437972** 0.1586398** Prod. Workers Share 01 -0.2356233** -0.1993744** -0.1201462# Median ann salary 01 -0.00000048 -0.0000011 -0.000000706 Salary Spread 01~ -0.1084788** -0.0932968** -0.0619018* D1NE 0.006967 0.0047863 D2Nat 0.0105138 0.0095369 D3ENC 0.0013332 -0.0018774 D5Sat 0.0087898 0.0063761 D7WSC -0.0073778 -0.0110729 D9PAC 0.0031748 0.0013134 _cons 0.1527997** 0.1423678** 0.0636855* Number of Observations 186 186 186 F F(7, 178)=22.61 F(13, 172)=12.96 F(16, 169)=12.60 Prob F>0 0.0000 0.0000 0.0000 Adjusted R-Squared 0.4499 0.4566 0.5009 *,**,### Significant at the 5% (*), 1% (**), or 10% (#) level. ~Salary Spread is the difference between the 4th quartile salary level and the 1st quartile salary level, divided by the median salary, for all occupations.
Disaggregating the statistical tests by region indicates that vulnerability may vary by regional structure (see Table 10). There is a significant negative relationship between high shares of computer occupations and job growth in both the Pacific Divison (Alaska, California, Hawaii, Oregon, and Washington) and the New England Division (Connecticut, Maine, Massachusetts, New Hampshire, Vermont and Rhode Island), but the Pacific Division also shows a positive correlation with telemarketing occupations, and the New England Division shows a weaker but positive correlation with business support occupations. High shares of office support occupations are negatively related to
26

employment growth in both the South Atlantic (Delaware, DC, Florida, Georgia, Maryland, North Carolina, South Carolina, Virginia and West Virginia) and West South Central (Arkansas, Louisiana, Oklahoma and Texas) divisions. This could indeed be an indication that restructuring of office work is occurring, with factors such as automation and offshoring playing a role.
Table 10
Statistical Tests Disaggregated by Region IV V VI VII Dependent Variable-Percent
Change in total MSA employment 2001-2003 Pacific Region New England South Atlantic West South Central
Emp Growth 1995-2001 0.0650687 0.3496675 0.2104336* 0.2874663** A-R Share, Bus Support 4.94913 5.145135# 1.435299 -5.097492# A-R Share, Computers -2.290484** -3.369259* 0.4613355 -0.8531349 A-R Share, Off Support 0.6064954 1.737334 -1.296228* -2.150183* A-R Share, Telemarketers 9.029279* 4.670547 -2.585668 -1.254901 Bachelors -0.0027767# -0.0025638# -0.0037333* 0.0012871 Ind Share-Gov't 0.3469463# 0.1960157 -0.0157607 0.1973461 Production W. Share 01 0.0921319 -0.268825 -0.409259 -0.1548884 Median ann salary 01 0.00000336 -3.22E-06 -2.18E-06 3.10E-06 Salary Spread 01~ 0.0017274 0.26349 -0.0257734 -0.1173834 _cons -0.1676779 -0.1886023 0.2343622* 0.1237497 Number of Observations 25 15 34 20 F F(10, 14) F(10, 4) F(10, 23) F(10, 9) Prob F>0 0.0000 0.0497 0.0007 0.0093 Adjusted R-Squared 0.8235 0.7808 0.5449 0.6968
*,**,# Significant at the 5% (*), 1% (**), or 10% (#) level.
~Salary Spread is the 75 percentile wage minus the 25th percentile wage divided by the median wage.
Statistical tests do not help to clarify the data for wage change in places with high shares of at-risk occupations. An OLS regression shows that wage change between 2001 and 2003 was negatively associated with the share of people employed in business support occupations and with the percent employed in the government sector, while areas with high shares of college-educated workers were more likely to see wage growth. The regression, however, had an adjusted R-squared of only 0.14. Regressions on wages for individual occupations explain even less of the variation. The complexity of some of the changes occurring within industries and occupations during this period may help to explain the difficulty with modeling wage change. The case of San Jose, California is described below.
27

6. Structural Change Metropolitan areas with high shares of at-risk occupations may be changing
structurally as well as growing more slowly. One metropolitan area, San Jose, California, illustrates the type of structural change that is occurring in part because of offshoring pressures. The San Jose MSA is among the metropolitan areas with the highest shares of employment in white-collar occupations at risk to offshoring. Ranking fifth nationwide and first in California, 16.7 percent of the workforce in 2003 was employed in white-collar at-risk occupations. (See Figure 7). The metropolitan area has a computer and math share three times higher than the national average. The neighboring San Francisco MSA also stands out as being well above the average US share in at-risk white-collar occupations, with a computer and math share almost twice the national average, and above average concentrations in each of the other aggregate at risk categories.
The San Jose MSA, which comprises much of Silicon Valley, experienced a far
worse recession than did the US or California, losing almost one fifth of its wage and salary employment between 2000 and 2002 (see Figure 8). The categories most at-risk to offshoring all suffered job losses at a much greater rate than nationally. For example, employment in computer and math occupations dropped by more than one third in a 2-year period. While offshoring played a role in this change, other factors, especially the dot-com collapse, were clearly implicated and undoubtedly account for the greater share of the loss. Some of the job hemorrhaging continued in 2003, long past the major impacts of the dot-com bust. Other high-risk, technologically concentrated MSAs show similar patterns in 2003, losing both computer jobs and routine offshorable jobs like data entry clerks, as shown in Table 11.
Figure 7Percent of Total Jobs in Occupations At-Risk for Outsourcing:
Selected California MSAs, 2003
0%
5%10%
15%
20%
US
Califor
nia
Los Ange
les
San Fra
ncisco
San Jo
se
Oaklan
d
Santa
Rosa
Val-Nap
-Fair
Office Support Business & Finance SupportComputer and Math Professions Other*
* Other includes medical, legal, sales, graphics, design, writing and translation.Source: Authors from Bureau of Labor Statistics data, 2002 data.
28
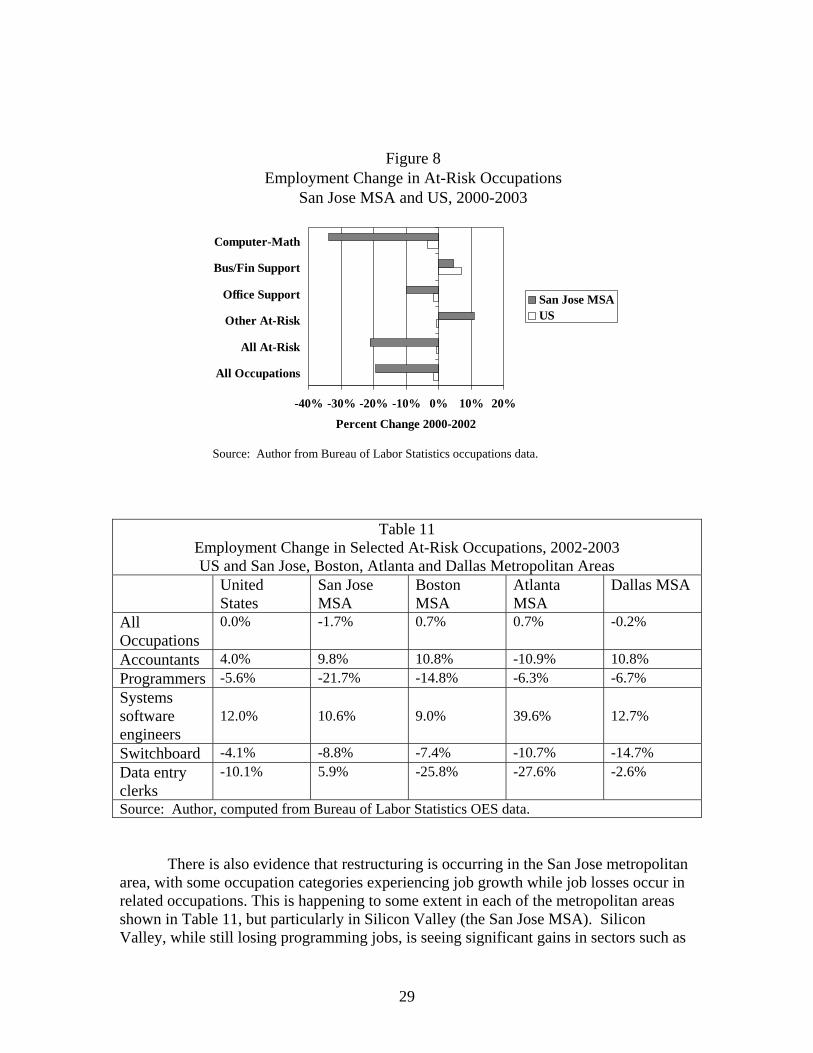
Figure 8Employment Change in At-Risk Occupations
San Jose MSA and US, 2000-2003
-40% -30% -20% -10% 0% 10% 20%
All Occupations
All At-Risk
Other At-Risk
Office Support
Bus/Fin Support
Computer-Math
Percent Change 2000-2002
San Jose MSAUS
Source: Author from Bureau of Labor Statistics occupations data.
Table 11 Employment Change in Selected At-Risk Occupations, 2002-2003 US and San Jose, Boston, Atlanta and Dallas Metropolitan Areas
United States
San Jose MSA
Boston MSA
Atlanta MSA
Dallas MSA
All Occupations
0.0%
-1.7%
0.7%
0.7%
-0.2%
Accountants 4.0% 9.8% 10.8% -10.9% 10.8% Programmers -5.6% -21.7% -14.8% -6.3% -6.7% Systems software engineers
12.0% 10.6% 9.0% 39.6% 12.7%
Switchboard -4.1% -8.8% -7.4% -10.7% -14.7% Data entry clerks
-10.1% 5.9% -25.8% -27.6% -2.6%
Source: Author, computed from Bureau of Labor Statistics OES data.
There is also evidence that restructuring is occurring in the San Jose metropolitan area, with some occupation categories experiencing job growth while job losses occur in related occupations. This is happening to some extent in each of the metropolitan areas shown in Table 11, but particularly in Silicon Valley (the San Jose MSA). Silicon Valley, while still losing programming jobs, is seeing significant gains in sectors such as
29

accounting and software engineering, both of which are related to the high end of the high-tech business—headquarters activities and research and development. It is interesting to speculate why Atlanta is losing instead of gaining accountants, and why San Jose is the only MSA in Table 11 that is gaining data entry jobs, counter to the national trends. If Atlanta has played more of a “back office” role in its technology jobs, then the accounting jobs, too, may be of the back office rather than headquarters type, more subject to offshoring. In contrast, if Silicon Valley is indeed shedding the most routine jobs, the growth in data entry clerks may accompany growth in the most skilled computing tasks as necessary local support for those workers. (On the other hand, this is only speculation, and more work is needed simply on validating the data and understanding the consistency in the application of occupational definitions from year to year).
Figure 9Median Programmer Salaries
US, San Jose MSA and Boston MSA 1999-2003
0100002000030000400005000060000700008000090000
US total emp US California San Jose
19992000200120022003
PROGRAMMERS
Salary statistics in Silicon Valley offer suggestive evidence that the job
composition is changing even within occupations, as white-collar employment is realigned. With consistently large drops in programmer jobs throughout the US and major MSAs, one would expect a dampening effect on wage levels, and the data presented earlier suggests that this occurred on average for MSAs with high shares of tradable white-collar jobs. With more than a 50 percent drop in programmer employment over a three-year period, the impact could be expected to be greatest in the San Jose MSA. As shown in Figures 9 and 10, this was not the case. In the US as a whole, a dampening of salary growth did occur for programmers, and salaries began dropping in 2003. Similar slowdowns or drops occurred in some of the MSAs outside of California (Figure 10). In California, the rate of growth of programmer salaries slowed, but the salary level continued to increase. In Silicon Valley, salaries took a sharp increase in
30

2003. A likely explanation of this is that the routine occupations were eliminated or moved out of the region, while only the most skilled remained in the area.
Figure 10Median Programmer Salaries
San Jose MSA and Boston MSA 1999-2003
0100002000030000400005000060000700008000090000
San Jose Boston Atlanta Dallas Phoenix
19992000200120022003
PROGRAMMERS
The evidence suggests a few conclusions. • The ability to have a job done remotely places it at risk to offshoring, but
actual impacts can vary widely by occupation and by location. • Overall, the more routine and “codifiable” an occupation, the more vulnerable
it is to offshoring. This is exacerbated if wage gaps are wide. • The prior economic base of a metropolitan area will influence what types of
jobs may be offshored, and it will also influence the prospects for future job growth. Silicon Valley’s high-cost technology base, strong Asian links and rapid growth in the late 1990s made it a fertle base for software ofshoring. The metropolitan area’s tech base also provides the resources for new business development.
• Offshoring may contribute to permanent restructuring of an economy. In the case of Silicon Valley, manufacturing offshoring left an economy that was more centered on headquarters, research and development, and services activities. With the offshoring of many programming and services jobs, it appears that specialization in headquarters and R&D activity is increasing. However, the net effects in the short term will likely be a smaller job base compared to 2000, and longer-term competitiveness issues remain.
• The future of economies that were focused on back office activities remains uncertain, as back offices move from nearby suburbs to suburbs half a world
31

away. Recovery in these areas may require creative redirection into new business areas.
The data shows slower job growth during the most recent period in metropolitan
areas with high shares of tradable white-collar occupations. In the longer term, the adjustment prospects for these places are likely to be more promising than for the manufacturing based regions that have experienced earlier waves of offshoring. The metropolitan areas vulnerable to the current wave of outsourcing have some advantages over communities that have lost a major manufacturing or resource based employer. First, white-collar workforce skills often are transferable among industries. For example, a number of displaced high-tech programmers from Silicon Valley have found work in health care professions in neighboring metropolitan areas (sometimes closer to their homes, often at lower salaries). Second, the more highly paid workers who are at risk of losing their work to offshore providers are also among the more educated workers. While they face wage losses and periods of unemployment, their rehiring prospects are far better than for less educated workers. Third, to the extent that displaced workers are younger workers (as is the case for much of the programmer labor force), their prospects for reemployment also improve (see Kletzer 2003), and their mobility is greater. Fourth, for communities that have gone from very low unemployment rates to higher rates of unemployment, the greater availability of labor can become an advantage in the growth of remaining businesses during recovery, and some laid off workers may become the new entrepreneurs of the next generation of businesses. Finally, although an entire job category may be shrinking, the basic labor skills or human capital may be transferable to other occupations with more flexibility than a manufacturing facility can be transferred to a new production technique.
Despite this list of mitigating factors, white-collar offshoring remains a problem,
not only for the workers whose jobs are lost or for businesses that lose customers through the process but also for the metropolitan areas where the workers concentrate. The ability of a metropolitan area to take advantage of its newly available resources (i.e. unemployed white-collar workers and vacant facilities) will vary with the details of the economic base. Technologically based areas with strong presence of headquarters and development activities have a different set of opportunities than back office communities whose major attraction was a low cost labor base with a “good work ethic.” Furthermore, to the extent that offshoring is occurring for the technical, professional and administrative jobs that used to remain onshore, the agglomeration pulls that have kept these centers strong may now be weakened.
6. Is State and Local Policy Equipped to Deal with Local Issues Raised by Offshoring?
Policy makers are faced with several aspects of this issue. By far the largest
attention on the political front and in the press seems to be on the level of offshoring and the types of jobs being lost. However, a range of other issues have also been raised, from
32

the impacts on displaced workers to threats to privacy and security and the long term competitive strengths of the US economy. This phenomenon has arisen and expanded so rapidly that neither national nor state policy responses have caught up. Assistance programs for workers displaced by trade agreements has not been broadly applied to white-collar workers. Legal requirements and protections are still being debated in the Internet age, as more and more personal information is sent over the Internet and processed globally. At the state level, as individual communities or occupational groups become heavily affected by offshoring, there is increasing pressure to take action.
The kinds of actions being considered fall broadly into several categories9: • Restrictions on the level and scope of offshoring • Better information on the process • Assistance and protections for displaced workers • Protections for privacy and security • Maintaining competitiveness.
Proposals have been introduced into Congress and at least 37 states to deal with one or more of these categories. (a) Restricting the Level and Scope of Offshoring
This issue gained strength when a US based outsource provider was found to be processing state welfare claims in India (stateaction.com 2004). Federal and state responses range from toothless resolutions to discourage the practice to bans on offshoring of government work. Proposals in the senate, house and 34 state legislatures would restrict the use of public funds to outsource services to companies that use offshore workers. In addition or as an alternative to direct bans, other proposed measures would use incentives, require a percentage of domestic hires, or offer preferences in state contract bids to firms hiring domestically. (Preference legislation has already been passed in Indiana—House Bill No. 1080, and Tennessee—Senate Bill No. 2344).
(b) Improved Information
The federal and a few state governments are trying to improve information on the process. Changes have already been instituted in how layoffs are reported, and a proposed extension would cover a larger universe of firms and incidents (Senate Bill 2090). A California bill requiring employers to report employment nationwide and worldwide as well as in California was proposed in February 2004, passed by both state houses in September 2004, but vetoed by the governor (www.leginfo.ca.gov).
(c) Assistance and Protections for Displaced Workers
9 Where not otherwise noted, much of this information was drawn from summaries and details provided in National Foundation for American Policy 2004a and 2004b.
33

Proposals at the Federal level include layoff notifications, extension of trade adjustment assistance to services workers, wage insurance, and reforms to the guest worker visa programs. At least two states, Michigan and California, layoff notification requirements have been proposed. Very little has been adopted, as yet, to improve reemployment prospects for displaced white-collar workers.
(d) Privacy and Security At least 10 states have proposals that would restrict the kinds of services that may be offshored. Most focus on protecting personal data such as health related and financial information. In California alone in 2004, at least 5 separate proposals were introduced that would restrict sending offshore personal identifying information, financial information, medical information, or information involving national security. (Legislative Counsel 2004). (e) Competitiveness Competitiveness programs have not been a direct focus of the discussion on offshoring, although the importance of competitiveness and fears of changing comparative advantage come up frequently in debates about globalization. Broader discussions of competitiveness center on ways to continue producing a technically trained labor force and ways to foster innovation in business. Many different states have programs to support technological development and/or venture capital for technical ventures (see www.ncsl.org). At the state level, the proposals currently under consideration offer serious pitfalls and at the same time fail to address some of the key victims of offshoring. The share of attention given to state government offshored jobs far exceeds the size of the problem. The numbers of workers affected by state welfare offshoring in any one state appears to be in the dozens. In addition, in setting such restrictions, states run the risk of violating treaties that allow their resident firms to contract to do work for foreign governments, often a much larger job producer than the data and claims processing jobs that have been offshored.
At the same time, the need to update dislocation assistance is not being met. Assistance programs to aid displaced workers are generally designed for earlier waves of layoffs in manufacturing and lower skilled services jobs. Retraining programs in as computer technology and programming may need to be reevaluated if those jobs are now being outsourced, and engineers with PhD and masters degrees will need assistance of a different type than is generally provided in the standard community college based training center. Proposals for wage insurance, which could be an important transistion assistance mechanism, have been discussed but not enacted (see Kletzer and Litan 2003; this proposal would most effectively be enacted at the national level).
Furthermore, local businesses that have rapidly lost customers to offshore
providers have received little attention in the press or state legislatures. Support for new
34

and recovering businesses may be an important factor in the ability of a metropolitan area to recover from the restructuring associated with offshoring.
7. Summary and Conclusions
A quick look at national level statistics shows that advocates of free trade have a case—the white-collar occupations most likely to be offshored are not on average showing weaker trends than other parts of the economy, and analyses that look at the full system suggest that ultimately there may be gains from services trade. Even so, earlier periods of globalization that affected the manufacturing base, although growth inducing in balance, also led to substantial restructuring and disruption for the labor force and for communities that lost their economic bases in the process. Could offshoring of white-collar jobs have a similar affect on the employment mix, demand for different labor skills, and location of job shifts?
The research reported in this paper has shown that the offshoring of white-collar
jobs affects a significant segment of the US labor force and job base and that the effects of this type of globalization will vary among metropolitan areas. The number of white-collar jobs at risk to offshoring is of the same order of magnitude as the number of manufacturing jobs that were at risk when manufacturing globalization first began. The scale of job loss could also be similar. The distribution of the loss, among industries and among geographic locations, will be quite different.
States and metropolitan areas with high shares of tradable white-collar
occupations are often services-based centers characterized by high wages, historically low unemployment, and an educated labor force. Since 2001, these places, overall, have seen slower job growth and slower wage gains than centers less concentrated in white-collar jobs at-risk to offshoring. Understanding the effects of offshoring is complicated by longer term restructuring that is occurring in addition to these effects. Silicon Valley, for example, seems to be following its historic strategy of concentrating employment growth and wage gains in high-end occupations and spinning off or eliminating lower paying, more routine occupations. The “high end,” however, seems to have moved “up,” with jobs that were once considered skilled, such as many programming jobs, becoming displaced as “routine.” Recession and restructuring left 2004 employment in the San Jose MSA below its 1996 level and almost 20% below its 2000 peak.
More generally, the longer term effect of offshoring on “at-risk” metropolitan
areas remains uncertain. The type of workers affected and therefore the structural impacts will clearly depend on the type of concentration—technological, back office or business and financial support. The ability of a metropolitan area to benefit from the gains of global trade and other aspects of economic growth will also vary, depending on the character of resources left in the region. Further research should focus on (i) how industrial mix as well as occupational mix has affected job change patterns in recent
35

years and (ii) what the growth and contraction of individual firms can tell us about the composition of net employment and income gains or losses in these metropolitan areas.
Even the preliminary numbers and reports from individuals, however, suggest that
both worker displacement and business displacement will be areas where public response is needed, whether or not the net impacts of offshoring are positive or negative for the economy. Because halting the process is difficult, complex, and may have negative consequences on other parts of the economy, policy responses need to focus on worker and business assistance, maintaining competitive strengths, and positioning the community, local firms, and the labor force to participate in future growth opportunities.
36

References
A.T. Kearney, Madan, Praveen, Nguyen, Amy, Leon, Anna, Dixit, Rohit, McMillen, Brad, Cope, Katherine, Pradhan, Keith, and Koren, Scott. 2004. The Future of Bay Area Jobs: The Impact of Offshoring and Other Key Trends. San Francisco, Bay Area Economic Forum, Joint Venture Silicon Valley, Stanford Project on Regions of Innovation and Entrepreneurship.
Amiti, Mary and Wei, Shang-Jin. Fear of Service Outsourcing: Is It Justified? 2004. Cambridge, National Bureau of Economic Research. NBER Working Paper Series.
Anderson, C. 2004. "The Indian Machine: Computers threatened our jobs, but ultimately made us stronger. So will outsourcing." Wired Magazine.
Ashok Deo Bardhan and Subhrajit Guhathakurta. “Global Linkages of Subnational Regions: Coastal Exports and International Networks.” Contemporary Economic Policy 22[2], 225-236. 2004.
Bardhan, A.D. and D.K. Howe. Globalization and Labor: The Effect of Imported Inputs on Blue Collar Workers. 1998. Berkeley, Fisher Center for Real Estate and Urban Economics, University of California.
Bardhan, A.D., D.M. Jaffee, and C.A. Kroll. 2004. Globalization and a High-Tech Economy: California, the United States and Beyond. Kluwer Academic Publishers. Boston.
Bardhan, Ashok Deo and Kroll, Cynthia A. “Emerging Sector in an Emerging Economy: The Russian Software Industry and its Global Linkages.” 2003. Paper Presented to ACSP-AESOP Joint Congress, Leuven, Belgium.
Bardhan, A.D. and C.A. Kroll. 2003. "The New Wave of Outsourcing." Research Report, Fisher Center for Real Estate and Urban Economics.
Bhagwati, J., A. Panagariya, and T.N. Srinivasa. forthcoming. "The Muddles over Outsourcing." Journal of Economic Perspectives.
Bjorhus, J. “Offshoring Threat to Twin Cities Weighed: Job Vulnerability Difficult for Researchers to Assess.” St. Paul Pioneer Press. Business, C-1. 2004. St. Paul, MN.
Bluestone, B. and B. Harrison. 1982. The Deindustrialization of America: plant closings, community abandonment, and the dismantling of basic industry. Basic Books. New York City.
Brainard, Lael and Litan, Robert E. “"Offshoring" Service Jobs: Bane or Boon and What to Do?” 2004. Washington, DC. Global Economics, Policy Brief.
Bureau of Labor Statistics. “Extended Mass Layoffs Associated With Domestic and Overseas Relocations, First Quarter 2004 Summary.” 2004. Washington, D.C., Bureau of Labor Statistics.
Dobbs, L. 2004. Exporting America: Why Corporate Greed is Shipping Jobs Overseas. Warner.
Dossani, Rafiq. The Growth of India's IT Industry. 2003. Stanford, Asia Pacific Research Center. Working Paper.
Drezner, D.W. 2004. "The Outsourcing Bogeyman." Foreign Affairs .
Feenstra, Robert C. US Imports, 1972-1994: Data and Concordances. 1996. NBER Working Paper Series.
37

Garner, C.A. 2004. "Offshoring in the Service Sector: Economic Impact and Policy Issues." Economic Review, Federal Reserve Bank of Kansas City.5-37.
Garry, G.C. 1999. "Offshore programmers: The wave of the future?" UNIX Review's Performance Computing. Vol. 17:14-19.
Global Insight. The Impact of Offshore IT Software and Services Outsourcing on the U.S. Economy and the IT Industry. 2004. Lexington, Global Insight (USA), Inc.
Grimes, A. “Venture Firms Seek Start-Ups That Outsource.” Wall Street Journal. B[5,4], 1, 4. 2004. Dow Jones & Company.
Grossman, Gene M. and Helpman, Elhanan. Outsourcing in a Global Economy. 2002. Cambridge, National Bureau of Economic Research. NBER Working Paper Series.
Harrison, B. and M.R. Kelley. 1993. "Outsourcing and the Search for Flexibility." Work Employment and Society. 7:213-235.
Hoffman, T. and P. Thibodeau. 2003. "Exporting IT Jobs." Computerworld. 37:39, 4pp.
Horwitz, J. and P. Wilson. 2004. "New BLS Job Projections Reflect Growing Impact of Offshoring on US Workers; Professionals, High-Tech Employees Are the Big Losers." U.S. Newswire.
Kirby, C. and J. Shinal. “Offshoring's giant target: the Bay Area Silicon Valley could face export of 1 in 6 jobs -- worst in nation.” San Francisco Chronicle. A, 1+. 2004. San Francisco.
Kletzer, L.G. 2003. "The Long-Term Costs of Job Displacement for Young Adult Workers." Industrial and Labor Relations Review. 56:682-.
Kletzer, L.G. and R.E. Litan. 2001. “A Prescription to Relieve Worker Anxiety.” International Economics Policy Brief, Institute for International Economics, March.
Kroll, C.A., D.M. Jaffee, A.D. Bardhan, J. Kirschenbaum, and D.K. Howe. 1998. Foreign Trade and California's Economic Growth. California Policy Seminar, University of California. Berkeley.
Lachman, M. Leanne. The New Exports: Office Jobs. 2004. New York City, The Paul Milstein Center for Real Estate, Columbia Business School. Issue Paper Series.
Larson, J., J. Higuera, and J. Kamman. Phoenix-Area Jobs In Jeopardy: Offshoring Risk Higher In Valley Than In Other Areas. The Arizona Republic. Front, A1. 2004. Phoenix.
Legislative Counsel, S.o.C. Official California Legislative Information. October 2004. http://www.leginfo.ca.gov/index.html
McCarthy, J.C., A. Dash, H. Liddell, C.F. Ross, and B.D. Temkin. 2002. "3.3 Million US Services Jobs to Go Offshore." Forrester Research, IT View and Business View Brief.
McCarthy, J.C., C.F. Ross, W. Martorelli, and C. Mines. 2004. "Near Term Growth of Offshoring Accellerating." Forrester Research, IT View and Business View Brief.
McKinsey Global Instititute. Offshoring: Is It a Win-Win Game? 2003. San Francisco, McKinsey & Co.
Naponen, Helzi, Graham, Julie, and Markusen, Ann R. Trading Industries, Trading Regions: International Trade, American Industry, and Regional Economic Development. 1993. New York, The Guilford Press. 1993.
38

National Foundation for American Policy. Global Sourcing Information: Table Tracking State and Federal Global Sourcing Legislation. October 2004. http://www.nfap.net/researchactivities/globalsourcing/appendix.aspx
National Foundation for American Policy. Summary List of States with New Laws and Proposed Legislation Restricting Outsourcing. October 2004. http://www.nfap.net/researchactivities/globalsourcing/summary/summaryList.pdf
Rondinelli, D.A. and G. Vastag. 1997. "Analyzing the Competitiveness of Metropolitan Areas." Economic Development Quarterly. 11:347-366.
Samuelson, P.A. 2004. "Where Ricardo and Mill Rebut and Confirm Arguments of Mainstream Economists Supporting Globalization." Journal of Economic Perspectives. 18:135-146.
Saxenian, A. 1994. Regional Advantage: Culture and Competition in Silicon Valley and Route 128 . Harvard University Press. Cambridge.
Saxenian, AnnaLee, Motoyama, Yasuyuki, and Quan, Xiaohong. Local and Global Networks of Immigrant Professionals in Silicon Valley. 2002. San Francisco, Public Policy Institute of California.
Sharp, M. Industrial Policy in a Global Environment. Gourevitch, Peter and Guerrieri, Paolo. “Industrial Policy in a Global Environment.” In New Challenges to International Cooperation: Adjustment of Firms, Policies and Organizations to Global Competition . 197-231. 1993. San Diego, University of California, San Diego, International Relations and Pacific Studies. 1993.
Sobol, M.G. and U. Apte. 1995. "Domestic and Global Outsourcing Practices of America's Most Effective Is Users." Journal of Information Technology. 10:269-280.
stateaction.org. Outsourcing. October 2004.
Tilton, A. 2003. "Offshoring: Where have all the Jobs Gone?" Goldman Sachs, U.S. Economics Analyst.
Vernon, R. 1979. "The Product Cycle Hypothesis in a New International Environment." Oxford Bulletin of Economics and Statistics. 41:255-267.
Waldman, A. A Young American Outsources Himself to India; [Biography]. New York Times. A, 4. 2004.
39