Embed Size (px)
Citation preview

Metro Strategic Plan
APPENDICESAppendix A: 2017 Customer Satisfaction Survey ResultsAppendix B: Summary of OutreachAppendix C: Equity Framework

1
Unpacking Customer Satisfaction:Customer Satisfaction Survey Results
Summer 2017
Appendix A: 2017 Customer Satisfaction Survey Results

2
Table of ContentsINTRODUCTION............................................................................................................................................. 3
METHODOLOGY ............................................................................................................................................ 3
Audience ................................................................................................................................................... 3
Survey Administration .............................................................................................................................. 3
Survey Design............................................................................................................................................ 4
ANALYSIS AND RESULTS................................................................................................................................ 7
Key User Segment Characteristics ............................................................................................................ 7
Common Issues Across User Groups ......................................................................................................10
Customer Satisfaction and Priorities ......................................................................................................11
SUMMARY AND RECOMMENDATIONS.......................................................................................................20
ACKNOWLEDGMENTS.................................................................................................................................22
REFERENCE..................................................................................................................................................23
APPENDICES ................................................................................................................................................24
Appendix A – Complete list of survey questions
Appendix B – Outline of the skip logic feature and sequencing of questions
Appendix C – 2017 Customer Satisfaction Focus Groups, Final Report
Appendix D – Overview of the questions and responses used to categorize these user segments
Appendix E – Detailed Summary of Demographic Makeup of Respondents by User Segment
Appendices can be accessed online:http://libraryarchives.metro.net/DB_Attachments/180103_Attachment%20C_Appendices.pdf
List of Tables
Table A – Net Promoter Score
Table B – Snapshot of Demographic Makeup of Respondents by User Segment
Table C – Customer Priorities and Level of Satisfaction
Table D – Questions to Identify the Main Reason or Top Improvement That Users Prioritize

3
INTRODUCTION
The Los Angeles County Metropolitan Transportation Authority (Metro) seeks to better understand thetransportation needs and concerns of Los Angeles County residents and workers. Metro conducted acustomer satisfaction survey to identify specific elements that affect customer satisfaction and assessrelative importance of those elements to the customer. The survey included an online component andcomplementary focus group research to ensure adequate reach. The results of the survey will inform thedevelopment of an agency-wide Metro Strategic Plan and help Metro more effectively tailor services toour customers, which include all residents and visitors to Los Angeles County.
METHODOLOGY
AudienceMetro conducted a large-scale online survey of transit riders and non-riders. The demographics ofrespondents were compared to previous Metro surveys and Los Angeles County Census data to confirma representative sample. In addition, the agency conducted focus group research to provide a deeperdive into groups that are historically more challenging to engage, such as those with limited Englishproficiency and low income, elderly and minority populations.
Survey AdministrationOnline Survey. The online survey was administered from June 1 - 30, 2017, and distributed through acombination of email invitations and social media, such as targeted Facebook ads, with a goal ofreceiving 20,000 responses. The survey was administered online using Facebook Ads Manager, which isa self-service tool that enables Metro to create and manage advertisements on Facebook. The adstargeted people 18 years old and older living in Los Angeles County, based on user profiles and behaviordata from Facebook’s social media platform. The survey was also available in English, Spanish, Chinese,and Korean languages, representing the most prevalent languages spoken in Los Angeles County. Toincentivize participation in the survey, respondents were entered into a raffle drawing to win a prize.
Focus Group Research. Metro contracted withEvitarus, a public opinion research and publicpolicy consulting firm, to design and conductfocus group research that can supplement theonline survey. The research was conducted inJuly and August 2017, and consisted of fivefocus groups, segmented primarily bylanguage, including two groups conducted inEnglish and one group each in Spanish,Chinese, and Korean. The English groups wereconducted among two populations shown byprior research to have distinctive opinions ontransit and transit equity issues: residents over the age of 50, and African Americans. Each focus groupwas comprised of a gender-balanced mix of nine to ten participants. The groups also included residentswith varying degrees of education, Internet and social media usage, as well as those with physical ormental health conditions that affect daily life and mobility (disability).

4
Survey DesignOnline Survey. Metro designed the survey instrument to explore how and why respondents maketransportation decisions by addressing the following areas:
Transportation behaviors, including modes of transportation that respondents typically use, typesof Metro transit services (e.g., bus, rail) that they use, frequency of usage, and why they use or donot use Metro transit services;
Attitudes toward various attributes of public transportation, such as safety, reliability, travel time,comfort, access, and knowledge of how to use the system;
Demographic information, including household income, age, gender, ethnicity, and employmentstatus.
The complete list of survey questions is in Appendix A. The survey design includes a skip logic featurethat enabled Metro to better tailor the relevant questions to the individual respondents. Appendix Bprovides an outline of the skip logic feature and sequencing of questions. This shortens the length oftime needed for participants to take the survey by providing only questions that are relevant to them,thus increasing the chances that they will complete the entire survey.
Transportation profiles of the respondents were established through a series of questions towards thebeginning of the survey to understand their transportation behaviors and their attitudes towards publictransit, as described below. In order to identify attributes that may be specific to rail or bus services, aseries of questions specific to rail usage were asked first, followed by questions specific to bus.
Types of Metro transit services used (i.e., use both bus and rail services, use bus services only, userail services only, don’t use Metro transit services). Although LA Metro offers a suite of services tomeet the diverse needs of LA County residents and visitors, including rail and bus services, ExpressLanes, regional bike share, among other services, this survey was designed specifically to gaugesatisfaction with Metro’s transit services as a starting point. By identifying specific attributes oftransit that affect customer satisfaction and assessing the relative importance of those attributes tothe respondents, Metro can identify opportunities to leverage other services that can complementthe transit riders’ experience or offer other mobility options that better suit the respondents’preferences and needs.

5
Frequency of transit usage (i.e., frequent,occasional, infrequent, never). Based onthe respondents’ answers to frequency oftransit usage, they were asked follow upattitude questions tailored to theirprevious responses. If respondentsindicated that they use Metro transitservices three times a week, Metroassumed that this was one of theirprimary modes of transportation;therefore, they would be asked questionsregarding why they choose to ride Metroand how Metro can better serve them.Respondents who indicated that they useMetro transit services one to two times a week were asked what improvements Metro could maketo encourage them to ride more frequently, since Metro assumed that there may be opportunitiesto encourage increased usage. Any respondent who indicated that they do not use Metro transitservices regularly, had never used Metro transit services, or stopped using these services wereasked specific questions to help identify how they chose their current mode of transportation.Below is an overview of survey question design around the frequency of transit usage, which thenleads to tailored questions related to attitudes about various attributes of public transit.
o Infrequent/Non-riders: For respondents who never rode Metro transit or used itinfrequently, questions were designed to identify the respondents’ modes of travel,frequency at which they use those modes, reasons for not using Metro transit, main reasonsfor using their current mode of transportation rather than using Metro transit, andsuggested actions that Metro can take to encourage their patronage of Metro transitservices. The survey questions are designed to identify the main attributes, or factors,influencing these respondents’ travel decisions, types of improvements that could attractthese respondents to Metro transit services, or opportunities to match them with othermobility services beyond Metro rail or buses.
o Current riders: For current Metro riders, questions were designed to understand the factors(e.g., convenience, traffic, cost, lack of car availability, etc) that influence their decision touse Metro rail or bus, relative importance of those factors, purpose of their trips, andlikelihood that they would recommend Metro rail or bus services to a friend or colleague.For respondents who ride less than three days a week, follow up questions were designed toidentify actions and improvements that would encourage them to ride more often (e.g.,more frequent service, more reliable service, more late-night service, better information,better access to transit, etc) as well as identify the highest priority improvement that wouldincrease their usage.
o Previous riders: For respondents who previously rode Metro rail and/or bus, but no longeruse these services, questions were designed to identify how long they rode the Metrosystem before they stopped, their current modes of travel, frequency at which they usethose modes, main reasons for using their current mode of transportation rather than usingMetro transit, and suggested actions that Metro can take to encourage their patronageagain.

6
Customer Satisfaction and Priorities. Previous survey studies undertaken by Metro focused on whatproblems affect Metro riders and non-riders, and reported the problems that were mentioned themost. This survey attempted to accomplish that same task, while also asking for the respondent’smain reason for using Metro transit services or the main improvement that would encourage themto use the services more often. The survey questions are designed to identify the main attributes, orfactors, influencing respondents’ travel decisions and the relative importance of those attributes.This approach provides Metro with insights into factors that are very important to customers andopportunities for Metro to focus and prioritize improvements and resources based on thecustomers’ needs and preferences.
Overall opinions and perceptions of Metro transit services, using the net promoter score. The netpromoter score, which is widely used by many companies, is a metric used to gauge the customer’soverall level of satisfaction with a company’s services or products. For respondents who currentlyuse Metro bus or rail, the survey includes a question asking about their likelihood to recommendMetro rail or bus to a friend or colleague. Their response options are shown on a sliding scale ofzero, which indicates not at all likely to recommend Metro rail or bus, to 10, which indicatesextremely likely to recommend the service. The respondents’ answers are used to calculate the netpromoter score, which is divided into three groups, as shown in Table A. It is calculated bysubtracting the percentage of detractors (scores of six or lower) from the percentage of promoters(scores of nine and ten). Passive scores are not factored into the calculation in this case. The goal isto increase the number of promoters and decrease the number of detractors.
Table A. Net Promoter Score Range
Score range Customer perception
0 to 6 Detractor: customer holds a negative opinion of the service
7 to 8 Passive: customer has a neutral or passive opinion of the service
9 to 10 Promoter: customer holds a positive opinion of the service and would be willing topromote it
Focus Group Research. The focus group research was designed to supplement the online survey, with aspecific focus on demographic subgroups that may have been unrepresented or underrepresented inthe survey’s sample. The full report on this research is in Appendix C.

7
ANALYSIS AND RESULTSThere were 18,198 total respondents to theonline survey, with 16,446 survey takers whocompleted enough of the survey to be included inthe segment analysis. Metro analyzed the surveyresults to identify key segments of users in LosAngeles County that may have similar travelcharacteristics, based on respondents’ answers toquestions that assess their transportationbehaviors, attitudes towards various attributes ofpublic transit, and their likelihood of using Metrotransit services. Appendix D provides an overviewof the questions and responses used to categorizethese user segments. The focus group research was not included in the user segment analysis due to themuch smaller sample size and the objective of reaching targeted, unrepresented or underrepresented,demographic populations.
Key User Segment CharacteristicsBased on the results of the analysis, Metro identified the following seven key user segments and thecharacteristics of each group, including factors that drive their transportation decisions, demographics(e.g., age, gender, ethnicity, household income, employment status), level and frequency of transitusage, and willingness to promote Metro’s services, which was quantified through the net promoterscore. The user segments are listed in order from most frequent Metro transit users to the least. Theseven user segments make up 83% of survey respondents. The remaining 17% of respondents hadmyriad and disparate characteristics that could not be meaningfully classified into distinct categories.Net promoter scores were not available for Drivers Who Occasionally Ride Rail, High Potential TransitUser, or Previous Bus/Rail Rider groups since they use Metro transit services very infrequently. Table Bprovides a snapshot of the demographic makeup of each user segment. For a more detailed summary ofthe demographic makeup, see Appendix E.
Table B. Snapshot of Demographic Makeup of Respondents by User Segment
Savvy
Transit
Users
No Hassle
Travelers
Frequent
Bus
Patrons
Frequent
Rail
Patrons
Drivers Who
Occasionally
Ride Rail
High
Potential
Transit
Users
Previous
Bus/Rail
Riders Other*
Total Number of
Respondents 4,606 1,792 970 828 1,323 3,320 746 2,861
% of Total
Respondents 28% 11% 6% 5% 8% 20% 5% 17%
Employed full-time 50% 67% 48% 75% 67% 59% 59%
Annual Household
Income: Less than
$50,000 65% 36% 61% 28% 23% 33% 52%
Annual Household
Income: More than
$100,000 12% 28% 12% 34% 39% 32% 17%
African American/
Latino 44% 26% 40% 20% 13% 25% 42%
*Consist of remaining respondents who could not be meaningfully classified into distinct categories.
8
Savvy Transit Users (28% of respondents)
Transportation decisions driven by convenience, cost, and transit-dependency.
Likely to live close to rail station (60% of respondents in this group live within a 20-minute walk of astation).
Very diverse transit trip purposes: 20-40% of them ride Metro bus and rail three or more times aweek for school, groceries, personal errands, and/or other non-work trips.
Approximately 39% of them ride primarily because they do not have a car or driver’s license.
Highest percentage of Latino and African American respondents of all segments.
Less likely to be employed full-time than other segments, except for Frequent Bus Patrons group.
Lowest household income of all segments.
Net Promoter Score is 21% for rail, which is surpassed only by the No Hassle Traveler group.
No Hassle Travelers (11% of respondents)
Transportation decisions driven by convenience, traffic, trip reliability, strong preference forconsistent travel time, and travel speed.
Likely to live close to rail station (62% of respondents in this group live within a 20-minute walk of astation).
Only segment with a higher percentage of men than women (53% versus 46%, respectively).
Second most likely of all groups to be employed (86% employed at least part-time). Much morelikely to have a full-time job. Likely to be commuters.
Sixteen percent more likely to have household income over $100,000 per year than Savvy TransitUsers.
Diverse range of household incomes.
Net promoter score of 26% for Metro rail, which is the highest of any user group. They are morelikely to praise Metro rail to their friends and colleagues and be a champion of Metro rail servicethan any other rider segment, even though most of them have other mobility options.
Frequent Bus Patrons (6% of respondents)
Transportation decisions driven by cost, transit-dependency, and close proximity to bus stops.
Likely to live far from rail stations.
Very diverse transit trip purposes: 18-30% of them ride Metro buses three or more times a week forschool, groceries, personal errands, or other non-work trips.
Third highest percentage of total Latino and African American respondents of any group.
Tend to be younger (under 25 years old) or older (over 50 years old) compared to other groups.
Second highest percentage of female respondents of any group.
Lower income. Tied with Savvy Transit Users for lowest percentage of households making over$100,000 per year.
They are more likely to be satisfied with Metro bus service, think their bus is generally on time, andfeel safe while waiting for and riding Metro buses than the Savvy Transit Users. Yet, they are morelikely to be in the middle of the net promoter score spectrum and have a neutral or passive opinionof Metro’s transit service.

9
Frequent Rail Patrons (5% of respondents)
Transportation decisions driven by the fact that Metro rail provides them an opportunity to avoiddriving in traffic.
Likely to live near Metro rail station (59% of respondents in this group live within a 20-minute walkof a station)
Many of them are high frequency users who recently started using Metro rail. More likely to rideExpo and Gold Lines and less likely to use all other rail lines compared to the Savvy Transit Users.
Second highest percentage of white respondents of any group.
One of the top percentages of any group to be of prime working age (age 25-49).
Wealthiest of all groups that ride at least once a week. Most likely to be employed (91%) andemployed full time (75%).
Nearly three times as likely as Savvy Transit Users to have household income of $100,000 or more.
More likely to have neutral or passive opinion regarding Metro rail. They have the lowest Metro railnet promoter score of any group, at 16%, but there is still 16% more promoters than detractors.
Drivers Who Occasionally Ride Rail (8% of respondents)
Transportation decisions driven by trip reliability and a desire to control their work trips and avoidunknown factors, such as traffic levels, transfer wait times, and parking availability.
Concerned with safety, comfort, and knowledge of Metro bus system.
Likely to live far from Metro rail station. They overwhelming feel that Metro rail is too hard to access(e.g., too far from their house, too far from where they want to go, and lacks parking at stations).
Ninety-seven percent of them drive alone at least once a month but only 65% of their total trips aresingle occupancy vehicle trips.
Highest percentage of white respondents of any group.
One of the top percentages of any group to be retired.
Highest percentage of female respondents (59%) of any group.
Wealthiest of all user groups. Fifteen percent more likely than the survey average to have annualhousehold income of more than $100,000 and 21% less likely to make under $40,000.
High Potential Transit Users (20% of respondents)
Transportation decisions driven by convenience, ease of use, and travel speed.
Most feel that Metro rail is fast but very hard to access. Sixty-one percent of them list access as themain reason they do not ride Metro rail.
Most agree that Metro bus is fine in terms of safety and cleanliness. However, 54% of them list longtravel time and slow speed as the main reason they do not ride Metro bus.
Currently ride both Metro bus and rail but use neither service more than once a month.
Fifty-six percent of their total trips around Los Angeles County are done by driving alone; however,this group has a diverse travel profile consisting of:
o 21% walkingo 7% dropped off by friend or family membero 5% using Uber/Lyfto 5% biking
Forty percent of respondents in this group are 50 years or older and 10% of them are retired, bothof which are the highest percentage compared to any other groups.
More likely to be female (56%) than survey average.
Diverse range of household incomes.
Unlikely to hold extreme positive or negative views of transit.

10
Previous Bus/Rail Riders (5% of respondents)
Transportation decisions driven by cost, convenience, and safety.
Feel more strongly about safety compared to other groups.
Large percentage of respondents used to ride for school.
Heavy mode switch to single-occupancy vehicles despite previously being frequent Metro transituser.
Thirty-five percent of people in this segment previously rode Metro rail at least three or more timesa week for school. For 18-24 year old Latinos in this bracket, 91% previously rode three or moretimes a week for school.
Of the white women who stopped riding rail, 23% listed safety as the main reason. This statistic is19% for bus riders. More than half of this group had previously ridden Metro bus and rail five ormore times a week for various lengths of time before leaving the Metro transit system.
Second highest percentage of total Latino and African American respondents and lowest percentageof White respondents of any group.
Most likely to be of prime working age (25-49) compared to other groups. Six percent more likely tobe under 35 years old than survey average.
Common Issues Across User GroupsCommon issues were identified across the different user groups, as described below. Findings from thefocus group research generally corroborated those of the online survey, with the exception ofperceptions around safety, which is further explained below.
Frequency, reliability and total trip time on bus. Thirty-three percent of Savvy Transit Users and 27% ofFrequent Bus Patrons who ride Metro bus one to two days a week indicated that more frequent busservice would encourage them to ride more often, with many preferring 5- or 10-minute frequenciesduring peak hours and 10- or 15-minute frequencies during off-peak hours.
Respondents across many user groups, including High Potential Transit Users, No Hassle Travelers,Drivers Who Occasionally Ride Rail, Frequent Rail Patrons, and Previous Bus/Rail Riders, indicated thatthe primary reason they don’t use Metro bus is because this service takes too long and is too slow. Manyindicated that buses are slowed by automobile traffic, stuck at traffic lights, lack dedicated bus-onlylane, and require too many transfers. The factors listed by respondents are inter-related and affectoverall trip time. The lack of reliability and consistency of service influences their decisions to use othertransportation options rather than taking Metro bus.
Access to/from Metro rail. Sixty-one percent ofHigh Potential Transit Users, 58% of Drivers WhoOccasionally Ride Rail, 67% of Frequent Bus Patrons,and 45% of Previous Bus/Rail Riders stated thataccess to and from Metro rail is difficult, with manyrespondents indicating that rail stations are too faraway from their home or destination. Access to andfrom Metro rail stations were main factors thatinfluence their decision to use other modes oftransportation rather than Metro rail.

11
New Metro rail lines to new places. Thirty-onepercent of Savvy Transit Users, 39% of No HassleTravelers, and 35% of Frequent Rail Patrons whoride one to two days a week indicated that newrail lines to new places would be the primaryreason influencing them to ride more often.
Safety concerns. Respondents to the onlinesurvey, across all user groups, indicated thatsafety on Metro bus and/or rail was a concern.When asked to identify the main reason or topimprovement that they prioritize, manyrespondents ultimately listed other service attributes. Although safety was a concern, it was not themain concern relatively to other factors, according to respondents to the online survey. However, safetyemerged as one of the top issues in the focus group research. Participants in each focus group identifiedsafety as one of their top concerns about Metro rail and buses. Safety, for most participants, meansprotection from other riders. By all indications, participants’ concerns about safety appeared to stemfrom a combination of their personal experiences on Metro rail and bus, and stories about crime passedfrom person-to-person by word of mouth. African American and Latino participants expressedsignificant concerns about racial profiling and discrimination by law enforcement and Metro fare-checking personnel when taking public transportation.
Better information. Respondents expressed preferences for availability, clarity and accuracy ofinformation regarding bus lines, transfers and arrival time per schedule or online apps.
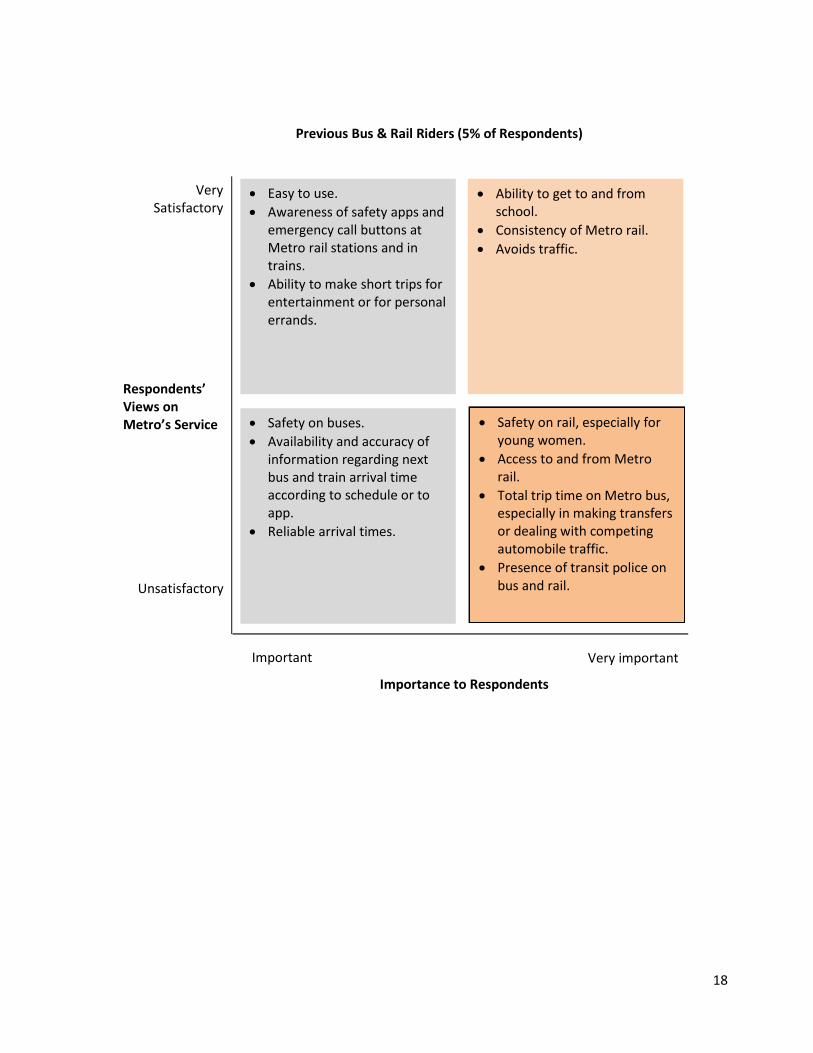
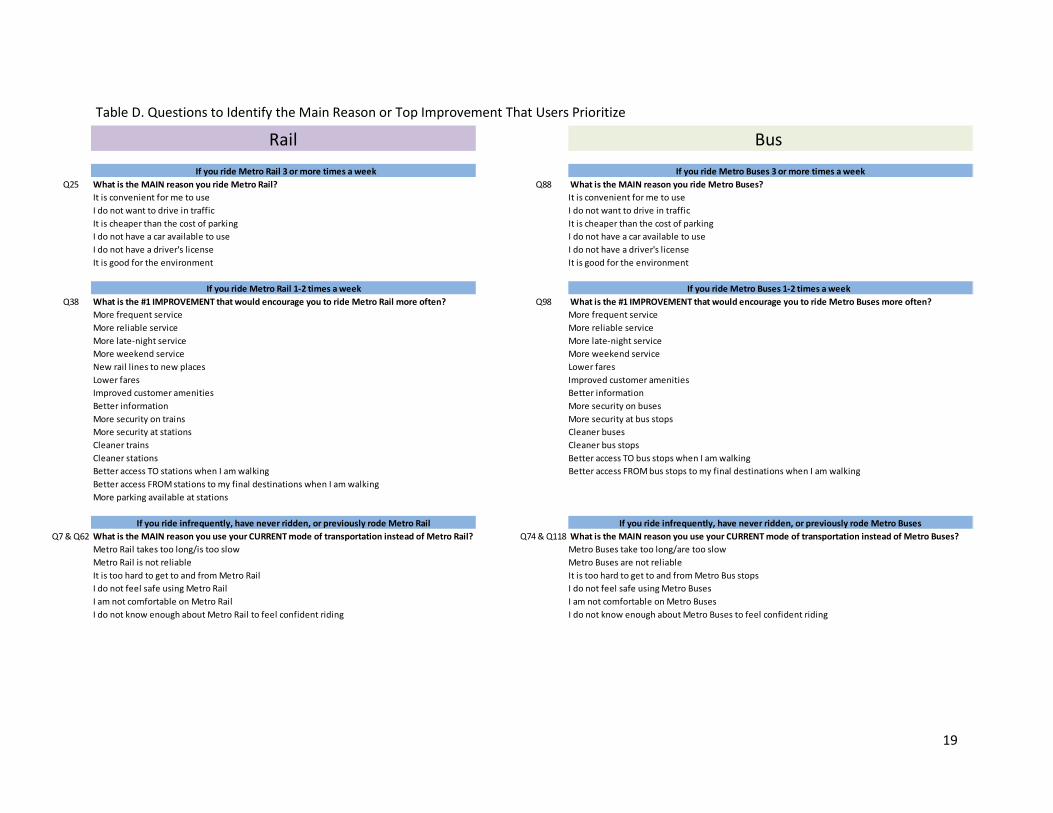
Customer Satisfaction and PrioritiesTable C provides an overview of the respondent’s level of satisfaction with various elements of Metro’stransit services and the level of importance they place on those elements, for each user segment. Theinformation included and its placement on the quadrant in Table C is based on a variety of questionsaimed at assessing the respondent’s level of Metro transit usage, overall perceptions of Metro bus andrail services, and the respondent’s primary concerns regarding those services. Table D provides anoverview of the questions that were asked in the survey to identify the main reason or top improvementthat users prioritize.

12
Table C. Customer Priorities and Level of Satisfaction
Environmental benefit.
Affordable parking.
Convenient flat-rate fare.
Ability to be productive whileriding.
Bus stops are near home.
Ease of use.
Avoids traffic.
Affordable solution forthose who cannot afford acar and driver’s license.
Availability and accuracy ofinformation on next trainarrival time according toschedule or to app.
Fare discounts for low-income riders.
Presence of transit police ontrains and at stations.
Cleanliness of buses and trains.
Availability and accuracy ofinformation regarding nextbus arrival time according toschedule or app.
Metro system goes to placesthat they want to go.
Frequency of bus service.
Frequency of late-nightservice.
Consistency and reliability ofbus headways.
Savvy Transit Users (28% of Respondents)
Very importantImportant
Very Satisfactory
Unsatisfactory
Importance to Respondents
Respondents’Views onMetro’s Service

13
Ability to be productive whileriding.
Environmental benefit.
Access to clear informationabout the Metro system.
Affordability (including theflat-rate fare).
Avoids traffic.
Frequency of service and oflate-night service.
Availability of parking atMetro rail stations.
Metro transit police presenceon trains and at stations.
Availability and accuracy ofinformation regarding nextbus and train arrival timeaccording to schedule or toapp.
Metro rail goes to more placesthat they want to go.
Total trip time by bus
No Hassle Travelers (11% of Respondents)
Very importantImportant
VerySatisfactory
Unsatisfactory
Respondents’Views onMetro’s Service
Importance to Respondents

14
Avoids traffic.
Easy to use.
Distance from Metro busstop to home.
Metro buses go everywherethey want to go.
Affordability.
Clear and accessibleinformation about theMetro system.
Lighting and security camerasat bus stops.
Distance from Metro railstations to home.
Access to ticket vendingmachines (TVMs) and placesto buy fare on TAP. (Mostlikely of all user segments topay with cash fare ratherthan a pass or TAP storedvalue)
Frequent Bus Patrons (6% of Respondents)
Very importantImportant
VerySatisfactory
Unsatisfactory
Respondents’Views onMetro’s Service
Importance to Respondents

15
Affordability of parking. Relief from the stress ofdriving and traffic.
Distance from Metro railstations to home.
Metro rail system isexpanding.
Availability of free parking.
Police presence on Metro busand rail.
Slow speed of Metro buses.
Making transfers to completejourneys.
Clear information about buslines and bus transfers.
Frequent Rail Patrons (5% of Respondents)
Very importantImportant
Very Satisfactory
Unsatisfactory
Respondents’Views onMetro’s Service
Importance to Respondents

16
Affordability of parking. Avoids traffic.
Safety
Cleanliness
Comfort
Getting to and from Metrorail stations.
Total trip time by rail.
Speed of Metro buses.
Making transfers to completejourneys.
Drivers Who Occasionally Ride Rail (8% of Respondents)
Very importantImportant
Very Satisfactory
Unsatisfactory
Respondents’Views onMetro’s Service
Importance to Respondents

17
Safety
Reliability
Cleanliness
Avoids traffic.
Fast speed of Metro rail.
Bus stops are located nearhome and work.
Clear and accessibleinformation about where tomake Metro rail transfers.
Presence of transit police atstations, in trains, and buses.
Availability and accuracy ofinformation on next bus andtrain arrival time according toschedule or to app.
Accurate and reliable signageon buses.
Access to and from Metro railstations.
Total trip time by bus.
Number of bus transfersrequired for a journey.
Clear and accessibleinformation about where tomake Metro bus transfers.
High Potential Transit Users (20% of Respondents)
Very importantImportant
VerySatisfactory
Unsatisfactory
Respondents’Views onMetro’s Service
Importance to Respondents
18
Easy to use.
Awareness of safety apps andemergency call buttons atMetro rail stations and intrains.
Ability to make short trips forentertainment or for personalerrands.
Ability to get to and fromschool.
Consistency of Metro rail.
Avoids traffic.
Safety on buses.
Availability and accuracy ofinformation regarding nextbus and train arrival timeaccording to schedule or toapp.
Reliable arrival times.
Safety on rail, especially foryoung women.
Access to and from Metrorail.
Total trip time on Metro bus,especially in making transfersor dealing with competingautomobile traffic.
Presence of transit police onbus and rail.
Previous Bus & Rail Riders (5% of Respondents)
Very importantImportant
VerySatisfactory
Unsatisfactory
Respondents’Views onMetro’s Service
Importance to Respondents
19
Table D. Questions to Identify the Main Reason or Top Improvement That Users Prioritize
Q25 What is the MAIN reason you ride Metro Rail? Q88 What is the MAIN reason you ride Metro Buses?
It is convenient for me to use It is convenient for me to use
I do not want to drive in traffic I do not want to drive in traffic
It is cheaper than the cost of parking It is cheaper than the cost of parking
I do not have a car available to use I do not have a car available to use
I do not have a driver's license I do not have a driver's license
It is good for the environment It is good for the environment
Q38 What is the #1 IMPROVEMENT that would encourage you to ride Metro Rail more often? Q98 What is the #1 IMPROVEMENT that would encourage you to ride Metro Buses more often?
More frequent service More frequent service
More reliable service More reliable service
More late-night service More late-night service
More weekend service More weekend service
New rail lines to new places Lower fares
Lower fares Improved customer amenities
Improved customer amenities Better information
Better information More security on buses
More security on trains More security at bus stops
More security at stations Cleaner buses
Cleaner trains Cleaner bus stops
Cleaner stations Better access TO bus stops when I am walking
Better access TO stations when I am walking Better access FROM bus stops to my final destinations when I am walking
Better access FROM stations to my final destinations when I am walking
More parking available at stations
Q7 & Q62 What is the MAIN reason you use your CURRENT mode of transportation instead of Metro Rail? Q74 & Q118 What is the MAIN reason you use your CURRENT mode of transportation instead of Metro Buses?
Metro Rail takes too long/is too slow Metro Buses take too long/are too slow
Metro Rail is not reliable Metro Buses are not reliable
It is too hard to get to and from Metro Rail It is too hard to get to and from Metro Bus stops
I do not feel safe using Metro Rail I do not feel safe using Metro Buses
I am not comfortable on Metro Rail I am not comfortable on Metro Buses
I do not know enough about Metro Rail to feel confident riding I do not know enough about Metro Buses to feel confident riding
If you ride infrequently, have never ridden, or previously rode Metro BusesIf you ride infrequently, have never ridden, or previously rode Metro Rail
Rail Bus
If you ride Metro Buses 3 or more times a weekIf you ride Metro Rail 3 or more times a week
If you ride Metro Rail 1-2 times a week If you ride Metro Buses 1-2 times a week

20
SUMMARY AND RECOMMENDATIONS
Metro has the opportunity to leverage its suite of services to provide an outstanding complete tripexperience. The agency operates numerous services designed to provide customers with a plethora ofmobility options, including the use of buses, trains, regional bike share, and ExpressLanes, among otherservices. Based on people’s attitudes about public transportation, key factors that influence theirtransportation choices, and demographic characteristics, Metro can tailor and match its suite of services tomeet the needs and preferences of different segments of the market. Below are recommendations basedon the findings from the online survey and focus group research.
Improve Metro bus service to attract and promote more usage (frequency, reliability, travel time,transfers, information). Improvements to Metro’s bus services, including enhancements to frequency,reliability, and travel time, as well as more accurate information, may enable Metro to further attract andpromote more frequent usage. Despite respondents’ proximity to bus services, many people did not feelthat this was a viable form of transportation for them. Many expressed concerns that buses were too slowand took too long to get them where they wanted to go. Many respondents attributed this issue to busesoperating on congested streets, being stuck at traffic lights, and lacking dedicated lanes that wouldprioritize bus travel. In addition, respondents were concerned about the need to make multiple transfers,which may further affect reliability, since wait time between transfers can contribute to uncertainty of thetransit connections and add to the overall trip time for completing the journey.
This survey result can help Metro better understand the priorities of its customers in terms of what type ofservice performance and outcome they expect and identify strategies to deliver a world-class bus systemthat is effective, reliable and desirable for more people, for more trips. The results of this survey will informthe Metro Strategic Plan, which will identify key initiatives to further achieve this outcome and complementMetro’s existing work, such as the NextGen Bus Study.
Improve access and connectivity across the suite of mobility services to provide better choices for all usergroups. Metro has an opportunity to improve the trip taking experience along the customer’s entirejourney, recognizing that multiple entities are involved in various aspects of that journey. A number ofrespondents indicated that access to and from Metro rail stations posed challenges to using rail service.More detailed assessments may be necessary to identify the specific challenges experienced by each usergroup in order to identify the applicable solutions. Metro’s first last mile planning work generally looks at a3-mile bike shed and one half-mile walk shed for infrastructure improvements to access transit; however,more research may be necessary to understand the types of challenges that customers face, including thedistance they must travel to access the transit network, the integration and coordination of mobilityservices (e.g., rail and bus connections and intermodal transfers), and the quality of transportationinfrastructure, which may help or hinder access. The emergence of on-demand rideshare services andmicro-transit service models provides additional opportunities for Metro to enhance access to transit andpilot new mobility services that meet the needs of public transit customers. In addition, improvements toaccess, connectivity, and integration across the entire transportation network will be critical to provideseamless travel, whether people choose to walk, bike, take transit, use rideshare services, or drive. Metrohas an opportunity to leverage its resources and influence to encourage public and private sector partnersto be part of the solution to improve connectivity and integration of infrastructure (e.g., sidewalks,bikeways, transit facilities, highways, roadways, etc) and mobility services (e.g., rail service, bus service,bike share, Express Lanes, rideshare service, etc) to provide better choices for all user groups.

21
Enhance Safety. A majority of the participants in the focus groups indicated that greater police presenceand security cameras would increase their sense of safety. In 2017, Metro established a new securitycontract to put more police on Metro buses and trains. The agency is also working with social serviceagencies to get help for people who are on the Metro system and require support services. However,African American participants, and some Latino participants, raised substantial concerns about racialprofiling and discrimination by police and fare inspectors. As Metro continues to identify ways to addresssafety and security for all users on the system, it is important that the agency be mindful of the concerns ofAfrican American and Latino users.
Expand Metro’s ExpressLane Services. Travel time uncertainty is a significant factor in the decisions thatpeople make regarding which modes to use for their transportation needs. ExpressLanes provide an optionto mitigate uncertainties for those who choose to drive. This service is appealing to respondents who desireto control their work trips and avoid unknown factors. ExpressLanes currently operate on I-110 and I-10,but expansion of this program can provide solo drivers with more options for a reliable trip experience aswell as improve highway flow for other users.

22
ACKNOWLEDGMENTS
Los Angeles County Metropolitan Transportation AuthorityJoshua SchankNadine LeeTham Nguyen (Project Manager)Matthew Kridler (Lead Researcher)Jeffrey BobergEileen Hsu
2017 Customer Satisfaction Focus Group Research conducted by:Evitarus, Inc. (Prime Contractor)Kandi Reyes & Associates (Subcontractor)361 Degrees Consulting (Subcontractor)
23
REFERENCE
BBC Research & Consulting (2014). 2014 RTD Segmentation Study.
LA Metro (2016). Customer Satisfaction Survey.
Perk, V., Flynn, J., Volinski, J. (2008). Transit Ridership, Reliability, and Retention. National Center for TransitResearch, Center for Urban Transportation Research.
Transit Center (2016). Who’s On Board 2016: What Today’s Riders Teach Us About Transit That Works.
Transit Center (2016). Who’s On Board 2016: What Today’s Riders Teach Us About Transit That Works.Rider Survey.

24
APPENDICES
Appendices can be accessed online:http://libraryarchives.metro.net/DB_Attachments/180103_Attachment%20C_Appendices.pdf
Appendix A – Complete list of survey questionsAppendix B – Outline of the skip logic feature and sequencing of questionsAppendix C – 2017 Customer Satisfaction Focus Groups, Final ReportAppendix D – Overview of the questions and responses used to categorize these user segmentsAppendix E – Detailed Summary of Demographic Makeup of Respondents by User Segment

Appendix B: Summary of Outreach - List of Stakeholders who Participated in
Meeting / Interview
External Stakeholders & Interviewees
Access Services: Andre Colaiace, Executive Director
Alliance for Community Transit: Laura Raymond
Brian Taylor, Professor of Urban Planning, University of California, Los Angeles, Luskin Schoolof Public Affairs; Director, Lewis Center for Regional Policy Studies; Director, Institute ofTransportation Studies; OEI Advisory Board Member
California Department of Transportation (Caltrans): Kome Ajise, Chief Deputy Director; OEIAdvisory Board Member
Council of Governments: Gateway Cities COG Board Meeting
Daniel Sperling, Professor of Civil and Environmental Science and Policy, University ofCalifornia, Davis; Director of Institute of Transportation Studies; OEI Advisory Board Member
David Ulin, Professor of the Practice of English at University of Southern California and authorof Sidewalking
Ethan Elkind, Director, Climate Change and Business Program, University of California (UC),Los Angeles & UC Berkeley School Law; OEI Advisory Board Member
Faith Leaders Breakfast
Gil Penalosa, Founder & Board Chair of 8 80 Cities, Chair of World Urban Parks, Gil Penalosa& Assoc.; Ryan O'Connor, interim ED at 8 80 Cities; Amanda O'Rourke, Senior Advisor, GilPenalosa & Associates
Hilary Norton, Executive Director, Fixing Angelenos Stuck in Traffic (FAST); OEI AdvisoryBoard Member
Investing in Place: Jessica Meaney, Executive Director
Jeremy B Dann, Lecturer in Entrepreneurship and Director, University of Southern California,Case Program; OEI Advisory Board Member
Karen Philbrick, Mineta Transportation Institute; OEI Advisory Board Member
Kim Kawada, Chief Deputy Executive Director, San Diego Association of Governments; OEIAdvisory Board Member
LA-Mas: Helen Leung, Co-Executive Director
Los Angeles County Bicycle Coalition: Tamika Butler, Executive Director
Los Angeles County Department of Public Health, Policies for Livable, Active Communities andEnvironments (PLACE) Program: Jean Armbruster, Director; Chanda Singh, Policy Analyst
Los Angeles Tourism & Convention Board: Adam Burke, Chief Administrative Officer; PattiMacJennett, Senior Vice President, Business Affairs
Mark Kroncke, Partner, Invoke Technologies; OEI Advisory Board Member
Martin (Marty) Wachs, Distinguished Professor Emeritus of Urban Planning, University ofCalifornia, Los Angeles, Luskin School of Public Affairs; OEI Advisory Board Member
Metro Accessibility Advisory Committee
Metro Chief Executive Officer and Subregional Executive Directors' Meeting
Metro Service Council: Quarterly Meet & Confer
Metro Technical Advisory Committee
Metro Technical Advisory Committee: Bus Operations Subcommittee
Metro Technical Advisory Committee: Local Transit System Subcommittee
Metro Technical Advisory Committee: Streets & Freeway Subcommittee
Move LA: Denny Zane, Executive Director
Multicultural Communities for Mobility: Anisha Hingorani, Program and Policy Manager
Natural Resources Defense Council: Amanda Eakin, Director, Transportation and Climate
1

Appendix B: Summary of Outreach - List of Stakeholders who Participated in
Meeting / Interview
External Stakeholders & Interviewees (Continued)
Office of Extraordinary Innovation (OEI) Advisory Board
Paul Curcio, Urban Studies and Planning Lecturer, University of California, San Diego, UrbanStudies and Planning; Miralto; OEI Advisory Board Member
Peter Marx, Executive Director, GE Digital; University of California, Los Angeles, Lewis Centerand USC Annenberg Innovation Lab; OEI Advisory Board Member
Southern California Association of Governments: Hasan Ikhrata, Executive Director; OEIAdvisory Board Member
Ratna Amin, Transportation Policy Director, San Francisco Bay Area Planning and UrbanResearch (SPUR); OEI Advisory Board Member
Richard Willson, Professor of Urban and Regional Planning, Cal Poly Pomona; OEI AdvisoryBoard Member
Susan Shaheen, University of California, Berkeley, Transportation Sustainability ResearchCenter; OEI Advisory Board Member
Rani Narula-Woods, Shared-Use Mobility Center; OEI Advisory Board Member
Port of Long Beach: Allison Yoh, Director of Transportation Planning
Port of Los Angeles: Kerry Cartwright, Director of Goods Movement
Rick Cole, City Manager of City of Santa Monica
Seleta Reynolds, General Manager, Los Angeles Department of Transportation
Southern California Regional Rail Authority: Anne Louise Rice, Assistant Director
Sudipto Aich, Ford Smart Mobility
Trust South LA: Sandra McNeill
Yonah Freemark, Urbanist & Journalist
Metro Board Members & Deputies (Note: Ongoing Board Staff meetings are not
listed below)Director Carrie Bowen
Director Eric Garcetti
Director Jacquelyn Dupont-Walker
Director Janice Hahn
Director John Fasana
Director Mark Ridley-Thomas
Director Robert Garcia
Director Sheila Kuehl
Metro Board Deputies: Javier Hernandez & Waqas Rehman (On behalf of Director Hilda Solis)
Internal Metro Stakeholders
Board Secretary's Office: Michele Jackson, Christina Goins, Collete Langston, Deanna Phillips
Chief Policy Office: Elba Higueros, Jonathan Adame, Claudia Galicia, Aaron Johnson
Civil Rights & Equal Employment Opportunity Team: Dan Levy, Jess Segovia, JonauraWisdom
Communication, Community Relations Team
Communication, Marketing: Glen Becerra, John Gordon, Lan-Chi Lam, Michael Lejeune,Bernadette Mindiola
2

Appendix B: Summary of Outreach - List of Stakeholders who Participated in
Meeting / Interview
Internal Metro Stakeholders (Continued)
Communication, Public Relations: Joni Goheen, Aurea Adao, Ana Chen, Luis Enzunza, SteveHymon, Rick Jager, Dave Sotero, Jose Ubaldo
Communications Team: Pauletta Tonilas, Glen Becerra, Joni Goheen, Gail Harvey, Ron Jue,Ann Kerman, Jackie Lopez, Vanessa Smith, Michael Turner
Communications, Government Relations: Michael Turner,Raffi Hamparian, Marisa Yeager,Crystall Martell
Communications, Marketing: Glen Becerra, Devon Demining, John Gordon, Lan-Chi Lam,Michael Lejeune, Kevin Pollard
Communications: Pauletta Tonilas, Yvette Rapose, Jodi Litvak, John Gordon
Congestion Reduction Team
Countywide Planning & Development, Active Transportation Team: Laura Cornejo, RobertMachuca, Jackie Su, Brett Thomas, Julia Salinas, Henry Phipps, Jingyi Fan, Alice Tolar, LiaYim, Tony Jusay
Countywide Planning & Development, Goods Movement: Michael Cano, Akiko Yamagami
Countywide Planning & Development, Long/Short Range Planning: Brad McAllester, HeatherHills, Mark Yamarone, Rena Lum
Countywide Planning & Development, Regional Grants Management Team: Frank Flores,Cosette Stark, James Allen, Diego Ramirez, Vanessa Ward, Ann Flores, Kathy Banh, EmmaNogales, Vincent Lorenzo, Nathan Maddox
Countywide Planning & Development, Shared Mobility Team staff meeting: Dolores Roybal-Saltarelli, Valerie Rader, Neha Chawla, Aaron Voorhees, Kevin Holliday, Jenny Cristales-Cevallos
Countywide Planning & Development, Strategic Financial Planning & Programming: WilRidder, Kalieh Honish, Mark Linsenmayer, Herman Cheng, Patricia Chen, Gloria Anderson
Countywide Planning & Development, Sustainability: Diego Cardoso, Jacob Lieb, KatieLemmon
Countywide Planning & Development, System Analysis/Research: Chaushie Chu, Falan Guan,Paul Burke, Ying Zhu
Countywide Planning & Development, Systemwide Planning: Adam Light, Georgia Sheridan,Cory Zelmer, Rachelle Andrews
Countywide Planning & Development, Transit Corridors and Subregional Planning StaffMeeting: Renee Berlin, Fanny Pan, Adam Light, Eugene Kim, Martha Butler, Veronica Guzman
Countywide Planning & Development, Transit Oriented Community/Joint Development/Strategic Initiatives/Parking: Jenna Hornstock, Adela Felix, Well Lawson, Frank Ching, NickSaponara, Greg Angelo, Elizabeth Carvajal
Human Capital & Development: Joanne Peterson, Dan Dzyacky, Carmen Mayor, Don Howey,Steve Espinoza, Patrice McElroy, Avis Gibson, Steve Jaffe
Human Capital & Development, Employee & Labor Relations: Steve Espinoza, Tara Butler,Brendan Adams, Sharde Jackson, Rachael Aguirre, Gabriela De Leon, KimberleeVandenakker, Esther Reed, Robert Chavez, Judith Baxter
Human Capital & Development, Employee & Labor Relations, Administration: Ashley Martin,Cathy Zhu, Shuyen Lin, Melinda Perrier, Imelda Hernandez, Arnel Abeleda, Flor Anaya
3

Appendix B: Summary of Outreach - List of Stakeholders who Participated in
Meeting / Interview
Internal Metro Stakeholders (Continued)
Program Management, Environmental Compliance and Sustainability staff meeting:Emmanuel (Cris) Liban, Alex Cantwell, Heather Severin, Ryan Honda, Dan Rob, AlvinKusumoto, Dilara Rodriguez, Erika Wilder, Evan Rosenberg, Jesus Villanueva, Kingsley,Shannon Walker, Tom Kefalas, Kyle Lefton, Andrew Quinn, Cody Bricks
Program Management, Highways Program Staff Meeting
Human Capital & Development, Talent Acquisition Team
Information Technology Services: Dave Edwards, Joe Giba, Bill Balter, Matt Barrett, DougAnderson, Vincent Tee, Pat Astredo
Management Audit Services Team
Matt Barrett, Manager, Policy Research and Library Services
Office of Management & Budget Team: Nalini Ahuja, David Sutton, Kelly Hines, ConanCheung, Michelle Navarro, Gwen, Giovanna Gogreve, Tina Marquez, Jesse Soto, Perry Blake,Drew Phillips
Office of Management & Budget, TAP: Robin O'Hara
Operations & Maintenance Team: Jim Gallagher, Diane Corral-Lopez, Jesse Montes, AlexDiNuzzo, John Hillmer, Bob Holland, Dan Nguyen, Frank Alejandro, Bob Spadafora, BernardJackson, Conan Cheung, Jesse Montes, Bob Holland, Errol Taylor, Michael Ornelas, NancySaravia, Julio Rodriguez
Operations, Mainenance, Non-Revenue: Daniel Ramirez
Operations, Bus Maintenance Team
Operations, Rail Fleet Services: Bob Spadafora, Russell Homan, Fred, Ted, Michael, Arnold,Rick
Operations, Service Development, Service Planning & Scheduling, Regional Service Council:Jon Hillmer, Dan Nguyen, Gary Spivack, Scott Page
Operations, South Bay Division 18
Operations: Division 5 RAP Session
Program Management: Abdollah Ansari, Gary Baker, Dennis Mori, Brian Pennington, TimLindholm, Rick Meade, Rick Clark, Cris Liban, Charles Beauvoir, Brian Boudreau, SamMayman, Pauline Lee
Program Management, Program Control: Brian Boudreau, Julie Owen, Amy Wang, SalChavez, Paul Briggs, Ferri Ahmadi, Julie Lansford, Richard Mora, Brittany Zhuang, Dennis
Program Management: Westside Purple Line Project Managers - Dennis Mori and MichaelMcKenna
Risk Management, Emergency & Homeland Security Preparation: Greg Kildare, Richard,Denise Longley, Juanita (Nita) Welch, Raymond (Ray) Lopez, Dennis, Tim Rosevear, EdwardBagosian, Vijay Khawani
Senior Leadership Team: Alex Wiggins, System Security and Law Enforcement; Dan Levy,Office of Civil Rights; Dave Edwards, ITS; Debra Avila, Vendor Contract Management; DianaEstrada, Management Audit; Elba Higueros, Board Relations, Policy & Research; Greg Kildare,Risk, Safety, and Asset Management; Jim Gallagher, Operations; Joanne Peterson, HumanCapital & Development; Joshua Schank, Office of Extraordinary Innovation; Karen Gorma,Inspector General; Nalini Ahuja, Office of Management & Budget; Pauletta Tonilas,Communications; Phillip Washington, Chief Executive Officer; Richard Clarke, ProgramManagement; Stephanie Wiggins, Deputy Chief Executive Officer; Therese McMillan,Countywide Planning & Development
4

Appendix B: Summary of Outreach - List of Stakeholders who Participated in
Meeting / Interview
Internal Metro Stakeholders (Continued)
System Security & Law Enforcement Staff Meeting: Alex Wiggins, Judy Romero, Tinh Quach,Barry Aboltin, Cathie Banuelos, Rivers Jacques, Shawn Khodadadi, Vache Minasyan, GustavoOrtega, Sanda Solis, Helen Valenzuela, Brandon Wong, Mario Zamorano
Vendor/Contract Management: Debra Avila, Ivan Page, Michael Gonzalez, Selena Landero,Carolina Coppolo, Andrea Arias, Miguel Cabral
5

Metro
Board Report
Los Angeles CountyMetropolitan Transportation
AuthorityOne Gateway Plaza
3rd Floor Board RoomLos Angeles, CA
File #:2017-0912, File Type:Policy Agenda Number:33.
REVISEDEXECUTIVE MANAGEMENT COMMITTEE
FEBRUARY 15, 2018
SUBJECT: METRO EQUITY PLATFORM FRAMEWORK
ACTION: RECEIVE AND FILE APPROVE METRO EQUITY PLATFORM FRAMEWORK
RECOMMENDATION
APPROVE Metro’s Equity Platform Framework.
ISSUEAccess to opportunity should be a core objective of public decision making, public investment, andpublic service - and transportation is an essential lever to enabling that access. Unfortunately, thereexists vast disparity among neighborhoods and individuals in Los Angeles County in their ability tosee and seize opportunity - be it jobs, housing, education, health, safety or other essential facets ofthriving in vibrant, diverse communities. A multi-point equity platform provides a basis for Metro toactively lead and partner in addressing and overcoming those disparities.
Metro staff does not approach the subject of equity lightly or uninformed. The adoption of Measure Mincluded performance metrics that were tied to disadvantaged communities. The major revision to theLong Range Transportation Plan has committed to incorporating equity as a crosscutting issue sinceits introduction to the Board in February 2017. The Policy Advisory Council has flagged this as amajor topic of interest. Most importantly, recent and engaged experience with community memberswith several projects (i.e., First/Last Mile planning, the Transformative Climate Communities grant forRail to Rail, and a body of innovative workforce development initiatives) all underscore both thetimeliness and urgency that equity considerations bring to Metro’s portfolio. In addition, staffinformally reached out to representatives from academia, foundations, advocacy organizations andlocal government in developing this platform. Their demonstrated experience in research andcollective action, and their candid feedback on challenges and opportunities in the equity space wereinvaluable.
DISCUSSIONMetro’s multi-point equity platform is wrapped around four pillars.
First, we need to define a common basis for talking about and building an agenda around equity, andhow to improve it.
- Equity holds different perspectives and priorities for everyone and anyone who will be part of
Metro Printed on 2/16/2018Page 1 of 6
powered by Legistar™
Appendix C: Equity Platform Framework

File #:2017-0912, File Type:Policy Agenda Number:33.
this conversation.
- At its core, inequity exists when there are fundamental differences in access to opportunity, notjust with respect to where you begin, but in your capacity to improve from that starting position.
- Historically and currently, race and class have largely defined where these disparities are mostconcentrated: in poor, minority communities throughout LA County. Age, gender, disability, andresidency also can expand or constrain opportunities.
- It would be presumptuous to begin a truly inclusive conversation with a pre-determineddefinition of “equity” and all its facets, but Metro can enter into that conversation committing tothe following:
· Establish meaningful goals around a shared definition of equity and actions to achievethose goals.
· Define metrics to evaluate outcomes and consider redirected actions if needed. It willbe particularly critical to infuse equity-based performance metrics in Metro’s investmentdecisions. These cannot be the only investment considerations. Transportation is rifewith tradeoffs. But equity metrics need to be definable, impactful, measurable,accountable, and at the front end of the analysis, not the back end.
· Seek and invite the diverse range of voices that must participate with Metro inaccomplishing the above. Importantly, we need to proactively reach out to those whohave remained on the margins of decision-making in the past. These will includehistorically underserved communities and organizations that represent them. But wemust also reach out and hear voices that may not be aligned with established groups.
Second, Metro needs to establish comprehensive, multiple forums to engage the communitymeaningfully and actively in pursuit of the first step discussed above. An important openingconversation with LA’s community members would address: a) where they believe achieving equityhas been problematic - broadly, and specific to transportation’s role; and b) where improvedrelationships, partnerships and actions aligned with Metro’s portfolio of responsibility can be definedto advance more equitable transportation outcomes going forward.
- This will be a challenging conversation, insofar as it requires the Metro as Board and staff toinvite the community to articulate where it has experienced, in fact deeply felt, inequity inMetro’s past. This isn’t a platform for Metro to defend or be defensive; people feel what theyfeel, and it is going to be impossible to define a new path and build a different position of trustif past experience is not given voice and legitimacy.
- That said, the main point of this conversation forum should be to learn and move forwardbased on that acknowledgement. This may require reconciling divergent opinions to arrive atsome shared goals and actions. Actions going forward may redress past ills - that is to bedetermined - but they certainly should not repeat them, if at all possible. It is also anopportunity to discuss with community members those initiatives where Metro has activelytackled disparity gaps, such as its growing portfolio of workforce development initiatives.
- Advice and best practices on how to effectively have these community-driven conversations
Metro Printed on 2/16/2018Page 2 of 6
powered by Legistar™

File #:2017-0912, File Type:Policy Agenda Number:33.
will be key.
· Metro can start with lessons learned from other cities across the country. SanFrancisco, Seattle, Oakland and others all have models to tap.
· These forums would benefit from professional facilitation. Foundations have establishedseveral venues that Metro might pivot from (e.g. the on-going national Strong,Prosperous and Resilient Communities Challenge (SPARCC) Initiative includes LosAngeles as a participating city - LA Thrives coalition is the local lead; the CaliforniaEndowment and others have underwritten numerous initiatives across the County); orseek new support.
- As noted at the outset, Metro consulted with equity thought leaders whose advice informed thecore of this platform. Retaining this cross-sectional consultation will be critical to successfullyimplementing a platform that requires dedication and time. In particular, the community forumsenvisioned will benefit from a circle of demonstrated leaders. We certainly don’t hold all thekeys on issues, and making use of the rich resources around us is essential.
· A key step will be to establish a formal or informal advisory group supporting the equityplatform, and to incorporate, as appropriate, the equity agenda into existing advisorygroups.
- In addition, the following initiatives are also suggested:
· Actively develop and invest in a Community Based Organization (CBO) oriented publicengagement program. This approach may not be applicable to every Metro investment,program or activity located in, or otherwise impacting, LA County’s historicallyunderinvested (HU) communities. As stated above, we must be mindful that any singlegroup does not represent all voices in every community. However, this approach shouldbe added to and implemented as part of our public process, if we are going to establishand maintain legitimacy within impacted communities when addressing equity issuesthat they themselves are experiencing directly.
· Invest in the transportation technical capacity of local governments that serve HUcommunities. Metro cannot and should not be the sole partner in all transportation ortransportation-impacted decisions, legally or practically. And traditional funding andregulatory programs in particular assume effective participation by local jurisdictions. Inshort, strengthening cities that are home to equity communities is probably a corerequirement for a more equitable County. This assistance can range from deliveringtransportation improvements swiftly and effectively to competing for discretionaryfunding more successfully; to better supporting more community-inclusive decision-making around transport investments.
Third, the Long Range Transportation Plan (LRTP) must have a concentrated focus on equity. Thereare two major arenas for that focus to take root.
Where Metro Leads
- First and foremost, we must tackle impacts of the LA County’s transportation system under our
Metro Printed on 2/16/2018Page 3 of 6
powered by Legistar™

File #:2017-0912, File Type:Policy Agenda Number:33.
direct responsibility via Metro’s role as transportation planner, operator, builder and funder. Assuch, equity is a “cross cutting” principle that will be applied throughout the LRTP’sdevelopment, as reported to the Board in prior presentation’s on the Plan’s design and rollout.
- Critically, what we choose - or do not choose - to invest in that system is paramount. Over the40-year span of the LRTP, a considerable amount of funding controlled by Metro is legally orlegislatively dictated, such as Measure M. It should be noted that equity related factors wereconsidered as part of the 5 performance measures developed to assess and prioritizeMeasure M’s expenditure plan projects. Specifically, the “Economy” and “Sustainability/Qualityof Life” themes included metrics attached to investments in disadvantaged communities. Butwhile there are important additional equity considerations Metro can assess as projects areimplemented, there are practical limitations to rethinking or redirecting certain funds that arestatutorily prescribed.
However, a significant amount of funding in the long range plan is not yet locked down for 40years, allowing us to reassess current patterns of investment and either reaffirm them orchange them.
- These investment decisions should be based on performance outcomes and, as presentedhere, front and center considerations should be given to those that actively:
· advance outcomes that promote and sustain opportunities in underserved communities;or
· avoid outcomes that lead to or aggravate disparities in opportunity in thosecommunities.
- Notably, investments must be made to operate, maintain and rebuild the existingtransportation system, in addition to expanding it. The community’s ability to access thattransportation system - where, when, how, and at what cost - impacts their opportunities tojobs, housing, education and health. Thus, measuring equity against that access, and forwhom, is central to our planning process.
· In this realm, there will be several, discrete transportation activities that will bedeveloped alongside the LRTP where equity will be front and center: any discussion of“right sizing” fares, redesign of the Metro bus system, our continuing work in WorkForce Development and small business support, to name a few.
· The Long Range Transportation Plan will not duplicate analysis and recommendationsin these areas. It will incorporate goals, decisions, and any actions attached to all ofthem, and will likely help facilitate equity-driven discussions in each of them.
· These issues address critical transportation access concerns, and will be importantvenues for coordinating community involvement.
Where Metro Partners
- Beyond its core transportation responsibilities, there will be an expectation to take on a new,countywide, visible equity challenge: the Metro transport system’s interface withgentrification/displacement/affordable housing.
Metro Printed on 2/16/2018Page 4 of 6
powered by Legistar™

File #:2017-0912, File Type:Policy Agenda Number:33.
- Neighborhoods throughout the county are facing escalating housing costs, real estatedevelopments that are reshaping community culture, and in both cases, frequently forcingexisting residents into painful relocation or transportation decisions.Gentrification/displacement/affordable housing is a common thread of concern among electedofficials and advocates. And it hits every corner of the County.
- Metro cannot address this subject by ourselves - it will require active partnerships with others,such as the County, cities, Council of Governments, private sector and business as well ascommunity representatives. Foundations are extremely interested in this arena and couldbring valuable resources to the table.
- Among other considerations, these issues underscore the complexity of equity concerns andthe necessarily complex response to them. By taking up a big problem - but not Metro’sproblem alone - it gives us the space to explore, experiment and advance change whilebuilding necessary partnerships at the outset.
Fourth, we need to pursue equity training within Metro. Successfully setting and delivering on a newequity agenda requires “top to bottom” ownership throughout the agency.
- In recent years, there has been a growing body of equity training designed for governmentalagencies. LA County departments have deployed these programs, among others. We intendto explore options and commit to internal education that would be required at certain levelsand positions.
- Training would be in two important areas:
· Methods to evaluate equity including data collection, measurement and analysis; and
· Approaches to effectively communicate and work with communities in a manner thatrecognizes and respects equity issues.
This platform is a starting point, and should be considered a working outline that can be adjusted withexperience and feedback. The commitment expressed herein, however, should be a guiding constant- for Metro, our transportation partnerships, and the people we serve.
NEXT STEPSStaff will proceed to use the Equity Platform as a framework for specific analyses and actionsattached to Metro initiatives, as outlined in this report. Progress will be reported periodically to theBoard, particularly as it relates to key plans and programs underway, such as the Long RangeTransportation Plan.
Prepared by: Therese W. McMillan, Chief Planning Officer, (213) 922-7077
Reviewed by: Phillip A. Washington, Chief Executive Officer, (213) 922-7555
Metro Printed on 2/16/2018Page 5 of 6
powered by Legistar™

File #:2017-0912, File Type:Policy Agenda Number:33.
Metro Printed on 2/16/2018Page 6 of 6
powered by Legistar™