Embed Size (px)
Citation preview
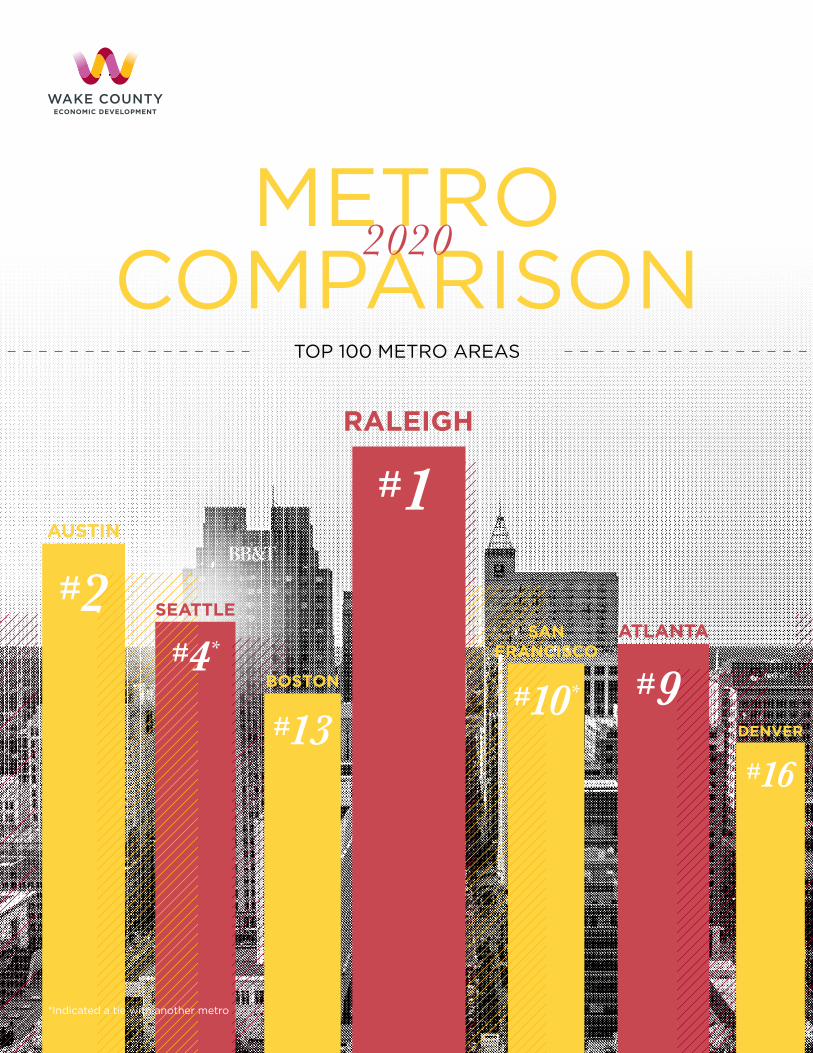
METRO COMPARISON
2020
#1
TOP 100 METRO AREAS
RALEIGH
#10*
SAN FRANCISCO#4*
SEATTLE
#9ATLANTA
#13#16
BOSTON
DENVER
#2AUSTIN
*Indicated a tie with another metro
INTRO
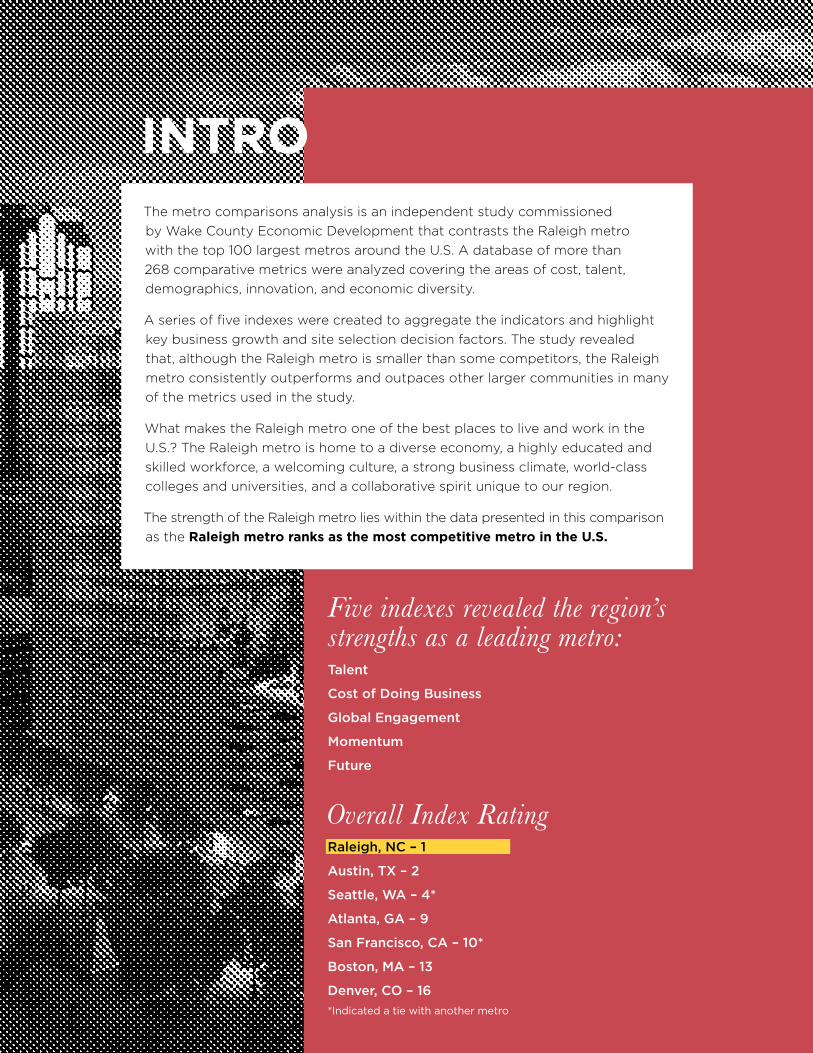
Overall Index Rating Raleigh, NC – 1
Austin, TX – 2
Seattle, WA – 4*
Atlanta, GA – 9
San Francisco, CA – 10*
Boston, MA – 13
Denver, CO – 16
*Indicated a tie with another metro
Talent
Cost of Doing Business
Global Engagement
Momentum
Future
Five indexes revealed the region’s strengths as a leading metro:
The metro comparisons analysis is an independent study commissioned
by Wake County Economic Development that contrasts the Raleigh metro
with the top 100 largest metros around the U.S. A database of more than
268 comparative metrics were analyzed covering the areas of cost, talent,
demographics, innovation, and economic diversity.
A series of five indexes were created to aggregate the indicators and highlight
key business growth and site selection decision factors. The study revealed
that, although the Raleigh metro is smaller than some competitors, the Raleigh
metro consistently outperforms and outpaces other larger communities in many
of the metrics used in the study.
What makes the Raleigh metro one of the best places to live and work in the
U.S.? The Raleigh metro is home to a diverse economy, a highly educated and
skilled workforce, a welcoming culture, a strong business climate, world-class
colleges and universities, and a collaborative spirit unique to our region.
The strength of the Raleigh metro lies within the data presented in this comparison
as the Raleigh metro ranks as the most competitive metro in the U.S.
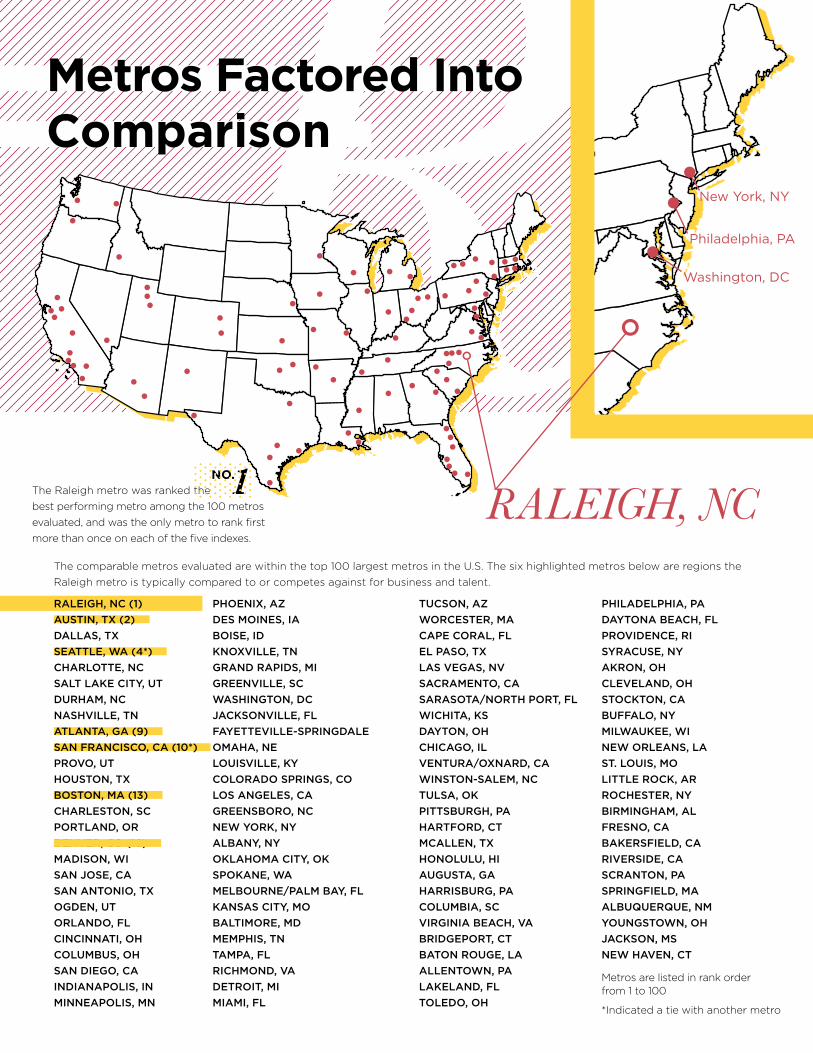
Metros Factored Into Comparison
The comparable metros evaluated are within the top 100 largest metros in the U.S. The six highlighted metros below are regions the
Raleigh metro is typically compared to or competes against for business and talent.
The Raleigh metro was ranked the
NO.1
best performing metro among the 100 metros
evaluated, and was the only metro to rank first
more than once on each of the five indexes.
RALEIGH, NC (1)
AUSTIN, TX (2)
DALLAS, TX
SEATTLE, WA (4*)
CHARLOTTE, NC
SALT LAKE CITY, UT
DURHAM, NC
NASHVILLE, TN
ATLANTA, GA (9)
SAN FRANCISCO, CA (10*)
PROVO, UT
HOUSTON, TX
BOSTON, MA (13)
CHARLESTON, SC
PORTLAND, OR
DENVER, CO (16)
MADISON, WI
SAN JOSE, CA
SAN ANTONIO, TX
OGDEN, UT
ORLANDO, FL
CINCINNATI, OH
COLUMBUS, OH
SAN DIEGO, CA
INDIANAPOLIS, IN
MINNEAPOLIS, MN
PHOENIX, AZ
DES MOINES, IA
BOISE, ID
KNOXVILLE, TN
GRAND RAPIDS, MI
GREENVILLE, SC
WASHINGTON, DC
JACKSONVILLE, FL
FAYETTEVILLE-SPRINGDALE
OMAHA, NE
LOUISVILLE, KY
COLORADO SPRINGS, CO
LOS ANGELES, CA
GREENSBORO, NC
NEW YORK, NY
ALBANY, NY
OKLAHOMA CITY, OK
SPOKANE, WA
MELBOURNE/PALM BAY, FL
KANSAS CITY, MO
BALTIMORE, MD
MEMPHIS, TN
TAMPA, FL
RICHMOND, VA
DETROIT, MI
MIAMI, FL
TUCSON, AZ
WORCESTER, MA
CAPE CORAL, FL
EL PASO, TX
LAS VEGAS, NV
SACRAMENTO, CA
SARASOTA/NORTH PORT, FL
WICHITA, KS
DAYTON, OH
CHICAGO, IL
VENTURA/OXNARD, CA
WINSTON-SALEM, NC
TULSA, OK
PITTSBURGH, PA
HARTFORD, CT
MCALLEN, TX
HONOLULU, HI
AUGUSTA, GA
HARRISBURG, PA
COLUMBIA, SC
VIRGINIA BEACH, VA
BRIDGEPORT, CT
BATON ROUGE, LA
ALLENTOWN, PA
LAKELAND, FL
TOLEDO, OH
PHILADELPHIA, PA
DAYTONA BEACH, FL
PROVIDENCE, RI
SYRACUSE, NY
AKRON, OH
CLEVELAND, OH
STOCKTON, CA
BUFFALO, NY
MILWAUKEE, WI
NEW ORLEANS, LA
ST. LOUIS, MO
LITTLE ROCK, AR
ROCHESTER, NY
BIRMINGHAM, AL
FRESNO, CA
BAKERSFIELD, CA
RIVERSIDE, CA
SCRANTON, PA
SPRINGFIELD, MA
ALBUQUERQUE, NM
YOUNGSTOWN, OH
JACKSON, MS
NEW HAVEN, CT
New York, NY
Washington, DC
Philadelphia, PA
Metros are listed in rank order from 1 to 100
*Indicated a tie with another metro
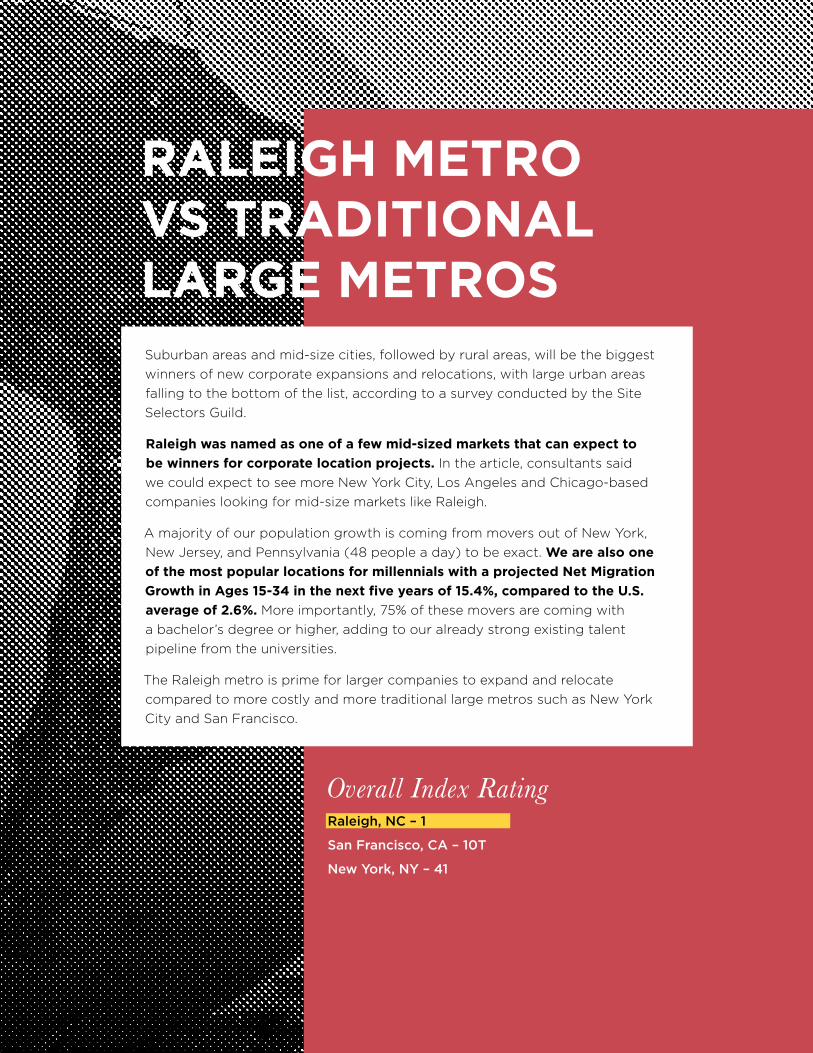
RALEIGH METRO VS TRADITIONAL LARGE METROSSuburban areas and mid-size cities, followed by rural areas, will be the biggest
winners of new corporate expansions and relocations, with large urban areas
falling to the bottom of the list, according to a survey conducted by the Site
Selectors Guild.
Raleigh was named as one of a few mid-sized markets that can expect to
be winners for corporate location projects. In the article, consultants said
we could expect to see more New York City, Los Angeles and Chicago-based
companies looking for mid-size markets like Raleigh.
A majority of our population growth is coming from movers out of New York,
New Jersey, and Pennsylvania (48 people a day) to be exact. We are also one
of the most popular locations for millennials with a projected Net Migration
Growth in Ages 15-34 in the next five years of 15.4%, compared to the U.S.
average of 2.6%. More importantly, 75% of these movers are coming with
a bachelor’s degree or higher, adding to our already strong existing talent
pipeline from the universities.
The Raleigh metro is prime for larger companies to expand and relocate
compared to more costly and more traditional large metros such as New York
City and San Francisco.
Overall Index Rating Raleigh, NC – 1
San Francisco, CA – 10T
New York, NY – 41
01
2020 RALEIGH METRO COMPARISON | RALEIGH METRO VS TRADITIONAL LARGE METROS | 5
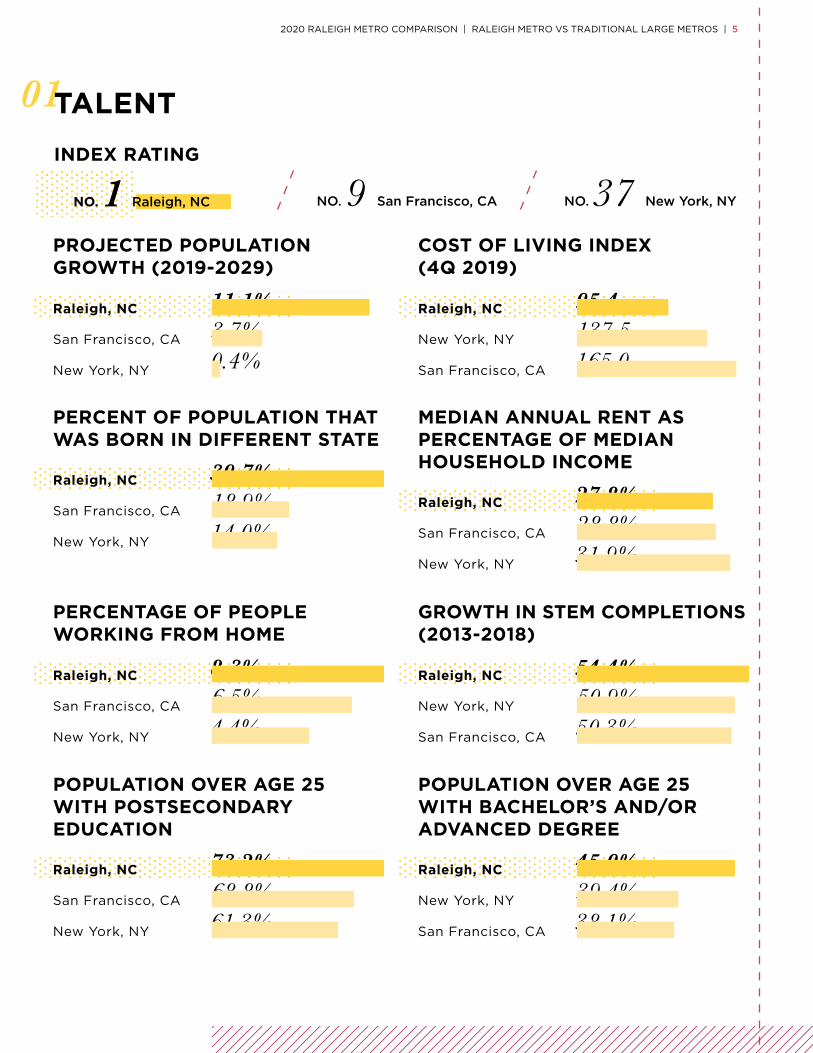
TALENT
PROJECTED POPULATION GROWTH (2019-2029)
3.7%0.4%
11.1%San Francisco, CA
New York, NY
Raleigh, NC
PERCENTAGE OF PEOPLE WORKING FROM HOME
6.5%4.4%
8.3%San Francisco, CA
New York, NY
Raleigh, NC
COST OF LIVING INDEX (4Q 2019)
137.5165.0
95.4New York, NY
San Francisco, CA
Raleigh, NC
GROWTH IN STEM COMPLETIONS (2013-2018)
50.9%50.3%
54.4%New York, NY
San Francisco, CA
Raleigh, NC
PERCENT OF POPULATION THAT WAS BORN IN DIFFERENT STATE
18.9%14.0%
39.7%San Francisco, CA
New York, NY
Raleigh, NC
POPULATION OVER AGE 25 WITH POSTSECONDARY EDUCATION
68.8%61.3%
73.2%San Francisco, CA
New York, NY
Raleigh, NC
MEDIAN ANNUAL RENT AS PERCENTAGE OF MEDIAN HOUSEHOLD INCOME
28.8%31.9%
27.8%San Francisco, CA
New York, NY
Raleigh, NC
POPULATION OVER AGE 25 WITH BACHELOR’S AND/OR ADVANCED DEGREE
39.4%38.1%
45.9%New York, NY
San Francisco, CA
Raleigh, NC
Raleigh, NC
INDEX RATING
NO. 1 NO. 9 San Francisco, CA NO. 37 New York, NY
Raleigh, NC
New York, NY
San Francisco, CA
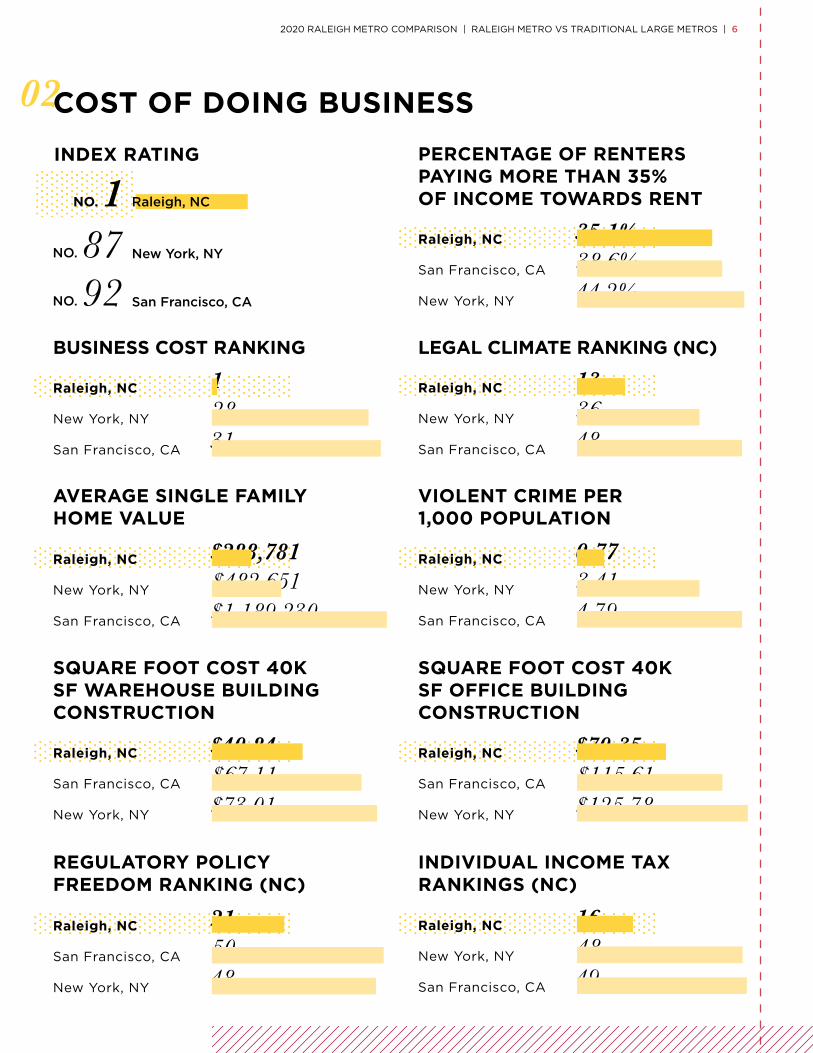
INDEX RATING PERCENTAGE OF RENTERS PAYING MORE THAN 35% OF INCOME TOWARDS RENT
38.6%44.2%
35.1%San Francisco, CA
New York, NY
Raleigh, NC
AVERAGE SINGLE FAMILY HOME VALUE
$482,651$1,189,230
$288,781New York, NY
San Francisco, CA
Raleigh, NC
SQUARE FOOT COST 40K SF WAREHOUSE BUILDING CONSTRUCTION
$67.11$73.01
$40.84San Francisco, CA
New York, NY
Raleigh, NC
REGULATORY POLICY FREEDOM RANKING (NC)
5048
21San Francisco, CA
New York, NY
Raleigh, NC
SQUARE FOOT COST 40K SF OFFICE BUILDING CONSTRUCTION
$115.61$125.78
$70.35San Francisco, CA
New York, NY
Raleigh, NC
VIOLENT CRIME PER 1,000 POPULATION
3.414.79
0.77New York, NY
San Francisco, CA
Raleigh, NC
INDIVIDUAL INCOME TAX RANKINGS (NC)
4849
16New York, NY
San Francisco, CA
Raleigh, NC
BUSINESS COST RANKING
2831
1New York, NY
San Francisco, CA
Raleigh, NC
LEGAL CLIMATE RANKING (NC)
3648
13New York, NY
San Francisco, CA
Raleigh, NC
02COST OF DOING BUSINESS
NO. 1NO. 87NO. 92
2020 RALEIGH METRO COMPARISON | RALEIGH METRO VS TRADITIONAL LARGE METROS | 6
2020 RALEIGH METRO COMPARISON | RALEIGH METRO VS TRADITIONAL LARGE METROS | 7
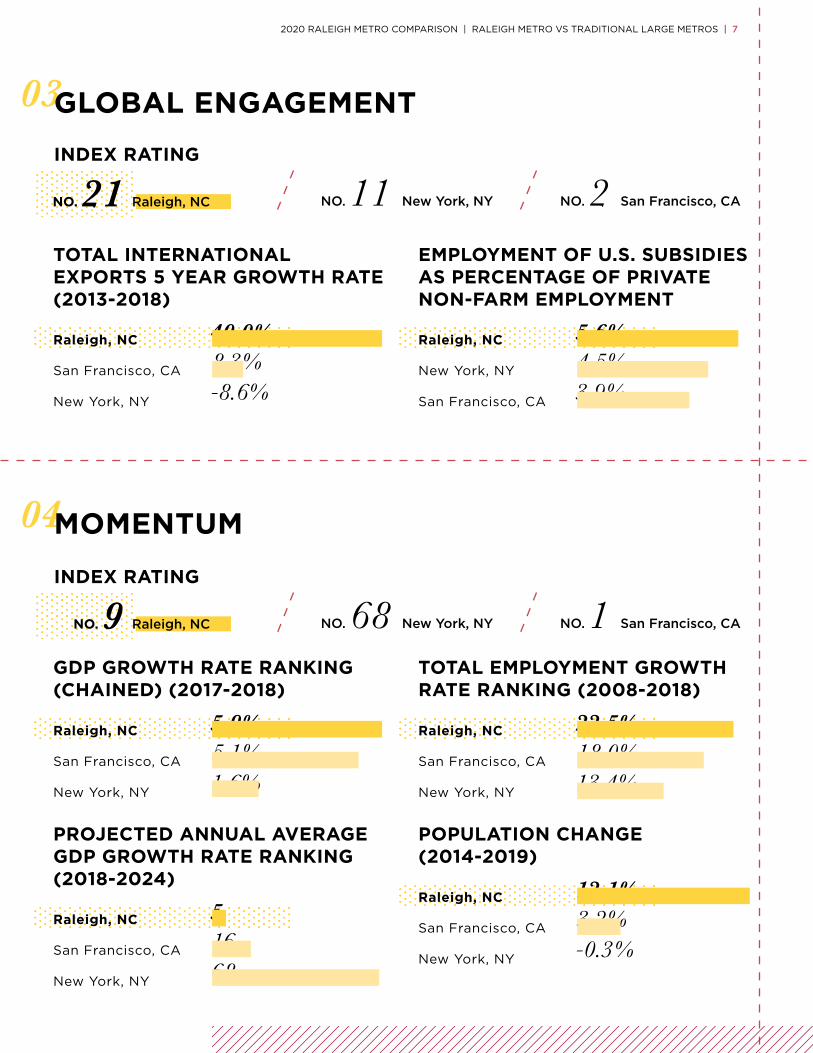
TOTAL INTERNATIONAL EXPORTS 5 YEAR GROWTH RATE (2013-2018)
8.3%-8.6%
40.0%San Francisco, CA
New York, NY
Raleigh, NC
GDP GROWTH RATE RANKING (CHAINED) (2017-2018)
PROJECTED ANNUAL AVERAGE GDP GROWTH RATE RANKING (2018-2024)
5.1%
16
1.6%
68
5.9%
5
San Francisco, CA
San Francisco, CA
New York, NY
New York, NY
Raleigh, NC
Raleigh, NC
EMPLOYMENT OF U.S. SUBSIDIES AS PERCENTAGE OF PRIVATE NON-FARM EMPLOYMENT
4.5%3.9%
5.6%New York, NY
San Francisco, CA
Raleigh, NC
TOTAL EMPLOYMENT GROWTH RATE RANKING (2008-2018)
POPULATION CHANGE (2014-2019)
18.0%
3.2%
13.4%
-0.3%
22.5%
12.1%
San Francisco, CA
San Francisco, CA
New York, NY
New York, NY
Raleigh, NC
Raleigh, NC
03GLOBAL ENGAGEMENT
04MOMENTUM
Raleigh, NC
Raleigh, NC
INDEX RATING
INDEX RATING
NO. 21
NO. 9
NO. 11 New York, NY
NO. 68 New York, NY
NO. 2 San Francisco, CA
NO. 1 San Francisco, CA
Raleigh, NC
San Francisco, CA
New York, NY
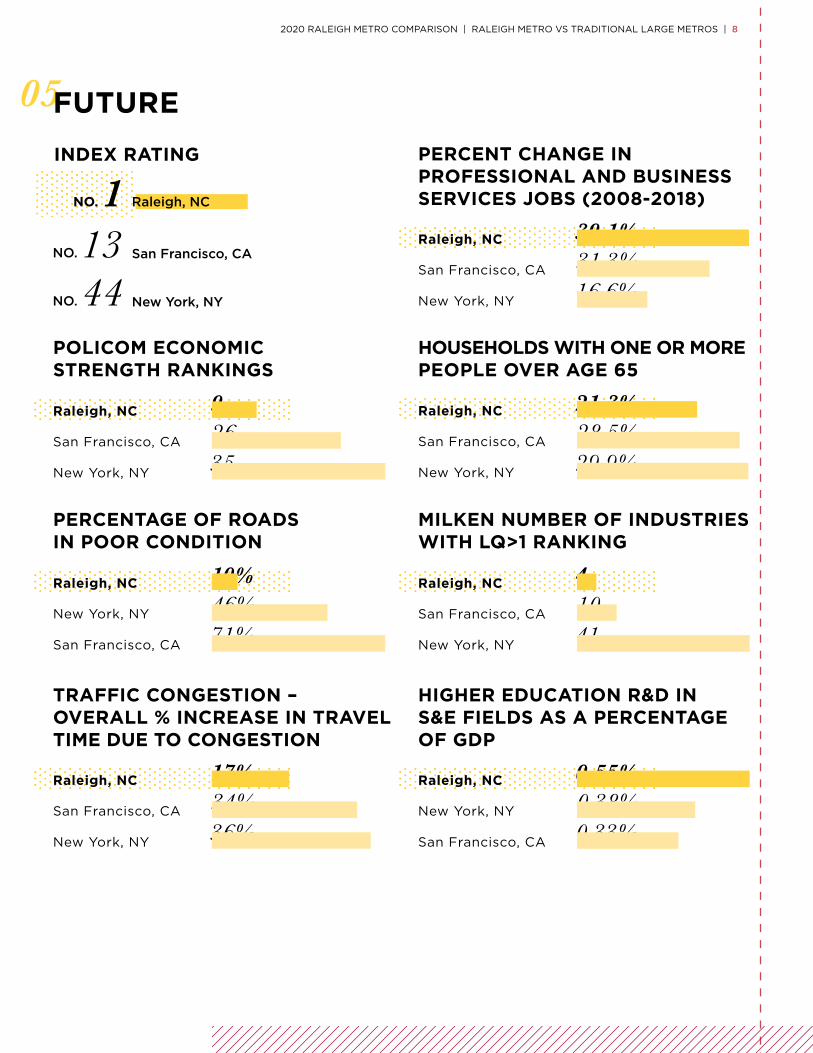
INDEX RATING
POLICOM ECONOMIC STRENGTH RANKINGS
2635
9San Francisco, CA
New York, NY
Raleigh, NC
PERCENTAGE OF ROADS IN POOR CONDITION
46%71%
10%New York, NY
San Francisco, CA
Raleigh, NC
PERCENT CHANGE IN PROFESSIONAL AND BUSINESS SERVICES JOBS (2008-2018)
31.3%16.6%
39.1%San Francisco, CA
New York, NY
Raleigh, NC
MILKEN NUMBER OF INDUSTRIES WITH LQ>1 RANKING
1041
4San Francisco, CA
New York, NY
Raleigh, NC
TRAFFIC CONGESTION – OVERALL % INCREASE IN TRAVEL TIME DUE TO CONGESTION
34%36%
17%San Francisco, CA
New York, NY
Raleigh, NC
HOUSEHOLDS WITH ONE OR MORE PEOPLE OVER AGE 65
28.5%29.9%
21.3%San Francisco, CA
New York, NY
Raleigh, NC
HIGHER EDUCATION R&D IN S&E FIELDS AS A PERCENTAGE OF GDP
0.38%0.33%
0.55%New York, NY
San Francisco, CA
Raleigh, NC
05FUTURE
NO. 1NO. 13NO. 44
2020 RALEIGH METRO COMPARISON | RALEIGH METRO VS TRADITIONAL LARGE METROS | 8
TALENT
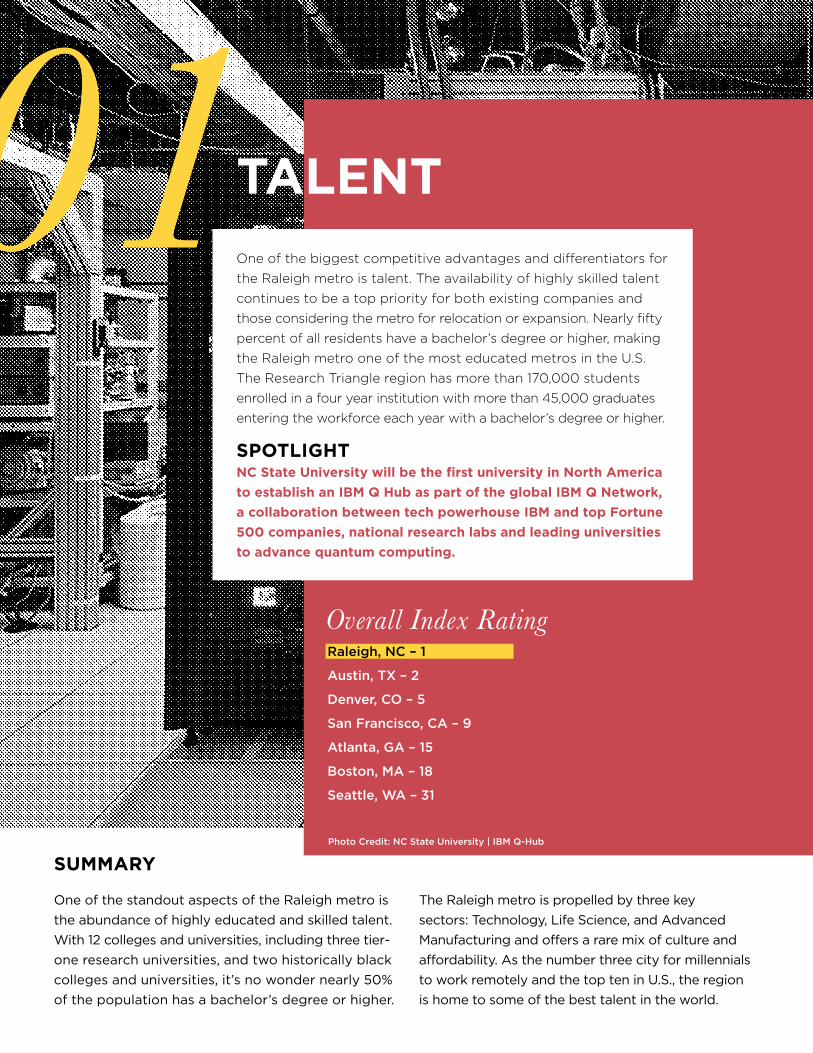
Overall Index RatingRaleigh, NC – 1
Austin, TX – 2
Denver, CO – 5
San Francisco, CA – 9
Atlanta, GA – 15
Boston, MA – 18
Seattle, WA – 31
SUMMARY
One of the standout aspects of the Raleigh metro is
the abundance of highly educated and skilled talent.
With 12 colleges and universities, including three tier-
one research universities, and two historically black
colleges and universities, it’s no wonder nearly 50%
of the population has a bachelor’s degree or higher.
The Raleigh metro is propelled by three key
sectors: Technology, Life Science, and Advanced
Manufacturing and offers a rare mix of culture and
affordability. As the number three city for millennials
to work remotely and the top ten in U.S., the region
is home to some of the best talent in the world.
One of the biggest competitive advantages and differentiators for
the Raleigh metro is talent. The availability of highly skilled talent
continues to be a top priority for both existing companies and
those considering the metro for relocation or expansion. Nearly fifty
percent of all residents have a bachelor’s degree or higher, making
the Raleigh metro one of the most educated metros in the U.S.
The Research Triangle region has more than 170,000 students
enrolled in a four year institution with more than 45,000 graduates
entering the workforce each year with a bachelor’s degree or higher.
SPOTLIGHT NC State University will be the first university in North America
to establish an IBM Q Hub as part of the global IBM Q Network,
a collaboration between tech powerhouse IBM and top Fortune
500 companies, national research labs and leading universities
to advance quantum computing.
Photo Credit: NC State University | IBM Q-Hub
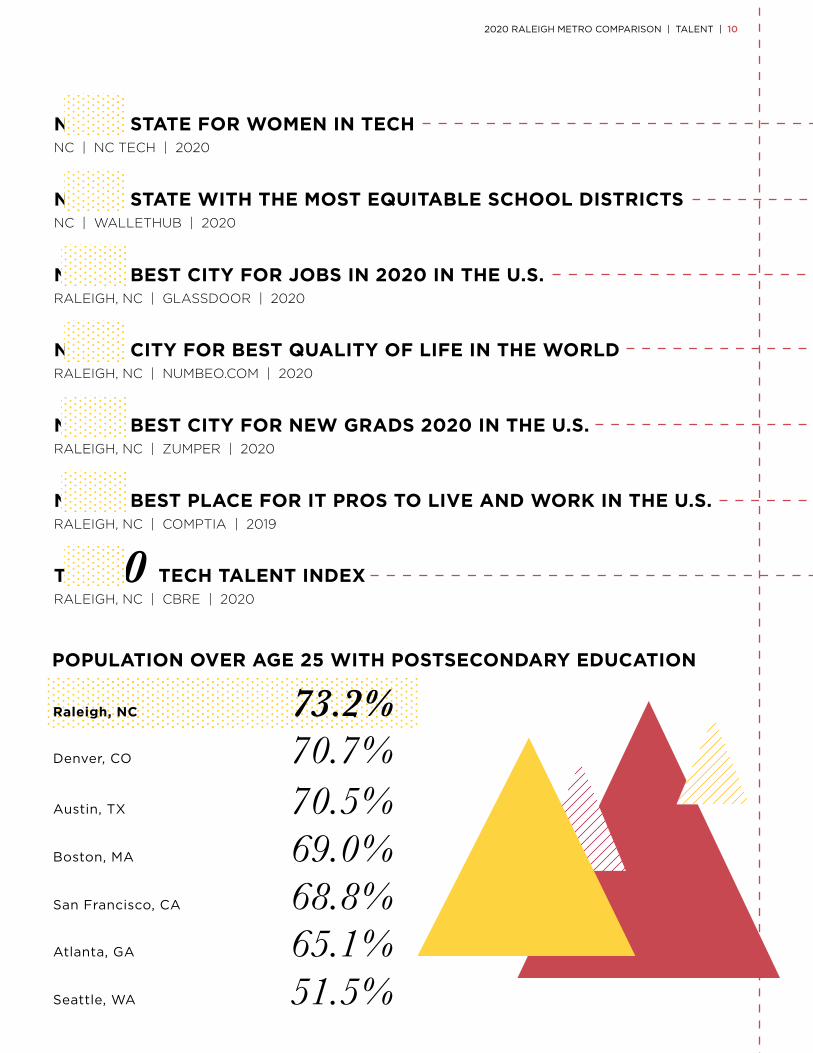
TOP 10 TECH TALENT INDEX RALEIGH, NC | CBRE | 2020
NO. 1 STATE FOR WOMEN IN TECH NC | NC TECH | 2020
NO. 2 CITY FOR BEST QUALITY OF LIFE IN THE WORLD RALEIGH, NC | NUMBEO.COM | 2020
NO. 1 BEST CITY FOR JOBS IN 2020 IN THE U.S. RALEIGH, NC | GLASSDOOR | 2020
NO. 1 STATE WITH THE MOST EQUITABLE SCHOOL DISTRICTS NC | WALLETHUB | 2020
NO. 2 BEST CITY FOR NEW GRADS 2020 IN THE U.S.RALEIGH, NC | ZUMPER | 2020
NO. 2 BEST PLACE FOR IT PROS TO LIVE AND WORK IN THE U.S.RALEIGH, NC | COMPTIA | 2019
2020 RALEIGH METRO COMPARISON | TALENT | 10
65.1%51.5%
68.8%69.0%70.5%70.7%73.2%Raleigh, NC
Denver, CO
Austin, TX
Boston, MA
San Francisco, CA
Atlanta, GA
Seattle, WA
POPULATION OVER AGE 25 WITH POSTSECONDARY EDUCATION
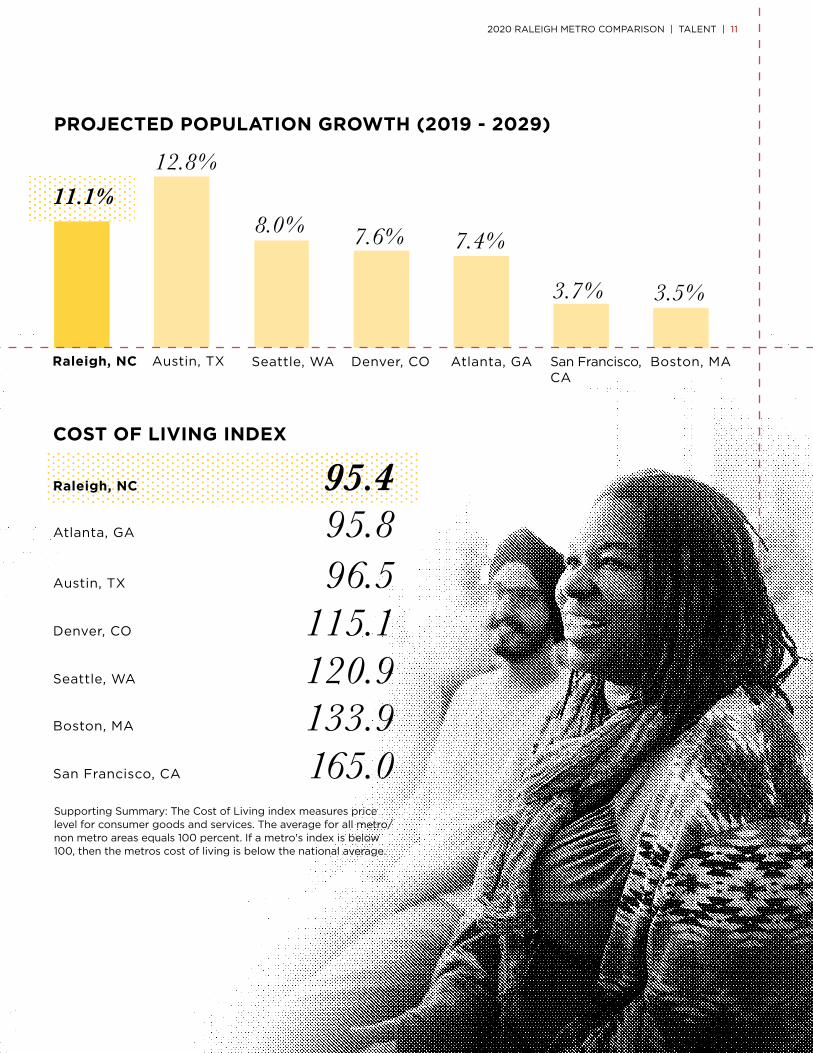
12.8%
8.0% 7.6% 7.4%
3.5%3.7%
Raleigh, NC Austin, TX Seattle, WA Denver, CO Atlanta, GA Boston, MASan Francisco, CA
11.1%
PROJECTED POPULATION GROWTH (2019 - 2029)
133.9165.0
120.9115.196.595.895.4Raleigh, NC
Atlanta, GA
Austin, TX
Denver, CO
Seattle, WA
Boston, MA
San Francisco, CA
COST OF LIVING INDEX
Supporting Summary: The Cost of Living index measures price level for consumer goods and services. The average for all metro/non metro areas equals 100 percent. If a metro's index is below 100, then the metros cost of living is below the national average.
2020 RALEIGH METRO COMPARISON | TALENT | 11
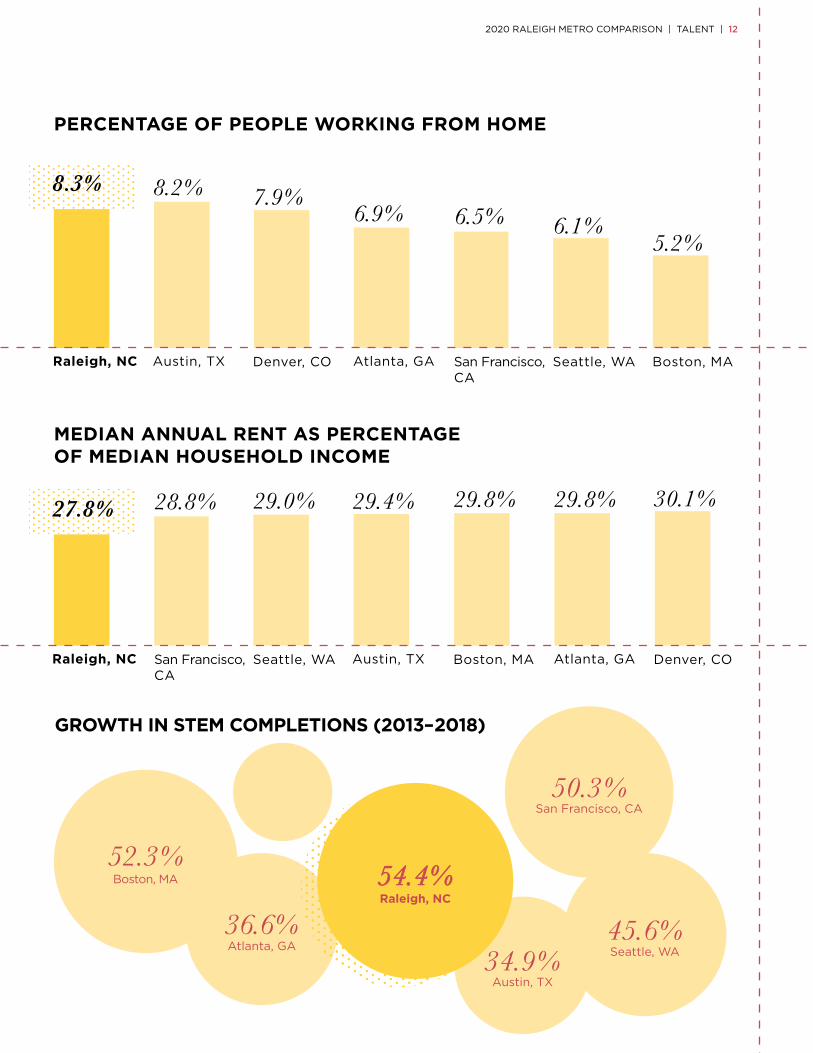
6.1%
Seattle, WA
5.2%
Boston, MA
6.5%
San Francisco, CA
MEDIAN ANNUAL RENT AS PERCENTAGE OF MEDIAN HOUSEHOLD INCOME
San Francisco, CA50.3%
GROWTH IN STEM COMPLETIONS (2013–2018)
Boston, MA
52.3%
Austin, TX34.9% Seattle, WA
45.6%36.6%Atlanta, GA
27.8%
Raleigh, NC
29.4%
Austin, TX
30.1%
Denver, CO
29.8%
Atlanta, GA
29.8%
Boston, MA
29.0%
Seattle, WA
28.8%
San Francisco, CA
PERCENTAGE OF PEOPLE WORKING FROM HOME
8.3% 8.2% 7.9%6.9%
Raleigh, NC Austin, TX Denver, CO Atlanta, GA
2020 RALEIGH METRO COMPARISON | TALENT | 12
Denver, CO
22.5%
Raleigh, NC
54.4%54.4%
COST OF DOING BUSINESS
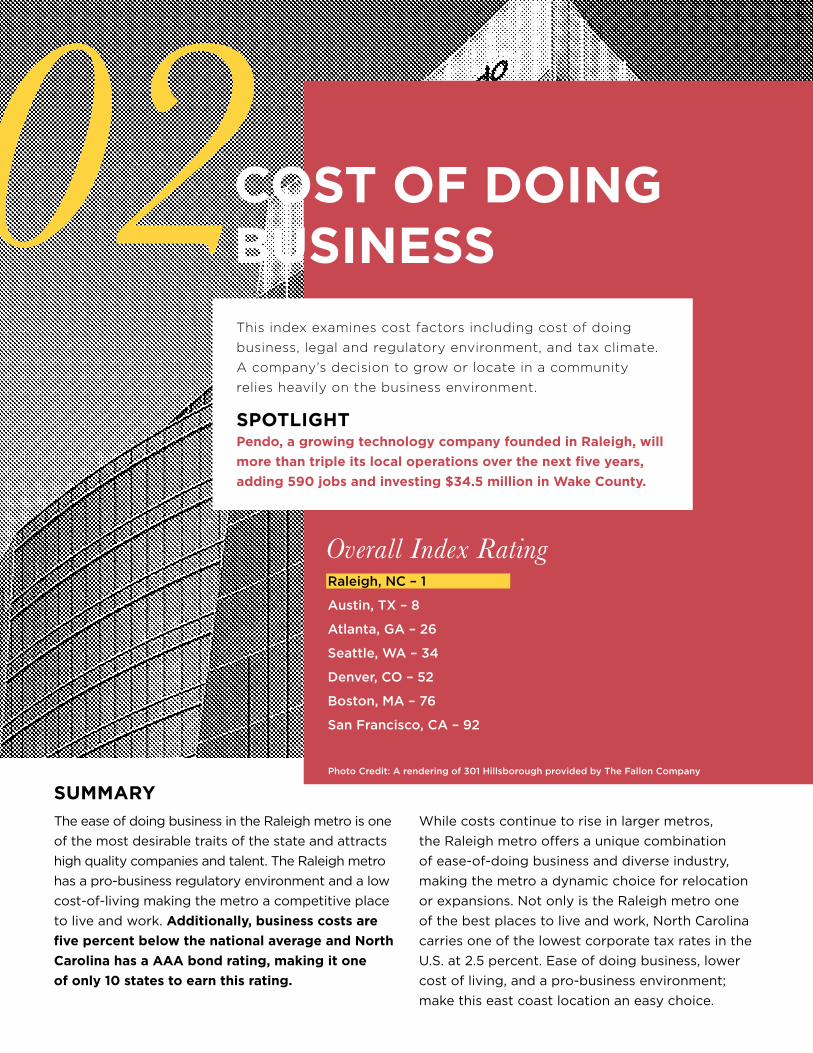
Overall Index Rating Raleigh, NC – 1
Austin, TX – 8
Atlanta, GA – 26
Seattle, WA – 34
Denver, CO – 52
Boston, MA – 76
San Francisco, CA – 92
This index examines cost factors including cost of doing
business, legal and regulatory environment, and tax climate.
A company’s decision to grow or locate in a community
relies heavily on the business environment.
SPOTLIGHT Pendo, a growing technology company founded in Raleigh, will
more than triple its local operations over the next five years,
adding 590 jobs and investing $34.5 million in Wake County.
SUMMARY
The ease of doing business in the Raleigh metro is one
of the most desirable traits of the state and attracts
high quality companies and talent. The Raleigh metro
has a pro-business regulatory environment and a low
cost-of-living making the metro a competitive place
to live and work. Additionally, business costs are
five percent below the national average and North
Carolina has a AAA bond rating, making it one
of only 10 states to earn this rating.
While costs continue to rise in larger metros,
the Raleigh metro offers a unique combination
of ease-of-doing business and diverse industry,
making the metro a dynamic choice for relocation
or expansions. Not only is the Raleigh metro one
of the best places to live and work, North Carolina
carries one of the lowest corporate tax rates in the
U.S. at 2.5 percent. Ease of doing business, lower
cost of living, and a pro-business environment;
make this east coast location an easy choice.
Photo Credit: A rendering of 301 Hillsborough provided by The Fallon Company
2020 RALEIGH METRO COMPARISON | COST OF DOING BUSINESS | 14
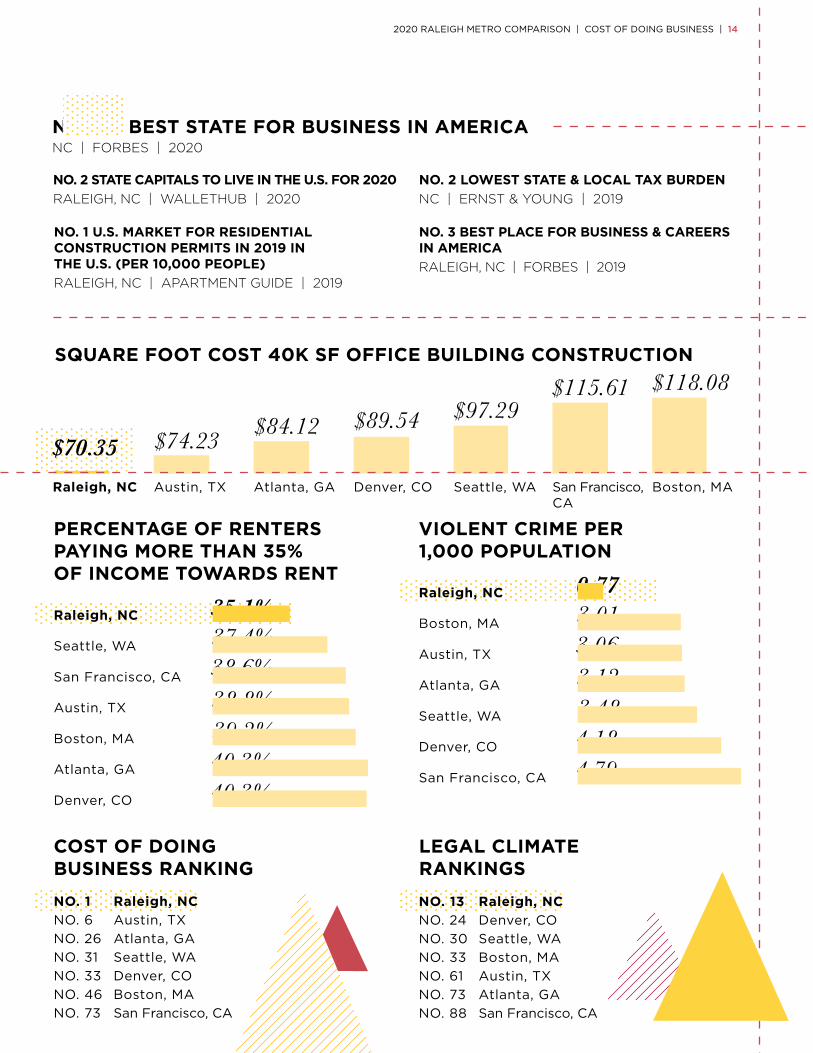
SQUARE FOOT COST 40K SF OFFICE BUILDING CONSTRUCTION
$70.35 $74.23 $84.12 $89.54$115.61
$97.29$118.08
Raleigh, NC Austin, TX Atlanta, GA Denver, CO Seattle, WA Boston, MASan Francisco, CA
NO. 1 BEST STATE FOR BUSINESS IN AMERICANC | FORBES | 2020
NO. 3 BEST PLACE FOR BUSINESS & CAREERS IN AMERICA
RALEIGH, NC | FORBES | 2019
NO. 2 LOWEST STATE & LOCAL TAX BURDEN
NC | ERNST & YOUNG | 2019
NO. 1 U.S. MARKET FOR RESIDENTIAL CONSTRUCTION PERMITS IN 2019 IN THE U.S. (PER 10,000 PEOPLE)
RALEIGH, NC | APARTMENT GUIDE | 2019
NO. 2 STATE CAPITALS TO LIVE IN THE U.S. FOR 2020
RALEIGH, NC | WALLETHUB | 2020
VIOLENT CRIME PER 1,000 POPULATION
3.013.06
0.77
3.123.484.184.79
Boston, MA
Austin, TX
Raleigh, NC
Atlanta, GA
Seattle, WA
Denver, CO
San Francisco, CA
PERCENTAGE OF RENTERS PAYING MORE THAN 35% OF INCOME TOWARDS RENT
37.4%38.6%
35.1%
38.8%39.2%40.3%40.3%
Seattle, WA
San Francisco, CA
Raleigh, NC
NO. 1 Raleigh, NC
NO. 6 Austin, TX
NO. 26 Atlanta, GA
NO. 31 Seattle, WA
NO. 33 Denver, CO
NO. 46 Boston, MA
NO. 73 San Francisco, CA
NO. 13 Raleigh, NC
NO. 24 Denver, CO
NO. 30 Seattle, WA
NO. 33 Boston, MA
NO. 61 Austin, TX
NO. 73 Atlanta, GA
NO. 88 San Francisco, CA
Austin, TX
Boston, MA
Atlanta, GA
Denver, CO
COST OF DOING BUSINESS RANKING
LEGAL CLIMATE RANKINGS
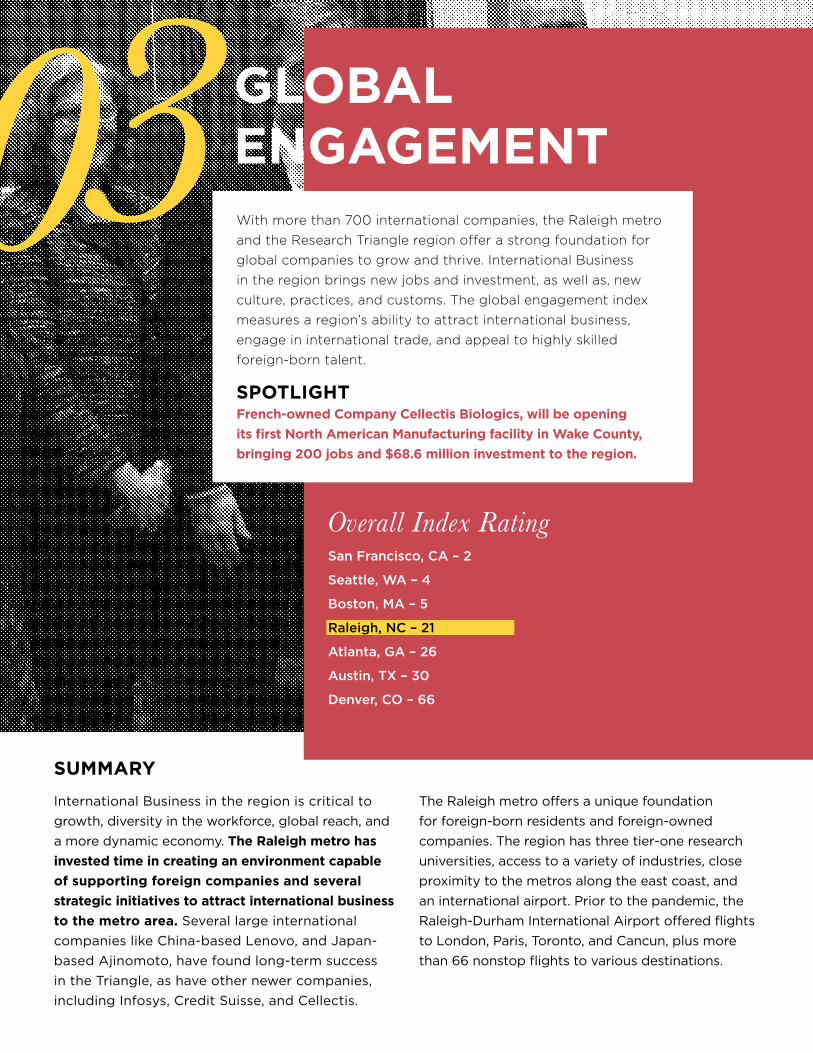
SUMMARY
International Business in the region is critical to
growth, diversity in the workforce, global reach, and
a more dynamic economy. The Raleigh metro has
invested time in creating an environment capable
of supporting foreign companies and several
strategic initiatives to attract international business
to the metro area. Several large international
companies like China-based Lenovo, and Japan-
based Ajinomoto, have found long-term success
in the Triangle, as have other newer companies,
including Infosys, Credit Suisse, and Cellectis.
The Raleigh metro offers a unique foundation
for foreign-born residents and foreign-owned
companies. The region has three tier-one research
universities, access to a variety of industries, close
proximity to the metros along the east coast, and
an international airport. Prior to the pandemic, the
Raleigh-Durham International Airport offered flights
to London, Paris, Toronto, and Cancun, plus more
than 66 nonstop flights to various destinations.
Overall Index RatingSan Francisco, CA – 2
Seattle, WA – 4
Boston, MA – 5
Raleigh, NC – 21
Atlanta, GA – 26
Austin, TX – 30
Denver, CO – 66
With more than 700 international companies, the Raleigh metro
and the Research Triangle region offer a strong foundation for
global companies to grow and thrive. International Business
in the region brings new jobs and investment, as well as, new
culture, practices, and customs. The global engagement index
measures a region’s ability to attract international business,
engage in international trade, and appeal to highly skilled
foreign-born talent.
SPOTLIGHT French-owned Company Cellectis Biologics, will be opening
its first North American Manufacturing facility in Wake County,
bringing 200 jobs and $68.6 million investment to the region.
GLOBAL ENGAGEMENT
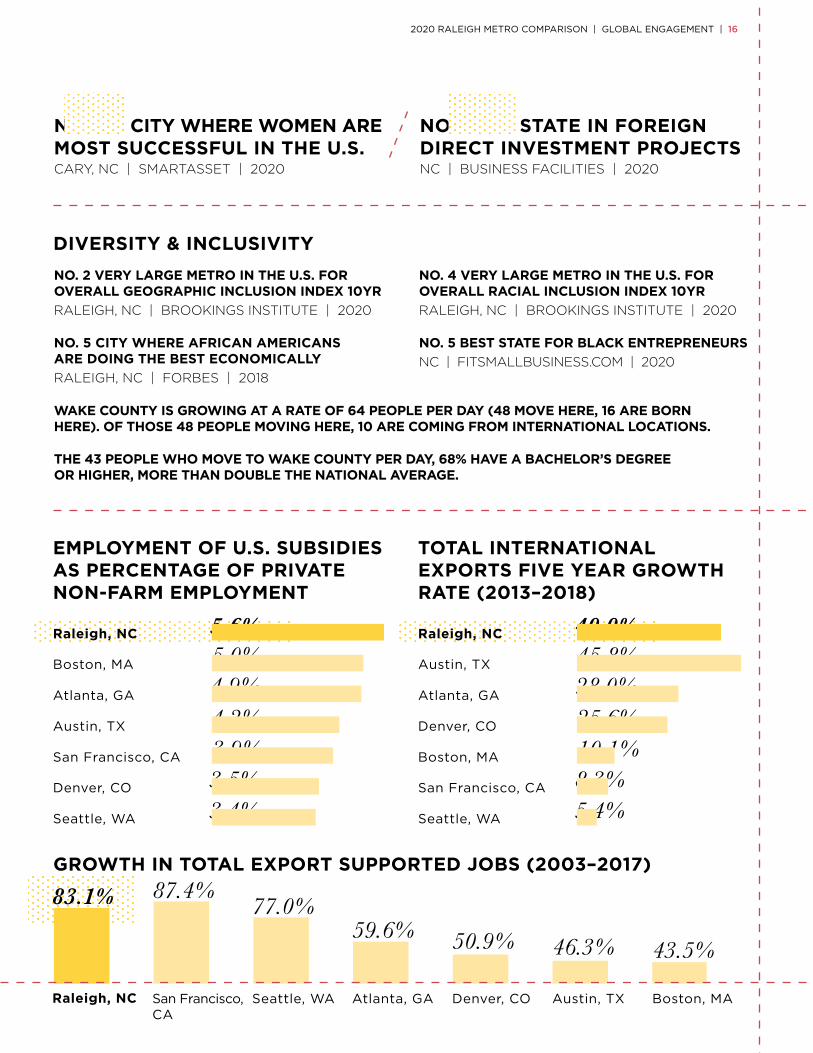
83.1% 77.0%87.4%
59.6% 50.9% 46.3% 43.5%
Raleigh, NC Seattle, WASan Francisco, CA
Atlanta, GA Denver, CO Austin, TX Boston, MA
GROWTH IN TOTAL EXPORT SUPPORTED JOBS (2003–2017)
NO. 5 BEST STATE FOR BLACK ENTREPRENEURS
NC | FITSMALLBUSINESS.COM | 2020
WAKE COUNTY IS GROWING AT A RATE OF 64 PEOPLE PER DAY (48 MOVE HERE, 16 ARE BORN HERE). OF THOSE 48 PEOPLE MOVING HERE, 10 ARE COMING FROM INTERNATIONAL LOCATIONS.
THE 43 PEOPLE WHO MOVE TO WAKE COUNTY PER DAY, 68% HAVE A BACHELOR’S DEGREE OR HIGHER, MORE THAN DOUBLE THE NATIONAL AVERAGE.
NO. 5 CITY WHERE AFRICAN AMERICANS ARE DOING THE BEST ECONOMICALLY
RALEIGH, NC | FORBES | 2018
NO. 1 CITY WHERE WOMEN ARE MOST SUCCESSFUL IN THE U.S. CARY, NC | SMARTASSET | 2020
2020 RALEIGH METRO COMPARISON | GLOBAL ENGAGEMENT | 16
NO. 10 STATE IN FOREIGN DIRECT INVESTMENT PROJECTS NC | BUSINESS FACILITIES | 2020
DIVERSITY & INCLUSIVITY
NO. 2 VERY LARGE METRO IN THE U.S. FOR OVERALL GEOGRAPHIC INCLUSION INDEX 10YR
RALEIGH, NC | BROOKINGS INSTITUTE | 2020
NO. 4 VERY LARGE METRO IN THE U.S. FOR OVERALL RACIAL INCLUSION INDEX 10YR
RALEIGH, NC | BROOKINGS INSTITUTE | 2020
EMPLOYMENT OF U.S. SUBSIDIES AS PERCENTAGE OF PRIVATE NON-FARM EMPLOYMENT
TOTAL INTERNATIONAL EXPORTS FIVE YEAR GROWTH RATE (2013–2018)
5.0% 45.8%4.9% 28.0%
5.6% 40.0%
4.2% 25.6%3.9% 10.1%3.5% 8.3%3.4% 5.4%
Boston, MA Austin, TX
Atlanta, GA Atlanta, GA
Raleigh, NC Raleigh, NC
Austin, TX Denver, CO
San Francisco, CA Boston, MA
Denver, CO San Francisco, CA
Seattle, WA Seattle, WA
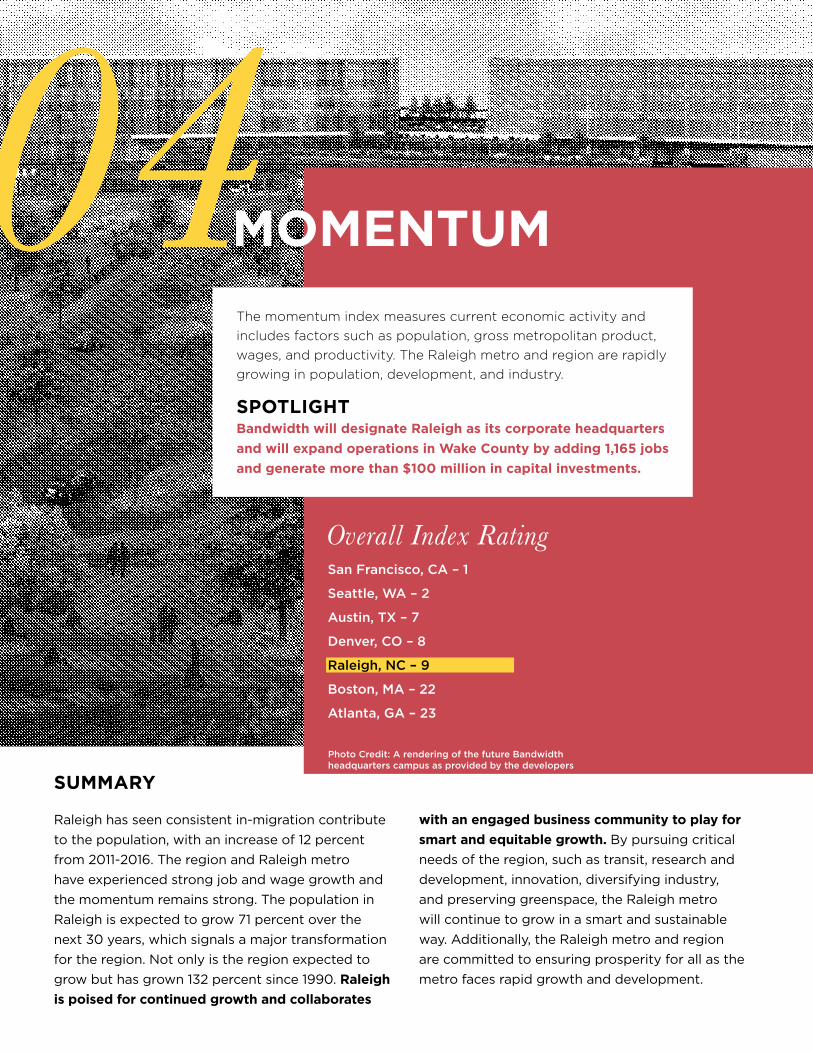
MOMENTUM
The momentum index measures current economic activity and
includes factors such as population, gross metropolitan product,
wages, and productivity. The Raleigh metro and region are rapidly
growing in population, development, and industry.
SPOTLIGHT Bandwidth will designate Raleigh as its corporate headquarters
and will expand operations in Wake County by adding 1,165 jobs
and generate more than $100 million in capital investments.
SUMMARY
Raleigh has seen consistent in-migration contribute
to the population, with an increase of 12 percent
from 2011-2016. The region and Raleigh metro
have experienced strong job and wage growth and
the momentum remains strong. The population in
Raleigh is expected to grow 71 percent over the
next 30 years, which signals a major transformation
for the region. Not only is the region expected to
grow but has grown 132 percent since 1990. Raleigh
is poised for continued growth and collaborates
with an engaged business community to play for
smart and equitable growth. By pursuing critical
needs of the region, such as transit, research and
development, innovation, diversifying industry,
and preserving greenspace, the Raleigh metro
will continue to grow in a smart and sustainable
way. Additionally, the Raleigh metro and region
are committed to ensuring prosperity for all as the
metro faces rapid growth and development.
Overall Index Rating San Francisco, CA – 1
Seattle, WA – 2
Austin, TX – 7
Denver, CO – 8
Raleigh, NC – 9
Boston, MA – 22
Atlanta, GA – 23
Photo Credit: A rendering of the future Bandwidth headquarters campus as provided by the developers
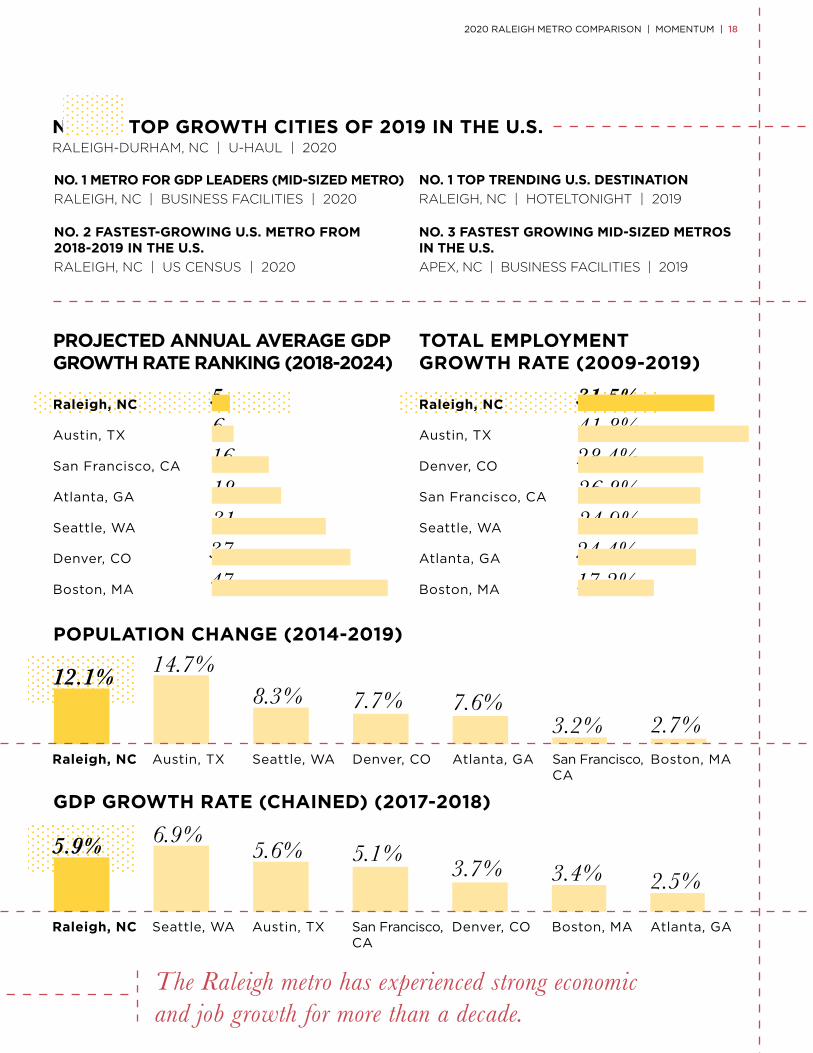
NO. 1 TOP GROWTH CITIES OF 2019 IN THE U.S. RALEIGH-DURHAM, NC | U-HAUL | 2020
2020 RALEIGH METRO COMPARISON | MOMENTUM | 18
NO. 3 FASTEST GROWING MID-SIZED METROS IN THE U.S.
APEX, NC | BUSINESS FACILITIES | 2019
NO. 2 FASTEST-GROWING U.S. METRO FROM 2018-2019 IN THE U.S.
RALEIGH, NC | US CENSUS | 2020
NO. 1 METRO FOR GDP LEADERS (MID-SIZED METRO)
RALEIGH, NC | BUSINESS FACILITIES | 2020
NO. 1 TOP TRENDING U.S. DESTINATION
RALEIGH, NC | HOTELTONIGHT | 2019
PROJECTED ANNUAL AVERAGE GDP GROWTH RATE RANKING (2018-2024)
TOTAL EMPLOYMENT GROWTH RATE (2009-2019)
6 41.8%16 28.4%
5 31.5%
18 26.8%31 24.9%37 24.4%47 17.2%
Austin, TX Austin, TX
San Francisco, CA Denver, CO
Raleigh, NC Raleigh, NC
Atlanta, GA San Francisco, CA
Seattle, WA Seattle, WA
Denver, CO Atlanta, GA
Boston, MA Boston, MA
5.9% 6.9% 5.6% 5.1% 3.7% 3.4% 2.5%
Raleigh, NC Seattle, WA Austin, TX San Francisco, CA
Denver, CO Boston, MA Atlanta, GA
GDP GROWTH RATE (CHAINED) (2017-2018)
12.1% 14.7%8.3% 7.7% 7.6%
2.7%3.2%Raleigh, NC Austin, TX Seattle, WA Denver, CO Atlanta, GA Boston, MASan Francisco,
CA
POPULATION CHANGE (2014-2019)
The Raleigh metro has experienced strong economic and job growth for more than a decade.
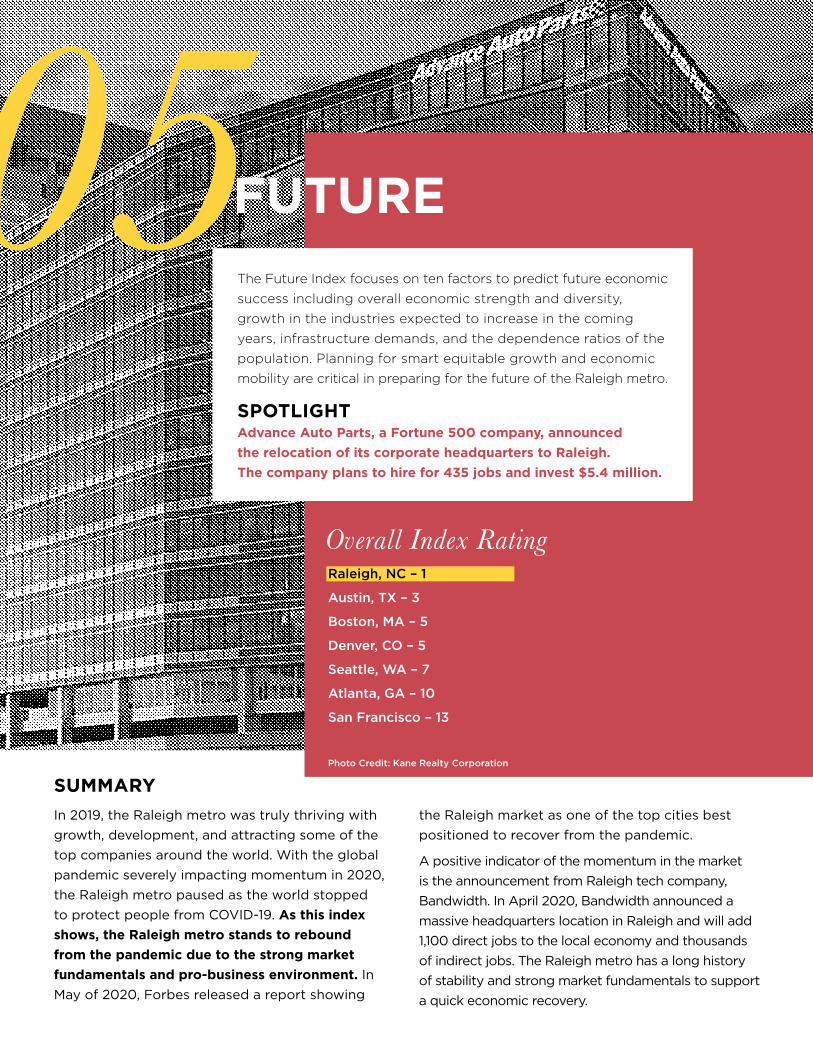
FUTURE
SUMMARY
In 2019, the Raleigh metro was truly thriving with
growth, development, and attracting some of the
top companies around the world. With the global
pandemic severely impacting momentum in 2020,
the Raleigh metro paused as the world stopped
to protect people from COVID-19. As this index
shows, the Raleigh metro stands to rebound
from the pandemic due to the strong market
fundamentals and pro-business environment. In
May of 2020, Forbes released a report showing
the Raleigh market as one of the top cities best
positioned to recover from the pandemic.
A positive indicator of the momentum in the market
is the announcement from Raleigh tech company,
Bandwidth. In April 2020, Bandwidth announced a
massive headquarters location in Raleigh and will add
1,100 direct jobs to the local economy and thousands
of indirect jobs. The Raleigh metro has a long history
of stability and strong market fundamentals to support
a quick economic recovery.
The Future Index focuses on ten factors to predict future economic
success including overall economic strength and diversity,
growth in the industries expected to increase in the coming
years, infrastructure demands, and the dependence ratios of the
population. Planning for smart equitable growth and economic
mobility are critical in preparing for the future of the Raleigh metro.
SPOTLIGHT Advance Auto Parts, a Fortune 500 company, announced
the relocation of its corporate headquarters to Raleigh.
The company plans to hire for 435 jobs and invest $5.4 million.
Overall Index Rating Raleigh, NC – 1
Austin, TX – 3
Boston, MA – 5
Denver, CO – 5
Seattle, WA – 7
Atlanta, GA – 10
San Francisco – 13
Photo Credit: Kane Realty Corporation
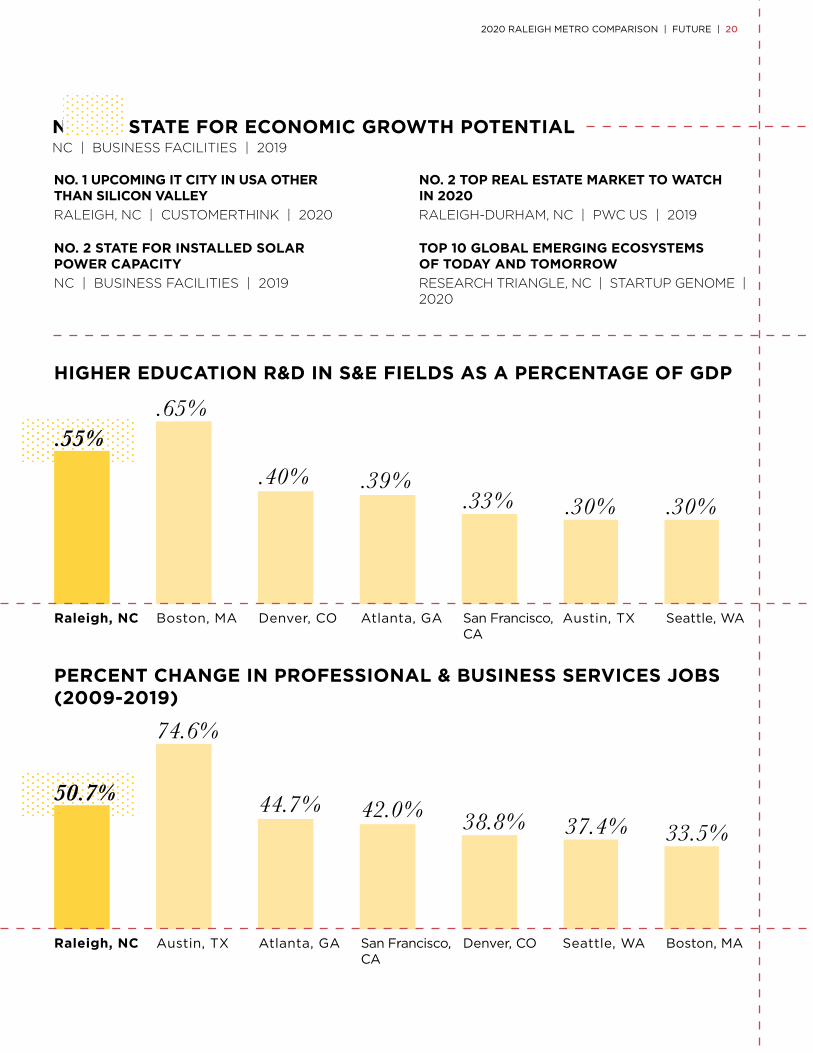
.55%
50.7%
2020 RALEIGH METRO COMPARISON | FUTURE | 20
NO. 1 STATE FOR ECONOMIC GROWTH POTENTIAL NC | BUSINESS FACILITIES | 2019
TOP 10 GLOBAL EMERGING ECOSYSTEMS OF TODAY AND TOMORROW
RESEARCH TRIANGLE, NC | STARTUP GENOME | 2020
NO. 2 STATE FOR INSTALLED SOLAR POWER CAPACITY
NC | BUSINESS FACILITIES | 2019
NO. 1 UPCOMING IT CITY IN USA OTHER THAN SILICON VALLEY
RALEIGH, NC | CUSTOMERTHINK | 2020
NO. 2 TOP REAL ESTATE MARKET TO WATCH IN 2020
RALEIGH-DURHAM, NC | PWC US | 2019
.65%
74.6%
.40%
44.7%
.39%
42.0%
.33%
38.8%
.30%
37.4%
.30%
33.5%
Raleigh, NC
Raleigh, NC
Boston, MA
Austin, TX
Denver, CO
Atlanta, GA
Atlanta, GA
San Francisco, CA
San Francisco, CA
Denver, CO
Austin, TX
Seattle, WA
Seattle, WA
Boston, MA
HIGHER EDUCATION R&D IN S&E FIELDS AS A PERCENTAGE OF GDP
PERCENT CHANGE IN PROFESSIONAL & BUSINESS SERVICES JOBS (2009-2019)
17%22%
25% 25% 26%31%
34%
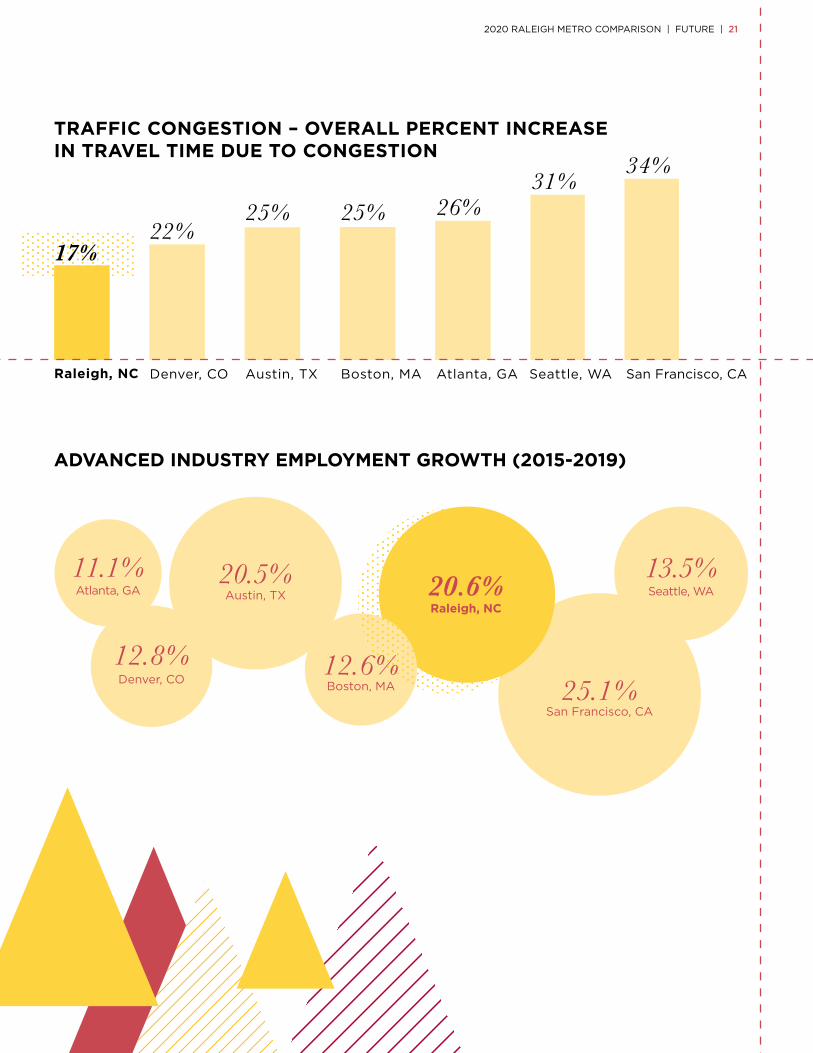
Raleigh, NC Denver, CO Austin, TX Boston, MA Atlanta, GA Seattle, WA San Francisco, CA
TRAFFIC CONGESTION – OVERALL PERCENT INCREASE IN TRAVEL TIME DUE TO CONGESTION
20.5%Austin, TX
Raleigh, NC
20.6%
Denver, CO
12.8%
San Francisco, CA25.1%Boston, MA
12.6%
Seattle, WAAtlanta, GA
11.1% 13.5%
ADVANCED INDUSTRY EMPLOYMENT GROWTH (2015-2019)
2020 RALEIGH METRO COMPARISON | FUTURE | 21
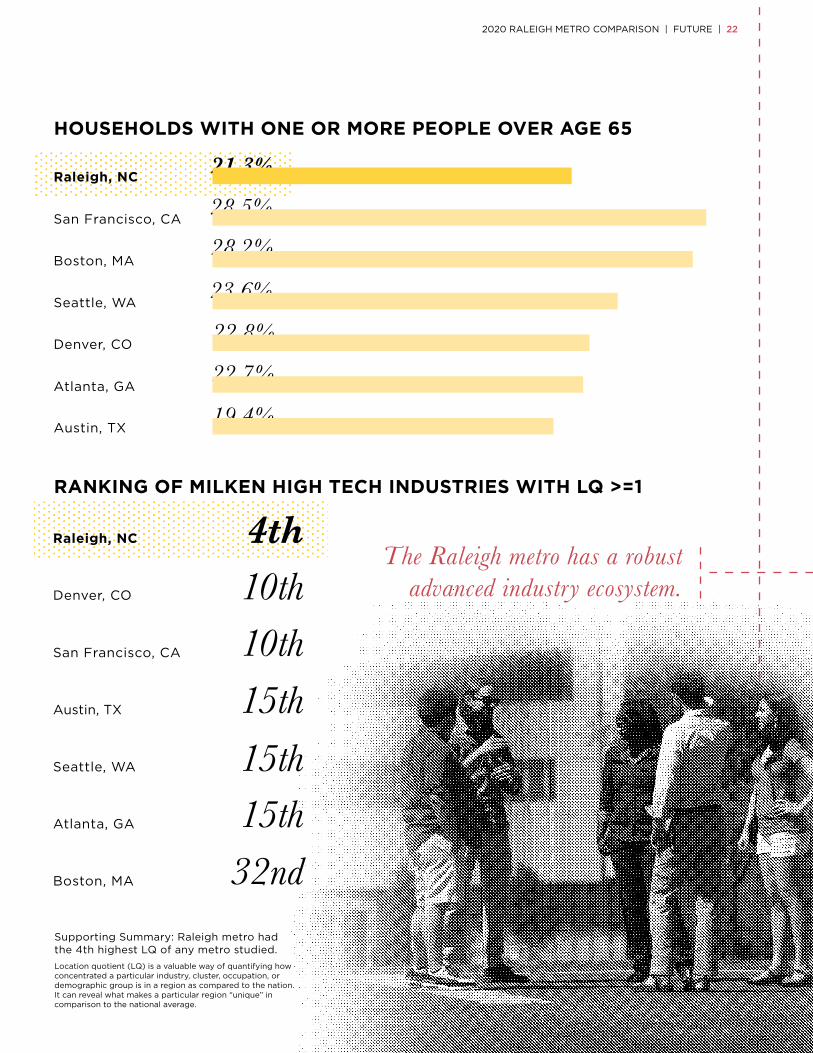
HOUSEHOLDS WITH ONE OR MORE PEOPLE OVER AGE 65
RANKING OF MILKEN HIGH TECH INDUSTRIES WITH LQ >=1
Supporting Summary: Raleigh metro had the 4th highest LQ of any metro studied.
Location quotient (LQ) is a valuable way of quantifying how concentrated a particular industry, cluster, occupation, or demographic group is in a region as compared to the nation. It can reveal what makes a particular region “unique” in comparison to the national average.
15th32nd
10th15th15th
10th4thRaleigh, NC
Denver, CO
Seattle, WA
San Francisco, CA
Austin, TX
Atlanta, GA
Boston, MA
21.3%Raleigh, NC
22.7%Atlanta, GA
28.2%Boston, MA
19.4%Austin, TX
22.8%Denver, CO
23.6%Seattle, WA
28.5%San Francisco, CA
2020 RALEIGH METRO COMPARISON | FUTURE | 22
The Raleigh metro has a robust advanced industry ecosystem.
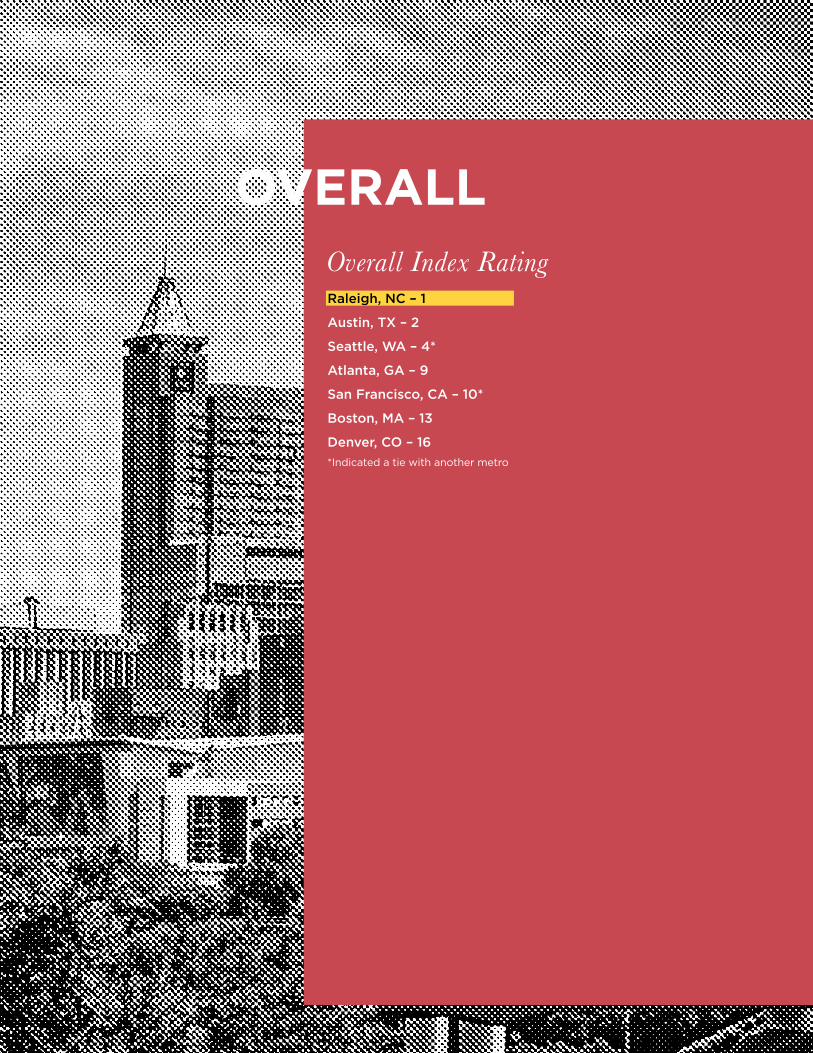
OVERALLOverall Index RatingRaleigh, NC – 1
Austin, TX – 2
Seattle, WA – 4*
Atlanta, GA – 9
San Francisco, CA – 10*
Boston, MA – 13
Denver, CO – 16
*Indicated a tie with another metro
Conclusions
2020 RALEIGH METRO COMPARISON | OVERALL | 24
Ted Abernathy, Managing Partner with Economic
Leadership shares insight on Raleigh Metro’s future
and talent index.
In the last decade, data analytics has emerged as the
top decision-making tool for business. We live in a
time where information is ubiquitous and disruption is
constant, and in 2020 our choices will determine our
future success. Where should our company invest?
Where can we attract the talent we need to grow?
Where can we find a supportive business climate,
affordability, diversity, great infrastructure, and a place
positioned for the future?
In one of the world centers for data analytics, creating
a multifactor index to identify and address regional
strengths and weaknesses makes perfect sense. In
the current analysis, the Raleigh metro remains the
most competitive region in the country. This year the
Raleigh metro scored #1 of the 100 metros analyzed,
in both the Costs of Doing Business Index and the
Talent Index.
• The Cost of Doing Business Index includes measures
of taxation, regulation, legal environment, building
energy and occupancy costs, and crime.
• The Talent Index includes measures of labor growth,
labor force participation, educational attainment,
cost of living, and investments in education.
These two areas consistently rank among the
most important for site selection decisions. Other
independent rankings have placed the Raleigh metro
and North Carolina among the top three for business
and careers, lowest state and local tax burdens, best
place to start a business, best city to work in, best
city for young professionals and best quality of life
in the world.
The region also topped all other metros in the Future
Index. This index anticipates performance over the
next decade. What are the economic projections,
how extensive are the metro’s dependency ratios,
is the infrastructure prepared for growth, what does
the talent pipeline look like and is there job growth
in growing industries?
There are many great regions in the United States
and the competition for investment and workforce
continues to intensify. The post-pandemic landscape
will put a premium on places that can attract talent
with a combination of high quality of place and
affordability; on places that have strong technology
assets; on places that value and celebrate diversity
and innovation; and on places where the business,
government and higher education leaders work
together as stewards of a place they love. The future
for the Raleigh MSA and the Research Triangle
region looks bright.

raleigh-wake.org
workinthetriangle.com
@RaleighWake
@WorkTriangleNC
POWERED BY