Embed Size (px)
Citation preview
OBSERVATORY OF AUTOMATED METROS WORLD ATLAS REPORT, 2013
© copyright UITP 2013 Page | 1
Figure 2: Geographic distribution of automated lines, as of 2013
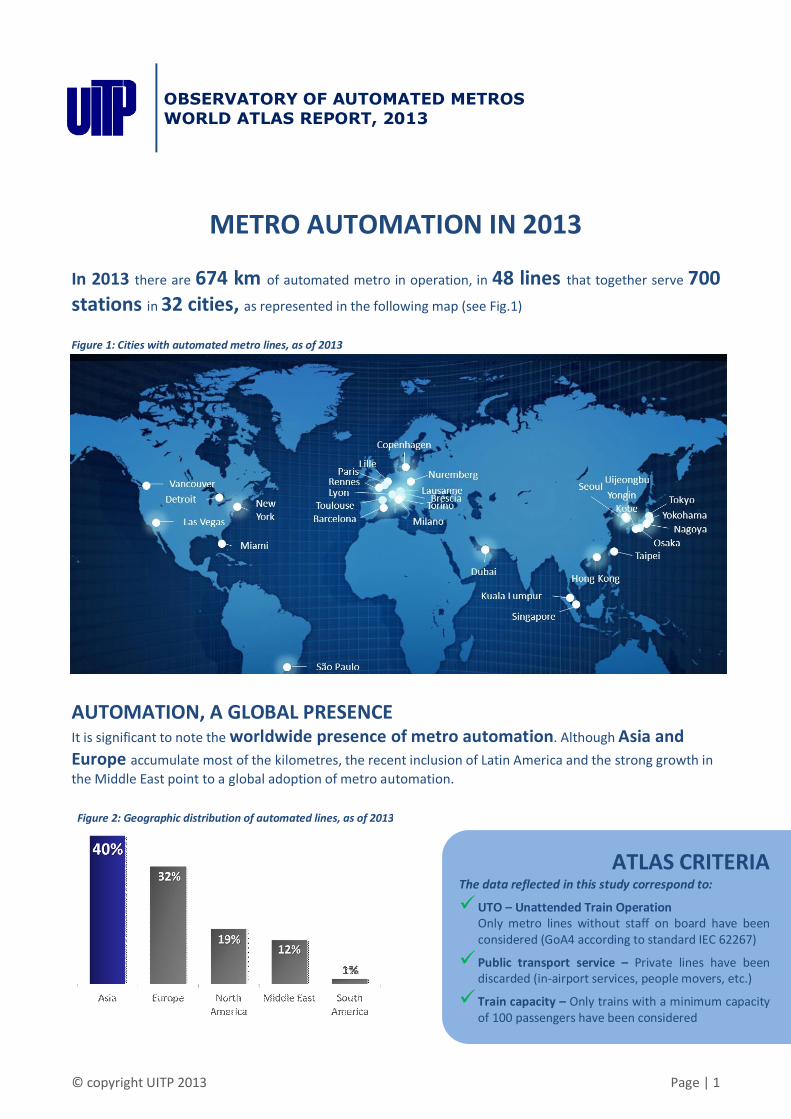
METRO AUTOMATION IN 2013
In 2013 there are 674 km of automated metro in operation, in 48 lines that together serve 700 stations in 32 cities, as represented in the following map (see Fig.1) Figure 1: Cities with automated metro lines, as of 2013
AUTOMATION, A GLOBAL PRESENCE It is significant to note the worldwide presence of metro automation. Although Asia and Europe accumulate most of the kilometres, the recent inclusion of Latin America and the strong growth in the Middle East point to a global adoption of metro automation.
ATLAS CRITERIA The data reflected in this study correspond to:
ü UTO – Unattended Train Operation Only metro lines without staff on board have been considered (GoA4 according to standard IEC 62267)
ü Public transport service – Private lines have been discarded (in-airport services, people movers, etc.)
ü Train capacity – Only trains with a minimum capacity of 100 passengers have been considered
OBSERVATORY OF AUTOMATED METROS WORLD ATLAS REPORT, 2013
© copyright UITP 2013 Page | 2
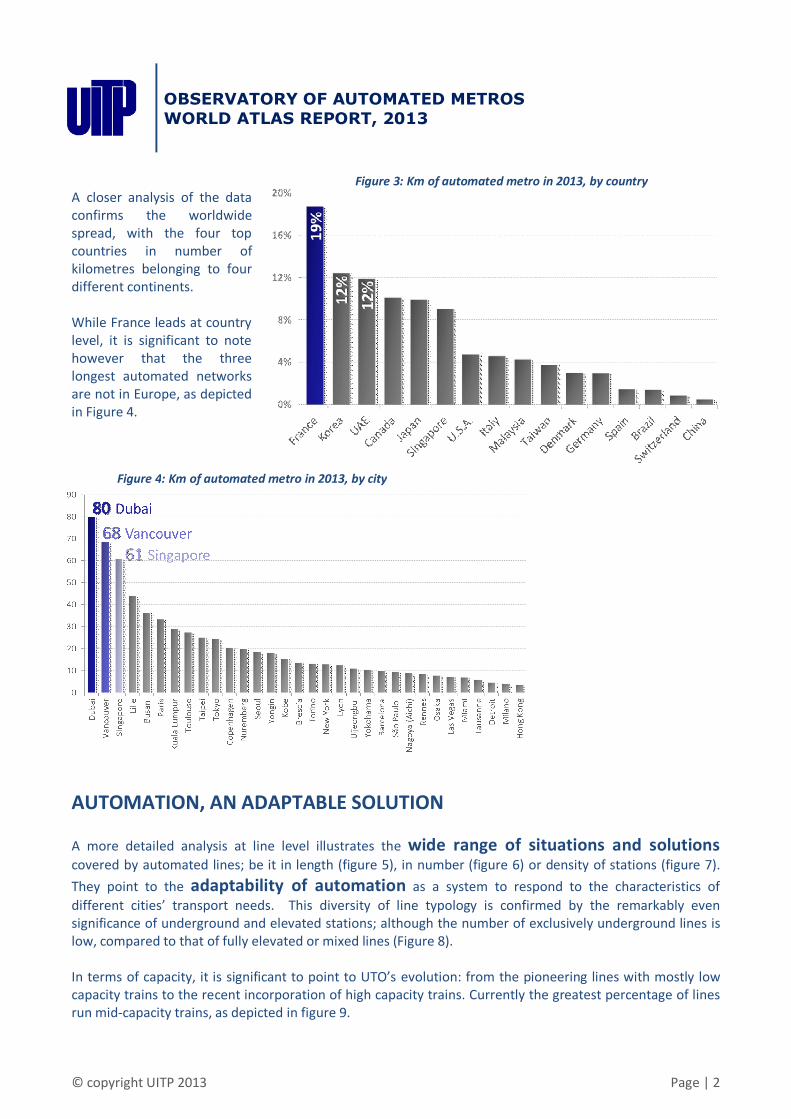
Figure 3: Km of automated metro in 2013, by country
Figure 4: Km of automated metro in 2013, by city
A closer analysis of the data confirms the worldwide spread, with the four top countries in number of kilometres belonging to four different continents. While France leads at country level, it is significant to note however that the three longest automated networks are not in Europe, as depicted in Figure 4.
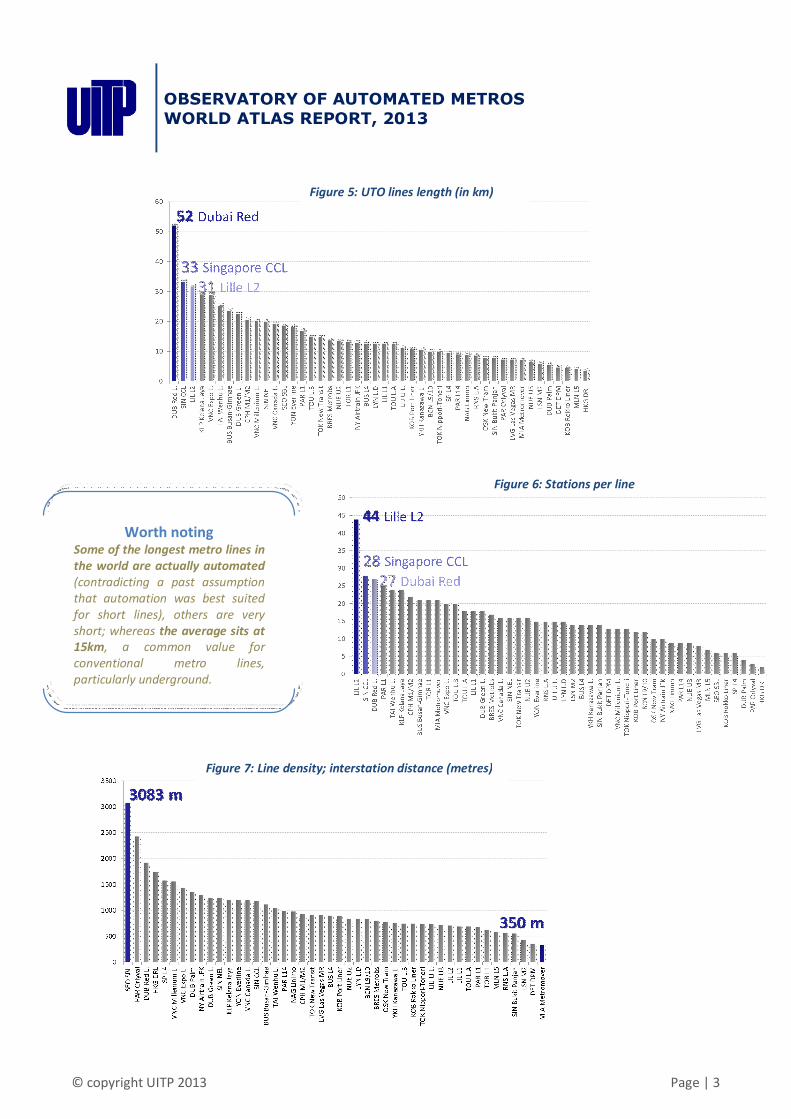
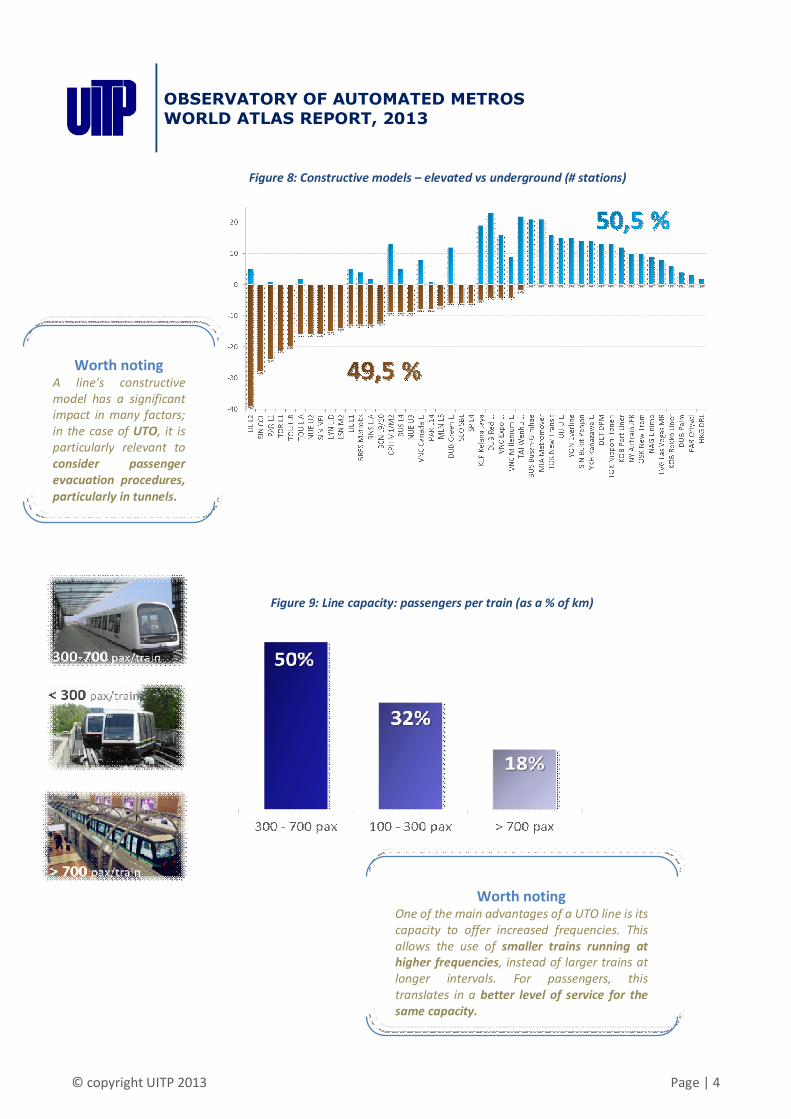
AUTOMATION, AN ADAPTABLE SOLUTION A more detailed analysis at line level illustrates the wide range of situations and solutions covered by automated lines; be it in length (figure 5), in number (figure 6) or density of stations (figure 7). They point to the adaptability of automation as a system to respond to the characteristics of different cities’ transport needs. This diversity of line typology is confirmed by the remarkably even significance of underground and elevated stations; although the number of exclusively underground lines is low, compared to that of fully elevated or mixed lines (Figure 8). In terms of capacity, it is significant to point to UTO’s evolution: from the pioneering lines with mostly low capacity trains to the recent incorporation of high capacity trains. Currently the greatest percentage of lines run mid-capacity trains, as depicted in figure 9.
OBSERVATORY OF AUTOMATED METROS WORLD ATLAS REPORT, 2013
© copyright UITP 2013 Page | 3
Figure 5: UTO lines length (in km)
Worth noting Some of the longest metro lines in the world are actually automated (contradicting a past assumption that automation was best suited for short lines), others are very short; whereas the average sits at 15km, a common value for conventional metro lines, particularly underground.
Figure 7: Line density; interstation distance (metres)
Figure 6: Stations per line
OBSERVATORY OF AUTOMATED METROS WORLD ATLAS REPORT, 2013
© copyright UITP 2013 Page | 4
Figure 8: Constructive models – elevated vs underground (# stations)
Figure 9: Line capacity: passengers per train (as a % of km)
Worth noting A line’s constructive model has a significant impact in many factors; in the case of UTO, it is particularly relevant to consider passenger evacuation procedures, particularly in tunnels.
Worth noting One of the main advantages of a UTO line is its capacity to offer increased frequencies. This allows the use of smaller trains running at higher frequencies, instead of larger trains at longer intervals. For passengers, this translates in a better level of service for the same capacity.
OBSERVATORY OF AUTOMATED METROS WORLD ATLAS REPORT, 2013
© copyright UITP 2013 Page | 5
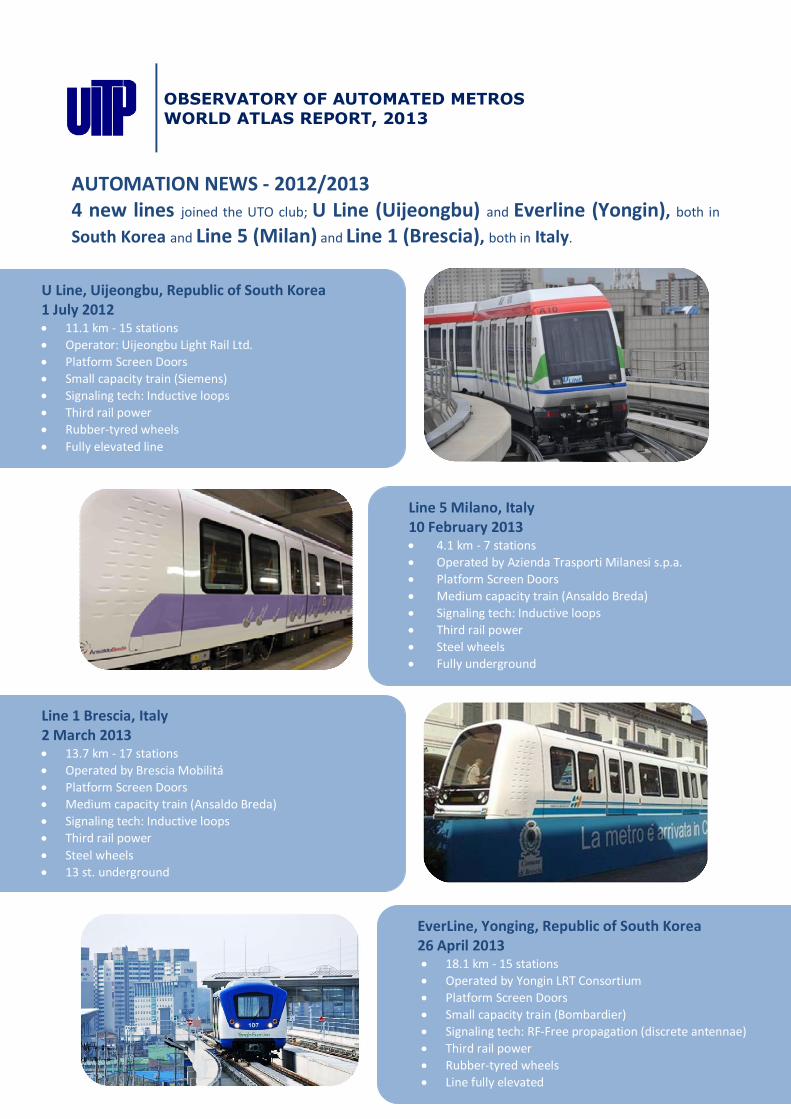
AUTOMATION NEWS - 2012/2013 4 new lines joined the UTO club; U Line (Uijeongbu) and Everline (Yongin), both in South Korea and Line 5 (Milan) and Line 1 (Brescia), both in Italy.
U Line, Uijeongbu, Republic of South Korea 1 July 2012 • 11.1 km - 15 stations • Operator: Uijeongbu Light Rail Ltd. • Platform Screen Doors • Small capacity train (Siemens) • Signaling tech: Inductive loops • Third rail power • Rubber-tyred wheels • Fully elevated line
Line 5 Milano, Italy 10 February 2013 • 4.1 km - 7 stations • Operated by Azienda Trasporti Milanesi s.p.a. • Platform Screen Doors • Medium capacity train (Ansaldo Breda) • Signaling tech: Inductive loops • Third rail power • Steel wheels • Fully underground
Line 1 Brescia, Italy 2 March 2013 • 13.7 km - 17 stations • Operated by Brescia Mobilitá • Platform Screen Doors • Medium capacity train (Ansaldo Breda) • Signaling tech: Inductive loops • Third rail power • Steel wheels • 13 st. underground
EverLine, Yonging, Republic of South Korea 26 April 2013 • 18.1 km - 15 stations • Operated by Yongin LRT Consortium • Platform Screen Doors • Small capacity train (Bombardier) • Signaling tech: RF-Free propagation (discrete antennae) • Third rail power • Rubber-tyred wheels • Line fully elevated
OBSERVATORY OF AUTOMATED METROS WORLD ATLAS REPORT, 2013
© copyright UITP 2013 Page | 6
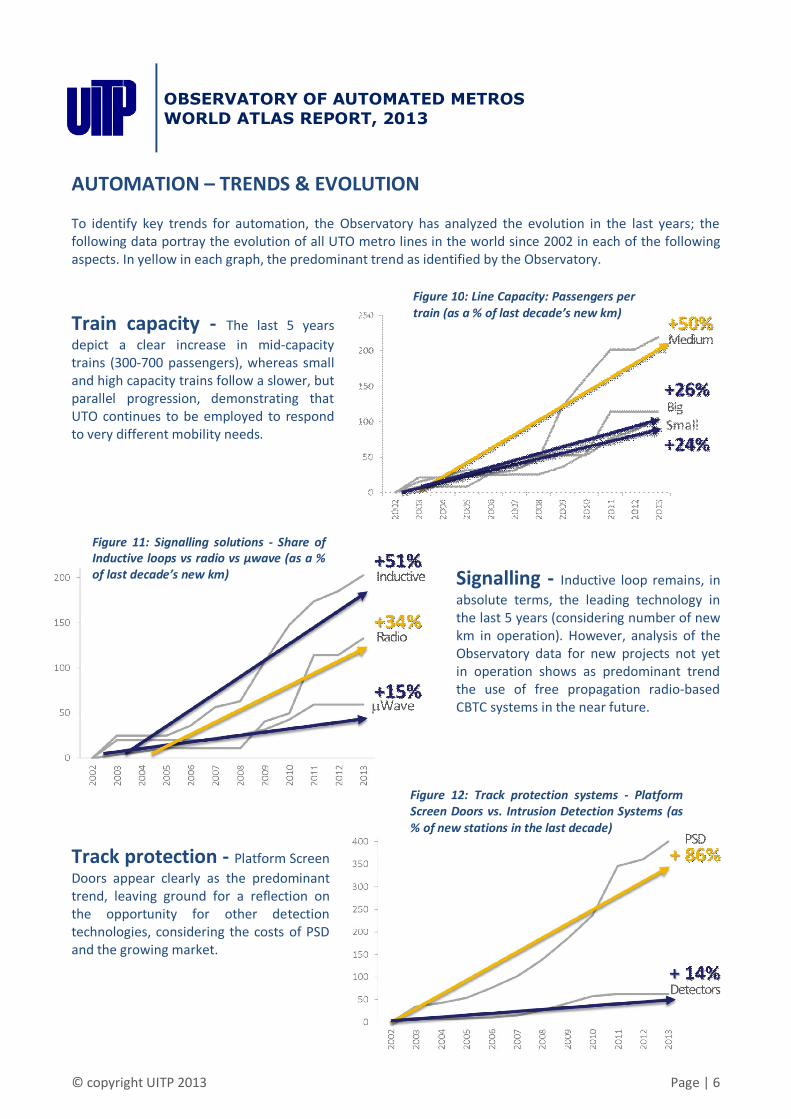
Figure 10: Line Capacity: Passengers per train (as a % of last decade’s new km)
Figure 11: Signalling solutions - Share of Inductive loops vs radio vs µwave (as a % of last decade’s new km)
Figure 12: Track protection systems - Platform Screen Doors vs. Intrusion Detection Systems (as % of new stations in the last decade)
AUTOMATION – TRENDS & EVOLUTION To identify key trends for automation, the Observatory has analyzed the evolution in the last years; the following data portray the evolution of all UTO metro lines in the world since 2002 in each of the following aspects. In yellow in each graph, the predominant trend as identified by the Observatory.
Train capacity - The last 5 years depict a clear increase in mid-capacity trains (300-700 passengers), whereas small and high capacity trains follow a slower, but parallel progression, demonstrating that UTO continues to be employed to respond to very different mobility needs.
Signalling - Inductive loop remains, in absolute terms, the leading technology in the last 5 years (considering number of new km in operation). However, analysis of the Observatory data for new projects not yet in operation shows as predominant trend the use of free propagation radio-based CBTC systems in the near future.
Track protection - Platform Screen Doors appear clearly as the predominant trend, leaving ground for a reflection on the opportunity for other detection technologies, considering the costs of PSD and the growing market.
OBSERVATORY OF AUTOMATED METROS WORLD ATLAS REPORT, 2013
© copyright UITP 2013 Page | 7
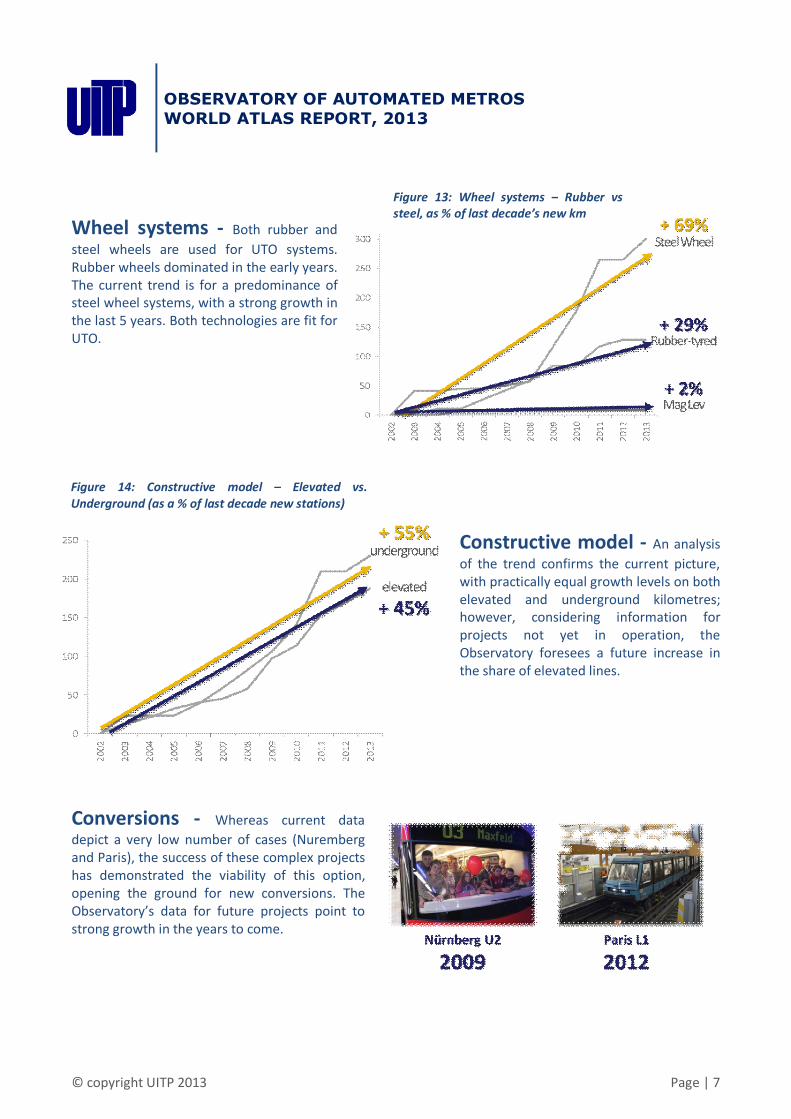
Figure 14: Constructive model – Elevated vs. Underground (as a % of last decade new stations)
Figure 13: Wheel systems – Rubber vs steel, as % of last decade’s new km
Wheel systems - Both rubber and steel wheels are used for UTO systems. Rubber wheels dominated in the early years. The current trend is for a predominance of steel wheel systems, with a strong growth in the last 5 years. Both technologies are fit for UTO.
Constructive model - An analysis of the trend confirms the current picture, with practically equal growth levels on both elevated and underground kilometres; however, considering information for projects not yet in operation, the Observatory foresees a future increase in the share of elevated lines.
Conversions - Whereas current data depict a very low number of cases (Nuremberg and Paris), the success of these complex projects has demonstrated the viability of this option, opening the ground for new conversions. The Observatory’s data for future projects point to strong growth in the years to come.
OBSERVATORY OF AUTOMATED METROS WORLD ATLAS REPORT, 2013
© copyright UITP 2013 Page | 8
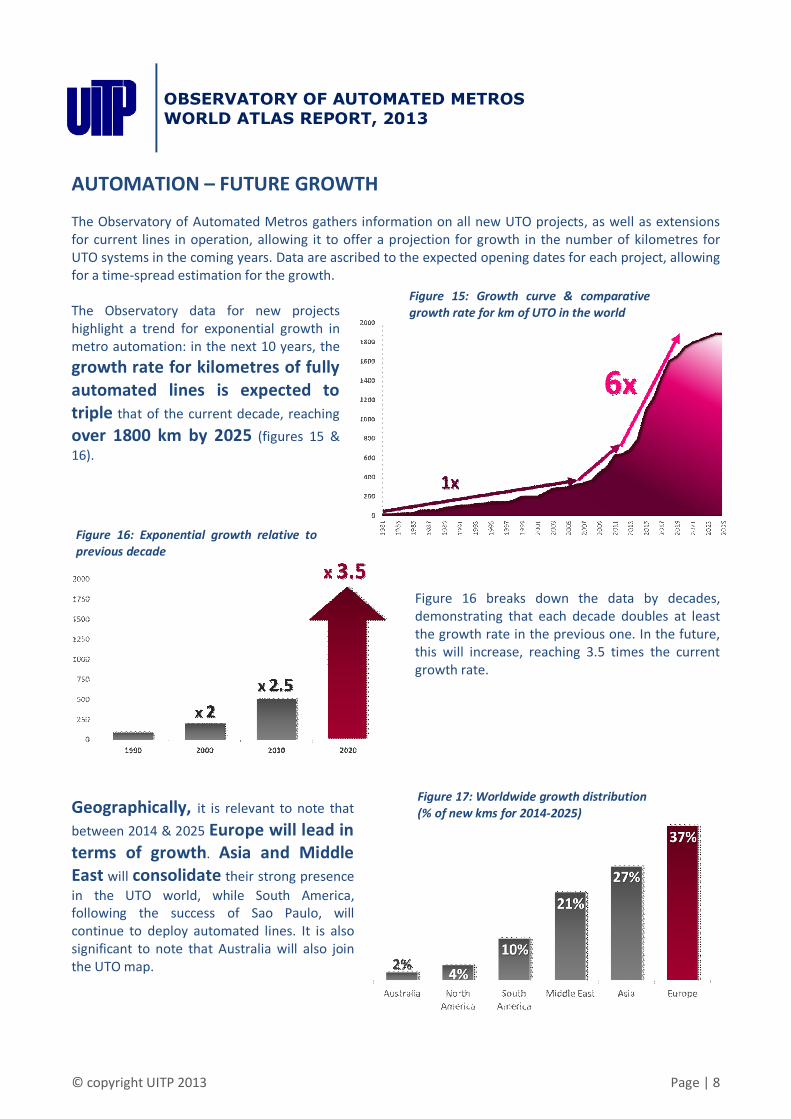
Figure 15: Growth curve & comparative growth rate for km of UTO in the world
Figure 16: Exponential growth relative to previous decade
Figure 17: Worldwide growth distribution (% of new kms for 2014-2025)
AUTOMATION – FUTURE GROWTH
The Observatory of Automated Metros gathers information on all new UTO projects, as well as extensions for current lines in operation, allowing it to offer a projection for growth in the number of kilometres for UTO systems in the coming years. Data are ascribed to the expected opening dates for each project, allowing for a time-spread estimation for the growth. The Observatory data for new projects highlight a trend for exponential growth in metro automation: in the next 10 years, the growth rate for kilometres of fully automated lines is expected to triple that of the current decade, reaching over 1800 km by 2025 (figures 15 & 16).
Figure 16 breaks down the data by decades, demonstrating that each decade doubles at least the growth rate in the previous one. In the future, this will increase, reaching 3.5 times the current growth rate.
Geographically, it is relevant to note that between 2014 & 2025 Europe will lead in terms of growth. Asia and Middle East will consolidate their strong presence in the UTO world, while South America, following the success of Sao Paulo, will continue to deploy automated lines. It is also significant to note that Australia will also join the UTO map.
OBSERVATORY OF AUTOMATED METROS WORLD ATLAS REPORT, 2013
© copyright UITP 2013 Page | 9
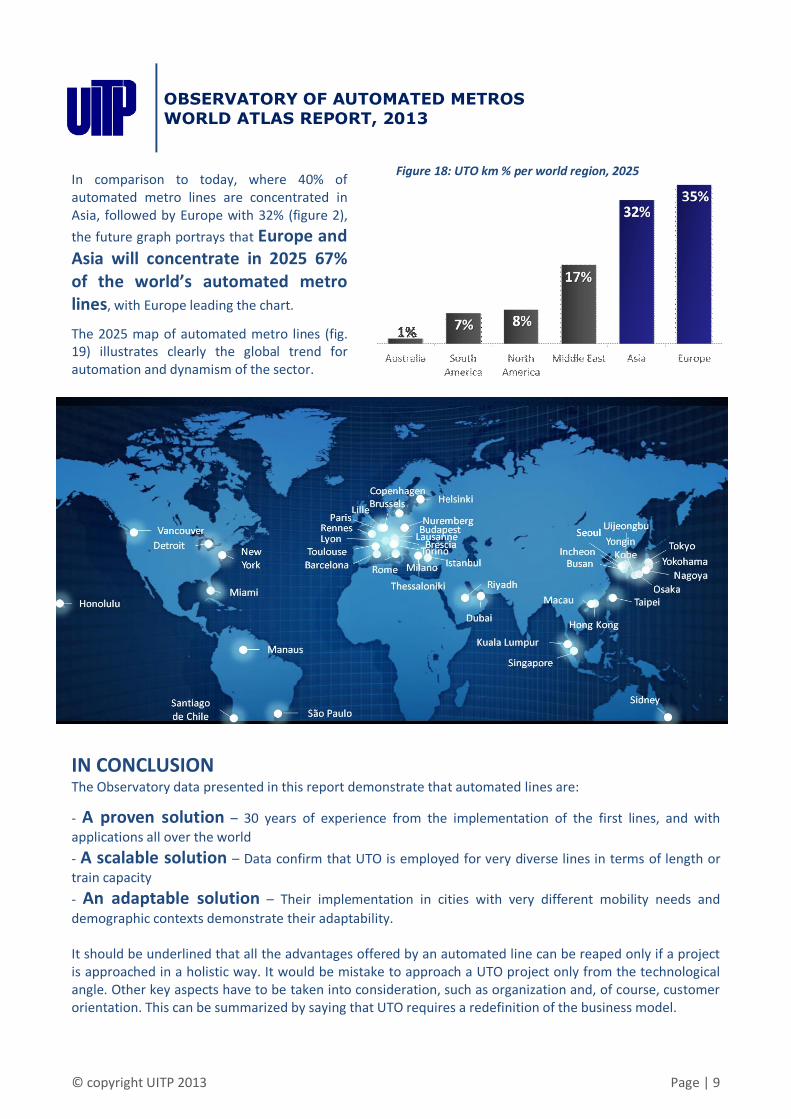
Figure 18: UTO km % per world region, 2025 In comparison to today, where 40% of automated metro lines are concentrated in Asia, followed by Europe with 32% (figure 2), the future graph portrays that Europe and Asia will concentrate in 2025 67% of the world’s automated metro lines, with Europe leading the chart.
The 2025 map of automated metro lines (fig. 19) illustrates clearly the global trend for automation and dynamism of the sector.
IN CONCLUSION The Observatory data presented in this report demonstrate that automated lines are:
- A proven solution – 30 years of experience from the implementation of the first lines, and with applications all over the world - A scalable solution – Data confirm that UTO is employed for very diverse lines in terms of length or train capacity - An adaptable solution – Their implementation in cities with very different mobility needs and demographic contexts demonstrate their adaptability. It should be underlined that all the advantages offered by an automated line can be reaped only if a project is approached in a holistic way. It would be mistake to approach a UTO project only from the technological angle. Other key aspects have to be taken into consideration, such as organization and, of course, customer orientation. This can be summarized by saying that UTO requires a redefinition of the business model.
OBSERVATORY OF AUTOMATED METROS WORLD ATLAS REPORT, 2013
© copyright UITP 2013 Page | 10
THE UITP OBSERVATORY OF AUTOMATED METROS
The Observatory of Automated Metros is a UITP body composed of leading operators in this sector worldwide. Its mission is to disseminate and share knowledge with a cross-cutting approach to all the business perspectives of automated lines operation. It also analyzes the global evolution identifying future trends, presenting them in periodical reports and events.
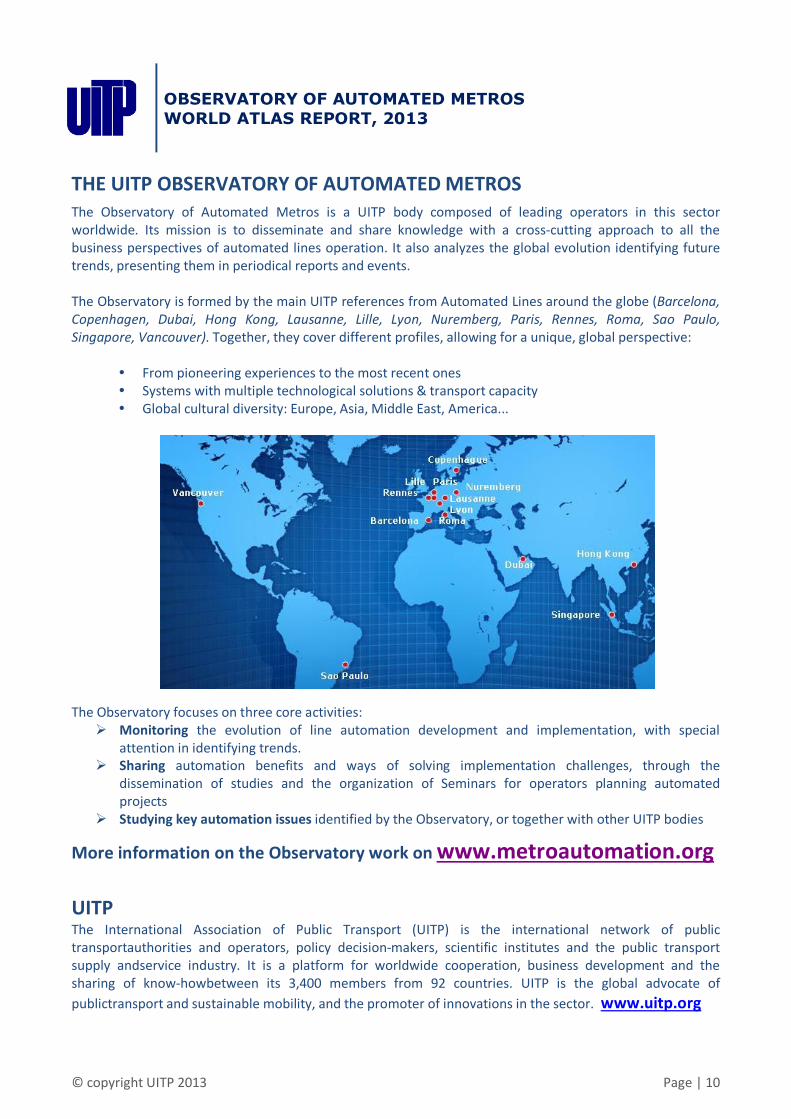
The Observatory is formed by the main UITP references from Automated Lines around the globe (Barcelona, Copenhagen, Dubai, Hong Kong, Lausanne, Lille, Lyon, Nuremberg, Paris, Rennes, Roma, Sao Paulo, Singapore, Vancouver). Together, they cover different profiles, allowing for a unique, global perspective:
� From pioneering experiences to the most recent ones � Systems with multiple technological solutions & transport capacity � Global cultural diversity: Europe, Asia, Middle East, America...
The Observatory focuses on three core activities: Ø Monitoring the evolution of line automation development and implementation, with special
attention in identifying trends. Ø Sharing automation benefits and ways of solving implementation challenges, through the
dissemination of studies and the organization of Seminars for operators planning automated projects
Ø Studying key automation issues identified by the Observatory, or together with other UITP bodies
More information on the Observatory work on www.metroautomation.org
UITP The International Association of Public Transport (UITP) is the international network of public transportauthorities and operators, policy decision-makers, scientific institutes and the public transport supply andservice industry. It is a platform for worldwide cooperation, business development and the sharing of know-howbetween its 3,400 members from 92 countries. UITP is the global advocate of publictransport and sustainable mobility, and the promoter of innovations in the sector. www.uitp.org