Embed Size (px)
Citation preview

MetLife, Inc. Annual Report 2002


chairman’s letterTo MetLife Shareholders:
A few years ago, MetLife stood before the investment community and made some powerful promises.We laid out specific financial and operational objectives that we would work to achieve over the nextseveral years. We said we would achieve increasing profitability across the enterprise and efficientlyutilize excess capital while improving returns to shareholders. And we said our newly instituted perform-ance management culture would drive MetLife to higher levels of performance.
This December, as the MetLife senior management team and I stood before 200 members of theinvestment community during our annual Investor Day, the message was clear and unequivocal. We aredelivering on our promises. We are doing what we said we would do and are well on the way
to achieving our ambitious goals, despite the hurdles that we and others in the industry have faced.The year 2002 was good for MetLife in terms of financial performance. We delivered to our shareholders results consistent with
investment community expectations and, in fact, exceeded our target of 11.5% operating return on equity, ending the year at 11.7%. Wedelivered to our customers the continued pledge to build financial freedom for everyone. This is what it’s all about—earning the trust ofour various constituencies as we have done for the past 135 years.
Particularly today, in light of stock market volatility, the recent spate of corporate scandals, and the uncertain geopolitical landscape,customers want to deal with a company they can trust. They want a financially strong company that will be there for them, in good timesand bad, to deliver on its guarantees and provide the products they need to feel secure and confident. They want to deal with employeesthey can trust to offer the highest level of objective advice and counsel. And they want to do business with a company which hasintegrity as one of its core values.
Customers want to do business with a company like MetLife, and this year we benefited from this flight to quality. Through disciplinedand strategic financial management and solid business growth, we are increasingly well positioned in the marketplace. Our earnings,despite some significant market hurdles and a difficult operating environment, continue to reflect the diversity, strength and financialflexibility of MetLife’s businesses.
In 2002, we continued to focus on our capital management. As volatile equity markets in 2002 caused rating agencies to take a morecautious view of the insurance industry, we worked quickly to defend our ratings by increasing capital in our primary insurance operatingentity, Metropolitan Life Insurance Company. We did so, in part, from the sale of 17 real estate properties during the fourth quarter thathad a carrying value of approximately $840 million. This special initiative, which is a portion of the company’s total real estate salesprogram, provided us in excess of $500 million in statutory gains. Capital was also raised through a $1 billion debt offering in December,the proceeds of which were used to increase capital in Metropolitan Life Insurance Company and for other general corporate purposes.The combination of these and other actions enhanced Metropolitan Life Insurance Company’s risk based capital ratio, a measure offinancial strength and security used by regulators, rating agencies and investors.
H Business Growth Outpaces the MarketThroughout our lines of business, we surpassed a number of goals this year as we continued to grow and enhance our operations.
The exceptional results of Institutional Business resulted in an operating return on allocated equity of 23.0%, as the business exper-ienced strong top line sales growth and continued expense efficiencies. In fact, our business growth in many cases outpaced themarket, a clear sign that we are improving our competitive positioning.
In 2002, we set out to reduce expenses in our Individual Business operation by $200 million, before income taxes. We exceeded ourgoal and delivered expense savings of $220 million, before income taxes. We realized these savings through rigorous expensediscipline, aggressive utilization of technology and development of common platforms to support many of our functional operations.
In addition to the expense savings in Individual Business, our distribution channels in this operation nimbly shifted gears toaccommodate market demands through their broad array of fixed offerings to compensate for the lower demand for variable products.Increases in whole life, universal life and term life insurance sales offset declines in equity-linked insurance products, while the launch ofa new line of annuity products created new market opportunities in the agent and broker-dealer channels.
Through improved operating fundamentals, including rate increases, Auto & Home exceeded its goal of $155 million in operatingearnings and achieved a combined ratio under 100%. And, through strategic and accretive acquisitions in Mexico and Chile, ourInternational business nearly tripled its operating earnings while continuing to plant seeds for future growth.
H Leveraging the Power of the EnterpriseTo broaden our services and capitalize on a trend in our business over the past several years—the increasing popularity of voluntary
benefits in the workplace, such as life insurance, long-term care, auto and home insurance, and financial advice—we placed ourIndividual and Institutional Businesses under a shared services umbrella in 2002. The U.S. Insurance and Financial Services businesses,while distinct, leverage the strengths of our Individual Business and Institutional Business by creating a common administrative platformwhich will bring to bear the company’s full resources to enhance top-line growth, create greater efficiencies, increase expense savings,bolster product development and accelerate the pace of technology enhancements. More importantly, we will be better positioned toserve our customers.
H Achieving MilestonesWe made a number of business inroads in 2002, including continued success with eBusiness initiatives such as MyBenefits,
MetDental.com and MetLink. By year-end, group life premiums, fees and other revenues were $5.16 billion, voluntary benefit premiumstopped $3 billion, and retirement and savings entered the market with its new fully bundled 401(k) product. Annuity deposits were$7.89 billion, driven by increases in production by: MetLife Investors Group, up 98%; New England Financial, up 32%; MetLifeResources, up 16%; and, MetLife Financial Services, up 6%. Fixed annuity deposits were $1.47 billion and variable annuity depositswere $6.42 billion.
In the international arena, MetLife’s acquisition of Mexico’s Aseguradora Hidalgo S.A., vaulted us to the #1 spot in life insurance inthat country. This acquisition enabled MetLife to further expand its presence in Mexico, a country in which we’ve had very goodexperience through MetLife Genesis, a wholly-owned subsidiary since 1992.
International is a growth area for MetLife as we continue to tap opportunities in underserved, yet growing markets worldwide. In fact,we are challenging International to grow operating earnings by 30% to 40% and operating revenues by 15% to 20% each year, obtainingleadership positions in three or four countries by 2005, and to contribute 7%-9% of the company’s total operating revenues andoperating earnings by that year.
H MetLife and SnoopyPart of our strength as a company comes from our brand, one of the most widely recognized and trusted in the world. Snoopy is our
corporate ambassador and has been an important part of our advertising campaigns for more than 17 years. In December 2002, wesigned a new 10-year contract with United Media to continue the inclusion of Snoopy and the PEANUTS characters in MetLife’sdomestic and certain international advertising.
H Setting Higher Standards for PerformanceMetLife’s relentless focus on performance management continues to produce tangible results. Consider that six years ago, when we
implemented performance management, our adjusted operating return on equity was 7%. As of December 31, 2002, our operating returnon equity was 11.7%. What this tells me, and the broader investment community, is that we are driving results by rewarding perform-ance. Within this culture, we continue to attract and retain top achievers. People are recognizing that MetLife is an exciting place to be.
With solid business strategies, capital strength and continued discipline around operational excellence, MetLife is very well posi-tioned. Our tradition of trust and integrity has become a vital point of differentiation that has enabled MetLife to benefit from the flight toquality evidenced in today’s marketplace. This is something we’re proud of, and which is reaffirmed day-to-day as an integral part of howwe manage our business.
MetLife’s leadership in the world’s financial service arena carries with it responsibilities as large as they are exciting. To me, there canbe no doubt about our ability to deliver on our promises. There can be no question as to our honor. Earning marketplace respect, andyour respect as our shareholders, is a priority for me, and for all employees of MetLife. Thank you for your continued commitment toMetLife’s success.
Sincerely,
Robert H. BenmoscheChairman of the Board and Chief Executive OfficerMarch 27, 2003
* Operating return on equity is defined as operating earnings divided by average equity (excluding unrealized investment gains and losses). Operating earnings is defined asnet income excluding net investment gains or losses, net of income taxes. Operating earnings is a non-GAAP financial measure that management uses in managing thecompany’s business and evaluating its results.
Adjusted operating return on equity also excludes $190 million, net of income taxes, of certain litigation-related charges.
Cautionary Statement on Forward-Looking Statements
This Annual Report, including the Management’s Discussion and Analysis of Financial Condition and Results of Operations, contains statementswhich constitute forward-looking statements within the meaning of the Private Securities Litigation Reform Act of 1995, including statements relating totrends in the operations and financial results and the business and the products of the Registrant and its subsidiaries, as well as other statementsincluding words such as ‘‘anticipate,’’ ‘‘believe,’’ ‘‘plan,’’ ‘‘estimate,’’ ‘‘expect,’’ ‘‘intend’’ and other similar expressions. ‘‘MetLife’’ or the ‘‘Company’’ refersto MetLife, Inc., a Delaware corporation (the ‘‘Holding Company’’), and its subsidiaries, including Metropolitan Life Insurance Company (‘‘MetropolitanLife’’). Forward-looking statements are made based upon management’s current expectations and beliefs concerning future developments and theirpotential effects on the Company. Such forward-looking statements are not guarantees of future performance.
Actual results may differ materially from those included in the forward-looking statements as a result of risks and uncertainties including, but notlimited to, the following: (i) changes in general economic conditions, including the performance of financial markets and interest rates; (ii) heightenedcompetition, including with respect to pricing, entry of new competitors and the development of new products by new and existing competitors;(iii) unanticipated changes in industry trends; (iv) MetLife, Inc.’s primary reliance, as a holding company, on dividends from its subsidiaries to meet debtpayment obligations and the applicable regulatory restrictions on the ability of the subsidiaries to pay such dividends; (v) deterioration in the experience ofthe ‘‘closed block’’ established in connection with the reorganization of Metropolitan Life; (vi) catastrophe losses; (vii) adverse litigation or arbitrationresults; (viii) regulatory, accounting or tax changes that may affect the cost of, or demand for, the Company’s products or services; (ix) downgrades in theCompany’s and its affiliates’ claims paying ability, financial strength or debt ratings; (x) changes in rating agency policies or practices; (xi) discrepanciesbetween actual claims experience and assumptions used in setting prices for the Company’s products and establishing the liabilities for the Company’sobligations for future policy benefits and claims; (xii) discrepancies between actual experience and assumptions used in establishing liabilities related toother contingencies or obligations; (xiii) the effects of business disruption or economic contraction due to terrorism or other hostilities; and (xiv) other risksand uncertainties described from time to time in MetLife, Inc.’s filings with the U.S. Securities and Exchange Commission, including its S-1 andS-3 registration statements. The Company specifically disclaims any obligation to update or revise any forward-looking statement, whether as a result ofnew information, future developments or otherwise.
Selected Financial Data
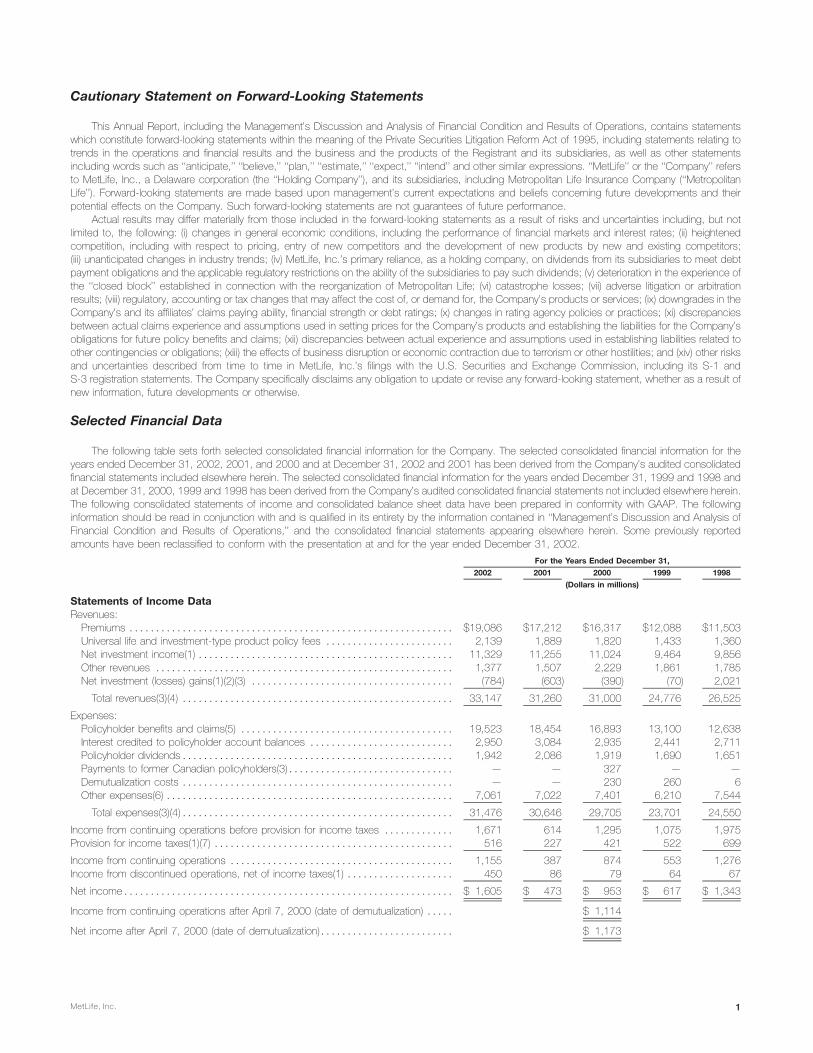
The following table sets forth selected consolidated financial information for the Company. The selected consolidated financial information for theyears ended December 31, 2002, 2001, and 2000 and at December 31, 2002 and 2001 has been derived from the Company’s audited consolidatedfinancial statements included elsewhere herein. The selected consolidated financial information for the years ended December 31, 1999 and 1998 andat December 31, 2000, 1999 and 1998 has been derived from the Company’s audited consolidated financial statements not included elsewhere herein.The following consolidated statements of income and consolidated balance sheet data have been prepared in conformity with GAAP. The followinginformation should be read in conjunction with and is qualified in its entirety by the information contained in ‘‘Management’s Discussion and Analysis ofFinancial Condition and Results of Operations,’’ and the consolidated financial statements appearing elsewhere herein. Some previously reportedamounts have been reclassified to conform with the presentation at and for the year ended December 31, 2002.
For the Years Ended December 31,
2002 2001 2000 1999 1998
(Dollars in millions)
Statements of Income DataRevenues:
Premiums ************************************************************* $19,086 $17,212 $16,317 $12,088 $11,503Universal life and investment-type product policy fees ************************ 2,139 1,889 1,820 1,433 1,360Net investment income(1) ************************************************ 11,329 11,255 11,024 9,464 9,856Other revenues ******************************************************** 1,377 1,507 2,229 1,861 1,785Net investment (losses) gains(1)(2)(3) ************************************** (784) (603) (390) (70) 2,021
Total revenues(3)(4) *************************************************** 33,147 31,260 31,000 24,776 26,525
Expenses:Policyholder benefits and claims(5) **************************************** 19,523 18,454 16,893 13,100 12,638Interest credited to policyholder account balances *************************** 2,950 3,084 2,935 2,441 2,711Policyholder dividends*************************************************** 1,942 2,086 1,919 1,690 1,651Payments to former Canadian policyholders(3)******************************* — — 327 — —Demutualization costs *************************************************** — — 230 260 6Other expenses(6) ****************************************************** 7,061 7,022 7,401 6,210 7,544
Total expenses(3)(4)*************************************************** 31,476 30,646 29,705 23,701 24,550
Income from continuing operations before provision for income taxes ************* 1,671 614 1,295 1,075 1,975Provision for income taxes(1)(7) ********************************************* 516 227 421 522 699
Income from continuing operations ****************************************** 1,155 387 874 553 1,276Income from discontinued operations, net of income taxes(1) ******************** 450 86 79 64 67
Net income************************************************************** $ 1,605 $ 473 $ 953 $ 617 $ 1,343
Income from continuing operations after April 7, 2000 (date of demutualization) ***** $ 1,114
Net income after April 7, 2000 (date of demutualization)************************* $ 1,173
MetLife, Inc. 1

At December 31,
2002 2001 2000 1999 1998
(Dollars in millions)
Balance Sheet DataAssets:
General account assets************************************************** $217,692 $194,256 $183,912 $160,291 $157,278Separate account assets************************************************* 59,693 62,714 70,250 64,941 58,068
Total assets ********************************************************** $277,385 $256,970 $254,162 $225,232 $215,346
Liabilities:Life and health policyholder liabilities(8) ************************************* $162,569 $148,395 $140,040 $122,637 $122,726Property and casualty policyholder liabilities(8) ******************************* 2,673 2,610 2,559 2,318 1,477Short-term debt ******************************************************** 1,161 355 1,085 4,180 3,572Long-term debt********************************************************* 4,425 3,628 2,400 2,494 2,886Separate account liabilities *********************************************** 59,693 62,714 70,250 64,941 58,068Other liabilities ********************************************************** 28,214 21,950 20,349 14,972 11,750
Total liabilities********************************************************* 258,735 239,652 236,683 211,542 200,479
Company-obligated mandatorily redeemable securities of subsidiary trusts********** 1,265 1,256 1,090 — —
Stockholders’ Equity:Common stock, at par value(9)******************************************** 8 8 8 — —Additional paid-in capital(9) *********************************************** 14,968 14,966 14,926 — —Retained earnings(9)***************************************************** 2,807 1,349 1,021 14,100 13,483Treasury stock, at cost(9)************************************************* (2,405) (1,934) (613) — —
Accumulated other comprehensive income (loss)******************************* 2,007 1,673 1,047 (410) 1,384
Total stockholders’ equity*********************************************** 17,385 16,062 16,389 13,690 14,867
Total liabilities and stockholders’ equity *********************************** $277,385 $256,970 $254,162 $225,232 $215,346
At or for the Years Ended December 31,
2002 2001 2000 1999 1998
(Dollars in millions, except per share data)
Other DataNet income ****************************************************** $ 1,605 $ 473 $ 953 $ 617 $ 1,343Return on equity(10)*********************************************** 10.8% 3.2% 6.5% 4.5% 9.4%Total assets under management(11)********************************** $299,166 $282,486 $301,325 $373,612 $360,703
Income from Continuing Operations Per Share Data(12)Basic earnings per share******************************************* $ 1.64 $ 0.52 $ 1.44 N/A N/ADiluted earnings per share****************************************** $ 1.58 $ 0.51 $ 1.41 N/A N/A
Income from Discontinued Operations Per Share Data(12)Basic earnings per share******************************************* $ 0.64 $ 0.12 $ 0.08 N/A N/ADiluted earnings per share****************************************** $ 0.62 $ 0.11 $ 0.08 N/A N/A
Net Income Per Share Data(12)Basic earnings per share******************************************* $ 2.28 $ 0.64 $ 1.52 N/A N/ADiluted earnings per share****************************************** $ 2.20 $ 0.62 $ 1.49 N/A N/A
Dividends Declared Per Share ************************************* $ 0.21 $ 0.20 $ 0.20 N/A N/A
(1) In accordance with Statement of Financial Accounting Standards (‘‘SFAS’’) No. 144, Accounting for the Impairment or Disposal of Long-LivedAssets, income related to real estate sold or classified as held-for-sale for transactions initiated on or after January 1, 2002 is presented asdiscontinued operations. The following table presents the components of income from discontinued operations:
For the Years Ended December 31,
2002 2001 2000 1999 1998
(Dollars in millions)
Net investment income ***************************************** $ 124 $ 125 $ 121 $ 100 $ 106Net investment gains ******************************************* 582 — — — —
Total revenues ********************************************** 706 125 121 100 106Provision for income taxes ************************************** 256 39 42 36 39
Income from discontinued operations *************************** $ 450 $ 86 $ 79 $ 64 $ 67
MetLife, Inc.2

(2) Investment gains and losses are presented net of related policyholder amounts. The amounts netted against investment gains and losses are thefollowing:
For the Years Ended December 31,
2002 2001 2000 1999 1998
(Dollars in millions)
Gross investment (losses) gains *********************************** $(929) $(737) $(444) $(137) $2,629
Less amounts allocable to:Future policy benefit loss recognition ***************************** — — — — (272)Deferred policy acquisition costs ******************************** (5) (25) 95 46 (240)Participating contracts ***************************************** (7) — (126) 21 (96)Policyholder dividend obligation ********************************* 157 159 85 — —
Net investment (losses) gains ************************************* $(784) $(603) $(390) $ (70) $2,021
Investment gains and losses have been reduced by (i) additions to future policy benefits resulting from the need to establish additional liabilities dueto the recognition of investment gains, (ii) amortization of deferred policy acquisition costs, to the extent that such amortization results frominvestment gains and losses, (iii) adjustments to participating contractholder accounts when amounts equal to such investment gains and losses areapplied to the contractholder’s accounts, and (iv) adjustments to the policyholder dividend obligation resulting from investment gains and losses.This presentation may not be comparable to presentations made by other insurers.
(3) Includes the following combined financial statement data of Conning Corporation (‘‘Conning’’), which was sold in 2001, the Company’s controllinginterest in Nvest Companies, L.P. and its affiliates (‘‘Nvest’’), which were sold in 2000, MetLife Capital Holdings, Inc., which was sold in 1998, andthe Company’s Canadian operations and U.K. insurance operations, substantially all of which were sold in 1998:
For the Years Ended December 31,
2001 2000 1999 1998
(Dollars in millions)
Total revenues ************************************************************* $32 $605 $655 $1,405
Total expenses************************************************************* $33 $580 $603 $1,275
As a result of these sales, investment gains of $25 million, $663 million, and $520 million were recorded for the years ended December 31, 2001,2000, and 1998, respectively.
In July 1998, Metropolitan Life sold a substantial portion of its Canadian operations to Clarica Life Insurance Company (‘‘Clarica Life’’). As part of thatsale, a large block of policies in effect with Metropolitan Life in Canada were transferred to Clarica Life, and the holders of the transferred Canadianpolicies became policyholders of Clarica Life. Those transferred policyholders were no longer policyholders of Metropolitan Life and, therefore, werenot entitled to compensation under the plan of reorganization. However, as a result of a commitment made in connection with obtaining Canadianregulatory approval of that sale and in connection with the demutualization, in 2000, Metropolitan Life’s Canadian branch made cash payments tothose who were, or were deemed to be, holders of these transferred Canadian policies. The payments were determined in a manner that isconsistent with the treatment of, and fair and equitable to, eligible policyholders of Metropolitan Life.
(4) Included in total revenues and total expenses for the year ended December 31, 2002 are $421 million and $358 million, respectively, related toAseguradora Hidalgo S.A., which was acquired in June 2002. Included in total revenues and total expenses for the year ended December 31, 2000are $3,739 million and $3,561 million, respectively, related to GenAmerica, which was acquired in January 2000.
(5) Policyholder benefits and claims exclude ($150) million, ($159) million, $41 million, ($21) million, and $368 million for the years ended December 31,2002, 2001, 2000, 1999, and 1998, respectively, of future policy benefit loss recognition, adjustments to participating contractholder accounts andchanges in the policyholder dividend obligation that have been netted against net investment gains and losses as such amounts are directly relatedto such gains and losses. This presentation may not be comparable to presentations made by other insurers.
(6) Other expenses exclude $5 million, $25 million, ($95) million, ($46) million, and $240 million for the years ended December 31, 2002, 2001, 2000,1999 and 1998, respectively, of amortization of deferred policy acquisition costs that have been netted against net investment gains and losses assuch amounts are directly related to such gains and losses. This presentation may not be comparable to presentations made by other insurers.
(7) Provision for income taxes includes ($145) million, $125 million, and $18 million for surplus tax (credited) accrued by Metropolitan Life for the yearsended December 31, 2000, 1999, and 1998, respectively. Prior to its demutualization, Metropolitan Life was subject to surplus tax imposed onmutual life insurance companies under Section 809 of the Internal Revenue Code.
(8) Policyholder liabilities include future policy benefits and other policyholder funds. Life and health policyholder liabilities also include policyholderaccount balances, policyholder dividends payable and the policyholder dividend obligation.
(9) For additional information regarding these items, see Notes 1 and 17 of Notes to Consolidated Financial Statements.(10) Return on equity is defined as net income divided by average total equity, excluding accumulated other comprehensive income (loss).(11) Includes MetLife’s general account and separate account assets managed on behalf of third parties. Includes $21 billion of assets under
management managed by Conning at December 31, 2000, which was sold in 2001. Includes $133 billion and $135 billion of assets undermanagement managed by Nvest at December 31, 1999 and 1998, respectively, which was sold in 2000.
(12) Based on earnings subsequent to the date of demutualization. For additional information regarding net income per share data, see Note 19 of Notesto Consolidated Financial Statements.
MetLife, Inc. 3

Management’s Discussion and Analysis of Financial Condition and Results of Operations
For purposes of this discussion, the terms ‘‘Company’’ or ‘‘MetLife’’ refer, at all times prior to the date of demutualization (as hereinafter defined), toMetropolitan Life Insurance Company (‘‘Metropolitan Life’’), a mutual life insurance company organized under the laws of the State of New York, and itssubsidiaries, and at all times on and after the date of demutualization, to MetLife, Inc. (the ‘‘Holding Company’’), a Delaware corporation, and itssubsidiaries, including Metropolitan Life. Following this summary is a discussion addressing the consolidated results of operations and financial conditionof the Company for the periods indicated. This discussion should be read in conjunction with the Company’s consolidated financial statements includedelsewhere herein.
Business Realignment InitiativesDuring the fourth quarter of 2001, the Company implemented several business realignment initiatives, which resulted from a strategic review of
operations and an ongoing commitment to reduce expenses. The following tables represent the original expenses recorded in the fourth quarter of 2001and the remaining liability as of December 31, 2002:
Pre-tax Charges Recorded in the Fourth Quarter of 2001
Institutional Individual Auto & Home Total
(Dollars in millions)
Severance and severance-related costs ******************************** $ 9 $32 $ 3 $ 44Facilities’ consolidation costs ****************************************** 3 65 — 68Business exit costs************************************************** 387 — — 387
Total ********************************************************** $399 $97 $ 3 $499
Remaining Liability as of December 31, 2002
Institutional Individual Auto & Home Total
(Dollars in millions)
Severance and severance-related costs ********************************* $— $ 1 $— $ 1Facilities’ consolidation costs ******************************************* — 17 — 17Business exit costs*************************************************** 40 — — 40
Total *********************************************************** $40 $18 $— $58
The business realignment initiatives resulted in savings of approximately $95 million, net of income tax, during 2002, comprised of approximately$33 million, $57 million and $5 million in the Institutional, Individual and Auto & Home segments, respectively.
Institutional. The charges to this segment in the fourth quarter of 2001 include costs associated with exiting a business, including the write-off ofgoodwill, severance and severance-related costs, and facilities’ consolidation costs. These expenses are the result of the discontinuance of certain401(k) recordkeeping services and externally-managed guaranteed index separate accounts. These actions resulted in charges to policyholder benefitsand claims and other expenses of $215 million and $184 million, respectively. During the fourth quarter of 2002, approximately $30 million of the chargesrecorded in 2001 were released into income primarily as a result of the accelerated implementation of the Company’s exit from the large market 401(k)business. The business realignment initiatives will ultimately result in the elimination of approximately 930 positions. As of December 31, 2002, there wereapproximately 340 terminations to be completed. The Company continues to carry a liability as of December 31, 2002 since the exit plan could not becompleted within one year due to circumstances outside the Company’s control and since certain of its contractual obligations extended beyond oneyear.
Individual. The charges to this segment in the fourth quarter of 2001 include facilities’ consolidation costs, severance and severance-related costs,which predominately stem from the elimination of approximately 560 non-sales positions and 190 operations and technology positions supporting thissegment. As of December 31, 2002, there were approximately 25 terminations to be completed. These costs were recorded in other expenses. Theremaining liability as of December 31, 2002 is due to certain contractual obligations that extended beyond one year.
Auto & Home. The charges to this segment in the fourth quarter of 2001 include severance and severance-related costs associated with theelimination of approximately 200 positions. All terminations were completed as of December 31, 2002. The costs were recorded in other expenses.
September 11, 2001 TragediesOn September 11, 2001 terrorist attacks occurred in New York, Washington, D.C. and Pennsylvania (the ‘‘tragedies’’) triggering a significant loss of
life and property which had an adverse impact on certain of the Company’s businesses. The Company has direct exposure to these events with claimsarising from its Individual, Institutional, Reinsurance and Auto & Home insurance coverages, and it believes the majority of such claims have beenreported or otherwise analyzed by the Company.
The Company’s original estimate of the total insurance losses related to the tragedies, which was recorded in the third quarter of 2001, was$208 million, net of income taxes of $117 million. Net income for the year ended December 31, 2002 includes a $17 million, net of income taxes of$9 million, benefit from the reduction of the liability associated with the tragedies. The revision to the liability is the result of an analysis completed duringthe fourth quarter of 2002, which focused on the emerging incidence experienced over the past 12 months associated with certain disability products.As of December 31, 2002, the Company’s remaining liability for unpaid and future claims associated with the tragedies was $47 million, principally relatedto disability coverages. This estimate has been and will continue to be subject to revision in subsequent periods, as claims are received from insuredsand the claims to reinsurers are identified and processed. Any revision to the estimate of gross losses and reinsurance recoveries in subsequent periodswill affect net income in such periods. Reinsurance recoveries are dependent on the continued creditworthiness of the reinsurers, which may beadversely affected by their other reinsured losses in connection with the tragedies.
The Company’s general account investment portfolios include investments, primarily comprised of fixed maturities, in industries that were affected bythe tragedies, including airline, other travel, lodging and insurance. Exposures to these industries also exist through mortgage loans and investments inreal estate. The carrying value of the Company’s investment portfolio exposed to industries affected by the tragedies was approximately $3.7 billion atDecember 31, 2002.
MetLife, Inc.4

The long-term effects of the tragedies on the Company’s businesses cannot be assessed at this time. The tragedies have had significant adverseeffects on the general economic, market and political conditions, increasing many of the Company’s business risks. This may have a negative effect onMetLife’s businesses and results of operations over time. In particular, the declines in share prices experienced after the reopening of the U.S. equitymarkets following the tragedies have contributed, and may continue to contribute, to a decline in separate account assets, which in turn may have anadverse effect on fees earned in the Company’s businesses. In addition, the Company has received and expects to continue to receive disability claimsfrom individuals resulting from the tragedies.
The DemutualizationOn April 7, 2000 (the ‘‘date of demutualization’’), pursuant to an order by the New York Superintendent of Insurance (the ‘‘Superintendent’’) approving
its plan of reorganization, as amended (the ‘‘plan’’), Metropolitan Life converted from a mutual life insurance company to a stock life insurance companyand became a wholly-owned subsidiary of the Holding Company. In conjunction therewith, each policyholder’s membership interest was extinguishedand each eligible policyholder received, in exchange for that interest, trust interests representing shares of Common Stock held in the MetLifePolicyholder Trust, cash or an adjustment to their policy values in the form of policy credits, as provided in the plan. In addition, Metropolitan Life’sCanadian branch made cash payments to holders of certain policies transferred to Clarica Life Insurance Company in connection with the sale of asubstantial portion of Metropolitan Life’s Canadian operations in 1998, as a result of a commitment made in connection with obtaining Canadianregulatory approval of that sale. The payments, which were recorded in the second quarter of 2000, were determined in a manner that was consistentwith the treatment of, and fair and equitable to, eligible policyholders of Metropolitan Life.
On the date of demutualization, the Holding Company conducted an initial public offering of 202,000,000 shares of its Common Stock andconcurrent private placements of an aggregate of 60,000,000 shares of its Common Stock at an offering price of $14.25 per share. The shares ofCommon Stock issued in the offerings are in addition to 494,466,664 shares of Common Stock of the Holding Company distributed to the MetropolitanLife Policyholder Trust for the benefit of policyholders of Metropolitan Life in connection with the demutualization. On April 10, 2000, the Holding Companyissued 30,300,000 additional shares of its Common Stock as a result of the exercise of over-allotment options granted to underwriters in the initial publicoffering.
Concurrently with these offerings, MetLife, Inc. and MetLife Capital Trust I, a Delaware statutory business trust wholly-owned by MetLife, Inc. (the‘‘Trust’’), issued 20,125,000 8.00% equity security units (‘‘units’’) for an aggregate offering price of $1,006 million. Each unit originally consisted of (i) acontract to purchase, for $50, shares of Common Stock on May 15, 2003, and (ii) a capital security of the Trust, with a stated liquidation amount of $50.In accordance with the terms of the units, the Trust was dissolved on February 5, 2003 and $1,006 million aggregate principal amount of 8% debenturesof the Holding Company (the ‘‘MetLife debentures’’), the sole asset of the Trust, were distributed to the unit holders. As required by the terms of the units,the MetLife debentures were remarketed on behalf of the debenture holders on February 12, 2003 and the interest rate on the MetLife debentures wasreset as of February 15, 2003 to 3.911% per annum for a yield to maturity of 2.876%.
On the date of demutualization, Metropolitan Life established a closed block for the benefit of holders of certain individual life insurance policies ofMetropolitan Life.
Acquisitions and DispositionsIn June 2002, the Company acquired Aseguradora Hidalgo S.A. (‘‘Hidalgo’’), an insurance company based in Mexico with approximately $2.5 billion
in assets as of the date of acquisition. The purchase price is subject to adjustment under certain provisions of the purchase agreement. The Companydoes not expect that any purchase price adjustment will have an impact on its consolidated statements of income. The Company is in the process ofintegrating Hidalgo and Seguros Genesis, S.A., (‘‘Genesis’’), MetLife’s wholly-owned Mexican subsidiary headquartered in Mexico City, to operate as acombined entity under the name MetLife Mexico.
In November 2001, the Company acquired Compania de Seguros de Vida Santander S.A. and Compania de Reaseguros de Vida Soince Re S.A.,wholly-owned subsidiaries of Santander Central Hispano in Chile. These acquisitions marked MetLife’s entrance into the Chilean insurance market.
In July 2001, the Company completed its sale of Conning Corporation (‘‘Conning’’), an affiliate acquired in the acquisition of GenAmerica FinancialCorporation (‘‘GenAmerica’’) in 2000. Conning specialized in asset management for insurance company investment portfolios and investment research.
In May 2001, the Company acquired Seguradora America Do Sul S.A., a life and pension company in Brazil. Seasul has been integrated intoMetLife’s wholly-owned Brazilian subsidiary, Metropolitan Life Seguros e Previdencia Privada S.A.
In February 2001, the Holding Company consummated the purchase of Grand Bank, N.A., which was renamed MetLife Bank, N.A. (‘‘MetLifeBank’’). MetLife Bank provides banking services to individuals and small businesses in the Princeton, New Jersey area. On February 12, 2001, theFederal Reserve Board approved the Holding Company’s application for bank holding company status and to become a financial holding company uponits acquisition of Grand Bank, N.A.
During the second half of 2000, Reinsurance Group of America, Incorporated (‘‘RGA’’) acquired the interest in RGA Financial Group, LLC it did notalready own.
In October 2000, the Company completed the sale of its 48% ownership interest in its affiliates, Nvest, L.P. and Nvest Companies L.P.In July 2000, the Company acquired the workplace benefits division of Business Men’s Assurance Company (‘‘BMA’’), a Kansas City, Missouri-
based insurer.In April 2000, Metropolitan Life acquired the outstanding shares of Conning common stock not already owned by Metropolitan Life.In January 2000, Metropolitan Life completed its acquisition of GenAmerica, a holding company which included General American Life Insurance
Company (‘‘General American’’), approximately 49% of the outstanding shares of RGA common stock, and 61% of the outstanding shares of Conningcommon stock, which was subsequently sold in 2001. Metropolitan Life owned 9% of the outstanding shares of RGA common stock prior to thecompletion of the GenAmerica acquisition. During 2002, the Company purchased an additional 327,600 shares of RGA’s outstanding common stock atan aggregate price of $9.5 million to offset potential future dilution of the Company’s holding of RGA’s common stock arising from the issuance by RGA ofcompany-obligated mandatorily redeemable securities of a subsidiary trust in December 2001. These purchases increased the Company’s ownershippercentage of outstanding shares of RGA common stock from approximately 58% at December 31, 2001 to approximately 59% at December 31, 2002.
Summary of Critical Accounting EstimatesThe preparation of financial statements in conformity with accounting principles generally accepted in the United States of America (‘‘GAAP’’) requires
management to adopt accounting policies and make estimates and assumptions that affect amounts reported in the consolidated financial statements.The critical accounting policies, estimates and related judgments underlying the Company’s consolidated financial statements are summarized below. Inapplying these accounting policies, management makes subjective and complex judgments that frequently require estimates about matters that are
MetLife, Inc. 5

inherently uncertain. Many of these policies, estimates and related judgments are common in the insurance and financial services industries; others arespecific to the Company’s businesses and operations.
InvestmentsThe Company’s principal investments are in fixed maturities, mortgage loans and real estate, all of which are exposed to three primary sources of
investment risk: credit, interest rate and market valuation. The financial statement risks are those associated with the recognition of impairments andincome, as well as the determination of fair values. The assessment of whether impairments have occurred is based on management’s case-by-caseevaluation of the underlying reasons for the decline in fair value. Management considers a wide range of factors about the security issuer and uses itsbest judgment in evaluating the cause of the decline in the estimated fair value of the security and in assessing the prospects for near-term recovery.Inherent in management’s evaluation of the security are assumptions and estimates about the operations of the issuer and its future earnings potential.Considerations used by the Company in the impairment evaluation process include, but are not limited to: (i) the length of time and the extent to which themarket value has been below amortized cost; (ii) the potential for impairments of securities when the issuer is experiencing significant financial difficulties;(iii) the potential for impairments in an entire industry sector or sub-sector; (iv) the potential for impairments in certain economically depressed geographiclocations; (v) the potential for impairments of securities where the issuer, series of issuers or industry has suffered a catastrophic type of loss or hasexhausted natural resources; and (vi) other subjective factors, including concentrations and information obtained from regulators and rating agencies. Inaddition, the earnings on certain investments are dependent upon market conditions, which could result in prepayments and changes in amounts to beearned due to changing interest rates or equity markets. The determination of fair values in the absence of quoted market values is based on valuationmethodologies, securities the Company deems to be comparable and assumptions deemed appropriate given the circumstances. The use of differentmethodologies and assumptions may have a material effect on the estimated fair value amounts.
DerivativesThe Company enters into freestanding derivative transactions primarily to manage the risk associated with variability in cash flows related to the
Company’s financial assets and liabilities or to changing fair values. The Company also purchases investment securities and issues certain insurance andreinsurance policies with embedded derivatives. The associated financial statement risk is the volatility in net income which can result from (i) changes infair value of derivatives not qualifying as accounting hedges, and (ii) ineffectiveness of designated hedges in an environment of changing interest rates orfair values. In addition, accounting for derivatives is complex, as evidenced by significant authoritative interpretations of the primary accounting standardswhich continue to evolve, as well as the significant judgments and estimates involved in determining fair value in the absence of quoted market values.These estimates are based on valuation methodologies and assumptions deemed appropriate in the circumstances. Such assumptions includeestimated market volatility and interest rates used in the determination of fair value where quoted market values are not available. The use of differentassumptions may have a material effect on the estimated fair value amounts.
Deferred Policy Acquisition CostsThe Company incurs significant costs in connection with acquiring new insurance business. These costs, which vary with and are primarily related to
the production of new business, are deferred. The recovery of such costs is dependent upon the future profitability of the related business. The amountof future profit is dependent principally on investment returns, mortality, morbidity, persistency, expenses to administer the business, creditworthiness ofreinsurance counterparties and certain economic variables, such as inflation. Of these factors, the Company anticipates that investment returns are mostlikely to impact the rate of amortization of such costs. The aforementioned factors enter into management’s estimates of gross margins and profits, whichgenerally are used to amortize such costs. Revisions to estimates result in changes to the amounts expensed in the reporting period in which therevisions are made and could result in the impairment of the asset and a charge to income if estimated future gross margins and profits are less thanamounts deferred. In addition, the Company utilizes the reversion to the mean assumption, a standard industry practice, in its determination of theamortization of deferred policy acquisition costs. This practice assumes that the expectation for long-term appreciation in equity markets is not changedby minor short-term market fluctuations, but that it does change when large interim deviations have occurred.
Future Policy BenefitsThe Company establishes liabilities for amounts payable under insurance policies, including traditional life insurance, annuities and disability
insurance. Generally, amounts are payable over an extended period of time and the profitability of the products is dependent on the pricing of theproducts. Principal assumptions used in pricing policies and in the establishment of liabilities for future policy benefits are mortality, morbidity, expenses,persistency, investment returns and inflation.
The Company also establishes liabilities for unpaid claims and claims expenses for property and casualty insurance. Pricing of this insurance takesinto account the expected frequency and severity of losses, the costs of providing coverage, competitive factors, characteristics of the insured and theproperty covered, and profit considerations. Liabilities for property and casualty insurance are dependent on estimates of amounts payable for claimsreported but not settled and claims incurred but not reported. These estimates are influenced by historical experience and actuarial assumptions ofcurrent developments, anticipated trends and risk management strategies.
Differences between the actual experience and assumptions used in pricing these policies and in the establishment of liabilities result in variances inprofit and could result in losses.
ReinsuranceThe Company enters into reinsurance transactions as both a provider and a purchaser of reinsurance. Accounting for reinsurance requires extensive
use of assumptions and estimates, particularly related to the future performance of the underlying business and the potential impact of counterparty creditrisks. The Company periodically reviews actual and anticipated experience compared to the aforementioned assumptions used to establish policybenefits and evaluates the financial strength of counterparties to its reinsurance agreements using criteria similar to that evaluated in the securityimpairment process discussed above. Additionally, for each of its reinsurance contracts, the Company must determine if the contract providesindemnification against loss or liability relating to insurance risk, in accordance with applicable accounting standards. The Company must review allcontractual features, particularly those that may limit the amount of insurance risk to which the Company is subject or features that delay the timelyreimbursement of claims. If the Company determines that a contract does not expose it to a reasonable possibility of a significant loss from insurance risk,the Company records the contract using the deposit method of accounting.
LitigationThe Company is a party to a number of legal actions. Given the inherent unpredictability of litigation, it is difficult to estimate the impact of litigation on
the Company’s consolidated financial position. Liabilities are established when it is probable that a loss has been incurred and the amount of the loss can
MetLife, Inc.6

be reasonably estimated. Liabilities related to certain lawsuits, including the Company’s asbestos-related liability, are especially difficult to estimate due tothe limitation of available data and uncertainty regarding numerous variables used to determine amounts recorded. The data and variables that impact theassumption used to estimate the Company’s asbestos-related liability include the number of future claims, the cost to resolve claims, the disease mixand severity of disease, the jurisdiction of claims filed, tort reform efforts and the impact of any possible future adverse verdicts and their amounts. It ispossible that an adverse outcome in certain of the Company’s litigation, including asbestos-related cases, or the use of different assumptions in thedetermination of amounts recorded could have a material effect upon the Company’s consolidated net income or cash flows in particular quarterly orannual periods.
Employee Benefit PlansThe Company sponsors pension and other retirement plans in various forms covering employees who meet specified eligibility requirements. The
reported expense and liability associated with these plans requires an extensive use of assumptions which include the discount rate, expected return onplan assets and rate of future compensation increases as determined by the Company. Management determines these assumptions based uponcurrently available market and industry data, historical performance of the plan and its assets, and consultation with an independent consulting actuarialfirm to aid it in selecting appropriate assumptions and valuing its related liabilities. The actuarial assumptions used by the Company may differ materiallyfrom actual results due to changing market and economic conditions, higher or lower withdrawal rates or longer or shorter life spans of the participants.These differences may have a significant effect on the Company’s consolidated financial statements and liquidity.
The actuarial assumptions used in the calculation of the Company’s aggregate projected benefit obligation may vary and include an expectation oflong-term market appreciation in equity markets which is not changed by minor short-term market fluctuations, but does change when large interimdeviations occur. For the largest of the plans sponsored by the Company (the Metropolitan Life Retirement Plan for United States Employees, with aprojected benefit obligation of $4.3 billion or 98.6% of all qualified plans at December 31, 2002), the discount rate, expected rate of return on plan assets,and the range of rates of future compensation increases used in that plan’s valuation at December 31, 2002 were 6.75%, 9% and 4% to 8%,respectively. The expected rate of return on plan assets for use in that plan’s valuation in 2003 is currently anticipated to be 8.5%.
Results of OperationsThe following table presents consolidated financial information for the years indicated:
Year Ended December 31,
2002 2001 2000
(Dollars in millions)
RevenuesPremiums*********************************************************************** $19,086 $17,212 $16,317Universal life and investment-type product policy fees ********************************** 2,139 1,889 1,820Net investment income *********************************************************** 11,329 11,255 11,024Other revenues ****************************************************************** 1,377 1,507 2,229Net investment losses (net of amounts allocable to other accounts
of ($145), ($134) and ($54), respectively) ****************************************** (784) (603) (390)
Total revenues*************************************************************** 33,147 31,260 31,000
ExpensesPolicyholder benefits and claims (excludes amounts directly related
to net investment losses of ($150), ($159) and $41, respectively) ********************** 19,523 18,454 16,893Interest credited to policyholder account balances************************************* 2,950 3,084 2,935Policyholder dividends ************************************************************ 1,942 2,086 1,919Payments to former Canadian policyholders ****************************************** — — 327Demutualization costs************************************************************* — — 230Other expenses (excludes amounts directly related to net investment
losses of $5, $25 and ($95), respectively) ***************************************** 7,061 7,022 7,401
Total expenses ************************************************************** 31,476 30,646 29,705
Income from continuing operations before provision for income taxes ********************* 1,671 614 1,295Provision for income taxes********************************************************* 516 227 421
Income from continuing operations************************************************** 1,155 387 874Income from discontinued operations, net of income taxes****************************** 450 86 79
Net income ********************************************************************* $ 1,605 $ 473 $ 953
Year ended December 31, 2002 compared with the year ended December 31, 2001 — The CompanyPremiums increased by $1,874 million, or 11%, to $19,086 million for the year ended December 31, 2002 from $17,212 million for the comparable
2001 period. This variance is primarily attributable to increases in the Institutional, International and Reinsurance segments. A $966 million increase inInstitutional is largely due to sales growth in its group life, dental, disability and long-term care businesses, a sale of a significant retirement and savingscontract in the second quarter of 2002, as well as new sales throughout 2002 in this segment’s structured settlements and traditional annuity products.The June 2002 acquisition of Hidalgo, the 2001 acquisitions in Chile and Brazil and the sale of an annuity contract in the first quarter of 2002 to aCanadian trust company are the primary drivers of a $665 million increase in International. A portion of the increase in International is also attributable tobusiness growth in South Korea, Mexico (excluding Hidalgo), Spain and Taiwan. In addition, an increase in Canada due to the restructuring of a pensioncontract from an investment-type product to a long-term annuity contributed to this variance. New premiums from facultative and automatic treaties, andrenewal premiums on existing blocks of business contributed to a $243 million increase in the Reinsurance segment.
Universal life and investment-type product policy fees increased by $250 million, or 13%, to $2,139 million for the year ended December 31, 2002from $1,889 million for the comparable 2001 period. This variance is primarily attributable to the Individual, International and Institutional segments. A$120 million favorable variance in Individual is due to an increase in policy fees from insurance products, primarily due to higher revenue from insurance
MetLife, Inc. 7

fees, which increase as the average separate account asset base supporting the underlying minimum death benefits declines. The average separateaccount asset base has declined in 2002 in response to poor equity market performance. These increases are partially offset by lower policy fees fromannuity and investment-type products generally resulting from poor equity market performance despite growth in annuity deposits. Management wouldexpect policy fees from annuity and investment-type products to continue to be adversely impacted while revenues from insurance fees on variable lifeproducts would be expected to rise if average separate account asset levels continue to decline. A $106 million increase in International is largely due tothe acquisition of Hidalgo and the acquisitions in Chile, partially offset by a decrease in Spain due to the cessation of product lines offered through a jointventure with Banco Santander Central Hispano, S.A., (‘‘Banco Santander’’) in 2001. A $23 million increase in Institutional is principally due to a fee relatedto the renegotiation of a portion of a bank-owned life insurance contract, as well as growth in existing business in the group universal life product.
Net investment income increased by $74 million, or 1%, to $11,329 million for the year ended December 31, 2002 from $11,255 million for thecomparable 2001 period. This variance is primarily attributable to increases of (i) $61 million, or 1%, in income from fixed maturities, (ii) $54 million, or12%, in income from real estate and real estate joint ventures held-for-investment, net of investment expenses and depreciation, (iii) $35 million, or 2%, inincome on mortgage loans on real estate, (iv) $7 million, or 1%, in interest income on policy loans, and (v) lower investment expenses of $9 million, or 4%.These variances are partially offset by decreases of (i) $47 million, or 17%, in income on cash, cash equivalents and short-term investments,(ii) $31 million, or 12%, in income on other invested assets, and (iii) $14 million, or 14%, in income from equity securities and other limited partnershipinterests.
The increase in income from fixed maturities to $8,092 million in 2002 from $8,031 million in 2001 is largely due to a higher asset base, primarilyresulting from increased cash flows from sales of insurance and the acquisitions in Mexico and Chile. In addition, securities lending income was higherdue to increased activity and a more favorable cost of funds. The increases in income from fixed maturities are partially offset by decreases resulting fromlower reinvestment rates and a decline in bond prepayment fees. The increase in income from real estate and real estate joint ventures held-for-investment to $513 million in 2002 from $459 million in 2001 is primarily due to the transfer of the Company’s One Madison Avenue, New York propertyfrom a company use property to an investment property in 2002. The increase in income on mortgage loans on real estate to $1,883 million in 2002 from$1,848 million in 2001 is due primarily to a higher asset base from new loan production, partially offset by lower mortgage rates. The increase in interestincome from policy loans to $543 million in 2002 from $536 million in 2001 is largely due to increased loans outstanding. The decrease in income fromcash, cash equivalents and short-term investments to $232 million in 2002 from $279 million in 2001 is due to declining interest rates coupled with adecrease in the asset base. The decrease in net investment income from other invested assets to $218 million in 2002 from $249 million in 2001 islargely due to lower derivative income, partially offset by an increase in reinsurance contracts’ funds withheld at interest. The decline in income from equitysecurities and other limited partnership interests to $83 million in 2002 from $97 million in 2001 primarily resulted from lower dividend income from equitysecurities, partially offset by higher limited corporate partnership distributions.
The increase in net investment income is attributable to increases in the International, Individual and Reinsurance segments, partially offset bydecreases in Corporate & Other, and the Institutional and Auto & Home segments. A $194 million increase in International is due to a higher asset baseresulting from the acquisitions in Mexico and Chile. Individual increased by $71 million primarily due to higher income from securities lending and limitedcorporate partnership distributions, partially offset by lower bond prepayment fee income. The Reinsurance segment increased $31 million largelyresulting from an increase in reinsurance contracts’ funds withheld at interest. The decrease in Corporate & Other of $149 million is due to a lower assetbase, resulting from funding International’s acquisitions in Mexico and Chile, as well as the Company’s common stock repurchases, partially offset byhigher income from securities lending. Institutional decreased $38 million predominantly as a result of decreased limited partnership, equity-linked noteand bond prepayment fee income. Auto & Home decreased $23 million primarily due to lower reinvestment rates.
Other revenues decreased by $130 million, or 9%, to $1,377 million for the year ended December 31, 2002 from $1,507 million for the comparable2001 period. This variance is primarily attributable to decreases in the Individual, Institutional and Asset Management segments, partially offset by anincrease in Corporate & Other. Individual decreased by $77 million resulting from lower commission and fee income associated with decreased volume inthe broker/dealer and other subsidiaries as a result of the depressed equity markets. A $40 million decrease in Institutional is primarily due to a $73 millionreduction in administrative fees as a result of the Company’s exit from the large market 401(k) business in late 2001, as well as lower fees earned oninvestments in separate accounts resulting generally from poor equity market performance. This reduction is partially offset by a $33 million increase ingroup insurance due to growth in the administrative service businesses and a settlement received in 2002 related to the Company’s former medicalbusiness. A $32 million decrease in Asset Management is primarily due to the sale of Conning in July 2001. These variances were partially offset by anincrease of $16 million in Corporate & Other principally due to the sale of a company-occupied building and income earned on corporate-owned lifeinsurance (‘‘COLI’’) purchased during 2002, partially offset by an increase in the elimination of intersegment activity.
The Company’s investment gains and losses are net of related policyholder amounts. The amounts netted against investment gains and losses are(i) amortization of deferred policy acquisition costs, to the extent that such amortization results from investment gains and losses, (ii) adjustments toparticipating contractholder accounts when amounts equal to such investment gains and losses are applied to the contractholder’s accounts, and(iii) adjustments to the policyholder dividend obligation resulting from investment gains and losses.
Net investment losses increased by $181 million, or 30%, to $784 million for the year ended December 31, 2002 from $603 million for thecomparable 2001 period. This increase reflects total investment losses, before offsets, of $929 million (including gross gains of $2,028 million, grosslosses of $1,469 million, and writedowns of $1,488 million), an increase of $192 million, or 26%, from $737 million in 2001. Offsets include theamortization of deferred policy acquisition costs of ($5) million and ($25) million in 2002 and 2001, respectively, and changes in the policyholder dividendobligation of $157 million and $159 million in 2002 and 2001, respectively, and adjustments to participating contracts of ($7) million in 2002. Refer to‘‘— Investments’’ beginning on page 26 for a discussion of the Company’s investment portfolio.
The Company believes its policy of netting related policyholder amounts against investment gains and losses provides important information inevaluating its performance. Investment gains and losses are often excluded by investors when evaluating the overall financial performance of insurers.The Company believes its presentation enables readers to easily exclude investment gains and losses and the related effects on the consolidatedstatements of income when evaluating its performance. The Company’s presentation of investment gains and losses, net of policyholder amounts, maybe different from the presentation used by other insurance companies and, therefore, amounts in its consolidated statements of income may not becomparable to amounts reported by other insurers.
Policyholder benefits and claims increased by $1,069 million, or 6%, to $19,523 million for the year ended December 31, 2002 from $18,454 millionfor the comparable 2001 period. This variance is attributable to increases in the International, Institutional and Reinsurance segments, partially offset by adecrease in the Auto & Home segment. A $699 million increase in International is primarily due to the acquisition of Hidalgo, the acquisitions in Chile andBrazil, the aforementioned sale of an annuity contract, the restructuring of a Canadian pension contract and business growth in South Korea, Mexico
MetLife, Inc.8

(excluding Hidalgo), Taiwan and Spain. An increase in Institutional of $415 million is commensurate with the growth in premiums as discussed above,largely offset by the establishment of a liability in 2001 related to the September 11, 2001 tragedies and the 2001 fourth quarter business realignmentinitiatives. An increase in Reinsurance of $70 million is commensurate with the growth in premiums discussed above. These increases were partiallyoffset by a decrease of $102 million in the Auto & Home segment. The variance in Auto & Home is largely due to improved claim frequency resulting frommilder winter weather, lower catastrophe levels and fewer personal umbrella claims, partially offset by an increase in current year bodily injury and no-faultseverities and costs associated with the processing of the New York assigned risk business.
Interest credited to policyholder account balances decreased by $134 million, or 4%, to $2,950 million for the year ended December 31, 2002 from$3,084 million for the comparable 2001 period. This variance is attributable to decreases in the Individual and Institutional segments, partially offset byincreases in the International and Reinsurance segments. A $105 million decrease in Individual is primarily due to the establishment in 2001 of apolicyholder liability with respect to certain group annuity contracts at New England Financial. Excluding this policyholder liability, interest credited expenseincreased slightly in response to an increase in policyholder account balances, which is primarily attributable to sales growth despite declines in interestcrediting rates. An $81 million decrease in Institutional is primarily due to a decline in average crediting rates resulting from the current interest rateenvironment. These variances are partially offset by a net increase of $28 million in International. This increase is principally due to the acquisition ofHidalgo, partially offset by a reduction in the number of investment-type policies in-force in Argentina. In addition, a $24 million increase in Reinsurance isprimarily due to several new deferred annuity reinsurance agreements executed during 2002.
Policyholder dividends decreased by $144 million, or 7%, to $1,942 million for the year ended December 31, 2002 from $2,086 million for thecomparable 2001 period. This variance is attributable to a decrease in the Institutional segment resulting from unfavorable mortality experience of severallarge group clients. Institutional policyholder dividends vary from period to period based on participating contract experience, which is recorded inpolicyholder benefits and claims.
Other expenses increased by $39 million, or 1%, to $7,061 million for the year ended December 31, 2002 from $7,022 million for the comparable2001 period. Excluding the capitalization and amortization of deferred policy acquisition costs, which are discussed below, other expenses increased by$114 million, or 2%, to $7,762 million in 2002 from $7,648 million in 2001. Excluding the capitalization and amortization of deferred policy acquisitioncosts and the change in accounting as prescribed by Statement of Financial Accounting Standards (‘‘SFAS’’) No. 142, Goodwill and Other IntangibleAssets, (‘‘SFAS 142’’), which eliminates the amortization of goodwill and certain other intangibles, other expenses increased by $161 million. Thisvariance is primarily attributable to increases in the Reinsurance and International segments, as well as in Corporate & Other, partially offset by decreasesin the Institutional, Individual and Asset Management segments. A $209 million increase in Reinsurance is primarily attributable to increases in allowancespaid, primarily driven by high-allowance business in the U.K. along with strong growth in the U.S. and Asia/Pacific regions. An increase of $166 million inInternational expenses is primarily due to the acquisition of Hidalgo, the acquisitions in Chile and Brazil, as well as business growth in South Korea,Mexico (excluding Hidalgo), and Hong Kong. An increase in Corporate & Other of $112 million is primarily due to increases in legal and interest expenses.The 2002 period includes a $266 million charge to increase the Company’s asbestos-related liability and expenses to cover costs associated with theresolution of federal government investigations of General American’s former Medicare business. These increases are partially offset by a $250 millioncharge recorded in the fourth quarter of 2001 to cover costs associated with the resolution of class action lawsuits and a regulatory inquiry pendingagainst Metropolitan Life involving alleged race-conscious insurance underwriting practices prior to 1973. The increase in interest expenses is primarilydue to increases in long-term debt resulting from the issuance of $1.25 billion and $1 billion of senior debt in November 2001 and December 2002,respectively, partially offset by a decrease in commercial paper in 2002. In addition, a decrease in the elimination of intersegment activity contributed tothe variance. A decrease of $181 million in Institutional is due to higher expenses resulting from the business realignment initiatives accrual in the fourthquarter 2001 (primarily the Company’s exit from the large market 401(k) business), $30 million of which was released into income in the fourth quarter of2002. This decrease is partially offset by an increase in 2002 operational expenses for dental and disability and group insurance’s non-deferrableexpenses commensurate with the aforementioned premium growth, as well as higher pension and post-retirement benefit expenses. A decrease of$105 million in Individual is due to continued expense management initiatives, including reduced compensation-related expenses, a decline in businessrealignment expenses that were incurred in 2001 and reductions in volume-related commission expenses in the broker/dealer and other subsidiaries.These declines are partially offset by higher pension and post-retirement benefit expenses and an increase in expenses stemming from sales growth innew annuity and investment-type products. In addition, a decrease of $39 million in Asset Management is primarily due to the sale of Conning in July2001. Primarily as a result of changes in expected rate of return and discount rate assumptions effective for 2003, the Company currently anticipates itspension expense will increase by approximately $115 million, net of income tax, for the year ending December 31, 2003 from the comparable 2002period.
Deferred policy acquisition costs are principally amortized in proportion to gross margins and profits, including investment gains or losses. Theamortization is allocated to investment gains and losses to provide consolidated statement of income information regarding the impact of investmentgains and losses on the amount of the amortization, and other expenses to provide amounts related to gross margins and profits originating fromtransactions other than investment gains and losses.
Capitalization of deferred policy acquisition costs increased by $301 million, or 15%, to $2,340 million for the year ended December 31, 2002 from$2,039 million for the comparable 2001 period. This variance is primarily due to increases in the Reinsurance, Individual, International and Institutionalsegments. A $125 million increase in Reinsurance is commensurate with the increase in allowances paid. A $111 million increase in Individual is due tohigher sales of annuity and investment-type products, resulting in higher commissions and other deferrable expenses. A $51 million increase inInternational is primarily due to the 2002 acquisition of Hidalgo and overall business growth in South Korea, partially offset by a decrease in Argentina dueto the reduction in business caused by the overall economic environment. A $22 million increase in Institutional is primarily due to growth in salescommissions and fees for disability products sold by Institutional. Total amortization of deferred policy acquisitions costs increased by $206 million, or14%, to $1,644 million in 2002 from $1,438 million in 2001. Amortization of $1,639 million and $1,413 million are allocated to other expenses in 2002and 2001, respectively, while the remainder of the amortization in each period is allocated to investment gains and losses. The increase in amortizationallocated to other expenses is attributable to increases in the Individual, International and Reinsurance segments. An increase of $111 million in Individualis due to the impact of the depressed equity markets and changes in the estimates of future gross profits. In 2002, estimates of future dividend scales,future maintenance expenses, future rider margins, and future reinsurance recoveries were revised. In 2001, estimates of future fixed account interestspreads, future gross margins and profits related to separate accounts and future mortality margins were revised. An increase in International of$64 million is primarily due to loss recognition in Argentina as a result of the economic environment, primarily the devaluation of its currency. Theremaining increase was due to new business in South Korea, Taiwan, and the June 2002 acquisition of Hidalgo. An increase in Reinsurance of$55 million is due to growth in the business, commensurate with the growth in premiums described above.
MetLife, Inc. 9

Income tax expense for the year ended December 31, 2002 was $516 million, or 31% of income from continuing operations before provision forincome taxes, compared with $227 million, or 37%, for the comparable 2001 period. The 2002 effective tax rate differs from the federal corporate tax rateof 35% primarily due to the impact of non-taxable investment income. The 2001 effective tax rate differs from the federal corporate tax rate of 35%, due toan increase in prior year income taxes on capital gains.
In accordance with SFAS No. 144, Accounting for the Impairment or Disposal of Long-Lived Assets (‘‘SFAS 144’’), income related to the Company’sreal estate which was identified as held-for-sale on or after January 1, 2002 is presented as discontinued operations for the years ended December 31,2002, 2001 and 2000. The income from discontinued operations is comprised of net investment income and net investment gains related to47 properties that the Company began marketing for sale on or after January 1, 2002. For the year ended December 31, 2002, the Companyrecognized $582 million of net investment gains from discontinued operations due primarily to the sale of 36 properties.
Year ended December 31, 2001 compared with the year ended December 31, 2000 — The CompanyPremiums grew by $895 million, or 5%, to $17,212 million for the year ended December 31, 2001 from $16,317 for the comparable 2000 period.
This variance is attributable to increases in the Institutional, Reinsurance, International and Auto & Home segments, partially offset by a decrease in theIndividual segment. An improvement of $388 million in the Institutional segment is predominantly the result of sales growth and continued favorablepolicyholder retention in this segment’s dental, disability and long-term care businesses. In addition, significant premiums received from several existinggroup life customers in 2001 and the BMA acquisition in 2000 resulted in higher premiums. The 2000 balance includes $124 million in additionalinsurance coverages purchased by existing customers with funds received in the demutualization and significant premiums received from existingretirement and savings customers. New premiums from facultative and automatic treaties and renewal premiums on existing blocks of business allcontributed to the $312 million premium growth in the Reinsurance segment. A $186 million rise in the International segment is due to growth in Mexico,South Korea, Spain and Taiwan, as well as acquisitions in Brazil and Chile. These variances were partially offset by a decline in Argentinean individual lifepremiums, reflecting the impact of economic and political events in that country. Higher average premium resulting from rate increases is the primarydriver of a $119 million rise in the Auto & Home segment. A $110 million decline in the Individual segment is attributable to lower sales of traditional lifeinsurance policies, which reflects a continued shift in customer preference from those policies to variable life products.
Universal life and investment-type product policy fees increased by $69 million, or 4%, to $1,889 million for the year ended December 31, 2001from $1,820 million for the comparable 2000 period. This variance is due to increases in the Institutional and Individual segments, partially offset by adecline in the International segment. Growth in sales and deposits of group universal life and COLI products resulted in a $45 million increase in theInstitutional segment. A $39 million rise in the Individual segment is predominantly the result of higher fees from variable life products reflecting a shift incustomer preferences from traditional life products. A decrease of $15 million in the International segment is primarily due to reduced fees in Spainresulting from fewer assets under management. This is a result of a planned cessation of product lines offered through a joint venture with BancoSantander.
Net investment income increased by $231 million, or 2%, to $11,255 million for the year ended December 31, 2001 from $11,024 million for thecomparable 2000 period. This change is due to higher income from (i) mortgage loans on real estate of $155 million, or 9%, (ii) fixed maturities of$116 million, or 1%, (iii) other invested assets of $87 million, or 54%, and (iv) interest income on policy loans of $21 million, or 4%. These positivevariances are partially offset by lower income from (i) equity securities and other limited partnership interests of $86 million, or 47%, (ii) real estate and realestate joint ventures held-for-investment, net of investment expenses and depreciation, of $49 million, or 10%, (iii) cash, cash equivalents and short-terminvestments of $9 million, or 3%, and (iv) higher investment expenses of $4 million, or 2%.
The increase in income from mortgage loans on real estate to $1,848 million in 2001 from $1,693 million in 2000 is predominantly the result ofhigher mortgage production volume and increases in mortgage prepayment fees and contingent interest. The improvement in income from fixedmaturities to $8,031 million in 2001 from $7,915 million in 2000 is primarily due to bond prepayments and increased securities lending activity, offset bylower yields on reinvestments. Income from other invested assets increased to $249 million in 2001 from $162 million in 2000 primarily due to thereclassification of $19 million from other comprehensive income related to cash flow hedges, $24 million from derivatives not designated as accountinghedges and the recognition in 2000 of a $20 million loss on an equity method investment. The increase in interest income from policy loans to$536 million in 2001 from $515 million in 2000 is largely due to increased loans outstanding. The reduction of income from equity securities and otherlimited partnership interests to $97 million in 2001 from $183 million in 2000 is primarily due to fewer sales of underlying assets held in corporatepartnerships and increased partnership write-downs. The decrease in income from real estate and real estate joint ventures held-for-investment to$459 million in 2001 from $508 million in 2000 is primarily due to a decline in hotel occupancy rates and reduced real estate joint venture sales.
The increase in net investment income is largely attributable to positive variances in the Institutional and Individual segments, partially offset by adecline in Corporate & Other. Net investment income for the Institutional and Individual segments grew by $254 million and $80 million, respectively.These increases are predominately due to a higher volume of securities lending activity, increases in bond and mortgage prepayments and highercontingent interest on mortgages. The decrease in Corporate & Other is principally the result of sales in 2000 of underlying assets held in corporatelimited partnerships. The remainder of the variance is attributable to smaller fluctuations in the other segments.
Other revenues decreased by $722 million, or 32%, to $1,507 million for the year ended December 31, 2001 from $2,229 million for thecomparable 2000 period. This variance is mainly attributable to reductions in the Asset Management, Individual and Auto & Home segments, partiallyoffset by an increase in the Reinsurance segment. The sales of Nvest and Conning in October 2000 and July 2001, respectively, are the primarily driversof a $562 million decline in the Asset Management segment. A decrease of $155 million in the Individual segment is primarily due to reduced commissionand fee income associated with lower sales in the broker/dealer and other subsidiaries which was a result of the equity market downturn. Suchcommission and fee income can fluctuate consistent with movements in the equity market. Auto & Home’s other revenues are lower by $18 millionprimarily due to a revision of an estimate made in 2000 of amounts recoverable from reinsurers related to the disposition of this segment’s reinsurancebusiness in 1990. Other revenues in the Reinsurance segment improved by $13 million due to an increase in fees earned on financial reinsurance,primarily as a result of the acquisition of the remaining interest in RGA Financial Group, LLC during the second half of 2000.
The Company’s investment gains and losses are net of related policyholder amounts. The amounts netted against investment gains and losses are(i) amortization of deferred policy acquisition costs, to the extent that such amortization results from investment gains and losses, (ii) additions toparticipating contractholder accounts when amounts equal to such investment gains and losses are credited to the contractholder’s accounts, and(iii) adjustments to the policyholder dividend obligation resulting from investment gains and losses.
Net investment losses grew by $213 million, or 55%, to $603 million for the year ended December 31, 2001 from $390 million for the comparable2000 period. This increase reflects total investment losses, before offsets, of $737 million, an increase of $293 million, or 66%, from $444 million in2000. Offsets include the amortization of deferred policy acquisition costs of ($25) million and $95 million in 2001 and 2000, respectively; changes in
MetLife, Inc.10

policyholder dividend obligation of $159 million and $85 million in 2001 and 2000, respectively; and additions to participating contracts of ($126) millionin 2000. Excluding the net gain on the sale of a subsidiary, net investment losses decreased from the prior year. The Company recognized deterioratingcredits through the proactive sale of certain assets.
The Company believes its policy of netting related policyholder amounts against investment gains and losses provides important information inevaluating its operating performance. Investment gains and losses are often excluded by investors when evaluating the overall financial performance ofinsurers. The Company believes its presentation enables readers of its consolidated statements of income to easily exclude investment gains and lossesand the related effects on the consolidated statements of income when evaluating its operating performance. The Company’s presentation of investmentgains and losses, net of related policyholder amounts, may be different from the presentation used by other insurance companies and, therefore,amounts in its consolidated statements of income may not be comparable to amounts reported by other insurers.
Policyholder benefits and claims rose by $1,561 million, or 9%, to $18,454 million for the year ended December 31, 2001 from $16,893 million forthe comparable 2000 period. The variance in policyholder benefits and claims is mainly attributable to increases in the Institutional, Reinsurance,Individual, International and Auto & Home segments. Claims related to the September 11, 2001 tragedies and fourth quarter business realignmentinitiatives account for $291 million and $215 million, respectively, of a $746 million increase in the Institutional segment. The remainder of the fluctuation isattributable to growth in the group life, dental, disability and long-term care insurance businesses, commensurate with the variance in premiums, partiallyoffset by a decrease in policyholder benefits and claims related to the retirement and savings business. Policyholder benefits and claims for theReinsurance segment rose by $388 million due to unfavorable mortality experience in the first and fourth quarters of 2001, as well as adverse results onthe reinsurance of Argentine pension business, reflecting the impact of economic and political events in that country. In addition, reinsurance claimsarising from the September 11, 2001 tragedies of approximately $16 million, net of amounts recoverable from reinsurers, contributed to the variance. A$179 million rise in the Individual segment is primarily the result of an increase in the liabilities for future policy benefits commensurate with the aging of thein-force block of business. In addition, an increase of $74 million in the policyholder dividend obligation and $24 million in liabilities and claims associatedwith the September 11, 2001 tragedies contributed to the variance. International policyholder benefits and claims increased by $127 million as a result ofgrowth in Mexico, South Korea and Taiwan, as well as acquisitions in Brazil and Chile. These fluctuations are partially offset by a decline in Argentina,reflecting the impact of economic and political events in that country. A $116 million increase in the Auto & Home segment is predominantly the result ofincreased average claim costs, growth in the auto business and increased non-catastrophe weather-related losses.
Interest credited to policyholder account balances grew by $149 million, or 5%, to $3,084 million for the year ended December 31, 2001 from$2,935 million for the comparable 2000 period, primarily due to an increase of $218 million in the Individual segment, partially offset by a $77 millionreduction in the Institutional segment. The establishment of a policyholder liability of $118 million with respect to certain group annuity contracts at NewEngland Financial is the primary driver of the fluctuation in Individual. In addition, higher average policyholder account balances and slightly increasedcrediting rates contributed to the variance. The decrease in the Institutional segment is primarily due to an overall decline in crediting rates in 2001 as aresult of the low interest rate environment, partially offset by an increase in average customer account balances stemming from asset growth. Theremaining variance is due to minor fluctuations in the Reinsurance and International segments.
Policyholder dividends increased by $167 million, or 9%, to $2,086 million for the year ended December 31, 2001 from $1,919 million for thecomparable 2000 period, primarily due to increases of $135 million and $25 million in the Institutional and Individual segments, respectively. The rise inthe Institutional segment is primarily attributed to favorable experience on a large group life contract in 2001. Policyholder dividends vary from period toperiod based on participating contract experience, which is recorded in policyholder benefits and claims. The change in the Individual segment reflectsgrowth in the assets supporting policies associated with this segment’s aging block of traditional life insurance business. The remaining variance is due tominor fluctuations in the International and Reinsurance segments.
Payments of $327 million were made during the second quarter of 2000, as part of Metropolitan Life’s demutualization, to holders of certain policiestransferred to Clarica Life Insurance Company in connection with the sale of a substantial portion of the Canadian operations in 1998.
Demutualization costs of $230 million were incurred during the year ended December 31, 2000. These costs are related to Metropolitan Life’sdemutualization on April 7, 2000.
Other expenses decreased by $379 million, or 5%, to $7,022 million for the year ended December 31, 2001 from $7,401 million for the comparable2000 period. Excluding the capitalization and amortization of deferred policy acquisition costs, which are discussed below, other expenses declined by$138 million, or 2%, to $7,648 million in 2001 from $7,786 million in 2000. This variance is attributable to reductions in the Asset Management, Individualand Auto & Home segments, partially offset by increases in the other segments. A decrease of $532 million in the Asset Management segment ispredominantly the result of the sales of Nvest and Conning in October 2000 and July 2001, respectively. The Individual segment’s expenses declined by$121 million due to continued expense management, primarily due to reduced employee costs and lower discretionary spending. In addition, there werereductions in volume-related commission expenses in the broker/dealer and other subsidiaries. These items are partially offset by an increase of$97 million related to fourth quarter 2001 business realignment initiatives. A $34 million decrease in Auto & Home is attributable to a reduction inintegration costs associated with the acquisition of the standard personal lines property and casualty insurance operations of The St. Paul Companies inSeptember 1999 (‘‘St. Paul acquisition’’). An increase of $287 million in Institutional expenses is primarily driven by expenses associated with fourthquarter business realignment initiatives of $184 million and a rise in non-deferrable variable expenses associated with premium growth in the groupinsurance businesses. Non-deferrable variable expenses include premium tax, commissions and administrative expenses for dental, disability and long-term care businesses. Other expenses in Corporate & Other grew by $198 million primarily due to a $250 million race-conscious underwriting lossprovision which was recorded in the fourth quarter of 2001, additional expenses associated with MetLife, Inc. shareholder services costs and start-upcosts relating to MetLife’s banking initiatives, as well as a decrease in the elimination of intersegment activity. These increases are partially offset by adecline in interest expense due to reduced average levels in borrowing and a lower interest rate environment in 2001. An increase of $43 million in theInternational segment is predominantly the result of growth in Mexico and South Korea, and acquisitions in Brazil and Chile, partially offset by a decreasein Spain’s other expenses due to a planned cessation of product lines offered through a joint venture with Banco Santander. The acquisition of theremaining interest in RGA Financial Group, LLC during the second half of 2000 contributed to the $20 million increase in other expenses in theReinsurance segment.
Deferred policy acquisition costs are principally amortized in proportion to gross margins or profits, including investment gains or losses. Theamortization is allocated to investment gains and losses to provide consolidated statement of income information regarding the impact of investmentgains and losses on the amount of the amortization, and other expenses to provide amounts related to gross margins or profits originating fromtransactions other than investment gains and losses.
MetLife, Inc. 11
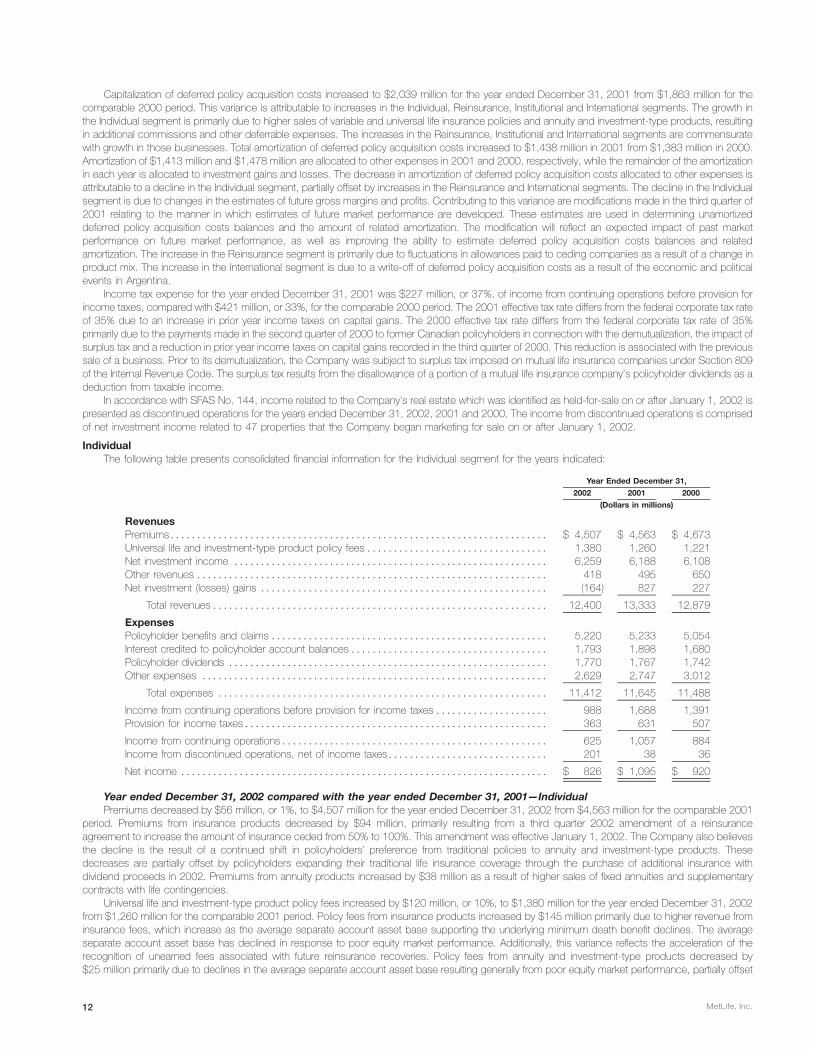
Capitalization of deferred policy acquisition costs increased to $2,039 million for the year ended December 31, 2001 from $1,863 million for thecomparable 2000 period. This variance is attributable to increases in the Individual, Reinsurance, Institutional and International segments. The growth inthe Individual segment is primarily due to higher sales of variable and universal life insurance policies and annuity and investment-type products, resultingin additional commissions and other deferrable expenses. The increases in the Reinsurance, Institutional and International segments are commensuratewith growth in those businesses. Total amortization of deferred policy acquisition costs increased to $1,438 million in 2001 from $1,383 million in 2000.Amortization of $1,413 million and $1,478 million are allocated to other expenses in 2001 and 2000, respectively, while the remainder of the amortizationin each year is allocated to investment gains and losses. The decrease in amortization of deferred policy acquisition costs allocated to other expenses isattributable to a decline in the Individual segment, partially offset by increases in the Reinsurance and International segments. The decline in the Individualsegment is due to changes in the estimates of future gross margins and profits. Contributing to this variance are modifications made in the third quarter of2001 relating to the manner in which estimates of future market performance are developed. These estimates are used in determining unamortizeddeferred policy acquisition costs balances and the amount of related amortization. The modification will reflect an expected impact of past marketperformance on future market performance, as well as improving the ability to estimate deferred policy acquisition costs balances and relatedamortization. The increase in the Reinsurance segment is primarily due to fluctuations in allowances paid to ceding companies as a result of a change inproduct mix. The increase in the International segment is due to a write-off of deferred policy acquisition costs as a result of the economic and politicalevents in Argentina.
Income tax expense for the year ended December 31, 2001 was $227 million, or 37%, of income from continuing operations before provision forincome taxes, compared with $421 million, or 33%, for the comparable 2000 period. The 2001 effective tax rate differs from the federal corporate tax rateof 35% due to an increase in prior year income taxes on capital gains. The 2000 effective tax rate differs from the federal corporate tax rate of 35%primarily due to the payments made in the second quarter of 2000 to former Canadian policyholders in connection with the demutualization, the impact ofsurplus tax and a reduction in prior year income taxes on capital gains recorded in the third quarter of 2000. This reduction is associated with the previoussale of a business. Prior to its demutualization, the Company was subject to surplus tax imposed on mutual life insurance companies under Section 809of the Internal Revenue Code. The surplus tax results from the disallowance of a portion of a mutual life insurance company’s policyholder dividends as adeduction from taxable income.
In accordance with SFAS No. 144, income related to the Company’s real estate which was identified as held-for-sale on or after January 1, 2002 ispresented as discontinued operations for the years ended December 31, 2002, 2001 and 2000. The income from discontinued operations is comprisedof net investment income related to 47 properties that the Company began marketing for sale on or after January 1, 2002.
IndividualThe following table presents consolidated financial information for the Individual segment for the years indicated:
Year Ended December 31,
2002 2001 2000
(Dollars in millions)
RevenuesPremiums*********************************************************************** $ 4,507 $ 4,563 $ 4,673Universal life and investment-type product policy fees ********************************** 1,380 1,260 1,221Net investment income *********************************************************** 6,259 6,188 6,108Other revenues ****************************************************************** 418 495 650Net investment (losses) gains ****************************************************** (164) 827 227
Total revenues*************************************************************** 12,400 13,333 12,879
ExpensesPolicyholder benefits and claims **************************************************** 5,220 5,233 5,054Interest credited to policyholder account balances************************************* 1,793 1,898 1,680Policyholder dividends ************************************************************ 1,770 1,767 1,742Other expenses ***************************************************************** 2,629 2,747 3,012
Total expenses ************************************************************** 11,412 11,645 11,488
Income from continuing operations before provision for income taxes ********************* 988 1,688 1,391Provision for income taxes********************************************************* 363 631 507
Income from continuing operations************************************************** 625 1,057 884Income from discontinued operations, net of income taxes****************************** 201 38 36
Net income ********************************************************************* $ 826 $ 1,095 $ 920
Year ended December 31, 2002 compared with the year ended December 31, 2001—IndividualPremiums decreased by $56 million, or 1%, to $4,507 million for the year ended December 31, 2002 from $4,563 million for the comparable 2001
period. Premiums from insurance products decreased by $94 million, primarily resulting from a third quarter 2002 amendment of a reinsuranceagreement to increase the amount of insurance ceded from 50% to 100%. This amendment was effective January 1, 2002. The Company also believesthe decline is the result of a continued shift in policyholders’ preference from traditional policies to annuity and investment-type products. Thesedecreases are partially offset by policyholders expanding their traditional life insurance coverage through the purchase of additional insurance withdividend proceeds in 2002. Premiums from annuity products increased by $38 million as a result of higher sales of fixed annuities and supplementarycontracts with life contingencies.
Universal life and investment-type product policy fees increased by $120 million, or 10%, to $1,380 million for the year ended December 31, 2002from $1,260 million for the comparable 2001 period. Policy fees from insurance products increased by $145 million primarily due to higher revenue frominsurance fees, which increase as the average separate account asset base supporting the underlying minimum death benefit declines. The averageseparate account asset base has declined in response to poor equity market performance. Additionally, this variance reflects the acceleration of therecognition of unearned fees associated with future reinsurance recoveries. Policy fees from annuity and investment-type products decreased by$25 million primarily due to declines in the average separate account asset base resulting generally from poor equity market performance, partially offset
MetLife, Inc.12

by an increase in fees resulting from growth in annuity deposits. Policy fees from annuity and investment-type products are typically calculated as apercentage of average separate account assets. Such assets can fluctuate depending on equity market performance. If average separate account assetlevels continue to decline, management expects that policy fees from annuity and investment-type products will continue to be adversely impacted, whilerevenues from insurance fees on variable life products would be expected to rise.
Other revenues decreased by $77 million, or 16%, to $418 million for the year ended December 31, 2002 from $495 million for the comparable2001 period, largely due to lower commission and fee income associated with a volume decline in the broker/dealer and other subsidiaries which isprincipally due to the depressed equity markets.
Policyholder benefits and claims decreased by $13 million, or less than 1%, to $5,220 million for the year ended December 31, 2002 from$5,233 million for the comparable 2001 period. Policyholder benefits and claims for insurance products decreased by $119 million, primarily due to theimpact of the aforementioned reinsurance transaction and the establishment of liabilities for the September 11, 2001 tragedies in the previous year.Policyholder benefits and claims for annuity and investment-type products increased by $106 million primarily due to an increase in fixed and immediateannuity liabilities, resulting from business growth and an increase in the liability associated with guaranteed minimum death benefits on variable annuities.
Interest credited to policyholder account balances decreased by $105 million, or 6%, to $1,793 million for the year ended December 31, 2002compared with $1,898 for the comparable 2001 period. This decrease was primarily due to the establishment of a $118 million policyholder liability withrespect to certain group annuity contracts at New England Financial in 2001. Excluding this policyholder liability, interest credited increased slightly due toan increase in policyholder account balances which is primarily attributable to sales growth partially offset by declines in interest crediting rates.
Policyholder dividends increased by $3 million, or less than 1%, to $1,770 million for the year ended December 31, 2002 from $1,767 million for thecomparable 2001 period due to the increase in the invested assets supporting the policies associated with this segment’s large block of traditional lifeinsurance business. This increase is partially offset by the approval by the Company’s Board of Directors in the fourth quarter of 2002 of a reduction in thedividend scale to reflect the impact of the current low interest rate environment on the asset portfolios supporting these policies.
Other expenses decreased by $118 million, or 4%, to $2,629 million for the year ended December 31, 2002 million from $2,747 for the comparable2001 period. Excluding the capitalization and amortization of deferred policy acquisition costs, which are discussed below, other expenses decreased by$118 million, or 4%, to $2,922 million in 2002 from $3,040 million in 2001. Other expenses related to insurance products decreased by $129 million,which is attributable to continued expense management, reductions in volume-related commission expenses in the broker/dealer and other subsidiariesand a reduction of $62 million related to business realignment expenses incurred in 2001. These decreases are partially offset by increased pension andpost-retirement benefit expenses over the comparable period. Other expenses related to annuity and investment-type products increased by $11 million.This increase is commensurate with the rise in sales of new annuity and investment-type products as well as increased pension and post-retirementbenefit expenses. This increase is partially offset by the reduction of $37 million of business realignment expenses incurred in 2001.
Deferred policy acquisition costs are principally amortized in proportion to gross margins or gross profits, including investment gains or losses. Theamortization is allocated to investment gains and losses to provide consolidated statement of income information regarding the impact of investmentgains and losses on the amount of the amortization, and other expenses to provide amounts related to gross margins or profits originating fromtransactions other than investment gains and losses.
Capitalization of deferred policy acquisition costs increased by $111 million, or 12%, to $1,037 million for the year ended December 31, 2002 from$926 million for the comparable 2001 period due to higher sales of annuity and investment-type products, resulting in higher commissions and otherdeferrable expenses. Total amortization of deferred policy acquisition costs increased by $100 million, or 15%, to $754 million in 2002 from $654 millionin 2001. Amortization of deferred policy acquisition costs of $744 million and $633 million is allocated to other expenses in 2002 and 2001, respectively,while the remainder of the amortization in each year is allocated to investment gains and losses. Increases in amortization of deferred policy acquisitioncosts allocated to other expenses of $84 million and $27 million related to insurance products and annuity and investment-type products, respectively,are due to the impact of the depressed equity markets and changes in the estimates of future gross profits. In 2002, estimates of future dividend scales,future maintenance expenses, future rider margins, and future reinsurance recoveries were revised. In 2001, estimates of future fixed account interestspreads, future gross margins and profits related to separate accounts and future mortality margins were revised.
Year ended December 31, 2001 compared with the year ended December 31, 2000—IndividualPremiums decreased by $110 million, or 2%, to $4,563 million for the year ended December 31, 2001 from $4,673 million for the comparable 2000
period. Premiums from insurance products declined by $108 million. This decrease is primarily due to declines in traditional life insurance policies, whichreflects a maturing of that business and a continued shift in customer preference from those policies to variable life products. Premiums from annuityproducts declined by $2 million, due to lower sales of supplementary contracts with life contingencies and single premium immediate annuity business.
Universal life and investment-type product policy fees increased by $39 million, or 3%, to $1,260 million for the year ended December 31, 2001from $1,221 million for the comparable 2000 period. Policy fees from insurance products rose by $149 million. This growth is primarily due to increasesin variable life products reflecting a continued shift in customer preferences from traditional life products. Policy fees from annuity and investment-typeproducts decreased by $110 million, primarily resulting from a lower average separate account asset base. Policy fees from annuity and investment-typeproducts are typically calculated as a percentage of average assets. Such assets can fluctuate depending on equity market performance. Thus, theamount of fees can increase or decrease consistent with movements in average separate account balances.
Other revenues decreased by $155 million, or 24%, to $495 million for the year ended December 31, 2001 from $650 million for the comparable2000 period, primarily due to reduced commission and fee income associated with lower sales in the broker/dealer and other subsidiaries, which was aresult of the equity market downturn. Such commission and fee income can fluctuate consistent with movements in the equity market.
Policyholder benefits and claims increased by $179 million, or 4%, to $5,233 million for the year ended December 31, 2001 from $5,054 million forthe comparable 2000 period. Policyholder benefits and claims for insurance products rose by $192 million primarily due to increases in the liabilities forfuture policy benefits commensurate with the aging of the in-force block of business. In addition, increases of $74 million and $24 million in thepolicyholder dividend obligation and liabilities and claims associated with the September 11, 2001 tragedies, respectively, contributed to the variance.Partially offsetting these variances is a reduction in policyholder benefits and claims for annuity and investment-type products due to a decrease inliabilities for supplemental contracts with life contingencies.
Interest credited to policyholder account balances rose by $218 million, or 13%, to $1,898 million for the year ended December 31, 2001 from$1,680 million for the comparable 2000 period. Interest on insurance products increased by $165 million, primarily due to the establishment of apolicyholder liability of $118 million with respect to certain group annuity contracts at New England Financial. The remainder of the variance ispredominantly a result of higher average policyholder account balances. Interest on annuity and investment-type products grew by $53 million due to
MetLife, Inc. 13

slightly higher crediting rates and higher policyholder account balances stemming from increased sales, including products with a dollar cost averaging-type feature.
Policyholder dividends increased by $25 million, or 1%, to $1,767 million for the year ended December 31, 2001 from $1,742 million for thecomparable 2000 period. This is largely attributable to the growth in the assets supporting policies associated with this segment’s aging block oftraditional life insurance business.
Other expenses decreased by $265 million, or 9%, to $2,747 for the year ended December 31, 2001 from $3,012 million for the comparable 2000period. Excluding the capitalization and amortization of deferred policy acquisition costs that are discussed below, other expenses are lower by$121 million, or 4%, to $3,040 million in 2001 from $3,161 million in 2000. Other expenses related to insurance products decreased by $158 million dueto continued expense management, primarily due to reduced employee costs and lower discretionary spending. In addition, there were reductions involume-related commission expenses in the broker/dealer and other subsidiaries. These decreases are partially offset by an increase of $62 millionrelated to fourth quarter 2001 business realignment initiatives. The annuity and investment-type products experienced an increase in other expenses of$37 million primarily due to expenses associated with the business realignment initiatives.
Deferred policy acquisition costs are principally amortized in proportion to gross margins and profits, including investment gains or losses. Theamortization is allocated to investment gains and losses to provide consolidated statement of income information regarding the impact of investmentgains and losses on the amount of the amortization, and to other expenses to provide amounts related to gross margins and profits originating fromtransactions other than investment gains and losses.
Capitalization of deferred policy acquisition costs increased by $54 million, or 6%, to $926 million for the year ended December 31, 2001 from$872 million for the comparable 2000 period. This increase is primarily due to higher sales of variable and universal life insurance policies and annuity andinvestment-type products, resulting in higher commissions and other deferrable expenses. Total amortization of deferred policy acquisition costsincreased by $26 million, or 4%, to $654 million in 2001 from $628 million in 2000. Amortization of deferred policy acquisition costs of $633 million and$723 million is allocated to other expenses in 2001 and 2000, respectively, while the remainder of the amortization in each year is allocated to investmentgains and losses. Amortization of deferred policy acquisition costs allocated to other expenses related to insurance products declined by $48 million dueto changes in the estimate of future gross margins and profits. Amortization of deferred policy acquisition costs allocated to other expenses related toannuity and investment products declined by $42 million due to changes in the estimate of future gross profits. Contributing to this variance aremodifications made in the third quarter of 2001 relating to the manner in which estimates of future market performance are developed. These estimatesare used in determining unamortized deferred policy acquisition costs balances and the amount of related amortization. The modification reflects anexpected impact of past market performance on future market performance, and improves the ability to estimate deferred policy acquisition costsbalances and related amortization.
InstitutionalThe following table presents consolidated financial information for the Institutional segment for the years indicated:
Year Ended December 31,
2002 2001 2000
(Dollars in millions)
RevenuesPremiums************************************************************************ $ 8,254 $ 7,288 $ 6,900Universal life and investment-type product policy fees *********************************** 615 592 547Net investment income ************************************************************ 3,928 3,966 3,712Other revenues ******************************************************************* 609 649 650Net investment losses ************************************************************* (506) (15) (475)
Total revenues**************************************************************** 12,900 12,480 11,334
ExpensesPolicyholder benefits and claims ***************************************************** 9,339 8,924 8,178Interest credited to policyholder account balances************************************** 932 1,013 1,090Policyholder dividends ************************************************************* 115 259 124Other expenses ****************************************************************** 1,531 1,746 1,514
Total expenses *************************************************************** 11,917 11,942 10,906
Income from continuing operations before provision for income taxes ********************** 983 538 428Provision for income taxes********************************************************** 347 179 142
Income from continuing operations*************************************************** 636 359 286Income from discontinued operations, net of income taxes******************************* 123 23 21
Net income ********************************************************************** $ 759 $ 382 $ 307
Year ended December 31, 2002 compared with the year ended December 31, 2001—InstitutionalPremiums increased by $966 million, or 13%, to $8,254 million for the year ended December 31, 2002 from $7,288 million for the comparable
2001 period. Group insurance premiums increased by $505 million as a result of growth in this segment’s group life, dental, disability and long-term carebusinesses. Retirement and savings premiums increased by $461 million primarily due to the sale of a significant contract in the second quarter of 2002,as well as new sales throughout 2002 from structured settlements and traditional annuity products. Retirement and savings premium levels aresignificantly influenced by large transactions and, as a result, can fluctuate from period to period.
Universal life and investment-type product policy fees increased by $23 million, or 4%, to $615 million for the year ended December 31, 2002 from$592 million for the comparable 2001 period. This increase is primarily attributable to a fee resulting from the renegotiation of a portion of a bank-ownedlife insurance contract, as well as growth in existing business in the group universal life product line.
Other revenues decreased by $40 million, or 6%, to $609 million for the year ended December 31, 2002 from $649 million for the comparable 2001period. Retirement and savings other revenues decreased $73 million primarily due to a reduction in administrative fees as a result of the Company’s exitfrom the large market 401(k) business in late 2001, and lower fees earned on investments in separate accounts resulting generally from poor equity
MetLife, Inc.14
market performance. This decrease is partially offset by a $33 million increase in group insurance due to growth in the administrative service businessesand a settlement received in 2002 related to the Company’s former medical business.
Policyholder benefits and claims increased by $415 million, or 5%, to $9,339 million for the year ended December 31, 2002 from $8,924 million forthe comparable 2001 period. This variance is attributable to increases of $238 million and $177 million in group insurance and retirement and savings,respectively. Excluding $291 million of 2001 claims related to the September 11, 2001 tragedies, group insurance policyholder benefits and claimsincreased by $529 million commensurate with the aforementioned premium growth in this segment’s group life, dental, disability, and long-term carebusinesses. Excluding $215 million of 2001 policyholder benefits related to the fourth quarter 2001 business realignment initiatives, retirement andsavings policyholder benefits increased $392 million, commensurate with the aforementioned premium growth.
Interest credited to policyholders decreased by $81 million, or 8%, to $932 million for the year ended December 31, 2002 from $1,013 million forthe comparable 2001 period. Decreases of $42 million and $39 million in retirement and savings and group insurance, respectively, are primarilyattributable to declines in the average crediting rates in 2002 as a result of the current low interest rate environment.
Policyholder dividends decreased by $144 million, or 56%, to $115 million for the year ended December 31, 2002 from $259 million for thecomparable 2001 period. This decline is largely attributable to unfavorable mortality experience of several large group clients. Policyholder dividends varyfrom period to period based on participating contract experience, which are generally recorded in policyholder benefits and claims.
Other expenses decreased by $215 million, or 12%, to $1,531 million for the year ended December 31, 2002 from $1,746 million in thecomparable 2001 period. Retirement and savings decreased by $293 million, primarily attributable to $184 million of accrued expenses related tobusiness realignment initiatives recorded in the fourth quarter of 2001 (predominantly related to the Company’s exit from the large market 401(k)business), $30 million of which was released into income in the fourth quarter of 2002. In addition, ongoing expenses for the defined contribution producthave steadily decreased throughout 2002. The net reduction in retirement and savings is partially offset by an increase in pension and post-retirementcosts. Group insurance other expenses increased by $78 million. This increase is mainly attributable to growth in operational expenses for the dental anddisability products, as well as group insurance’s non-deferrable expenses, including a certain portion of premium taxes and commissions. Thesevariances are commensurate with the aforementioned premium growth. In addition, an increase in pension and post-retirement costs contributed to thevariance.
Year ended December 31, 2001 compared with the year ended December 31, 2000—InstitutionalPremiums increased by $388 million, or 6%, to $7,288 million for the year ended December 31, 2001 from $6,900 million for the comparable 2000
period. Group insurance premiums grew by $680 million, due, in most part, to sales growth and continued favorable policyholder retention in thissegment’s dental, disability and long-term care businesses. In addition, premiums received from several existing group life customers in 2001 and theBMA acquisition contributed $173 million and $29 million, respectively, to this variance. The 2000 balance includes $124 million in additional insurancecoverages purchased by existing customers with funds received in the demutualization. Retirement and savings premiums decreased by $292 million,primarily as a result of $270 million in premiums received in 2000 from existing customers.
Universal life and investment-type product policy fees increased by $45 million, or 8%, to $592 million for the year ended December 31, 2001 from$547 million for the comparable 2000 period. The rise in fees reflects growth in sales and deposits in group universal life and COLI products. Higher feesin group universal life products represent an increase in insured lives for an existing customer, coupled with a change in a customer preference for grouplife over optional term products. The increase in corporate-owned life insurance represents a $27 million fee received in 2001 from an existing customer.
Other revenues decreased by $1 million to $649 million for the year ended December 31, 2001 from $650 million for the comparable 2000 period.Group insurance other revenues decreased by $19 million. This decline is primarily attributable to the renegotiation of an existing contract with asignificant long-term care customer, as well as $20 million in final settlements in 2000 on several cases relating to the term life and former medicalbusiness. This variance is partially offset by a rise in other revenues stemming from sales growth in this segment’s dental and disability administrativebusinesses. Retirement and savings’ other revenues increased by $18 million, due to $12 million in earnings on seed money and an increase inadministrative services fees for the defined contribution group businesses.
Policyholder benefits and claims increased by $746 million, or 9%, to $8,924 million for the year ended December 31, 2001 from $8,178 million forthe comparable 2000 period. Group insurance policyholder benefits and claims grew by $778 million, primarily due to growth in this segment’s group life,dental, disability and long-term care insurance businesses, commensurate with the premium variance discussed above. In addition, $291 million inclaims related to the September 11, 2001 tragedies contributed to this variance. Retirement and savings policyholder benefits and claims declined by$32 million. A decrease commensurate with the $292 million premium variance discussed above is almost entirely offset by a $215 million increase inpolicyholder benefits associated with fourth quarter 2001 business realignment initiatives.
Interest credited to policyholder account balances decreased by $77 million, or 7%, to $1,013 million for the year ended December 31, 2001 from$1,090 million for the comparable 2000 period. Retirement and savings decreased by $53 million, or 9%, to $549 million in 2001 from $602 million in2000, due to a overall decline in crediting rates in 2001 as a result of the low interest rate environment. A $24 million drop in group life is largelyattributable to an overall decline in crediting rates in 2001 as a result of the low interest rate environment. The variance in group life was partiallydampened by an increase in average customer account balances stemming from asset growth, resulting in $12 million in additional interest credited.
Policyholder dividends increased by $135 million, or 109%, to $259 million for the year ended December 31, 2001 from $124 million for thecomparable 2000 period. The rise in dividends is primarily attributed to favorable experience on a large group life contract in 2001. Policyholder dividendsvary from period to period based on insurance contract experience, which are generally recorded in policyholder benefits and claims.
Other expenses increased by $232 million, or 15%, to $1,746 million for the year ended December 31, 2001 from $1,514 million for thecomparable 2000 period. Other expenses related to retirement and savings rose by $121 million, which is largely attributable to $184 million in expensesassociated with fourth quarter 2001 business realignment initiatives. This variance is partially offset by a decrease in expenses, due in most part, toexpense management initiatives. Group insurance expenses grew by $111 million due primarily to a rise in non-deferrable variable expenses associatedwith premium growth. Non-deferrable variable expenses include premium tax, commissions and administrative expenses for dental, disability and long-term care businesses.
MetLife, Inc. 15

ReinsuranceThe following table presents consolidated financial information for the Reinsurance segment for the years indicated:
Year Ended December 31,
2002 2001 2000
(Dollars in millions)
RevenuesPremiums ************************************************************************** $2,005 $1,762 $1,450Net investment income*************************************************************** 421 390 379Other revenues ********************************************************************* 43 42 29Net investment gains (losses) ********************************************************* 2 (6) (2)
Total revenues ****************************************************************** 2,471 2,188 1,856
ExpensesPolicyholder benefits and claims ******************************************************* 1,554 1,484 1,096Interest credited to policyholder account balances **************************************** 146 122 109Policyholder dividends**************************************************************** 22 24 21Other expenses********************************************************************* 547 439 446
Total expenses****************************************************************** 2,269 2,069 1,672
Income before provision for income taxes and minority interest****************************** 202 119 184Provision for income taxes ************************************************************ 43 27 48Minority interest ********************************************************************* 75 52 67
Net income ************************************************************************ $ 84 $ 40 $ 69
Year ended December 31, 2002 compared with the year ended December 31, 2001—ReinsurancePremiums increased by $243 million, or 14%, to $2,005 million for the year ended December 31, 2002 from $1,762 million for the comparable
2001 period. New premiums from facultative and automatic treaties and renewal premiums on existing blocks of business, particularly in the U.S. andU.K. reinsurance operations, all contributed to the premium growth. Premium levels are significantly influenced by large transactions and reportingpractices of ceding companies and, as a result, can fluctuate from period to period.
Other revenues remained essentially unchanged at $43 million for the year ended December 31, 2002 versus $42 million for the comparable 2001period.
Policyholder benefits and claims increased by $70 million, or 5%, to $1,554 million for the year ended December 31, 2002 from $1,484 million forthe comparable 2001 period. Policyholder benefits and claims were 78% of premiums for the year ended December 31, 2002 compared to 84% in thecomparable 2001 period. The decrease in policyholder benefits and claims as a percentage of premiums is primarily attributable to higher than expectedmortality in the U.S. reinsurance operations during the first and fourth quarters of 2001, favorable claims experience in 2002 and the 2001 impact ofclaims associated with the September 11, 2001 tragedies. In addition, increases in the liabilities for future policyholder benefits and adverse results on thereinsurance of Argentine pension business during 2001 contributed to the decrease. The level of claims may fluctuate from period to period, but exhibitsless volatility over the long term.
Interest credited to policyholder account balances increased by $24 million, or 20%, to $146 million for the year ended December 31, 2002 from$122 million for the comparable 2001 period. Contributing to this growth were several new deferred annuity reinsurance agreements executed during2002. The crediting rate on certain blocks of annuities is based on the performance of the underlying assets.
Policyholder dividends were essentially unchanged at $22 million for the year ended December 31, 2002, versus $24 million for the 2001comparable period.
Other expenses increased by $108 million, or 25%, to $547 million for the year ended December 31, 2002 from $439 million for the comparable2001 period. The increase in other expenses is primarily attributable to an increase in reinsurance business in the U.K., which is characterized by higherinitial reinsurance allowances than those historically experienced in the segment. These expenses fluctuate depending on the mix of the underlyinginsurance products being reinsured as allowances paid and the related capitalization and amortization can vary significantly based on the type ofbusiness and the reinsurance treaty.
Minority interest reflects third-party ownership interests in RGA.
Year ended December 31, 2001 compared with the year ended December 31, 2000—ReinsurancePremiums increased by $312 million, or 22%, to $1,762 million for the year ended December 31, 2001 from $1,450 million for the comparable
2000 period. New premiums from facultative and automatic treaties and renewal premiums on existing blocks of business all contributed to the premiumgrowth. Premium levels are significantly influenced by large transactions and reporting practices of ceding companies and, as a result, can fluctuate fromperiod to period.
Other revenues increased by $13 million, or 45%, to $42 million for the year ended December 31, 2001 from $29 million for the comparable 2000period. The increase is due to an increase in fees earned on financial reinsurance, primarily as a result of the acquisition of RGA Financial Group, LLCduring the second half of 2000.
Policyholder benefits and claims increased by $388 million, or 35%, to $1,484 million for the year ended December 31, 2001 from $1,096 million forthe comparable 2000 period. Claims experience for the year ended December 31, 2001 includes claims arising from the September 11, 2001 tragediesof approximately $16 million, net of amounts recoverable from reinsurers. As a percentage of premiums, policyholder benefits and claims increased to84% for the year ended December 31, 2001 from 76% for the comparable 2000 period. This increase is attributed primarily to higher than expectedmortality in the U.S. reinsurance operations during the first and fourth quarters of 2001, in addition to the claims arising from the terrorist attacks.Additionally, increases for benefits and adverse results on the reinsurance of Argentine pension business contributed to the increase. Mortality isexpected to vary from period to period, but generally remains fairly constant over the long term.
Interest credited to policyholder account balances increased by $13 million, or 12%, to $122 million for the year ended December 31, 2001 from$109 million for the comparable 2000 period. Interest credited to policyholder account balances relates to amounts credited on deposit-type contracts
MetLife, Inc.16

and certain cash-value contracts. The increase is primarily related to an increase in the underlying account balances due to a new block of singlepremium deferred annuities reinsured in 2001. Additionally, the crediting rate on certain blocks of annuities is based on the performance of the underlyingassets. Therefore, any fluctuations in interest credited related to these blocks are generally offset by a corresponding change in net investment income.
Policyholder dividends were essentially unchanged at $24 million for the year ended December 31, 2001 as compared to $21 million for the yearended December 31, 2000.
Other expenses decreased by $7 million, or 2%, to $439 million for the year ended December 31, 2001 from $446 million for the comparable 2000period. Other expenses, which include underwriting, acquisition and insurance expenses, were 20% of segment revenues in 2001 compared with 24%in 2000. This percentage fluctuates depending on the mix of the underlying insurance products being reinsured.
Minority interest reflects third-party ownership interests in RGA.
Auto & HomeThe following table presents consolidated financial information for the Auto & Home segment for the years indicated:
Year Ended December 31,
2002 2001 2000
(Dollars in millions)
RevenuesPremiums ************************************************************************** $2,828 $2,755 $2,636Net investment income*************************************************************** 177 200 194Other revenues ********************************************************************* 26 22 40Net investment losses**************************************************************** (46) (17) (20)
Total revenues ****************************************************************** 2,985 2,960 2,850
ExpensesPolicyholder benefits and claims ******************************************************* 2,019 2,121 2,005Other expenses********************************************************************* 793 800 827
Total expenses****************************************************************** 2,812 2,921 2,832
Income before provision (benefit) for income taxes **************************************** 173 39 18Provision (benefit) for income taxes ***************************************************** 41 (2) (12)
Net income ************************************************************************ $ 132 $ 41 $ 30
Year ended December 31, 2002 compared with the year ended December 31, 2001—Auto & HomePremiums increased by $73 million, or 3%, to $2,828 million for the year ended December 31, 2002 from $2,755 million for the comparable 2001
period. Auto and property premiums increased by $66 million and $1 million, respectively, primarily due to increases in average premium earned perpolicy resulting from rate increases. The impact on premiums from rate increases was partially offset by an expected reduction in retention and areduction in new business sales. Premiums from other personal lines increased by $6 million.
Other revenues increased by $4 million, or 18%, to $26 million for the year ended December 31, 2002 from $22 million for the comparable 2001period. This increase was primarily due to income earned on a COLI policy purchased in the second quarter of 2002, as well as higher fees oninstallment payments. These increases were partially offset by an adjustment to a deferred gain related to the disposition of this segment’s reinsurancebusiness in 1990.
Policyholder benefits and claims decreased by $102 million, or 5%, to $2,019 million for the year ended December 31, 2002 from $2,121 million forthe comparable 2001 period. Property policyholder benefits and claims decreased by $120 million due to improved claim frequency, underwriting andagency management actions, and a $41 million reduction in catastrophe losses. Property catastrophes represented 7.4% of the property loss ratio in2002 compared to 13.5% in 2001. Other policyholder benefits and claims decreased by $10 million due to fewer personal umbrella claims. Fluctuationsin these policyholder benefits and claims may not be commensurate with the change in premiums for a given period due to low premium volume and highliability limits. Auto policyholder benefits and claims increased by $28 million largely due to an increase in current year bodily injury and no-fault severities.Costs associated with the processing of the New York assigned risk business also contributed to this increase. These increases were partially offset byimproved claim frequency resulting from milder winter weather, underwriting and agency management actions, as well as lower catastrophe losses.
Other expenses decreased by $7 million, or 1%, to $793 million for the year ended December 31, 2002 from $800 million for the comparable 2001period. This decrease is primarily due to reduced employee head-count and reduced expenses associated with the consolidation of The St. Paulcompanies acquired in 1999. These declines are partially offset by an increase in expenses related to the outsourced New York assigned risk business.
The effective income tax rates for the year ended December 31, 2002 and 2001 differ from the federal corporate tax rate of 35% due to the impactof non-taxable investment income.
Year ended December 31, 2001 compared with the year ended December 31, 2000—Auto & HomePremiums increased by $119 million, or 5%, to $2,755 million for the year ended December 31, 2001 from $2,636 million for the comparable 2000
period. Auto premiums increased by $99 million. Property premiums increased by $17 million. Both increases were largely due to rate increases. Due toincreased rate activity, the retention ratio for the existing business declined from 90% to 89%. Premiums from other personal lines increased by $3 million.
Other revenues decreased by $18 million, or 45%, to $22 million for the year ended December 31, 2001 from $40 million for the comparable 2000period. This decrease is primarily due to a revision of an estimate made in 2000 of amounts recoverable from reinsurers related to the disposition of thissegment’s reinsurance business in 1990.
Policyholder benefits and claims increased by $116 million, or 6%, to $2,121 million for the year ended December 31, 2001 from $2,005 million forthe comparable 2000 period. Auto policyholder benefits and claims increased by $62 million due to increased average claim costs, growth in thebusiness and adverse weather in the first quarter of 2001. Despite this increase, the auto loss ratio decreased to 75.9% in 2001 from 76.6% in 2000 as aresult of higher premiums per policy. Property policyholder benefits and claims increased by $41 million due to increased non-catastrophe weather-related losses in 2001. Correspondingly, the property loss ratio increased to 80.7% in 2001 from 76.4% in 2000. Catastrophes represented 13.5% ofthe loss ratio in 2001 compared to 17.3% in 2000. Other policyholder benefits and claims grew by $13 million, primarily due to an increase in high liability
MetLife, Inc. 17

personal umbrella claims. Fluctuations in these policyholder benefits and claims may not be commensurate with the change in premiums for a givenperiod due to low premium volume and high liability limits.
Other expenses decreased by $27 million, or 3%, to $800 million for the year ended December 31, 2001 from $827 million for the comparable2000 period. This decrease is due to a reduction in integration costs associated with the St. Paul acquisition.
The effective income tax rates for the years ended December 31, 2001 and 2000 differ from the federal corporate tax rate of 35% due to the impactof non-taxable investment income.
Asset ManagementThe following table presents consolidated financial information for the Asset Management segment for the years indicated:
Year Ended December 31,
2002 2001 2000
(Dollars in millions)
RevenuesNet investment income******************************************************************** $ 59 $ 71 $ 90Other revenues ************************************************************************** 166 198 760Net investment (losses) gains ************************************************************** (4) 25 —
Total revenues *********************************************************************** 221 294 850
Other Expenses ************************************************************************ 211 252 749
Income before provision for income taxes and minority interest*********************************** 10 42 101Provision for income taxes ***************************************************************** 4 15 32Minority interest ************************************************************************** — — 35
Net income ***************************************************************************** $ 6 $ 27 $ 34
Year ended December 31, 2002 compared with the year ended December 31, 2001—Asset ManagementOther revenues, which primarily consist of management and advisory fees from third parties, decreased by $32 million, or 16%, to $166 million for
the year ended December 31, 2002 from $198 million for the comparable 2001 period. The most significant factor contributing to this decline is a$31 million decrease resulting from the sale of Conning, which occurred in July 2001. Excluding the impact of this transaction, other revenues remainedessentially unchanged at $166 million for the year ended December 31, 2002 as compared to $167 million for the year ended December 31, 2001.Despite lower average assets under management, revenues remained constant due to performance and incentive fees earned on certain real estate andhedge fund products. The lower assets under management are primarily due to institutional client withdrawals, and the downturn in the equity market. Inaddition, fourth quarter 2002 product closings and business exits also contributed to this decline.
Other expenses decreased by $41 million, or 16%, to $211 million for the year ended December 31, 2002 from $252 million for the comparable2001 period. Excluding the impact of the sale of Conning, other expenses decreased by $6 million, or 3%, to $211 million in 2002 from $217 million in2001. This decrease is due to reductions in marketing-related expenses and expenses related to fund reimbursements. In addition, a decrease inamortization of deferred sales commissions resulted from a reduction in sales. These decreases were partially offset by a $5 million increase in employeecompensation attributable to severance-related expenses resulting from third and fourth quarter 2002 staff reductions.
Year ended December 31, 2001 compared with the year ended December 31, 2000—Asset ManagementOther revenues, which are primarily comprised of management and advisory fees from third parties, decreased by $562 million, or 74%, to
$198 million in 2001 from $760 million in 2000. The most significant factors contributing to this decline were a $522 million decrease resulting from thesale of Nvest, which occurred in October 2000, and a $48 million decrease resulting from the sale of Conning, which occurred in July 2001. Excludingthe impact of these transactions, other revenues increased by $8 million, or 5%, to $167 million in 2001 from $159 million in 2000. This is attributable toan increase in real estate assets under management that command a higher fee. Assets under management in the remaining Asset Managementorganization decreased from $56 billion as of December 31, 2000 to $51 billion at December 31, 2001. The decline occurred as a result of the equitymarket downturn and MetLife institutional customer withdrawals. Third party assets under management registered only a slight decrease of $352 millionas a result of the equity market downturn, substantially offset by strong mutual fund sales and the purchase of a real estate portfolio in the second quarterof 2001 comprised of new assets of $1.7 billion. Management and advisory fees are typically calculated based on a percentage of assets undermanagement, and are not necessarily proportionate to average assets managed due to changes in account mix.
Other expenses decreased by $497 million, or 66%, to $252 million in 2001 from $749 million in 2000. The sale of Nvest reduced other expensesby $457 million and the sale of Conning reduced other expenses by $55 million. Excluding the impact of these transactions, other expenses increasedby $15 million, or 7%, to $217 million in 2001 from $202 million in 2000. This variance is attributable to an increase in total compensation and benefitsand an increase in discretionary spending. Compensation and benefits expense totaled $111 million in 2001 and is comprised of approximately 63%base compensation and 37% variable compensation. Base compensation increased by $9 million, or 15%, to $70 million in 2001 from $61 million in2000, primarily due to higher staffing levels. Variable compensation decreased by $1 million, or 2%, to $41 million in 2001 from $42 million in 2000 due tolower profitability. Variable incentive payments are based upon profitability, investment portfolio performance, new business sales and growth in revenuesand profits. The variable compensation plans reward the employees for growth in their businesses, but also require them to share in the impact of anydeclines. Increased sales commissions arising from higher mutual fund sales in 2001 were largely offset by downward revisions in other variablecompensation due to a decline in profits. Other general and administrative expenses increased $7 million, or 7%, to $106 million in 2001 from $99 millionin 2000, primarily due to increases in occupancy costs and increased mutual fund reimbursement subsidies.
Minority interest, principally reflecting third-party ownership interest in Nvest, decreased by $35 million, or 100%, due to the sale of Nvest.
MetLife, Inc.18

InternationalThe following table presents consolidated financial information for the International segment for the years indicated:
Year Ended December 31,
2002 2001 2000
(Dollars in millions)
RevenuesPremiums ************************************************************************** $1,511 $ 846 $ 660Universal life and investment-type product policy fees ************************************* 144 38 53Net investment income*************************************************************** 461 267 254Other revenues ********************************************************************* 14 16 9Net investment (losses) gains ********************************************************* (9) (16) 18
Total revenues ****************************************************************** 2,121 1,151 994
ExpensesPolicyholder benefits and claims ******************************************************* 1,388 689 562Interest credited to policyholder account balances **************************************** 79 51 56Policyholder dividends**************************************************************** 35 36 32Payments to former Canadian policyholders ********************************************* — — 327Other expenses********************************************************************* 507 329 292
Total expenses****************************************************************** 2,009 1,105 1,269
Income (loss) before provision for income taxes ****************************************** 112 46 (275)Provision for income taxes ************************************************************ 28 32 10
Net income (loss) ******************************************************************* $ 84 $ 14 $ (285)
Year ended December 31, 2002 compared with the year ended December 31, 2001—InternationalPremiums increased by $665 million, or 79%, to $1,511 million for the year ended December 31, 2002 from $846 million for the comparable 2001
period. The June 2002 acquisition of Hidalgo and the 2001 acquisitions in Chile and Brazil increased premiums by $228 million, $102 million and$8 million, respectively. In addition, a portion of the increase in premiums is attributable to a $108 million increase due to the sale of an annuity contract inthe first quarter of 2002 to a Canadian trust company. South Korea’s premiums increased by $91 million primarily due to a larger professional sales forceand improved agent productivity. Mexico’s premiums (excluding Hidalgo), increased by $66 million, primarily due to increases in its group life, majormedical and individual life businesses. Excluding the aforementioned sale of an annuity contract, Canada’s premiums increased by $26 million due to therestructuring of a pension contract from an investment-type product to a long-term annuity. Spain’s and Taiwan’s premiums increased by $25 million and$13 million, respectively, due primarily to continued growth in the direct auto business and in the individual life insurance business. Hong Kong’spremiums increased $5 million primarily due to continued growth in the group life and traditional life businesses. These increases are partially offset by adecrease in Argentina’s premiums of $9 million due to the reduction in business caused by the Argentine economic environment. The remainder of thevariance is attributable to minor fluctuations in other countries.
Universal life and investment type-product policy fees increased by $106 million, or 279%, to $144 million for the year ended December 31, 2002from $38 million for the comparable 2001 period. The acquisition of Hidalgo and the acquisitions in Chile resulted in increases of $102 million and$5 million, respectively. These increases were partially offset by a $9 million decrease in Spain due to a reduction in fees caused by a decline in assetsunder management, as a result of the cessation of product lines offered through a joint venture with Banco Santander in 2001. The remainder of thevariance is attributable to minor fluctuations in several countries.
Other revenues decreased by $2 million, or 13%, to $14 million for the year ended December 31, 2002 from $16 million for the comparable 2001period. Canada’s other revenues in 2001 included $1 million due primarily to the settlement of two legal cases in 2001. The remainder of the variance isattributable to minor fluctuations in several countries. The acquisition of Hidalgo and the acquisitions in Chile and Brazil had no material impact on thisvariance.
Policyholder benefits and claims increased by $699 million, or 101%, to $1,388 million for the year ended December 31, 2002 from $689 million forthe comparable 2001 period. The acquisition of Hidalgo and the acquisitions in Chile increased policyholder benefits and claims by $224 million and$169 million, respectively. In addition, $108 million of this increase in policyholder benefits and claims is attributable to the aforementioned sale of anannuity contract in Canada. South Korea’s, Mexico’s (excluding Hidalgo), Taiwan’s and Spain’s policyholder benefits and claims increased by $69 million,$67 million, $18 million and $15 million, respectively, commensurate with the overall premium increases discussed above. Excluding the aforementionedsale of an annuity contract, Canada’s policyholder benefits and claims increased by $32 million primarily due to the restructuring of a pension contractfrom an investment-type product to a long-term annuity. The remainder of the variance is attributable to minor fluctuations in several countries.
Interest credited to policyholder account balances increased by $28 million, or 55%, to $79 million for the year ended December 31, 2002 from$51 million for the comparable 2001 period. The acquisition of Hidalgo contributed $51 million. This increase was partially offset by a decrease of$17 million in Argentina. This decrease is primarily due to modifications to policy contracts as authorized by the Argentinean government and a reductionof investment-type policies in-force. In addition, Spain’s interest credited decreased by $7 million primarily due to a decrease in the assets undermanagement for life products with guarantees associated with the sale of a block of policies to Banco Santander in May 2001. The remainder of thevariance is attributable to minor fluctuations in several countries.
Policyholder dividends remained essentially unchanged at $35 million for the year ended December 31, 2002 versus $36 million for the comparable2001 period. The acquisition of Hidalgo and the acquisitions in Chile and Brazil had no material impact on this variance.
Other expenses increased by $178 million, or 54%, to $507 million for the year ended December 31, 2002 from $329 million for the comparable2001 period. The acquisition of Hidalgo and the acquisitions in Chile and Brazil contributed $82 million, $21 million and $5 million, respectively. SouthKorea’s, Mexico’s (excluding Hidalgo), and Hong Kong’s other expenses increased by $29 million, $19 million and $7 million, respectively. Theseincreases are primarily due to increased non-deferrable commissions from higher sales as discussed above, particularly in South Korea where fixed salescompensation is paid to new sales management as part of the professional agency expansion. Argentina’s other expenses increased by $9 million due to
MetLife, Inc. 19
additional loss recognition in connection with ongoing economic circumstances in the country. Poland’s other expenses increased by $5 million primarilydue to costs incurred in the fourth quarter of 2002 associated with the closing of this operation. The remainder of the variance is attributable to minorfluctuations in several countries.
Year ended December 31, 2001 compared with the year ended December 31, 2000—InternationalPremiums increased by $186 million, or 28%, to $846 million for the year ended December 31, 2001 from $660 million for the comparable 2000
period. Mexico’s premiums grew by $89 million due to additional sales in group life, major medical and individual life products. Protection-type productsales fostered by the continued expansion of the professional sales force in South Korea accounted for an additional $41 million in premiums. Spain’spremiums rose by $18 million primarily due to continued growth in the direct auto business. Higher individual life sales resulted in an additional $17 millionin Taiwanese premiums. The 2001 acquisitions in Brazil and Chile increased premiums by $12 million and $7 million, respectively, in those countries.Hong Kong’s premiums grew by $5 million primarily due to continued growth in the direct marketing, group life, and traditional life businesses. Thesevariances were partially offset by a $3 million decline in Argentinean individual life premiums, reflecting the impact of economic and political events in thatcountry. The remainder of the variance is attributable to minor fluctuations in several countries.
Universal life and investment-type product policy fees decreased by $15 million, or 28%, to $38 million for the year ended December 31, 2001 from$53 million for the comparable 2000 period. This decline is primarily attributable to a $19 million reduction in fees in Spain caused by a reduction inassets under management, as a result of a planned cessation of product lines offered through a joint venture with Banco Santander. The remainder of thevariance is attributable to minor fluctuations in several countries.
Other revenues increased by $7 million, or 78%, to $16 million for the year ended December 31, 2001 from $9 million for the comparable 2000period. Argentina’s other revenues grew by $5 million primarily due to foreign currency transaction gains in the private pension business, which wasintroduced in the third quarter of 2001. The required accounting for foreign currency translation fluctuations in Indonesia, a highly inflationary economy,resulted in a $3 million increase in other revenues. These variances were partially offset by a $3 million decrease in Taiwan due to higher groupreinsurance commissions received in 2000. The remainder of the increase is attributable to minor variances in several countries.
Policyholder benefits and claims increased by $127 million, or 23%, to $689 million for the year ended December 31, 2001 from $562 million for thecomparable 2000 period. Mexico’s, South Korea’s and Taiwan’s policyholder benefits and claims grew by $74 million, $24 million and $15 million,respectively, commensurate with the overall premium variance discussed above. The 2001 acquisitions in Brazil and Chile contributed $9 million and$7 million, respectively, to this variance. These variances are partially offset by a $7 million decline in Argentina’s policyholder benefits and claims as aresult of the impact of economic and political events in that country. The remainder of the variance is attributable to minor fluctuations in several countries.
Interest credited to policyholder account balances decreased by $5 million, or 9%, to $51 million for the year ended December 31, 2001 from $56million for the comparable 2000 period. An overall decline in crediting rates on interest-sensitive products in 2001 as a result of the low interest rateenvironment is primarily responsible for a $6 million reduction in South Korea. Spain’s interest credited dropped by $6 million due to a reduction in assetsunder management, as a result of a planned cessation of product lines offered through a joint venture with Banco Santander. These variances werepartially offset by a $2 million increase in both Mexico and Argentina, due to an increase in average customer account balances.
Policyholder dividends increased by $4 million, or 13%, to $36 million for the year ended December 31, 2001 from $32 million for the comparable2000 period. The growth in Mexico’s group life sales mentioned above resulted in an increase in policyholder dividends of $2 million. Taiwan’s individuallife sales contributed an additional $2 million in policyholder dividends. The remainder of the variance is attributable to minor fluctuations in severalcountries.
Payments of $327 million related to Metropolitan Life’s demutualization were made during the second quarter of 2000 to holders of certain policiestransferred to Clarica Life Insurance Company in connection with the sale of a substantial portion of the Company’s Canadian operations in 1998.
Other expenses increased by $37 million, or 13%, to $329 million for the year ended December 31, 2001 from $292 million in the comparable 2000period. Argentina’s other expenses rose by $15 million due to a write-off of deferred policy acquisition costs, resulting from a revision in the calculation ofestimated gross margins and profits caused by the anticipated impact of economic and political events in that country. Mexico and South Korea’s otherexpenses grew by $13 million and $10 million, respectively, primarily due to the growth in business in these countries. The 2001 acquisitions in Brazil andChile contributed $7 million and $3 million, respectively, to this variance. These variances were partially offset by an $11 million decrease in Spain’s otherexpenses due to a reduction in payroll, commissions, and administrative expenses as a result of a planned cessation of product lines offered through ajoint venture with Banco Santander. The remainder of the variance is attributable to minor fluctuations in several countries.
Corporate & Other
Year ended December 31, 2002 compared with the year ended December 31, 2001 — Corporate & OtherOther revenues increased by $16 million, or 19%, to $101 million for the year ended December 31, 2002 from $85 million for the comparable 2001
period, primarily due to the sale of a company-occupied building, and income earned on COLI purchased during 2002, partially offset by an increase inthe elimination of intersegment activity.
Other expenses increased by $111 million, or 17%, to $768 million for the year ended December 31, 2002 from $657 million for the comparable2001 period, primarily due to increases in legal and interest expenses. The 2002 period includes a $266 million charge to increase the Company’sasbestos-related liability and expenses to cover costs associated with the resolution of federal government investigations of General American’s formerMedicare business. These increases are partially offset by a $250 million charge recorded in the fourth quarter of 2001 to cover costs associated with theresolution of class action lawsuits and a regulatory inquiry pending against Metropolitan Life, involving alleged race-conscious insurance underwritingpractices prior to 1973. The increase in interest expenses is primarily due to increases in long-term debt resulting from the issuance of $1.25 billion and$1 billion of senior debt in November 2001 and December 2002, respectively, partially offset by a decrease in commercial paper in 2002. In addition, adecrease in the elimination of intersegment activity contributed to the variance.
Year ended December 31, 2001 compared with the year ended December 31, 2000 — Corporate & OtherOther revenues decreased by $6 million, or 7%, to $85 million for the year ended December 31, 2001 from $91 million for the comparable 2000
period, primarily due the sales of certain subsidiaries in 2000, partially offset by the recognition of a refund earned on a reinsurance treaty in 2001 and adecrease in the elimination of intersegment activity.
Demutualization costs of $230 million were incurred during the year ended December 31, 2000. These costs are related to Metropolitan Life’sdemutualization on April 7, 2000.
Other expenses increased by $198 million, or 43%, to $657 million for the year ended December 31, 2001 from $459 million for the comparable2000 period. This variance is primarily due to higher legal expenses, expenses associated with MetLife, Inc. shareholder services cost and start-up costs
MetLife, Inc.20

relating to MetLife’s banking initiatives, as well as a decrease in the elimination of intersegment activity. Legal expenses of $250 million were recorded inthe fourth quarter of 2001 to cover costs associated with the anticipated resolution of class action lawsuits and a regulatory inquiry pending againstMetropolitan Life, involving alleged race-conscious insurance underwriting practices prior to 1973. These increases are partially offset by a reduction ininterest expenses due to reduced average levels in borrowing and a lower rate environment in 2001.
Liquidity and Capital Resources
The Holding Company
Capital
Restrictions and Limitations on Bank Holding Companies and Financial Holding Companies — Capital. MetLife, Inc. and its insured depositoryinstitution subsidiary are subject to risk-based and leverage capital guidelines issued by the federal banking regulatory agencies for banks and financialholding companies. The federal banking regulatory agencies are required by law to take specific prompt corrective actions with respect to institutions thatdo not meet minimum capital standards. At December 31, 2002, MetLife and its insured depository institution subsidiary were in compliance with theaforementioned guidelines.
Liquidity
Liquidity refers to a company’s ability to generate adequate amounts of cash to meet its needs. Liquidity is managed to preserve stable, reliable andcost-effective sources of cash to meet all current and future financial obligations. Liquidity is provided by a variety of sources, including a portfolio of liquidassets, a diversified mix of short- and long-term funding sources from the wholesale financial markets and the ability to borrow through committed creditfacilities. The Holding Company is an active participant in the global financial markets through which it obtains a significant amount of funding. Thesemarkets, which serve as cost-effective sources of funds, are critical components of the Holding Company’s liquidity management. Decisions to accessthese markets are based upon relative costs, prospective views of balance sheet growth, and a targeted liquidity profile. A disruption in the financialmarkets could limit access to liquidity for the Holding Company.
The Holding Company’s ability to maintain regular access to competitively priced wholesale funds is fostered by its current debt ratings from themajor credit rating agencies. Management views its capital ratios, credit quality, stable and diverse earnings streams, diversity of liquidity sources and itsliquidity monitoring procedures as critical to retaining high credit ratings.
Liquidity is monitored through the use of internal liquidity risk metrics, including the composition and level of the liquid asset portfolio, timingdifferences in short-term cash flow obligations, access to the financial markets for capital and term-debt transactions, and exposure to contingent drawson the Holding Company’s liquidity.
Liquidity Sources
Dividends. The primary source of the Holding Company’s liquidity is dividends it receives from Metropolitan Life. Under the New York InsuranceLaw, Metropolitan Life is permitted without prior insurance regulatory clearance to pay a stockholder dividend to the Holding Company as long as theaggregate amount of all such dividends in any calendar year does not exceed the lesser of (i) 10% of its statutory surplus as of the immediately precedingcalendar year, and (ii) its statutory net gain from operations for the immediately preceding calendar year (excluding realized capital gains). Metropolitan Lifewill be permitted to pay a stockholder dividend to the Holding Company in excess of the lesser of such two amounts only if it files notice of its intention todeclare such a dividend and the amount thereof with the Superintendent and the Superintendent does not disapprove the distribution. Under the NewYork Insurance Law, the Superintendent has broad discretion in determining whether the financial condition of a stock life insurance company wouldsupport the payment of such dividends to its stockholders. The New York Insurance Department (the ‘‘Department’’) has established informal guidelinesfor such determinations. The guidelines, among other things, focus on the insurer’s overall financial condition and profitability under statutory accountingpractices. Management of the Holding Company cannot provide assurance that Metropolitan Life will have statutory earnings to support payment ofdividends to the Holding Company in an amount sufficient to fund its cash requirements and pay cash dividends or that the Superintendent will notdisapprove any dividends that Metropolitan Life must submit for the Superintendent’s consideration. In addition, the Holding Company also receivesdividends from its other subsidiaries. The Holding Company’s other insurance subsidiaries are also subject to restrictions on the payment of dividends totheir respective parent companies.
The dividend limitation is based on statutory financial results. Statutory accounting practices, as prescribed by the Department, differ in certainrespects from accounting principles used in financial statements prepared in conformity with GAAP. The significant differences relate to deferred policyacquisition costs, certain deferred income taxes, required investment reserves, reserve calculation assumptions, goodwill and surplus notes.
Liquid Assets. An integral part of the Holding Company’s liquidity management is the amount of liquid assets that it holds. Liquid assets includecash, cash equivalents, short-term investments and marketable fixed maturities. At December 31, 2002 and 2001, the Holding Company had$1,343 million and $2,981 million in liquid assets, respectively.
Global Funding Sources. Liquidity is also provided by a variety of both short- and long-term instruments, including repurchase agreements,commercial paper, medium-and long-term debt, capital securities and stockholders’ equity. The diversity of the Holding Company’s funding sourcesenhances funding flexibility and limits dependence on any one source of funds, and generally lowers the cost of funds.
At December 31, 2002, the Holding Company had $249 million in short-term debt outstanding. At December 31, 2001, the Holding Company hadno short-term debt outstanding. At December 31, 2002 and 2001, the Holding Company had $3.3 billion and $2.3 billion in long-term debt outstanding,respectively.
The Holding Company filed a $4.0 billion shelf registration statement, effective June 1, 2001, with the U.S. Securities and Exchange Commission(‘‘SEC’’) which permits the registration and issuance of debt and equity securities as described more fully therein. The Holding Company has issuedsenior debt in the amount of $2.25 billion under this registration statement. In December 2002, the Holding Company issued $400 million 5.375% seniornotes due 2012 and $600 million 6.50% senior notes due 2032 and in November 2001, the Holding Company issued $500 million 5.25% senior notesdue 2006 and $750 million 6.125% senior notes due 2011. In addition, in February 2003, the Holding Company remarketed under the shelf registrationstatement $1,006 million aggregate principal amount of debentures previously issued in connection with the issuance of equity security units as part ofMetLife, Inc.’s initial public offering in April 2000.
MetLife, Inc. 21
Other sources of the Holding Company’s liquidity include programs for short- and long-term borrowing, as needed, arranged through MetropolitanLife.
Credit Facilities. The Holding Company maintains approximately $1.25 billion in a committed and unsecured credit facility that it shares withMetropolitan Life and MetLife Funding, Inc. (‘‘MetLife Funding’’) expiring in 2005. If these facilities were drawn upon, they would bear interest at varyingrates stated in the agreements. This facility is primarily used as back-up lines of credit for its commercial paper program. At December 31, 2002, theHolding Company, Metropolitan Life or MetLife Funding had not drawn against this credit facility.
Liquidity Uses
The primary uses of liquidity of the Holding Company include cash dividends on common stock, service on debt, contributions to subsidiaries,payment of general operating expenses and the repurchase of the Holding Company’s common stock.
Dividends. In the fourth quarter of 2002, the Holding Company declared an annual dividend for 2002 of $0.21 per share. The 2002 dividendrepresented an increase of $0.01 per share from the 2001 annual dividend of $0.20 per share. Dividends, if any, in any year will be determined by theHolding Company’s Board of Directors after taking into consideration factors such as the Holding Company’s current earnings, expected medium- andlong-term earnings, financial condition, regulatory capital position, and applicable governmental regulations and policies.
Capital Contributions to Subsidiaries. In 2002, the Holding Company contributed $500 million to Metropolitan Life and in 2001, contributed $770million to Metropolitan Insurance and Annuity Company (‘‘MIAC’’).
Share Repurchase. On February 19, 2002, the Holding Company’s Board of Directors authorized a $1 billion common stock repurchase program.This program began after the completion of the March 28, 2001 and June 27, 2000 repurchase programs, each of which authorized the repurchase of$1 billion of common stock. Under these authorizations, the Holding Company may purchase common stock from the MetLife Policyholder Trust, in theopen market and in privately negotiated transactions. The Holding Company acquired 15,244,492 and 45,242,966 shares of common stock for$471 million and $1,322 million during the years ended December 31, 2002 and 2001, respectively. At December 31, 2002 the Holding Company hadapproximately $806 million remaining on its existing share repurchase authorization. The Company does not anticipate any share repurchases in the firstsix months of 2003 and any repurchases in the remainder of 2003 will be dependent upon several factors, including the Company’s capital position, itsfinancial strength and credit ratings, general market conditions and the price of the Company’s stock.
Support Agreements. In 2002, the Holding Company entered into a net worth maintenance agreement with three of its insurance subsidiaries,MetLife Investors Insurance Company, First MetLife Investors Insurance Company and MetLife Investors Insurance Company of California. Under theagreements, the Holding Company agreed, without limitation as to the amount, to cause each of these subsidiaries to have a minimum capital andsurplus of $10 million (or, with respect to MetLife Investors Insurance Company of California, $5 million), total adjusted capital at a level not less than150% of the company action level RBC, as defined by state insurance statutes, and liquidity necessary to enable it to meet its current obligations on atimely basis. The capital and surplus of each of these subsidiaries at December 31, 2002 was in excess of the referenced amounts.
The Holding Company has agreed to make capital contributions, in any event not to exceed $120 million, to MIAC in the aggregate amount of theexcess of (i) the debt service payments required to be made, and the capital expenditure payments required to be made or reserved for, in connectionwith the affiliated borrowings arranged in December 2001 to fund the purchase by MIAC of certain real estate properties from Metropolitan Life during thetwo year period following the date of the borrowings, over (ii) the cash flows generated by these properties.
Based on management’s analysis of its expected cash inflows from the dividends it receives from subsidiaries, including Metropolitan Life, that arepermitted to be paid without prior insurance regulatory approval and its portfolio of liquid assets and other anticipated cash flows, management believesthere will be sufficient liquidity to enable the Holding Company to make payments on debt, make dividend payments on its common stock, pay alloperating expenses and meet other obligations.
The Company
Capital
Risk-Based Capital (‘‘RBC’’). Section 1322 of the New York Insurance Law requires that New York domestic life insurers report their RBC based ona formula calculated by applying factors to various asset, premium and statutory reserve items, and similar rules apply to each of the Company’sdomestic insurance subsidiaries. The formula takes into account the risk characteristics of the insurer, including asset risk, insurance risk, interest rate riskand business risk. Section 1322 gives the Superintendent explicit regulatory authority to require various actions by, or take various actions against,insurers whose total adjusted capital does not exceed certain RBC levels. At December 31, 2002, Metropolitan Life’s and each of the HoldingCompany’s domestic insurance subsidiaries’ total adjusted capital was in excess of each of the RBC levels required by each state of domicile.
The National Association of Insurance Commissioners (‘‘NAIC’’) adopted the Codification of Statutory Accounting Principles (the ‘‘Codification’’),which is intended to standardize regulatory accounting and reporting to state insurance departments and became effective January 1, 2001. However,statutory accounting principles continue to be established by individual state laws and permitted practices. The Department required adoption of theCodification with certain modifications for the preparation of statutory financial statements of insurance companies domiciled in New York effectiveJanuary 1, 2001. Effective December 31, 2002, the Department adopted a modification to its regulations to be consistent with Codification with respectto the admissibility of deferred income taxes by New York insurers, subject to certain limitations. The adoption of the Codification as modified by theDepartment, did not adversely affect Metropolitan Life’s statutory capital and surplus. Further modifications by state insurance departments may impactthe effect of the Codification on the statutory capital and surplus of Metropolitan Life and the Holding Company’s other insurance subsidiaries.
Liquidity Sources
Cash Flow from Operations. The Company’s principal cash inflows from its insurance activities come from insurance premiums, annuity considera-tions and deposit funds. A primary liquidity concern with respect to these cash inflows is the risk of early contractholder and policyholder withdrawal. TheCompany seeks to include provisions limiting withdrawal rights on many of its products, including general account institutional pension products(generally group annuities, including guaranteed interest contracts and certain deposit fund liabilities) sold to employee benefit plan sponsors.
MetLife, Inc.22

The Company’s principal cash inflows from its investment activities result from repayments of principal, proceeds from maturities and sales ofinvested assets and investment income. The primary liquidity concerns with respect to these cash inflows are the risk of default by debtors and marketvolatilities. The Company closely monitors and manages these risks through its credit risk management process.
Liquid Assets. An integral part of the Company’s liquidity management is the amount of liquid assets it holds. Liquid assets include cash, cashequivalents, short-term investments, marketable fixed maturities and equity securities. At December 31, 2002 and 2001, the Company had $127 billionand $108 billion in liquid assets, respectively.
Global Funding Sources. Liquidity is also provided by a variety of both short- and long-term instruments, including repurchase agreements,commercial paper, medium- and long-term debt, capital securities and stockholders’ equity. The diversity of the Company’s funding sources enhancesfunding flexibility and limits dependence on any one source of funds, and generally lowers the cost of funds.
At December 31, 2002 and 2001, the Company had $1,161 million and $355 million in short-term debt outstanding, respectively, and $4,425million and $3,628 million in long-term debt outstanding, respectively. See ‘‘— The Holding Company — Global Funding Sources.’’
MetLife Funding serves as a centralized finance unit for Metropolitan Life. Pursuant to a support agreement, Metropolitan Life has agreed to causeMetLife Funding to have a tangible net worth of at least one dollar. At December 31, 2002 and 2001, MetLife Funding had a tangible net worth of$10.7 million and $10.6 million, respectively. MetLife Funding raises funds from various funding sources and uses the proceeds to extend loans, throughMetLife Credit Corp., a subsidiary of Metropolitan Life, to the Holding Company, Metropolitan Life and other affiliates. MetLife Funding manages itsfunding sources to enhance the financial flexibility and liquidity of Metropolitan Life and other affiliated companies. At December 31, 2002 and 2001,MetLife Funding had total outstanding liabilities, including accrued interest payable, of $400 million and $133 million, respectively, consisting primarily ofcommercial paper.
Credit Facilities. The Company maintains committed and unsecured credit facilities aggregating $2.43 billion ($1.14 billion expiring in 2003 and$1.29 billion expiring in 2005). If these facilities were drawn upon, they would bear interest at varying rates stated in the agreements. The facilities can beused for general corporate purposes and also as back-up lines of credit for the Company’s commercial paper program. At December 31, 2002, theCompany had drawn approximately $28 million under the facilities expiring in 2005 at interest rates ranging from 4.39% to 5.57%.
Liquidity Uses
Insurance Liabilities. The Company’s principal cash outflows primarily relate to the liabilities associated with its various life insurance, property andcasualty, annuity and group pension products, operating expenses and income taxes, as well as principal and interest on its outstanding debtobligations. Liabilities arising from its insurance activities primarily relate to benefit payments under the aforementioned products, as well as payments forpolicy surrenders, withdrawals and loans.
Investment and Other. Additional cash outflows include those related to obligations of securities lending activities, investments in real estate, limitedpartnership and joint ventures, as well as legal liabilities.
The following table summarizes the Company’s major contractual obligations (other than those arising from its ordinary product and investmentpurchase activities):
Contractual Obligations Total 2003 2004 2005 2006 2007 Thereafter
(Dollars in millions)
Long-term debt(1) *************************************** $4,460 $ 452 $ 12 $ 397 $ 604 $ 4 $2,991Partnership investments ********************************** 1,667 1,667 — — — — —Company-obligated securities(1) *************************** 1,356 — — 1,006 — — 350Operating leases **************************************** 1,399 192 166 149 133 116 643Mortgage commitments ********************************** 859 859 — — — — —
Total*************************************************** $9,741 $3,170 $178 $1,552 $ 737 $120 $3,984
(1) Amounts differ from the balances presented on the Consolidated Balance Sheets, which are shown net of related discounts.On July 11, 2002, an affiliate of the Company elected not to make future payments required by the terms of a non-recourse loan obligation. The
book value of this loan was $16 million at December 31, 2002. The Company’s exposure under the terms of the applicable loan agreement is limitedsolely to its investment in certain securities held by an affiliate. During the first quarter of 2003 the Company made all previously required and currentpayments under the terms of the loan.
Letters of Credit. At December 31, 2002 and December 31, 2001, the Company had outstanding approximately $625 million and $473 million inletters of credit from various banks, all of which expire within one year. Since commitments associated with letters of credit and financing arrangementsmay expire unused, these amounts do not necessarily reflect the actual future cash funding requirements.
Support Agreements. In addition to its support agreement with MetLife Funding described above, Metropolitan Life entered into a net worthmaintenance agreement with New England Life Insurance Company (‘‘New England Life’’) at the time Metropolitan Life acquired New England Life. Underthe agreement, Metropolitan Life agreed, without limitation as to the amount, to cause New England Life to have a minimum capital and surplus of$10 million, total adjusted capital at a level not less than the company action level RBC, as defined by state insurance statutes, and liquidity necessary toenable it to meet its current obligations on a timely basis. The agreement may be terminated under certain circumstances. The capital and surplus of NewEngland Life at December 31, 2002 and 2001 was in excess of the referenced amounts. See ‘‘— Liquidity Sources — Global Funding Sources.’’
In connection with the Company’s acquisition of GenAmerica, Metropolitan Life entered into a net worth maintenance agreement with GeneralAmerican Life Insurance Company (‘‘General American’’). Under the agreement, Metropolitan Life agreed without limitation as to amount to cause GeneralAmerican to have a minimum capital and surplus of $10 million, total adjusted capital at a level not less than 180% of the company action level RBC, asdefined by state insurance statutes, and liquidity necessary to enable it to meet its current obligations on a timely basis. The agreement was subsequentlyamended to provide that, for the five year period from 2003 through 2007, total adjusted capital must be maintained at a level not less than 200% of the
MetLife, Inc. 23

company action level RBC, as defined by state insurance statutes. The capital and surplus of General American at December 31, 2002 and 2001 was inexcess of the referenced amounts.
Metropolitan Life has entered into a net worth maintenance agreement with Security Equity Life Insurance Company (‘‘Security Equity’’), an insurancesubsidiary acquired in the GenAmerica transaction. Under the agreement, Metropolitan Life agreed without limitation as to amount to cause SecurityEquity to have a minimum capital and surplus of $10 million, total adjusted capital at a level not less than 150% of the company action level RBC, asdefined by state insurance statutes, and sufficient liquidity to meet its current obligations. The agreement may be terminated under certain circumstances.The capital and surplus of Security Equity at December 31, 2002 and 2001 was in excess of the referenced amounts.
Metropolitan Life has also entered into arrangements for the benefit of some of its other subsidiaries and affiliates to assist such subsidiaries andaffiliates in meeting various jurisdictions’ regulatory requirements regarding capital and surplus and security deposits. In addition, Metropolitan Life hasentered into a support arrangement with respect to a subsidiary under which Metropolitan Life may become responsible, in the event that the subsidiarybecomes the subject of insolvency proceedings, for the payment of certain reinsurance recoverables due from the subsidiary to one or more of itscedents in accordance with the terms and conditions of the applicable reinsurance agreements.
General American has agreed to guarantee the obligations of its subsidiary, Paragon Life Insurance Company, and certain obligations of its formersubsidiaries, Security Equity, MetLife Investors Insurance Company (‘‘MetLife Investors’’), First MetLife Investors Insurance Company and MetLifeInvestors Insurance Company of California. In addition, General American has entered into a contingent reinsurance agreement with MetLife Investors.Under this agreement, in the event that MetLife Investors’ statutory capital and surplus is less than $10 million or total adjusted capital falls below 150% ofthe company action level RBC, as defined by state insurance statutes, General American would assume as assumption reinsurance, subject toregulatory approvals and required consents, all of MetLife Investors’ life insurance policies and annuity contract liabilities. The capital and surplus ofMetLife Investors’ at December 31, 2002 and 2001 was in excess of the referenced amounts.
Management does not anticipate that these arrangements will place any significant demands upon the Company’s liquidity resources.
Litigation. Various litigation claims and assessments against the Company have arisen in the course of the Company’s business, including, but notlimited to, in connection with its activities as an insurer, employer, investor, investment advisor and taxpayer. Further, state insurance regulatory authoritiesand other federal and state authorities regularly make inquiries and conduct investigations concerning the Company’s compliance with applicableinsurance and other laws and regulations.
It is not feasible to predict or determine the ultimate outcome of all pending investigations and legal proceedings or provide reasonable ranges ofpotential losses except with respect to certain matters. In some of the matters, very large and/or indeterminate amounts, including punitive and trebledamages, are sought. Although in light of these considerations, it is possible that an adverse outcome in certain cases could have a material adverseeffect upon the Company’s consolidated financial position, based on information currently known by the Company’s management, in its opinion, theoutcomes of such pending investigations and legal proceedings are not likely to have such an effect. However, given the large and/or indeterminateamounts sought in certain of these matters and the inherent unpredictability of litigation, it is possible that an adverse outcome in certain matters could,from time to time, have a material adverse effect on the Company’s operating results or cash flows in particular quarterly or annual periods.
Based on management’s analysis of its expected cash inflows from operating activities, the dividends it receives from subsidiaries, includingMetropolitan Life, that are permitted to be paid without prior insurance regulatory approval and its portfolio of liquid assets and other anticipated cashflows, management believes there will be sufficient liquidity to enable the Company to make payments on debt, make dividend payments on its commonstock, pay all operating expenses and meet other obligations. The nature of the Company’s diverse product portfolio and customer base lessen thelikelihood that normal operations will result in any significant strain on liquidity in 2003.
Consolidated cash flows. Net cash provided by operating activities was $4,997 million and $4,512 million for the years ended December 31, 2002and 2001, respectively. The $485 million increase in operating cash flow in 2002 over the comparable 2001 period is primarily attributable to salesgrowth in the group life, dental, disability and long-term care businesses, the sale of a significant retirement and savings contract in the second quarter of2002, as well as additional sales of structured settlements and traditional annuity products. In addition, a large annuity contract sold in the first quarter of2002 to a Canadian trust company and increased sales in South Korea due to larger professional sales force and improved agent productivity. Theseincreases were partially offset by a contribution by the Company to its defined benefit pension plans in December 2002.
Net cash provided by operating activities was $4,512 million and $3,277 million for the years ended December 31, 2001 and 2000, respectively.The $1,235 million increase in operating cash flow in 2001 over the 2000 comparable period is primarily attributable to sales growth in the dental,disability, long-term care and group life products, partially offset by decreases in the sales of retirement and savings products. An increase in operatingcash flows resulted from additional sales of group life, major medical and individual life products in Mexico. Protection-type product sales fostered by thecontinued expansion of the professional sales force accounted for additional premiums from South Korea.
Net cash used in investing activities was $16,996 million and $3,165 million for the years ended December 31, 2002 and 2001, respectively. The$13,831 million increase in net cash used in investing activities in 2002 over the 2001 comparable period is partly attributable to an increase ininvestments held as cash collateral received in connection with the securities lending program. In addition, the Company invested income generated fromoperations, cash raised through the issuance of a guaranteed investment contract and cash generated by a company-sponsored real estate salesprogram in various financial instruments, including fixed maturities and mortgage loans on real estate. At December 31, 2001, the Company held cashequivalents that were subsequently invested in bonds and U.S. treasury notes in the first quarter of 2002. Additionally, certain contractholders transferredinvestments from the separate account to the general account. Net cash used in investing activities also increased due to the acquisition of Hidalgo.
Net cash used in investing activities was $3,165 million and $1,232 million for the years ended December 31, 2001 and 2000, respectively. Netcash used in investing activities increased $1,933 million in 2001, over the comparable period in 2000, due in large part to the purchase of equitysecurities as part of the Company’s investment in the equity markets following the September 11, 2001 tragedies. The remaining change in investingactivities was due to the investment of income generated from the operations of the Company in various financial instruments.
Net cash provided by financing activities was $6,849 million and $2,692 million for the years ended December 31, 2002 and 2001, respectively.The $4,157 million increase in financing activities in 2002 from 2001 was due to a $2,401 million increase in policyholder account balances primarily fromsales of annuity products, the issuance of $1,536 million in short-term debt. In addition, the Company spent $850 million less in the stock repurchaseprogram in 2002 as compared to 2001. These cash flows are partially offset by a $592 million decrease in long-term debt issued.
Net cash provided by financing was $2,692 million for the year ended December 31, 2001. Net cash used in financing was $1,400 million for theyear ended December 31, 2000. Net cash provided by financing activities increased $4,092 million in 2001 from 2000, partially attributable to a
MetLife, Inc.24

$3,514 million increase in policyholder account balances primarily from sales of annuity products, $2,550 million of cash payments to policyholders in2000 related to the Company’s demutualization, the paydown of $2,365 million of short-term debt in 2000 and the issuance of $1,393 million in long-term debt in 2001. Partially offsetting these activities were the issuance of $4,009 million in common stock in connection with the Company’s initial publicoffering in 2000, $708 million in higher costs associated with the stock repurchase program in 2001 and $772 million in lower proceeds from theissuance of company-obligated mandatorily redeemable securities in 2001.
Insolvency AssessmentsMost of the jurisdictions in which the Company is admitted to transact business require life insurers doing business within the jurisdiction to
participate in guaranty associations, which are organized to pay contractual benefits owed pursuant to insurance policies issued by impaired, insolvent orfailed life insurers. These associations levy assessments, up to prescribed limits, on all member insurers in a particular state on the basis of theproportionate share of the premiums written by member insurers in the lines of business in which the impaired, insolvent or failed insurer engaged. Somestates permit member insurers to recover assessments paid through full or partial premium tax offsets. Assessments levied against the Company fromJanuary 1, 2000 through December 31, 2002 aggregated $2 million. The Company maintained a liability of $62 million at December 31, 2002 for futureassessments in respect of currently impaired, insolvent or failed insurers.
In the past five years, none of the aggregate assessments levied against MetLife’s insurance subsidiaries has been material. The Company hasestablished liabilities for guaranty fund assessments that it considers adequate for assessments with respect to insurers that are currently subject toinsolvency proceedings.
Effects of InflationThe Company does not believe that inflation has had a material effect on its consolidated results of operations, except insofar as inflation may affect
interest rates.
Accounting StandardsDuring 2002, the Company adopted or applied the following accounting standards: (i) SFAS No. 141, Business Combinations (‘‘SFAS 141’’),
(ii) SFAS No. 142 and (iii) SFAS No. 144. In accordance with SFAS 141, the elimination of $5 million of negative goodwill was reported in net income inthe first quarter of 2002 as a cumulative effect of a change in accounting. On January 1, 2002, the Company adopted SFAS 142. The Company did notamortize goodwill during 2002. Amortization of goodwill was $47 million and $50 million for the years ended December 31, 2001 and 2000, respectively.Amortization of other intangible assets was not material for the years December 31, 2002, 2001 and 2000. The Company has completed the requiredimpairment tests of goodwill and indefinite-lived intangible assets. As a result of these tests, the Company recorded a $5 million charge to earningsrelating to the impairment of certain goodwill assets in the third quarter of 2002 as a cumulative effect of a change in accounting. There was noimpairment of identified intangible assets or significant reclassifications between goodwill and other intangible assets at January 1, 2002. Adoption ofSFAS 144 did not have a material impact on the Company’s consolidated financial statements other than the presentation as discontinued operations ofnet investment income and net investment gains related to operations of real estate on which the Company initiated disposition activities subsequent toJanuary 1, 2002 and the classification of such real estate as held-for-sale on the consolidated balance sheets.
The Financial Accounting Standards Board (‘‘FASB’’) is deliberating on a proposed statement that would further amend SFAS No. 133, Accountingfor Derivative Instruments and Hedging Activities (‘‘SFAS 133’’). The proposed statement will address certain SFAS 133 Implementation Issues. Theproposed statement is not expected to have a significant impact on the Company’s consolidated financial statements.
In January 2003, the FASB issued FASB Interpretation No. 46, Consolidation of Variable Interest Entities, an Interpretation of APB No. 51 (‘‘FIN 46’’).FIN 46 requires certain variable interest entities to be consolidated by the primary beneficiary of the entity if the equity investors in the entity do not havethe characteristics of a controlling financial interest or do not have sufficient equity at risk for the entity to finance its activities without additionalsubordinated financial support from other parties. FIN 46 is effective for all new variable interest entities created or acquired after January 31, 2003. Forvariable interest entities created or acquired prior to February 1, 2003, the provisions of FIN 46 must be applied for the first interim or annual periodbeginning after June 15, 2003. The Company is in the process of assessing the impact of FIN 46 on its consolidated financial statements. Certaindisclosure provisions of FIN 46 were required for December 31, 2002 financial statements. Such provisions, which were adopted by the Company,required the disclosure of the total assets and the maximum exposure to loss relating to the Company’s interests in variable interest entities.
In 2003, the FASB staff is expected to provide transition guidance with respect to the issue of whether embedded derivatives within modifiedcoinsurance agreements need to be accounted for separately. The Company enters into modified coinsurance and certain coinsurance agreementsunder which assets equal to the net statutory reserves are withheld from the Company and legally owned by the ceding company. The withheld funds arereflected on the Company’s balance sheet as funds withheld at interest and totaled $2.1 billion as of December 31, 2002. The Company also cedesbusiness under certain modified coinsurance agreements. As of December 31, 2002, the Company has not separately accounted for any potentialembedded derivatives associated with these contracts, which it believes is consistent with GAAP, as well as industry practice. The Company cannotestimate the impact, if any, associated with the adoption of any new FASB guidance expected to be issued in 2003.
In December 2002, the FASB issued SFAS No. 148, Accounting for Stock-Based Compensation — Transition and Disclosure (‘‘SFAS 148’’), whichprovides guidance on how to transition from the intrinsic value method of accounting for stock-based employee compensation under AccountingPrinciples Board (‘‘APB’’) Opinion No. 25 Accounting for Stock-Issued to Employees (‘‘APB 25’’) to the fair value method of accounting from SFASNo. 123 Accounting for Stock-Based Compensation (‘‘SFAS 123’’), if a company so elects. Effective January 1, 2003, the Company adopted the fairvalue method of recording stock options under SFAS 123. In accordance with alternatives available under the transitional guidance of SFAS 148, theCompany has elected to apply the fair value method of accounting for stock options prospectively to awards granted subsequent to January 1, 2003. Aspermitted, options granted prior to January 1, 2003, will continue to be accounted for under APB 25, and the pro forma impact of accounting for theseoptions at fair value will continue to be disclosed in the consolidated financial statements until the last of those options vest in 2005. Had the Companyexpensed stock options beginning January 1, 2002, the income statement impact would have been approximately $23 million pretax, and $15 million, or$0.02 per diluted share, after tax, in 2002. As the cost of anticipated future option awards is phased in over a three-year period, the annual impact in thethird year (2005) will rise to approximately $0.07 per diluted share, assuming options are granted in future years at a similar level and under similar marketconditions to 2002. The actual impact per diluted share may vary in the event the fair value or the number of options granted increases or decreases fromthe current estimate, or if the current accounting guidance changes.
In November 2002, the FASB issued Interpretation No. 45, Guarantor’s Accounting and Disclosure Requirements for Guarantees Including IndirectGuarantees of Indebtedness of Others (‘‘FIN 45’’). FIN 45 requires entities to establish liabilities for certain types of guarantees, and expands financialstatement disclosures for others. Disclosure requirements under FIN 45 are effective for financial statements of annual periods ending after December 15,
MetLife, Inc. 25
2002 and are applicable to all guarantees issued by the guarantor subject to the provisions of FIN 45. The initial recognition and initial measurementprovisions of FIN 45 are applicable on a prospective basis to guarantees issued or modified after December 31, 2002. The Company does not expectthe initial adoption of FIN 45 to have a significant impact on the Company’s consolidated financial statements. The adoption of FIN 45 requires theCompany to include disclosures in its consolidated financial statements related to guarantees.
In June 2002, the FASB issued SFAS No. 146, Accounting for Costs Associated with Exit or Disposal Activities (‘‘SFAS 146’’), which must beadopted for exit and disposal activities initiated after December 31, 2002. SFAS 146 will require that a liability for a cost associated with an exit or disposalactivity be recognized and measured initially at fair value only when the liability is incurred rather than at the date of an entity’s commitment to an exit planas required by Emerging Issues Task Force (‘‘EITF’’) 94-3, Liability Recognition for Certain Employee Termination Benefits and Other Costs to Exit anActivity (including Certain Costs Incurred in a Restructuring). In the fourth quarter of 2001, the Company recorded a charge of $330 million, net of incometaxes of $169 million, associated with business realignment initiatives using the EITF 94-3 accounting guidance.
In April 2002, the FASB issued SFAS No. 145, Rescission of FASB Statements No. 4, 44, and 64, Amendment of FASB Statement No. 13, andTechnical Corrections (‘‘SFAS 145’’). In addition to amending or rescinding other existing authoritative pronouncements to make various technicalcorrections, clarify meanings, or describe their applicability under changed conditions, SFAS 145 generally precludes companies from recording gainsand losses from the extinguishment of debt as an extraordinary item. SFAS 145 also requires sale-leaseback treatment for certain modifications of acapital lease that result in the lease being classified as an operating lease. SFAS 145 is effective for fiscal years beginning after May 15, 2002, and theinitial application of this standard did not have a significant impact on the Company’s consolidated financial statements.
InvestmentsThe Company had total cash and invested assets at December 31, 2002 of $190.7 billion. In addition, the Company had $59.7 billion held in its
separate accounts, for which the Company generally does not bear investment risk.The Company’s primary investment objective is to maximize net investment income consistent with acceptable risk parameters. The Company is
exposed to three primary sources of investment risk:) credit risk, relating to the uncertainty associated with the continued ability of a given obligor to make timely payments of principal and interest;) interest rate risk, relating to the market price and cash flow variability associated with changes in market interest rates; and) market valuation risk.The Company manages risk through in-house fundamental analysis of the underlying obligors, issuers, transaction structures and real estate
properties. The Company also manages credit risk and market valuation risk through industry and issuer diversification and asset allocation. For realestate and agricultural assets, the Company manages credit risk and valuation risk through geographic, property type, and product type diversificationand asset allocation. The Company manages interest rate risk as part of its asset and liability management strategies, product design, such as the use ofmarket value adjustment features and surrender charges, and proactive monitoring and management of certain non-guaranteed elements of its products,such as the resetting of credited interest and dividend rates for policies that permit such adjustments.
The following table summarizes the Company’s cash and invested assets at:December 31,
2002 2001
Carrying % of Carrying % ofValue Total Value Total
Fixed maturities available-for-sale, at fair value ***************************************** $140,553 73.7% $115,398 68.0%Mortgage loans on real estate******************************************************* 25,086 13.2 23,621 13.9Policy loans ********************************************************************** 8,580 4.5 8,272 4.9Real estate and real estate joint ventures held-for-investment***************************** 4,496 2.4 4,054 2.4Equity securities and other limited partnership interests ********************************** 3,743 2.0 4,700 2.8Other invested assets ************************************************************* 3,727 1.9 3,298 1.9Cash and cash equivalents ********************************************************* 2,323 1.2 7,473 4.4Short-term investments ************************************************************ 1,921 1.0 1,203 0.7Real estate held-for-sale *********************************************************** 229 0.1 1,676 1.0
Total cash and invested assets**************************************************** $190,658 100.0% $169,695 100.0%
MetLife, Inc.26

Investment ResultsThe annualized yields on general account cash and invested assets, excluding net investment gains and losses, were 7.20%, 7.56% and 7.54% for
the years ended December 31, 2002, 2001 and 2000, respectively.The following table illustrates the annualized yields on average assets for each of the components of the Company’s investment portfolio for the
years ended December 31, 2002, 2001 and 2000:2002 2001 2000
Yield(1) Amount Yield(1) Amount Yield(1) Amount
(Dollars in millions)
Fixed Maturities:(2)Investment income ********************************************* 7.46% $ 8,092 7.89% $ 8,031 7.81% $ 7,915Net investment losses******************************************* (917) (645) (1,437)
Total ******************************************************* $ 7,175 $ 7,386 $ 6,478
Ending assets ************************************************* $140,533 $115,398 $112,979
Mortgage Loans:(3)Investment income ********************************************* 7.84% $ 1,883 8.17% $ 1,848 7.87% $ 1,693Net investment gains (losses)************************************* (22) (91) (18)
Total ******************************************************* $ 1,861 $ 1,757 $ 1,675
Ending assets ************************************************* $ 25,086 $ 23,621 $ 21,951
Policy Loans:Investment income ********************************************* 6.49% $ 543 6.56% $ 536 6.45% $ 515
Ending assets ************************************************* $ 8,580 $ 8,272 $ 8,158
Cash, Cash Equivalents and Short-term Investments:Investment income ********************************************* 4.17% $ 232 5.54% $ 279 5.72% $ 288Net investment losses******************************************* — (5) —
Total ******************************************************* $ 232 $ 274 $ 288
Ending assets ************************************************* $ 4,244 $ 8,676 $ 4,703
Real Estate and Real Estate Joint Ventures:(4)Investment income, net of expenses******************************* 11.41% $ 637 10.58% $ 584 11.09% $ 629Net investment gains (losses)************************************* 576 (4) 101
Total ******************************************************* $ 1,213 $ 580 $ 730
Ending assets ************************************************* $ 4,725 $ 5,730 $ 5,504
Equity Securities and Other Limited Partnership Interests:Investment income ********************************************* 2.21% $ 83 2.37% $ 97 4.98% $ 183Net investment gains (losses)************************************* 222 (96) 185
Total ******************************************************* $ 305 $ 1 $ 368
Ending assets ************************************************* $ 3,743 $ 4,700 $ 3,845
Other Invested Assets:Investment income ********************************************* 6.42% $ 218 7.60% $ 249 6.30% $ 162Net investment gains (losses)************************************* (206) 79 65
Total ******************************************************* $ 12 $ 328 $ 227
Ending assets ************************************************* $ 3,727 $ 3,298 $ 2,821
Total Investments:Investment income before expenses and fees*********************** 7.35% $ 11,688 7.72% $ 11,624 7.70% $ 11,385Investment expenses and fees *********************************** (0.15%) (235) (0.16%) (244) (0.16%) (240)
Net investment income ****************************************** 7.20% $ 11,453 7.56% $ 11,380 7.54% $ 11,145Net investment losses******************************************* (347) (762) (1,104)Adjustments to investment losses(5) ******************************* 145 134 54Gains from sales of subsidiaries ********************************** — 25 660
Total ******************************************************* $ 11,251 $ 10,777 $ 10,755
(1) Yields are based on quarterly average asset carrying values, excluding recognized and unrealized gains and losses, and for yield calculationpurposes, average assets exclude collateral associated with the Company’s securities lending program.
(2) Included in fixed maturities are equity-linked notes of $834 million, $1,004 million and $1,232 million at December 31, 2002, 2001 and 2000,respectively, which include an equity-like component as part of the notes’ return. Investment income for fixed maturities includes prepayment fees andincome from the securities lending program. Fixed maturity investment income has been reduced by rebates paid under the securities lending program.
(3) Investment income from mortgage loans on real estate includes prepayment fees.(4) Real estate and real estate joint venture income is shown net of depreciation of $227 million, $220 million and $224 million for the years ended
December 31, 2002, 2001 and 2000, respectively. Real estate and real estate joint venture income includes amounts classified as discontinuedoperations of $124 million, $125 million and $121 million for the years ended December 31, 2002, 2001 and 2000, respectively. These amounts arenet of depreciation of $48 million, $79 million and $80 million for the years ended December 31, 2002, 2001 and 2000, respectively. Net investmentgains include $582 million of gains classified as discontinued operations for the year ended December 31, 2002.
(5) Adjustments to investment gains and losses include amortization of deferred policy acquisition costs, charges and credits to participating contracts,and adjustments to the policyholder dividend obligation resulting from investment gains and losses.
MetLife, Inc. 27

Fixed MaturitiesFixed maturities consist principally of publicly traded and privately placed debt securities, and represented 73.7% and 68.0% of total cash and
invested assets at December 31, 2002 and 2001, respectively. Based on estimated fair value, public fixed maturities represented $121,191 million, or86.2%, and $96,579 million, or 83.7%, of total fixed maturities at December 31, 2002 and 2001, respectively. Based on estimated fair value, private fixedmaturities represented $19,362 million, or 13.8%, and $18,819 million, or 16.3%, of total fixed maturities at December 31, 2002 and 2001, respectively.The Company invests in privately placed fixed maturities to (i) obtain higher yields than can ordinarily be obtained with comparable public marketsecurities, (ii) provide the Company with protective covenants, call protection features and, where applicable, a higher level of collateral, and (iii) increasediversification. However, the Company may not freely trade its privately placed fixed maturities because of restrictions imposed by federal and statesecurities laws and illiquid markets.
In cases where quoted market prices are not available, fair values are estimated using present value or valuation techniques. The fair value estimatesare made at a specific point in time, based on available market information and judgments about the financial instruments, including estimates of thetiming and amounts of expected future cash flows and the credit standing of the issuer or counter-party. Factors considered in estimating fair valueinclude: coupon rate, maturity, estimated duration, call provisions, sinking fund requirements, credit rating, industry sector of the issuer and quotedmarket prices of comparable securities.
The Securities Valuation Office of the NAIC evaluates the fixed maturity investments of insurers for regulatory reporting purposes and assignssecurities to one of six investment categories called ‘‘NAIC designations.’’ The NAIC ratings are similar to the rating agency designations of the NationallyRecognized Statistical Rating Organizations for marketable bonds. NAIC ratings 1 and 2 include bonds generally considered investment grade (rated‘‘Baa3’’ or higher by Moody’s Investors Services (‘‘Moody’s’’), or rated ‘‘BBB–’’ or higher by Standard & Poor’s (‘‘S&P’’)) by such rating organizations. NAICratings 3 through 6 include bonds generally considered below investment grade (rated ‘‘Ba1’’ or lower by Moody’s, or rated ‘‘BB+’’ or lower by S&P).
The following table presents the Company’s total fixed maturities by Nationally Recognized Statistical Rating Organizations designation and theequivalent ratings of the NAIC, as well as the percentage, based on estimated fair value, that each designation comprises at:
December 31, 2002 December 31, 2001
Rating Agency Amortized Estimated % of Amortized Estimated % ofDesignation(1) Cost Fair Value Total Cost Fair Value Total
(Dollars in millions)
Aaa/Aa/A ********************************************** $ 91,250 $ 97,495 69.4% $ 72,098 $ 75,265 65.2%Baa *************************************************** 29,345 31,060 22.1 29,128 29,581 25.6Ba **************************************************** 7,413 7,304 5.2 6,021 5,856 5.1B ***************************************************** 3,463 3,227 2.3 3,205 3,100 2.7Caa and lower****************************************** 434 339 0.2 726 597 0.5In or near default **************************************** 430 416 0.3 327 237 0.2
Subtotal *********************************************** 132,335 139,841 99.5 111,505 114,636 99.3Redeemable preferred stock ****************************** 817 712 0.5 783 762 0.7
Total fixed maturities ************************************* $133,152 $140,553 100.0% $112,288 $115,398 100.0%
(1) Amounts presented are based on rating agency designations. Comparisons between NAIC ratings and rating agency designations are published bythe NAIC.Based on estimated fair values, investment grade fixed maturities comprised 91.5% and 90.8% of total fixed maturities in the general account at
December 31, 2002 and 2001, respectively.The following table shows the amortized cost and estimated fair value of fixed maturities, by contractual maturity dates (excluding scheduled sinking
funds) at:
December 31,
2002 2001
Amortized Estimated Amortized EstimatedCost Fair Value Cost Fair Value
(Dollars in millions)
Due in one year or less ************************************************** $ 4,592 $ 4,662 $ 4,001 $ 4,049Due after one year through five years *************************************** 26,200 27,354 20,168 20,841Due after five years through ten years ************************************** 23,297 24,987 22,937 23,255Due after ten years ****************************************************** 35,507 38,452 30,778 32,248
Subtotal *********************************************************** 89,596 95,455 77,884 80,393Mortgage-backed and asset-backed securities******************************* 42,739 44,386 33,621 34,243
Subtotal *********************************************************** 132,335 139,841 111,505 114,636Redeemable preferred stock ********************************************** 817 712 783 762
Total fixed maturities ************************************************* $133,152 $140,553 $112,288 $115,398
Actual maturities may differ as a result of prepayments by the issuer.
MetLife, Inc.28

The Company diversifies its fixed maturities by security sector. The following tables set forth the amortized cost, gross unrealized gain or loss andestimated fair value of the Company’s fixed maturities by sector, as well as the percentage of the total fixed maturities holdings that each security sector iscomprised at:
December 31, 2002
Gross UnrealizedAmortized Estimated % ofCost Gain Loss Fair Value Total
(Dollars in millions)
U.S. corporate securities************************************************* $ 47,021 $3,193 $ 957 $ 49,257 35.0%Mortgage-backed securities ********************************************** 33,256 1,649 22 34,883 24.8Foreign corporate securities ********************************************** 18,001 1,435 207 19,229 13.7U.S. treasuries/agencies ************************************************* 14,373 1,565 4 15,934 11.3Asset-backed securities ************************************************* 9,483 228 208 9,503 6.8Foreign government securities ******************************************** 7,012 636 52 7,596 5.4State and political subdivisions******************************************** 2,580 182 20 2,742 2.0Other fixed income assets *********************************************** 609 191 103 697 0.5
Total bonds ******************************************************** 132,335 9,079 1,573 139,841 99.5Redeemable preferred stocks********************************************* 817 12 117 712 0.5
Total fixed maturities************************************************* $133,152 $9,091 $1,690 $140,553 100.0%
December 31, 2001
Gross UnrealizedAmortized Estimated % ofCost Gain Loss Fair Value Total
(Dollars in millions)
U.S. corporate securities************************************************* $ 43,141 $1,470 $ 748 $ 43,863 38.0%Mortgage-backed securities ********************************************** 25,506 866 192 26,180 22.7Foreign corporate securities ********************************************** 16,836 688 539 16,985 14.7U.S. treasuries/agencies ************************************************* 8,297 1,031 43 9,285 8.0Asset-backed securities ************************************************* 8,115 154 206 8,063 7.0Foreign government securities ******************************************** 5,488 544 37 5,995 5.2State and political subdivisions******************************************** 2,248 68 21 2,295 2.0Other fixed income assets *********************************************** 1,874 238 142 1,970 1.7
Total bonds ******************************************************** 111,505 5,059 1,928 114,636 99.3Redeemable preferred stocks********************************************* 783 12 33 762 0.7
Total fixed maturities************************************************* $112,288 $5,071 $1,961 $115,398 100.0%
Problem, Potential Problem and Restructured Fixed Maturities. The Company monitors fixed maturities to identify investments that managementconsiders to be problems or potential problems. The Company also monitors investments that have been restructured.
The Company defines problem securities in the fixed maturities category as securities with principal or interest payments in default, securities to berestructured pursuant to commenced negotiations, or securities issued by a debtor that has entered into bankruptcy.
The Company defines potential problem securities in the fixed maturity category as securities of an issuer deemed to be experiencing significantoperating problems or difficult industry conditions. The Company uses various criteria, including the following, to identify potential problem securities:
) debt service coverage or cash flow falling below certain thresholds which vary according to the issuer’s industry and other relevant factors;) significant declines in revenues or margins;) violation of financial covenants;) public securities trading at a substantial discount as a result of specific credit concerns; and) other subjective factors.The Company defines restructured securities in the fixed maturities category as securities to which the Company has granted a concession that it
would not have otherwise considered but for the financial difficulties of the obligor. The Company enters into a restructuring when it believes it will realize agreater economic value under the new terms rather than through liquidation or disposition. The terms of the restructuring may involve some or all of thefollowing characteristics: a reduction in the interest rate, an extension of the maturity date, an exchange of debt for equity or a partial forgiveness ofprincipal or interest.
The following table presents the estimated fair value of the Company’s total fixed maturities classified as performing, potential problem, problem andrestructured at:
December 31,
2002 2001
Estimated % of Estimated % ofFair Value Total Fair Value Total
(Dollars in millions)
Performing *********************************************************************** $139,717 99.4% $114,879 99.6%Potential problem ***************************************************************** 450 0.3 386 0.3Problem ************************************************************************* 358 0.3 111 0.1Restructured ********************************************************************* 28 0.0 22 0.0
Total ******************************************************************** $140,553 100.0% $115,398 100.0%
Fixed Maturity Impairment. The Company classifies all of its fixed maturities as available-for-sale and marks them to market through othercomprehensive income. All securities with gross unrealized losses at the consolidated balance sheet date are subjected to the Company’s process for
MetLife, Inc. 29

identifying other-than-temporary impairments. The Company writes down to fair value securities that it deems to be other-than-temporarily impaired in theperiod the securities are deemed to be so impaired. The assessment of whether such impairment has occurred is based on management’s case-by-case evaluation of the underlying reasons for the decline in fair value. Management considers a wide range of factors, as described below, about thesecurity issuer and uses its best judgment in evaluating the cause of the decline in the estimated fair value of the security and in assessing the prospectsfor near-term recovery. Inherent in management’s evaluation of the security are assumptions and estimates about the operations of the issuer and itsfuture earnings potential.
Considerations used by the Company in the impairment evaluation process include, but are not limited to, the following:) The length of time and the extent to which the market value has been below amortized cost;) The potential for impairments of securities when the issuer is experiencing significant financial difficulties, including a review of all securities of the
issuer, including its known subsidiaries and affiliates, regardless of the form of the Company’s ownership;) The potential for impairments in an entire industry sector or sub-sector;) The potential for impairments in certain economically depressed geographic locations;) The potential for impairments of securities where the issuer, series of issuers or industry has suffered a catastrophic type of loss or has exhausted
natural resources; and) Other subjective factors, including concentrations and information obtained from regulators and rating agencies.The Company records writedowns as investment losses and adjusts the cost basis of the fixed maturities accordingly. The Company does not
change the revised cost basis for subsequent recoveries in value. Writedowns of fixed maturities were $1,264 million and $273 million for the yearsended December 31, 2002 and 2001, respectively. The Company’s three largest writedowns totaled $352 million for the year ended December 31,2002. The circumstances that gave rise to these impairments were financial restructurings or bankruptcy filings. During the year ended December 31,2002, the Company sold fixed maturity securities with a fair value of $14,597 million at a loss of $894 million.
The gross unrealized loss related to the Company’s fixed maturities at December 31, 2002 was $1,690 million. These fixed maturities mature asfollows: 17% due in one year or less; 19% due in greater than one year to five years; 18% due in greater than five years to ten years; and 46% due ingreater than ten years (calculated as a percentage of amortized cost). Additionally, such securities are concentrated by security type in U.S. corporates(57%), asset-backed (12%) and foreign corporates (12%); and are concentrated by industry in utilities (20%), finance (18%), transportation (12%) andcommunications (10%) (calculated as a percentage of gross unrealized loss). Non-investment grade securities represent 23% of the $23,402 million ofthe fair value and 48% of the $1,690 million gross unrealized loss on fixed maturities.
The following table presents the amortized cost, gross unrealized losses and number of securities for fixed maturities where the estimated fair valuehad declined and remained below amortized cost by less than 20%, or 20% or more for:
December 31, 2002
Gross Unrealized Number ofAmortized Cost Losses Securities
Less than 20% or Less than 20% or Less than 20% or20% More 20% More 20% More
(Dollars in millions)
Less than six months********************************************* $16,733 $1,622 $569 $531 791 160Six months or greater but less than nine months********************** 1,008 433 53 156 91 25Nine months or greater but less than twelve months******************* 3,212 87 175 31 170 11Twelve months or greater ***************************************** 1,885 112 128 47 170 21
Total ******************************************************* $22,838 $2,254 $925 $765 1,222 217
The Company’s review of its fixed maturities for impairments includes an analysis of the total gross unrealized losses by three categories ofsecurities: (i) securities where the estimated fair value had declined and remained below amortized cost by less than 20%; (ii) securities where theestimated fair value had declined and remained below amortized cost by 20% or more for less than six months; and (iii) securities where the estimatedvalue had declined and remained below amortized cost by 20% or more for six months or greater. The first two categories have generally been adverselyimpacted by the downturn in the financial markets, overall economic conditions and continuing effects of the September 11, 2001 tragedies. While all ofthese securities are monitored for potential impairment, the Company’s experience indicates that the first two categories do not present as great a risk ofimpairment, and often, fair values recover over time as the factors that caused the declines improve.
The following table presents the total gross unrealized losses for fixed maturities where the estimated fair value had declined and remained belowamortized cost by:
December 31, 2002
Gross unrealized % oflosses Total
(Dollars in millions)
Less than 20% ********************************************************************************** $ 925 54.7%20% or more for less than six months *************************************************************** 531 31.420% or more for six months or greater*************************************************************** 234 13.9
Total *************************************************************************************** $1,690 100.0%
The category of fixed maturity securities where the estimated fair value has declined and remained below amortized cost by less than 20% iscomprised of 1,222 securities with an amortized cost of $22,838 million and a gross unrealized loss of $925 million. These fixed maturities mature asfollows: 19% due in one year or less; 19% due in greater than one year to five years; 17% due in greater than five years to ten years; and 45% due ingreater than ten years (calculated as a percentage of amortized cost). Additionally, such securities are concentrated by security type in U.S. corporates(51%) and foreign corporates (17%); and are concentrated by industry in finance (28%), utilities (14%) and communications (11%) (calculated as apercentage of gross unrealized loss). Non-investment grade securities represent 21% of the $21,913 million fair value and 33% of the $925 million grossunrealized loss.
The category of fixed maturity securities where the estimated fair value has declined and remained below amortized cost by 20% or more for lessthan six months is comprised of 160 securities with an amortized cost of $1,622 million and a gross unrealized loss of $531 million. These fixed maturities
MetLife, Inc.30
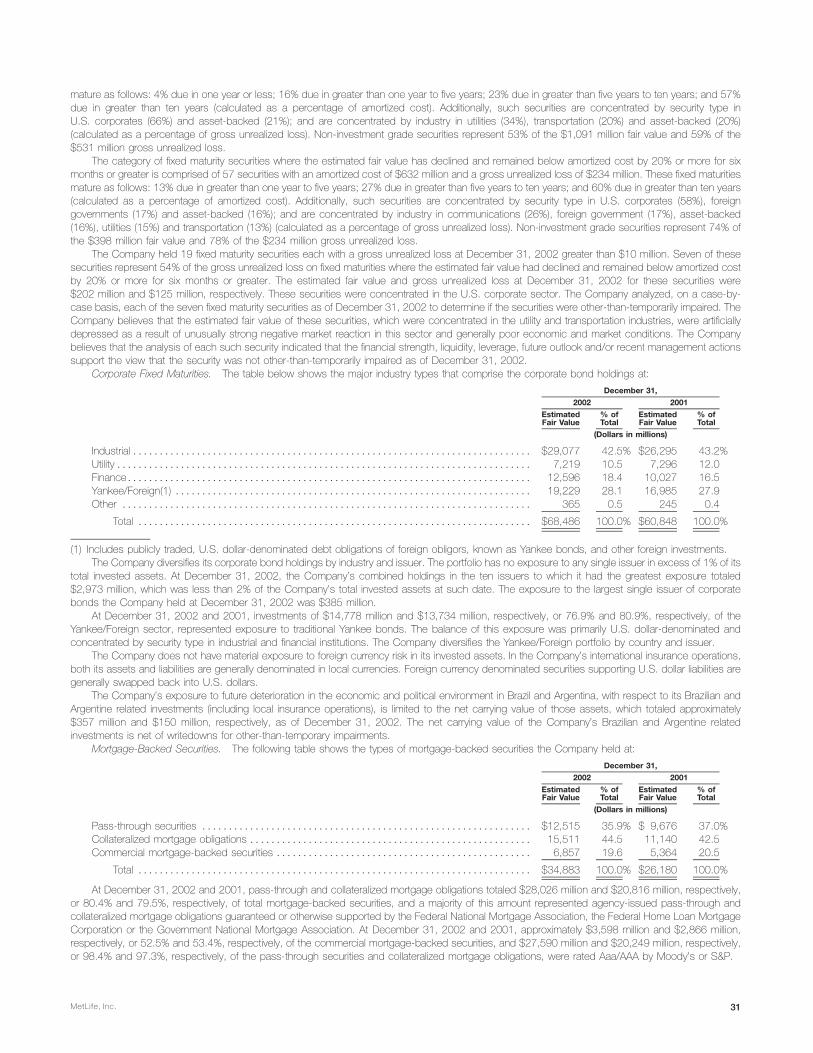
mature as follows: 4% due in one year or less; 16% due in greater than one year to five years; 23% due in greater than five years to ten years; and 57%due in greater than ten years (calculated as a percentage of amortized cost). Additionally, such securities are concentrated by security type inU.S. corporates (66%) and asset-backed (21%); and are concentrated by industry in utilities (34%), transportation (20%) and asset-backed (20%)(calculated as a percentage of gross unrealized loss). Non-investment grade securities represent 53% of the $1,091 million fair value and 59% of the$531 million gross unrealized loss.
The category of fixed maturity securities where the estimated fair value has declined and remained below amortized cost by 20% or more for sixmonths or greater is comprised of 57 securities with an amortized cost of $632 million and a gross unrealized loss of $234 million. These fixed maturitiesmature as follows: 13% due in greater than one year to five years; 27% due in greater than five years to ten years; and 60% due in greater than ten years(calculated as a percentage of amortized cost). Additionally, such securities are concentrated by security type in U.S. corporates (58%), foreigngovernments (17%) and asset-backed (16%); and are concentrated by industry in communications (26%), foreign government (17%), asset-backed(16%), utilities (15%) and transportation (13%) (calculated as a percentage of gross unrealized loss). Non-investment grade securities represent 74% ofthe $398 million fair value and 78% of the $234 million gross unrealized loss.
The Company held 19 fixed maturity securities each with a gross unrealized loss at December 31, 2002 greater than $10 million. Seven of thesesecurities represent 54% of the gross unrealized loss on fixed maturities where the estimated fair value had declined and remained below amortized costby 20% or more for six months or greater. The estimated fair value and gross unrealized loss at December 31, 2002 for these securities were$202 million and $125 million, respectively. These securities were concentrated in the U.S. corporate sector. The Company analyzed, on a case-by-case basis, each of the seven fixed maturity securities as of December 31, 2002 to determine if the securities were other-than-temporarily impaired. TheCompany believes that the estimated fair value of these securities, which were concentrated in the utility and transportation industries, were artificiallydepressed as a result of unusually strong negative market reaction in this sector and generally poor economic and market conditions. The Companybelieves that the analysis of each such security indicated that the financial strength, liquidity, leverage, future outlook and/or recent management actionssupport the view that the security was not other-than-temporarily impaired as of December 31, 2002.
Corporate Fixed Maturities. The table below shows the major industry types that comprise the corporate bond holdings at:
December 31,
2002 2001
Estimated % of Estimated % ofFair Value Total Fair Value Total
(Dollars in millions)
Industrial *************************************************************************** $29,077 42.5% $26,295 43.2%Utility****************************************************************************** 7,219 10.5 7,296 12.0Finance**************************************************************************** 12,596 18.4 10,027 16.5Yankee/Foreign(1) ******************************************************************* 19,229 28.1 16,985 27.9Other ***************************************************************************** 365 0.5 245 0.4
Total ************************************************************************** $68,486 100.0% $60,848 100.0%
(1) Includes publicly traded, U.S. dollar-denominated debt obligations of foreign obligors, known as Yankee bonds, and other foreign investments.The Company diversifies its corporate bond holdings by industry and issuer. The portfolio has no exposure to any single issuer in excess of 1% of its
total invested assets. At December 31, 2002, the Company’s combined holdings in the ten issuers to which it had the greatest exposure totaled$2,973 million, which was less than 2% of the Company’s total invested assets at such date. The exposure to the largest single issuer of corporatebonds the Company held at December 31, 2002 was $385 million.
At December 31, 2002 and 2001, investments of $14,778 million and $13,734 million, respectively, or 76.9% and 80.9%, respectively, of theYankee/Foreign sector, represented exposure to traditional Yankee bonds. The balance of this exposure was primarily U.S. dollar-denominated andconcentrated by security type in industrial and financial institutions. The Company diversifies the Yankee/Foreign portfolio by country and issuer.
The Company does not have material exposure to foreign currency risk in its invested assets. In the Company’s international insurance operations,both its assets and liabilities are generally denominated in local currencies. Foreign currency denominated securities supporting U.S. dollar liabilities aregenerally swapped back into U.S. dollars.
The Company’s exposure to future deterioration in the economic and political environment in Brazil and Argentina, with respect to its Brazilian andArgentine related investments (including local insurance operations), is limited to the net carrying value of those assets, which totaled approximately$357 million and $150 million, respectively, as of December 31, 2002. The net carrying value of the Company’s Brazilian and Argentine relatedinvestments is net of writedowns for other-than-temporary impairments.
Mortgage-Backed Securities. The following table shows the types of mortgage-backed securities the Company held at:
December 31,
2002 2001
Estimated % of Estimated % ofFair Value Total Fair Value Total
(Dollars in millions)
Pass-through securities ************************************************************** $12,515 35.9% $ 9,676 37.0%Collateralized mortgage obligations ***************************************************** 15,511 44.5 11,140 42.5Commercial mortgage-backed securities ************************************************ 6,857 19.6 5,364 20.5
Total ************************************************************************** $34,883 100.0% $26,180 100.0%
At December 31, 2002 and 2001, pass-through and collateralized mortgage obligations totaled $28,026 million and $20,816 million, respectively,or 80.4% and 79.5%, respectively, of total mortgage-backed securities, and a majority of this amount represented agency-issued pass-through andcollateralized mortgage obligations guaranteed or otherwise supported by the Federal National Mortgage Association, the Federal Home Loan MortgageCorporation or the Government National Mortgage Association. At December 31, 2002 and 2001, approximately $3,598 million and $2,866 million,respectively, or 52.5% and 53.4%, respectively, of the commercial mortgage-backed securities, and $27,590 million and $20,249 million, respectively,or 98.4% and 97.3%, respectively, of the pass-through securities and collateralized mortgage obligations, were rated Aaa/AAA by Moody’s or S&P.
MetLife, Inc. 31
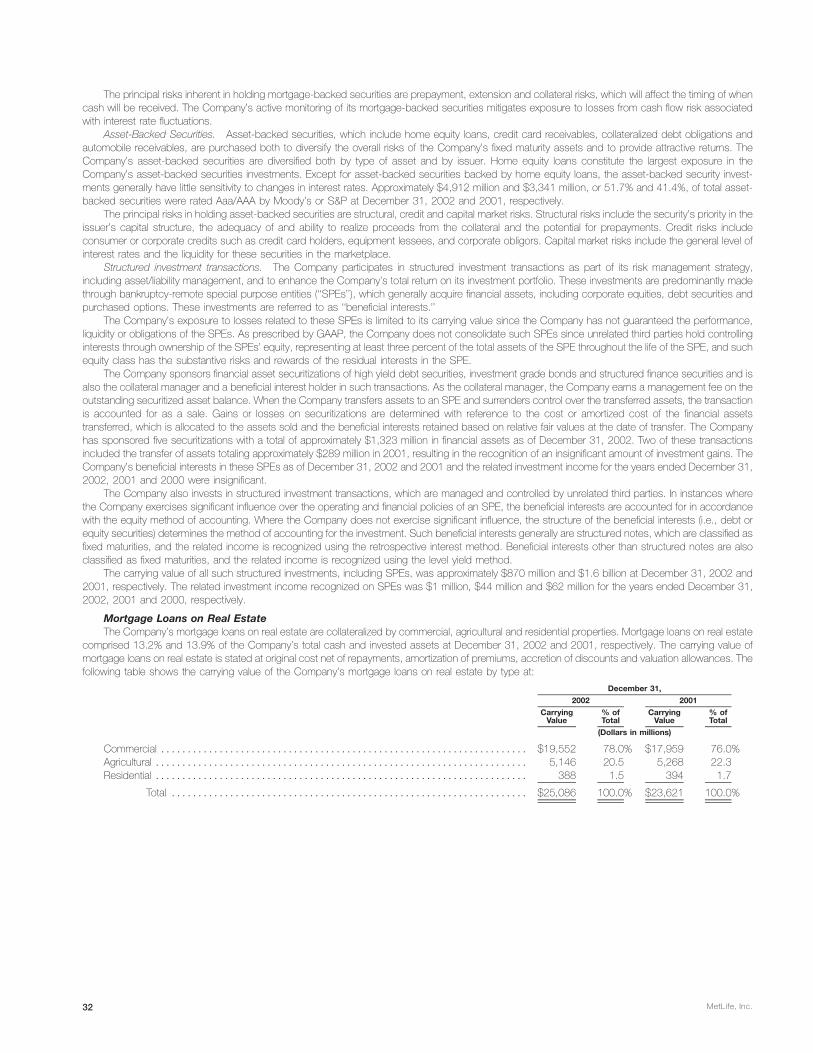
The principal risks inherent in holding mortgage-backed securities are prepayment, extension and collateral risks, which will affect the timing of whencash will be received. The Company’s active monitoring of its mortgage-backed securities mitigates exposure to losses from cash flow risk associatedwith interest rate fluctuations.
Asset-Backed Securities. Asset-backed securities, which include home equity loans, credit card receivables, collateralized debt obligations andautomobile receivables, are purchased both to diversify the overall risks of the Company’s fixed maturity assets and to provide attractive returns. TheCompany’s asset-backed securities are diversified both by type of asset and by issuer. Home equity loans constitute the largest exposure in theCompany’s asset-backed securities investments. Except for asset-backed securities backed by home equity loans, the asset-backed security invest-ments generally have little sensitivity to changes in interest rates. Approximately $4,912 million and $3,341 million, or 51.7% and 41.4%, of total asset-backed securities were rated Aaa/AAA by Moody’s or S&P at December 31, 2002 and 2001, respectively.
The principal risks in holding asset-backed securities are structural, credit and capital market risks. Structural risks include the security’s priority in theissuer’s capital structure, the adequacy of and ability to realize proceeds from the collateral and the potential for prepayments. Credit risks includeconsumer or corporate credits such as credit card holders, equipment lessees, and corporate obligors. Capital market risks include the general level ofinterest rates and the liquidity for these securities in the marketplace.
Structured investment transactions. The Company participates in structured investment transactions as part of its risk management strategy,including asset/liability management, and to enhance the Company’s total return on its investment portfolio. These investments are predominantly madethrough bankruptcy-remote special purpose entities (‘‘SPEs’’), which generally acquire financial assets, including corporate equities, debt securities andpurchased options. These investments are referred to as ‘‘beneficial interests.’’
The Company’s exposure to losses related to these SPEs is limited to its carrying value since the Company has not guaranteed the performance,liquidity or obligations of the SPEs. As prescribed by GAAP, the Company does not consolidate such SPEs since unrelated third parties hold controllinginterests through ownership of the SPEs’ equity, representing at least three percent of the total assets of the SPE throughout the life of the SPE, and suchequity class has the substantive risks and rewards of the residual interests in the SPE.
The Company sponsors financial asset securitizations of high yield debt securities, investment grade bonds and structured finance securities and isalso the collateral manager and a beneficial interest holder in such transactions. As the collateral manager, the Company earns a management fee on theoutstanding securitized asset balance. When the Company transfers assets to an SPE and surrenders control over the transferred assets, the transactionis accounted for as a sale. Gains or losses on securitizations are determined with reference to the cost or amortized cost of the financial assetstransferred, which is allocated to the assets sold and the beneficial interests retained based on relative fair values at the date of transfer. The Companyhas sponsored five securitizations with a total of approximately $1,323 million in financial assets as of December 31, 2002. Two of these transactionsincluded the transfer of assets totaling approximately $289 million in 2001, resulting in the recognition of an insignificant amount of investment gains. TheCompany’s beneficial interests in these SPEs as of December 31, 2002 and 2001 and the related investment income for the years ended December 31,2002, 2001 and 2000 were insignificant.
The Company also invests in structured investment transactions, which are managed and controlled by unrelated third parties. In instances wherethe Company exercises significant influence over the operating and financial policies of an SPE, the beneficial interests are accounted for in accordancewith the equity method of accounting. Where the Company does not exercise significant influence, the structure of the beneficial interests (i.e., debt orequity securities) determines the method of accounting for the investment. Such beneficial interests generally are structured notes, which are classified asfixed maturities, and the related income is recognized using the retrospective interest method. Beneficial interests other than structured notes are alsoclassified as fixed maturities, and the related income is recognized using the level yield method.
The carrying value of all such structured investments, including SPEs, was approximately $870 million and $1.6 billion at December 31, 2002 and2001, respectively. The related investment income recognized on SPEs was $1 million, $44 million and $62 million for the years ended December 31,2002, 2001 and 2000, respectively.
Mortgage Loans on Real EstateThe Company’s mortgage loans on real estate are collateralized by commercial, agricultural and residential properties. Mortgage loans on real estate
comprised 13.2% and 13.9% of the Company’s total cash and invested assets at December 31, 2002 and 2001, respectively. The carrying value ofmortgage loans on real estate is stated at original cost net of repayments, amortization of premiums, accretion of discounts and valuation allowances. Thefollowing table shows the carrying value of the Company’s mortgage loans on real estate by type at:
December 31,
2002 2001
Carrying % of Carrying % ofValue Total Value Total
(Dollars in millions)
Commercial ********************************************************************* $19,552 78.0% $17,959 76.0%Agricultural ********************************************************************** 5,146 20.5 5,268 22.3Residential ********************************************************************** 388 1.5 394 1.7
Total ******************************************************************* $25,086 100.0% $23,621 100.0%
MetLife, Inc.32

Commercial Mortgage Loans. The Company diversifies its commercial mortgage loans by both geographic region and property type, andmanages these investments through a network of regional offices overseen by its investment department. The following table presents the distributionacross geographic regions and property types for commercial mortgage loans at:
December 31,
2002 2001
Carrying % of Carrying % ofValue Total Value Total
(Dollars in millions)
RegionSouth Atlantic ******************************************************************* $ 5,076 26.0% $ 4,729 26.3%Pacific************************************************************************** 4,180 21.4 3,593 20.0Middle Atlantic ******************************************************************* 3,441 17.6 3,248 18.1East North Central**************************************************************** 2,147 11.0 2,003 11.2New England ******************************************************************** 1,323 6.8 1,198 6.7West South Central*************************************************************** 1,097 5.6 1,021 5.7Mountain *********************************************************************** 833 4.2 733 4.1West North Central *************************************************************** 645 3.3 727 4.0International ********************************************************************* 632 3.2 526 2.9East South Central *************************************************************** 178 0.9 181 1.0
Total ******************************************************************* $19,552 100.0% $17,959 100.0%
Property TypeOffice ************************************************************************** $ 9,340 47.8% $ 8,293 46.2%Retail*************************************************************************** 4,320 22.1 4,208 23.4Apartments********************************************************************** 2,793 14.3 2,553 14.2Industrial ************************************************************************ 1,910 9.7 1,813 10.1Hotel*************************************************************************** 942 4.8 864 4.8Other ************************************************************************** 247 1.3 228 1.3
Total ******************************************************************* $19,552 100.0% $17,959 100.0%
The following table presents the scheduled maturities for the Company’s commercial mortgage loans at:
December 31,
2002 2001
Carrying % of Carrying % ofValue Total Value Total
(Dollars in millions)
Due in one year or less *********************************************************** $ 713 3.6% $ 840 4.7%Due after one year through two years *********************************************** 1,204 6.2 677 3.8Due after two years through three years ********************************************* 1,939 9.9 1,532 8.5Due after three years through four years ********************************************* 2,048 10.5 1,772 9.9Due after four years through five years*********************************************** 2,443 12.5 2,078 11.6Due after five years *************************************************************** 11,205 57.3 11,060 61.5
Total ******************************************************************* $19,552 100.0% $17,959 100.0%
Problem, Potential Problem and Restructured Mortgage Loans. The Company monitors its mortgage loan investments on a continual basis.Through this monitoring process, the Company reviews loans that are restructured, delinquent or under foreclosure and identifies those that managementconsiders to be potentially delinquent. These loan classifications are generally consistent with those used in industry practice.
The Company defines restructured mortgage loans, consistent with industry practice, as loans in which the Company, for economic or legal reasonsrelated to the debtor’s financial difficulties, grants a concession to the debtor that it would not otherwise consider. This definition provides for loans to exitthe restructured category under certain conditions. The Company defines delinquent mortgage loans, consistent with industry practice, as loans in whichtwo or more interest or principal payments are past due. The Company defines mortgage loans under foreclosure, consistent with industry practice, asloans in which foreclosure proceedings have formally commenced. The Company defines potentially delinquent loans as loans that, in management’sopinion, have a high probability of becoming delinquent.
The Company reviews all mortgage loans at least annually. These reviews may include an analysis of the property financial statements and rent roll,lease rollover analysis, property inspections, market analysis and tenant creditworthiness. The Company also reviews loan-to-value ratios and debtcoverage ratios for restructured loans, delinquent loans, loans under foreclosure, potentially delinquent loans, loans with an existing valuation allowance,loans maturing within two years and loans with a loan-to-value ratio greater than 90% as determined in the prior year.
The principal risks in holding commercial mortgage loans are property specific, supply and demand, financial and capital market risks. Propertyspecific risks include the geographic location of the property, the physical condition of the property, the diversity of tenants and the rollover of their leasesand the ability of the property manager to attract tenants and manage expenses. Supply and demand risks include changes in the supply and/or demandfor rental space which cause changes in vacancy rates and/or rental rates. Financial risks include the overall level of debt on the property and the amountof principal repaid during the loan term. Capital market risks include the general level of interest rates, the liquidity for these securities in the marketplaceand the capital available for loan refinancing.
The Company has a $525 million non-recourse mortgage loan on a high profile office complex that has been affected by the September 11, 2001tragedies, causing the obligor to impair its investment in the property. The Company continues to be in discussions with the borrower concerning theborrower’s ownership interest in the property. A change in circumstances could result in a borrower default, MetLife classifying the loan as impaired or the
MetLife, Inc. 33

transfer of ownership of the property to the Company. The Company did not classify this loan as a problem or potential problem as of December 31,2002 since the obligor is performing as agreed and the estimated collateral value provides sufficient coverage for the loan. Based on the Company’scurrent estimate that the property’s market value exceeds the loan balance, the Company would not record a loss in accordance with SFAS No. 114,Accounting by Creditors for Impairments of a Loan (‘‘SFAS 114’’) in the event the loan was classified as impaired.
The Company establishes valuation allowances for loans that it deems impaired, as determined through its mortgage review process. The Companydefines impaired loans consistent with SFAS 114 as loans which it probably will not collect all amounts due according to applicable contractual terms ofthe agreement. The Company bases valuation allowances upon the present value of expected future cash flows discounted at the loan’s original effectiveinterest rate or the value of the loan’s collateral. The Company records valuation allowances as investment losses. The Company records subsequentadjustments to allowances as investment gains or losses.
The following table presents the amortized cost and valuation allowance for commercial mortgage loans distributed by loan classification at:
December 31, 2002 December 31, 2001
% of % ofAmortized % of Valuation Amortized Amortized % of Valuation Amortized
Cost(1) Total Allowance Cost Cost(1) Total Allowance Cost
(Dollars in millions)
Performing ******************************************** $19,343 98.3% $ 60 0.3% $17,495 96.6% $ 52 0.3%Restructured******************************************* 246 1.3 49 19.9% 448 2.5 55 12.3%Delinquent or under foreclosure*************************** 14 0.1 — 0.0% 14 0.1 7 50.0%Potentially delinquent************************************ 68 0.3 10 14.7% 136 0.8 20 14.7%
Total ***************************************** $19,671 100.0% $119 0.6% $18,093 100.0% $134 0.7%
(1) Amortized cost is equal to carrying value before valuation allowances.
The following table presents the changes in valuation allowances for commercial mortgage loans for the:
Year Ended December 31,
2002 2001 2000
(Dollars in millions)
Balance, beginning of year ************************************************************************ $134 $ 76 $ 69Additions *************************************************************************************** 38 84 61Deductions for writedowns and dispositions ********************************************************** (53) (26) (54)
Balance, end of year ***************************************************************************** $119 $134 $ 76
Agricultural Mortgage Loans. The Company diversifies its agricultural mortgage loans by both geographic region and product type. The Companymanages these investments through a network of regional offices and field professionals overseen by its investment department.
Approximately 63.5% of the $5,146 million of agricultural mortgage loans outstanding at December 31, 2002 were subject to rate resets prior tomaturity. A substantial portion of these loans generally is successfully renegotiated and remains outstanding to maturity. The process and policies formonitoring the agricultural mortgage loans and classifying them by performance status are generally the same as those for the commercial loans.
The following table presents the amortized cost and valuation allowances for agricultural mortgage loans distributed by loan classification at:
December 31, 2002 December 31, 2001
% of % ofAmortized % of Valuation Amortized Amortized % of Valuation Amortized
Cost(1) Total Allowance Cost Cost(1) Total Allowance Cost
(Dollars in millions)
Performing ******************************************** $4,980 96.7% $— 0.0% $5,055 95.8% $3 0.1%Restructured******************************************* 140 2.7 5 3.6% 188 3.6 3 1.6%Delinquent or under foreclosure **************************** 14 0.3 — 0.0% 29 0.5 2 6.9%Potentially delinquent************************************* 18 0.3 1 5.6% 5 0.1 1 20.0%
Total****************************************** $5,152 100.0% $ 6 0.1% $5,277 100.0% $9 0.2%
(1) Amortized cost is equal to carrying value before valuation allowances.
The following table presents the changes in valuation allowances for agricultural mortgage loans for the:
Year Ended December 31,
2002 2001 2000
(Dollars in millions)
Balance, beginning of year*************************************************************************** $ 9 $ 7 $ 18Additions ***************************************************************************************** 3 21 8Deductions for writedowns and dispositions ************************************************************ (6) (19) (19)
Balance, end of year******************************************************************************** $ 6 $ 9 $ 7
The principal risks in holding agricultural mortgage loans are property specific, supply and demand, and financial and capital market risks. Propertyspecific risks include the geographic location of the property, soil types, weather conditions and the other factors that may impact the borrower’sguaranty. Supply and demand risks include the supply and demand for the commodities produced on the specific property and the related price forthose commodities. Financial risks include the overall level of debt on the property and the amount of principal repaid during the loan term. Capital marketrisks include the general level of interest rates, the liquidity for these securities in the marketplace and the capital available for loan refinancing.
MetLife, Inc.34
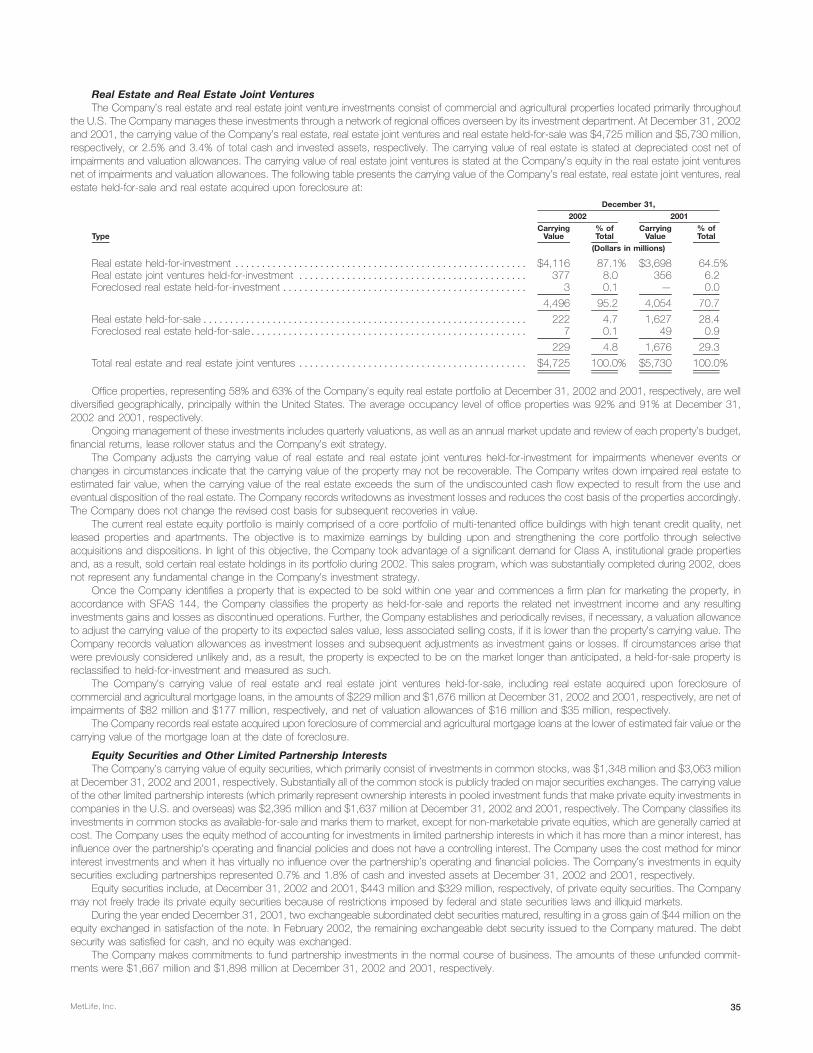
Real Estate and Real Estate Joint VenturesThe Company’s real estate and real estate joint venture investments consist of commercial and agricultural properties located primarily throughout
the U.S. The Company manages these investments through a network of regional offices overseen by its investment department. At December 31, 2002and 2001, the carrying value of the Company’s real estate, real estate joint ventures and real estate held-for-sale was $4,725 million and $5,730 million,respectively, or 2.5% and 3.4% of total cash and invested assets, respectively. The carrying value of real estate is stated at depreciated cost net ofimpairments and valuation allowances. The carrying value of real estate joint ventures is stated at the Company’s equity in the real estate joint venturesnet of impairments and valuation allowances. The following table presents the carrying value of the Company’s real estate, real estate joint ventures, realestate held-for-sale and real estate acquired upon foreclosure at:
December 31,
2002 2001
Carrying % of Carrying % ofType Value Total Value Total
(Dollars in millions)
Real estate held-for-investment ******************************************************* $4,116 87.1% $3,698 64.5%Real estate joint ventures held-for-investment ******************************************* 377 8.0 356 6.2Foreclosed real estate held-for-investment ********************************************** 3 0.1 — 0.0
4,496 95.2 4,054 70.7
Real estate held-for-sale ************************************************************* 222 4.7 1,627 28.4Foreclosed real estate held-for-sale**************************************************** 7 0.1 49 0.9
229 4.8 1,676 29.3
Total real estate and real estate joint ventures ******************************************* $4,725 100.0% $5,730 100.0%
Office properties, representing 58% and 63% of the Company’s equity real estate portfolio at December 31, 2002 and 2001, respectively, are welldiversified geographically, principally within the United States. The average occupancy level of office properties was 92% and 91% at December 31,2002 and 2001, respectively.
Ongoing management of these investments includes quarterly valuations, as well as an annual market update and review of each property’s budget,financial returns, lease rollover status and the Company’s exit strategy.
The Company adjusts the carrying value of real estate and real estate joint ventures held-for-investment for impairments whenever events orchanges in circumstances indicate that the carrying value of the property may not be recoverable. The Company writes down impaired real estate toestimated fair value, when the carrying value of the real estate exceeds the sum of the undiscounted cash flow expected to result from the use andeventual disposition of the real estate. The Company records writedowns as investment losses and reduces the cost basis of the properties accordingly.The Company does not change the revised cost basis for subsequent recoveries in value.
The current real estate equity portfolio is mainly comprised of a core portfolio of multi-tenanted office buildings with high tenant credit quality, netleased properties and apartments. The objective is to maximize earnings by building upon and strengthening the core portfolio through selectiveacquisitions and dispositions. In light of this objective, the Company took advantage of a significant demand for Class A, institutional grade propertiesand, as a result, sold certain real estate holdings in its portfolio during 2002. This sales program, which was substantially completed during 2002, doesnot represent any fundamental change in the Company’s investment strategy.
Once the Company identifies a property that is expected to be sold within one year and commences a firm plan for marketing the property, inaccordance with SFAS 144, the Company classifies the property as held-for-sale and reports the related net investment income and any resultinginvestments gains and losses as discontinued operations. Further, the Company establishes and periodically revises, if necessary, a valuation allowanceto adjust the carrying value of the property to its expected sales value, less associated selling costs, if it is lower than the property’s carrying value. TheCompany records valuation allowances as investment losses and subsequent adjustments as investment gains or losses. If circumstances arise thatwere previously considered unlikely and, as a result, the property is expected to be on the market longer than anticipated, a held-for-sale property isreclassified to held-for-investment and measured as such.
The Company’s carrying value of real estate and real estate joint ventures held-for-sale, including real estate acquired upon foreclosure ofcommercial and agricultural mortgage loans, in the amounts of $229 million and $1,676 million at December 31, 2002 and 2001, respectively, are net ofimpairments of $82 million and $177 million, respectively, and net of valuation allowances of $16 million and $35 million, respectively.
The Company records real estate acquired upon foreclosure of commercial and agricultural mortgage loans at the lower of estimated fair value or thecarrying value of the mortgage loan at the date of foreclosure.
Equity Securities and Other Limited Partnership InterestsThe Company’s carrying value of equity securities, which primarily consist of investments in common stocks, was $1,348 million and $3,063 million
at December 31, 2002 and 2001, respectively. Substantially all of the common stock is publicly traded on major securities exchanges. The carrying valueof the other limited partnership interests (which primarily represent ownership interests in pooled investment funds that make private equity investments incompanies in the U.S. and overseas) was $2,395 million and $1,637 million at December 31, 2002 and 2001, respectively. The Company classifies itsinvestments in common stocks as available-for-sale and marks them to market, except for non-marketable private equities, which are generally carried atcost. The Company uses the equity method of accounting for investments in limited partnership interests in which it has more than a minor interest, hasinfluence over the partnership’s operating and financial policies and does not have a controlling interest. The Company uses the cost method for minorinterest investments and when it has virtually no influence over the partnership’s operating and financial policies. The Company’s investments in equitysecurities excluding partnerships represented 0.7% and 1.8% of cash and invested assets at December 31, 2002 and 2001, respectively.
Equity securities include, at December 31, 2002 and 2001, $443 million and $329 million, respectively, of private equity securities. The Companymay not freely trade its private equity securities because of restrictions imposed by federal and state securities laws and illiquid markets.
During the year ended December 31, 2001, two exchangeable subordinated debt securities matured, resulting in a gross gain of $44 million on theequity exchanged in satisfaction of the note. In February 2002, the remaining exchangeable debt security issued to the Company matured. The debtsecurity was satisfied for cash, and no equity was exchanged.
The Company makes commitments to fund partnership investments in the normal course of business. The amounts of these unfunded commit-ments were $1,667 million and $1,898 million at December 31, 2002 and 2001, respectively.
MetLife, Inc. 35

The following tables set forth the cost, gross unrealized gain or loss and estimated fair value of the Company’s equity securities, as well as thepercentage of the total equity securities at:
December 31, 2002
GrossUnrealized Estimated % of
Cost Gain Loss Fair Value Total
(Dollars in millions)
Equity Securities:Common stocks ********************************************************* $ 877 $115 $79 $ 913 67.7%Nonredeemable preferred stocks******************************************** 426 13 4 435 32.3
Total equity securities *********************************************** $1,303 $128 $83 $1,348 100.0%
December 31, 2001
GrossUnrealized Estimated % of
Cost Gain Loss Fair Value Total
(Dollars in millions)
Equity Securities:Common stocks ************************************************************* $1,968 $657 $78 $2,547 83.2%Nonredeemable preferred stocks************************************************ 491 28 3 516 16.8
Total equity securities *************************************************** $2,459 $685 $81 $3,063 100.0%
Problem and Potential Problem Equity Securities and Other Limited Partnership InterestsThe Company monitors its equity securities and other limited partnership interests on a continual basis. Through this monitoring process, the
Company identifies investments that management considers to be problems or potential problems.Problem equity securities and other limited partnership interests are defined as securities (i) in which significant declines in revenues and/or margins
threaten the ability of the issuer to continue operating, or (ii) where the issuer has entered into bankruptcy.Potential problem equity securities and other limited partnership interests are defined as securities issued by a company that is experiencing
significant operating problems or difficult industry conditions. Criteria generally indicative of these problems or conditions are (i) cash flows falling belowvarying thresholds established for the industry and other relevant factors, (ii) significant declines in revenues and/or margins, (iii) public securities trading ata substantial discount compared to original cost as a result of specific credit concerns, and (iv) other information that becomes available.
Equity Security Impairment. The Company classifies all of its equity securities as available-for-sale and marks them to market through othercomprehensive income. All securities with gross unrealized losses at the consolidated balance sheet date are subjected to the Company’s process foridentifying other-than-temporary impairments. The Company writes down to fair value securities that it deems to be other-than-temporarily impaired in theperiod the securities are deemed to be so impaired. The assessment of whether such impairment has occurred is based on management’s case-by-case evaluation of the underlying reasons for the decline in fair value. Management considers a wide range of factors, as described below, about thesecurity issuer and uses its best judgment in evaluating the cause of the decline in the estimated fair value of the security and in assessing the prospectsfor near-term recovery. Inherent in management’s evaluation of the security are assumptions and estimates about the operations of the issuer and itsfuture earnings potential.
Considerations used by the Company in the impairment evaluation process include, but are not limited to, the following:) The length of time and the extent to which the market value has been below cost;) The potential for impairments of securities when the issuer is experiencing significant financial difficulties, including a review of all securities of the
issuer, including its known subsidiaries and affiliates, regardless of the form of the Company’s ownership;) The potential for impairments in an entire industry sector or sub-sector;) The potential for impairments in certain economically depressed geographic locations;) The potential for impairments of securities where the issuer, series of issuers or industry has suffered a catastrophic type of loss or has exhausted
natural resources; and) Other subjective factors, including concentrations and information obtained from regulators and rating agencies.Equity securities or other limited partnership interests which are deemed to be other-than-temporarily impaired are written down to fair value. The
Company records writedowns as investment losses and adjusts the cost basis of the equity securities accordingly. The Company does not change therevised cost basis for subsequent recoveries in value. Writedowns of equity securities and other limited partnership interests were $191 million and$142 million for the years ended December 31, 2002 and 2001, respectively. During the years ended December 31, 2002 and 2001, the Company soldequity securities with an estimated fair value of $915 million and $1,311 million at a loss of $85 million and $41 million, respectively.
The gross unrealized loss related to the Company’s equity securities at December 31, 2002 was $83 million. Such securities are concentrated bysecurity type in common stock (61%) and mutual funds (35%); and are concentrated by industry in financial (59%) and domestic broad market mutualfunds (34%) (calculated as a percentage of gross unrealized loss).
MetLife, Inc.36

The following table presents the costs, gross unrealized losses and number of securities for equity securities where the estimated fair value haddeclined and remained below cost by less than 20%, or 20% or more for:
December 31, 2002
Gross Unrealized Number ofCost Losses Securities
Less than 20% or Less than 20% or Less than 20% or20% More 20% More 20% More
(Dollars in millions)
Less than six months********************************************** $298 $292 $25 $58 27 23Six months or greater but less than nine months *********************** 49 — — — 19 —Nine months or greater but less than twelve months******************** — — — — — —Twelve months or greater ****************************************** 18 — — — 15 —
Total **************************************************** $365 $292 $25 $58 61 23
The Company’s review of its equity security exposure includes the analysis of the total gross unrealized losses by three categories of securities:(i) securities where the estimated fair value had declined and remained below cost by less than 20%; (ii) securities where the estimated fair value haddeclined and remained below cost by 20% or more for less than six months; and (iii) securities where the estimated fair value had declined and remainedbelow cost by 20% or more for six months or greater. The first two categories have generally been adversely impacted by the downturn in the financialmarkets, overall economic conditions and continuing effects of the September 11, 2001 tragedies. While all of these securities are monitored for potentialimpairment, the Company’s experience indicates that the first two categories do not present as great a risk of impairment, and often, fair values recoverover time as the factors that caused the declines improve.
The following table presents the total gross unrealized losses for equity securities at December 31, 2002 where the estimated fair value had declinedand remained below cost by:
December 31, 2002
Gross Unrealized % ofLosses Total
(Dollars in millions)
Less than 20% ********************************************************************************** $25 30.1%20% or more for less than six months *************************************************************** 58 69.920% or more for six months or greater*************************************************************** — —
Total *********************************************************************************** $83 100.0%
The category of equity securities where the estimated fair value has declined and remained below cost by less than 20% is comprised of 61 equitysecurities with a cost of $365 million and a gross unrealized loss of $25 million. These securities are concentrated by security type in mutual funds (78%);and concentrated by industry in domestic broad market mutual funds (78%) (calculated as a percentage of gross unrealized loss). The significant factorsconsidered at December 31, 2002 in the review of equity securities for other-than-temporary impairment were the unusual and severely depressedmarket conditions, the instability of the global economy and the lagging effects of the September 11, 2001 tragedies.
The category of equity securities where the estimated fair value has declined and remained below cost by 20% or more for less than six months iscomprised of 23 equity securities with a cost of $292 million and a gross unrealized loss of $58 million. These securities are concentrated by securitytype in common stock (80%) and mutual funds (15%); and concentrated by industry in financial (80%) and domestic broad market mutual funds (15%)(calculated as a percentage of gross unrealized loss). The significant factors considered at December 31, 2002 in the review of equity securities for other-than-temporary impairment were the unusual and severely depressed market conditions, the instability of the global economy and the lagging effects ofthe September 11, 2001 tragedies.
The Company held two equity securities with a gross unrealized loss at December 31, 2002 greater than $5 million. Neither of these securitiesrepresented gross unrealized losses where the estimated fair value had declined and remained below cost by 20% or more for six months or greater.
Other Invested AssetsThe Company’s other invested assets consist principally of leveraged leases and funds withheld at interest of $3.1 billion and $2.7 billion at
December 31, 2002 and 2001, respectively. The leveraged leases are recorded net of non-recourse debt. The Company participates in leasetransactions, which are diversified by geographic area. The Company regularly reviews residual values and writes down residuals to expected values asneeded. Funds withheld represent amounts contractually withheld by ceding companies in accordance with reinsurance agreements. For agreementswritten on a modified coinsurance basis and certain agreements written on a coinsurance basis, assets supporting the reinsured policies equal to the netstatutory reserves are withheld and continue to be legally owned by the ceding company. Interest accrues to these funds withheld at rates defined by thetreaty terms and may be contractually specified or directly related to the investment portfolio. The Company’s other invested assets represented 1.9% ofcash and invested assets at both December 31, 2002 and 2001.
Derivative Financial InstrumentsThe Company uses derivative instruments to manage risk through one of four principal risk management strategies: the hedging of liabilities, invested
assets, portfolios of assets or liabilities and anticipated transactions. Additionally, Metropolitan Life enters into income generation and replication derivativetransactions as permitted by its derivatives use plan that was approved by the Department. The Company’s derivative strategy employs a variety ofinstruments, including financial futures, financial forwards, interest rate, credit default and foreign currency swaps, foreign currency forwards, writtencovered calls and options, including caps and floors.
MetLife, Inc. 37

The table below provides a summary of the notional amount and fair value of derivative financial instruments held at:
December 31, 2002 December 31, 2001
Fair Value Fair ValueNotional NotionalAmount Assets Liabilities Amount Assets Liabilities
(Dollars in millions)
Financial futures ******************************************************* $ 4 $ — $ — $ — $ — $—Interest rate swaps ***************************************************** 3,866 196 126 1,823 73 9Floors**************************************************************** 325 9 — 325 11 —Caps **************************************************************** 8,040 — — 7,890 5 —Financial forwards ****************************************************** 1,945 — 12 — — —Foreign currency swaps************************************************* 2,371 92 181 1,925 188 26Options ************************************************************** 78 9 — 1,880 8 12Foreign currency forwards *********************************************** 54 — 1 67 4 —Written covered calls *************************************************** — — — 40 — —Credit default swaps *************************************************** 376 2 — 270 — —
Total contractual commitments ***************************************** $17,059 $308 $320 $14,220 $289 $47
Securities LendingThe Company participates in a securities lending program whereby blocks of securities, which are included in investments, are loaned to third
parties, primarily major brokerage firms. The Company requires a minimum of 102% of the fair value of the loaned securities to be separately maintainedas collateral for the loans. Securities with a cost or amortized cost of $14,873 million and $11,416 million and an estimated fair value of $17,625 millionand $12,066 million were on loan under the program at December 31, 2002 and 2001, respectively. The Company was liable for cash collateral underits control of $17,862 million and $12,661 million at December 31, 2002 and 2001, respectively. Security collateral on deposit from customers may notbe sold or repledged and is not reflected in the consolidated financial statements.
Separate Account AssetsThe Company manages each separate account’s assets in accordance with the prescribed investment policy that applies to that specific separate
account. The Company establishes separate accounts on a single client and multi-client commingled basis in conformity with insurance laws. Generally,separate accounts are not chargeable with liabilities that arise from any other business of the Company. Separate account assets are subject to theCompany’s general account claims only to the extent that the value of such assets exceeds the separate account liabilities, as defined by the account’scontract. If the Company uses a separate account to support a contract providing guaranteed benefits, the Company must comply with the assetmaintenance requirements stipulated under Regulation 128 of the Department. The Company monitors these requirements at least monthly and, inaddition, performs cash flow analyses, similar to that conducted for the general account, on an annual basis. The Company reports separately as assetsand liabilities investments held in separate accounts and liabilities of the separate accounts. The Company reports substantially all separate accountassets at their fair market value. Investment income and gains or losses on the investments of separate accounts accrue directly to contractholders, and,accordingly, the Company does not reflect them in its consolidated statements of income and cash flows. The Company reflects in its revenues feescharged to the separate accounts by the Company, including mortality charges, risk charges, policy administration fees, investment management feesand surrender charges.
Quantitative and Qualitative Disclosures About Market RiskThe Company must effectively manage, measure and monitor the market risk associated with its invested assets and interest rate sensitive
insurance contracts. It has developed an integrated process for managing risk, which it conducts through its Corporate Risk Management Department,several asset/liability committees and additional specialists at the business segment level. The Company has established and implemented comprehen-sive policies and procedures at both the corporate and business segment level to minimize the effects of potential market volatility.
Market Risk ExposuresThe Company has exposure to market risk through its insurance operations and investment activities. For purposes of this disclosure, ‘‘market risk’’
is defined as the risk of loss resulting from changes in interest rates, equity prices and foreign currency exchange rates.Interest rates. The Company’s exposure to interest rate changes results from its significant holdings of fixed maturities, as well as its interest rate
sensitive liabilities. The fixed maturities include U.S. and foreign government bonds, securities issued by government agencies, corporate bonds andmortgage-backed securities, all of which are mainly exposed to changes in medium- and long-term treasury rates. The interest rate sensitive liabilities forpurposes of this disclosure include guaranteed interest contracts and fixed annuities, which have the same interest rate exposure (medium- and long-term treasury rates) as the fixed maturities. The Company employs product design, pricing and asset/liability management strategies to reduce theadverse effects of interest rate volatility. Product design and pricing strategies include the use of surrender charges or restrictions on withdrawals in someproducts. Asset/liability management strategies include the use of derivatives, the purchase of securities structured to protect against prepayments,prepayment restrictions and related fees on mortgage loans and consistent monitoring of the pricing of the Company’s products in order to better matchthe duration of the assets and the liabilities they support.
Equity prices. The Company’s investments in equity securities expose it to changes in equity prices. It manages this risk on an integrated basiswith other risks through its asset/liability management strategies. The Company also manages equity price risk through industry and issuer diversificationand asset allocation techniques.
Foreign currency exchange rates. The Company’s exposure to fluctuations in foreign currency exchange rates against the U.S. dollar results fromits holdings in non-U.S. dollar denominated fixed maturity securities and equity securities and through its investments in foreign subsidiaries. The principalcurrencies which create foreign currency exchange rate risk in the Company’s investment portfolios are Canadian dollars, Euros, Mexican pesos, Chileanpesos and British pounds. The Company mitigates the majority of its fixed maturities’ foreign currency exchange rate risk through the utilization of foreigncurrency swaps and forward contracts. Through its investments in foreign subsidiaries, the Company is primarily exposed to the Euro, Mexican peso andSouth Korean won. The Company has denominated substantially all assets and liabilities of its foreign subsidiaries in their respective local currencies,thereby minimizing its risk to foreign currency exchange rate fluctuations.
MetLife, Inc.38

Risk ManagementCorporate risk management. MetLife has established several financial and non-financial senior management committees as part of its risk
management process. These committees manage capital and risk positions, approve asset/liability management strategies and establish appropriatecorporate business standards.
MetLife also has a separate Corporate Risk Management Department, which is responsible for risk throughout MetLife and reports directly toMetropolitan Life’s Chief Actuary. The Corporate Risk Management Department’s primary responsibilities consist of:
) implementing a board of directors-approved corporate risk framework, which outlines the Company’s approach for managing risk on anenterprise-wide basis;
) developing policies and procedures for managing, measuring and monitoring those risks identified in the corporate risk framework;) establishing appropriate corporate risk tolerance levels;) deploying capital on an economic capital basis; and) reporting on a periodic basis to the Audit Committee of the Holding Company’s board of directors and various financial and non-financial senior
management committees.Asset/liability management. At MetLife, asset/liability management is the responsibility of the General Account Portfolio Management Department
(‘‘GAPM’’), the operating business segments and various GAPM boards. The GAPM boards are comprised of senior officers from the investmentdepartment, senior managers from each business segment and the Chief Actuary. The GAPM boards’ duties include setting broad asset/liabilitymanagement policy and strategy, reviewing and approving target portfolios, establishing investment guidelines and limits, and providing oversight of theportfolio management process.
The portfolio managers and asset sector specialists, who have responsibility on a day-to-day basis for risk management of their respective investingactivities, implement the goals and objectives established by the GAPM boards. The goals of the investment process are to optimize after-tax, risk-adjusted investment income and after-tax, risk-adjusted total return while ensuring that the assets and liabilities are managed on a cash flow and durationbasis. The risk management objectives established by the GAPM boards stress quality, diversification, asset/liability matching, liquidity and investmentreturn.
Each of MetLife’s business segments has an asset/liability officer who works with portfolio managers in the investment department to monitorinvestment, product pricing, hedge strategy and liability management issues. MetLife establishes target asset portfolios for each major insurance product,which represent the investment strategies used to profitably fund its liabilities within acceptable levels of risk. These strategies include objectives foreffective duration, yield curve sensitivity, convexity, liquidity, asset sector concentration and credit quality.
To manage interest rate risk, the Company performs periodic projections of asset and liability cash flows to evaluate the potential sensitivity of itssecurities investments and liabilities to interest rate movements. These projections involve evaluating the potential gain or loss on most of the Company’sin-force business under various increasing and decreasing interest rate environments. The Company has developed models of its in-force business thatreflect specific product characteristics and include assumptions based on current and anticipated experience regarding lapse, mortality and interestcrediting rates. In addition, these models include asset cash flow projections reflecting interest payments, sinking fund payments, principal payments,bond calls, mortgage prepayments and defaults. New York Insurance Department regulations require that MetLife perform some of these analysesannually as part of the annual proof of the sufficiency of its regulatory reserves to meet adverse interest rate scenarios.
Hedging activities. MetLife’s risk management strategies incorporate the use of various interest rate derivatives that are used to adjust the overallduration and cash flow profile of its invested asset portfolios to better match the duration and cash flow profile of its liabilities to reduce interest rate risk.Such instruments include financial futures, financial forwards, interest rate and credit default swaps, floors, options, written covered calls and caps.MetLife also uses foreign currency swaps and foreign currency forwards to hedge its foreign currency denominated fixed income investments.
Economic Capital. Beginning in 2003, the Company has changed its methodology of allocating capital from Risk Based Capital to EconomicCapital. In 2002 and in prior years, the Company’s business segments’ allocated equity was primarily based on Risk Based Equity, an internallydeveloped formula based on applying a multiple to the NAIC Statutory Risk Based Capital and includes certain GAAP accounting adjustments. EconomicCapital is an internally developed risk capital model, the purpose of which is to measure the risk in the business and to provide a basis upon which capitalis deployed. The Economic Capital model accounts for the unique and specific nature of the risks inherent in MetLife’s businesses. This is in contrast tothe standardized regulatory Risk Based Capital formula which is not as refined in its risk calculations with respect to the nuances of different companies’businesses.
This change in methodology will be applied prospectively and will impact the level of net investment income and net income of each of theCompany’s business segments. A portion of net investment income is credited to the segments based on the level of allocated equity. This methodologychange of allocating equity will not impact the Company’s consolidated net investment income or net income.
Risk Measurement; Sensitivity AnalysisThe Company measures market risk related to its holdings of invested assets and other financial instruments, including certain market risk sensitive
insurance contracts (‘‘other financial instruments’’), based on changes in interest rates, equity prices and currency exchange rates, utilizing a sensitivityanalysis. This analysis estimates the potential changes in fair value, cash flows and earnings based on a hypothetical 10% change (increase or decrease)in interest rates, equity prices and currency exchange rates. The Company believes that a 10% change (increase or decrease) in these market rates andprices is reasonably possible in the near-term. In performing this analysis, the Company used market rates at December 31, 2002 to re-price its investedassets and other financial instruments. The sensitivity analysis separately calculated each of MetLife’s market risk exposures (interest rate, equity priceand foreign currency exchange rate) related to its non-trading invested assets and other financial instruments. The Company does not maintain a tradingportfolio.
The sensitivity analysis performed included the market risk sensitive holdings described above. The Company modeled the impact of changes inmarket rates and prices on the fair values of its invested assets, earnings and cash flows as follows:
Fair values. The Company bases its potential change in fair values on an immediate change (increase or decrease) in:) the net present values of its interest rate sensitive exposures resulting from a 10% change (increase or decrease) in interest rates;) the U.S. dollar equivalent balances of the Company’s currency exposures due to a 10% change (increase or decrease) in currency exchange
rates; and) the market value of its equity positions due to a 10% change (increase or decrease) in equity prices.
MetLife, Inc. 39
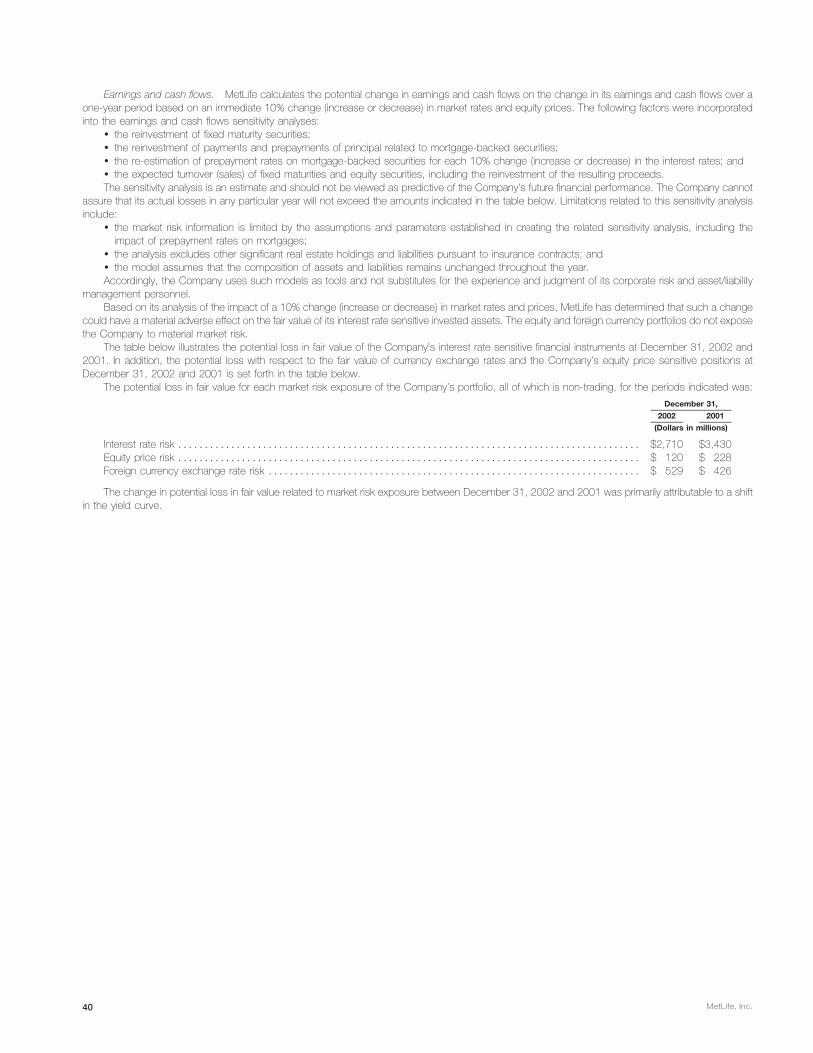
Earnings and cash flows. MetLife calculates the potential change in earnings and cash flows on the change in its earnings and cash flows over aone-year period based on an immediate 10% change (increase or decrease) in market rates and equity prices. The following factors were incorporatedinto the earnings and cash flows sensitivity analyses:
) the reinvestment of fixed maturity securities;) the reinvestment of payments and prepayments of principal related to mortgage-backed securities;) the re-estimation of prepayment rates on mortgage-backed securities for each 10% change (increase or decrease) in the interest rates; and) the expected turnover (sales) of fixed maturities and equity securities, including the reinvestment of the resulting proceeds.The sensitivity analysis is an estimate and should not be viewed as predictive of the Company’s future financial performance. The Company cannot
assure that its actual losses in any particular year will not exceed the amounts indicated in the table below. Limitations related to this sensitivity analysisinclude:
) the market risk information is limited by the assumptions and parameters established in creating the related sensitivity analysis, including theimpact of prepayment rates on mortgages;
) the analysis excludes other significant real estate holdings and liabilities pursuant to insurance contracts; and) the model assumes that the composition of assets and liabilities remains unchanged throughout the year.Accordingly, the Company uses such models as tools and not substitutes for the experience and judgment of its corporate risk and asset/liability
management personnel.Based on its analysis of the impact of a 10% change (increase or decrease) in market rates and prices, MetLife has determined that such a change
could have a material adverse effect on the fair value of its interest rate sensitive invested assets. The equity and foreign currency portfolios do not exposethe Company to material market risk.
The table below illustrates the potential loss in fair value of the Company’s interest rate sensitive financial instruments at December 31, 2002 and2001. In addition, the potential loss with respect to the fair value of currency exchange rates and the Company’s equity price sensitive positions atDecember 31, 2002 and 2001 is set forth in the table below.
The potential loss in fair value for each market risk exposure of the Company’s portfolio, all of which is non-trading, for the periods indicated was:
December 31,
2002 2001
(Dollars in millions)
Interest rate risk *************************************************************************************** $2,710 $3,430Equity price risk *************************************************************************************** $ 120 $ 228Foreign currency exchange rate risk ********************************************************************** $ 529 $ 426
The change in potential loss in fair value related to market risk exposure between December 31, 2002 and 2001 was primarily attributable to a shiftin the yield curve.
MetLife, Inc.40

Financial Statements and Supplementary Data
INDEX TO CONSOLIDATED FINANCIAL STATEMENTS AND SCHEDULESPage
Independent Auditors’ Report ******************************************************************************************* F-2Financial Statements as of December 31, 2002 and 2001 and for the years ended December 31, 2002, 2001 and 2000:
Consolidated Balance Sheets ************************************************************************************** F-3Consolidated Statements of Income********************************************************************************* F-4Consolidated Statements of Stockholders’ Equity ******************************************************************** F-5Consolidated Statements of Cash Flows **************************************************************************** F-6Notes to Consolidated Financial Statements ************************************************************************* F-8
MetLife, Inc. F-1

Independent Auditors’ ReportThe Board of Directors and Shareholders of MetLife, Inc.:
We have audited the accompanying consolidated balance sheets of MetLife, Inc. and subsidiaries (the ‘‘Company’’) as of Decem-ber 31, 2002 and 2001, and the related consolidated statements of income, stockholders’ equity, and cash flows for each of the threeyears in the period ended December 31, 2002. These financial statements are the responsibility of the Company’s management. Ourresponsibility is to express an opinion on the financial statements based on our audits.
We conducted our audits in accordance with auditing standards generally accepted in the United States of America. Those standardsrequire that we plan and perform the audit to obtain reasonable assurance about whether the financial statements are free of materialmisstatement. An audit includes examining, on a test basis, evidence supporting the amounts and disclosures in the financial state-ments. An audit also includes assessing the accounting principles used and significant estimates made by management, as well asevaluating the overall financial statement presentation. We believe that our audits provide a reasonable basis for our opinion.
In our opinion, such consolidated financial statements present fairly, in all material respects, the consolidated financial position ofMetLife, Inc. and subsidiaries as of December 31, 2002 and 2001, and the consolidated results of their operations and their consoli-dated cash flows for each of the three years in the period ended December 31, 2002, in conformity with accounting principles generallyaccepted in the United States of America.
DELOITTE & TOUCHE LLP
New York, New YorkFebruary 19, 2003
MetLife, Inc.F-2

METLIFE, INC.
CONSOLIDATED BALANCE SHEETSDECEMBER 31, 2002 AND 2001
(Dollars in millions, except share and per share data)
2002 2001
ASSETSInvestments:
Fixed maturities available-for-sale, at fair value (amortized cost: $133,152 and $112,288, respectively) ******************* $140,553 $115,398Equity securities, at fair value (cost: $1,303 and $2,459, respectively) ****************************************** 1,348 3,063Mortgage loans on real estate**************************************************************************** 25,086 23,621Policy loans ******************************************************************************************* 8,580 8,272Real estate and real estate joint ventures held-for-investment************************************************** 4,496 4,054Real estate held-for-sale ******************************************************************************** 229 1,676Other limited partnership interests************************************************************************* 2,395 1,637Short-term investments ********************************************************************************* 1,921 1,203Other invested assets ********************************************************************************** 3,727 3,298
Total investments ******************************************************************************** 188,335 162,222Cash and cash equivalents ******************************************************************************** 2,323 7,473Accrued investment income ******************************************************************************* 2,088 2,062Premiums and other receivables**************************************************************************** 7,669 6,509Deferred policy acquisition costs *************************************************************************** 11,727 11,167Other assets ******************************************************************************************** 5,550 4,823Separate account assets********************************************************************************** 59,693 62,714
Total assets ************************************************************************************* $277,385 $256,970
LIABILITIES AND STOCKHOLDERS’ EQUITYLiabilities:
Future policy benefits *********************************************************************************** $ 89,815 $ 84,924Policyholder account balances *************************************************************************** 66,830 58,923Other policyholder funds ******************************************************************************** 5,685 5,404Policyholder dividends payable *************************************************************************** 1,030 1,046Policyholder dividend obligation*************************************************************************** 1,882 708Short-term debt *************************************************************************************** 1,161 355Long-term debt**************************************************************************************** 4,425 3,628Current income taxes payable**************************************************************************** 769 306Deferred income taxes payable*************************************************************************** 1,625 1,526Payables under securities loaned transactions ************************************************************** 17,862 12,661Other liabilities ***************************************************************************************** 7,958 7,457Separate account liabilities******************************************************************************* 59,693 62,714
Total liabilities************************************************************************************ 258,735 239,652
Commitments and contingencies (Note 11)
Company-obligated mandatorily redeemable securities of subsidiary trusts***************************************** 1,265 1,256
Stockholders’ Equity:Preferred stock, par value $0.01 per share; 200,000,000 shares authorized; none issued ************************* — —Series A junior participating preferred stock***************************************************************** — —Common stock, par value $0.01 per share; 3,000,000,000 shares authorized; 786,766,664 shares issued at
December 31, 2002 and December 31, 2001; 700,278,412 shares outstanding at December 31, 2002 and715,506,525 shares outstanding at December 31, 2001*************************************************** 8 8
Additional paid-in capital ******************************************************************************** 14,968 14,966Retained earnings************************************************************************************** 2,807 1,349Treasury stock, at cost; 86,488,252 shares at December 31, 2002 and 71,260,139 shares at December 31, 2001*** (2,405) (1,934)Accumulated other comprehensive income***************************************************************** 2,007 1,673
Total stockholders’ equity************************************************************************** 17,385 16,062
Total liabilities and stockholders’ equity ************************************************************** $277,385 $256,970
See accompanying notes to consolidated financial statements.
MetLife, Inc. F-3
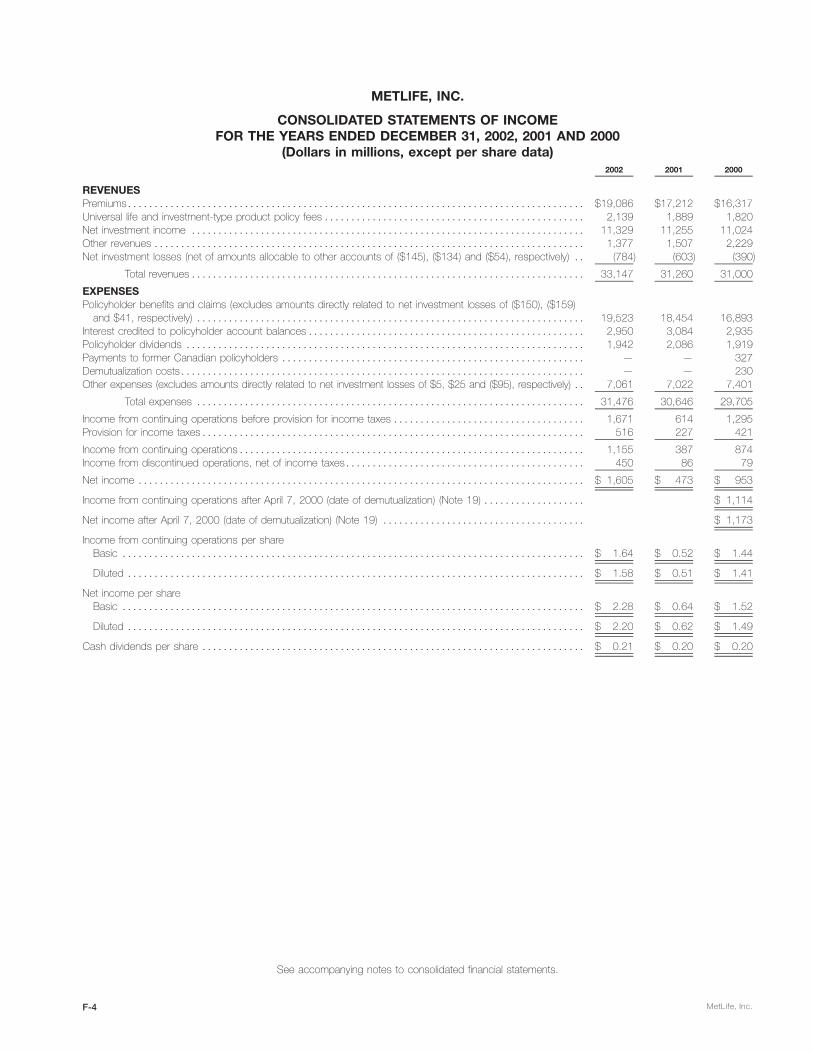
METLIFE, INC.
CONSOLIDATED STATEMENTS OF INCOMEFOR THE YEARS ENDED DECEMBER 31, 2002, 2001 AND 2000
(Dollars in millions, except per share data)2002 2001 2000
REVENUESPremiums************************************************************************************** $19,086 $17,212 $16,317Universal life and investment-type product policy fees ************************************************* 2,139 1,889 1,820Net investment income ************************************************************************** 11,329 11,255 11,024Other revenues ********************************************************************************* 1,377 1,507 2,229Net investment losses (net of amounts allocable to other accounts of ($145), ($134) and ($54), respectively) ** (784) (603) (390)
Total revenues************************************************************************** 33,147 31,260 31,000
EXPENSESPolicyholder benefits and claims (excludes amounts directly related to net investment losses of ($150), ($159)
and $41, respectively) ************************************************************************* 19,523 18,454 16,893Interest credited to policyholder account balances**************************************************** 2,950 3,084 2,935Policyholder dividends *************************************************************************** 1,942 2,086 1,919Payments to former Canadian policyholders ********************************************************* — — 327Demutualization costs**************************************************************************** — — 230Other expenses (excludes amounts directly related to net investment losses of $5, $25 and ($95), respectively) ** 7,061 7,022 7,401
Total expenses ************************************************************************* 31,476 30,646 29,705
Income from continuing operations before provision for income taxes ************************************ 1,671 614 1,295Provision for income taxes************************************************************************ 516 227 421
Income from continuing operations***************************************************************** 1,155 387 874Income from discontinued operations, net of income taxes********************************************* 450 86 79
Net income ************************************************************************************ $ 1,605 $ 473 $ 953
Income from continuing operations after April 7, 2000 (date of demutualization) (Note 19) ******************* $ 1,114
Net income after April 7, 2000 (date of demutualization) (Note 19) ************************************** $ 1,173
Income from continuing operations per shareBasic *************************************************************************************** $ 1.64 $ 0.52 $ 1.44
Diluted ************************************************************************************** $ 1.58 $ 0.51 $ 1.41
Net income per shareBasic *************************************************************************************** $ 2.28 $ 0.64 $ 1.52
Diluted ************************************************************************************** $ 2.20 $ 0.62 $ 1.49
Cash dividends per share ************************************************************************ $ 0.21 $ 0.20 $ 0.20
See accompanying notes to consolidated financial statements.
MetLife, Inc.F-4

METLIFE, INC.
CONSOLIDATED STATEMENTS OF STOCKHOLDERS’ EQUITYFOR THE YEARS ENDED DECEMBER 31, 2002, 2001 AND 2000
(Dollars in millions)Accumulated Other
Comprehensive Income (Loss)
Net Foreign MinimumAdditional Treasury Unrealized Currency Pension
Common Paid-in Retained Stock Investment Translation LiabilityStock Capital Earnings at Cost (Losses) Gains Adjustment Adjustment Total
Balance at December 31, 1999************************ $— $ — $ 14,100 $ — $ (297) $ (94) $(19) $13,690Policy credits and cash payments to eligible policyholders ** (2,958) (2,958)Common stock issued in demutualization **************** 5 10,917 (10,922) —Initial public offering of common stock******************* 2 3,152 3,154Private placement of common stock ******************** 1 854 855Unit offering***************************************** 3 3Treasury stock transactions, net ************************ (613) (613)Dividends on common stock ************************** (152) (152)Comprehensive income:
Net loss before date of demutualization**************** (220) (220)Net income after date of demutualization*************** 1,173 1,173Other comprehensive income:
Unrealized investment gains, net of related offsets,reclassification adjustments and income taxes ****** 1,472 1,472
Foreign currency translation adjustments************* (6) (6)Minimum pension liability adjustment **************** (9) (9)
Other comprehensive income ********************** 1,457
Comprehensive income***************************** 2,410
Balance at December 31, 2000************************ 8 14,926 1,021 (613) 1,175 (100) (28) 16,389Treasury stock transactions, net ************************* (1,321) (1,321)Dividends on common stock ************************** (145) (145)Issuance of warrants — by subsidiary ******************* 40 40Comprehensive income:
Net income *************************************** 473 473Other comprehensive income:
Cumulative effect of change in accounting forderivatives, net of income taxes ****************** 22 22
Unrealized gains on derivative instruments, net ofincome taxes ********************************* 24 24
Unrealized investment gains, net of related offsets,reclassification adjustments and income taxes ****** 658 658
Foreign currency translation adjustments************* (60) (60)Minimum pension liability adjustment **************** (18) (18)
Other comprehensive income ********************** 626
Comprehensive income***************************** 1,099
Balance at December 31, 2001************************ 8 14,966 1,349 (1,934) 1,879 (160) (46) 16,062Treasury stock transactions, net ************************ 2 (471) (469)Dividends on common stock ************************** (147) (147)Comprehensive income:
Net income *************************************** 1,605 1,605Other comprehensive income:
Unrealized losses on derivative instruments, net ofincome taxes ********************************* (60) (60)
Unrealized investment gains, net of related offsets,reclassification adjustments and income taxes ****** 463 463
Foreign currency translation adjustments************* (69) (69)
Other comprehensive income ********************** 334
Comprehensive income***************************** 1,939
Balance at December 31, 2002************************ $ 8 $14,968 $ 2,807 $(2,405) $2,282 $(229) $(46) $17,385
See accompanying notes to consolidated financial statements.
MetLife, Inc. F-5

METLIFE, INC.
CONSOLIDATED STATEMENTS OF CASH FLOWSFOR THE YEARS ENDED DECEMBER 31, 2002, 2001 AND 2000
(Dollars in millions)
2002 2001 2000
Cash flows from operating activitiesNet income************************************************************************************* $ 1,605 $ 473 $ 953
Adjustments to reconcile net income to net cash provided by operating activities:Depreciation and amortization expenses********************************************************* 449 480 369Amortization of premiums and accretion of discounts associated with investments, net****************** (519) (575) (452)Losses from sales of investments and businesses, net ******************************************** 931 737 444Interest credited to other policyholder account balances ******************************************* 2,950 3,084 2,935Universal life and investment-type product policy fees ********************************************* (2,139) (1,889) (1,820)Change in premiums and other receivables ****************************************************** (795) 476 925Change in deferred policy acquisition costs, net ************************************************** (741) (563) (560)Change in insurance-related liabilities *********************************************************** 3,137 2,567 2,042Change in income taxes payable*************************************************************** 479 477 239Change in other liabilities ********************************************************************* 18 41 (933)Other, net ********************************************************************************** (378) (796) (865)
Net cash provided by operating activities ************************************************************ 4,997 4,512 3,277
Cash flows from investing activitiesSales, maturities and repayments of:
Fixed maturities ***************************************************************************** 64,327 52,382 56,940Equity securities ***************************************************************************** 2,642 2,065 748Mortgage loans on real estate ***************************************************************** 2,603 2,069 2,163Real estate and real estate joint ventures ******************************************************** 276 303 606Other limited partnership interests ************************************************************** 355 396 422
Purchases of:Fixed maturities ***************************************************************************** (85,173) (52,160) (64,918)Equity securities ***************************************************************************** (1,242) (3,059) (863)Mortgage loans on real estate ***************************************************************** (3,206) (3,596) (2,787)Real estate and real estate joint ventures ******************************************************** (208) (769) (407)Other limited partnership interests ************************************************************** (456) (424) (660)
Net change in short-term investments************************************************************* (477) 74 2,043Purchase of business, net of cash received******************************************************** (879) (276) (416)Proceeds from sales of businesses*************************************************************** — 81 869Net change in payable under securities loaned transactions ****************************************** 5,201 360 5,840Other, net ************************************************************************************ (759) (611) (812)
Net cash used in investing activities **************************************************************** $(16,996) $ (3,165) $ (1,232)
See accompanying notes to consolidated financial statements.
F-6
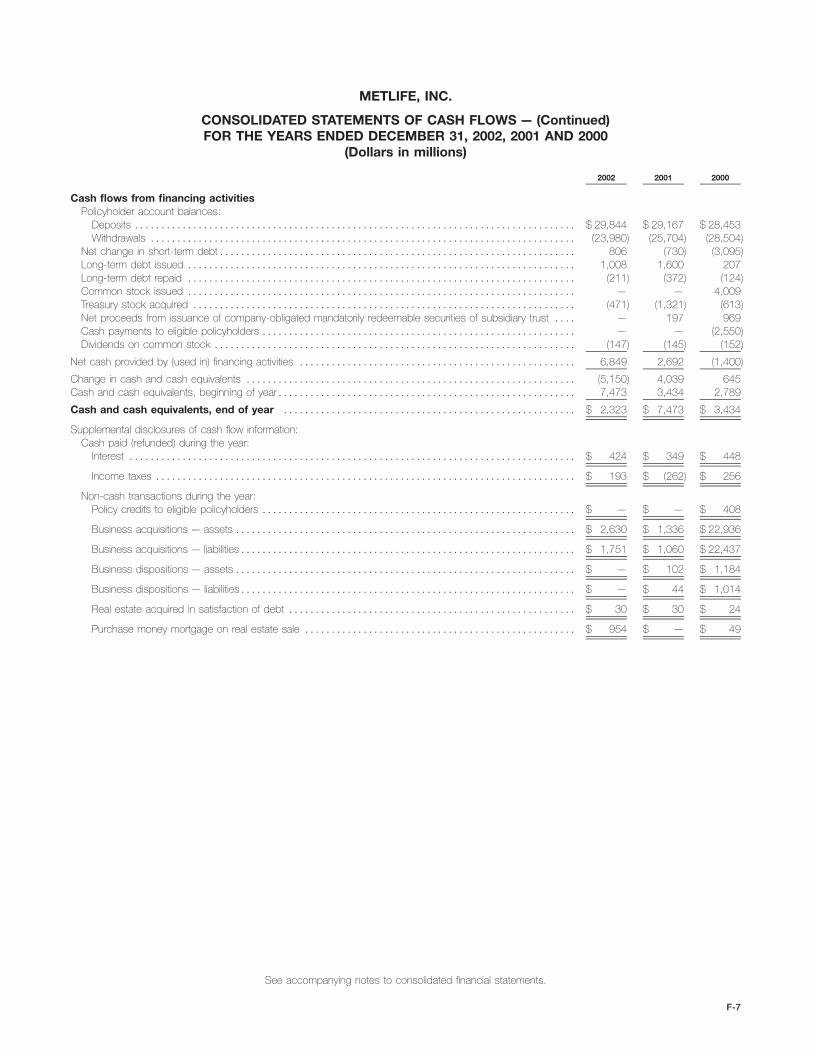
METLIFE, INC.
CONSOLIDATED STATEMENTS OF CASH FLOWS — (Continued)FOR THE YEARS ENDED DECEMBER 31, 2002, 2001 AND 2000
(Dollars in millions)
2002 2001 2000
Cash flows from financing activitiesPolicyholder account balances:
Deposits *********************************************************************************** $ 29,844 $ 29,167 $ 28,453Withdrawals ******************************************************************************** (23,980) (25,704) (28,504)
Net change in short-term debt******************************************************************* 806 (730) (3,095)Long-term debt issued ************************************************************************* 1,008 1,600 207Long-term debt repaid ************************************************************************* (211) (372) (124)Common stock issued ************************************************************************* — — 4,009Treasury stock acquired ************************************************************************ (471) (1,321) (613)Net proceeds from issuance of company-obligated mandatorily redeemable securities of subsidiary trust **** — 197 969Cash payments to eligible policyholders *********************************************************** — — (2,550)Dividends on common stock ******************************************************************** (147) (145) (152)
Net cash provided by (used in) financing activities **************************************************** 6,849 2,692 (1,400)
Change in cash and cash equivalents ************************************************************** (5,150) 4,039 645Cash and cash equivalents, beginning of year******************************************************** 7,473 3,434 2,789
Cash and cash equivalents, end of year ******************************************************* $ 2,323 $ 7,473 $ 3,434
Supplemental disclosures of cash flow information:Cash paid (refunded) during the year:
Interest ************************************************************************************ $ 424 $ 349 $ 448
Income taxes ******************************************************************************* $ 193 $ (262) $ 256
Non-cash transactions during the year:Policy credits to eligible policyholders *********************************************************** $ — $ — $ 408
Business acquisitions — assets **************************************************************** $ 2,630 $ 1,336 $ 22,936
Business acquisitions — liabilities*************************************************************** $ 1,751 $ 1,060 $ 22,437
Business dispositions — assets **************************************************************** $ — $ 102 $ 1,184
Business dispositions — liabilities*************************************************************** $ — $ 44 $ 1,014
Real estate acquired in satisfaction of debt ****************************************************** $ 30 $ 30 $ 24
Purchase money mortgage on real estate sale *************************************************** $ 954 $ — $ 49
See accompanying notes to consolidated financial statements.
F-7

METLIFE, INC.
NOTES TO CONSOLIDATED FINANCIAL STATEMENTS1. Summary of Accounting Policies
BusinessMetLife, Inc. (the ‘‘Holding Company’’) and its subsidiaries (together with the Holding Company, ‘‘MetLife’’ or the ‘‘Company’’) is a leading provider of
insurance and other financial services to a broad section of individual and institutional customers. The Company offers life insurance, annuities,automobile and property insurance and mutual funds to individuals and group insurance, reinsurance, as well as retirement and savings products andservices to corporations and other institutions.
Basis of PresentationThe accompanying consolidated financial statements include the accounts of the Holding Company and its subsidiaries, partnerships and joint
ventures in which the Company has a majority voting interest. Closed block assets, liabilities, revenues and expenses are combined on a line by linebasis with the assets, liabilities, revenues and expenses outside the closed block based on the nature of the particular item. See Note 7. Intercompanyaccounts and transactions have been eliminated.
The Company uses the equity method of accounting for investments in real estate joint ventures and other limited partnership interests in which ithas more than a minor interest, has influence over the partnership’s operating and financial policies and does not have a controlling interest. TheCompany uses the cost method for minor interest investments and when it has virtually no influence over the partnership’s operating and financialpolicies.
Minority interest related to consolidated entities included in other liabilities was $491 million and $442 million at December 31, 2002 and 2001,respectively.
Certain amounts in the prior years’ consolidated financial statements have been reclassified to conform with the 2002 presentation.
Summary of Critical Accounting EstimatesThe preparation of financial statements in conformity with accounting principles generally accepted in the United States of America (‘‘GAAP’’) requires
management to adopt accounting policies and make estimates and assumptions that affect amounts reported in the consolidated financial statements.The critical accounting policies, estimates and related judgments underlying the Company’s consolidated financial statements are summarized below. Inapplying these policies, management makes subjective and complex judgments that frequently require estimates about matters that are inherentlyuncertain. Many of these policies, estimates and related judgments are common in the insurance and financial services industries; others are specific tothe Company’s businesses and operations.
InvestmentsThe Company’s principal investments are in fixed maturities, mortgage loans and real estate, all of which are exposed to three primary sources of
investment risk: credit, interest rate and market valuation. The financial statement risks are those associated with the recognition of impairments andincome, as well as the determination of fair values. The assessment of whether impairments have occurred is based on management’s case-by-caseevaluation of the underlying reasons for the decline in fair value. Management considers a wide range of factors about the security issuer and uses itsbest judgment in evaluating the cause of the decline in the estimated fair value of the security and in assessing the prospects for near-term recovery.Inherent in management’s evaluation of the security are assumptions and estimates about the operations of the issuer and its future earnings potential.Considerations used by the Company in the impairment evaluation process include, but are not limited to: (i) the length of time and the extent to which themarket value has been below amortized cost; (ii) the potential for impairments of securities when the issuer is experiencing significant financial difficulties;(iii) the potential for impairments in an entire industry sector or sub-sector; (iv) the potential for impairments in certain economically depressed geographiclocations; (v) the potential for impairments of securities where the issuer, series of issuers or industry has suffered a catastrophic type of loss or hasexhausted natural resources; and (vi) other subjective factors, including concentrations and information obtained from regulators and rating agencies. Inaddition, the earnings on certain investments are dependent upon market conditions, which could result in prepayments and changes in amounts to beearned due to changing interest rates or equity markets. The determination of fair values in the absence of quoted market values is based on valuationmethodologies, securities the Company deems to be comparable and assumptions deemed appropriate given the circumstances. The use of differentmethodologies and assumptions may have a material effect on the estimated fair value amounts.
DerivativesThe Company enters into freestanding derivative transactions primarily to manage the risk associated with variability in cash flows related to the
Company’s financial assets and liabilities or to changing fair values. The Company also purchases investment securities and issues certain insurance andreinsurance policies with embedded derivatives. The associated financial statement risk is the volatility in net income, which can result from (i) changes infair value of derivatives not qualifying as accounting hedges, and (ii) ineffectiveness of designated hedges in an environment of changing interest rates orfair values. In addition, accounting for derivatives is complex, as evidenced by significant authoritative interpretations of the primary accounting standardswhich continue to evolve, as well as the significant judgments and estimates involved in determining fair value in the absence of quoted market values.These estimates are based on valuation methodologies and assumptions deemed appropriate in the circumstances. Such assumptions includeestimated market volatility and interest rates used in the determination of fair value where quoted market values are not available. The use of differentassumptions may have a material effect on the estimated fair value amounts.
Deferred Policy Acquisition CostsThe Company incurs significant costs in connection with acquiring new insurance business. These costs, which vary with, and are primarily related
to, the production of new business, are deferred. The recovery of such costs is dependent upon the future profitability of the related business. Theamount of future profit is dependent principally on investment returns, mortality, morbidity, persistency, expenses to administer the business, creditworthi-ness of reinsurance counterparties and certain economic variables, such as inflation. Of these factors, the Company anticipates that investment returnsare most likely to impact the rate of amortization of such costs. The aforementioned factors enter into management’s estimates of gross margins andprofits, which generally are used to amortize such costs. Revisions to estimates result in changes to the amounts expensed in the reporting period inwhich the revisions are made and could result in the impairment of the asset and a charge to income if estimated future gross margins and profits are lessthan amounts deferred. In addition, the Company utilizes the reversion to the mean assumption, a standard industry practice, in its determination of the
F-8
METLIFE, INC.
NOTES TO CONSOLIDATED FINANCIAL STATEMENTS — (Continued)
amortization of deferred policy acquisition costs. This practice assumes that the expectation for long-term appreciation in equity markets is not changedby minor short-term market fluctuations, but that it does change when large interim deviations have occurred.
Future Policy Benefits
The Company establishes liabilities for amounts payable under insurance policies, including traditional life insurance, annuities and disabilityinsurance. Generally, amounts are payable over an extended period of time and the profitability of the products is dependent on the pricing of theproducts. Principal assumptions used in pricing policies and in the establishment of liabilities for future policy benefits are mortality, morbidity, expenses,persistency, investment returns and inflation.
The Company also establishes liabilities for unpaid claims and claims expenses for property and casualty insurance. Pricing of this insurance takesinto account the expected frequency and severity of losses, the costs of providing coverage, competitive factors, characteristics of the insured and theproperty covered, and profit considerations. Liabilities for property and casualty insurance are dependent on estimates of amounts payable for claimsreported but not settled and claims incurred but not reported. These estimates are influenced by historical experience and actuarial assumptions ofcurrent developments, anticipated trends and risk management strategies.
Differences between the actual experience and assumptions used in pricing these policies and in the establishment of liabilities result in variances inprofit and could result in losses.
Reinsurance
The Company enters into reinsurance transactions as both a provider and a purchaser of reinsurance. Accounting for reinsurance requires extensiveuse of assumptions and estimates, particularly related to the future performance of the underlying business and the potential impact of counterparty creditrisks. The Company periodically reviews actual and anticipated experience compared to the aforementioned assumptions used to establish policybenefits and evaluates the financial strength of counterparties to its reinsurance agreements using criteria similar to that evaluated in the securityimpairment process discussed above. Additionally, for each of its reinsurance contracts, the Company must determine if the contract providesindemnification against loss or liability relating to insurance risk, in accordance with applicable accounting standards. The Company must review allcontractual features, particularly those that may limit the amount of insurance risk to which the Company is subject or features that delay the timelyreimbursement of claims. If the Company determines that a contract does not expose it to a reasonable possibility of a significant loss from insurance risk,the Company records the contract using the deposit method of accounting.
Litigation
The Company is a party to a number of legal actions. Given the inherent unpredictability of litigation, it is difficult to estimate the impact of litigation onthe Company’s consolidated financial position. Liabilities are established when it is probable that a loss has been incurred and the amount of the loss canbe reasonably estimated. Liabilities related to certain lawsuits, including the Company’s asbestos-related liability, are especially difficult to estimate due tothe limitation of available data and uncertainty regarding numerous variables used to determine amounts recorded. The data and variables that impact theassumption used to estimate the Company’s asbestos-related liability include the number of future claims, the cost to resolve claims, the disease mixand severity of disease, the jurisdiction of claims filed, tort reform efforts and the impact of any possible future adverse verdicts and their amounts. It ispossible that an adverse outcome in certain of the Company’s litigation, including asbestos-related cases, or the use of different assumptions in thedetermination of amounts recorded could have a material effect upon the Company’s consolidated net income or cash flows in particular quarterly orannual periods.
Employee Benefit Plans
The Company sponsors pension and other retirement plans in various forms covering employees who meet specified eligibility requirements. Thereported expense and liability associated with these plans requires an extensive use of assumptions which include the discount rate, expected return onplan assets and rate of future compensation increases as determined by the Company. Management determines these assumptions based uponcurrently available market and industry data, historical performance of the plan and its assets, and consultation with an independent consulting actuarialfirm to aid it in selecting appropriate assumptions and valuing its related liabilities. The actuarial assumptions used by the Company may differ materiallyfrom actual results due to changing market and economic conditions, higher or lower withdrawal rates or longer or shorter life spans of the participants.These differences may have a significant effect on the Company’s consolidated financial statements and liquidity.
The actuarial assumptions used in the calculation of the Company’s aggregate projected benefit obligation may vary and include an expectation oflong-term market appreciation in equity markets which is not changed by minor short-term market fluctuations, but does change when large interimdeviations occur. For the largest of the plans sponsored by the Company (the Metropolitan Life Retirement Plan for United States Employees, with aprojected benefit obligation of $4.3 billion or 98.6% of all qualified plans at December 31, 2002), the discount rate, expected rate of return on plan assets,and the range of rates of future compensation increases used in that plan’s valuation at December 31, 2002 were 6.75%, 9% and 4% to 8%,respectively. Note 6 describes in more detail the assumptions used and status of the many plans sponsored by the Company and its affiliates.
Significant Accounting Policies
Investments
The Company’s fixed maturity and equity securities are classified as available-for-sale and are reported at their estimated fair value. Unrealizedinvestment gains and losses on securities are recorded as a separate component of other comprehensive income or loss, net of policyholder relatedamounts and deferred income taxes. The cost of fixed maturity and equity securities is adjusted for impairments in value deemed to be other-than-temporary. These adjustments are recorded as investment losses. Investment gains and losses on sales of securities are determined on a specificidentification basis. All security transactions are recorded on a trade date basis.
Mortgage loans on real estate are stated at amortized cost, net of valuation allowances. Valuation allowances are established for the excess carryingvalue of the mortgage loan over its estimated fair value when it is probable that, based upon current information and events, the Company will be unableto collect all amounts due under the contractual terms of the loan agreement. Valuation allowances are included in net investment gains and losses and
MetLife, Inc. F-9
METLIFE, INC.
NOTES TO CONSOLIDATED FINANCIAL STATEMENTS — (Continued)
are based upon the present value of expected future cash flows discounted at the loan’s original effective interest rate or the collateral value if the loan iscollateral dependent. Interest income earned on impaired loans is accrued on the principal amount of the loan based on the loan’s contractual interestrate. However, interest ceases to be accrued for loans on which interest is generally more than 60 days past due and/or where the collection of interest isnot considered probable. Cash receipts on impaired loans are recorded as a reduction of the recorded asset.
Real estate held-for-investment, including related improvements, is stated at cost less accumulated depreciation. Depreciation is provided on astraight-line basis over the estimated useful life of the asset (typically 20 to 40 years). Real estate held-for-sale is stated at the lower of depreciated cost orfair value less expected disposition costs. Real estate is not depreciated while it is classified as held-for-sale. Cost of real estate held-for-investment isadjusted for impairment whenever events or changes in circumstances indicate the carrying amount of the asset may not be recoverable. Impaired realestate is written down to estimated fair value with the impairment loss being included in net investment gains and losses. Impairment losses are basedupon the estimated fair value of real estate, which is generally computed using the present value of expected future cash flows from the real estatediscounted at a rate commensurate with the underlying risks. Real estate acquired upon foreclosure of commercial and agricultural mortgage loans isrecorded at the lower of estimated fair value or the carrying value of the mortgage loan at the date of foreclosure.
Policy loans are stated at unpaid principal balances.Short-term investments are stated at amortized cost, which approximates fair value.Other invested assets consist principally of leveraged leases and funds withheld at interest. The leveraged leases are recorded net of non-recourse
debt. The Company participates in lease transactions which are diversified by geographic area. The Company regularly reviews residual values and writesdown residuals to expected values as needed. Funds withheld represent amounts contractually withheld by ceding companies in accordance withreinsurance agreements. For agreements written on a modified coinsurance basis and certain agreements written on a coinsurance basis, assetssupporting the reinsured policies and equal to the net statutory reserves are withheld and continue to be legally owned by the ceding companies. TheCompany recognizes interest on funds withheld in accordance with the treaty terms as investment income is earned on the assets supporting thereinsured policies.
Structured Investment Transactions and Variable Interest Entities
The Company participates in structured investment transactions, primarily asset securitizations and structured notes. These transactions enhancethe Company’s total return of the investment portfolio principally by generating management fee income on asset securitizations and by providing equity-based returns on debt securities through structured notes and similar type instruments.
The Company sponsors financial asset securitizations of high yield debt securities, investment grade bonds and structured finance securities andalso is the collateral manager and a beneficial interest holder in such transactions. As the collateral manager, the Company earns management fees onthe outstanding securitized asset balance, which are recorded in income as earned. When the Company transfers assets to a bankruptcy-remote specialpurpose entity (‘‘SPE’’) and surrenders control over the transferred assets, the transaction is accounted for as a sale. Gains or losses on securitizationsare determined with reference to the carrying amount of the financial assets transferred, which is allocated to the assets sold and the beneficial interestsretained based on relative fair values at the date of transfer. Beneficial interests in securitizations are carried at fair value in fixed maturities. Income on thebeneficial interests is recognized using the prospective method in accordance with Emerging Issues Task Force (‘‘EITF’’) Issue No. 99-20, Recognition ofInterest Income and Impairment on Certain Investments (‘‘EITF 99-20’’). The SPEs used to securitize assets are not consolidated by the Companybecause unrelated third parties hold controlling interests through ownership of equity in the SPEs, representing at least three percent of the value of thetotal assets of the SPE throughout the life of the SPE, and such equity class has the substantive risks and rewards of the residual interest of the SPE.
The Company purchases or receives beneficial interests in SPEs, which generally acquire financial assets, including corporate equities, debtsecurities and purchased options. The Company has not guaranteed the performance, liquidity or obligations of the SPEs and the Company’s exposureto loss is limited to its carrying value of the beneficial interests in the SPEs. The Company uses the beneficial interests as part of its risk managementstrategy, including asset-liability management. These SPEs are not consolidated by the Company because unrelated third parties hold controllinginterests through ownership of equity in the SPEs, representing at least three percent of the value of the total assets of the SPE throughout the life of theSPE, and such equity class has the substantive risks and rewards of the residual interest of the SPE. The beneficial interests in SPEs where the Companyexercises significant influence over the operating and financial policies of the SPE are accounted for in accordance with the equity method of accounting.Impairments of these beneficial interests are included in net investment gains and losses. The beneficial interests in SPEs where the Company does notexercise significant influence are accounted for based on the substance of the beneficial interest’s rights and obligations. Beneficial interests areaccounted for and are included in fixed maturities. These beneficial interests are generally structured notes, as defined by EITF Issue No. 96-12,Recognition of Interest Income and Balance Sheet Classification of Structured Notes, and their income is recognized using the retrospective interestmethod or the level yield method, as appropriate.
Effective in 2003, Financial Accounting Standards Board (‘‘FASB’’) Interpretation No. 46, Consolidation of Variable Interest Entities, an Interpretation ofAPB No. 51 (‘‘FIN 46’’) will establish new accounting guidance relating to the consolidation of variable interest entities (‘‘VIEs’’). Certain of the asset-backed securitizations and structured investment transactions discussed above meet the definition of a VIE under FIN 46. In addition, certain investmentsin real estate joint ventures and other limited partnership interests also meet the VIE definition. The Company will be required to consolidate any VIE forwhich it is determined that the Company is the primary beneficiary. The Company is still in the process of evaluating its investments with regard to theimplementation of FIN 46.
MetLife, Inc.F-10

METLIFE, INC.
NOTES TO CONSOLIDATED FINANCIAL STATEMENTS — (Continued)
The following table presents the total assets and the maximum exposure to loss relating to the VIEs that the Company believes it is reasonablypossible it will need to consolidate or disclose information about in accordance with the provisions of FIN 46 at:
December 31, 2002
MaximumTotal Exposure to
Assets Loss
(Dollars in millions)
Financial asset-backed securitizations and collateralized debt and bond obligations********************************* $1,719 $ 9(1)Other structured investment transactions*************************************************************** 89 38(2)Real estate joint ventures**************************************************************************** 443 196(3)Other limited partnership interests ******************************************************************** 872 167(3)
Total ************************************************************************************* $3,123 $410
(1) The maximum exposure to loss is based on the carrying value of retained interests.(2) The maximum exposure to loss is based on the carrying value of beneficial interests.(3) The maximum exposure to loss is based on the carrying value plus unfunded commitments reduced by amounts guaranteed by other partners.
Derivative Instruments
The Company uses derivative instruments to manage risk through one of four principal risk management strategies: (i) the hedging of liabilities,(ii) invested assets, (iii) portfolios of assets or liabilities and (iv) firm commitments and forecasted transactions. Additionally, the Company enters intoincome generation and replication derivative transactions as permitted by its derivatives use plan that was approved by the New York InsuranceDepartment (the ‘‘Department’’). The Company’s derivative hedging strategy employs a variety of instruments, including financial futures, financialforwards, interest rate, credit default and foreign currency swaps, foreign currency forwards, and options, including caps and floors.
On the date the Company enters into a derivative contract, management designates the derivative as a hedge of the identified exposure (fair value,cash flow or foreign currency). If a derivative does not qualify as a hedge, according to Statement of Financial Accounting Standards (‘‘SFAS’’) No. 133,Accounting for Derivative Instruments and Hedging Activities, as amended (‘‘SFAS 133’’), the derivative is recorded at fair value and changes in its fairvalue are generally reported in net investment gains or losses.
The Company formally documents all relationships between hedging instruments and hedged items, as well as its risk management objective andstrategy for undertaking various hedge transactions. In this documentation, the Company specifically identifies the asset, liability, firm commitment, orforecasted transaction that has been designated as a hedged item and states how the hedging instrument is expected to hedge the risks related to thehedged item. The Company formally measures effectiveness of its hedging relationships both at the hedge inception and on an ongoing basis inaccordance with its risk management policy. The Company generally determines hedge effectiveness based on total changes in fair value of a derivativeinstrument. The Company discontinues hedge accounting prospectively when: (i) it is determined that the derivative is no longer effective in offsettingchanges in the fair value or cash flows of a hedged item, (ii) the derivative expires or is sold, terminated, or exercised, (iii) the derivative is de-designatedas a hedge instrument, (iv) it is probable that the forecasted transaction will not occur, (v) a hedged firm commitment no longer meets the definition of afirm commitment, or (vi) management determines that designation of the derivative as a hedge instrument is no longer appropriate.
The Company designates and accounts for the following as cash flow hedges, when they have met the effectiveness requirements of SFAS 133:(i) various types of interest rate swaps to convert floating rate investments to fixed rate investments, (ii) receive U.S. dollar fixed on foreign currency swapsto hedge the foreign currency cash flow exposure of foreign currency denominated investments, (iii) foreign currency forwards to hedge the exposure offuture payments or receipts in foreign currencies, and (iv) other instruments to hedge the cash flows of various other forecasted transactions. For allqualifying and highly effective cash flow hedges, the effective portion of changes in fair value of the derivative instrument is reported in othercomprehensive income or loss. The ineffective portion of changes in fair value of the derivative instrument is reported in net investment gains or losses.Hedged forecasted transactions, other than the receipt or payment of variable interest payments, are not expected to occur more than 12 months afterhedge inception.
The Company designates and accounts for the following as fair value hedges when they have met the effectiveness requirements of SFAS 133:(i) various types of interest rate swaps to convert fixed rate investments to floating rate investments, (ii) receive U.S. dollar floating on foreign currencyswaps to hedge the foreign currency fair value exposure of foreign currency denominated investments, and (iii) other instruments to hedge various otherfair value exposures of investments. For all qualifying and highly effective fair value hedges, the changes in fair value of the derivative instrument arereported as net investment gains or losses. In addition, changes in fair value attributable to the hedged portion of the underlying instrument are reported innet investment gains and losses.
When hedge accounting is discontinued because it is determined that the derivative no longer qualifies as an effective fair value hedge, the derivativecontinues to be carried on the consolidated balance sheet at its fair value, but the hedged asset or liability will no longer be adjusted for changes in fairvalue. When hedge accounting is discontinued because the hedged item no longer meets the definition of a firm commitment, the derivative continues tobe carried on the consolidated balance sheet at its fair value, and any asset or liability that was recorded pursuant to recognition of the firm commitment isremoved from the consolidated balance sheet and recognized as a net investment gain or loss in the current period. When hedge accounting isdiscontinued because it is probable that a forecasted transaction will not occur, the derivative continues to be carried on the consolidated balance sheetat its fair value, and gains and losses that were accumulated in other comprehensive income or loss are recognized immediately in net investment gainsor losses. When the hedged forecasted transaction is no longer probable, but is reasonably possible, the accumulated gain or loss remains in othercomprehensive income or loss and is recognized when the transaction affects net income or loss; however, prospective hedge accounting for thetransaction is terminated. In all other situations in which hedge accounting is discontinued, the derivative is carried at its fair value on the consolidatedbalance sheet, with changes in its fair value generally recognized in the current period as net investment gains or losses.
MetLife, Inc. F-11
METLIFE, INC.
NOTES TO CONSOLIDATED FINANCIAL STATEMENTS — (Continued)
The Company may enter into contracts that are not themselves derivative instruments but contain embedded derivatives. For each contract, theCompany assesses whether the economic characteristics of the embedded derivative are clearly and closely related to those of the host contract anddetermines whether a separate instrument with the same terms as the embedded instrument would meet the definition of a derivative instrument.
If it is determined that the embedded derivative possesses economic characteristics that are not clearly and closely related to the economiccharacteristics of the host contract, and that a separate instrument with the same terms would qualify as a derivative instrument, the embedded derivativeis separated from the host contract and accounted for as a stand-alone derivative. Such embedded derivatives are recorded on the consolidatedbalance sheet at fair value and changes in their fair value are recorded currently in net investment gains or losses. If the Company is unable to properlyidentify and measure an embedded derivative for separation from its host contract, the entire contract is carried on the consolidated balance sheet at fairvalue, with changes in fair value recognized in the current period as net investment gains or losses.
The Company also uses derivatives to synthetically create investments that are either more expensive to acquire or otherwise unavailable in the cashmarkets. These securities, called replication synthetic asset transactions (‘‘RSATs’’), are a combination of a derivative and a cash security to syntheticallycreate a third replicated security. These derivatives are not designated as hedges. As of December 31, 2002 and 2001, 19 and 15, respectively, of suchRSATs, with notional amounts totaling $285 million and $205 million, respectively, have been created through the combination of a credit default swapand a U.S. Treasury security. The Company records the premiums received on the credit default swaps in investment income over the life of the contractand changes in fair value are recorded in net investment gains and losses.
The Company enters into written covered calls and net written covered collars to generate additional investment income on the underlying assets itholds. These derivatives are not designated as hedges. The Company records the premiums received as net investment income over the life of thecontract and changes in fair value of such options and collars as net investment gains and losses.
Cash and Cash Equivalents
The Company considers all investments purchased with an original maturity of three months or less to be cash equivalents.
Property, Equipment, Leasehold Improvements and Computer Software
Property, equipment and leasehold improvements, which are included in other assets, are stated at cost, less accumulated depreciation andamortization. Depreciation is determined using either the straight-line or sum-of-the-years-digits method over the estimated useful lives of the assets. Theestimated life for company occupied real estate property is 40 years. Estimated lives range from five to ten years for leasehold improvements and three tofive years for all other property and equipment. Accumulated depreciation and amortization of property, equipment and leasehold improvements was$428 million and $552 million at December 31, 2002 and 2001, respectively. Related depreciation and amortization expense was $85 million, $99 millionand $90 million for the years ended December 31, 2002, 2001 and 2000, respectively.
Computer software, which is included in other assets, is stated at cost, less accumulated amortization. Purchased software costs, as well as internaland external costs incurred to develop internal-use computer software during the application development stage, are capitalized. Such costs areamortized generally over a three-year period using the straight-line method. Accumulated amortization of capitalized software was $317 million and$169 million at December 31, 2002 and 2001, respectively. Related amortization expense was $155 million, $110 million and $45 million for the yearsended December 31, 2002, 2001 and 2000, respectively.
Deferred Policy Acquisition Costs
The costs of acquiring new insurance business that vary with, and are primarily related to, the production of new business are deferred. Such costs,which consist principally of commissions, agency and policy issue expenses, are amortized with interest over the expected life of the contract forparticipating traditional life, universal life and investment-type products. Generally, deferred policy acquisition costs are amortized in proportion to thepresent value of estimated gross margins or profits from investment, mortality, expense margins and surrender charges. Interest rates are based on ratesin effect at the inception or acquisition of the contracts.
Actual gross margins or profits can vary from management’s estimates resulting in increases or decreases in the rate of amortization. Managementutilizes the reversion to the mean assumption, a standard industry practice, in its determination of the amortization of deferred policy acquisition costs.This practice assumes that the expectation for long-term appreciation is not changed by minor short-term market fluctuations, but that it does changewhen large interim deviations have occurred. Management periodically updates these estimates and evaluates the recoverability of deferred policyacquisition costs. When appropriate, management revises its assumptions of the estimated gross margins or profits of these contracts, and thecumulative amortization is re-estimated and adjusted by a cumulative charge or credit to current operations.
Deferred policy acquisition costs for non-participating traditional life, non-medical health and annuity policies with life contingencies are amortized inproportion to anticipated premiums. Assumptions as to anticipated premiums are made at the date of policy issuance or acquisition and are consistentlyapplied during the lives of the contracts. Deviations from estimated experience are included in operations when they occur. For these contracts, theamortization period is typically the estimated life of the policy.
Policy acquisition costs related to internally replaced contracts are expensed at the date of replacement.Deferred policy acquisition costs for property and casualty insurance contracts, which are primarily comprised of commissions and certain
underwriting expenses, are deferred and amortized on a pro rata basis over the applicable contract term or reinsurance treaty.Value of business acquired (‘‘VOBA’’), included as part of deferred policy acquisition costs, represents the present value of future profits generated
from existing insurance contracts in force at the date of acquisition and is amortized over the expected policy or contract duration in relation to the presentvalue of estimated gross profits from such policies and contracts.
MetLife, Inc.F-12

METLIFE, INC.
NOTES TO CONSOLIDATED FINANCIAL STATEMENTS — (Continued)
Information regarding VOBA and deferred policy acquisition costs for the year ended December 31, 2002 is as follows:
Value of DeferredBusiness Policy AcquisitionAcquired Costs Total
(Dollars in millions)
Balance at January 1, 2002 ***************************************************** $1,678 $ 9,489 $11,167Capitalizations ***************************************************************** — 2,340 2,340Acquisitions******************************************************************* 369 — 369
Total ***************************************************************** 2,047 11,829 13,876
Amortization allocated to:Net investment gains (losses) ************************************************** 16 (11) 5Unrealized investment gains *************************************************** 154 384 538Other expenses ************************************************************* 132 1,507 1,639
Total amortization ****************************************************** 302 1,880 2,182Dispositions and other ********************************************************** (6) 39 33
Balance at December 31, 2002************************************************** $1,739 $ 9,988 $11,727
Information regarding VOBA and deferred policy acquisition costs for the year ended December 31, 2001 is as follows:
Value of DeferredBusiness PolicyAcquired Acquisition Costs Total
(Dollars in millions)
Balance at January 1, 2001 ***************************************************** $1,674 $ 8,944 $10,618Capitalizations ***************************************************************** — 2,039 2,039Acquisitions******************************************************************* 124 — 124
Total ***************************************************************** 1,798 10,983 12,781
Amortization allocated to:Net investment (losses) gains ************************************************** (15) 40 25Unrealized investment gains *************************************************** 8 132 140Other expenses ************************************************************* 126 1,287 1,413
Total amortization ****************************************************** 119 1,459 1,578Dispositions and other ********************************************************** (1) (35) (36)
Balance at December 31, 2001************************************************** $1,678 $ 9,489 $11,167
Information regarding VOBA and deferred policy acquisition costs for the year ended December 31, 2000 is as follows:
Value of DeferredBusiness PolicyAcquired Acquisition Costs Total
(Dollars in millions)
Balance at January 1, 2000 ***************************************************** $ 632 $ 8,438 $ 9,070Capitalizations ***************************************************************** — 1,863 1,863Acquisitions******************************************************************* 1,480 201 1,681
Total ***************************************************************** 2,112 10,502 12,614
Amortization allocated to:Net investment gains (losses) ************************************************** 28 (123) (95)Unrealized investment gains *************************************************** 93 497 590Other expenses ************************************************************* 310 1,168 1,478
Total amortization ****************************************************** 431 1,542 1,973Dispositions and other ********************************************************** (7) (16) (23)
Balance at December 31, 2000************************************************** $1,674 $ 8,944 $10,618
The estimated future amortization expense allocated to other expenses for VOBA is $147 million in 2003, $141 million in 2004, $137 million in 2005,$135 million in 2006 and $128 million in 2007.
Amortization of VOBA and deferred policy acquisition costs is allocated to (i) investment gains and losses to provide consolidated statement ofincome information regarding the impact of such gains and losses on the amount of the amortization, (ii) unrealized investment gains and losses toprovide information regarding the amount that would have been amortized if such gains and losses had been recognized, and (iii) other expenses toprovide amounts related to the gross margins or profits originating from transactions other than investment gains and losses.
Investment gains and losses related to certain products have a direct impact on the amortization of VOBA and deferred policy acquisition costs.Presenting investment gains and losses net of related amortization of VOBA and deferred policy acquisition costs provides information useful in evaluatingthe operating performance of the Company. This presentation may not be comparable to presentations made by other insurers.
MetLife, Inc. F-13

METLIFE, INC.
NOTES TO CONSOLIDATED FINANCIAL STATEMENTS — (Continued)
Goodwill
The excess of cost over the fair value of net assets acquired (‘‘goodwill’’) is included in other assets. On January 1, 2002, the Company adopted theprovisions of SFAS No. 142, Goodwill and Other Intangible Assets, (‘‘SFAS 142’’). In accordance with SFAS 142, goodwill is not amortized but is testedfor impairment at least annually to determine if a write down of the cost of the asset is required. Impairments are recognized in operating results when thecarrying amount of goodwill exceeds its implied fair value. Prior to the adoption of SFAS 142, goodwill was amortized on a straight-line basis over a periodranging from ten to 30 years and impairments were recognized in operating results when permanent diminution in value was deemed to have occurred.
Changes in goodwill were as follows:Years Ended December 31,
2002 2001 2000
(Dollars in millions)
Net balance at January 1 ************************************************************************ $609 $703 $ 611Acquisitions************************************************************************************ 166 54 286Amortization************************************************************************************ — (47) (50)Impairment losses******************************************************************************* (8) (61) —Dispositions and other *************************************************************************** (17) (40) (144)
Net balance at December 31 ********************************************************************* $750 $609 $ 703
Accumulated amortization from goodwill was as follows at:December 31,
2002 2001
(Dollars in millions)
Accumulated amortization ************************************************************************** $101 $101
Future Policy Benefits and Policyholder Account Balances
Future policy benefit liabilities for participating traditional life insurance policies are equal to the aggregate of (i) net level premium reserves for deathand endowment policy benefits (calculated based upon the nonforfeiture interest rate, ranging from 3% to 11%, and mortality rates guaranteed incalculating the cash surrender values described in such contracts), (ii) the liability for terminal dividends, and (iii) premium deficiency reserves, which areestablished when the liabilities for future policy benefits plus the present value of expected future gross premiums are insufficient to provide for expectedfuture policy benefits and expenses after deferred policy acquisition costs are written off.
Future policy benefit liabilities for traditional annuities are equal to accumulated contractholder fund balances during the accumulation period and thepresent value of expected future payments after annuitization. Interest rates used in establishing such liabilities range from 2% to 11%. Future policybenefit liabilities for non-medical health insurance are calculated using the net level premium method and assumptions as to future morbidity, withdrawalsand interest, which provide a margin for adverse deviation. Interest rates used in establishing such liabilities range from 3% to 11%. Future policy benefitliabilities for disabled lives are estimated using the present value of benefits method and experience assumptions as to claim terminations, expenses andinterest. Interest rates used in establishing such liabilities range from 3% to 11%.
Policyholder account balances for universal life and investment-type contracts are equal to the policy account values, which consist of anaccumulation of gross premium payments plus credited interest, ranging from 1% to 13%, less expenses, mortality charges, and withdrawals.
The liability for unpaid claims and claim expenses for property and casualty insurance represents the amount estimated for claims that have beenreported but not settled and claims incurred but not reported. Liabilities for unpaid claims are estimated based upon the Company’s historical experienceand other actuarial assumptions that consider the effects of current developments, anticipated trends and risk management programs, reduced foranticipated salvage and subrogation. Revisions of these estimates are included in operations in the year such refinements are made.
Recognition of Insurance Revenue and Related Benefits
Premiums related to traditional life and annuity policies with life contingencies are recognized as revenues when due. Benefits and expenses areprovided against such revenues to recognize profits over the estimated lives of the policies. When premiums are due over a significantly shorter periodthan the period over which benefits are provided, any excess profit is deferred and recognized into operations in a constant relationship to insurance in-force or, for annuities, the amount of expected future policy benefit payments.
Premiums related to non-medical health contracts are recognized on a pro rata basis over the applicable contract term.Deposits related to universal life and investment-type products are credited to policyholder account balances. Revenues from such contracts
consist of amounts assessed against policyholder account balances for mortality, policy administration and surrender charges and are recognized in theperiod in which services are provided. Amounts that are charged to operations include interest credited and benefit claims incurred in excess of relatedpolicyholder account balances.
Premiums related to property and casualty contracts are recognized as revenue on a pro rata basis over the applicable contract term. Unearnedpremiums are included in other liabilities.
Other Revenues
Other revenues include asset management and advisory fees, broker/dealer commissions and fees, and administrative service fees. Such fees andcommissions are recognized in the period in which services are performed. Other revenues also include changes in account value relating tocorporate-owned life insurance (‘‘COLI’’). Under certain COLI contracts, if the Company reports certain unlikely adverse results in its consolidated financialstatements, withdrawals would not be immediately available and would be subject to market value adjustment, which could result in a reduction of theaccount value.
MetLife, Inc.F-14

METLIFE, INC.
NOTES TO CONSOLIDATED FINANCIAL STATEMENTS — (Continued)
Policyholder Dividends
Policyholder dividends are approved annually by the insurance subsidiaries’ boards of directors. The aggregate amount of policyholder dividends isrelated to actual interest, mortality, morbidity and expense experience for the year, as well as management’s judgment as to the appropriate level ofstatutory surplus to be retained by the insurance subsidiaries.
Participating Business
Participating business represented approximately 16% and 18% of the Company’s life insurance in-force, and 55% and 78% of the number of lifeinsurance policies in-force, at December 31, 2002 and 2001, respectively. Participating policies represented approximately 43% and 45%, 43% and45%, and 47% and 50% of gross and net life insurance premiums for the years ended December 31, 2002, 2001 and 2000, respectively. Thepercentages indicated are calculated excluding the business of the Reinsurance segment.
Income Taxes
The Holding Company and its includable life insurance and non-life insurance subsidiaries file a consolidated U.S. federal income tax return inaccordance with the provisions of the Internal Revenue Code of 1986, as amended (the ‘‘Code’’). Non-includable subsidiaries file either separate taxreturns or separate consolidated tax returns. Under the Code, the amount of federal income tax expense incurred by mutual life insurance companiesincludes an equity tax calculated based upon a prescribed formula that incorporates a differential earnings rate between stock and mutual life insurancecompanies. Metropolitan Life has not been subject to the equity tax since the date of demutualization. The future tax consequences of temporarydifferences between financial reporting and tax bases of assets and liabilities are measured at the balance sheet dates and are recorded as deferredincome tax assets and liabilities.
Reinsurance
The Company has reinsured certain of its life insurance and property and casualty insurance contracts with other insurance companies undervarious agreements. Amounts due from reinsurers are estimated based upon assumptions consistent with those used in establishing the liabilities relatedto the underlying reinsured contracts. Policy and contract liabilities are reported gross of reinsurance credits. Deferred policy acquisition costs arereduced by amounts recovered under reinsurance contracts. Amounts received from reinsurers for policy administration are reported in other revenues.
The Company assumes and retrocedes financial reinsurance contracts, which represent low mortality risk reinsurance treaties. These contracts arereported as deposits and are included in other assets. The amount of revenue reported on these contracts represents fees and the cost of insuranceunder the terms of the reinsurance agreement.
Separate Accounts
Separate accounts are established in conformity with insurance laws and are generally not chargeable with liabilities that arise from any otherbusiness of the Company. Separate account assets are subject to general account claims only to the extent the value of such assets exceeds theseparate account liabilities. Investments (stated at estimated fair value) and liabilities of the separate accounts are reported separately as assets andliabilities. Deposits to separate accounts, investment income and recognized and unrealized gains and losses on the investments of the separateaccounts accrue directly to contractholders and, accordingly, are not reflected in the Company’s consolidated statements of income and cash flows.Mortality, policy administration and surrender charges to all separate accounts are included in revenues.
Stock Based Compensation
The Company accounts for the stock-based compensation plans using the accounting method prescribed by Accounting Principles Board Opinion(‘‘APB’’) No. 25, Accounting for Stock Issued to Employees (‘‘APB 25’’) and has included in Note 17 the pro forma disclosures required by SFAS No. 123,Accounting for Stock-Based Compensation (‘‘SFAS 123’’).
Foreign Currency Translation
Balance sheet accounts of foreign operations are translated at the exchange rates in effect at each year-end and income and expense accounts aretranslated at the average rates of exchange prevailing during the year. The local currencies of foreign operations are the functional currencies unless thelocal economy is highly inflationary. Translation adjustments are charged or credited directly to other comprehensive income or loss. Gains and lossesfrom foreign currency transactions are reported in earnings.
Discontinued Operations
The results of operations of a component of the Company that either has been disposed of or is classified as held-for-sale on or after January 1,2002 are reported in discontinued operations if the operations and cash flows of the component have been or will be eliminated from the ongoingoperations of the Company as a result of the disposal transaction and the Company will not have any significant continuing involvement in the operationsof the component after the disposal transaction.
Earnings Per Share
Earnings per share amounts, on a basic and diluted basis, have been calculated based upon the weighted average common shares outstanding ordeemed to be outstanding only for the period after the date of demutualization.
Basic earnings per share is computed based on the weighted average number of shares outstanding during the period. Diluted earnings per shareincludes the dilutive effect of the assumed conversion of forward purchase contracts and exercise of stock options, using the treasury stock method.Under the treasury stock method, exercise of the stock options and the forward purchase contracts is assumed with the proceeds used to purchasecommon stock at the average market price for the period. The difference between the number of shares assumed issued and number of sharesassumed purchased represents the dilutive shares.
MetLife, Inc. F-15

METLIFE, INC.
NOTES TO CONSOLIDATED FINANCIAL STATEMENTS — (Continued)
Demutualization and Initial Public Offering
On April 7, 2000 (the ‘‘date of demutualization’’), Metropolitan Life Insurance Company (‘‘Metropolitan Life’’) converted from a mutual life insurancecompany to a stock life insurance company and became a wholly-owned subsidiary of MetLife, Inc. The conversion was pursuant to an order by the NewYork Superintendent of Insurance (the ‘‘Superintendent’’) approving Metropolitan Life’s plan of reorganization, as amended (the ‘‘plan’’).
On the date of demutualization, policyholders’ membership interests in Metropolitan Life were extinguished and eligible policyholders received, inexchange for their interests, trust interests representing 494,466,664 shares of common stock of MetLife, Inc. to be held in a trust, cash paymentsaggregating $2,550 million and adjustments to their policy values in the form of policy credits aggregating $408 million, as provided in the plan. Inaddition, Metropolitan Life’s Canadian branch made cash payments of $327 million in the second quarter of 2000 to holders of certain policiestransferred to Clarica Life Insurance Company in connection with the sale of a substantial portion of Metropolitan Life’s Canadian operations in 1998, as aresult of a commitment made in connection with obtaining Canadian regulatory approval of that sale.
Application of Accounting PronouncementsIn January 2003, the FASB issued FIN 46 which requires certain variable interest entities to be consolidated by the primary beneficiary of the entity if
the equity investors in the entity do not have the characteristics of a controlling financial interest or do not have sufficient equity at risk for the entity tofinance its activities without additional subordinated financial support from other parties. FIN 46 is effective for all new variable interest entities created oracquired after January 31, 2003. For variable interest entities created or acquired prior to February 1, 2003, the provisions of FIN 46 must be applied forthe first interim or annual period beginning after June 15, 2003. The Company is in the process of assessing the impact of FIN 46 on its consolidatedfinancial statements. Certain disclosure provisions of FIN 46 were required for December 31, 2002 financial statements. See ‘‘— Structured InvestmentTransactions and Variable Interest Entities.’’
As of December 31, 2002, the FASB is deliberating on a proposed statement that would further amend SFAS 133. The proposed statement willaddress certain SFAS 133 Implementation Issues. The proposed statement is not expected to have a significant impact on the Company’s consolidatedfinancial statements.
In December 2002, the FASB issued SFAS No. 148, Accounting for Stock-Based Compensation — Transition and Disclosure (‘‘SFAS 148’’), whichprovides guidance on how to transition from the intrinsic value method of accounting for stock-based employee compensation under APB 25 to the fairvalue method of accounting from SFAS 123, if a company so elects. Effective January 1, 2003, the Company adopted the fair value method of recordingstock options under SFAS 123. In accordance with alternatives available under the transitional guidance of SFAS 148, the Company has elected to applythe fair value method of accounting for stock options prospectively to awards granted subsequent to January 1, 2003. As permitted, options grantedprior to January 1, 2003, will continue to be accounted for under APB 25, and the pro forma impact of accounting for these options at fair value willcontinue to be disclosed in the consolidated financial statements until the last of those options vest in 2005.
In November 2002, the FASB issued Interpretation No. 45, Guarantor’s Accounting and Disclosure Requirements for Guarantees Including IndirectGuarantees of Indebtedness of Others (‘‘FIN 45’’). FIN 45 requires entities to establish liabilities for certain types of guarantees, and expands financialstatement disclosures for others. Disclosure requirements under FIN 45 are effective for financial statements of annual periods ending after December 15,2002 and are applicable to all guarantees issued by the guarantor subject to the provisions of FIN 45. The initial recognition and initial measurementprovisions of FIN 45 are applicable on a prospective basis to guarantees issued or modified after December 31, 2002. The Company does not expectthe initial adoption of FIN 45 to have a significant impact on the Company’s consolidated financial statements. The adoption of FIN 45 requires theCompany to include disclosures in its consolidated financial statements related to guarantees. See Note 11.
In June 2002, the FASB issued SFAS No. 146, Accounting for Costs Associated with Exit or Disposal Activities (‘‘SFAS 146’’), which must beadopted for exit and disposal activities initiated after December 31, 2002. SFAS 146 will require that a liability for a cost associated with an exit or disposalactivity be recognized and measured initially at fair value only when the liability is incurred rather than at the date of an entity’s commitment to an exit planas required by EITF 94-3, Liability Recognition for Certain Employee Termination Benefits and Other Costs to Exit an Activity (including Certain CostsIncurred in a Restructuring) (‘‘EITF 94-3’’). As discussed in Note 13, in the fourth quarter of 2001, the Company recorded a charge of $330 million, net ofincome taxes of $169 million, associated with business realignment initiatives using the EITF 94-3 accounting guidance.
In April 2002, the FASB issued SFAS No. 145, Rescission of FASB Statements No. 4, 44, and 64, Amendment of FASB Statement No. 13, andTechnical Corrections (‘‘SFAS 145’’). In addition to amending or rescinding other existing authoritative pronouncements to make various technicalcorrections, clarify meanings, or describe their applicability under changed conditions, SFAS 145 generally precludes companies from recording gainsand losses from the extinguishment of debt as an extraordinary item. SFAS 145 also requires sale-leaseback treatment for certain modifications of acapital lease that result in the lease being classified as an operating lease. SFAS 145 is effective for fiscal years beginning after May 15, 2002, and theinitial application of this standard did not have a significant impact on the Company’s consolidated financial statements.
Effective January 1, 2002, the Company adopted SFAS No. 144, Accounting for the Impairment or Disposal of Long-Lived Assets (‘‘SFAS 144’’).SFAS 144 provides a single model for accounting for long-lived assets to be disposed of by superseding SFAS No. 121, Accounting for the Impairmentof Long-Lived Assets and for Long-Lived Assets to be Disposed Of (‘‘SFAS 121’’), and the accounting and reporting provisions of APB Opinion No. 30,Reporting the Results of Operations — Reporting the Effects of Disposal of a Segment of a Business, and Extraordinary, Unusual and InfrequentlyOccurring Events and Transactions (‘‘APB 30’’). Under SFAS 144, discontinued operations are measured at the lower of carrying value or fair value lesscosts to sell, rather than on a net realizable value basis. Future operating losses relating to discontinued operations also are no longer recognized beforethey occur. SFAS 144 (i) broadens the definition of a discontinued operation to include a component of an entity (rather than a segment of a business);(ii) requires long-lived assets to be disposed of other than by sale to be considered held and used until disposed; and (iii) retains the basic provisions of(a) APB 30 regarding the presentation of discontinued operations in the statements of income, (b) SFAS 121 relating to recognition and measurement ofimpaired long-lived assets (other than goodwill), and (c) SFAS 121 relating to the measurement of long-lived assets classified as held-for-sale. Adoptionof SFAS 144 did not have a material impact on the Company’s consolidated financial statements other than the presentation as discontinued operationsof net investment income and net investment gains related to operations of real estate on which the Company initiated disposition activities subsequent toJanuary 1, 2002 and the classification of such real estate as held-for-sale on the consolidated balance sheets. See Note 22.
MetLife, Inc.F-16

METLIFE, INC.
NOTES TO CONSOLIDATED FINANCIAL STATEMENTS — (Continued)
Effective January 1, 2002, the Company adopted SFAS No. 142, Goodwill and Other Intangible Assets (‘‘SFAS 142’’). SFAS 142 eliminates thesystematic amortization and establishes criteria for measuring the impairment of goodwill and certain other intangible assets by reporting unit. TheCompany did not amortize goodwill during 2002. Amortization of goodwill was $47 million and $50 million for the years ended December 31, 2001 and2000, respectively. Amortization of other intangible assets was not material for the years ended December 31, 2002, 2001 and 2000. The Company hascompleted the required impairment tests of goodwill and indefinite-lived intangible assets. As a result of these tests, the Company recorded a $5 millioncharge to earnings relating to the impairment of certain goodwill assets in the third quarter of 2002 as a cumulative effect of a change in accounting.There was no impairment of identified intangible assets or significant reclassifications between goodwill and other intangible assets at January 1, 2002.
Effective July 1, 2001, the Company adopted SFAS No. 141, Business Combinations (‘‘SFAS 141’’). SFAS 141 requires the purchase method ofaccounting for all business combinations and separate recognition of intangible assets apart from goodwill if such intangible assets meet certain criteria.In accordance with SFAS 141, the elimination of $5 million of negative goodwill was reported in net income in the first quarter of 2002 as a cumulativeeffect of a change in accounting.
In July 2001, the U.S. Securities and Exchange Commission (‘‘SEC’’) released Staff Accounting Bulletin (‘‘SAB’’) No. 102, Selected Loan LossAllowance and Documentation Issues (‘‘SAB 102’’). SAB 102 summarizes certain of the SEC’s views on the development, documentation andapplication of a systematic methodology for determining allowances for loan and lease losses. The application of SAB 102 by the Company did not havea material impact on the Company’s consolidated financial statements.
Effective April 1, 2001, the Company adopted certain additional accounting and reporting requirements of SFAS No. 140, Accounting for Transfersand Servicing of Financial Assets and Extinguishments of Liabilities — a Replacement of FASB Statement No. 125, relating to the derecognition oftransferred assets and extinguished liabilities and the reporting of servicing assets and liabilities. The initial adoption of these requirements did not have amaterial impact on the Company’s consolidated financial statements.
Effective April 1, 2001, the Company adopted EITF 99-20, Recognition of Interest Income and Impairment on Certain Investments. This pronounce-ment requires investors in certain asset-backed securities to record changes in their estimated yield on a prospective basis and to apply specificevaluation methods to these securities for an other-than-temporary decline in value. The initial adoption of EITF 99-20 did not have a material impact onthe Company’s consolidated financial statements.
Effective January 1, 2001, the Company adopted SFAS 133 which established new accounting and reporting standards for derivative instruments,including certain derivative instruments embedded in other contracts, and for hedging activities. The cumulative effect of the adoption of SFAS 133, as ofJanuary 1, 2001, resulted in a $33 million increase in other comprehensive income, net of income taxes of $18 million, and had no material impact on netincome. The increase to other comprehensive income is attributable to net gains on cash flow-type hedges at transition. Also at transition, the amortizedcost of fixed maturities decreased and other invested assets increased by $22 million, representing the fair value of certain interest rate swaps that wereaccounted for prior to SFAS 133 using fair value-type settlement accounting. During the year ended December 31, 2001, $18 million of the pre-tax gainreported in accumulated other comprehensive income at transition was reclassified into net investment income. The FASB continues to issue additionalguidance relating to the accounting for derivatives under SFAS 133, which may result in further adjustments to the Company’s treatment of derivatives insubsequent accounting periods.
Effective October 1, 2000, the Company adopted SAB No. 101, Revenue Recognition in Financial Statements (‘‘SAB 101’’). SAB 101 summarizescertain of the Securities and Exchange Commission’s views in applying GAAP to revenue recognition in financial statements. The requirements ofSAB 101 did not have a material effect on the Company’s consolidated financial statements.
Effective January 1, 2000, the Company adopted Statement of Position (‘‘SOP’’) No. 98-7, Accounting for Insurance and Reinsurance ContractsThat Do Not Transfer Insurance Risk (‘‘SOP 98-7’’). SOP 98-7 provides guidance on the method of accounting for insurance and reinsurance contractsthat do not transfer insurance risk, defined in the SOP as the deposit method. SOP 98-7 classifies insurance and reinsurance contracts for which thedeposit method is appropriate into those that (i) transfer only significant timing risk, (ii) transfer only significant underwriting risk, (iii) transfer neithersignificant timing nor underwriting risk and (iv) have an indeterminate risk. Adoption of SOP 98-7 did not have a material effect on the Company’sconsolidated financial statements.
2. September 11, 2001 TragediesOn September 11, 2001 terrorist attacks occurred in New York, Washington, D.C. and Pennsylvania (the ‘‘tragedies’’) triggering a significant loss of
life and property which had an adverse impact on certain of the Company’s businesses. The Company has direct exposure to these events with claimsarising from its Individual, Institutional, Reinsurance and Auto & Home insurance coverages, and it believes the majority of such claims have beenreported or otherwise analyzed by the Company.
The Company’s original estimate of the total insurance losses related to the tragedies, which was recorded in the third quarter of 2001, was$208 million, net of income taxes of $117 million. Net income for the year ended December 31, 2002 includes a $17 million, net of income taxes of$9 million, benefit from the reduction of the liability associated with the tragedies. The revision to the liability is the result of an analysis completed duringthe fourth quarter of 2002, which focused on the emerging incidence experienced over the past 12 months associated with certain disability products.As of December 31, 2002, the Company’s remaining liability for unpaid and future claims associated with the tragedies was $47 million, principally relatedto disability coverages. This estimate has been and will continue to be subject to revision in subsequent periods, as claims are received from insuredsand the claims to reinsurers are identified and processed. Any revision to the estimate of gross losses and reinsurance recoveries in subsequent periodswill affect net income in such periods. Reinsurance recoveries are dependent on the continued creditworthiness of the reinsurers, which may beadversely affected by their other reinsured losses in connection with the tragedies.
The Company’s general account investment portfolios include investments, primarily comprised of fixed maturities, in industries that were affected bythe tragedies, including airline, other travel, lodging and insurance. Exposures to these industries also exist through mortgage loans and investments inreal estate. The carrying value of the Company’s investment portfolio exposed to industries affected by the tragedies was approximately $3.7 billion atDecember 31, 2002.
The long-term effects of the tragedies on the Company’s businesses cannot be assessed at this time. The tragedies have had significant adverseeffects on the general economic, market and political conditions, increasing many of the Company’s business risks. This may have a negative effect onMetLife’s businesses and results of operations over time. In particular, the declines in share prices experienced after the reopening of the U.S. equitymarkets following the tragedies have contributed, and may continue to contribute, to a decline in separate account assets, which in turn may have anadverse effect on fees earned in the Company’s businesses. In addition, the Company has received and expects to continue to receive disability claimsfrom individuals resulting from the tragedies.
MetLife, Inc. F-17

METLIFE, INC.
NOTES TO CONSOLIDATED FINANCIAL STATEMENTS — (Continued)
3. Investments
Fixed Maturities and Equity SecuritiesFixed maturities and equity securities at December 31, 2002 were as follows:
Cost or Gross UnrealizedAmortized EstimatedCost Gain Loss Fair Value
(Dollars in millions)
Fixed Maturities:Bonds:
U.S. corporate securities************************************************** $ 47,021 $3,193 $ 957 $ 49,257Mortgage-backed securities *********************************************** 33,256 1,649 22 34,883Foreign corporate securities *********************************************** 18,001 1,435 207 19,229U.S. treasuries/agencies ************************************************** 14,373 1,565 4 15,934Asset-backed securities ************************************************** 9,483 228 208 9,503Foreign government securities ********************************************* 7,012 636 52 7,596States and political subdivisions ******************************************** 2,580 182 20 2,742Other fixed income assets ************************************************ 609 191 103 697
Total bonds ********************************************************* 132,335 9,079 1,573 139,841Redeemable preferred stocks************************************************ 817 12 117 712
Total fixed maturities************************************************** $133,152 $9,091 $1,690 $140,553
Equity Securities:Common stocks*********************************************************** $ 877 $ 115 $ 79 $ 913Nonredeemable preferred stocks ********************************************* 426 13 4 435
Total equity securities************************************************* $ 1,303 $ 128 $ 83 $ 1,348
Fixed maturities and equity securities at December 31, 2001 were as follows:
Cost or Gross UnrealizedAmortized EstimatedCost Gain Loss Fair Value
(Dollars in millions)
Fixed Maturities:Bonds:
U.S. corporate securities************************************************** $ 43,141 $1,470 $ 748 $ 43,863Mortgage-backed securities *********************************************** 25,506 866 192 26,180Foreign corporate securities *********************************************** 16,836 688 539 16,985U.S. treasuries/agencies ************************************************** 8,297 1,031 43 9,285Asset-backed securities ************************************************** 8,115 154 206 8,063Foreign government securities ********************************************* 5,488 544 37 5,995States and political subdivisions ******************************************** 2,248 68 21 2,295Other fixed income assets ************************************************ 1,874 238 142 1,970
Total bonds ********************************************************* 111,505 5,059 1,928 114,636Redeemable preferred stocks************************************************ 783 12 33 762
Total fixed maturities************************************************** $112,288 $5,071 $1,961 $115,398
Equity Securities:Common stocks*********************************************************** $ 1,968 $ 657 $ 78 $ 2,547Nonredeemable preferred stocks ********************************************* 491 28 3 516
Total equity securities************************************************* $ 2,459 $ 685 $ 81 $ 3,063
The Company held foreign currency derivatives with notional amounts of $2,371 million and $1,925 million to hedge the exchange rate riskassociated with foreign bonds at December 31, 2002 and 2001, respectively.
The Company held fixed maturities at estimated fair values that were below investment grade or not rated by an independent rating agency thattotaled $11,286 million and $9,790 million at December 31, 2002 and 2001, respectively. Non-income producing fixed maturities were $416 million and$237 million at December 31, 2002 and 2001, respectively.
MetLife, Inc.F-18
METLIFE, INC.
NOTES TO CONSOLIDATED FINANCIAL STATEMENTS — (Continued)
The cost or amortized cost and estimated fair value of bonds at December 31, 2002, by contractual maturity date (excluding scheduled sinkingfunds), are shown below:
Cost orAmortized Estimated
Cost Fair Value
(Dollars in millions)
Due in one year or less *************************************************************** $ 4,592 $ 4,662Due after one year through five years **************************************************** 26,200 27,354Due after five years through ten years**************************************************** 23,297 24,987Due after ten years ******************************************************************* 35,507 38,452
Subtotal ******************************************************************** 89,596 95,455Mortgage-backed and asset-backed securities ******************************************** 42,739 44,386
Subtotal ******************************************************************** 132,335 139,841Redeemable preferred stock *********************************************************** 817 712
Total fixed maturities ********************************************************** $133,152 $140,553
Actual maturities may differ as a result of prepayments by the issuer.Bonds not due at a single maturity date have been included in the above table in the year of final maturity. Actual maturities may differ from
contractual maturities due to the exercise of prepayment options.Sales of fixed maturities and equity securities classified as available-for-sale were as follows:
Years Ended December 31,
2002 2001 2000
(Dollars in millions)
Proceeds ****************************************************************************** $37,427 $28,105 $46,205Gross investment gains ****************************************************************** $ 1,661 $ 646 $ 599Gross investment losses ***************************************************************** $ (979) $ (948) $ (1,520)
Gross investment losses above exclude writedowns recorded during 2002, 2001 and 2000 for other than temporarily impaired available-for-salefixed maturities and equity securities of $1,375 million, $278 million and $324 million, respectively.
Excluding investments in U.S. Treasury securities and obligations of U.S. government corporations and agencies, the Company is not exposed toany significant concentration of credit risk in its fixed maturities portfolio.
Securities Lending ProgramThe Company participates in securities lending programs whereby blocks of securities, which are included in investments, are loaned to third
parties, primarily major brokerage firms. The Company requires a minimum of 102% of the fair value of the loaned securities to be separately maintainedas collateral for the loans. Securities with a cost or amortized cost of $14,873 million and $11,416 million and an estimated fair value of $17,625 millionand $12,066 million were on loan under the program at December 31, 2002 and 2001, respectively. The Company was liable for cash collateral underits control of $17,862 million and $12,661 million at December 31, 2002 and 2001, respectively. Security collateral on deposit from customers may notbe sold or repledged and is not reflected in the consolidated financial statements.
Structured Investment TransactionsThe Company securitizes high yield debt securities, investment grade bonds and structured finance securities. The Company has sponsored five
securitizations with a total of approximately $1,323 million in financial assets as of December 31, 2002. Two of these transactions included the transfer ofassets totaling approximately $289 million in 2001, resulting in the recognition of an insignificant amount of investment gains. The Company’s beneficialinterests in these SPEs as of December 31, 2002 and 2001 and the related investment income for the years ended December 31, 2002, 2001 and2000 were insignificant.
The Company also invests in structured notes and similar type instruments, which generally provide equity-based returns on debt securities. Thecarrying value of such investments was approximately $870 million and $1.6 billion at December 31, 2002 and 2001, respectively. The related incomerecognized was $1 million, $44 million and $62 million for the years ended December 31, 2002, 2001 and 2000, respectively.
Assets on Deposit and Held in TrustThe Company had investment assets on deposit with regulatory agencies with a fair market value of $936 million and $845 million at December 31,
2002 and 2001, respectively. Company securities held in trust to satisfy collateral requirements had an amortized cost of $1,949 million and$1,918 million at December 31, 2002 and 2001, respectively.
MetLife, Inc. F-19

METLIFE, INC.
NOTES TO CONSOLIDATED FINANCIAL STATEMENTS — (Continued)
Mortgage Loans on Real EstateMortgage loans on real estate were categorized as follows:
December 31,
2002 2001
Amount Percent Amount Percent
(Dollars in millions)
Commercial mortgage loans************************************************** $19,671 78% $18,093 76%Agricultural mortgage loans*************************************************** 5,152 20 5,277 22Residential mortgage loans*************************************************** 389 2 395 2
Total****************************************************************** 25,212 100% 23,765 100%
Less: Valuation allowances *************************************************** 126 144
Mortgage loans ******************************************************** $25,086 $23,621
Mortgage loans on real estate are collateralized by properties primarily located throughout the United States. At December 31, 2002, approximately18%, 8% and 8% of the properties were located in California, New York and Florida, respectively. Generally, the Company (as the lender) requires that aminimum of one-fourth of the purchase price of the underlying real estate be paid by the borrower.
Certain of the Company’s real estate joint ventures have mortgage loans with the Company. The carrying values of such mortgages were$620 million and $644 million at December 31, 2002 and 2001, respectively.
Changes in mortgage loan valuation allowances were as follows:
Years Ended December 31,
2002 2001 2000
(Dollars in millions)
Balance at January 1 ************************************************************************* $144 $ 83 $ 90Additions *********************************************************************************** 41 106 38Deductions for writedowns and dispositions ****************************************************** (59) (45) (74)Acquisitions of affiliates *********************************************************************** — — 29
Balance at December 31********************************************************************** $126 $144 $ 83
A portion of the Company’s mortgage loans on real estate was impaired and consisted of the following:
December 31,
2002 2001
(Dollars in millions)
Impaired mortgage loans with valuation allowances ********************************************************** $627 $ 816Impaired mortgage loans without valuation allowances******************************************************** 261 324
Total ********************************************************************************************* 888 1,140Less: Valuation allowances on impaired mortgages ********************************************************** 125 140
Impaired mortgage loans **************************************************************************** $763 $1,000
The average investment in impaired mortgage loans on real estate was $1,088 million, $947 million and $912 million for the years endedDecember 31, 2002, 2001 and 2000, respectively. Interest income on impaired mortgage loans was $91 million, $103 million and $80 million for theyears ended December 31, 2002, 2001 and 2000, respectively.
The investment in restructured mortgage loans on real estate was $414 million and $685 million at December 31, 2002 and 2001, respectively.Interest income of $44 million, $76 million and $77 million was recognized on restructured loans for the years ended December 31, 2002, 2001 and2000, respectively. Gross interest income that would have been recorded in accordance with the original terms of such loans amounted to $41 million,$60 million and $74 million for the years ended December 31, 2002, 2001 and 2000, respectively.
Mortgage loans on real estate with scheduled payments of 60 days (90 days for agriculture mortgages) or more past due or in foreclosure had anamortized cost of $40 million and $53 million at December 31, 2002 and 2001, respectively.
MetLife, Inc.F-20

METLIFE, INC.
NOTES TO CONSOLIDATED FINANCIAL STATEMENTS — (Continued)
Real Estate and Real Estate Joint VenturesReal estate and real estate joint ventures consisted of the following:
December 31,
2002 2001
(Dollars in millions)
Real estate and real estate joint ventures held-for-investment **************************************** $4,684 $4,211Impairments ********************************************************************************* (188) (157)
Total *********************************************************************************** 4,496 4,054
Real estate held-for-sale *********************************************************************** 327 1,888Impairments ********************************************************************************* (82) (177)Valuation allowance *************************************************************************** (16) (35)
Total *********************************************************************************** 229 1,676
Real estate and real estate joint ventures ************************************************* $4,725 $5,730
Accumulated depreciation on real estate was $1,951 million and $2,504 million at December 31, 2002 and 2001, respectively. Relateddepreciation expense was $227 million, $220 million and $224 million for the years ended December 31, 2002, 2001 and 2000, respectively. Theseamounts include $48 million, $79 million and $80 million of depreciation expense related to discontinued operations for the years ended December 31,2002, 2001 and 2000, respectively.
Real estate and real estate joint ventures were categorized as follows:
December 31,
2002 2001
Amount Percent Amount Percent
(Dollars in millions)
Office *************************************************************************** $2,733 58% $3,637 63%Retail**************************************************************************** 699 15 780 14Apartments*********************************************************************** 835 18 740 13Land **************************************************************************** 87 2 184 3Agriculture *********************************************************************** 7 — 14 —Other**************************************************************************** 364 7 375 7
Total ******************************************************************** $4,725 100% $5,730 100%
The Company’s real estate holdings are primarily located throughout the United States. At December 31, 2002, approximately 37%, 21% and 13%of the Company’s real estate holdings were located in New York, California and Texas, respectively.
Changes in real estate and real estate joint ventures held-for-sale valuation allowance were as follows:
Years Ended December 31,
2002 2001 2000
(Dollars in millions)
Balance at January 1 **************************************************************************** $ 35 $ 39 $ 34Additions charged to operations ******************************************************************* 21 16 17Deductions for writedowns and dispositions ********************************************************* (40) (20) (12)
Balance at December 31************************************************************************* $ 16 $ 35 $ 39
Investment income related to impaired real estate and real estate joint ventures held-for-investment was $40 million, $22 million and $11 million forthe years ended December 31, 2002, 2001 and 2000, respectively. Investment income related to impaired real estate and real estate joint ventures held-for-sale was $11 million, $31 million and $52 million for the years ended December 31, 2002, 2001 and 2000, respectively. The carrying value of non-income producing real estate and real estate joint ventures was $63 million and $14 million at December 31, 2002 and 2001, respectively.
The Company owned real estate acquired in satisfaction of debt of $10 million and $49 million at December 31, 2002 and 2001, respectively.
Leveraged LeasesLeveraged leases, included in other invested assets, consisted of the following:
December 31,
2002 2001
(Dollars in millions)
Investment ********************************************************************************** $ 985 $1,070Estimated residual values ********************************************************************** 428 505
Total *********************************************************************************** 1,413 1,575Unearned income **************************************************************************** (368) (404)
Leveraged leases ************************************************************************ $1,045 $1,171
MetLife, Inc. F-21

METLIFE, INC.
NOTES TO CONSOLIDATED FINANCIAL STATEMENTS — (Continued)
The investment amounts set forth above are generally due in monthly installments. The payment periods generally range from two to 15 years, but incertain circumstances are as long as 30 years. These receivables are generally collateralized by the related property. The Company’s deferred taxprovision related to leveraged leases was $981 million and $1,077 million at December 31, 2002 and 2001, respectively.
Net Investment IncomeThe components of net investment income were as follows:
Years Ended December 31,
2002 2001 2000
(Dollars in millions)
Fixed maturities ************************************************************************* $ 8,384 $ 8,574 $ 8,538Equity securities ************************************************************************ 26 49 41Mortgage loans on real estate************************************************************* 1,883 1,848 1,693Real estate and real estate joint ventures(1) ************************************************* 1,053 932 989Policy loans **************************************************************************** 543 536 515Other limited partnership interests********************************************************** 57 48 142Cash, cash equivalents and short-term investments ****************************************** 248 279 288Other ********************************************************************************* 218 249 162
Total ****************************************************************************** 12,412 12,515 12,368Less: Investment expenses(1) ************************************************************* 1,083 1,260 1,344
Net investment income ************************************************************** $11,329 $11,255 $11,024
(1) Excludes amounts related to real estate held-for-sale presented as discontinued operations in accordance with SFAS 144.
Net Investment LossesNet investment losses, including changes in valuation allowances, were as follows:
Years Ended December 31,
2002 2001 2000
(Dollars in millions)
Fixed maturities ****************************************************************************** $(917) $(645) $(1,437)Equity securities****************************************************************************** 224 65 192Mortgage loans on real estate****************************************************************** (22) (91) (18)Real estate and real estate joint ventures(1)******************************************************* (6) (4) 101Other limited partnership interests *************************************************************** (2) (161) (7)Sales of businesses ************************************************************************** — 25 660Other ************************************************************************************** (206) 74 65
Total *********************************************************************************** (929) (737) (444)Amounts allocable to:
Deferred policy acquisition costs************************************************************** (5) (25) 95Participating contracts*********************************************************************** (7) — (126)Policyholder dividend obligation*************************************************************** 157 159 85
Total net investment losses **************************************************************** $(784) $(603) $ (390)
(1) The amount presented for the year ended December 31, 2002 excludes amounts related to sales of real estate held-for-sale presented asdiscontinued operations in accordance with SFAS 144.
Investment gains and losses are net of related policyholder amounts. The amounts netted against investment gains and losses are (i) amortization ofdeferred policy acquisition costs to the extent that such amortization results from investment gains and losses, (ii) adjustments to participatingcontractholder accounts when amounts equal to such investment gains and losses are applied to the contractholder’s accounts, and (iii) adjustments tothe policyholder dividend obligation resulting from investment gains and losses. This presentation may not be comparable to presentations made by otherinsurers.
MetLife, Inc.F-22
METLIFE, INC.
NOTES TO CONSOLIDATED FINANCIAL STATEMENTS — (Continued)
Net Unrealized Investment GainsThe components of net unrealized investment gains, included in accumulated other comprehensive income, were as follows:
Years Ended December 31,
2002 2001 2000
(Dollars in millions)
Fixed maturities*************************************************************************** $ 7,371 $ 3,110 $ 1,677Equity securities ************************************************************************** 45 604 744Derivatives ******************************************************************************* (24) 71 —Other invested assets ********************************************************************* 17 59 58
Total ******************************************************************************** 7,409 3,844 2,479
Amounts allocable to:Future policy benefit loss recognition ******************************************************* (1,269) (30) (284)Deferred policy acquisition costs ********************************************************** (559) (21) 119Participating contracts ******************************************************************* (153) (127) (133)Policyholder dividend obligation *********************************************************** (1,882) (708) (385)
Deferred income taxes********************************************************************* (1,264) (1,079) (621)
Total ******************************************************************************** (5,127) (1,965) (1,304)
Net unrealized investment gains ***************************************************** $ 2,282 $ 1,879 $ 1,175
The changes in net unrealized investment gains were as follows:
Years Ended December 31,
2002 2001 2000
(Dollars in millions)
Balance at January 1*********************************************************************** $ 1,879 $1,175 $ (297)Unrealized investment gains during the year **************************************************** 3,565 1,365 3,279Unrealized investment gains (losses) relating to:
Future policy benefit (loss) gain recognition *************************************************** (1,239) 254 (35)Deferred policy acquisition costs *********************************************************** (538) (140) (590)Participating contracts ******************************************************************** (26) 6 (15)Policyholder dividend obligation ************************************************************ (1,174) (323) (385)
Deferred income taxes********************************************************************** (185) (458) (782)
Balance at December 31 ******************************************************************* $ 2,282 $1,879 $1,175
Net change in unrealized investment gains ***************************************************** $ 403 $ 704 $1,472
4. Derivative InstrumentsThe table below provides a summary of notional amount and fair value of derivative financial instruments held at December 31, 2002 and 2001:
2002 2001
Fair Value Fair ValueNotional NotionalAmount Assets Liabilities Amount Assets Liabilities
(Dollars in millions)
Financial futures ************************************************************** $ 4 $ — $ — $ — $ — $—Interest rate swaps ************************************************************ 3,866 196 126 1,823 73 9Floors*********************************************************************** 325 9 — 325 11 —Caps *********************************************************************** 8,040 — — 7,890 5 —Financial forwards ************************************************************* 1,945 — 12 — — —Foreign currency swaps******************************************************** 2,371 92 181 1,925 188 26Options ********************************************************************* 78 9 — 1,880 8 12Foreign currency forwards ****************************************************** 54 — 1 67 4 —Written covered calls ********************************************************** — — — 40 — —Credit default swaps ********************************************************** 376 2 — 270 — —
Total contractual commitments ************************************************** $17,059 $308 $320 $14,220 $289 $47
MetLife, Inc. F-23

METLIFE, INC.
NOTES TO CONSOLIDATED FINANCIAL STATEMENTS — (Continued)
The following is a reconciliation of the notional amounts by derivative type and strategy at December 31, 2002 and 2001:
December 31, 2001 Terminations/ December 31, 2002Notional Amount Additions Maturities Notional Amount
(Dollars in millions)
BY DERIVATIVE TYPEFinancial futures *************************************************** $ — $ 760 $ 756 $ 4Interest rate swaps************************************************* 1,823 3,005 962 3,866Floors************************************************************ 325 — — 325Caps ************************************************************ 7,890 3,870 3,720 8,040Financial forwards************************************************** — 2,945 1,000 1,945Foreign currency swaps ******************************************** 1,925 760 314 2,371Options ********************************************************** 1,880 55 1,857 78Foreign currency forwards******************************************* 67 19 32 54Written covered calls *********************************************** 40 — 40 —Credit default swaps *********************************************** 270 121 15 376
Total contractual commitments *********************************** $14,220 $11,535 $8,696 $17,059
BY DERIVATIVE STRATEGYLiability hedging *************************************************** $ 8,888 $ 3,937 $3,871 $ 8,954Invested asset hedging ********************************************* 4,802 4,581 3,972 5,411Portfolio hedging*************************************************** 530 2,104 — 2,634Firm commitments and forecasted transactions ************************* — 913 853 60
Total contractual commitments *********************************** $14,220 $11,535 $8,696 $17,059
The following table presents the notional amounts of derivative financial instruments by maturity at December 31, 2002:
Remaining Life
After One After FiveOne Year Year Through Years Through After Tenor Less Five Years Ten Years Years Total
(Dollars in millions)
Financial futures ***************************************************** $ 4 $ — $ — $ — $ 4Interest rate swaps*************************************************** 64 1,887 1,630 285 3,866Floors************************************************************** — — 325 — 325Caps ************************************************************** 1,120 6,920 — — 8,040Financial forwards**************************************************** 1,945 — — — 1,945Foreign currency swaps ********************************************** 88 962 851 470 2,371Options ************************************************************ 3 20 — 55 78Foreign currency forwards********************************************* 53 1 — — 54Written covered calls ************************************************* — — — — —Credit default swaps ************************************************* 45 331 — — 376
Total contractual commitments ************************************* $3,322 $10,121 $2,806 $810 $17,059
The following table presents the notional amounts and fair values of derivatives by type of hedge designation at December 31, 2002 and 2001:
2002 2001
Fair Value Fair ValueNotional NotionalAmount Assets Liabilities Amount Assets Liabilities
(Dollars in millions)
BY TYPE OF HEDGEFair value ************************************************************ $ 420 $ — $ 64 $ — $ — $—Cash flow *********************************************************** 3,520 69 73 607 61 1Non qualifying ******************************************************** 13,119 239 183 13,613 228 46
Total ******************************************************** $17,059 $308 $320 $14,220 $289 $47
For the years ended December 31, 2002, 2001 and 2000, the Company recognized net investment income of $23 million, $32 million and$13 million, respectively, from the periodic settlement of interest rate and foreign currency swaps.
During the year ended December 31, 2002, the Company recognized $30 million in net investment losses related to qualifying fair value hedges.Accordingly, $34 million of unrealized gains on fair value hedged investments were recognized in net investment gains and losses. There were noderivatives designated as fair value hedges during the year ended December 31, 2001. There were no discontinued hedges during the year endedDecember 31, 2002.
For the years ended December 31, 2002 and 2001, the amounts accumulated in other comprehensive income relating to cash flow hedges werelosses of $24 million and gains of $71 million, respectively. During the year ended December 31, 2002, the Company recognized other comprehensive
MetLife, Inc.F-24
METLIFE, INC.
NOTES TO CONSOLIDATED FINANCIAL STATEMENTS — (Continued)
losses of $142 million relating to the effective portion of cash flow hedges. During the year ended December 31, 2002, $10 million of othercomprehensive income and $57 million of other comprehensive losses were reclassified into net investment income and net investment losses,respectively. During the year ended December 31, 2001, $19 million of other comprehensive income was reclassified into net investment income due tothe SFAS 133 transition adjustment. Approximately $6 million and $12 million of the losses reported in accumulated other comprehensive income atDecember 31, 2002 are expected to be reclassified during the year ending December 31, 2003 into net investment income and net investment gainsand losses, respectively, as the underlying investments mature or expire according to their original terms.
For the years ended December 31, 2002 and 2001, the Company recognized net investment income of $32 million and $24 million, respectively,and net investment losses of $172 million and net investment gains of $100 million, respectively, from derivatives not qualifying as accounting hedges.The use of these non-speculative derivatives is permitted by the Department.
5. Fair Value InformationThe estimated fair values of financial instruments have been determined by using available market information and the valuation methodologies
described below. Considerable judgment is often required in interpreting market data to develop estimates of fair value. Accordingly, the estimatespresented herein may not necessarily be indicative of amounts that could be realized in a current market exchange. The use of different assumptions orvaluation methodologies may have a material effect on the estimated fair value amounts.
Amounts related to the Company’s financial instruments were as follows:
Notional Carrying EstimatedAmount Value Fair Value
(Dollars in millions)
December 31, 2002Assets:
Fixed maturities********************************************************************** $140,553 $140,553Equity securities ********************************************************************* $ 1,348 $ 1,348Mortgage loans on real estate ********************************************************* $ 25,086 $ 27,778Policy loans************************************************************************* $ 8,580 $ 8,580Short-term investments *************************************************************** $ 1,921 $ 1,921Cash and cash equivalents************************************************************ $ 2,323 $ 2,323Mortgage loan commitments*********************************************************** $ 859 $ — $ 12Commitments to fund partnership investments ******************************************** $1,667 $ — $ —
Liabilities:Policyholder account balances ********************************************************* $ 55,285 $ 55,909Short-term debt ********************************************************************* $ 1,161 $ 1,161Long-term debt********************************************************************** $ 4,425 $ 4,731Payable under securities loaned transactions ********************************************* $ 17,862 $ 17,862
Other:Company-obligated mandatorily redeemable securities of subsidiary trusts********************* $ 1,265 $ 1,337
Notional Carrying EstimatedAmount Value Fair Value
(Dollars in millions)
December 31, 2001Assets:
Fixed maturities********************************************************************** $115,398 $115,398Equity securities ********************************************************************* $ 3,063 $ 3,063Mortgage loans on real estate ********************************************************* $ 23,621 $ 24,844Policy loans************************************************************************* $ 8,272 $ 8,272Short-term investments *************************************************************** $ 1,203 $ 1,203Cash and cash equivalents************************************************************ $ 7,473 $ 7,473Mortgage loan commitments*********************************************************** $ 532 $ — $ (4)Commitments to fund partnership investments ******************************************** $1,898 $ — $ —
Liabilities:Policyholder account balances ********************************************************* $ 47,977 $ 48,318Short-term debt ********************************************************************* $ 355 $ 355Long-term debt********************************************************************** $ 3,628 $ 3,685Payable under securities loaned transactions ********************************************* $ 12,661 $ 12,661
Other:Company-obligated mandatorily redeemable securities of subsidiary trusts********************* $ 1,256 $ 1,311
The methods and assumptions used to estimate the fair values of financial instruments are summarized as follows:
Fixed Maturities and Equity SecuritiesThe fair value of fixed maturities and equity securities are based upon quotations published by applicable stock exchanges or received from
other reliable sources. For securities for which the market values were not readily available, fair values were estimated using quoted market prices ofcomparable investments.
MetLife, Inc. F-25
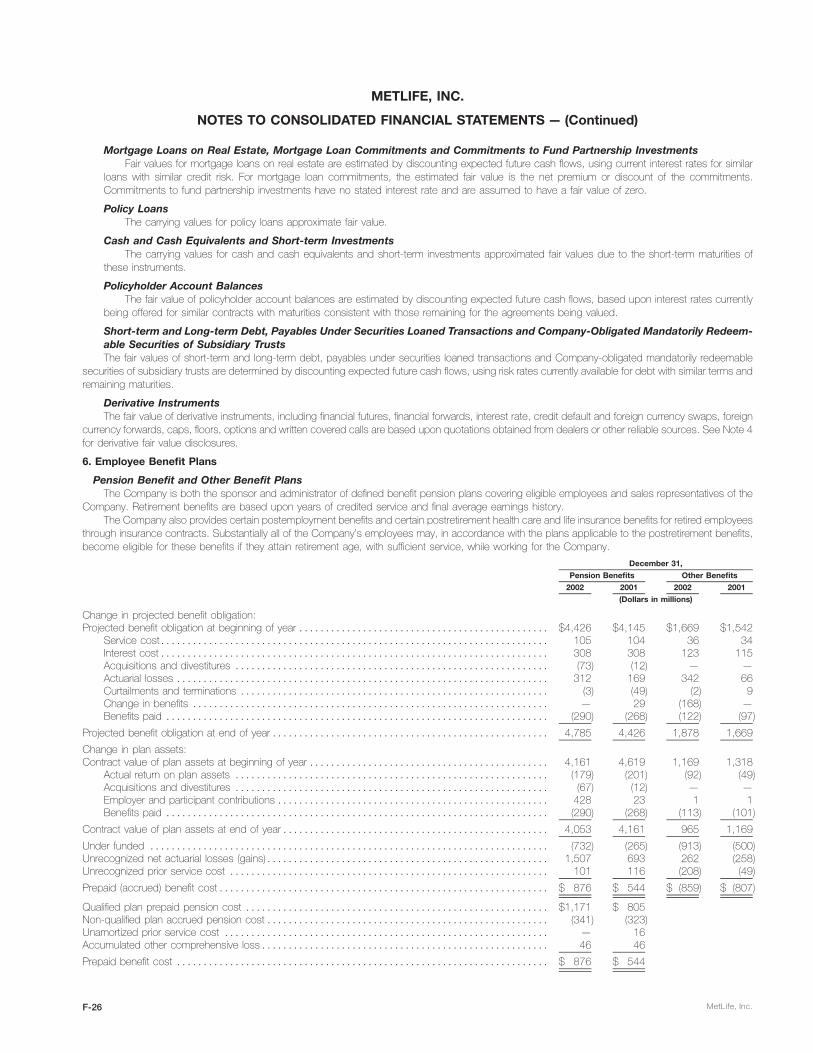
METLIFE, INC.
NOTES TO CONSOLIDATED FINANCIAL STATEMENTS — (Continued)
Mortgage Loans on Real Estate, Mortgage Loan Commitments and Commitments to Fund Partnership InvestmentsFair values for mortgage loans on real estate are estimated by discounting expected future cash flows, using current interest rates for similar
loans with similar credit risk. For mortgage loan commitments, the estimated fair value is the net premium or discount of the commitments.Commitments to fund partnership investments have no stated interest rate and are assumed to have a fair value of zero.
Policy LoansThe carrying values for policy loans approximate fair value.
Cash and Cash Equivalents and Short-term InvestmentsThe carrying values for cash and cash equivalents and short-term investments approximated fair values due to the short-term maturities of
these instruments.
Policyholder Account BalancesThe fair value of policyholder account balances are estimated by discounting expected future cash flows, based upon interest rates currently
being offered for similar contracts with maturities consistent with those remaining for the agreements being valued.
Short-term and Long-term Debt, Payables Under Securities Loaned Transactions and Company-Obligated Mandatorily Redeem-able Securities of Subsidiary TrustsThe fair values of short-term and long-term debt, payables under securities loaned transactions and Company-obligated mandatorily redeemable
securities of subsidiary trusts are determined by discounting expected future cash flows, using risk rates currently available for debt with similar terms andremaining maturities.
Derivative InstrumentsThe fair value of derivative instruments, including financial futures, financial forwards, interest rate, credit default and foreign currency swaps, foreign
currency forwards, caps, floors, options and written covered calls are based upon quotations obtained from dealers or other reliable sources. See Note 4for derivative fair value disclosures.
6. Employee Benefit Plans
Pension Benefit and Other Benefit PlansThe Company is both the sponsor and administrator of defined benefit pension plans covering eligible employees and sales representatives of the
Company. Retirement benefits are based upon years of credited service and final average earnings history.The Company also provides certain postemployment benefits and certain postretirement health care and life insurance benefits for retired employees
through insurance contracts. Substantially all of the Company’s employees may, in accordance with the plans applicable to the postretirement benefits,become eligible for these benefits if they attain retirement age, with sufficient service, while working for the Company.
December 31,
Pension Benefits Other Benefits
2002 2001 2002 2001
(Dollars in millions)
Change in projected benefit obligation:Projected benefit obligation at beginning of year *********************************************** $4,426 $4,145 $1,669 $1,542
Service cost************************************************************************* 105 104 36 34Interest cost************************************************************************* 308 308 123 115Acquisitions and divestitures *********************************************************** (73) (12) — —Actuarial losses ********************************************************************** 312 169 342 66Curtailments and terminations ********************************************************** (3) (49) (2) 9Change in benefits ******************************************************************* — 29 (168) —Benefits paid ************************************************************************ (290) (268) (122) (97)
Projected benefit obligation at end of year **************************************************** 4,785 4,426 1,878 1,669
Change in plan assets:Contract value of plan assets at beginning of year ********************************************* 4,161 4,619 1,169 1,318
Actual return on plan assets *********************************************************** (179) (201) (92) (49)Acquisitions and divestitures *********************************************************** (67) (12) — —Employer and participant contributions *************************************************** 428 23 1 1Benefits paid ************************************************************************ (290) (268) (113) (101)
Contract value of plan assets at end of year************************************************** 4,053 4,161 965 1,169
Under funded *************************************************************************** (732) (265) (913) (500)Unrecognized net actuarial losses (gains)***************************************************** 1,507 693 262 (258)Unrecognized prior service cost ************************************************************ 101 116 (208) (49)
Prepaid (accrued) benefit cost************************************************************** $ 876 $ 544 $ (859) $ (807)
Qualified plan prepaid pension cost ********************************************************* $1,171 $ 805Non-qualified plan accrued pension cost ***************************************************** (341) (323)Unamortized prior service cost ************************************************************* — 16Accumulated other comprehensive loss****************************************************** 46 46
Prepaid benefit cost ********************************************************************** $ 876 $ 544
MetLife, Inc.F-26

METLIFE, INC.
NOTES TO CONSOLIDATED FINANCIAL STATEMENTS — (Continued)
The aggregate projected benefit obligation and aggregate contract value of plan assets for the pension plans were as follows:
Non-QualifiedQualified Plan Plan Total
2002 2001 2002 2001 2002 2001
(Dollars in millions)
Aggregate projected benefit obligation ********************************************* $(4,311) $(4,006) $(474) $(420) $(4,785) $(4,426)Aggregate contract value of plan assets (principally Company contracts)***************** 4,053 4,161 — — 4,053 4,161
(Under) over funded ************************************************************ $ (258) $ 155 $(474) $(420) $ (732) $ (265)
The assumptions used in determining the aggregate projected benefit obligation and aggregate contract value for the pension and other benefitswere as follows:
Pension Benefits Other Benefits
2002 2001 2002 2001
Weighted average assumptions at December 31:Discount rate*************************************************************** 4% – 9.5% 4% – 7.4% 6.5% – 7.25% 6% – 7.4%Expected rate of return on plan assets ***************************************** 4% – 10% 4% – 9% 5.2% – 9% 6% – 9%Rate of compensation increase *********************************************** 2% – 8% 2% – 8.5% N/A N/A
For the largest of the plans sponsored by the Company (the Metropolitan Life Retirement Plan for United States Employees, with a projected benefitobligation of $4.3 billion or 98.6% of all qualified plans at December 31, 2002), the discount rate, expected rate of return on plan assets, and the range ofrates of future compensation increases used in that plan’s valuation at December 31, 2002 were 6.75%, 9% and 4% to 8%, respectively. The discountrate is based on the yield of a hypothetical portfolio of high-quality debt instruments available on the valuation date, which would provide the necessaryfuture cash flows to pay the aggregate projected benefit obligation when due. The expected rate of return on plan assets is based on anticipatedperformance of the various asset sectors, which the plan invests in, inflation expectations and long-term historical returns of the plan assets as well asother factors. The expected rate of return on plan assets for use in that plan’s valuation in 2003 is currently anticipated to be 8.5%. The discount rate of4% and 9.5% and the expected rate of return on plan assets of 4% and 10% are attributable to the Company’s international subsidiaries in Taiwan andMexico, respectively. The rate of compensation increase of 2% in 2002 and 2001 is attributable to the Company’s subsidiary in Taiwan. These rates areindicative of the economic environments in those countries.
The assumed health care cost trend rates used in measuring the accumulated nonpension postretirement benefit obligation were as follows:
December 31,
2002 2001
Pre-Medicare eligible claims ****************************************** 9% down to 5% in 2010 9.5% down to 5% in 2010Medicare eligible claims ********************************************** 11% down to 5% in 2014 11.5% down to 5% in 2014
Assumed health care cost trend rates may have a significant effect on the amounts reported for health care plans. A one-percentage point change inassumed health care cost trend rates would have the following effects:
One Percent One PercentIncrease Decrease
(Dollars in millions)
Effect on total of service and interest cost components *********************************************** $ 10 $ 10Effect on accumulated postretirement benefit obligation *********************************************** $ 90 $ 88
The components of net periodic benefit cost were as follows:
Pension Benefits Other Benefits
2002 2001 2000 2002 2001 2000
(Dollars in millions)
Service cost ****************************************************************** $ 105 $ 104 $ 98 $ 36 $ 34 $ 29Interest cost******************************************************************* 308 308 291 123 115 113Expected return on plan assets ************************************************** (356) (402) (420) (93) (108) (97)Amortization of prior actuarial losses (gains)***************************************** 33 (2) (19) (9) (27) (22)Curtailment cost (credit) ********************************************************* 11 21 (3) 4 6 2
Net periodic benefit cost (credit) ************************************************** $ 101 $ 29 $ (53) $ 61 $ 20 $ 25
Savings and Investment PlansThe Company sponsors savings and investment plans for substantially all employees under which the Company matches a portion of employee
contributions. The Company contributed $49 million, $55 million and $65 million for the years ended December 31, 2002, 2001 and 2000, respectively.
7. Closed BlockOn the date of demutualization, Metropolitan Life established a closed block for the benefit of holders of certain individual life insurance policies of
Metropolitan Life. Assets have been allocated to the closed block in an amount that has been determined to produce cash flows which, together withanticipated revenues from the policies included in the closed block, are reasonably expected to be sufficient to support obligations and liabilities relatingto these policies, including, but not limited to, provisions for the payment of claims and certain expenses and taxes, and to provide for the continuation of
MetLife, Inc. F-27

METLIFE, INC.
NOTES TO CONSOLIDATED FINANCIAL STATEMENTS — (Continued)
policyholder dividend scales in effect for 1999, if the experience underlying such dividend scales continues, and for appropriate adjustments in suchscales if the experience changes. At least annually, the Company compares actual and projected experience against the experience assumed in thethen-current dividend scales. Dividend scales are adjusted periodically to give effect to changes in experience.
The closed block assets, the cash flows generated by the closed block assets and the anticipated revenues from the policies in the closed block willbenefit only the holders of the policies in the closed block. To the extent that, over time, cash flows from the assets allocated to the closed block andclaims and other experience related to the closed block are, in the aggregate, more or less favorable than what was assumed when the closed block wasestablished, total dividends paid to closed block policyholders in the future may be greater than or less than the total dividends that would have been paidto these policyholders if the policyholder dividend scales in effect for 1999 had been continued. Any cash flows in excess of amounts assumed will beavailable for distribution over time to closed block policyholders and will not be available to stockholders. If the closed block has insufficient funds to makeguaranteed policy benefit payments, such payments will be made from assets outside of the closed block. The closed block will continue in effect aslong as any policy in the closed block remains in-force. The expected life of the closed block is over 100 years.
The Company uses the same accounting principles to account for the participating policies included in the closed block as it used prior to the dateof demutualization. However, the Company establishes a policyholder dividend obligation for earnings that will be paid to policyholders as additionaldividends as described below. The excess of closed block liabilities over closed block assets at the effective date of the demutualization (adjusted toeliminate the impact of related amounts in accumulated other comprehensive income) represents the estimated maximum future earnings from theclosed block expected to result from operations attributed to the closed block after income taxes. Earnings of the closed block are recognized in incomeover the period the policies and contracts in the closed block remain in-force. Management believes that over time the actual cumulative earnings of theclosed block will approximately equal the expected cumulative earnings due to the effect of dividend changes. If, over the period the closed blockremains in existence, the actual cumulative earnings of the closed block is greater than the expected cumulative earnings of the closed block, theCompany will pay the excess of the actual cumulative earnings of the closed block over the expected cumulative earnings to closed block policyholdersas additional policyholder dividends unless offset by future unfavorable experience of the closed block and, accordingly, will recognize only the expectedcumulative earnings in income with the excess recorded as a policyholder dividend obligation. If over such period, the actual cumulative earnings of theclosed block is less than the expected cumulative earnings of the closed block, the Company will recognize only the actual earnings in income. However,the Company may change policyholder dividend scales in the future, which would be intended to increase future actual earnings until the actualcumulative earnings equal the expected cumulative earnings. Amounts reported for the period after demutualization are as of April 1, 2000 and for theperiod beginning on April 1, 2000 (the effect of transactions from April 1, 2000 through April 6, 2000 is not considered material).
Closed block liabilities and assets designated to the closed block are as follows:
December 31,
2002 2001
(Dollars in millions)
CLOSED BLOCK LIABILITIESFuture policy benefits ************************************************************************ $41,207 $40,325Other policyholder funds ********************************************************************* 279 321Policyholder dividends payable **************************************************************** 719 757Policyholder dividend obligation**************************************************************** 1,882 708Payables under securities loaned transactions *************************************************** 4,851 3,350Other liabilities ****************************************************************************** 433 90
Total closed block liabilities *********************************************************** 49,371 45,551
ASSETS DESIGNATED TO THE CLOSED BLOCKInvestments:
Fixed maturities available-for-sale, at fair value (amortized cost: $28,334 and $25,761, respectively) **** 29,981 26,331Equity securities, at fair value (amortized cost: $236 and $240, respectively) ************************ 218 282Mortgage loans on real estate*************************************************************** 7,032 6,358Policy loans ****************************************************************************** 3,988 3,898Short-term investments********************************************************************* 24 170Other invested assets********************************************************************** 604 159
Total investments******************************************************************** 41,847 37,198Cash and cash equivalents ******************************************************************* 435 1,119Accrued investment income******************************************************************* 540 550Deferred income taxes *********************************************************************** 1,151 1,060Premiums and other receivables *************************************************************** 130 244
Total assets designated to the closed block ********************************************* 44,103 40,171
Excess of closed block liabilities over assets designated to the closed block************************** 5,268 5,380
Amounts included in accumulated other comprehensive loss:Net unrealized investment gains, net of deferred income tax of $577 and $219, respectively ********** 1,047 389Unrealized derivative gains, net of deferred income tax of $7 and $9, respectively ******************* 13 17Allocated to policyholder dividend obligation, net of deferred income tax of $668 and $255, respectively (1,214) (453)
(154) (47)
Maximum future earnings to be recognized from closed block assets and liabilities********************* $ 5,114 $ 5,333
MetLife, Inc.F-28

METLIFE, INC.
NOTES TO CONSOLIDATED FINANCIAL STATEMENTS — (Continued)
Information regarding the policyholder dividend obligation is as follows:
For the PeriodApril 7, 2000Years Ended throughDecember 31, December 31,
2002 2001 2000
(Dollars in millions)
Balance at beginning of period ****************************************************** $ 708 $ 385 $ —Impact on net income before amounts allocable to policyholder dividend obligation ********** 157 159 85Net investment losses ************************************************************* (157) (159) (85)Change in unrealized investment and derivative gains *********************************** 1,174 323 385
Balance at end of period *********************************************************** $1,882 $ 708 $385
Closed block revenues and expenses were as follows:For the PeriodApril 7, 2000Years Ended throughDecember 31, December 31,
2002 2001 2000
(Dollars in millions)
REVENUESPremiums *************************************************************************** $3,551 $3,658 $2,900Net investment income and other revenues *********************************************** 2,568 2,555 1,789Net investment gains (losses) (net of amounts allocable to the policyholder dividend obligation of
($157), ($159) and ($85), respectively) ************************************************* 168 (20) (150)
Total revenues *************************************************************** 6,287 6,193 4,539
EXPENSESPolicyholder benefits and claims ******************************************************** 3,770 3,862 2,874Policyholder dividends ***************************************************************** 1,573 1,544 1,132Change in policyholder dividend obligation (excludes amounts directly related to net investment
losses of ($157), ($159) and ($85), respectively)***************************************** 157 159 85Other expenses ********************************************************************** 310 352 265
Total expenses *************************************************************** 5,810 5,917 4,356
Revenues net of expenses before income taxes ******************************************* 477 276 183Income taxes ************************************************************************ 173 97 67
Revenues net of expenses and income taxes ********************************************* $ 304 $ 179 $ 116
The change in maximum future earnings of the closed block was as follows:For the PeriodApril 7, 2000Years Ended throughDecember 31, December 31,
2002 2001 2000
(Dollars in millions)
Balance at the end of period *********************************************************** $5,114 $5,333 $5,512Less:
Reallocation of assets *************************************************************** 85 — —Balance at beginning of period******************************************************** 5,333 5,512 5,628
Change during period ***************************************************************** $ (304) $ (179) $ (116)
During the year ended December 31, 2002, the allocation of assets to the closed block was revised to appropriately classify assets in accordancewith the plan of demutualization. The reallocation of assets had no impact on consolidated assets or liabilities.
Metropolitan Life charges the closed block with federal income taxes, state and local premium taxes, and other additive state or local taxes, as wellas investment management expenses relating to the closed block as provided in the plan of demutualization. Metropolitan Life also charges the closedblock for expenses of maintaining the policies included in the closed block.
Many of the derivative instrument strategies used by the Company are also used for the closed block. The table below provides a summary of thenotional amount and fair value of derivatives by hedge accounting classification at:
December 31, 2002 December 31, 2001
Fair Value Fair ValueNotional NotionalAmount Assets Liabilities Amount Assets Liabilities
(Dollars in millions)
By Type of HedgeFair value ********************************************* $ — $— $— $ — $— $—Cash flow********************************************* 128 2 11 171 22 —Non-qualifying ***************************************** 258 32 2 112 13 5
Total ***************************************** $386 $34 $13 $283 $35 $ 5
MetLife, Inc. F-29

METLIFE, INC.
NOTES TO CONSOLIDATED FINANCIAL STATEMENTS — (Continued)
The amounts accumulated in other comprehensive loss relating to cash flow hedges were gains of $21 million for both the years endedDecember 31, 2002 and 2001. During the year ended December 31, 2002, the Company recognized other comprehensive gains of $4 million relatingto the effective portion of cash flow hedges. Reclassifications are recognized over the life of the hedged item. During the year ended December 31,2002, $4 million of other comprehensive loss was reclassified into net investment income. Approximately $3 million of the gains reported in accumulatedother comprehensive loss is expected to be reclassified into net investment income during the year ending December 31, 2003, as the underlyinginvestments mature or expire according to their original terms.
For the years ended December 31, 2002 and 2001, the Company recognized net investment losses of $11 million and net investment gains of$5 million, respectively, from derivatives not qualifying as accounting hedges. The use of these non-speculative derivatives is permitted by theDepartment.
The cumulative effect of the adoption of SFAS 133, as of January 1, 2001, resulted in $11 million of other comprehensive income, net of incometaxes of $6 million.
8. Separate AccountsSeparate accounts include two categories of account types: non-guaranteed separate accounts totaling $44,925 million and $48,912 million at
December 31, 2002 and 2001, respectively, for which the policyholder assumes the investment risk, and guaranteed separate accounts totaling$14,768 million and $13,802 million at December 31, 2002 and 2001, respectively, for which the Company contractually guarantees either a minimumreturn or account value to the policyholder.
Fees charged to the separate accounts by the Company (including mortality charges, policy administration fees and surrender charges) are reflectedin the Company’s revenues as universal life and investment-type product policy fees and totaled $544 million, $564 million and $667 million for the yearsended December 31, 2002, 2001 and 2000, respectively. Guaranteed separate accounts consisted primarily of Met Managed Guaranteed InterestContracts and participating close out contracts. The average interest rates credited on these contracts were 4.8% and 7.0% at December 31, 2002 and2001, respectively. The assets that support these liabilities were comprised of $12,536 million and $11,888 million in fixed maturities at December 31,2002 and 2001, respectively. The portfolios are segregated from other investments and are managed to minimize liquidity and interest rate risk. In orderto minimize the risk of early withdrawals to invest in instruments yielding a higher return, these investment products carry a graded surrender charge aswell as a market value adjustment.
9. DebtDebt consisted of the following:
December 31,
2002 2001
(Dollars in millions)
Senior notes, interest rates ranging from 5.25% to 7.25%, maturity dates ranging from 2006 to 2032 ****** $2,539 $1,546Surplus notes, interest rates ranging from 6.30% to 7.88%, maturity dates ranging from 2003 to 2025 ***** 1,632 1,630Investment related exchangeable debt, interest rate of 4.90%**************************************** — 195Fixed rate notes, interest rates ranging from 2.97% to 12.00%, maturity dates ranging from 2003 to 2019 ** 83 87Capital lease obligations *********************************************************************** 21 23Other notes with varying interest rates *********************************************************** 150 147
Total long-term debt ************************************************************************** 4,425 3,628Total short-term debt************************************************************************** 1,161 355
Total ******************************************************************************* $5,586 $3,983
The Company maintains committed and unsecured credit facilities aggregating $2,434 million ($1,140 million expiring in 2003 and $1,294 millionexpiring in 2005). If these facilities were drawn upon, they would bear interest at rates stated in the agreements. The facilities can be used for generalcorporate purposes and also provide support for the Company’s commercial paper program. At December 31, 2002, the Company had drawnapproximately $28 million under the facilities expiring in 2005 at interest rates ranging from 4.39% to 5.57%. At December 31, 2002, the Company hadapproximately $625 million in letters of credit from various banks.
Payments of interest and principal on the surplus notes, subordinated to all other indebtedness, may be made only with the prior approval of theinsurance department of the state of domicile. Subject to the prior approval of the Superintendent, the $300 million 7.45% surplus notes due 2023 maybe redeemed, in whole or in part, at the election of Metropolitan Life at any time on or after November 1, 2003 and, if redeemed prior to November 2013,would include a premium.
The investment-related exchangeable debt instrument is payable in cash or by delivery of an underlying security owned by the Company. Theamount of the debt payable at maturity is greater than the principal of the debt if the market value of the underlying security appreciates above certainlevels at the date of debt repayment as compared to the market value of the underlying security at the date of debt issuance. At December 31, 2001, theunderlying security pledged as collateral had a market value of $240 million.
The aggregate maturities of long-term debt for the Company are $448 million in 2003, $12 million in 2004, $395 million in 2005, $601 million in2006, $4 million in 2007 and $2,965 million thereafter.
Short-term debt of the Company consisted of commercial paper with a weighted average interest rate of 1.5% and a weighted average maturity of74 days at December 31, 2002. Short-term debt of the Company consisted of commercial paper with a weighted average interest rate of 2.1% and aweighted average maturity of 87 days at December 31, 2001. The Company also has other collateralized borrowings with a weighted average couponrate of 5.83% and a weighted average maturity of 34 days at December 31, 2002. Such securities had a weighted average coupon rate of 7.25% and aweighted average maturity of 30 days at December 31, 2001.
Interest expense related to the Company’s indebtedness included in other expenses was $288 million, $252 million and $377 million for the yearsended December 31, 2002, 2001 and 2000, respectively.
MetLife, Inc.F-30

METLIFE, INC.
NOTES TO CONSOLIDATED FINANCIAL STATEMENTS — (Continued)
10. Company-Obligated Mandatorily Redeemable Securities of Subsidiary Trusts
MetLife Capital Trust I. In April 2000, MetLife Capital Trust I, a Delaware statutory business trust wholly-owned by the Holding Company, issued20,125,000 8.00% equity security units (‘‘units’’). Each unit consists of (i) a purchase contract under which the holder agrees to purchase, for $50.00,shares of common stock of the Holding Company on May 15, 2003 (59,771,250 shares at December 31, 2002 and 2001 based on the average marketprice at December 31, 2002 and 2001) and (ii) a capital security, with a stated liquidation amount of $50.00 and mandatorily redeemable on May 15,2005. The number of shares to be purchased at such date will be determined based on the average trading price of the Holding Company’s commonstock. The proceeds from the sale of the units were used to acquire $1,006 million 8.00% debentures of the Holding Company (‘‘MetLife debentures’’).The capital securities represent undivided beneficial ownership interests in MetLife Capital Trust I’s assets, which consist solely of the MetLife debentures.These securities are pledged to collateralize the obligations of the unit holder under the related purchase contracts. Holders of the capital securities areentitled to receive cumulative cash distributions accruing from April 2000 and payable quarterly in arrears commencing August 15, 2000 at an annual rateof 8.00%. The Holding Company irrevocably guarantee, on a senior and unsecured basis, the payment in full of distributions on the capital securities andthe stated liquidation amount of the capital securities, in each case to the extent of available trust funds. Holders of the capital securities generally have novoting rights. Capital securities outstanding were $988 million and $980 million, net of unamortized discounts of $18 million and $26 million, atDecember 31, 2002 and 2001, respectively.
The MetLife debentures bear interest at an annual rate of 8.00% of the principal amount, payable quarterly in arrears commencing August 15, 2000and mature on May 15, 2005. These debentures are unsecured. The Holding Company’s right to participate in the distribution of assets of any subsidiaryupon the subsidiary’s liquidation, reorganization or otherwise, is subject to the prior claims of creditors of the subsidiary, except to the extent the HoldingCompany may be recognized as a creditor of that subsidiary. Accordingly, the Holding Company’s obligations under the debentures are effectivelysubordinated to all existing and future liabilities of its subsidiaries. Interest expense on the capital securities is included in other expenses and was$81 million, $81 million and $59 million for the years ended December 31, 2002, 2001 and 2000, respectively.
In February 2003, the Company dissolved MetLife Capital Trust I, distributed the MetLife debentures to the holders of the capital securities inexchange for the capital securities and the interest rate on the MetLife debentures was reset in connection with the remarketing of the debentures. SeeNote 23.
GenAmerica Capital I. In June 1997, GenAmerica Corporation (‘‘GenAmerica’’) issued $125 million of 8.525% capital securities through awholly-owned subsidiary trust, GenAmerica Capital I. GenAmerica has fully and unconditionally guaranteed, on a subordinated basis, the obligation of thetrust under the capital securities and is obligated to mandatorily redeem the securities on June 30, 2027. GenAmerica may prepay the securities any timeafter June 30, 2007. Capital securities outstanding were $119 million and $118 million, net of unamortized discounts of $6 million and $7 million, atDecember 31, 2002 and 2001, respectively. Interest expense on these instruments is included in other expenses and was $11 million for each of theyears ended December 31, 2002, 2001 and 2000.
RGA Capital Trust I. In December 2001, a subsidiary of the Company, RGA, through its wholly-owned trust RGA Capital Trust I (the ‘‘Trust’’)issued 4,500,000 Preferred Income Equity Redeemable Securities (‘‘PIERS’’) Units. Each PIERS unit consists of (i) a preferred security issued by theTrust, having a stated liquidation amount of $50 per unit, representing an undivided beneficial ownership interest in the assets of the Trust, which consistsolely of junior subordinated debentures issued by RGA which have a principal amount at maturity of $50 and a stated maturity of March 18, 2051, and(ii) a warrant to purchase, at any time prior to December 15, 2050, 1.2508 shares of RGA stock at an exercise price of $50. The fair market value of thewarrant on the issuance date was $14.87 and is detachable from the preferred security. RGA fully and unconditionally guarantees, on a subordinatedbasis, the obligations of the Trust under the preferred securities. The preferred securities and subordinated debentures were issued at a discount (originalissue discount) to the face or liquidation value of $14.87 per security. The securities will accrete to their $50 face/liquidation value over the life of thesecurity on a level yield basis. The weighted average effective interest rate on the preferred securities and the subordinated debentures is 8.25% perannum. Capital securities outstanding were $158 million, net of unamortized discount of $67 million, at both December 31, 2002 and 2001.
11. Commitments, Contingencies and Guarantees
Litigation
Sales Practices ClaimsOver the past several years, Metropolitan Life, New England Mutual Life Insurance Company (‘‘New England Mutual’’) and General American Life
Insurance Company (‘‘General American’’) have faced numerous claims, including class action lawsuits, alleging improper marketing and sales ofindividual life insurance policies or annuities. These lawsuits are generally referred to as ‘‘sales practices claims.’’
In December 1999, a federal court approved a settlement resolving sales practices claims on behalf of a class of owners of permanent life insurancepolicies and annuity contracts or certificates issued pursuant to individual sales in the United States by Metropolitan Life, Metropolitan Insurance andAnnuity Company or Metropolitan Tower Life Insurance Company between January 1, 1982 and December 31, 1997. The class includes owners ofapproximately six million in-force or terminated insurance policies and approximately one million in-force or terminated annuity contracts or certificates.
Similar sales practices class actions against New England Mutual, with which Metropolitan Life merged in 1996, and General American, which wasacquired in 2000, have been settled. In October 2000, a federal court approved a settlement resolving sales practices claims on behalf of a class ofowners of permanent life insurance policies issued by New England Mutual between January 1, 1983 through August 31, 1996. The class includesowners of approximately 600,000 in-force or terminated policies. A federal court has approved a settlement resolving sales practices claims on behalf ofa class of owners of permanent life insurance policies issued by General American between January 1, 1982 through December 31, 1996. An appellatecourt has affirmed the order approving the settlement. The class includes owners of approximately 250,000 in-force or terminated policies. Implementa-tion of the General American class action settlement is proceeding.
Certain class members have opted out of the class action settlements noted above and have brought or continued non-class action sales practiceslawsuits. In addition, other sales practices lawsuits have been brought. As of December 31, 2002, there are approximately 420 sales practices lawsuitspending against Metropolitan Life, approximately 60 sales practices lawsuits pending against New England Mutual and approximately 35 sales practiceslawsuits pending against General American. Metropolitan Life, New England Mutual and General American continue to defend themselves vigorouslyagainst these lawsuits. Some individual sales practices claims have been resolved through settlement, won by dispositive motions, or, in a few instances,
MetLife, Inc. F-31

METLIFE, INC.
NOTES TO CONSOLIDATED FINANCIAL STATEMENTS — (Continued)
have gone to trial. Most of the current cases seek substantial damages, including in some cases punitive and treble damages and attorneys’ fees.Additional litigation relating to the Company’s marketing and sales of individual life insurance may be commenced in the future.
The Metropolitan Life class action settlement did not resolve two putative class actions involving sales practices claims filed against Metropolitan Lifein Canada, and these actions remain pending. In March 2002, a purported class action complaint was filed in a federal court in Kansas by S-G MetalsIndustries, Inc. against New England Mutual. The complaint seeks certification of a class on behalf of corporations and banks that purchased participatinglife insurance policies, as well as persons who purchased participating policies for use in pension plans or through work site marketing. Thesepolicyholders were not part of the New England Mutual class action settlement noted above. The action was transferred to a federal court inMassachusetts. New England Mutual moved to dismiss the case and in November 2002, the federal district court dismissed the case. S-G Metals hasfiled a notice of appeal. New England Mutual intends to continue to defend itself vigorously against the case.
The Company believes adequate provision has been made in its consolidated financial statements for all probable and reasonably estimable lossesfor sales practices claims against Metropolitan Life, New England Mutual and General American.
Regulatory authorities in a small number of states have had investigations or inquiries relating to Metropolitan Life’s, New England Mutual’s or GeneralAmerican’s sales of individual life insurance policies or annuities. Over the past several years, these and a number of investigations by other regulatoryauthorities were resolved for monetary payments and certain other relief. The Company may continue to resolve investigations in a similar manner.
Asbestos-Related ClaimsMetropolitan Life is a defendant in thousands of lawsuits seeking compensatory and punitive damages for personal injuries allegedly caused by
exposure to asbestos or asbestos-containing products. Metropolitan Life has never engaged in the business of manufacturing, producing, distributing orselling asbestos or asbestos-containing products nor has Metropolitan Life issued liability or workers’ compensation insurance to companies in thebusiness of manufacturing, producing, distributing or selling asbestos or asbestos-containing products. Rather, these lawsuits have principally beenbased upon allegations relating to certain research, publication and other activities of one or more of Metropolitan Life’s employees during the period fromthe 1920’s through approximately the 1950’s and alleging that Metropolitan Life learned or should have learned of certain health risks posed by asbestosand, among other things, improperly publicized or failed to disclose those health risks. Metropolitan Life believes that it should not have legal liability insuch cases.
Legal theories asserted against Metropolitan Life have included negligence, intentional tort claims and conspiracy claims concerning the health risksassociated with asbestos. Although Metropolitan Life believes it has meritorious defenses to these claims, and has not suffered any adverse monetaryjudgments in respect of these claims, due to the risks and expenses of litigation, almost all past cases have been resolved by settlements. MetropolitanLife’s defenses (beyond denial of certain factual allegations) to plaintiffs’ claims include that: (i) Metropolitan Life owed no duty to the plaintiffs — it had nospecial relationship with the plaintiffs and did not manufacture, produce, distribute or sell the asbestos products that allegedly injured plaintiffs; (ii) plaintiffscannot demonstrate justifiable detrimental reliance; and (iii) plaintiffs cannot demonstrate proximate causation. In defending asbestos cases, MetropolitanLife selects various strategies depending upon the jurisdictions in which such cases are brought and other factors which, in Metropolitan Life’s judgment,best protect Metropolitan Life’s interests. Strategies include seeking to settle or compromise claims, motions challenging the legal or factual basis forsuch claims or defending on the merits at trial. In early 2002 and in early 2003, two trial courts granted motions dismissing claims against MetropolitanLife on some or all of the above grounds. Other courts have denied motions brought by Metropolitan Life to dismiss cases without the necessity of trial.There can be no assurance that Metropolitan Life will receive favorable decisions on motions in the future. Metropolitan Life intends to continue toexercise its best judgment regarding settlement or defense of such cases, including when trials of these cases are appropriate.
The following table sets forth the total number of asbestos personal injury claims pending against Metropolitan Life as of the dates indicated, thenumber of new claims during the years ended on those dates and the total settlement payments made to resolve asbestos personal injury claims duringthose years:
At or for the yearsended December 31,
2002 2001 2000
(Dollars in millions)
Asbestos personal injury claims at year end (approximate) **************************** 106,500 89,000 73,000Number of new claims during the year (approximate) ******************************** 66,000 59,500 54,500Settlement payments during the year(1)******************************************** $ 95.1 $ 90.7 $ 71.1
(1) Settlement payments represent payments made by Metropolitan Life during the year in connection with settlements made in that year and in prioryears. Amounts do not include Metropolitan Life’s attorneys’ fees and expenses and do not reflect amounts received from insurance carriers.
During the fourth quarter of 2002, Metropolitan Life analyzed its claims experience and reviewed external publications and numerous variables toidentify trends and assessed their impact on its recorded asbestos liability. Certain publications suggest a trend towards more asbestos-related claimsand a greater awareness of asbestos litigation generally by potential plaintiffs and plaintiffs’ lawyers. Plaintiffs’ lawyers continue to advertise heavily withrespect to asbestos litigation. Bankruptcies and reorganizations of other defendants in asbestos litigation may increase the pressures on remainingdefendants, including Metropolitan Life. Through the first nine months of 2002, the number of new claims received by Metropolitan Life was lower thanthose received during the comparable 2001 period. However, the number of new claims received by Metropolitan Life during the fourth quarter of 2002was significantly higher than those received in the prior year quarter, resulting in more new claims being received by Metropolitan Life in 2002 than in2001. Factors considered also included expected trends in filing cases, the dates of initial exposure of plaintiffs to asbestos, the likely percentage of totalasbestos claims which included Metropolitan Life as a defendant and experience in claims settlement negotiations.
Metropolitan Life also considered views derived from actuarial calculations it made in the fourth quarter of 2002. These calculations were madeusing, among other things, current information regarding Metropolitan Life’s claims and settlement experience, information available in public reports, aswell as a study regarding the possible future incidence of mesothelioma. Based on all of the above information, including greater than expected claimsexperience over the last three years, Metropolitan Life expects to receive more claims in the future than it had previously expected. Previously,
MetLife, Inc.F-32
METLIFE, INC.
NOTES TO CONSOLIDATED FINANCIAL STATEMENTS — (Continued)
Metropolitan Life’s liability reflected that the increase in asbestos-related claims was a result of an acceleration in the reporting of such claims; the liabilitynow reflects that such an increase is also the result of an increase in the total number of asbestos-related claims expected to be received by MetropolitanLife. Accordingly, Metropolitan Life increased its recorded liability for asbestos-related claims by $402 million from approximately $820 million to$1,225 million at December 31, 2002. This total recorded asbestos-related liability (after the self-insured retention) is within the coverage of the excessinsurance policies discussed below.
During 1998, Metropolitan Life paid $878 million in premiums for excess insurance policies for asbestos-related claims. The excess insurancepolicies for asbestos-related claims provide for recovery of losses up to $1,500 million, which is in excess of a $400 million self-insured retention. Theasbestos-related policies are also subject to annual and per-claim sublimits. Amounts are recoverable under the policies annually with respect to claimspaid during the prior calendar year. Although amounts paid by Metropolitan Life in any given year that may be recoverable in the next calendar year underthe policies will be reflected as a reduction in the Company’s operating cash flows for the year in which they are paid, management believes that thepayments will not have a material adverse effect on the Company’s liquidity.
Each asbestos-related policy contains an experience fund and a reference fund that provides for payments to Metropolitan Life at the commutationdate if the reference fund is greater than zero at commutation or pro rata reductions from time to time in the loss reimbursements to Metropolitan Life if thecumulative return on the reference fund is less than the return specified in the experience fund. The return in the reference fund is tied to performance ofthe Standard & Poor’s 500 Index and the Lehman Brothers Aggregate Bond Index. A claim will be made under the excess insurance policies in 2003 forthe amounts paid with respect to asbestos litigation in excess of the retention. Based on performance of the reference fund, at December 31, 2002, theloss reimbursements to Metropolitan Life in 2003 and the recoverable with respect to later periods will be $42 million less than the amount of therecorded losses. Such foregone loss reimbursements may be recovered upon commutation depending upon future performance of the reference fund.The foregone loss reimbursements are estimated to be $9 million with respect to 2002 claims and $42 million in the aggregate.
The $402 million increase in the recorded liability for asbestos claims less the foregone loss reimbursement adjustment of $42 million ($27 million,net of income tax) resulted in an increase in the recoverable of $360 million. At December 31, 2002, a portion ($136 million) of the $360 millionrecoverable was recognized in income while the remainder ($224 million) was recorded as a deferred gain which is expected to be recognized in incomein the future over the estimated settlement period of the excess insurance policies. The $402 million increase in the recorded liability, less the portion ofthe recoverable recognized in income, resulted in a net expense of $266 million ($169 million, net of income tax). The $360 million recoverable maychange depending on the future performance of the Standard & Poor’s 500 Index and the Lehman Brothers Aggregate Bond Index.
As a result of the excess insurance policies, $1,237 million is recorded as a recoverable at December 31, 2002 ($224 million of which is recordedas a deferred gain as mentioned above); the amount includes recoveries expected to be obtained in 2003 for amounts paid in 2002. If at some point inthe future, the Company believes the liability for probable and estimable losses for asbestos-related claims should be increased, an expense would berecorded and the insurance recoverable would be adjusted subject to the terms, conditions and limits of the excess insurance policies. Portions of thechange in the insurance recoverable would be recorded as a deferred gain and amortized into income over the estimated remaining settlement period ofthe insurance policies.
The Company believes adequate provision has been made in its consolidated financial statements for all probable and reasonably estimable lossesfor asbestos-related claims. The ability of Metropolitan Life to estimate its ultimate asbestos exposure is subject to considerable uncertainty due tonumerous factors. The availability of data is limited and it is difficult to predict with any certainty numerous variables that can affect liability estimates,including the number of future claims, the cost to resolve claims, the disease mix and severity of disease, the jurisdiction of claims filed, tort reform effortsand the impact of any possible future adverse verdicts and their amounts.
Recent bankruptcies of other companies involved in asbestos litigation, as well as advertising by plaintiffs’ asbestos lawyers, may be resulting in anincrease in the number of claims and the cost of resolving claims, as well as the number of trials and possible adverse verdicts Metropolitan Life mayexperience. Plaintiffs are seeking additional funds from defendants, including Metropolitan Life, in light of such recent bankruptcies by certain otherdefendants. It is likely that bills will be introduced in 2003 in the United States Congress to reform asbestos litigation. While the Company stronglysupports reform efforts, there can be no assurance that legislative reforms will be enacted. Metropolitan Life will continue to study its claims experience,review external literature regarding asbestos claims experience in the United States and consider numerous variables that can affect its asbestos liabilityexposure, including bankruptcies of other companies involved in asbestos litigation and legislative and judicial developments, to identify trends and toassess their impact on the recorded asbestos liability.
The number of asbestos cases that may be brought or the aggregate amount of any liability that Metropolitan Life may ultimately incur is uncertain.Accordingly, it is reasonably possible that the Company’s total exposure to asbestos claims may be greater than the liability recorded by the Company inits consolidated financial statements and that future charges to income may be necessary. While the potential future charges could be material inparticular quarterly or annual periods in which they are recorded, based on information currently known by management, it does not believe any suchcharges are likely to have a material adverse effect on the Company’s consolidated financial position.
Property and Casualty ActionsPurported class action suits involving claims by policyholders for the alleged diminished value of automobiles after accident-related repairs have
been filed in Rhode Island, Texas, Georgia and Tennessee against Metropolitan Property and Casualty Insurance Company. Rhode Island and Texas trialcourts denied plaintiffs’ motions for class certification and a hearing on plaintiffs’ motion in Tennessee for class certification is to be scheduled. Asettlement has been reached in the Georgia class action; the Company determined to settle the case in light of a Georgia Supreme Court decisioninvolving another insurer. The settlement is being implemented. A purported class action has been filed against Metropolitan Property and CasualtyInsurance Company’s subsidiary, Metropolitan Casualty Insurance Company, in Florida. The complaint alleges breach of contract and unfair tradepractices with respect to allowing the use of parts not made by the original manufacturer to repair damaged automobiles. Discovery is ongoing and amotion for class certification is pending. Total loss valuation methods are the subject of national class actions involving other insurance companies. APennsylvania state court purported class action lawsuit filed in 2001 alleges that Metropolitan Property and Casualty Insurance Company improperly tookdepreciation on partial homeowner losses where the insured replaced the covered item. The court has dismissed the action. An appeal has been filed.Metropolitan Property and Casualty Insurance Company and Metropolitan Casualty Insurance Company are vigorously defending themselves againstthese lawsuits.
MetLife, Inc. F-33

METLIFE, INC.
NOTES TO CONSOLIDATED FINANCIAL STATEMENTS — (Continued)
Demutualization ActionsSeveral lawsuits were brought in 2000 challenging the fairness of Metropolitan Life’s plan of reorganization and the adequacy and accuracy of
Metropolitan Life’s disclosure to policyholders regarding the plan. These actions name as defendants some or all of Metropolitan Life, the HoldingCompany, the individual directors, the Superintendent and the underwriters for MetLife, Inc.’s initial public offering, Goldman, Sachs & Company andCredit Suisse First Boston. Five purported class actions pending in the New York state court in New York County were consolidated within thecommercial part. In addition, there remained a separate purported class action in New York state court in New York County. Another purported classaction in New York state court in Kings County has been voluntarily held in abeyance by plaintiffs. The plaintiffs in the state court class actions seekinjunctive, declaratory and compensatory relief, as well as an accounting and, in some instances, punitive damages. Some of the plaintiffs in the abovedescribed actions also have brought a proceeding under Article 78 of New York’s Civil Practice Law and Rules challenging the Opinion and Decision ofthe Superintendent who approved the plan. In this proceeding, petitioners seek to vacate the Superintendent’s Opinion and Decision and enjoin him fromgranting final approval of the plan. This case also is being held in abeyance by plaintiffs. Another purported class action was filed in New York state courtin New York County on behalf of a purported class of beneficiaries of Metropolitan Life annuities purchased to fund structured settlements claiming thatthe class members should have received common stock or cash in connection with the demutualization. Metropolitan Life’s motion to dismiss this casewas granted in a decision filed on October 31, 2002. Plaintiff has withdrawn her notice of appeal. Three purported class actions were filed in the UnitedStates District Court for the Eastern District of New York claiming violation of the Securities Act of 1933. The plaintiffs in these actions, which have beenconsolidated, claim that the Policyholder Information Booklets relating to the plan failed to disclose certain material facts and seek rescission andcompensatory damages. Metropolitan Life’s motion to dismiss these three cases was denied in 2001. On February 4, 2003, plaintiffs filed a consolidatedamended complaint adding a fraud claim under the Securities Exchange Act of 1934. A purported class action also was filed in the United States DistrictCourt for the Southern District of New York seeking damages from Metropolitan Life and the Holding Company for alleged violations of various provisionsof the Constitution of the United States in connection with the plan of reorganization. In 2001, pursuant to a motion to dismiss filed by Metropolitan Life,this case was dismissed by the District Court. In January 2003, the United States Court of Appeals for the Second Circuit affirmed the dismissal.Metropolitan Life, the Holding Company and the individual defendants believe they have meritorious defenses to the plaintiffs’ claims and are contestingvigorously all of the plaintiffs’ claims in these actions.
In 2001, a lawsuit was filed in the Superior Court of Justice, Ontario, Canada on behalf of a proposed class of certain former Canadian policyholdersagainst the Holding Company, Metropolitan Life, and Metropolitan Life Insurance Company of Canada. Plaintiffs’ allegations concern the way that theirpolicies were treated in connection with the demutualization of Metropolitan Life; they seek damages, declarations, and other non-pecuniary relief. Thedefendants believe they have meritorious defenses to the plaintiffs’ claims and will contest vigorously all of plaintiffs’ claims in this matter.
In July 2002, a lawsuit was filed in the United States District Court for the Eastern District of Texas on behalf of a proposed class comprised of thesettlement class in the Metropolitan Life sales practices class action settlement approved in December 1999 by the United States District Court for theWestern District of Pennsylvania. The Holding Company, Metropolitan Life, the trustee of the policyholder trust, and certain present and former individualdirectors and officers of Metropolitan Life are named as defendants. Plaintiffs’ allegations concern the treatment of the cost of the settlement inconnection with the demutualization of Metropolitan Life and the adequacy and accuracy of the disclosure, particularly with respect to those costs.Plaintiffs seek compensatory, treble and punitive damages, as well as attorneys’ fees and costs. The defendants’ motion to transfer the lawsuit to theWestern District of Pennsylvania was granted on February 14, 2003. The defendants’ motion to dismiss is pending. Plaintiffs have filed a motion for classcertification which the Texas court has adjourned. The defendants believe they have meritorious defenses to the plaintiffs’ claims and will contest themvigorously.
Race-Conscious Underwriting ClaimsInsurance Departments in a number of states initiated inquiries in 2000 about possible race-conscious underwriting of life insurance. These inquiries
generally have been directed to all life insurers licensed in their respective states, including Metropolitan Life and certain of its affiliates. The New YorkInsurance Department has concluded its examination of Metropolitan Life concerning possible past race-conscious underwriting practices. MetropolitanLife has cooperated fully with that inquiry. Four purported class action lawsuits filed against Metropolitan Life in 2000 and 2001 alleging racialdiscrimination in the marketing, sale, and administration of life insurance policies have been consolidated in the United States District Court for theSouthern District of New York. The plaintiffs seek unspecified monetary damages, punitive damages, reformation, imposition of a constructive trust, adeclaration that the alleged practices are discriminatory and illegal, injunctive relief requiring Metropolitan Life to discontinue the alleged discriminatorypractices and adjust policy values, and other relief. Metropolitan Life has entered into settlement agreements to resolve the regulatory examination andthe actions pending in the United States District Court for the Southern District of New York. The class action settlement, which has received preliminaryapproval from the court, must receive final approval before it can be implemented. A fairness hearing was held on February 7, 2003. The regulatorysettlement agreement is conditioned upon final approval of the class action settlement. Metropolitan Life recorded a charge in the fourth quarter of 2001in connection with the anticipated resolution of these matters and believes that charge is adequate to cover the costs associated with these settlements.
Sixteen lawsuits involving approximately 125 plaintiffs have been filed in federal and state court in Alabama, Mississippi and Tennessee allegingfederal and/or state law claims of racial discrimination in connection with the sale, formation, administration or servicing of life insurance policies.Metropolitan Life is contesting vigorously plaintiffs’ claims in these actions.
OtherIn 2001, a putative class action was filed against Metropolitan Life in the United States District Court for the Southern District of New York alleging
gender discrimination and retaliation in the MetLife Financial Services unit of the Individual segment. The plaintiffs seek unspecified compensatorydamages, punitive damages, a declaration that the alleged practices are discriminatory and illegal, injunctive relief requiring Metropolitan Life todiscontinue the alleged discriminatory practices, an order restoring class members to their rightful positions (or appropriate compensation in lieu thereof),and other relief. Metropolitan Life is vigorously defending itself against these allegations.
A lawsuit has been filed against Metropolitan Life in Ontario, Canada by Clarica Life Insurance Company regarding the sale of the majority ofMetropolitan Life’s Canadian operation to Clarica in 1998. Clarica alleges that Metropolitan Life breached certain representations and warrantiescontained in the sale agreement, that Metropolitan Life made misrepresentations upon which Clarica relied during the negotiations and that Metropolitan
MetLife, Inc.F-34
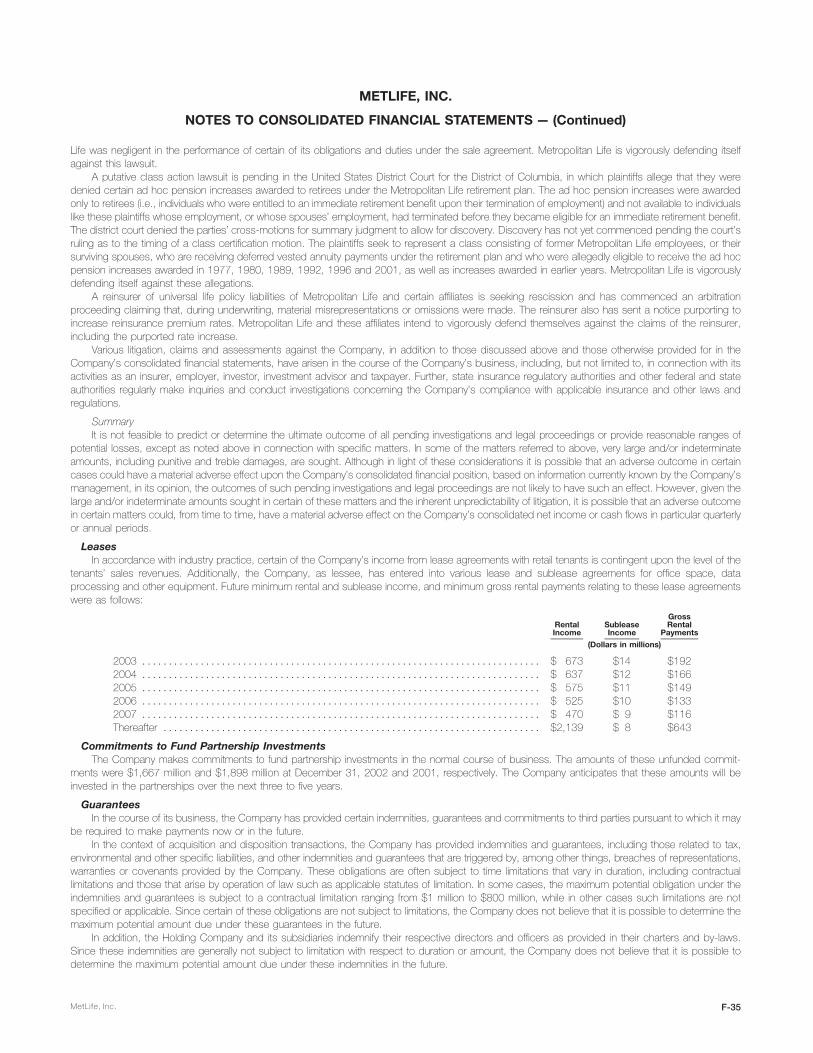
METLIFE, INC.
NOTES TO CONSOLIDATED FINANCIAL STATEMENTS — (Continued)
Life was negligent in the performance of certain of its obligations and duties under the sale agreement. Metropolitan Life is vigorously defending itselfagainst this lawsuit.
A putative class action lawsuit is pending in the United States District Court for the District of Columbia, in which plaintiffs allege that they weredenied certain ad hoc pension increases awarded to retirees under the Metropolitan Life retirement plan. The ad hoc pension increases were awardedonly to retirees (i.e., individuals who were entitled to an immediate retirement benefit upon their termination of employment) and not available to individualslike these plaintiffs whose employment, or whose spouses’ employment, had terminated before they became eligible for an immediate retirement benefit.The district court denied the parties’ cross-motions for summary judgment to allow for discovery. Discovery has not yet commenced pending the court’sruling as to the timing of a class certification motion. The plaintiffs seek to represent a class consisting of former Metropolitan Life employees, or theirsurviving spouses, who are receiving deferred vested annuity payments under the retirement plan and who were allegedly eligible to receive the ad hocpension increases awarded in 1977, 1980, 1989, 1992, 1996 and 2001, as well as increases awarded in earlier years. Metropolitan Life is vigorouslydefending itself against these allegations.
A reinsurer of universal life policy liabilities of Metropolitan Life and certain affiliates is seeking rescission and has commenced an arbitrationproceeding claiming that, during underwriting, material misrepresentations or omissions were made. The reinsurer also has sent a notice purporting toincrease reinsurance premium rates. Metropolitan Life and these affiliates intend to vigorously defend themselves against the claims of the reinsurer,including the purported rate increase.
Various litigation, claims and assessments against the Company, in addition to those discussed above and those otherwise provided for in theCompany’s consolidated financial statements, have arisen in the course of the Company’s business, including, but not limited to, in connection with itsactivities as an insurer, employer, investor, investment advisor and taxpayer. Further, state insurance regulatory authorities and other federal and stateauthorities regularly make inquiries and conduct investigations concerning the Company’s compliance with applicable insurance and other laws andregulations.
SummaryIt is not feasible to predict or determine the ultimate outcome of all pending investigations and legal proceedings or provide reasonable ranges of
potential losses, except as noted above in connection with specific matters. In some of the matters referred to above, very large and/or indeterminateamounts, including punitive and treble damages, are sought. Although in light of these considerations it is possible that an adverse outcome in certaincases could have a material adverse effect upon the Company’s consolidated financial position, based on information currently known by the Company’smanagement, in its opinion, the outcomes of such pending investigations and legal proceedings are not likely to have such an effect. However, given thelarge and/or indeterminate amounts sought in certain of these matters and the inherent unpredictability of litigation, it is possible that an adverse outcomein certain matters could, from time to time, have a material adverse effect on the Company’s consolidated net income or cash flows in particular quarterlyor annual periods.
LeasesIn accordance with industry practice, certain of the Company’s income from lease agreements with retail tenants is contingent upon the level of the
tenants’ sales revenues. Additionally, the Company, as lessee, has entered into various lease and sublease agreements for office space, dataprocessing and other equipment. Future minimum rental and sublease income, and minimum gross rental payments relating to these lease agreementswere as follows:
GrossRental Sublease RentalIncome Income Payments
(Dollars in millions)
2003 *************************************************************************** $ 673 $14 $1922004 *************************************************************************** $ 637 $12 $1662005 *************************************************************************** $ 575 $11 $1492006 *************************************************************************** $ 525 $10 $1332007 *************************************************************************** $ 470 $ 9 $116Thereafter *********************************************************************** $2,139 $ 8 $643
Commitments to Fund Partnership InvestmentsThe Company makes commitments to fund partnership investments in the normal course of business. The amounts of these unfunded commit-
ments were $1,667 million and $1,898 million at December 31, 2002 and 2001, respectively. The Company anticipates that these amounts will beinvested in the partnerships over the next three to five years.
GuaranteesIn the course of its business, the Company has provided certain indemnities, guarantees and commitments to third parties pursuant to which it may
be required to make payments now or in the future.In the context of acquisition and disposition transactions, the Company has provided indemnities and guarantees, including those related to tax,
environmental and other specific liabilities, and other indemnities and guarantees that are triggered by, among other things, breaches of representations,warranties or covenants provided by the Company. These obligations are often subject to time limitations that vary in duration, including contractuallimitations and those that arise by operation of law such as applicable statutes of limitation. In some cases, the maximum potential obligation under theindemnities and guarantees is subject to a contractual limitation ranging from $1 million to $800 million, while in other cases such limitations are notspecified or applicable. Since certain of these obligations are not subject to limitations, the Company does not believe that it is possible to determine themaximum potential amount due under these guarantees in the future.
In addition, the Holding Company and its subsidiaries indemnify their respective directors and officers as provided in their charters and by-laws.Since these indemnities are generally not subject to limitation with respect to duration or amount, the Company does not believe that it is possible todetermine the maximum potential amount due under these indemnities in the future.
MetLife, Inc. F-35

METLIFE, INC.
NOTES TO CONSOLIDATED FINANCIAL STATEMENTS — (Continued)
The Company has not recorded any liability for these indemnities, guarantees and commitments in the accompanying consolidated balance sheetsfor the years ended December 31, 2002 or 2001.
12. Acquisitions and Dispositions
DispositionsIn July 2001, the Company completed its sale of Conning Corporation (‘‘Conning’’), an affiliate acquired in the acquisition of GenAmerica Financial
Corporation (‘‘GenAmerica’’). Conning specialized in asset management for insurance company investment portfolios and investment research. TheCompany received $108 million in the transaction and reported a gain of approximately $25 million in the third quarter of 2001.
In October 2000, the Company completed the sale of its 48% ownership interest in its affiliates, Nvest, L.P. and Nvest Companies L.P. Thistransaction resulted in an investment gain of $663 million.
AcquisitionsIn June 2002, the Company acquired Aseguradora Hidalgo S.A. (‘‘Hidalgo’’), an insurance company based in Mexico with approximately $2.5 billion
in assets as of the date of acquisition. The purchase price is subject to adjustment under certain provisions of the purchase agreement. The Companydoes not expect that any purchase price adjustment will have an impact on its consolidated statements of income. The Company is in the process ofintegrating Hidalgo and Seguros Genesis, S.A., MetLife’s wholly-owned Mexican subsidiary headquartered in Mexico City, to operate as a combinedentity under the name MetLife Mexico.
In November 2001, the Company acquired Compania de Seguros de Vida Santander S.A. and Compania de Reaseguros de Vida Soince Re S.A.,wholly-owned subsidiaries of Santander Hispano in Chile. These acquisitions marked MetLife’s entrance into the Chilean insurance market.
In January 2000, Metropolitan Life completed its acquisition of GenAmerica, a holding company which included General American Life InsuranceCompany, approximately 49% of the outstanding shares of RGA common stock, and 61% of the outstanding shares of Conning common stock whichwas subsequently sold in 2001. Metropolitan Life owned 9% of the outstanding shares of RGA common stock prior to the completion of the GenAmericaacquisition. During 2002, the Company purchased an additional 327,600 shares of RGA’s outstanding common stock at an aggregate price of$9.5 million to offset potential future dilution of the Company’s holding of RGA’s common stock arising from the issuance by RGA of company-obligatedmandatorily redeemable securities of a subsidiary trust in December 2001. These purchases increased the Company’s ownership percentage ofoutstanding shares of RGA common stock from approximately 58% at December 31, 2001 to approximately 59% at December 31, 2002.
In April 2000, Metropolitan Life acquired the outstanding shares of Conning common stock not already owned by Metropolitan Life for $73 million.
13. Business Realignment Initiatives
During the fourth quarter of 2001, the Company implemented several business realignment initiatives, which resulted from a strategic review ofoperations and an ongoing commitment to reduce expenses. The following tables represent the original expenses recorded in the fourth quarter of 2001and the remaining liability as of December 31, 2002:
Pre-tax Charges Recorded in the Fourth Quarter of 2001
Institutional Individual Auto & Home Total
(Dollars in millions)
Severance and severance-related costs **************************************** $ 9 $32 $ 3 $ 44Facilities’ consolidation costs ************************************************** 3 65 — 68Business exit costs********************************************************** 387 — — 387
Total ************************************************************** $399 $97 $ 3 $499
Remaining Liability as of December 31, 2002
Institutional Individual Auto & Home Total
(Dollars in millions)
Severance and severance-related costs **************************************** $— $ 1 $— $ 1Facilities’ consolidation costs ************************************************** — 17 — 17Business exit costs********************************************************** 40 — — 40
Total ************************************************************** $40 $18 $— $58
The business realignment initiatives resulted in savings of approximately $95 million, net of income tax, during 2002, comprised of approximately$33 million, $57 million and $5 million in the Institutional, Individual and Auto & Home segments, respectively.
Institutional. The charges to this segment in the fourth quarter of 2001 include costs associated with exiting a business, including the write-off ofgoodwill, severance and severance-related costs, and facilities’ consolidation costs. These expenses are the result of the discontinuance of certain401(k) recordkeeping services and externally-managed guaranteed index separate accounts. These actions resulted in charges to policyholder benefitsand claims and other expenses of $215 million and $184 million, respectively. During the fourth quarter of 2002, approximately $30 million of the chargesrecorded in 2001 were released into income primarily as a result of the accelerated implementation of the Company’s exit from the large market401(k) business. The business realignment initiatives will ultimately result in the elimination of approximately 930 positions. As of December 31, 2002,there were approximately 340 terminations to be completed. The Company continues to carry a liability as of December 31, 2002 since the exit plancould not be completed within one year due to circumstances outside the Company’s control and since certain of its contractual obligations extendedbeyond one year.
Individual. The charges to this segment in the fourth quarter of 2001 include facilities’ consolidation costs, severance and severance-related costs,which predominately stem from the elimination of approximately 560 non-sales positions and 190 operations and technology positions supporting thissegment. As of December 31, 2002, there were approximately 25 terminations to be completed. These costs were recorded in other expenses. Theremaining liability as of December 31, 2002 is due to certain contractual obligations that extended beyond one year.
MetLife, Inc.F-36
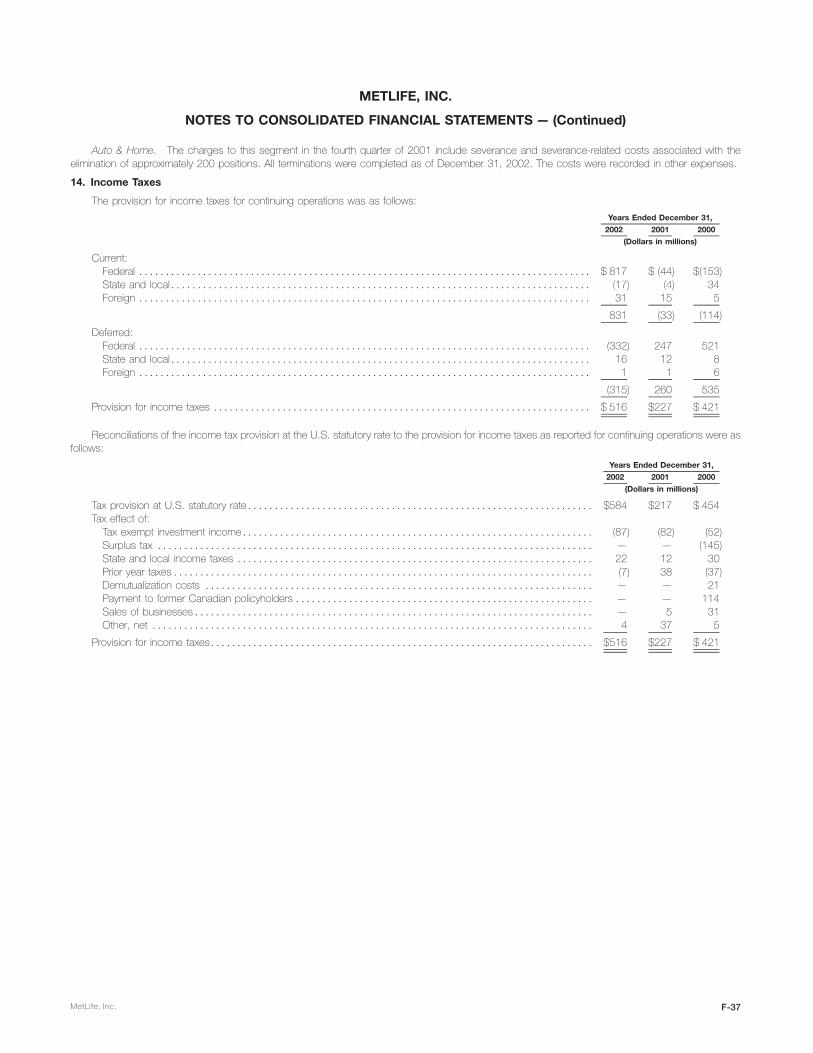
METLIFE, INC.
NOTES TO CONSOLIDATED FINANCIAL STATEMENTS — (Continued)
Auto & Home. The charges to this segment in the fourth quarter of 2001 include severance and severance-related costs associated with theelimination of approximately 200 positions. All terminations were completed as of December 31, 2002. The costs were recorded in other expenses.
14. Income Taxes
The provision for income taxes for continuing operations was as follows:
Years Ended December 31,
2002 2001 2000
(Dollars in millions)
Current:Federal ************************************************************************************* $ 817 $ (44) $(153)State and local******************************************************************************* (17) (4) 34Foreign ************************************************************************************* 31 15 5
831 (33) (114)
Deferred:Federal ************************************************************************************* (332) 247 521State and local******************************************************************************* 16 12 8Foreign ************************************************************************************* 1 1 6
(315) 260 535
Provision for income taxes *********************************************************************** $ 516 $227 $ 421
Reconciliations of the income tax provision at the U.S. statutory rate to the provision for income taxes as reported for continuing operations were asfollows:
Years Ended December 31,
2002 2001 2000
(Dollars in millions)
Tax provision at U.S. statutory rate***************************************************************** $584 $217 $ 454Tax effect of:
Tax exempt investment income****************************************************************** (87) (82) (52)Surplus tax ********************************************************************************** — — (145)State and local income taxes ******************************************************************* 22 12 30Prior year taxes******************************************************************************* (7) 38 (37)Demutualization costs ************************************************************************* — — 21Payment to former Canadian policyholders ******************************************************** — — 114Sales of businesses*************************************************************************** — 5 31Other, net *********************************************************************************** 4 37 5
Provision for income taxes************************************************************************ $516 $227 $ 421
MetLife, Inc. F-37
METLIFE, INC.
NOTES TO CONSOLIDATED FINANCIAL STATEMENTS — (Continued)
Deferred income taxes represent the tax effect of the differences between the book and tax bases of assets and liabilities. Net deferred income taxassets and liabilities consisted of the following:
December 31,
2002 2001
(Dollars in millions)
Deferred income tax assets:Policyholder liabilities and receivables **************************************************************** $ 3,845 $ 3,727Net operating losses ****************************************************************************** 322 336Employee benefits ******************************************************************************** — 123Litigation related ********************************************************************************** 99 279Intangible tax asset ******************************************************************************* 199 —Other******************************************************************************************* 386 438
4,851 4,903Less: Valuation allowance************************************************************************** 84 114
4,767 4,789
Deferred income tax liabilities:Investments ************************************************************************************* 1,681 2,157Deferred policy acquisition costs ******************************************************************** 3,307 2,950Employee benefits ******************************************************************************** 55 —Net unrealized investment gains********************************************************************* 1,264 1,079Other******************************************************************************************* 85 129
6,392 6,315
Net deferred income tax liability *********************************************************************** $(1,625) $(1,526)
Domestic net operating loss carryforwards amount to $656 million at December 31, 2002 and will expire beginning in 2019. Foreign net operatingloss carryforwards amount to $300 million at December 31, 2002 and were generated in various foreign countries with expiration periods of five years toinfinity.
The Company has recorded a valuation allowance related to tax benefits of certain foreign net operating loss carryforwards. The valuation allowancereflects management’s assessment, based on available information, that it is more likely than not that the deferred income tax asset for certain foreign netoperating loss carryforwards will not be realized. The tax benefit will be recognized when management believes that it is more likely than not that thesedeferred income tax assets are realizable.
The Internal Revenue Service has audited the Company for the years through and including 1996. The Company is being audited for the years1997, 1998 and 1999. The Company believes that any adjustments that might be required for open years will not have a material effect on theCompany’s consolidated financial statements.
15. Reinsurance
The Company’s life insurance operations participate in reinsurance activities in order to limit losses, minimize exposure to large risks, and to provideadditional capacity for future growth. The Company currently reinsures up to 90% of the mortality risk for all new individual life insurance policies that itwrites through its various franchises. This practice was initiated by different franchises for different products starting at various points in time between1992 and 2000. Risks in excess of $25 million on single life policies and $30 million on survivorship policies are 100% coinsured. In addition, in 1998, theCompany reinsured substantially all of the mortality risk on its universal life policies issued since 1983. RGA retains a maximum of $4 million of coverageper individual life with respect to its assumed reinsurance business. The company reinsures its business through a diversified group of reinsurers.Placement of reinsurance is done primarily on an automatic basis and also on a facultative basis for risks of specific characteristics. The Company iscontingently liable with respect to ceded reinsurance should any reinsurer be unable to meet its obligations under these agreements.
In addition to reinsuring mortality risk, the Company reinsures other risks and specific coverages. The Company routinely reinsures certain classes ofrisks in order to limit its exposure to particular travel, avocation and lifestyle hazards. The Company has exposure to catastrophes, which are an inherentrisk of the property and casualty business and could contribute to significant fluctuations in the Company’s results of operations. The Company usesexcess of loss and quota share reinsurance arrangements to limit its maximum loss, provide greater diversification of risk and minimize exposure to largerrisks.
The Company has also protected itself through the purchase of combination risk coverage. This reinsurance coverage pools risks from several linesof business and includes individual and group life claims in excess of $2 million per policy, as well as excess property and casualty losses, among others.
See Note 11 for information regarding certain excess of loss reinsurance agreements providing coverage for risks associated primarily with salespractices claims.
MetLife, Inc.F-38

METLIFE, INC.
NOTES TO CONSOLIDATED FINANCIAL STATEMENTS — (Continued)
The amounts in the consolidated statements of income are presented net of reinsurance ceded. The effects of reinsurance were as follows:
Years Ended December 31,
2002 2001 2000
(Dollars in millions)
Direct premiums ********************************************************************** $18,392 $16,332 $15,661Reinsurance assumed ***************************************************************** 3,018 2,907 2,918Reinsurance ceded ******************************************************************* (2,324) (2,027) (2,262)
Net premiums ************************************************************************ $19,086 $17,212 $16,317
Reinsurance recoveries netted against policyholder benefits ********************************** $ 3,043 $ 2,255 $ 1,942
Reinsurance recoverables, included in premiums and other receivables, were $3,574 million and $3,393 million at December 31, 2002 and 2001,respectively, including $1,348 million and $1,356 million, respectively, relating to reinsurance of long-term guaranteed interest contracts and structuredsettlement lump sum contracts accounted for as a financing transaction. Reinsurance and ceded commissions payables, included in other liabilities,were $50 million and $112 million at December 31, 2002 and 2001, respectively.
The following provides an analysis of the activity in the liability for benefits relating to property and casualty and group accident and non-medicalhealth policies and contracts:
Years Ended December 31,
2002 2001 2000
(Dollars in millions)
Balance at January 1******************************************************************** $ 4,597 $ 4,226 $ 3,790Reinsurance recoverables ************************************************************** (457) (410) (415)
Net balance at January 1 **************************************************************** 4,140 3,816 3,375
Incurred related to:Current year ************************************************************************* 4,215 4,182 3,786Prior years *************************************************************************** (85) (84) (112)
4,130 4,098 3,674
Paid related to:Current year ************************************************************************* (2,559) (2,538) (2,215)Prior years *************************************************************************** (1,332) (1,236) (1,018)
(3,891) (3,774) (3,233)
Net Balance at December 31 ************************************************************* 4,379 4,140 3,816Add: Reinsurance recoverables ********************************************************* 481 457 410
Balance at December 31 **************************************************************** $ 4,860 $ 4,597 $ 4,226
16. Other Expenses
Other expenses were comprised of the following:
Years Ended December 31,
2002 2001 2000
(Dollars in millions)
Compensation************************************************************************** $ 2,481 $ 2,459 $ 2,712Commissions ************************************************************************** 2,000 1,651 1,696Interest and debt issue costs ************************************************************* 403 332 436Amortization of policy acquisition costs (excludes amortization of $5, $25 and ($95), respectively,
related to net investment losses) ******************************************************** 1,639 1,413 1,478Capitalization of policy acquisition costs **************************************************** (2,340) (2,039) (1,863)Rent, net of sublease income************************************************************* 295 282 230Minority interest************************************************************************* 73 57 115Other ********************************************************************************* 2,510 2,867 2,597
Total other expenses **************************************************************** $ 7,061 $ 7,022 $ 7,401
17. Stockholders’ Equity
Preferred StockOn September 29, 1999, the Holding Company adopted a stockholder rights plan (the ‘‘rights plan’’) under which each outstanding share of
common stock issued between April 4, 2000 and the distribution date (as defined in the rights plan) will be coupled with a stockholder right. Each rightwill entitle the holder to purchase one one-hundredth of a share of Series A Junior Participating Preferred Stock. Each one one-hundredth of a share ofSeries A Junior Participating Preferred Stock will have economic and voting terms equivalent to one share of common stock. Until it is exercised, the rightitself will not entitle the holder thereof to any rights as a stockholder, including the right to receive dividends or to vote at stockholder meetings.
MetLife, Inc. F-39

METLIFE, INC.
NOTES TO CONSOLIDATED FINANCIAL STATEMENTS — (Continued)
Stockholder rights are not exercisable until the distribution date, and will expire at the close of business on April 4, 2010, unless earlier redeemed orexchanged by the Holding Company. The rights plan is designed to protect stockholders in the event of unsolicited offers to acquire the HoldingCompany and other coercive takeover tactics.
Common StockOn the date of demutualization, the Holding Company conducted an initial public offering of 202,000,000 shares of its common stock and
concurrent private placements of an aggregate of 60,000,000 shares of its common stock at an initial public offering price of $14.25 per share. Theshares of common stock issued in the offerings were in addition to 494,466,664 shares of common stock of the Holding Company distributed to theMetLife Policyholder Trust for the benefit of policyholders of Metropolitan Life in connection with the demutualization. On April 10, 2000, the HoldingCompany issued 30,300,000 additional shares of common stock as a result of the exercise of over-allotment options granted to underwriters in the initialpublic offering.
On February 19, 2002, the Holding Company’s Board of Directors authorized a $1 billion common stock repurchase program. This program beganafter the completion of the March 28, 2001 and June 27, 2000 repurchase programs, each of which authorized the repurchase of $1 billion of commonstock. Under these authorizations, the Holding Company may purchase common stock from the MetLife Policyholder Trust, in the open market and inprivately negotiated transactions.
On August 7, 2001, the Company purchased 10 million shares of its common stock as part of the sale of 25 million shares of MetLife commonstock by Santusa Holdings, S.L., an affiliate of Banco Santander Central Hispano, S.A. The sale by Santusa Holdings, S.L. was made pursuant to a shelfregistration statement, effective June 29, 2001.
The Company acquired 15,244,492, 45,242,966 and 26,108,315 shares of common stock for $471 million, $1,322 million and $613 million duringthe years ended December 31, 2002, 2001 and 2000, respectively. At December 31, 2002, the Company had approximately $806 million remaining onits existing share repurchase authorization.
Dividend RestrictionsUnder the New York Insurance Law, Metropolitan Life is permitted without prior insurance regulatory clearance to pay a stockholder dividend to the
Holding Company as long as the aggregate amount of all such dividends in any calendar year does not exceed the lesser of (i) 10% of its surplus topolicyholders as of the immediately preceding calendar year and (ii) its statutory net gain from operations for the immediately preceding calendar year(excluding realized capital gains). Metropolitan Life will be permitted to pay a stockholder dividend to the Holding Company in excess of the lesser of suchtwo amounts only if it files notice of its intention to declare such a dividend and the amount thereof with the Superintendent and the Superintendent doesnot disapprove the distribution. Under the New York Insurance Law, the Superintendent has broad discretion in determining whether the financialcondition of a stock life insurance company would support the payment of such dividends to its stockholders. The Department has established informalguidelines for such determinations. The guidelines, among other things, focus on the insurer’s overall financial condition and profitability under statutoryaccounting practices. For the year ended December 31, 2002, Metropolitan Life paid to MetLife, Inc. $535 million in dividends for which prior insuranceregulatory clearance was not required and $369 million in special dividends, as approved by the Superintendent. For the year ended December 31,2001, Metropolitan Life paid to MetLife, Inc. $721 million in dividends for which prior insurance regulatory clearance was not required and $3,033 millionin special dividends, as approved by the Superintendent. For the year ended December 31, 2000, Metropolitan Life paid to MetLife, Inc. $763 million individends for which prior insurance regulatory clearance was not required. At December 31, 2002, Metropolitan Life could pay the Holding Company adividend of $662 million without prior approval of the Superintendent.
MIAC paid to MetLife, Inc. $25 million and $31 million in dividends for which prior insurance regulatory clearance was not required for the yearsended December 31, 2002 and 2001, respectively. MIAC is subject to similar restrictions based on the regulations of its state of domicile, and atDecember 31, 2002, could pay the Holding Company dividends of $104 million without prior approval.
Stock Compensation PlansUnder the MetLife, Inc. 2000 Stock Incentive Plan (the ‘‘Stock Incentive Plan’’), awards granted may be in the form of non-qualified or incentive stock
options qualifying under Section 422A of the Internal Revenue Code. Under the MetLife, Inc. 2000 Directors Stock Plan, (the ‘‘Directors Stock Plan’’)awards granted may be in the form of stock awards or non-qualified stock options or a combination of the foregoing to outside Directors of the Company.The aggregate number of shares of stock that may be awarded under the Stock Incentive Plan is subject to a maximum limit of 37,823,333 shares for theduration of the plan. The Directors Stock Plan has a maximum limit of 500,000 share awards.
All options granted have an exercise price equal to the fair market value price of the Company’s common stock on the date of grant, and an option’smaximum term is ten years. Certain options under the Stock Incentive Plan become exercisable over a three-year period commencing with date of grant,while other options become exercisable three years after the date of grant. Options issued under the Directors Stock Plan are exercisable at any timeafter April 7, 2002.
The Company applies APB 25 and related interpretations in accounting for its stock-based compensation plans. Accordingly, in the measurement ofcompensation expense, the Company utilizes the excess of market price over exercise price on the first date that both the number of shares and awardprice are known. For the years ended December 31, 2002 and 2001, compensation expense for non-employees related to the Company’s StockIncentive Plan and Directors Stock Plan was $2 million and $1 million, respectively.
MetLife, Inc.F-40

METLIFE, INC.
NOTES TO CONSOLIDATED FINANCIAL STATEMENTS — (Continued)
Had compensation cost for the Company’s Stock Incentive Plan and Directors Stock Plan been determined based on fair value at the grant date forawards under those plans consistent with the method of SFAS No. 123, the Company’s net income and earnings per share would have been reduced tothe pro forma amounts below:
Years Ended December 31,
2002 2001
(Dollars in millions,except per share data)
Net IncomeAs reported******************************************************************************** $1,605 $ 473
Pro forma(1)(2) ***************************************************************************** $1,563 $ 454
Basic earnings per shareAs reported******************************************************************************** $ 2.28 $0.64
Pro forma(1)(2) ***************************************************************************** $ 2.22 $0.61
Diluted earnings per shareAs reported******************************************************************************** $ 2.20 $0.62
Pro forma(1)(2) ***************************************************************************** $ 2.14 $0.59
(1) The pro forma earnings disclosures are not necessarily representative of the effects on net income and earnings per share in future years.(2) Includes the Company’s ownership share of compensation costs related to RGA’s incentive stock plan determined in accordance with SFAS 123.
The fair value of each option grant is estimated on the date of the grant using the Black-Scholes options-pricing model with the following weightedaverage assumptions used for grants for the:
Years Ended December 31,
2002 2001
Dividend yield *********************************************************************** 0.68% 0.68%Risk-free rate of return**************************************************************** 4.74% – 5.52% 5.72%Volatility **************************************************************************** 25.3% – 30.3% 31.6%Expected duration ******************************************************************* 4 – 6 years 4 – 6 years
A summary of the status of options included in the Company’s Stock Incentive Plan and Directors Stock Plan is presented below:
Weighted WeightedAverage Options Average
Options Exercise Price Exercisable Exercise Price
Outstanding at December 31, 2000************************************* — $ — — $ —Granted ************************************************************ 12,263,550 $29.93 — $ —Canceled/expired **************************************************** (1,158,025) $29.95 — $ —
Outstanding at December 31, 2001************************************* 11,105,525 $29.93 — $ —Granted ************************************************************ 7,275,855 $30.35 — $ —Exercised *********************************************************** (11,401) $29.95 — $ —Canceled/expired **************************************************** (2,098,821) $30.07 — $ —
Outstanding at December 31, 2002************************************* 16,271,158 $30.10 1,357,034 $30.01
Years EndedDecember 31,
2002 2001
Weighted average fair value of options granted ************************************************ $10.48 $10.29
The following table summarizes information about stock options outstanding at December 31, 2002:
NumberNumber Weighted Average Weighted Exercisable at Weighted
Outstanding at Remaining Contractual Average December 31, AverageRange of Exercise Prices December 31, 2002 Life (Years) Exercise Price 2002 Exercise Price
$23.75 – $26.75 28,000 9.76 $23.75 — $ —$26.76 – $28.75 150,400 9.21 $27.36 — $ —$28.76 – $30.75 15,887,628 8.34 $30.11 1,319,253 $29.93$30.76 – $32.75 180,600 8.48 $31.92 13,251 $30.95$32.76 – $33.64 24,530 9.32 $33.64 24,530 $33.64
16,271,158 8.26 $30.10 1,357,034 $30.01
MetLife, Inc. F-41
METLIFE, INC.
NOTES TO CONSOLIDATED FINANCIAL STATEMENTS — (Continued)
Statutory Equity and IncomeApplicable insurance department regulations require that the insurance subsidiaries prepare statutory financial statements in accordance with
statutory accounting practices prescribed or permitted by the insurance department of the state of domicile. Statutory accounting practices primarily differfrom GAAP by charging policy acquisition costs to expense as incurred, establishing future policy benefit liabilities using different actuarial assumptions,reporting surplus notes as surplus instead of debt and valuing securities on a different basis. As of December 31, 2001, New York Statutory AccountingPractices did not provide for deferred income taxes. The Department has adopted a modification to its regulations, effective December 31, 2002, withrespect to the admissibility of deferred taxes by New York insurers, subject to certain limitations. Statutory net income of Metropolitan Life, as filed with theDepartment, was $1,478 million, $2,782 million and $1,027 million for the years ended 2002, 2001 and 2000, respectively; statutory capital and surplus,as filed, was $6,986 million and $5,358 million at December 31, 2002 and 2001, respectively.
The National Association of Insurance Commissioners (‘‘NAIC’’) adopted the Codification of Statutory Accounting Principles (the ‘‘Codification’’),which is intended to standardize regulatory accounting and reporting to state insurance departments, and became effective January 1, 2001. However,statutory accounting principles continue to be established by individual state laws and permitted practices. The Department required adoption of theCodification, with certain modifications, for the preparation of statutory financial statements effective January 1, 2001. Further modifications by stateinsurance departments may impact the effect of the Codification on the statutory capital and surplus of Metropolitan Life and the Holding Company’sother insurance subsidiaries.
18. Other Comprehensive Income
The following table sets forth the reclassification adjustments required for the years ended December 31, 2002, 2001 and 2000 to avoid double-counting in other comprehensive income (loss) items that are included as part of net income for the current year that have been reported as a part ofother comprehensive income (loss) in the current or prior year:
Years Ended December 31,
2002 2001 2000
(Dollars in millions)
Holding gains on investments arising during the year ********************************************** $ 3,722 $1,319 $2,789Income tax effect of holding gains ************************************************************** (1,169) (520) (969)Reclassification adjustments:
Recognized holding losses included in current year income*************************************** 369 534 989Amortization of premiums and accretion of discounts associated with investments ******************** (526) (488) (499)Recognized holding gains allocated to other policyholder amounts ********************************* (145) (134) (54)Income tax effect ************************************************************************** 95 35 (151)
Allocation of holding losses on investments relating to other policyholder amounts ********************** (2,832) (69) (971)Income tax effect of allocation of holding losses to other policyholder amounts************************* 889 27 338
Net unrealized investment gains **************************************************************** 403 704 1,472Foreign currency translation adjustment********************************************************** (69) (60) (6)Minimum pension liability adjustment ************************************************************ — (18) (9)
Other comprehensive income ****************************************************************** $ 334 $ 626 $1,457
19. Earnings Per Share and Earnings After Date of Demutualization
Net income after the date of demutualization is based on the results of operations after March 31, 2000, adjusted for the payments to the formerCanadian policyholders and costs of demutualization recorded in April 2000 which are applicable to the period prior to April 7, 2000.
MetLife, Inc.F-42

METLIFE, INC.
NOTES TO CONSOLIDATED FINANCIAL STATEMENTS — (Continued)
The following presents a reconciliation of the weighted average shares used in calculating basic earnings per share to those used in calculatingdiluted earnings per share:
For the Years Ended December 31,
2002 2001 2000
(Dollars in millions, except share and per sharedata)
Weighted average common stock outstanding for basic earnings per share *************** 704,599,115 741,041,654 772,027,666Incremental shares from assumed:
Conversion of forward purchase contracts***************************************** 24,596,950 25,974,114 16,480,028Exercise of stock options ******************************************************* 5,233 1,133 —
Weighted average common stock outstanding for diluted earnings per share************** 729,201,298 767,016,901 788,507,694
Income from Continuing Operations******************************************** $ 1,155 $ 387 $ 1,114(1)
Basic earnings per share ******************************************************* $ 1.64 $ 0.52 $ 1.44
Diluted earnings per share ****************************************************** $ 1.58 $ 0.51 $ 1.41
Income from Discontinued Operations ***************************************** $ 450 $ 86 $ 59(1)
Basic earnings per share ******************************************************* $ 0.64 $ 0.12 $ 0.08
Diluted earnings per share ****************************************************** $ 0.62 $ 0.11 $ 0.08
Net Income ******************************************************************* $ 1,605 $ 473 $ 1,173(1)
Basic earnings per share ******************************************************* $ 2.28 $ 0.64 $ 1.52
Diluted earnings per share ****************************************************** $ 2.20 $ 0.62 $ 1.49
(1) For the period April 7, 2000 through December 31, 2000.
20. Quarterly Results of Operations (Unaudited)
The unaudited quarterly results of operations for the years ended December 31, 2002 and 2001 are summarized in the table below:
Three Months Ended
March 31 June 30 September 30 December 31
(Dollars in millions, except per share data)2002Total revenues******************************************************* $7,973 $8,244 $8,120 $8,810Total expenses ****************************************************** $7,482 $7,715 $7,686 $8,593Income from continuing operations************************************** $ 305 $ 368 $ 311 $ 171Income before cumulative effect of change in accounting******************* $ 324 $ 387 $ 333 $ 561Net income ********************************************************* $ 329 $ 387 $ 328 $ 561Basic earnings per share
Income from continuing operations************************************ $ 0.43 $ 0.52 $ 0.44 $ 0.24Income before cumulative effect of change in accounting***************** $ 0.46 $ 0.55 $ 0.47 $ 0.80Net income ******************************************************* $ 0.46 $ 0.55 $ 0.47 $ 0.80
Diluted earnings per shareIncome from continuing operations************************************ $ 0.41 $ 0.50 $ 0.43 $ 0.24Income before cumulative effect of change in accounting***************** $ 0.44 $ 0.53 $ 0.46 $ 0.78Net income ******************************************************* $ 0.44 $ 0.53 $ 0.45 $ 0.78
2001Total revenues******************************************************* $7,757 $7,627 $7,815 $8,061Total expenses ****************************************************** $7,363 $7,169 $7,603 $8,511Income (loss) from continuing operations********************************* $ 265 $ 296 $ 144 $ (318)Net income (loss) **************************************************** $ 287 $ 320 $ 162 $ (296)Basic earnings per share
Income (loss) from continuing operations******************************* $ 0.35 $ 0.40 $ 0.20 $ (0.44)Net income (loss) ************************************************** $ 0.38 $ 0.43 $ 0.22 $ (0.41)
Diluted earnings per shareIncome (loss) from continuing operations******************************* $ 0.34 $ 0.38 $ 0.19 $ (0.43)Net income (loss) ************************************************** $ 0.37 $ 0.41 $ 0.21 $ (0.40)
Due to changes in the number of average shares outstanding, quarterly earnings per share of common stock do not add to the totals for the years.Unaudited net income for the first quarter of 2002 includes a charge of $48 million related to Metropolitan Life’s wholly-owned subsidiary, General
American, in connection with its former Medicare business and the resolution of a federal government investigation. Unaudited net income for the secondquarter of 2002 includes a benefit of $30 million related to a reduction of the Company’s previously established liability for its sales practice class action
MetLife, Inc. F-43

METLIFE, INC.
NOTES TO CONSOLIDATED FINANCIAL STATEMENTS — (Continued)
settlement recorded in 1999. Unaudited net income for the fourth quarter of 2002 includes a charge of $169 million related to the Company’s asbestos-related litigation, a $20 million benefit related to the reduction of a previously established liability for the Company’s 2001 business realignment initiativesand a $17 million benefit related to the reduction of a previously established liability for disability insurance-related losses from the September 11, 2001tragedies.
Unaudited net income for the third quarter of 2001 includes charges for insurance-related losses of $208 million related to the September 11, 2001tragedies. Unaudited net income for the fourth quarter of 2001 includes charges of $159 million related to a class action lawsuit and a related regulatoryinquiry pending against Metropolitan Life, $330 million related to business realignment initiatives and $74 million related to the establishment of apolicyholder liability for certain group annuity policies.
MetLife, Inc.F-44

METLIFE, INC.
NOTES TO CONSOLIDATED FINANCIAL STATEMENTS — (Continued)
21. Business Segment Information
The Company provides insurance and financial services to customers in the United States, Canada, Central America, South America, Europe, SouthAfrica, Asia and Australia. The Company’s business is divided into six major segments: Individual, Institutional, Reinsurance, Auto & Home, AssetManagement and International. These segments are managed separately because they either provide different products and services, require differentstrategies or have different technology requirements.
Individual offers a wide variety of individual insurance and investment products, including life insurance, annuities and mutual funds. Institutional offersa broad range of group insurance and retirement and savings products and services, including group life insurance, non-medical health insurance suchas short and long-term disability, long-term care, and dental insurance, and other insurance products and services. Reinsurance provides primarilyreinsurance of life and annuity policies in North America and various international markets. Additionally, reinsurance of critical illness policies is provided inselect international markets. Auto & Home provides insurance coverages, including private passenger automobile, homeowners and personal excessliability insurance. Asset Management provides a broad variety of asset management products and services to individuals and institutions. Internationalprovides life insurance, accident and health insurance, annuities and retirement and savings products to both individuals and groups, and auto andhomeowners coverage to individuals.
Set forth in the tables below is certain financial information with respect to the Company’s operating segments as of or for the years endedDecember 31, 2002, 2001 and 2000. The accounting policies of the segments are the same as those described in the summary of significantaccounting policies, except for the method of capital allocation and the accounting for gains and losses from inter-company sales which are eliminated inconsolidation. The Company allocates capital to each segment based upon an internal capital allocation system that allows the Company to moreeffectively manage its capital. The Company evaluates the performance of each operating segment based upon income or loss from operations beforeprovision for income taxes and non-recurring items (e.g. items of unusual or infrequent nature). The Company allocates certain non-recurring items(primarily consisting of expenses associated with the resolution of proceedings alleging race-conscious underwriting practices, sales practices claimsand claims for personal injuries caused by exposure to asbestos or asbestos-containing products and demutualization costs) to Corporate & Other.
Auto & Asset CorporateAt or for the Year Ended December 31, 2002 Individual Institutional Reinsurance Home Management International & Other Total
(Dollars in millions)
Premiums *********************************** $ 4,507 $ 8,254 $ 2,005 $2,828 $ — $1,511 $ (19) $ 19,086Universal life and investment-type product policy
fees ************************************** 1,380 615 — — — 144 — 2,139Net investment income ************************ 6,259 3,928 421 177 59 461 24 11,329Other revenues******************************* 418 609 43 26 166 14 101 1,377Net investment (losses) gains ******************* (164) (506) 2 (46) (4) (9) (57) (784)Policyholder benefits and claims***************** 5,220 9,339 1,554 2,019 — 1,388 3 19,523Interest credited to policyholder account balances** 1,793 932 146 — — 79 — 2,950Policyholder dividends ************************* 1,770 115 22 — — 35 — 1,942Other expenses ****************************** 2,629 1,531 622 793 211 507 768 7,061Income (loss) from continuing operations before
provision for income taxes ******************* 988 983 127 173 10 112 (722) 1,671Income from discontinued operations, net of
income taxes ****************************** 201 123 — — — — 126 450Net income (loss) ***************************** 826 759 84 132 6 84 (286) 1,605Total assets********************************** 138,783 94,950 10,229 4,957 191 8,963 19,312 277,385Deferred policy acquisition costs **************** 8,521 608 1,477 175 — 945 1 11,727Goodwill, net********************************* 223 62 96 155 18 193 3 750Separate account assets ********************** 27,457 31,935 11 — — 307 (17) 59,693Policyholder liabilities ************************** 95,813 55,497 7,387 2,673 — 5,883 (2,011) 165,242Separate account liabilities ********************* 27,457 31,935 11 — — 307 (17) 59,693
MetLife, Inc. F-45

METLIFE, INC.
NOTES TO CONSOLIDATED FINANCIAL STATEMENTS — (Continued)
Auto & Asset CorporateAt or for the Year Ended December 31, 2001 Individual Institutional Reinsurance Home Management International & Other Total
(Dollars in millions)
Premiums *********************************** $ 4,563 $ 7,288 $ 1,762 $2,755 $ — $ 846 $ (2) $ 17,212Universal life and investment-type product policy
fees ************************************** 1,260 592 — — — 38 (1) 1,889Net investment income ************************ 6,188 3,966 390 200 71 267 173 11,255Other revenues******************************* 495 649 42 22 198 16 85 1,507Net investment gains (losses) ******************* 827 (15) (6) (17) 25 (16) (1,401) (603)Policyholder benefits and claims***************** 5,233 8,924 1,484 2,121 — 689 3 18,454Interest credited to policyholder account balances** 1,898 1,013 122 — — 51 — 3,084Policyholder dividends ************************* 1,767 259 24 — — 36 — 2,086Other expenses ****************************** 2,747 1,746 491 800 252 329 657 7,022Income (loss) from continuing operations before
provision for income taxes ******************* 1,688 538 67 39 42 46 (1,806) 614Income from discontinued operations, net of
income taxes ****************************** 38 23 — — — — 25 86Net income (loss) ***************************** 1,095 382 40 41 27 14 (1,126) 473Total assets********************************** 131,314 89,661 7,983 4,581 256 5,308 17,867 256,970Deferred policy acquisition costs **************** 8,757 509 1,196 179 — 525 1 11,167Goodwill, net********************************* 223 55 106 159 20 37 9 609Separate account assets ********************** 31,261 31,177 13 — — 277 (14) 62,714Policyholder liabilities ************************** 88,287 52,075 5,427 2,610 — 3,419 (813) 151,005Separate account liabilities ********************* 31,261 31,177 13 — — 277 (14) 62,714
Auto & Asset CorporateAt or for the Year Ended December 31, 2000 Individual Institutional Reinsurance Home Management International & Other Total
(Dollars in millions)
Premiums *********************************** $ 4,673 $ 6,900 $ 1,450 $2,636 $ — $ 660 $ (2) $ 16,317Universal life and investment-type product policy
fees ************************************** 1,221 547 — — — 53 (1) 1,820Net investment income ************************ 6,108 3,712 379 194 90 254 287 11,024Other revenues******************************* 650 650 29 40 760 9 91 2,229Net investment gains (losses) ******************* 227 (475) (2) (20) — 18 (138) (390)Policyholder benefits and claims***************** 5,054 8,178 1,096 2,005 — 562 (2) 16,893Interest credited to policyholder account balances** 1,680 1,090 109 — — 56 — 2,935Policyholder dividends ************************* 1,742 124 21 — — 32 — 1,919Payments to former Canadian policyholders ******* — — — — — 327 — 327Demutualization costs ************************* — — — — — — 230 230Other expenses ****************************** 3,012 1,514 513 827 784 292 459 7,401Income (loss) from continuing operations before
provision for income taxes ******************* 1,391 428 117 18 66 (275) (450) 1,295Income from discontinued operations, net of
income taxes ****************************** 36 21 — — — — 22 79Net income (loss) ***************************** 920 307 69 30 34 (285) (122) 953
The International segment’s assets at December 31, 2002 and results of operations for the year ended December 31, 2002 include the assets andresults of operations of Hidalgo, a Mexican life insurer that was acquired in June 2002.
For the year ended December 31, 2001 the Institutional, Individual, Reinsurance and Auto & Home segments include $287 million, $24 million,$9 million and $5 million, respectively, of pre-tax losses associated with the September 11, 2001 tragedies. See Note 2.
The Institutional, Individual and Auto & Home segments include $399 million, $97 million and $3 million, respectively, in pre-tax charges associatedwith business realignment initiatives for the year ended December 31, 2001. See Note 13.
For the year ended December 31, 2001, the Individual segment includes $118 million of pre-tax expenses associated with the establishment of apolicyholder liability for certain group annuity policies.
For the year ended December 31, 2001, pre-tax gross investment gains and (losses) of $1,027 million, $142 million and ($1,172) million (comprisedof a $354 million gain and an intercompany elimination of ($1,526) million), resulting from the sale of certain real estate properties from Metropolitan Life toMetropolitan Insurance and Annuity Company, a subsidiary of MetLife, Inc., are included in the Individual segment, Institutional segment and Corporate &Other, respectively.
The Individual segment included an equity ownership interest in Nvest under the equity method of accounting. Nvest was included within the AssetManagement segment due to the types of products and strategies employed by the entity. The Individual segment’s equity in earnings of Nvest, which isincluded in net investment income, was $30 million for the year ended December 31, 2000. The Individual segment includes $538 million (after allocating$118 million to participating contracts) of the pre-tax gross investment gain on the sale of Nvest in 2000.
MetLife, Inc.F-46
METLIFE, INC.
NOTES TO CONSOLIDATED FINANCIAL STATEMENTS — (Continued)
As part of the GenAmerica acquisition in 2000, the Company acquired Conning, the results of which are included in the Asset Managementsegment due to the types of products and strategies employed by the entity from its acquisition date to July 2001, the date of its disposition. TheCompany sold Conning, receiving $108 million in the transaction and reported a gain of approximately $25 million, in the third quarter of 2001.
The Corporate & Other segment consists of various start-up entities, including Grand Bank, N.A., and run-off entities, as well as the elimination of allintersegment amounts. The principal component of the intersegment amounts relates to intersegment loans, which bear interest rates commensuratewith related borrowings. In addition, the elimination of the Individual segment’s ownership interest in Nvest is included for the year ended December 31,2000.
Net investment income and net investment gains and losses are based upon the actual results of each segment’s specifically identifiable assetportfolio adjusted for allocated capital. Other costs and operating costs were allocated to each of the segments based upon: (i) a review of the nature ofsuch costs, (ii) time studies analyzing the amount of employee compensation costs incurred by each segment, and (iii) cost estimates included in theCompany’s product pricing.
Revenues derived from any customer did not exceed 10% of consolidated revenues. Revenues from U.S. operations were $31,026 million,$30,109 million and $30,006 million for the years ended December 31, 2002, 2001 and 2000, respectively, which represented 94%, 96% and 97%,respectively, of consolidated revenues.
22. Discontinued Operations
The Company actively manages its real estate portfolio with the objective to maximize earnings through selective acquisitions and dispositions.Accordingly, the Company sold certain real estate holdings out of its portfolio during 2002. In accordance with SFAS No. 144, income related to realestate classified as held-for-sale on or after January 1, 2002 is presented as discontinued operations.
The following table presents the components of income from discontinued operations:
Years Ended December 31,
2002 2001 2000
(Dollars in millions)
Investment income *************************************************************************** $ 375 $ 422 $ 418Investment expense ************************************************************************** (251) (297) (297)Net investment gains ************************************************************************* 582 — —
Total revenues*********************************************************************** 706 125 121Provision for income taxes********************************************************************* 256 39 42
Income from discontinued operations *************************************************** $ 450 $ 86 $ 79
The carrying value of real estate related to discontinued operations was $223 million and $1,580 million at December 31, 2002 and 2001,respectively. See Note 21 for discontinued operations by business segment.
23. Subsequent Events
In connection with MetLife, Inc.’s initial public offering in April 2000, the Holding Company and MetLife Capital Trust I (the ‘‘Trust’’) issued equitysecurity units (the ‘‘units’’). Each unit originally consisted of (i) a contract to purchase, for $50, shares of the Holding Company’s common stock onMay 15, 2003, and (ii) a capital security of the Trust, with a stated liquidation amount of $50.
In accordance with the terms of the units, the Trust was dissolved on February 5, 2003 and $1,006 million aggregate principal amount8% debentures of the Holding Company (‘‘MetLife debentures’’), the sole asset of the Trust, were distributed to the unitholders in exchange for the capitalsecurities. As required by the terms of the units, the MetLife debentures were remarketed on behalf of the debenture holders on February 12, 2003 andthe interest rate on the MetLife debentures was reset as of February 15, 2003 to 3.911% per annum for a yield to maturity of 2.876%.
MetLife, Inc. F-47


BOARD OF EXECUTIVEDIRECTORS OFFICERS
ROBERT H. BENMOSCHE HARRY P. KAMEN STEWART G. NAGLER ROBERT H. BENMOSCHEChairman of the Board Retired Chairman of the Vice Chairman of the Board Chairman of the Boardand Chief Executive Officer Board and Chief and Chief Financial Officer and Chief Executive OfficerMetLife, Inc. Executive Officer MetLife, Inc.
GERALD CLARKChair, Executive Committee Metropolitan Life Insurance Member, Corporate Social
Vice Chairman of the Board andCompany Responsibility Committee
CURTIS H. BARNETTE Chief Investment OfficerMember, Governance and
Chairman Emeritus JOHN J. PHELAN, JR.Finance Committee and STEWART G. NAGLER
Bethlehem Steel Corporation Former Chairman of the BoardExecutive Committee Vice Chairman of the Board and
Member, Corporate Social and Chief Executive OfficerChief Financial Officer
Responsibility Committee HELENE L. KAPLAN New York Stock Exchange, Inc.Of Counsel Member, Audit Committee, C. ROBERT HENRIKSON
GERALD CLARKSkadden, Arps, Governance and Finance President, U.S. Insurance and
Vice Chairman of the BoardSlate, Meagher & Committee and Executive Financial Services businesses
and Chief Investment OfficerFlom LLP Committee
MetLife, Inc. CATHERINE A. REINChair, GovernanceMember, Corporate Social HUGH B. PRICE President and Chiefand Finance CommitteeResponsibility Committee President and Chief Executive OfficerMember, Corporate Social
Executive Officer MetLife@ Auto & HomeResponsibility CommitteeJOHN C. DANFORTHNational Urban League, Inc.
and Executive CommitteePartner WILLIAM J. TOPPETAChair, Corporate SocialBryan Cave LLP President, MetLife InternationalCATHERINE R. KINNEY Responsibility CommitteeFormer U.S. Senator
Co-Chief Operating Officer, Member, Audit Committee GARY A. BELLERMember, Corporate SocialPresident and Executive Senior Executive Vice PresidentResponsibility Committee WILLIAM C. STEERE, JR.Vice Chairman and General CounselRetired Chairman of the BoardNew York Stock Exchange, Inc.BURTON A. DOLE, JR.
and Chief Executive Officer LISA M. WEBERMember, CompensationRetired Chairman of the BoardPfizer Inc. Senior Executive Vice PresidentCommittee and GovernanceNellcor Puritan Bennett, Inc.Chair, Compensation and Chief Administrative Officerand Finance CommitteeMember, Audit Committee andCommittee
Corporate Social Responsibility DANIEL J. CAVANAGHCHARLES M. LEIGHTON Member, Audit CommitteeCommittee Executive Vice President,Retired Chairman of the Board and Governance and
Operations and Technologyand Chief Executive Officer Finance CommitteeJAMES R. HOUGHTONCML Group, Inc.Chairman of the Board andMember, CompensationChief Executive OfficerCommittee and ExecutiveCorning IncorporatedCommitteeChair, Audit Committee
Member, Governance andFinance Committee andExecutive Committee