Embed Size (px)
Citation preview

METHODS TO IMPROVE PROCESS SAFETY PERFORMANCE THROUGH FLANGE
CONNECTION LEAK PREDICTION AND CONTROL
A Thesis
by
JEREMY NELSON
Submitted to the Office of Graduate and Professional Studies of Texas A&M University
in partial fulfillment of the requirements for the degree of
MASTER OF SCIENCE
Chair of Committee, M. Sam Mannan Committee Members, Yong-Joe Kim
Ibrahim Karaman Head of Department, Ibrahim Karaman
August 2014
Major Subject: Materials Science and Engineering
Copyright 2014 Jeremy Nelson
ii
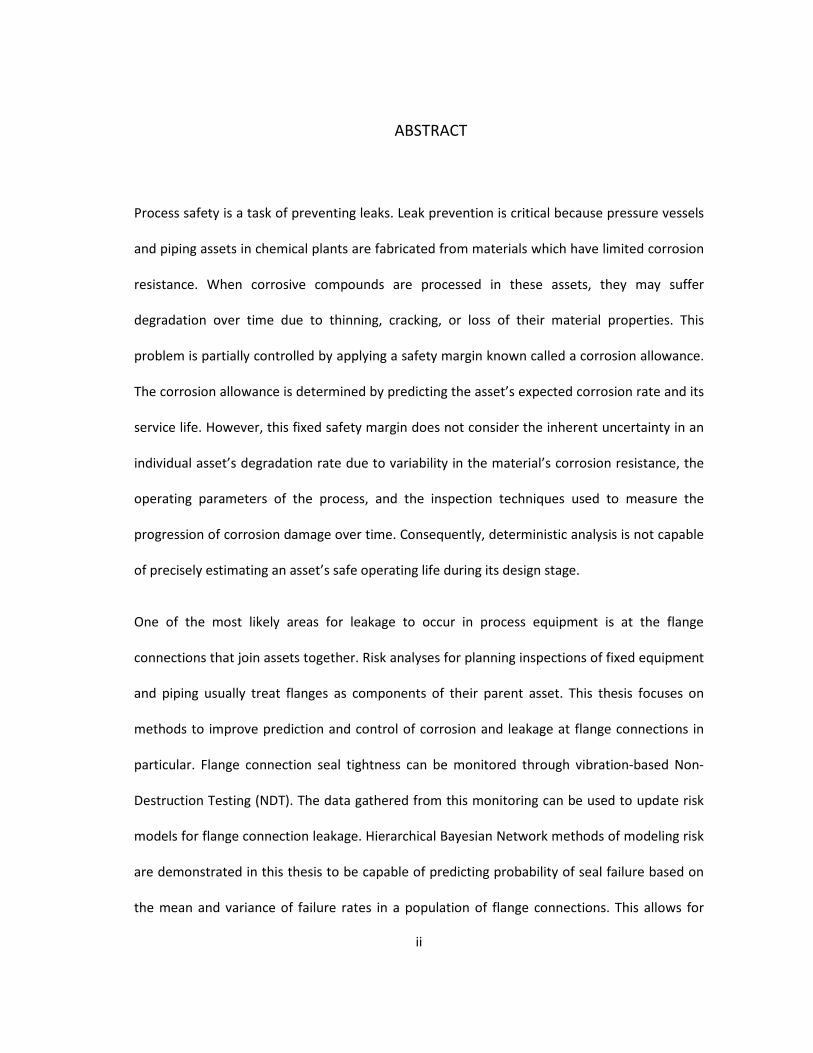
ABSTRACT
Process safety is a task of preventing leaks. Leak prevention is critical because pressure vessels
and piping assets in chemical plants are fabricated from materials which have limited corrosion
resistance. When corrosive compounds are processed in these assets, they may suffer
degradation over time due to thinning, cracking, or loss of their material properties. This
problem is partially controlled by applying a safety margin known called a corrosion allowance.
The corrosion allowance is determined by predicting the asset’s expected corrosion rate and its
service life. However, this fixed safety margin does not consider the inherent uncertainty in an
individual asset’s degradation rate due to variability in the material’s corrosion resistance, the
operating parameters of the process, and the inspection techniques used to measure the
progression of corrosion damage over time. Consequently, deterministic analysis is not capable
of precisely estimating an asset’s safe operating life during its design stage.
One of the most likely areas for leakage to occur in process equipment is at the flange
connections that join assets together. Risk analyses for planning inspections of fixed equipment
and piping usually treat flanges as components of their parent asset. This thesis focuses on
methods to improve prediction and control of corrosion and leakage at flange connections in
particular. Flange connection seal tightness can be monitored through vibration-based Non-
Destruction Testing (NDT). The data gathered from this monitoring can be used to update risk
models for flange connection leakage. Hierarchical Bayesian Network methods of modeling risk
are demonstrated in this thesis to be capable of predicting probability of seal failure based on
the mean and variance of failure rates in a population of flange connections. This allows for

iii
prediction of the probabilities based on corrosion and leak events in the plant. The results of
inspection techniques are used as inputs to this risk model, enabling probabilistic decision-
making.

iv
ACKNOWLEDGEMENTS
I would like to thank my committee chair, Dr. Mannan, and my committee members, Dr. Kim,
and Dr. Karaman, for their guidance and support throughout the course of this research.
Thanks also go to my friends and colleagues at the Mary K. O’Connor Process Safety Center and
the Acoustics and Signal Processing Lab for their support. I also want to extend my gratitude to
Pinnacle Asset Integrity Services, which provided me with the opportunities to gain experience
in Mechanical Integrity, and the many other skilled professionals at operating companies and
contractors in the process industry who lent their input to this work.
Finally, thanks to my family for their motivating words of encouragement and to my fiancée for
her patience, support, and love.
v
NOMENCLATURE
API American Petroleum Institute
ASME American Society of Mechanical Engineers
BFC Bolted Flanged Connection
DNV Det Norske Veritas
HSE Health and Safety Executive
NDE Non-Destructive Examination
QRA Quantified Risk Analysis
RBI Risk Based Inspection
SHM Structural Health Monitoring
SWUT Shear Wave Ultrasonic Testing
PTFE Poly-tetrafluorethane
vi
TABLE OF CONTENTS
Page
ABSTRACT ....................................................................................................................................... ii
ACKNOWLEDGEMENTS .................................................................................................................. iv
NOMENCLATURE ............................................................................................................................ v
TABLE OF CONTENTS ...................................................................................................................... vi
LIST OF FIGURES ........................................................................................................................... viii
LIST OF TABLES ............................................................................................................................... ix
INTRODUCTION ...................................................................................................................... 1 1.
QUANTIFIED RISK ANALYSIS ................................................................................................... 4 2.
Data Sources for QRA .................................................................................................. 5 2.1. Bayesian Methods for QRA ......................................................................................... 6 2.2.
RISK MODELS FOR LEAK PREDICTION ..................................................................................... 7 3.
Inspection Data for Risk-Based Decision Making ........................................................ 7 3.1. Decision Analysis Methods Utilizing Sparse Datasets ................................................. 7 3.2. Results of Deterministic Calculation for a Typical Flange Connection Scenario ....... 12 3.3. Beta-Binomial Bayesian Network for Typical Flange Connection Leakage 3.4.
Scenarios ................................................................................................................... 15 Gamma-Exponential Bayesian Network for Typical Flange Connection Leakage 3.5.
Scenarios ................................................................................................................... 18 Risk Modeling Using a System Approach .................................................................. 19 3.6.
FLANGE CONNECTION MATERIALS, DESIGN, AND DEGRADATION ...................................... 21 4.
Causes of Flange Connection Leakage ...................................................................... 22 4.1.
FLANGE CONNECTION INSPECTION ..................................................................................... 25 5.
Vibration-Based Inspection for Measuring Seals of Flange Connections ................. 27 5.1. Governing Equations for Vibration Inspection ......................................................... 28 5.2. Reflection Coefficient ................................................................................................ 29 5.3. Metrics for Estimating Remaining Life of a Flange Connection Seal ........................ 33 5.4. Flange Connection Resonance Experiment Setup .................................................... 34 5.5.
vii
Reflection Coefficient Experiment Results................................................................ 35 5.6. Variance in Flange Connection Tightness Measured by Bolt Strain ......................... 38 5.7. Vibration Signal Variance Due to Accelerometer Spacing ........................................ 40 5.8.
CONCLUSION ........................................................................................................................ 42 6.
REFERENCES ................................................................................................................................. 45
APPENDIX A – FLANGE REQUIREMENTS IN PRESSURE VESSEL DESIGN CODES ........................... 52
viii
LIST OF FIGURES
Page
Figure 1 Calculated Correlations Between Contact Pressure and Probability of Failure ............. 14
Figure 2 Predicted 𝜆 Based On Four Measured Flange Connection Failure Rates in a Beta Binomial Bayesian Network ......................................................................................... 16
Figure 3 Prediction of aff Using Gamma Exponential Bayesian Networks ................................... 19
Figure 4 Minimum Wavenumber For Various Accelerometer Spacing ........................................ 29
Figure 5 Schematic of Reflection Coefficient Measurement ........................................................ 30
Figure 6 Comparison Between Unfiltered and Filtered Reflection Coefficient Spectra ............... 32
Figure 7 Flange Connection Layout with Accelerometers Positioned .......................................... 34
Figure 8 Flange Connection with Accelerometers Positioned...................................................... 35
Figure 9 ePTFE Gasket: Change in Reflection Coefficient with Bolt Loosening ............................ 36
Figure 10 PTFE Gasket: Change in Reflection Coefficient with Bolt Loosening ............................ 37
Figure 11 |R| Compared with Different Accelerometer Positions and Torque Levels, ePTFE Gasket ............................................................................................................... 38

ix
LIST OF TABLES
Page Table 1 Several high consequence incidents related to flange connection leaks .......................... 2
Table 2 Comparison of Generic Failure Frequencies Between Selected QRA Datasets ................. 5
Table 3 Effect of Sample Size On % Error In Distribution Estimates .............................................. 8
Table 4 Typical Inputs Used in Deterministic Model .................................................................... 12
Table 5 Covariance Model Factors and Results ............................................................................ 13
Table 6 Properties of Beta-Binomial Hierarchical Bayesian Network for Four Flange Connection Population With Known Failure Rate ....................................................... 17
Table 7 Properties of Associated Prior Distribution ..................................................................... 17
Table 8 Properties of Beta-Binomial Hierarchical Bayesian Network for Five Flange Connection Population With Known Failure Rate ....................................................... 17
Table 9 Properties of Associated Prior Distribution ..................................................................... 17
Table 10 Properties of Beta-Binomial Hierarchical Bayesian Network for Five Flange Connection Population With Known Failure Rate For Four Flanges ........................... 18
Table 11 Properties of Associated Prior Distribution ................................................................... 18
Table 12 Strategies for Assessing Flange Connection Integrity While In Service ......................... 25
Table 13 Predicted Bolt Strain ...................................................................................................... 39
Table 14 Measured Elongation of Lubricated Bolts (Aramid fiber gasket) .................................. 39
Table 15 Measured Elongation of Lubricated Bolts (ePTFE gasket) ............................................. 40
Table 16 Allowable Defect Depth vs. Width Across Face ............................................................. 52
1
INTRODUCTION 1.
Flange connections play an important role in all process systems, allowing pressure equipment
assets to be assembled and disassembled without making weld connections. Due to the large
numbers of flange connections in a plant, they are often a failure point at which process leaks
occur. Perhaps the most well-known incident related to the failure of a sealing connection was
the Challenger Space Shuttle disaster. On January 28, 1986, seven crew members were killed
when the space shuttle Challenger exploded at just over a minute into the flight. The failure
investigation concluded that the explosion was caused by a failure of the solid rocket booster
O-rings to seal properly. This allowed hot combustion gases to leak from the side of the booster
and burn through the external fuel tank. Further analysis attributes this O-ring failure to faulty
design of the solid rocket boosters which failed to take into account the insufficient low-
temperature ductility of the O-ring material and of the joints that the O-ring sealed [1]. The key
point is that the accident occurred despite the engineers being aware of the potential issue
beforehand.
This tragic accident provides an invaluable lesson that failure of a component may have
catastrophic consequences, even if the component was perceived to be insignificant to the
overall system. In other words, this is a classic example of the proverb, “For want of a nail, the
Kingdom was lost”, occurring in the real world. The original rhyme goes as follows:
For want of a nail, the shoe was lost.
For want of a shoe, the horse was lost.
For want of a horse, the rider was lost.
2
For want of a rider, the battle was lost.
For want of a battle, the kingdom was lost.
And all for the want of a horseshoe nail.
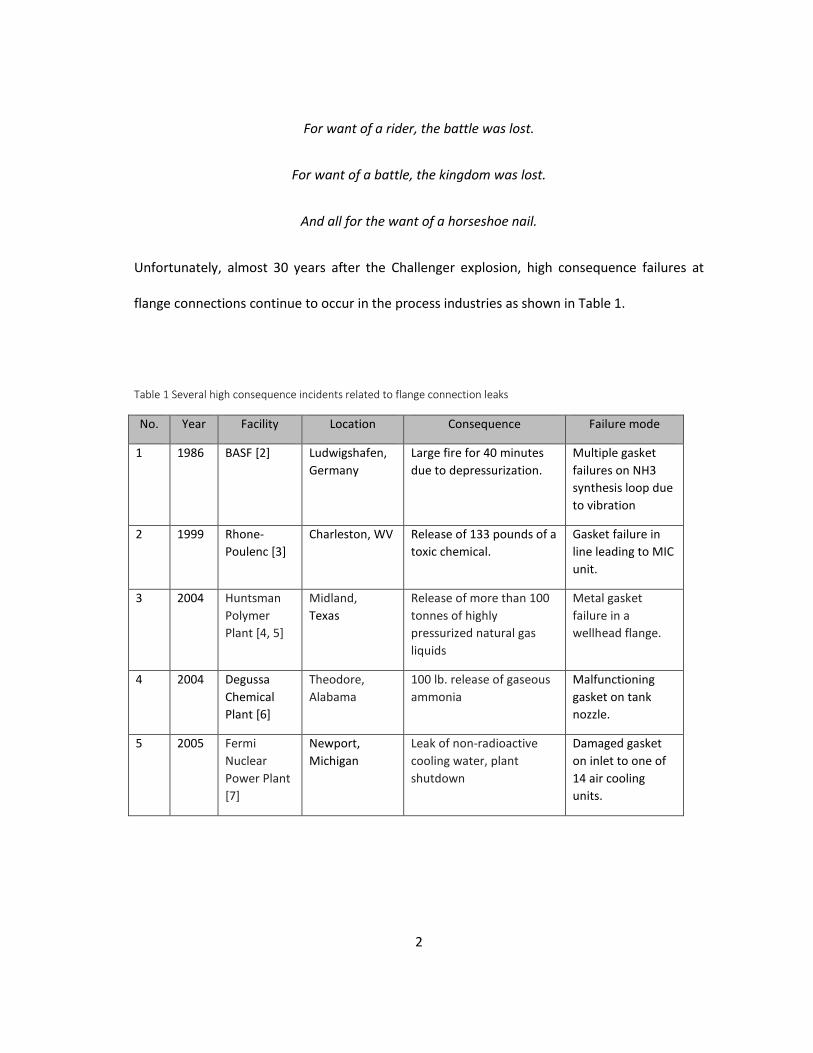
Unfortunately, almost 30 years after the Challenger explosion, high consequence failures at
flange connections continue to occur in the process industries as shown in Table 1.
Table 1 Several high consequence incidents related to flange connection leaks
No. Year Facility Location Consequence Failure mode
1 1986 BASF [2] Ludwigshafen, Germany
Large fire for 40 minutes due to depressurization.
Multiple gasket failures on NH3 synthesis loop due to vibration
2 1999 Rhone-Poulenc [3]
Charleston, WV Release of 133 pounds of a toxic chemical.
Gasket failure in line leading to MIC unit.
3 2004 Huntsman Polymer Plant [4, 5]
Midland, Texas
Release of more than 100 tonnes of highly pressurized natural gas liquids
Metal gasket failure in a wellhead flange.
4 2004 Degussa Chemical Plant [6]
Theodore, Alabama
100 lb. release of gaseous ammonia
Malfunctioning gasket on tank nozzle.
5 2005 Fermi Nuclear Power Plant [7]
Newport, Michigan
Leak of non-radioactive cooling water, plant shutdown
Damaged gasket on inlet to one of 14 air cooling units.

3
Table 1 Continued
No. Year Facility Location Consequence Failure mode
6 2005 BP Amoco [8]
Whiting, Indiana
Free hydrocarbon product detected in monitoring wells
Evidence of a prior leak on the fiber ring joint gasket. Flange faces had evidence of possible leak at two different locations.
7 2009 Columbia Gas Transmission Corp. [9]
Clendenin, WV Uncontrolled gas discharge into compressor building, gas allowed to being vented from blowdown valves for 90 minutes.
Compressor head end gasket failure.
8 2010 Sunoco [10] Philadelphia, PA 1700 barrel release of Vacuum Gas Oil (VGO) from the FM-1 pipeline into an open in-ground valve pit.
Failure of flange connection in a deadleg leading to pig trap.
9 2012 Citgo Refinery [11]
Corpus Christi, Texas
300-500lb release of Hydrofluoric Acid (estimated)
Metal gasket failure on a HF Alkylation unit piping flange
The recent nature of several of these releases associated with flange connection failure indicate
that the problem of maintaining flange connection integrity is still an issue. The causes of
leakage are known, but effective risk management is not a reality for many process plants.
4
QUANTIFIED RISK ANALYSIS 2.
Quantified Risk Analysis (QRA) is used to evaluate process plants and determine the risk
associated with scenarios where a failure could cause a process safety incident. These models
consider the likelihood of failure events which may only occur less than once in ten thousand to
one million operating years. Therefore, the models must account for random failure which
happens independently of time and also degradation of the plant over time which leads to
increased probability of a failure. After calculating this probability and the associated
consequences, process safety management proscribes mitigation activities to reduce the
likelihood for the failure to occur. Of these mitigation activities, inspection may be planned,
which has the effect of reducing the uncertainty in the condition of the asset, which in turn
reduces the probability that a failure will occur.
Industry standards for risk-based inspection use models to approximate the change in
probability of failure over time due corrosion kinetics, along with a variance to account for the
uncertainty in the effect that the corrosion will have an asset’s condition. This parameter is
called a damage factor, and it is combined with a generic failure frequency to determine an
asset’s probability of failure. Based on the probability and consequences of a failure, a risk is
calculated and a mitigation event such as an inspection is scheduled before the vessel is
predicted to exceed an acceptable risk level [12]. The industry standard codes for risk-based
inspection are intended to calculate point value probabilities, and they are not currently
capable of considering the likelihood distribution of outcomes from a failure. They also do not
represent a system approach, because each vessel’s risk is assessed independently of the
5
population of vessels to which it is connected and with which it shares the causes of corrosion
and material degradation.
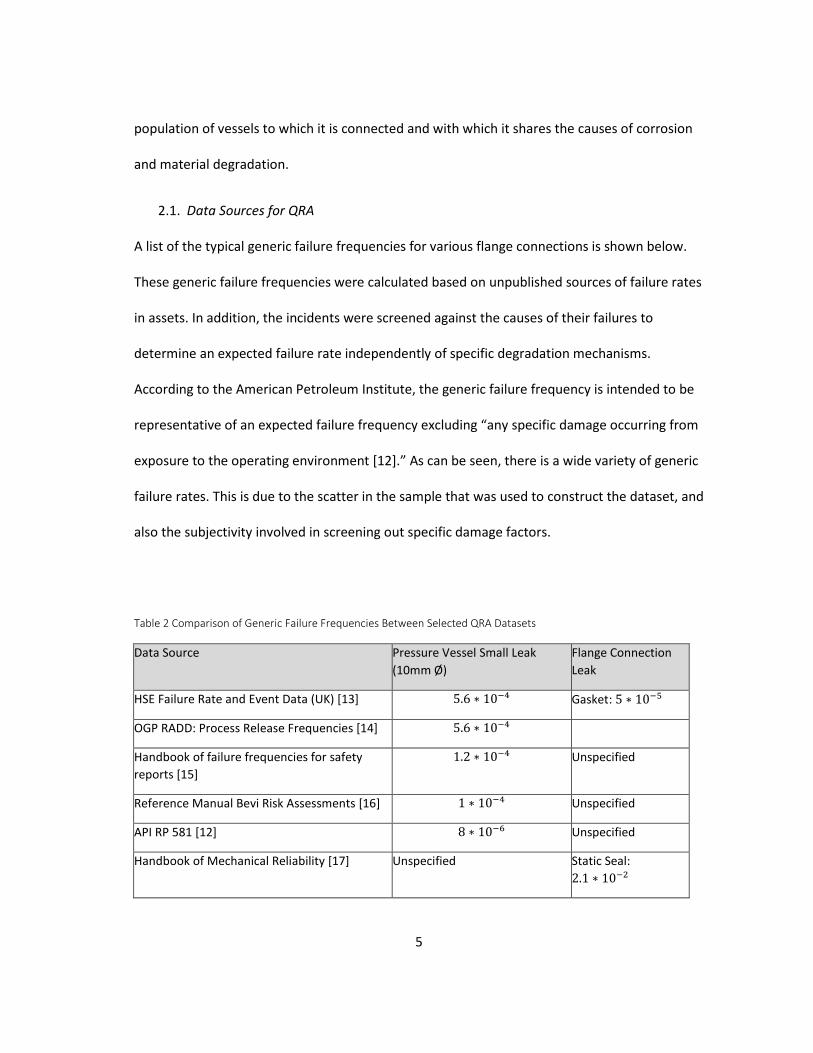
Data Sources for QRA 2.1.
A list of the typical generic failure frequencies for various flange connections is shown below.
These generic failure frequencies were calculated based on unpublished sources of failure rates
in assets. In addition, the incidents were screened against the causes of their failures to
determine an expected failure rate independently of specific degradation mechanisms.
According to the American Petroleum Institute, the generic failure frequency is intended to be
representative of an expected failure frequency excluding “any specific damage occurring from
exposure to the operating environment [12].” As can be seen, there is a wide variety of generic
failure rates. This is due to the scatter in the sample that was used to construct the dataset, and
also the subjectivity involved in screening out specific damage factors.
Table 2 Comparison of Generic Failure Frequencies Between Selected QRA Datasets
Data Source Pressure Vessel Small Leak (10mm Ø)
Flange Connection Leak
HSE Failure Rate and Event Data (UK) [13] 5.6 ∗ 10−4 Gasket: 5 ∗ 10−5
OGP RADD: Process Release Frequencies [14] 5.6 ∗ 10−4
Handbook of failure frequencies for safety reports [15]
1.2 ∗ 10−4 Unspecified
Reference Manual Bevi Risk Assessments [16] 1 ∗ 10−4 Unspecified
API RP 581 [12] 8 ∗ 10−6 Unspecified
Handbook of Mechanical Reliability [17] Unspecified Static Seal: 2.1 ∗ 10−2
6
Bayesian Methods for QRA 2.2.
Bayesian Networks are capable of combining the probability distributions of multiple assets to
infer the life expectancy of one flange connection based on the average life and variance in
average life of the population [18]. Covariance models exist to predict the failure rate of flange
connections, based on information about the flange connection that is generated during
design, assembly, and operation [17, 19]. In the Bayesian Network approach, variable which is
not known can be defined as probability distribution based on the range of expected values,
and the expected mean value. The mean is known as the first moment of the distribution, and
the variance is known as the second moment. Additionally, relationships between random
variables may also be defined through their covariance [20].
This probabilistic approach allows the effect of the uncertainty of input variables to be reflected
in the degree of uncertainty of the overall system. The end goal of a probabilistic model is to
provide the decision maker with a distribution for the range of expected outcomes. From this,
the decision maker can determine whether there is enough information to make a decision or
whether the circumstances warrant collecting additional information. Therefore, the
probabilistic model is especially useful for dealing with complex systems such as flange
connections.
7
RISK MODELS FOR LEAK PREDICTION 3.
Inspection Data for Risk-Based Decision Making 3.1.
The problem of the process operator is making decisions that optimize the reliability of the
plant. Often the decisions must be made with a limited amount of information, because the
time and expense of acquiring exact data cannot be justified. There are two potential options
for making decisions in this case. The decision maker can either choose the most conservative
option available to them, or they can create prognostic models of the potential outcomes
based on the available information and determine whether they have enough information to
make a decision. The latter approach to decision making has the advantage of allowing
measurement of the uncertainty, risk, and consequences of the potential outcomes.
Decision Analysis Methods Utilizing Sparse Datasets 3.2.
The main difficulty in making decisions that affect process safety is in quantifying the likelihood
that an unsafe condition could exist. The tools and data for doing this are rarely robust enough
to feed directly into deterministic models and product decisive answers. Therefore,
probabilistic approaches are favored. As can be seen in Table 3, the precision of a model is
related to the amount of data that can be measured and correlated in a model[21].

8
Table 3 Effect of Sample Size On % Error In Distribution Estimates
mean estimator �𝑟𝑇� 𝑚𝑒𝑎𝑛 (𝜇) 𝑠𝑡𝑑𝑒𝑣 (𝜎) 𝜇 − 𝑟
𝑇𝜇
% Error
1/5 = 0.2 0.288 0.163 0.306 31
3/15 = 0.2 0.236 0.101 0.153 15
5/25 = 0.2 0.222 0.080 0.099 10
15/75 = 0.2 0.208 0.047 0.038 4.0
30/150 = 0.2 0.203 0.034 0.015 1.5
60/300 = 0.2 0.202 0.024 0.010 1.0
The approach proposed in this research is to use vibration-based NDE as a method for
establishing the amount of integrity remaining in a flange connection before failure due to
unacceptable leakage occurs. Other methods could be utilized for this purpose, such as
measuring strain in each of the bolts to estimate a contact pressure at the gasket. However,
these methods are more time consuming and do not account for the flange flexing. A vibration-
based NDE approach would give the overall picture of how much pressure existed across the
overall flange.
Decision making models could be created to varying degrees of detail. A superficial model could
be created based on observed correlations and trends in the plant. This type of model would be
vulnerable if it does not capture causal relationships, or if it assumes linear correlations where
nonlinear correlations exist. Such models are also observed in practice to produce many false
alarms because they have no way of differentiating between the variability in the data caused
by normal operations (e.g., startup and shutdown) and that caused by damage progression
[22].
9
An improved model is one that offers predictions based on physical correlations between
variables that are known to affect failure rates. Because the model is based upon physical
parameters, an observed failure can only have an effect on a subset of the parameters, so
future performance extrapolations will be less influenced by false signals. Such a model has
been established for flange connection leakage by the US Navy [17]. This particular
deterministic model accounts for the factors leading to gasket failure, such that the life
expectancy of a flange connection’s seal could be predicted if all of the variables were
measured and/or controlled. Because variability is expected, a more robust model has been
produced by this research.
A Bayesian Network model is used in this research to predict the point in time when a flange
connection’s leak rate will exceed acceptable limits. It is based on the API 581 industry standard
risk model which predicts the change in the probability of pressure boundary failure on a vessel
or pipe over time [12]. This industry standard model is referenced for the sake of establishing a
flange connection leakage risk model that is relatable to the widely accepted notions of how
often failures occur and the degree of risk associated with those failures in the chemical
process industries. The mechanics of the flange connection model are independent of the
pressure vessel risk model, and the base assumptions about generic failure frequencies can and
will be changed as the model incorporates new information. One model for flange connection
failure is published by the US Navy in the Handbook of Mechanical Reliability. This model uses
algebraic multipliers to relate input parameters and predict a seal failure rate. The experiments
underlying this particular model were performed for the Air Force Research Laboratory, and
10
appear to have more in common with sealing air and spacecraft, than with sealing process
piping.
The input parameters are defined over ranges that are more stringent than the expectations in
the process industries. One example is the parameter for mean surface roughness of the flange
face. In the ASME Boiler Pressure Vessel Code, the expected range of average (RMS) roughness
is 125-250𝜇in. The US Navy model parameter is defined over a 25-150𝜇in range. See Appendix
A – Flange Requirements in Pressure Vessel Design Codes for further details.
Uncertainty of input data is a common limitation of deterministic corrosion models. The
dynamic nature of field operations means that there is not always an opportunity to analyze
the full complement of input variables needed to construct a full analytical model. In practice,
the corrosion engineer must make educated judgments about likely values of certain
parameters and emphasize the use of “conservative assumptions.” This is less than ideal, as
shown by the improved approach that Bayesian Networks provide.
Limited data is still useful if a system approach is used to extrapolate the risk from the basis of
one model to another. This system approach uses the expected range of variables as input for
measuring the problem’s range of variables. A probabilistic model is created from a
deterministic model by defining a Probability Density Function (PDF) for each of the model
parameters. This can be done based on a parameter’s mean and variance values. Skewness can
also be factored into the distribution. Data or observations from a population of flange
connections can be used to adjust and extend the original distribution. Since the PDF is a
continuous function, it can be extrapolated to make predictions about low probability events.
11
More importantly, the uncertainty of an event’s probability can be measured by the variance in
the PDF.
The probabilistic failure frequency distributions for a large population of flanges can be
modified based on the observations about the population. If a particular flange connection
shares similar risk drivers with other connections, the PDF of each individual connection can be
aggregated into a population likelihood PDF. This is useful because the failure rate model for
each individual flange has a base failure frequency term in it, which is generic. After each
iterations of inputting observations into the model, these generic failure frequencies (gff) can
be updated to be specific about that particular flange at that particular moment in time.
The model generated from this research is based on a combination of the known physical
properties of flange connections, and it also allows for missing data to be accounted for with
the use of parameter learning and Bayesian updating of the probability distributions. The
correlations between the parameters are set up as prior probability distribution nodes in a
Bayesian Network. These groups of parameters are modeled for a population of flange
connections in a process plant. Observations in the plant, such as failures or accelerated
corrosion events, are then used to update the values of the other flange connections in the
population. By the same token, absence of failures can be used to update the expected
remaining life of the flange connection seals. This can be used to determine which flanges
should be broken during shutdowns for inspection. The model used in this work does not
explicitly capture the probability of failure due to non-routine operation; such as during
startup, shutdown, and upset conditions. While these operating modes may have a different
12
effect on the remaining life of the flange connection seal, the probabilistic nature of the model
allows it to capture rare events.
In this way, a progressively updated model is generated from generic, but accurate, physical
data and updating with observations. At the same time, the PDF of unmeasured parameters are
inferred based on the observed performance of the system, or population of flange
connections.
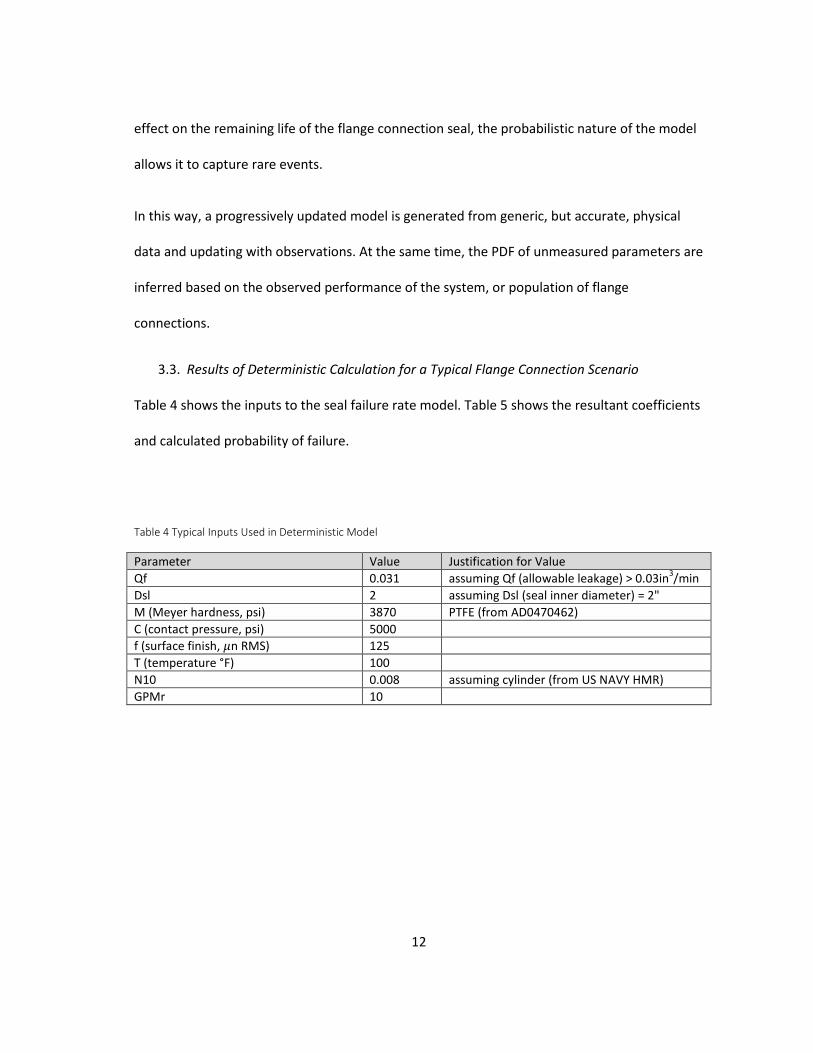
Results of Deterministic Calculation for a Typical Flange Connection Scenario 3.3.
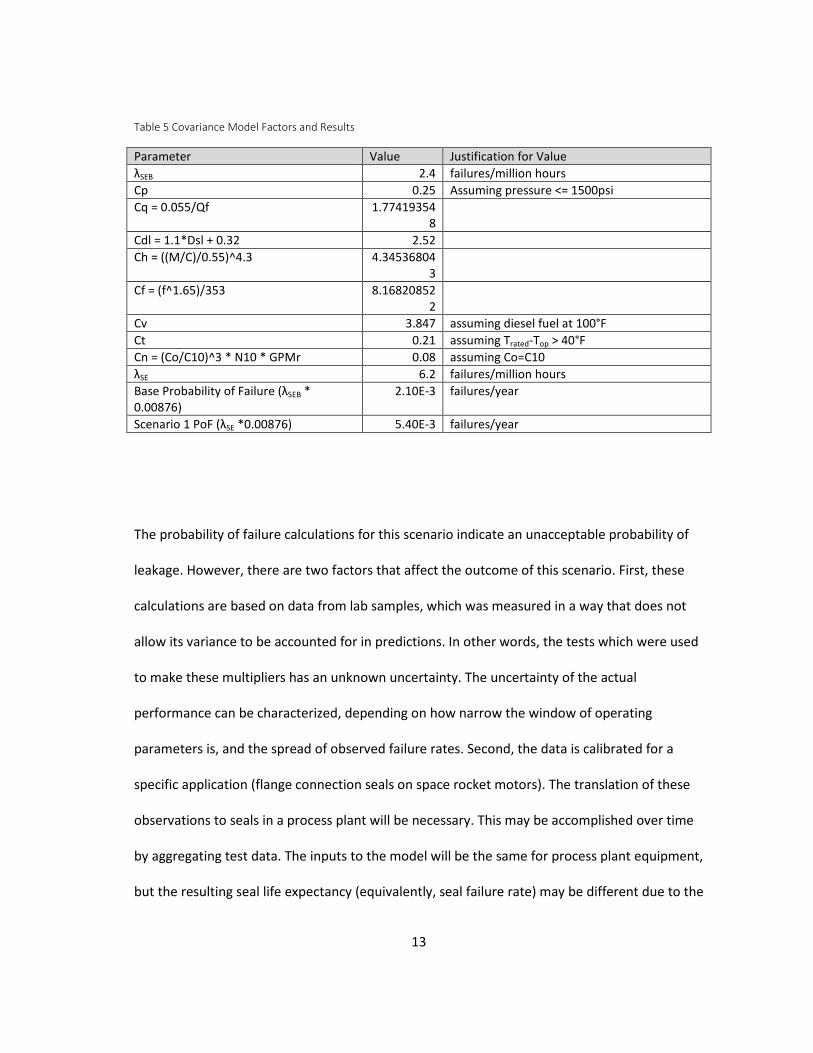
Table 4 shows the inputs to the seal failure rate model. Table 5 shows the resultant coefficients
and calculated probability of failure.
Table 4 Typical Inputs Used in Deterministic Model
Parameter Value Justification for Value Qf 0.031 assuming Qf (allowable leakage) > 0.03in3/min Dsl 2 assuming Dsl (seal inner diameter) = 2" M (Meyer hardness, psi) 3870 PTFE (from AD0470462) C (contact pressure, psi) 5000 f (surface finish, 𝜇n RMS) 125 T (temperature °F) 100 N10 0.008 assuming cylinder (from US NAVY HMR) GPMr 10
13
Table 5 Covariance Model Factors and Results
Parameter Value Justification for Value λSEB 2.4 failures/million hours Cp 0.25 Assuming pressure <= 1500psi Cq = 0.055/Qf 1.77419354
8
Cdl = 1.1*Dsl + 0.32 2.52 Ch = ((M/C)/0.55)^4.3 4.34536804
3
Cf = (f^1.65)/353 8.168208522
Cv 3.847 assuming diesel fuel at 100°F Ct 0.21 assuming Trated-Top > 40°F Cn = (Co/C10)^3 * N10 * GPMr 0.08 assuming Co=C10 λSE 6.2 failures/million hours Base Probability of Failure (λSEB * 0.00876)
2.10E-3 failures/year
Scenario 1 PoF (λSE *0.00876) 5.40E-3 failures/year
The probability of failure calculations for this scenario indicate an unacceptable probability of
leakage. However, there are two factors that affect the outcome of this scenario. First, these
calculations are based on data from lab samples, which was measured in a way that does not
allow its variance to be accounted for in predictions. In other words, the tests which were used
to make these multipliers has an unknown uncertainty. The uncertainty of the actual
performance can be characterized, depending on how narrow the window of operating
parameters is, and the spread of observed failure rates. Second, the data is calibrated for a
specific application (flange connection seals on space rocket motors). The translation of these
observations to seals in a process plant will be necessary. This may be accomplished over time
by aggregating test data. The inputs to the model will be the same for process plant equipment,
but the resulting seal life expectancy (equivalently, seal failure rate) may be different due to the

14
variance in the operating parameters of a plant over a relatively long time scale compared to a
rocket engine.
The gasket life expectancy can be modeled as an exponential curve, with a hazard rate of 1.0E-
3. Suppose the contact stress distribution did not have a significant amount of variance, and
was approximated as a point value. Then on-stream measurement of bolt strain or joint
stiffness could be used to measure the contact stress and estimate the remaining life of the
flange connection seal.
Figure 1 Calculated Correlations Between Contact Pressure and Probability of Failure
The conversion from event frequency to probability of failure is based on the assumption that
the seal will degrade in an exponential fashion. The probability of failure can be related to a risk
y = 17.787e-0.001x
0
0.2
0.4
0.6
0.8
1
1.2
2000 2500 3000 3500 4000 4500 5000 5500
Prob
abili
ty o
f Fai
lure
Contact Pressure (psi)
Flange Connection Seal Probability of Failure
15
matrix, along with the consequence of failure, to identify action levels. Action levels are points
at which the utility cost of a potential seal failure exceeds the cost of a mitigating event such as
an inspection or repair.
However, the above first moment calculations do not have any way of accounting for the
variance of the distribution, so a second moment method is proposed which makes use of the
mean and the variance of the distribution.
Beta-Binomial Bayesian Network for Typical Flange Connection Leakage 3.4.
Scenarios
One possible method of estimating the failure frequency would be using a beta binomial
conjugate distribution. The beta probability density function is represented by a beta
expression which measures the likelihood of a particular failure frequency in a normal
distribution (1).
𝑓(𝜆) =
𝛤(𝛼 + 𝛽)𝜆𝛼−1(1 − 𝜆)𝛽−1 𝛤(𝛼)𝛤(𝛽)
(1)
The conditional likelihood of n failures out of a population of k flanges would be represented by
a binomial distribution.
𝑝(𝜆|𝑓) = �𝑛𝑘� 𝑝𝑘(1 − 𝑝)𝑛−𝑘 (2)
An example of a beta binomial Bayesian Network is shown in Figure 2.

16
Figure 2 Predicted 𝜆 Based On Four Measured Flange Connection Failure Rates in a Beta Binomial Bayesian Network
The effect of this network is to treat base failure rates as a normal distribution in a population
(API 581 assumes their generic data to be lognormally distributed, but does not give a
justification for it). Then the known failure rates are used to construct a weighted average
failure rate for the population. This failure rate can then be extrapolated to an estimate of a
posterior failure rate, such as for a particular flange that has no known performance data. As
can be seen from Table 6, Table 8, and Table 10, the average failure frequency of the
population converges to the mean as the amount of time in service increases. Adding additional
unknowns to the population does not affect the predicted probability, which implies that the
technique could be applied to populations with arbitrarily large quantities of unknown
elements. It does change the properties of the prior distribution, however, this has a limited
effect on the precision of the predicted probability of failure. Adding elements reduces the
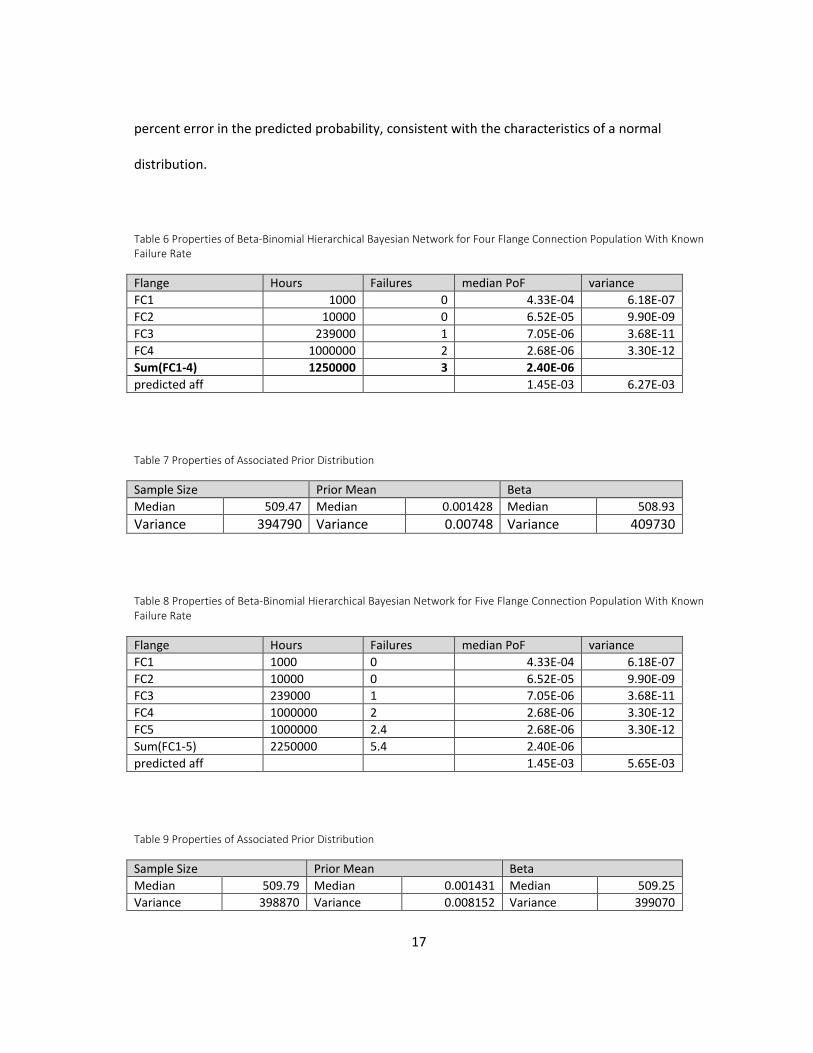
17
percent error in the predicted probability, consistent with the characteristics of a normal
distribution.
Table 6 Properties of Beta-Binomial Hierarchical Bayesian Network for Four Flange Connection Population With Known Failure Rate
Flange Hours Failures median PoF variance FC1 1000 0 4.33E-04 6.18E-07 FC2 10000 0 6.52E-05 9.90E-09 FC3 239000 1 7.05E-06 3.68E-11 FC4 1000000 2 2.68E-06 3.30E-12 Sum(FC1-4) 1250000 3 2.40E-06 predicted aff 1.45E-03 6.27E-03
Table 7 Properties of Associated Prior Distribution
Sample Size Prior Mean Beta Median 509.47 Median 0.001428 Median 508.93 Variance 394790 Variance 0.00748 Variance 409730
Table 8 Properties of Beta-Binomial Hierarchical Bayesian Network for Five Flange Connection Population With Known Failure Rate
Flange Hours Failures median PoF variance FC1 1000 0 4.33E-04 6.18E-07 FC2 10000 0 6.52E-05 9.90E-09 FC3 239000 1 7.05E-06 3.68E-11 FC4 1000000 2 2.68E-06 3.30E-12 FC5 1000000 2.4 2.68E-06 3.30E-12 Sum(FC1-5) 2250000 5.4 2.40E-06 predicted aff 1.45E-03 5.65E-03
Table 9 Properties of Associated Prior Distribution
Sample Size Prior Mean Beta Median 509.79 Median 0.001431 Median 509.25 Variance 398870 Variance 0.008152 Variance 399070

18
Table 10 Properties of Beta-Binomial Hierarchical Bayesian Network for Five Flange Connection Population With Known Failure Rate For Four Flanges
Flange Hours Failures median PoF variance FC1 1000 0 4.33E-04 6.18E-07 FC2 10000 0 6.52E-05 9.90E-09 FC3 239000 1 7.05E-06 3.68E-11 FC4 1000000 2 2.68E-06 3.30E-12 FC5 1000000 unknown 1.45E-03 6.27E-03 Sum(FC1-5) 2250000 5.4 2.40E-06 predicted aff 1.45E-03 5.65E-03
Table 11 Properties of Associated Prior Distribution
Sample Size Prior Mean Beta median 509.79 Median 0.001428 Median 508.93 variance 394790 Variance 0.00748 Variance 409730
Gamma-Exponential Bayesian Network for Typical Flange Connection Leakage 3.5.
Scenarios
In a similar fashion, the gamma-exponential conjugate distribution could be used to estimate
an average time to first failure, given the time to first failure of other flanges in the population.
The gamma pdf is given by (3), where 𝛼 = 𝑚𝑒𝑎𝑛 ∗ � 𝑚𝑒𝑎𝑛𝑣𝑎𝑟𝑖𝑎𝑛𝑐𝑒
� and 𝛽 = 𝑣𝑎𝑟𝑖𝑎𝑛𝑐𝑒𝑚𝑒𝑎𝑛
.
𝑓(𝜆) =
𝛽𝛼𝜆𝛼−1𝑒−𝜆𝛽
𝛤(𝛼) (3)
The exponential pdf is given by (4).
𝑓𝑥(𝑥) = 𝜆𝑒−𝜆𝑥 (4)
An application of this type of conjugate distribution is shown in Figure 3 [18].
𝑓𝑥(𝑥) = 𝜆𝑒−𝜆𝑥 (5)
19
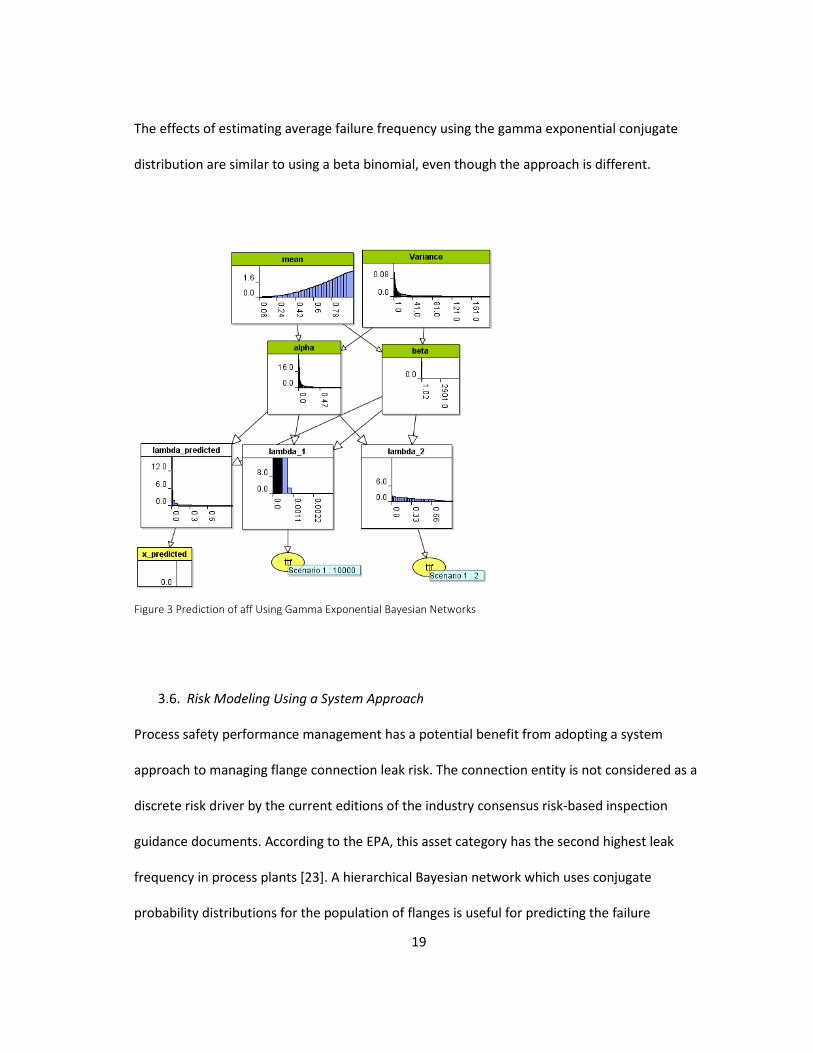
The effects of estimating average failure frequency using the gamma exponential conjugate
distribution are similar to using a beta binomial, even though the approach is different.
Figure 3 Prediction of aff Using Gamma Exponential Bayesian Networks
Risk Modeling Using a System Approach 3.6.
Process safety performance management has a potential benefit from adopting a system
approach to managing flange connection leak risk. The connection entity is not considered as a
discrete risk driver by the current editions of the industry consensus risk-based inspection
guidance documents. According to the EPA, this asset category has the second highest leak
frequency in process plants [23]. A hierarchical Bayesian network which uses conjugate
probability distributions for the population of flanges is useful for predicting the failure

20
frequency of the population and of a single connection, and also for making decisions
systematically. This approach to modeling risk enhances the visibility of the potential secondary
effects of specific decisions on the system. It also provides pathways to confirm the risk drivers
for observed events. Most importantly, a system approach is needed to improve process safety
because it enables the measurement of long tail risk. This is characteristic of process safety
incidents, which are rare events with high consequences. It also reveals interdependencies
between apparently isolated events.
21
FLANGE CONNECTION MATERIALS, DESIGN, AND DEGRADATION 4.
Large numbers of flange connections are present in a typical plant. They enable assets to be
quickly connected and disconnected, without cutting or welding operations. Despite their
apparent simplicity, flange connection seals are a complex system which changes over time.
Most flange connections are made up of three components. The flanges are either welded or
slip on type and are attached to associated asset. Typically bolts are used as fasteners to apply
clamping force on the flanges. And in most cases, a gasket is installed between the flanges. The
gasket forms a seal while compensating for the surface roughness of the flanges as well as
variations in the clamping force applied by the fasteners [24]. A flange connection joint’s design
and performance is governed by its stiffness, which is limited by the stiffness of the gasket [25].
Since the transition away from asbestos, most gaskets are now made from three types of
materials: 1) nonmetallic, such as elastomers, PTFE or compressed graphite, 2) metallic,
including flat and spiral wound metal, or 3) composites, consisting of a nonmetal outer layer
with a metallic core [26, 27]. The most important property of a gasket is its response to the
fasteners’ compressive stress. This response is governed by the gasket’s stiffness. Metallic
gaskets have an elastic stress response, and deform proportionally to the applied stress until
they begin to plastically deform. The elastic modulus of a metal gasket determines its stiffness.
Nonmetallic gaskets deform viscoelastically, and their stiffness is measured by their dynamic
modulus, which is a function of temperature and the frequency of a cyclic loading applied to
the test specimen [28]. Dynamic modulus can then be measured in a lab setting by vibrational
response techniques [29]. Other materials-related properties of gaskets that are relevant to
sealing performance include response to thermal and pressure cycling, relationship between
22
the thickness of the gasket and its stiffness, and the degree of plastic deformation the gasket
can withstand under compressive loading [30-32]. Another important property for nonmetallic
and composite gaskets is the creep relaxation which they undergo while under compression.
This creep results in a loss of the clamping load applied by the fasteners and a loss of the seal’s
integrity [33-38].
Causes of Flange Connection Leakage 4.1.
A flange connection’s leak rate is determined by material properties, assembly parameters, and
process operating conditions. A leak rate is a measure of the conductance of fluid through the
gasket membrane. In very low leak rate regimes, this conduction happens by molecular
diffusion. At higher leak rates, this occurs by laminar flow. The sealing performance of the
flange connection, and the leak rate or life expectancy for the flange connection over a time
interval, are related. The leak rate is increased by a lower viscosity process fluid, but decreased
by a tighter seal. Since the properties of the process fluid are constrained by the process
design, the leak rate is most effectively controlled by the quality of the seal.
A seal is only formed when the pressure applied to the gasket by the flange is high enough to
compress the gasket into any roughness that may exist on the flange face. If the flange surface
is very rough, the gasket will be required to compress more in order to form a seal. If the gasket
material has a high stiffness, a higher stress will be required to achieve the compression
necessary to form the seal. This gasket property is known as high loadability [24]. The
compressibility of the gasket affects how much pressure must be applied in order to form and
maintain this seal. Therefore, flange connections made with highly loadable gaskets have a
lower leak rate due to the higher contact stresses applied.

23
Surface pressure may be directly measured using pressure indicating films, but the pressure
value cannot be known without disassembling the seal, and the film also affects the leak rate.
The methods for indirectly measuring surface pressure include using elongation methods to
measure the strain at the fasteners, but the strain is distributed unevenly across the flange
surface because the flange elastically deforms. The ligaments between bolt holes in the flange
will have a lower applied stress. Also, the flange will rotate and expand at the inside radius due
to the moment applied by the fasteners at the outside of the flange radius.
Leakage at flange connections can occur through two routes: due to a lack of intimate contact
between the gasket and the flange surface or due to diffusion through the gasket membrane.
Membrane diffusion typically only occurs at appreciable rates when the gasket is in service at
very high temperatures and pressures. In most cases leakage is due to a loss of sealing between
the gasket and flange [39]. Originally, pressure vessel design codes assumed that properly
designed and installed flange connections would not leak while in service. The older editions of
these codes specified design calculations for the flanges and fasteners based on the seating and
maintenance stress levels (Y and m factors) of the gaskets [40]. Seating stress is the initial
amount of compression required to conform the gasket surface to the mating flange surfaces. It
is applied before the flange is pressurized. The maintenance stress is a measure of the
minimum required compression to keep the gasket compressed against the flange while
internal or external pressure is applied to the flange. This maintenance stress represents a
balance of forces between the fastener and the flange and gasket in the elastic loading regime
for both. Ideally, the balance shifts when the hydrostatic pressure in the flange increases the
end thrust on the bolts, such that the gasket can expand to compensate for the relaxation of

24
the bolts while still maintaining a tight seal. Modern design guidelines recognize that leakage
will always occur, and therefore include rules for flange connection design based on specific
maximum leak rates [30]. A summary of flange design code details is given in Appendix A –
Flange Requirements in Pressure Vessel Design Codes.
25
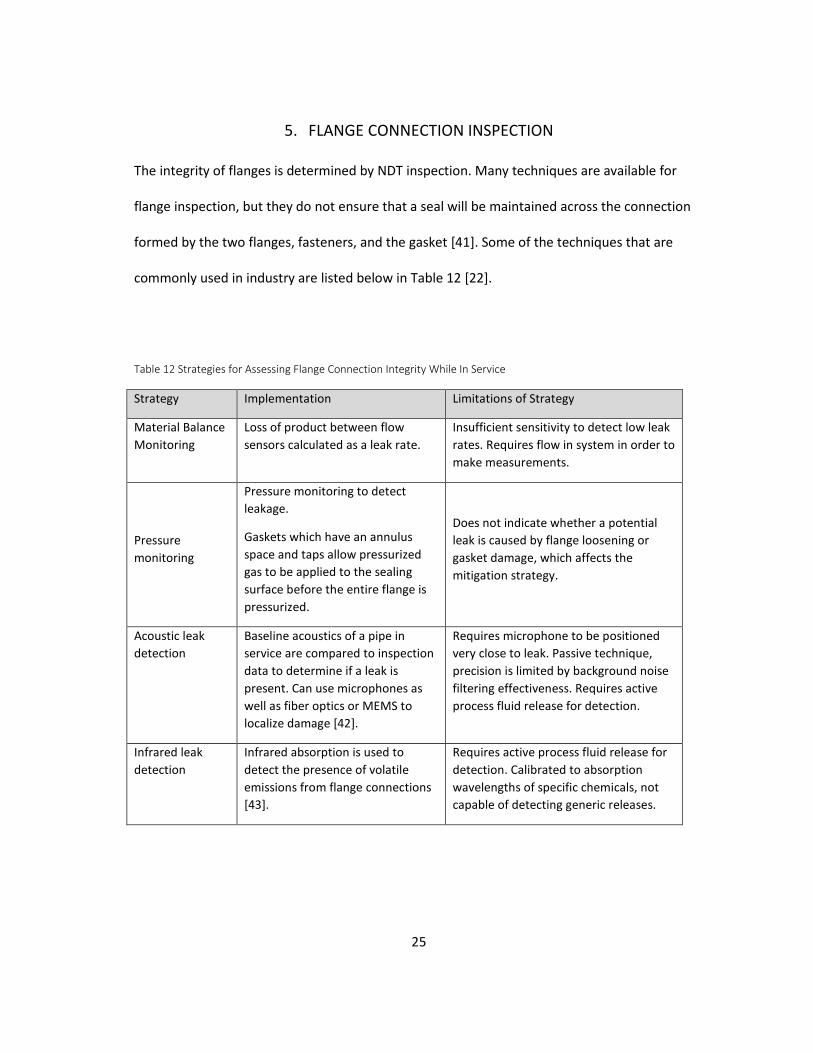
FLANGE CONNECTION INSPECTION 5.
The integrity of flanges is determined by NDT inspection. Many techniques are available for
flange inspection, but they do not ensure that a seal will be maintained across the connection
formed by the two flanges, fasteners, and the gasket [41]. Some of the techniques that are
commonly used in industry are listed below in Table 12 [22].
Table 12 Strategies for Assessing Flange Connection Integrity While In Service
Strategy Implementation Limitations of Strategy
Material Balance Monitoring
Loss of product between flow sensors calculated as a leak rate.
Insufficient sensitivity to detect low leak rates. Requires flow in system in order to make measurements.
Pressure monitoring
Pressure monitoring to detect leakage.
Gaskets which have an annulus space and taps allow pressurized gas to be applied to the sealing surface before the entire flange is pressurized.
Does not indicate whether a potential leak is caused by flange loosening or gasket damage, which affects the mitigation strategy.
Acoustic leak detection
Baseline acoustics of a pipe in service are compared to inspection data to determine if a leak is present. Can use microphones as well as fiber optics or MEMS to localize damage [42].
Requires microphone to be positioned very close to leak. Passive technique, precision is limited by background noise filtering effectiveness. Requires active process fluid release for detection.
Infrared leak detection
Infrared absorption is used to detect the presence of volatile emissions from flange connections [43].
Requires active process fluid release for detection. Calibrated to absorption wavelengths of specific chemicals, not capable of detecting generic releases.
26
Table 12 Continued
Strategy Implementation Limitations of Strategy
External strain measurement
Time-of-flight measurement of ultrasonic signal along the length of a bolt to determine the extension and stress level in the bolt. This is then converted into a bolt stress.
Accuracy depends on the precision datum faces machined each end of the bolt, and operator skill. Adequate bolt tightness may not prevent leak paths from forming on the flange face (if the flange geometry is not in-spec).
Strain indicating fasteners
Strain gages installed inside the bolt shaft, or washers which emit an indicator fluid at a specific stress level.
Adequate bolt tightness does not rule out the presence of leak paths on the flange face ligaments between bolts.
Vibration-based NDT is capable of detecting a change in the stiffness of a bolted joint, in
particular a flange connection [35, 44]. Microphones or accelerometers are coupled with an
impulse signal source, or each other, to measure the systems’ vibrational response. The input
and output time signals may be converted to frequency spectra with a Fourier transform if the
system’s vibration response is approximately linear over the measured frequency range. The
data must also be stationary, or not changing within the time interval over which the DFT is
sampled [45, 46]. This means that time-domain signals which change over the time that they
are measured, or with respect to the location of the sensor, will have increased error in the
frequency spectra. The Empirical Modal Decomposition technique using the Huang-Hilbert
Transform has been used to measure nonlinear vibration systems, in particular during
continuous monitoring [47-49].

27
Vibration data may be used to detect changes in the integrity of a flange connection by modal
parameters such as the position and amplitude of the system’s resonance frequencies. These
parameters are affected by a change in the stiffness of the flange connection [44, 50-56].
Leakage may also be detected by a change in impedance parameters such as the reflection
coefficient of longitudinal waves impacting the flange surface [57]. In the ultrasonic frequency
range, reflection coefficients may be used to non-intrusively measure the flange surface’s
contact pressure directly under the transducer [44, 55, 58-60].
Prior data is useful to plant operators for determining the remaining life of pressure assets.
These risk models are commonly used to schedule outages [61]. The purpose of the outages is
to detect damage that may have occurred while the asset was in service, and to repair that
damage. While the inspection itself does not reduce existing damage to the vessel, it does
reduce uncertainty in the condition of the vessel.
Vibration-Based Inspection for Measuring Seals of Flange Connections 5.1.
Because flange connections are distinct locations, an inspection can be focused within the
vicinity of the flange connection and can exclude adjacent vessels and piping. A flange
connection inspection could also be primarily focused on evaluating the integrity of the seal. A
secondary goal may be to detect mechanical damage that could lead to catastrophic collapse of
the components.
A method of measuring the seal is to examine the vibrational properties of the connection. The
vibration spectrum offers more signal bandwidth than even the optical spectrum, as can be
seen by the effect of opaque materials in blocking light, whereas vibrations can be conducted
28
through almost all materials at some frequency. Therefore, vibration testing is a suitable option
for evaluating seals of flange connections.
Since the flange connection is generally composed of different materials, and these materials
have different characteristic vibration impedances due to their stiffness and damping
coefficients, a plane wave vibration which encounters the flange will be partially reflected as it
passes through the flange to the gasket. This reflection is a function of the impedance drop,
which is also a factor of the degree of contact area between the different flange and gasket
materials. Therefore, the reflection coefficient parameter is relatable to the conductance
parameter of the leak rate equation.
Governing Equations for Vibration Inspection 5.2.
In the experiments for this thesis, the speed of sound in the steel was calculated using the
elastic modulus and the density. The formulas are as follows.
𝑐 = �
𝐸𝜌
= �205 𝐺𝑃𝑎
7800 𝑘𝑔𝑚3
= 5126𝑚𝑠
(6)
The wavenumber was then calculated as a function of frequency to determine the optimal
spacing of the accelerometers.
𝑘𝐿 =
2 ∗ 𝑝𝑖 ∗ 𝑓𝑐𝑜
=𝜔𝑐𝐿
(7)
The accelerometer spacing was set at 7cm. The bounds on the spacing between measurement
sensors are due to the error introduced into the signal by phase mismatch on the higher end
and the finite difference limit on the lower end. The graph below shows the minimum
wavenumber for various spacing.
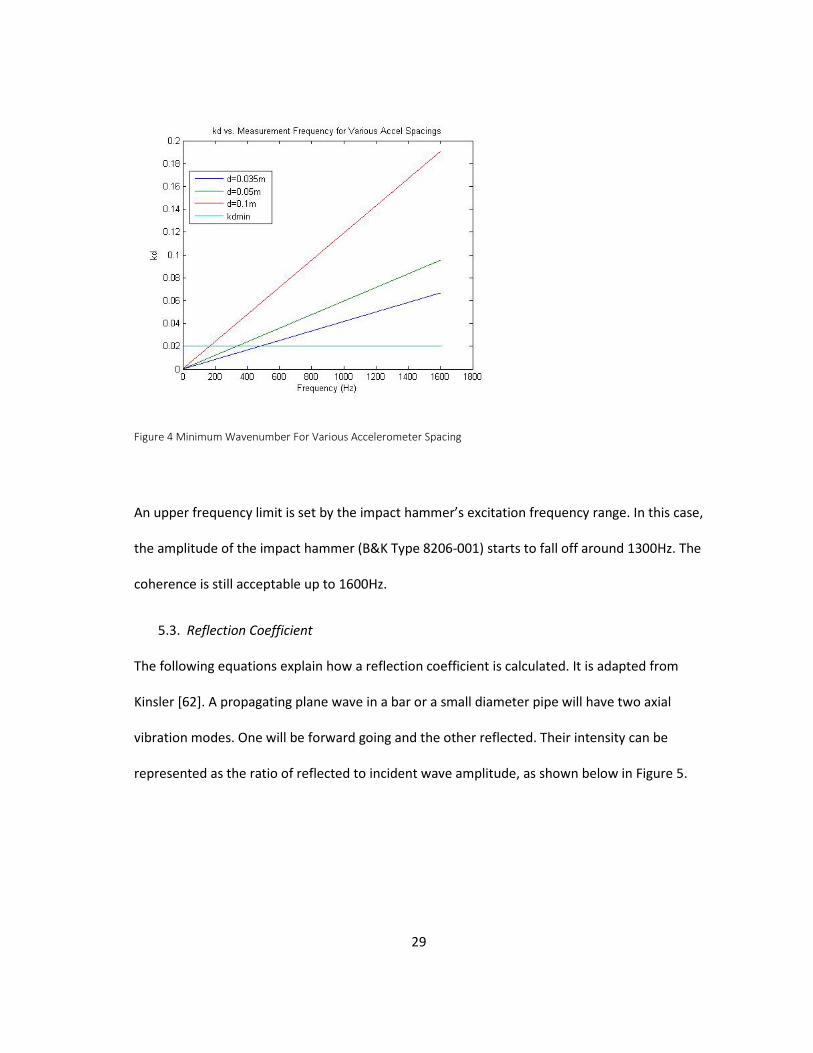
29
Figure 4 Minimum Wavenumber For Various Accelerometer Spacing
An upper frequency limit is set by the impact hammer’s excitation frequency range. In this case,
the amplitude of the impact hammer (B&K Type 8206-001) starts to fall off around 1300Hz. The
coherence is still acceptable up to 1600Hz.
Reflection Coefficient 5.3.
The following equations explain how a reflection coefficient is calculated. It is adapted from
Kinsler [62]. A propagating plane wave in a bar or a small diameter pipe will have two axial
vibration modes. One will be forward going and the other reflected. Their intensity can be
represented as the ratio of reflected to incident wave amplitude, as shown below in Figure 5.
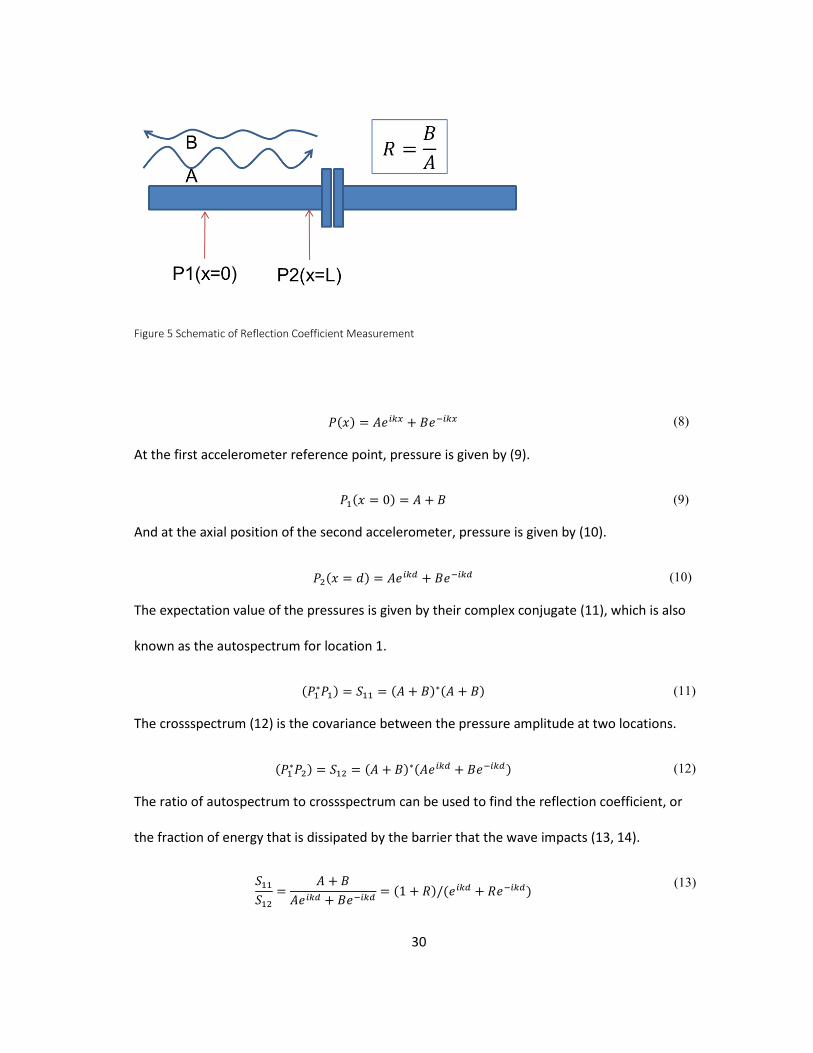
30
Figure 5 Schematic of Reflection Coefficient Measurement
𝑃(𝑥) = 𝐴𝑒𝑖𝑘𝑥 + 𝐵𝑒−𝑖𝑘𝑥 (8)
At the first accelerometer reference point, pressure is given by (9).
𝑃1(𝑥 = 0) = 𝐴 + 𝐵 (9)
And at the axial position of the second accelerometer, pressure is given by (10).
𝑃2(𝑥 = 𝑑) = 𝐴𝑒𝑖𝑘𝑑 + 𝐵𝑒−𝑖𝑘𝑑 (10)
The expectation value of the pressures is given by their complex conjugate (11), which is also
known as the autospectrum for location 1.
(𝑃1∗𝑃1) = 𝑆11 = (𝐴 + 𝐵)∗(𝐴 + 𝐵) (11)
The crossspectrum (12) is the covariance between the pressure amplitude at two locations.
(𝑃1∗𝑃2) = 𝑆12 = (𝐴 + 𝐵)∗(𝐴𝑒𝑖𝑘𝑑 + 𝐵𝑒−𝑖𝑘𝑑) (12)
The ratio of autospectrum to crossspectrum can be used to find the reflection coefficient, or
the fraction of energy that is dissipated by the barrier that the wave impacts (13, 14).
𝑆11𝑆12
=𝐴 + 𝐵
𝐴𝑒𝑖𝑘𝑑 + 𝐵𝑒−𝑖𝑘𝑑= (1 + 𝑅)/(𝑒𝑖𝑘𝑑 + 𝑅𝑒−𝑖𝑘𝑑)
(13)
31
|𝑅| =
|𝐵||𝐴| = �
𝑆11𝑒𝑖𝑘𝑑 − 𝑆12𝑆12 − 𝑆11𝑒−𝑖𝑘𝑑
� (14)
In order to reduce the amount of input noise to the system, autospectra can be filtered against
the input signal using the following relations (15-20).
𝑆𝑥𝑥 = 𝐸[𝑋∗𝑋] (15)
𝑆𝑥𝑦1 = 𝐸[𝑋∗𝑌1] (16)
𝑆𝑥𝑦2 = 𝐸[𝑋∗𝑌2] (17)
𝑆12 = 𝐸[𝑌1∗𝑌2] (18)
𝑆𝑦1𝑦2 =
𝑆𝑥𝑦1∗ 𝑆𝑥𝑦2𝑆𝑥𝑥
(19)
𝑆𝑦1𝑦1 =
𝑆𝑥𝑦1∗ 𝑆𝑥𝑦1𝑆𝑥𝑥
(20)
A comparison between the reflection coefficient calculated from the same signal data with and
without using this filtering technique is shown in Figure 6.
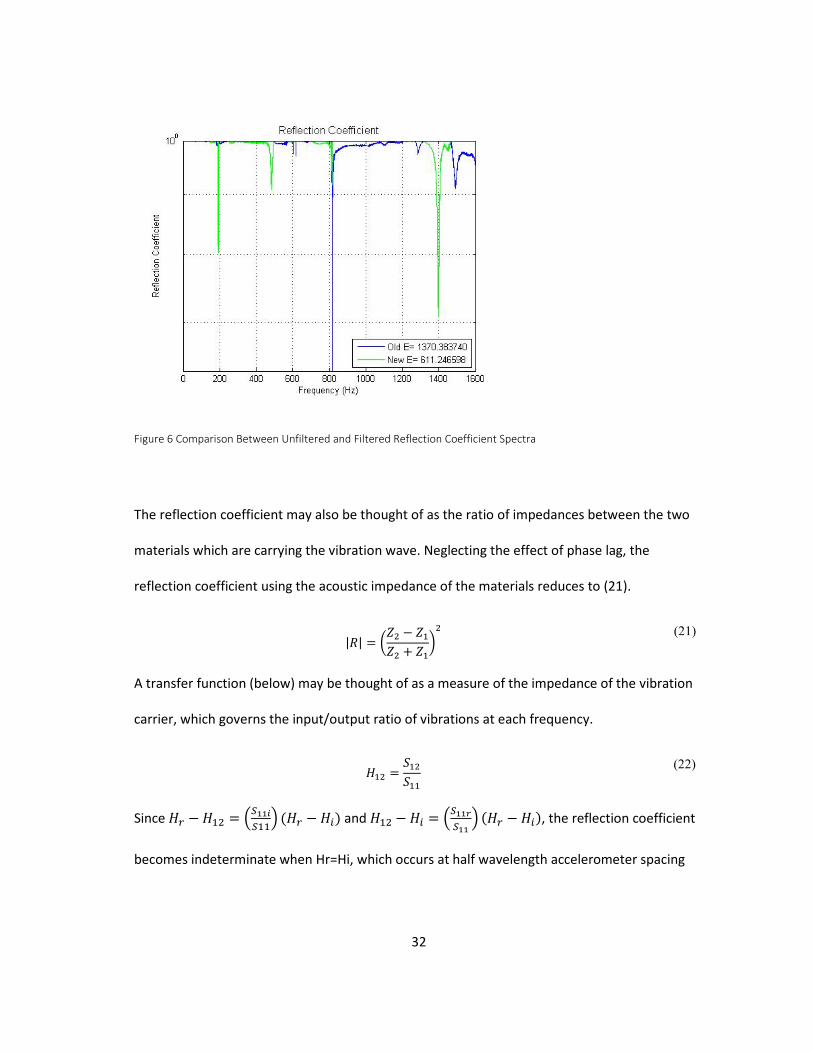
32
Figure 6 Comparison Between Unfiltered and Filtered Reflection Coefficient Spectra
The reflection coefficient may also be thought of as the ratio of impedances between the two
materials which are carrying the vibration wave. Neglecting the effect of phase lag, the
reflection coefficient using the acoustic impedance of the materials reduces to (21).
|𝑅| = �
𝑍2 − 𝑍1𝑍2 + 𝑍1
�2
(21)
A transfer function (below) may be thought of as a measure of the impedance of the vibration
carrier, which governs the input/output ratio of vibrations at each frequency.
𝐻12 =𝑆12𝑆11
(22)
Since 𝐻𝑟 − 𝐻12 = �𝑆11𝑖𝑆11
� (𝐻𝑟 − 𝐻𝑖) and 𝐻12 − 𝐻𝑖 = �𝑆11𝑟𝑆11
� (𝐻𝑟 − 𝐻𝑖), the reflection coefficient
becomes indeterminate when Hr=Hi, which occurs at half wavelength accelerometer spacing
33
[56]. The suggested spacing to avoid this condition is given by 𝑠 < 𝑐𝑜2𝑓𝑢𝑝𝑝𝑒𝑟
, which for 1600Hz
would be 2m.
Metrics for Estimating Remaining Life of a Flange Connection Seal 5.4.
In the signal data, the most useful measurements of the remaining life are comparisons
between the undamaged vs. damaged states. The metric chosen to make this comparison is the
norm of the reflection coefficient. This norm is implemented by taking the square root of the
trace of the standard deviation of the reflection coefficient [63]. From this, a damage index
measurement is used, which compares the reflection coefficient norm measured in a known
good condition (such as immediately after assembly) with a measurement after some time has
passed. If loss of contact pressure (i.e., tightness) has occurred, the norm will increase due to a
higher vibration/acoustic impedance drop across the flange-gasket interface. Marshall [54] and
others [44] have theorized that, on a microscopic scale, this change in the reflection coefficient
can also represent the loss of vibrational energy across the joint due to the change in contact
stiffness. This contact stiffness is due to roughness and asperities at joint which act as
dampeners. The outcome is the same; reflection coefficient is inversely correlated with
tightness. This can be considered as the major contributing factor to a loss of sealing.
Therefore, the damage index is useful as a metric for the amount of sealing capability left in the
flange connection.
The graphs below show the change in reflection coefficient as well as the numerical integration
values for the reflection coefficient.
34
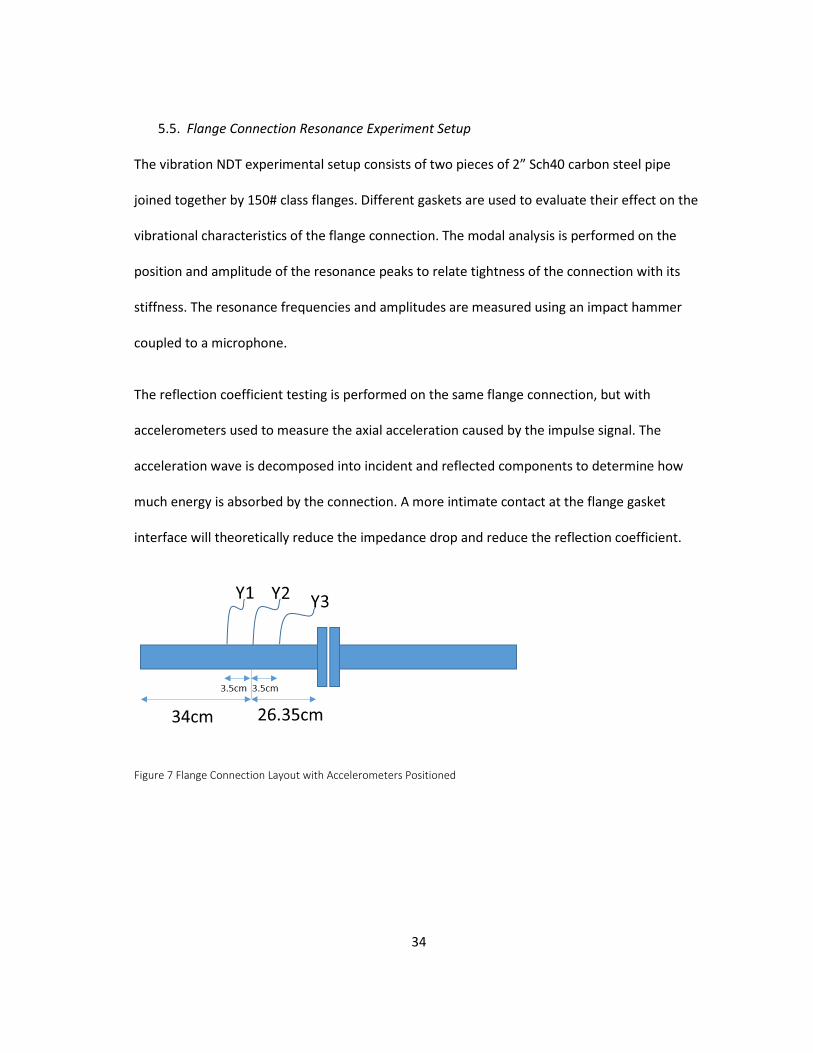
Flange Connection Resonance Experiment Setup 5.5.
The vibration NDT experimental setup consists of two pieces of 2” Sch40 carbon steel pipe
joined together by 150# class flanges. Different gaskets are used to evaluate their effect on the
vibrational characteristics of the flange connection. The modal analysis is performed on the
position and amplitude of the resonance peaks to relate tightness of the connection with its
stiffness. The resonance frequencies and amplitudes are measured using an impact hammer
coupled to a microphone.
The reflection coefficient testing is performed on the same flange connection, but with
accelerometers used to measure the axial acceleration caused by the impulse signal. The
acceleration wave is decomposed into incident and reflected components to determine how
much energy is absorbed by the connection. A more intimate contact at the flange gasket
interface will theoretically reduce the impedance drop and reduce the reflection coefficient.
Figure 7 Flange Connection Layout with Accelerometers Positioned
35
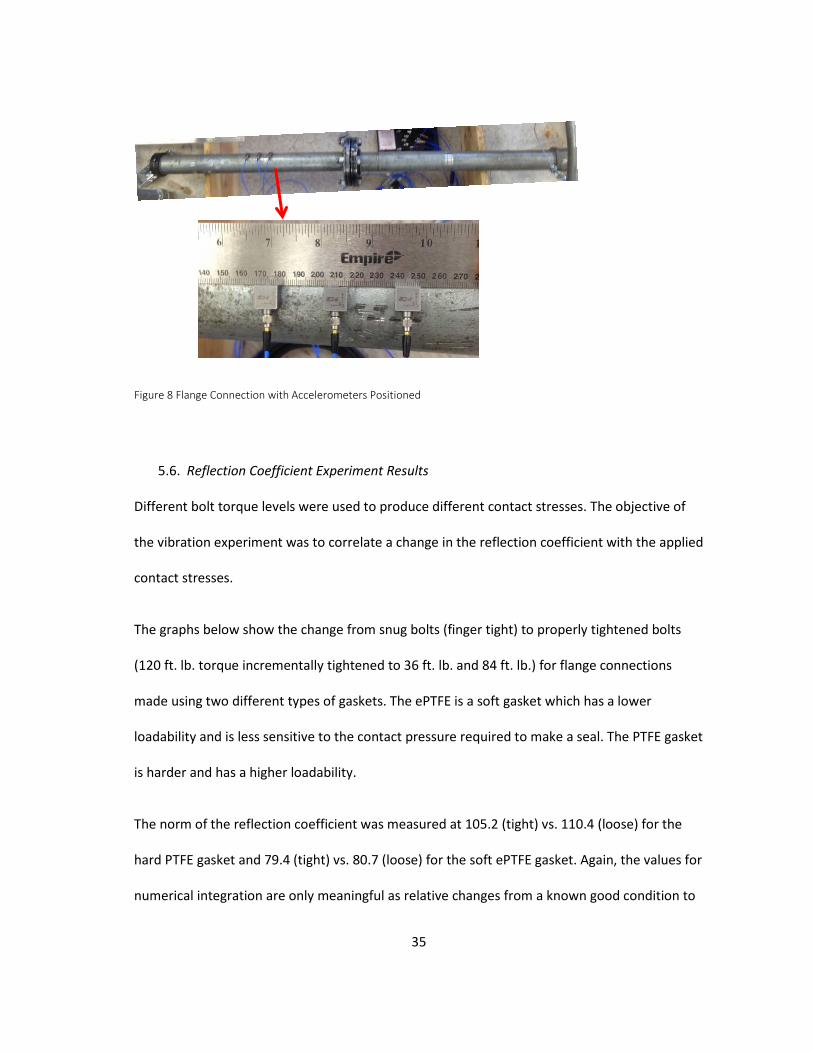
Figure 8 Flange Connection with Accelerometers Positioned
Reflection Coefficient Experiment Results 5.6.
Different bolt torque levels were used to produce different contact stresses. The objective of
the vibration experiment was to correlate a change in the reflection coefficient with the applied
contact stresses.
The graphs below show the change from snug bolts (finger tight) to properly tightened bolts
(120 ft. lb. torque incrementally tightened to 36 ft. lb. and 84 ft. lb.) for flange connections
made using two different types of gaskets. The ePTFE is a soft gasket which has a lower
loadability and is less sensitive to the contact pressure required to make a seal. The PTFE gasket
is harder and has a higher loadability.
The norm of the reflection coefficient was measured at 105.2 (tight) vs. 110.4 (loose) for the
hard PTFE gasket and 79.4 (tight) vs. 80.7 (loose) for the soft ePTFE gasket. Again, the values for
numerical integration are only meaningful as relative changes from a known good condition to
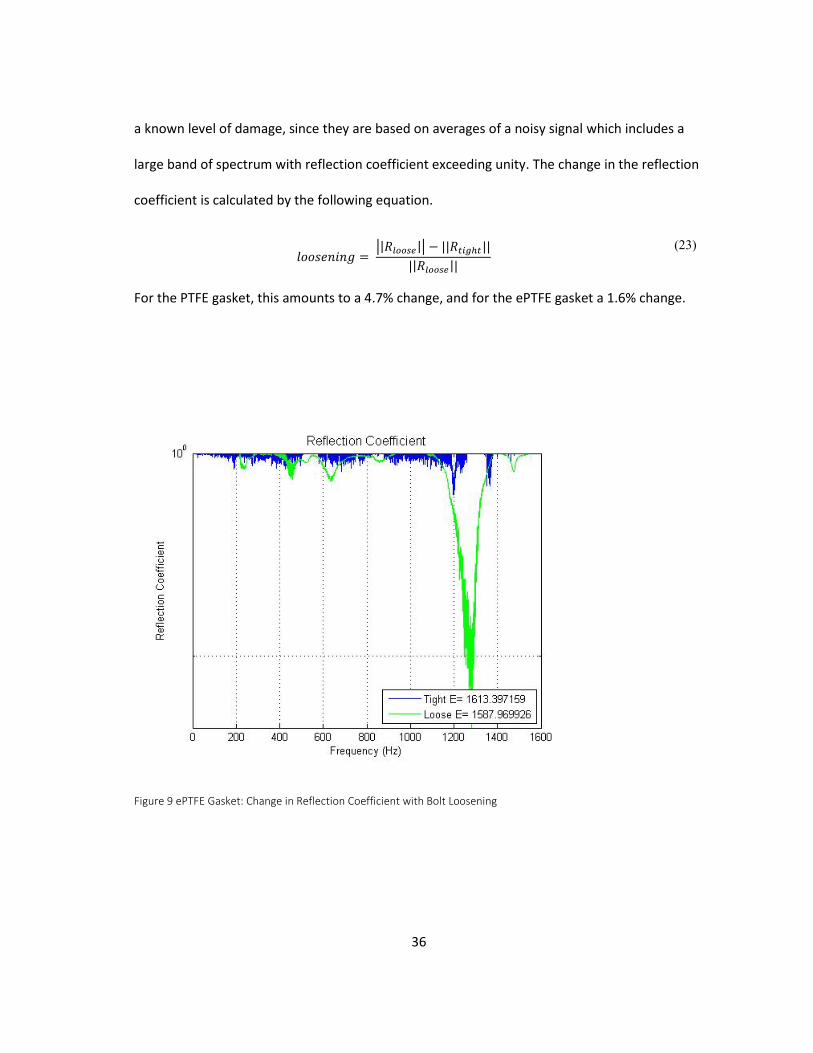
36
a known level of damage, since they are based on averages of a noisy signal which includes a
large band of spectrum with reflection coefficient exceeding unity. The change in the reflection
coefficient is calculated by the following equation.
𝑙𝑜𝑜𝑠𝑒𝑛𝑖𝑛𝑔 =
�|𝑅𝑙𝑜𝑜𝑠𝑒|� − ||𝑅𝑡𝑖𝑔ℎ𝑡||||𝑅𝑙𝑜𝑜𝑠𝑒||
(23)
For the PTFE gasket, this amounts to a 4.7% change, and for the ePTFE gasket a 1.6% change.
Figure 9 ePTFE Gasket: Change in Reflection Coefficient with Bolt Loosening
37
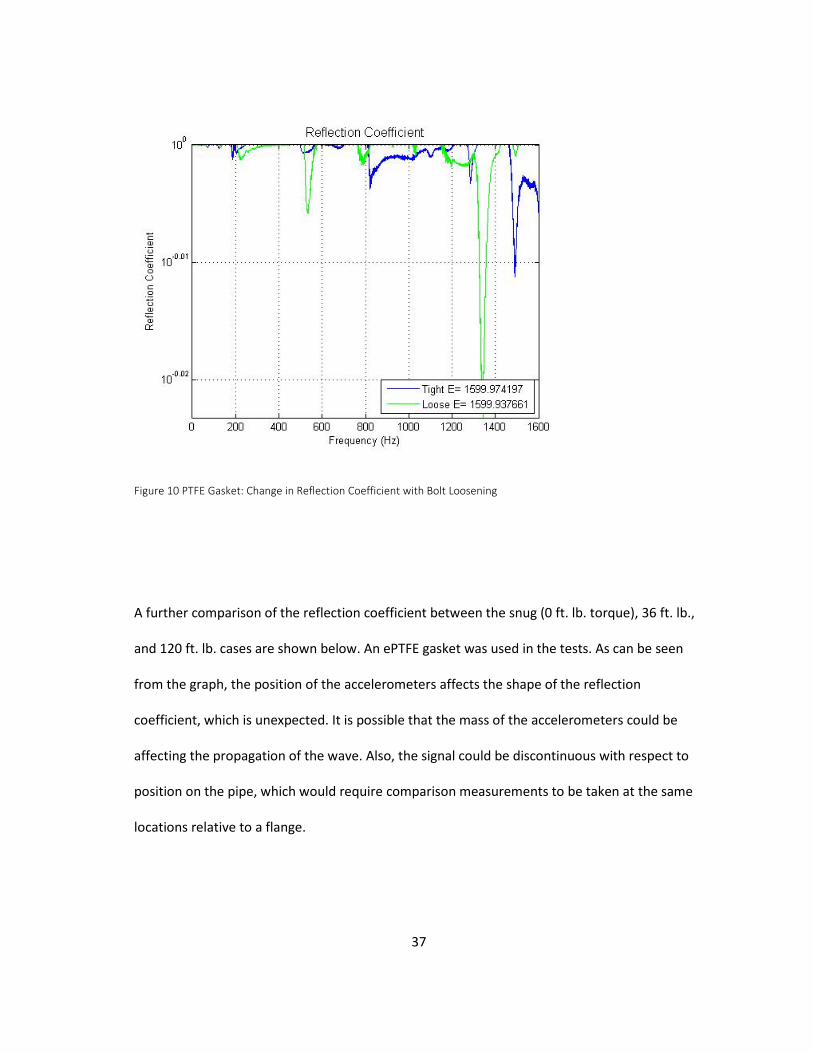
Figure 10 PTFE Gasket: Change in Reflection Coefficient with Bolt Loosening
A further comparison of the reflection coefficient between the snug (0 ft. lb. torque), 36 ft. lb.,
and 120 ft. lb. cases are shown below. An ePTFE gasket was used in the tests. As can be seen
from the graph, the position of the accelerometers affects the shape of the reflection
coefficient, which is unexpected. It is possible that the mass of the accelerometers could be
affecting the propagation of the wave. Also, the signal could be discontinuous with respect to
position on the pipe, which would require comparison measurements to be taken at the same
locations relative to a flange.
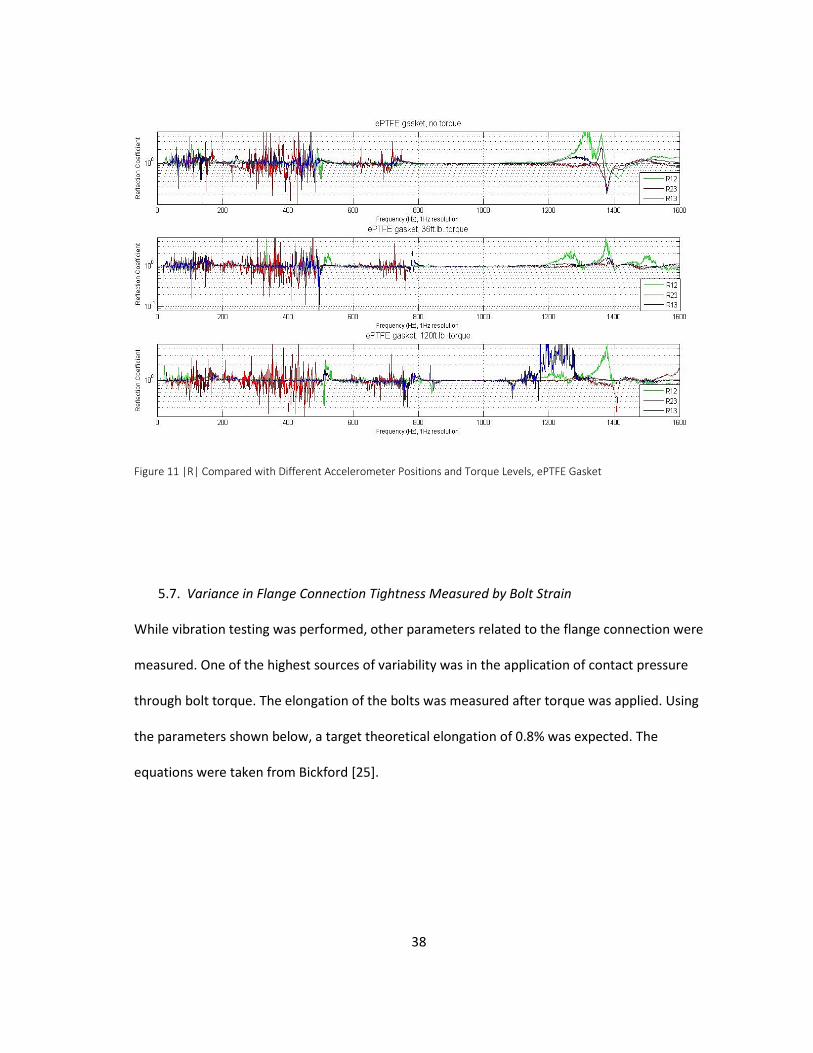
38
Figure 11 |R| Compared with Different Accelerometer Positions and Torque Levels, ePTFE Gasket
Variance in Flange Connection Tightness Measured by Bolt Strain 5.7.
While vibration testing was performed, other parameters related to the flange connection were
measured. One of the highest sources of variability was in the application of contact pressure
through bolt torque. The elongation of the bolts was measured after torque was applied. Using
the parameters shown below, a target theoretical elongation of 0.8% was expected. The
equations were taken from Bickford [25].
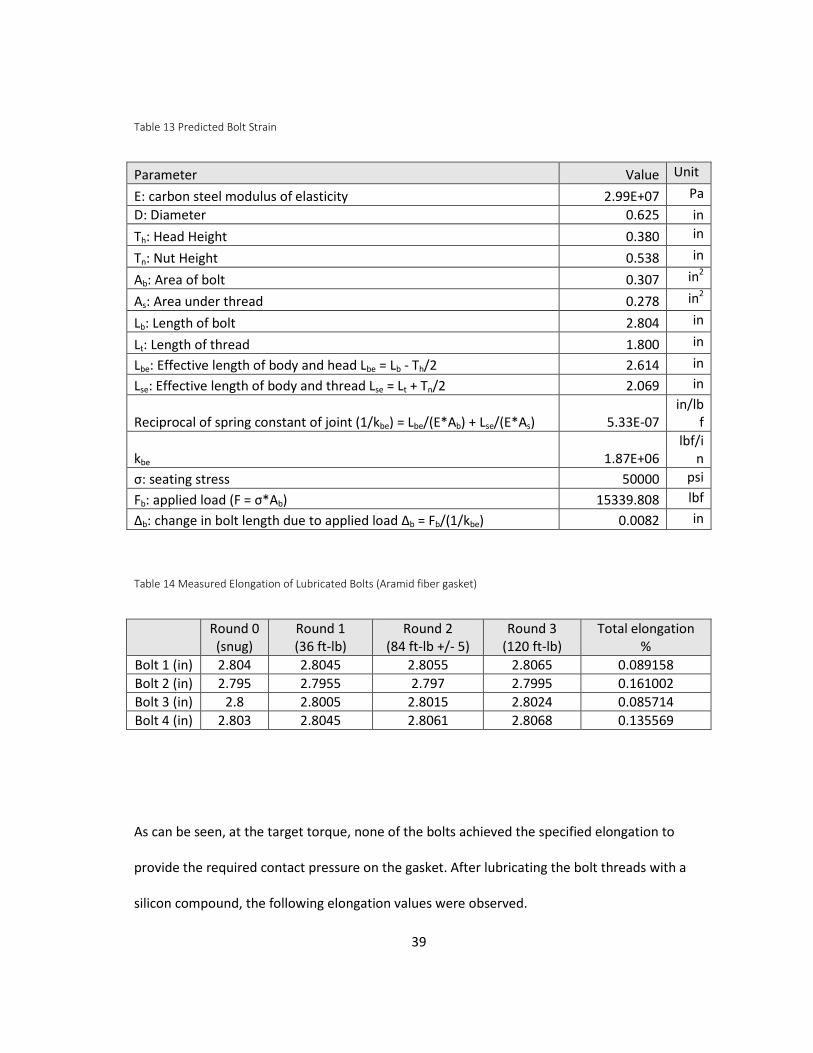
39
Table 13 Predicted Bolt Strain
Parameter Value Unit
E: carbon steel modulus of elasticity 2.99E+07 Pa D: Diameter 0.625 in Th: Head Height 0.380 in
Tn: Nut Height 0.538 in
Ab: Area of bolt 0.307 in2
As: Area under thread 0.278 in2
Lb: Length of bolt 2.804 in
Lt: Length of thread 1.800 in
Lbe: Effective length of body and head Lbe = Lb - Th/2 2.614 in Lse: Effective length of body and thread Lse = Lt + Tn/2 2.069 in
Reciprocal of spring constant of joint (1/kbe) = Lbe/(E*Ab) + Lse/(E*As) 5.33E-07 in/lb
f
kbe 1.87E+06 lbf/i
n σ: seating stress 50000 psi Fb: applied load (F = σ*Ab) 15339.808 lbf Δb: change in bolt length due to applied load Δb = Fb/(1/kbe) 0.0082 in
Table 14 Measured Elongation of Lubricated Bolts (Aramid fiber gasket)
Round 0 (snug)
Round 1 (36 ft-lb)
Round 2 (84 ft-lb +/- 5)
Round 3 (120 ft-lb)
Total elongation %
Bolt 1 (in) 2.804 2.8045 2.8055 2.8065 0.089158 Bolt 2 (in) 2.795 2.7955 2.797 2.7995 0.161002 Bolt 3 (in) 2.8 2.8005 2.8015 2.8024 0.085714 Bolt 4 (in) 2.803 2.8045 2.8061 2.8068 0.135569
As can be seen, at the target torque, none of the bolts achieved the specified elongation to
provide the required contact pressure on the gasket. After lubricating the bolt threads with a
silicon compound, the following elongation values were observed.
40
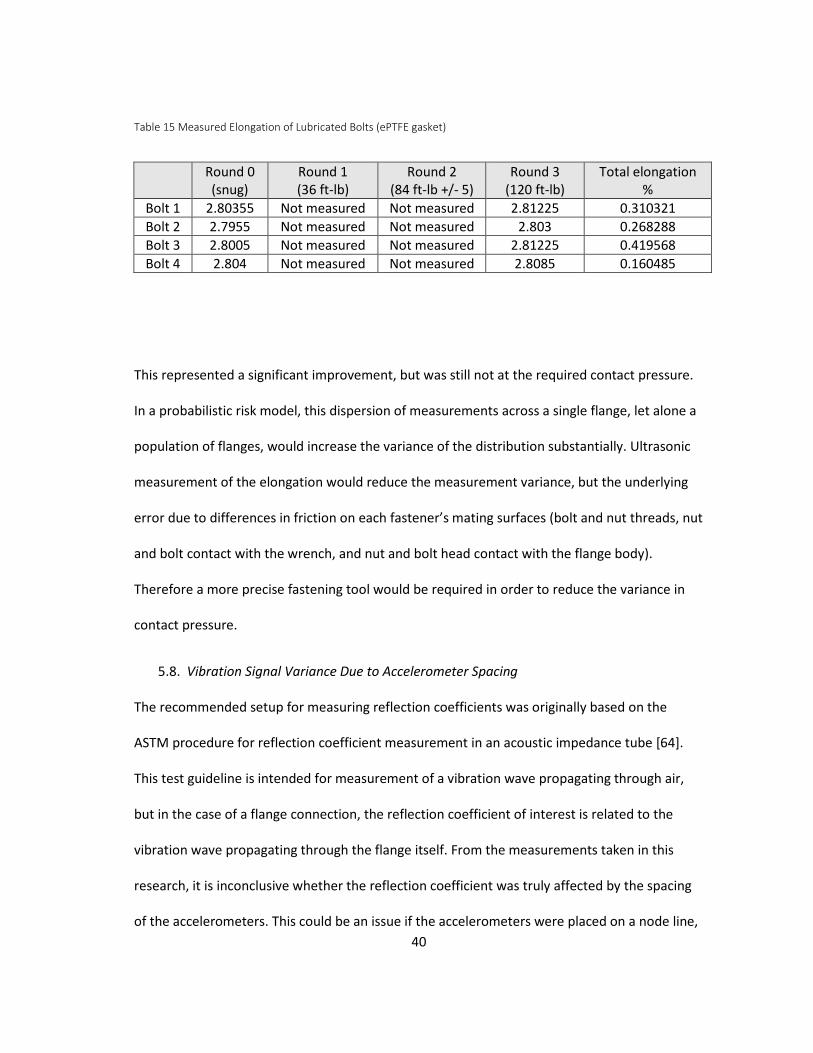
Table 15 Measured Elongation of Lubricated Bolts (ePTFE gasket)
Round 0 (snug)
Round 1 (36 ft-lb)
Round 2 (84 ft-lb +/- 5)
Round 3 (120 ft-lb)
Total elongation %
Bolt 1 2.80355 Not measured Not measured 2.81225 0.310321 Bolt 2 2.7955 Not measured Not measured 2.803 0.268288 Bolt 3 2.8005 Not measured Not measured 2.81225 0.419568 Bolt 4 2.804 Not measured Not measured 2.8085 0.160485
This represented a significant improvement, but was still not at the required contact pressure.
In a probabilistic risk model, this dispersion of measurements across a single flange, let alone a
population of flanges, would increase the variance of the distribution substantially. Ultrasonic
measurement of the elongation would reduce the measurement variance, but the underlying
error due to differences in friction on each fastener’s mating surfaces (bolt and nut threads, nut
and bolt contact with the wrench, and nut and bolt head contact with the flange body).
Therefore a more precise fastening tool would be required in order to reduce the variance in
contact pressure.
Vibration Signal Variance Due to Accelerometer Spacing 5.8.
The recommended setup for measuring reflection coefficients was originally based on the
ASTM procedure for reflection coefficient measurement in an acoustic impedance tube [64].
This test guideline is intended for measurement of a vibration wave propagating through air,
but in the case of a flange connection, the reflection coefficient of interest is related to the
vibration wave propagating through the flange itself. From the measurements taken in this
research, it is inconclusive whether the reflection coefficient was truly affected by the spacing
of the accelerometers. This could be an issue if the accelerometers were placed on a node line,

41
such as a half wavelength of the signal frequency of interest. As long as the measurements
were taken at the same spots on the pipe consistently, there should not be a significant
variation in the reflection coefficient due to the accelerometer spacing.
42
CONCLUSION 6.
Loss of containment events in the process industry are rare. The consequences of a failure are
high, which justifies a Quantified Risk Analysis. The various data sources which may be used for
predicting probabilities of failure have large differences in parameters that should be
comparable. This variation is due to differences in the way the data has been sampled,
censored, and categorized by the authorities who gathered it. Expert judgment can be used to
rationalize the differences in probability predictions that are based on different data sources.
However, the judgment and decisions based on the experience of an individual or a group of
individuals in an industry are by nature heuristic. They are not capable of accounting for
unknowns for which the expert group has no awareness.
In order to make predictions about rare events that are relatable to event scenarios with other
priors and that can be extrapolated beyond the timescale of the priors, the degree of
uncertainty in the priors should be considered. Hierarchical Bayesian methods provide a tool
for doing so. With these probabilistic techniques the unknown or incomplete distribution of
likelihoods for a prior can be updated as data is gathered about a specific scenario. This enables
predictions to be made without censoring data, and without including data which may have
priors that are not correlated to the scenario under consideration.
In order to maintain mechanical integrity, fixed assets in the process industries are managed
based on their estimated remaining life. The primary causes of degradation in these fixed
equipment assets are corrosion reactions between the asset’s material of construction and the
process chemistry. The remaining life predictions for these assets typically use a generic failure

43
frequency that is modified based on the expected corrosion rate. The sources of uncertainty in
these models are population-wide and asset-specific.
Population-wide variance includes the uncertainty in the accuracy of the generic failure
frequencies used to conduct the analysis. This affects the predicted failure rate of each asset in
the plant. On a specific level, there is uncertainty in the actual corrosion rate due to 1) variation
within the material of construction’s specified composition, 2) control of the fabrication
process, where welding, forging, application of corrosion resistant linings, and other heat
treatment operations could produce microstructures which have unexpected mechanical
properties and corrosion resistance, 3) control of the process operating conditions which
govern the chemical activity of the corrosive components of the stream, and 4) precision of the
inspection techniques used to quantify the structural integrity and amount of remaining life in
the vessel, including the sample amount of the vessel that is inspected and the probability of
detection of any Non-Destructive Evaluation techniques which are used.
Asset-specific uncertainties have historically been addressed with empirical safety factors,
which have no physical basis or statistical measurement of their uncertainty. A new approach
has been proposed in this thesis for predicting the probability of failure based on the average
failure frequency (aff) of a specific population of assets in a process plant. This aff is determined
by a hierarchical Bayesian network which combines a covariance model with a generic failure
frequency and then updates as failures are observed at different operating times. In this way,
remaining life predictions of a population of assets can be tied to their actual performance,
even where they have different corrosion resistance, operating conditions, and inspection
44
history. The use of an aff also enables a system approach which updates the predictions for the
remaining life of other assets when an observation is made in a single asset.
A specific application of this probabilistic method for flange connection leak risk has been
demonstrated. Flange connections are present in large numbers in a process plant, but their
risk as discrete elements of a process system is typically not considered. The prior factors that
drive the failure frequency were developed from an existing static seal covariance model and
the generic failure frequency was updated using the averaging technique described above.
In order to update the expected failure rate prior to observing a failure, an inspection
technique for flange connections was also investigated. Flange connection seal failures are
generally due to a loss of clamping force at the flange face. This loss of clamping force can be
caused by degradation of the gasket material, corrosion of the flange face, or loss of tightness
at the fasteners. A vibration-based NDE method may be capable of detecting all of these forms
of degradation by measuring the loss of tightness in the sample. Although there are many
measurements that may be performed from a vibration frequency spectrum, the experiments
in this thesis focused on the shift in the resonance frequencies of the transfer function and
changes in the reflection coefficient. The resonance frequency shift is a function of the stiffness
of the system. As expected, decreasing bolt torque shifted the resonance frequencies lower,
indicating a loss in the flange connection system’s stiffness. The reflection coefficient is a
function of the amplitudes of the forward and reverse propagating components of plane waves
in the pipe. Also as expected, the reflection coefficient decreased with increasing bolt torque,
due to the increase of contact stress causing the surface area between the flange face and
gasket to increase and the overall stiffness of the system to increase.
45
REFERENCES
[1] Presidential Commission on the Space Shuttle Challenger Accident. Report to the
President., vol. 1. Washington D.C., 1986, URL:
http://history.nasa.gov/rogersrep/genindex.htm. Retrieved May 31, 2014.
[2] Sötebier D.L., Rall W., Problems With Leakages at Large Flanges in the
BASF New Ammonia Plant. Plant/Operations Progress, 1986;vol. 5 Page 86.
[3] Daily Mail Staff, Gasket Failure Led to Leak: Worker Injured in Incident at Rhone-
Poulenc Plant. Charleston Daily Mail News. Charleston, WV, 1999.
[4] Breaux J., 'Official:Gas Was Volatile, But Not Toxic - System Safe,' Huntsman Manager
Says, After Plant Lost Tons of Gas. Odessa American News (Odessa, TX). McClatchy-
Tribune Information Services. March 18, 2004, Page 1A.
[5] Breaux J., Huntsman Polymers' Gas Leak In Odessa, Texas, Blamed On Mechanical
Failure. Odessa American News (Odessa, TX). McClatchy-Tribune Information Services.
March 18, 2004.
[6] Editors, Gasket failures in US chemical plants, Sealing Technology, Volume 2004, Issue
4, April 2004, Page 5.
[7] Editors, Gasket failure at US nuclear plant, Sealing Technology, Volume 2005, Issue 2,
February 2005, Page 5.
[8] Pipeline and Hazardous Materials Safety Administration, Failure Investigation Report –
Amoco Insulating Flange Leak, Granger, IN, 2005.
[9] Pipeline and Hazardous Materials Safety Administration, Failure Investigation Report –
Columbia Clendenin Compressor Station Head Gasket Failure, Clendenin, WV, 2009.

46
[10] Pipeline and Hazardous Materials Safety Administration, Failure Investigation Report –
Sunoco R&M Flange Gasket. Philadelphia, PA, 2010.
[11] Chemical Safety Board, Statement on Ongoing Investigation into the March 5th Release
of HF at the CITGO East Refinery in Corpus Christi, Texas. Washington D.C., 2012.
[12] American Petroleum Institute, API Recommended Practice 581 Risk-Based Inspection
Technology. First Edition, Washington D.C., 2008.
[13] Health and Safety Executive, Failure Rate and Event Data for use within Risk
Assessments. London, UK, 2012.
[14] International Association of Oil & Gas Producers, Process Release Frequencies. London,
UK, 2010.
[15] LNE Department, Nature and Energy Policy Unit, Safety Reporting Division, Flemish
Government, Handbook of failure frequencies for safety reports. Flanders, Belgium,
2009.
[16] National Institute of Public Health and the Environment, Reference Manual Bevi. The
Netherlands, 2009.
[17] Naval Sea Systems Command, Handbook of Reliability Prediction Procedures for
Mechanical Equipment. Washington D.C., 2014.
[18] Fenton N., Neil M., Risk assessment and decision analysis with bayesian networks. CRC
Press, Boca Raton, FL 2012.
[19] Ebeling C.E., An introduction to reliability and maintainability engineering. McGraw-Hill
Education, New York 2004.
[20] Ang A.H.S., Tang W.H., Probability concepts in engineering planning and design. Wiley,
Hoboken, NJ 2007.
47
[21] Rogers W.R., SENG 660 Lecture 33 - Risk Management (unpublished slide), Texas A&M
University, College Station, TX, 2014.
[22] Engel S.J., Gilmartin B.J., Bongort K., Hess A., Prognostics, the real issues involved with
predicting life remaining. Aerospace Conference Proceedings, 2000 IEEE, Vol 6, Pages
457-469.
[23] Environmental Protection Agency, Cost and Emission Reductions for Meeting Percent
Leaker Requirements for HON Sources. Washington, DC, 2005.
[24] Bickford J., Gaskets and Gasketed Joints. CRC Press, Boca Raton, FL 1997.
[25] Bickford J., An Introduction to the Design and Behavior of Bolted Joints. Third Edition,
Taylor & Francis, New York, 1995.
[26] Currie R., The Combination of Modern Sealing Materials to Assist in the Reduction of
Flange Deterioration. ASME 2011 Pressure Vessels and Piping Conference: American
Society of Mechanical Engineers, 2011. Pages 133-138.
[27] Szweda R., Sealing products for the electronics equipment market. Sealing Technology,
August 2001, Pages 6-8.
[28] Meyers M.A., Chawla K.K., Mechanical Behavior of Materials. Cambridge University
Press, 2009.
[29] Simonetti F., Cawley P., On the nature of shear horizontal wave propagation in elastic
plates coated with viscoelastic materials. Proceedings of the Royal Society A:
Mathematical, Physical & Engineering Sciences, 2004, Vol:460, ISSN:1364-5021, Pages
2197-2221.
48
[30] EN13555 C. Flanges and their joints-Gasket parameters and test procedures relevant to
the design rules for gasketed circular flange connections. European Community for
Standardisation Task Group TC47, 2004.
[31] American Society for Testing of Materials, ASTM F104 - Standard Classification System
for Nonmetallic Gasket Materials. West Conshohocken, PA: ASTM International, 2011.
[32] Dinzburg B., The Selection of Elastomer Compounds through Correlation of Rubber
Properties to Seal Life. SAE International, 2001, Paper 2001-01-0686
[33] Abboud A., Nassar S.A., Journal of Pressure Vessel Technology, 2013, Vol 135, Issue 3,
Article 031201.
[34] Alkelani A.A., Housari B.A., Nassar S.A., Journal of Pressure Vessel Technology, 2008,
Vol 130, Article 011211.
[35] Housari B.A., Nassar S.A., Alkelani A.A., Journal of Pressure Vessel Technology, 2012,
Vol 134, Article 021201.
[36] Kobayashi T., Hamano K., The Reduction of Bolt Load in Bolted Flange Joints due to
Gasket Creep-Relaxation Characteristics. ASME/JSME 2004 Pressure Vessels and Piping
Conference, 2004, Pages 97-104.
[37] Kobayashi T., Nishida T., Yamanaka Y., Effect of Creep-Relaxation Characteristics of
Gaskets on the Bolt Loads of Gasketed Joints. ASME 2003 Pressure Vessels and Piping
Conference, 2003, Pages 111-118.
[38] Nagy A., International journal of pressure vessels and piping, 1997, Vol 72, Pages 219-
229.
[39] Grine L., Bouzid A-H., Journal of Pressure Vessel Technology, 2013, Vol 135, Issue 2,
Article 021302.

49
[40] American Society of Mechanical Engineers, Boiler and Pressure Vessel Code Section VIII,
New York, 2013.
[41] Sandbrook T., Emery M., Ludman J., Chemical Engineering Progress 2011, Vol 107,
Pages 31-37.
[42] Ozevin D., Harding J., International Journal of Pressure Vessels and Piping, 2012, Vol 92,
Pages 62-69.
[43] Chambers A.K., Strosher M., Wootton T., Moncrieff J., McCready P., Journal of the Air &
Waste Management Association, 2008, Vol 58, Pages 1047-1056.
[44] Holmes C., Drinkwater B., The Use of Ultrasound to Measure Contact Stiffness and
Pressure in Large Contacting Interfaces. AIP conference proceedings: Institute of
Physics Publishing Ltd, 2003, Pages 1072-1079.
[45] Huang N.E., Shen Z., Long S.R., Annual Review of Fluid Mechanics 1999, Vol 31, Pages
417-457.
[46] Huang N.E., Shen Z., Long S.R., Wu M.C., Shih H.H., Zheng Q., Yen N-C., Tung C.C., Liu
H.H., Proceedings of the Royal Society of London. Series A: Mathematical, Physical and
Engineering Sciences, 1998, Vol 454, Pages 903-995.
[47] Ruqiang Y., Gao R.X., IEEE Transactions on Instrumentation and Measurement, 2006,
Vol 55, Pages 2320-2329.
[48] Salvino L.W., Pines D.J., Todd M., Nichols J.M., EMD and instantaneous phase detection
of structural damage. Hilbert-Huang Transform and Its Applications. World Scientific
Publishing Co. Pte. Ltd. Singapore. 2005.
[49] Yang J., Journal of Engineering Mechanics, 2004, Vol 130, Pages 85-95.
[50] Caccese V., Mewer R., Vel S.S., Engineering Structures, 2004, Vol 26, Pages 895-906.

50
[51] Esmaeel R.A., Taheri F., Nondestructive Testing and Evaluation, 2013, Vol 28, Pages
208-225.
[52] He K., Zhu W., Detecting loosening of bolted connections in a pipeline using changes in
natural frequencies. ASME 2011 International Design Engineering Technical
Conferences and Computers and Information in Engineering Conference: American
Society of Mechanical Engineers, 2011, Pages 525-533.
[53] Jinkyu Y., Fu-Kuo C., Smart Materials and Structures, 2006, Vol 15, Pages 581-590.
[54] Marshall M., Lewis R., Howard T, Brunskill H. Proceedings of the Institution of
Mechanical Engineers, Part C: Journal of Mechanical Engineering Science, 2012, Vol
226, Pages 1869-1884.
[55] Marshall M.B., Zainal I., Lewis R., Strain, 2011, Vol 47, Pages 65-78.
[56] Chung J.Y., Blaser D.A., The Journal of the Acoustical Society of America, 1980, Vol 68,
Pages 907-921.
[57] Park G., Cudney H.H., Inman DJ. Earthquake Engineering & Structural Dynamics, 2001,
Vol 30, Page 1463-1474.
[58] Szczepek J., Krolikowski J., Journal of High Pressure Research, 1990, Vol 5, Pages 897-
899.
[59] Marshall M.B., Lewis R., Dwyer-Joyce R.S., Strain, 2006,Vol 42, Pages 31-43.
[60] Pau M., Baldi A., Journal of Pressure Vessel Technology, 2006, Vol 129, Pages 175-181.
[61] Madsen H.O., Krenk S., Lind N.C., Methods of Structural Safety, Courier Dover
Publications, 2006.
[62] Kinsler L.E., Frey A.R., Coppens A.B., Sanders J.V., Fundamentals of Acoustics, 4th
Edition, Wiley-VCH, 1999.
51
[63] Saffari M., Sedaghati R., Stiharu I., Damage Identification in Frame Structures, Using
Damage Index, Based on H2-Norm. Annual Conference of the Prognostics and Health
Management Society, Montreal, 2011.
[64] American Society for Testing of Materials, ASTM E1050-98. Standard Test Method for
Impedance and Absorption of Acoustical Materials Using a Tube, Two Microphones,
and a Digital Frequency Analysis System. New York, 1998.

52
APPENDIX A
FLANGE REQUIREMENTS IN PRESSURE VESSEL DESIGN CODES
ASME Boiler Pressure Vessel Code Approach 6.1.
The ASME Boiler Pressure Vessel Code (BPVC) Section VIII Nonmandatory Appendix S specifies a
seating stress y and a maintenance factor m. However, these constants are only applicable for a
statically loaded connection. Once the pressure or temperature have cycled, the seal of the
connection will be less effective.
For flange gasket seating surfaces, a typical roughness recommendation is 125-250μin (ASME
PCC-1 Appendix C). A defect depth limit is given by the following table (ASME PCC-1 Appendix
D).
Table 16 Allowable Defect Depth vs. Width Across Face
Measurement Hard-faced
gaskets
Soft-faced gaskets
rd <w/4 <0.030 in. <0.050 in.
w/4 <rd <w/2 <0.010 in. <0.030 in.
w/2 <rd
<3w/4
Not allowed <0.005 in.
rd >3w/4 Not allowed Not allowed
DIN EN 13555 Approach to BFC Design 6.2.
EN 13555 uses a leak rate based approach. An acceptable volumetric leak rate is specified,
based on the process fluid viscosity at operating temperature. The EN 13555 approach provides

53
for the case that the BFC will experience cycles of pressure and temperature while it is in
operation. Therefore, it is a more realistic test of the seal’s ability to resist these challenges.
A tightness parameter is given by (24), where P = internal pressure (MPa), P* = atmospheric
pressure (MPa), Lrm = mass leak rate per unit diameter (mg/sec-mm), and L*rm = reference
leak rate per unit diameter [150L*rm = 1 mg/sec] (mg/sec-mm).
𝑇𝑃 =
𝑃/(𝐿𝑟𝑚)0.5
𝑃∗/(𝐿𝑟𝑚∗ )0.5 (24)