Embed Size (px)
Citation preview
Methods of Analysis by the U.S. Geological SurveyNational Water Quality Laboratory— Comparison of aNitric Acid In-Bottle Digestion Procedure toOther Whole-Water Digestion Procedures
Open-File Report 99–094
U.S. Department of the InteriorU.S. Geological Survey
Methods of Analysis by the U.S. Geological SurveyNational Water Quality Laboratory— Comparison of aNitric Acid In-Bottle Digestion Procedure toOther Whole-Water Digestion Procedures
By John R. Garbarino and Gerald L. Hoffman
U.S. GEOLOGICAL SURVEY
Open-File Report 99–094
Denver, Colorado1999
U.S. DEPARTMENT OF THE INTERIOR
BRUCE BABBITT, Secretary
U.S. GEOLOGICAL SURVEY
Charles G. Groat, Director
The use of brand, firm, and trade names in this report is for identificationpurposes only and does not constitute endorsement by the U.S. Government.
For additional information write to: Copies of this report can be purchased from:
U.S. Geological Survey U.S. Geological SurveyChief, National Water Quality Laboratory Branch of Information ServicesBox 25046, Mail Stop 407 Box 25286Federal Center Federal CenterDenver, CO 80225-0046 Denver, CO 80225-0286
CONTENTS III
CONTENTS
Abstract ......................................................................................................................... 1Introduction ................................................................................................................... 1Analytical method.......................................................................................................... 2
1. Application......................................................................................................... 22. Summary of method ........................................................................................... 23. Interferences ....................................................................................................... 24. Apparatus and materials...................................................................................... 25. Reagents............................................................................................................. 26. Nitric acid in-bottle digestion procedure ............................................................. 47. Calculations........................................................................................................ 58. Reporting results................................................................................................. 5
Discussion of results....................................................................................................... 5Conclusions ................................................................................................................... 12References cited ............................................................................................................. 17Appendix........................................................................................................................ 18
FIGURES
1. Percentage yield as a function of hydrochloric acid in-bottle digestion, U.S.Environmental Protection Agency digestion, and nitric acid in-bottledigestion procedures for synthetic whole-water samples prepared usingBuffalo River, Riverine, and Estuarine Sediments ................................................. 13
2–4. Graphs showing linear regression analysis of elemental percentage yieldfor the nitric acid in-bottle digestion in relation to the hydrochloric acidin-bottle digestion for synthetic whole-water samples made from NationalInstitute of Standards and Technology standard reference material:
2. Buffalo River Sediment ......................................................................................... 183. Riverine Sediment ................................................................................................. 194. Estuarine Sediment................................................................................................ 19
TABLES
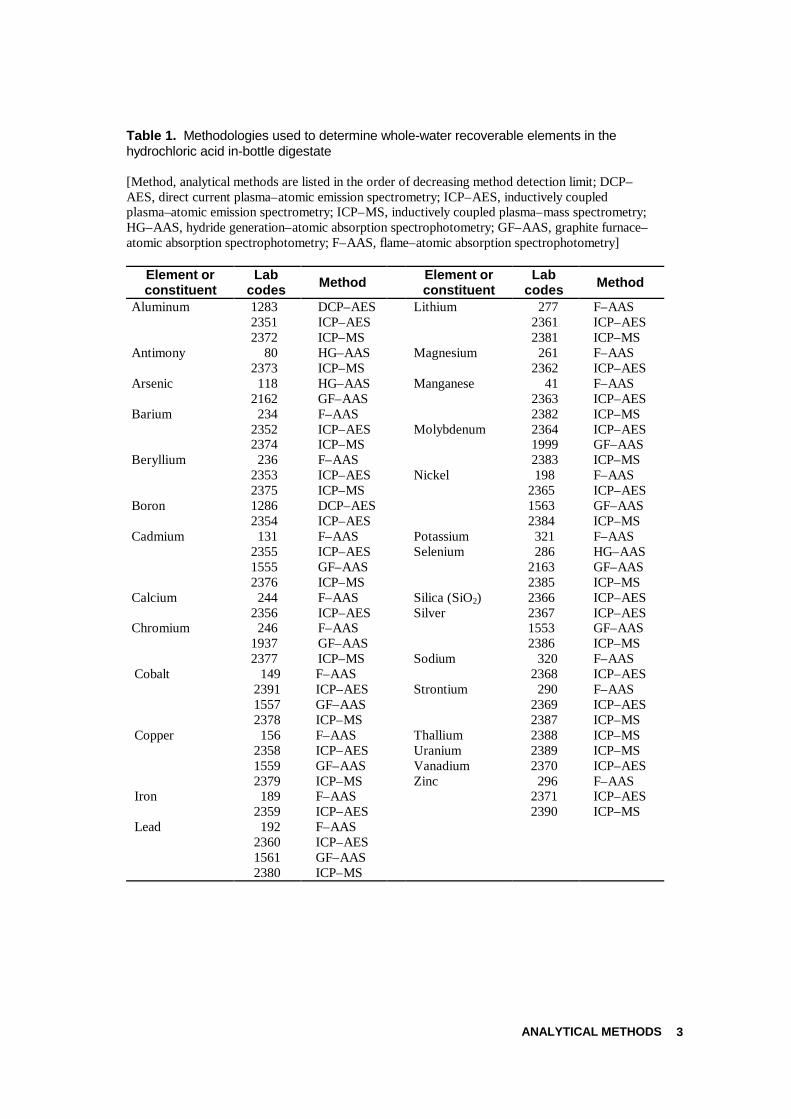
1. Methodologies used to determine whole-water recoverable elements in thehydrochloric acid in-bottle digestate ...................................................................... 3
2–4. Elemental concentrations in various digestates of a synthetic whole-watersample made from National Institute of Standards and Technology standardreference material:
2. Buffalo River Sediment ......................................................................................... 73. Riverine Sediment ................................................................................................. 84. Estuarine Sediment................................................................................................ 9
Comparison of a Nitric Acid In-Bottle Digestion Procedureto Other Whole-Water Digestion Procedures
IV
TABLES— Continued
5–7. Percentage yield using various digestion procedures for syntheticwhole-water samples made from National Institute of Standardsand Technology standard reference material:
5. Buffalo River Sediment ......................................................................................... 106. Riverine Sediment ................................................................................................. 117. Estuarine Sediment................................................................................................ 128. Statistical analysis summary of elemental percentage yield for the nitric
acid in-bottle digestion in relation to the hydrochloric acid in-bottle digestion ....... 179. Bias and variability for the subboiling evaporation technique ................................ 20
10. Bias and variability of subboiling evaporation of digestate from a syntheticwhole-water sample made from National Institute of Standards andTechnology Standard Reference Material 1646, Estuarine Sediment...................... 21
CONVERSION FACTORS AND ABBREVIATED WATER-QUALITY UNITS V
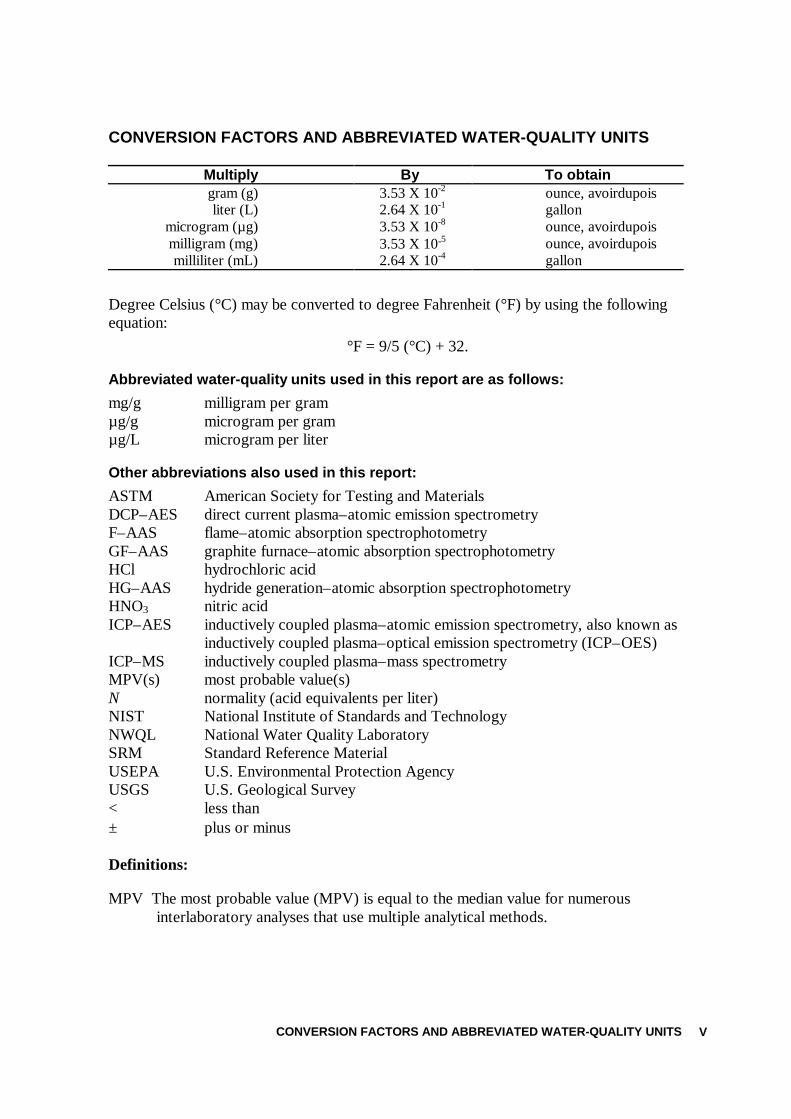
CONVERSION FACTORS AND ABBREVIATED WATER-QUALITY UNITS
Multiply By To obtaingram (g) 3.53 X 10⁻² ounce, avoirdupoisliter (L) 2.64 X 10⁻¹ gallon
microgram (µg) 3.53 X 10⁻⁸ ounce, avoirdupoismilligram (mg) 3.53 X 10⁻⁵ ounce, avoirdupoismilliliter (mL) 2.64 X 10⁻⁴ gallon
Degree Celsius (°C) may be converted to degree Fahrenheit (°F) by using the followingequation:
°F = 9/5 (°C) + 32.
Abbreviated water-quality units used in this report are as follows:
mg/g milligram per gramµg/g microgram per gramµg/L microgram per liter
Other abbreviations also used in this report:
ASTM American Society for Testing and MaterialsDCP–AES direct current plasma–atomic emission spectrometryF–AAS flame–atomic absorption spectrophotometryGF–AAS graphite furnace–atomic absorption spectrophotometryHCl hydrochloric acidHG–AAS hydride generation–atomic absorption spectrophotometryHNO3 nitric acidICP–AES inductively coupled plasma–atomic emission spectrometry, also known as
inductively coupled plasma–optical emission spectrometry (ICP–OES)ICP–MS inductively coupled plasma–mass spectrometryMPV(s) most probable value(s)N normality (acid equivalents per liter)NIST National Institute of Standards and TechnologyNWQL National Water Quality LaboratorySRM Standard Reference MaterialUSEPA U.S. Environmental Protection AgencyUSGS U.S. Geological Survey< less than± plus or minus
Definitions:
MPV The most probable value (MPV) is equal to the median value for numerousinterlaboratory analyses that use multiple analytical methods.
Comparison of a Nitric Acid In-Bottle Digestion Procedureto Other Whole-Water Digestion Procedures
VI
Whole-water recoverable. Pertains to the constituents in solution after a representativewater-suspended-sediment sample is digested (usually using dilute acid solution).Complete dissolution of particulate matter often is not achieved by the digestiontreatment, and thus the determination represents something less than the “total”amount (that is, less than 95 percent) of the constituent present in the dissolved andsuspended phases of the sample. Equivalent digestion procedures would be requiredof all laboratories that perform such analyses to achieve comparability of analyticaldata, because different digestion procedures are likely to produce different analyticalresults.
INTRODUCTION 1
Methods of Analysis by the U.S. Geological SurveyNational Water Quality Laboratory— Comparison of aNitric Acid In-Bottle Digestion Procedure to OtherWhole-Water Digestion Procedures
By John R. Garbarino and Gerald L. Hoffman
ABSTRACT
A hydrochloric acid in-bottle digestionprocedure is used to partially digest whole-water samples prior to determiningrecoverable elements by various analyticalmethods. The use of hydrochloric acid isproblematic for some methods of analysisbecause of spectral interference. The in-bottle digestion procedure has beenmodified to eliminate such interference byusing nitric acid instead of hydrochloric acidin the digestion. Implications of thismodification are evaluated by comparingresults for a series of synthetic whole-watersamples. Results are also compared withthose obtained by using U.S. EnvironmentalProtection Agency (1994) (USEPA) Method200.2 total-recoverable digestion procedure.Percentage yields that use the nitric acid in-bottle digestion procedure are within 10percent of the hydrochloric acid in-bottleyields for 25 of the 26 elements determinedin two of the three synthetic whole-watersamples tested. Differences in percentageyields for the third synthetic whole-watersample were greater than 10 percent for 16of the 26 elements determined. The USEPAmethod was the most rigorous forsolubilizing elements from particulate matterin all three synthetic whole-water samples.Nevertheless, the variability in thepercentage yield by using the USEPA
digestion procedure was generally greater thanthe in-bottle digestion procedure, presumablybecause of the difficulty in controlling thedigestion conditions accurately.
INTRODUCTION
The U.S. Geological Survey (USGS)National Water Quality Laboratory (NWQL)has been using the hydrochloric acid (HCl) in-bottle digestion procedure described byHoffman and others (1996) since 1992. Newanalytical methods that expand the scope ofelemental determinations, such as inductivelycoupled plasma–mass spectrometry (ICP–MS),have been developed that are adversely affectedby the presence of HCl in the in-bottle digestate.
Implementation of newer methods for thedetermination of elements in whole-watersamples, therefore, requires modification of thein-bottle procedure. The proposed modifica-tion involves using nitric acid (HNO3) insteadof HCl for the in-bottle digestion. The bias andvariability of such a modification weredetermined by digesting three synthetic whole-water samples by the HCl and the HNO3 in-bottle procedures. Replicate samples were alsodigested using U.S. Environmental ProtectionAgency (1994) (USEPA) Method 200.2 as anadditional comparison. Elements currently(1999) being determined in HCl in-bottle
Comparison of a Nitric Acid In-Bottle Digestion Procedureto Other Whole-Water Digestion Procedures
2
digestate and their corresponding USGSanalytical methods are listed in table 1.
The objectives of this report are asfollows:
• To describe the HNO3 in-bottledigestion procedure.
• To establish the bias and variability ofthe HNO3 in-bottle digestionprocedure.
• To discuss the advantages anddisadvantages of using the HNO3
in-bottle digestion procedure.
The subject method was developed bythe USGS for use at the NWQL. Thismethod supplements other official USGSinorganic methods (Fishman and Friedman,1989; Fishman, 1993).
ANALYTICAL METHOD
Metals, Extraction Procedure, AcidDigestion, Whole-Water Recoverable,I-3487-98
1. Application
This method was developed to digestwhole-water samples by using an HNO3 in-bottle procedure to determine the elementslisted in table 1.
2. Summary of Method
Hoffman and others (1996) havepreviously described an HCl in-bottledigestion procedure. The HNO3 in-bottleprocedure requires minor modifications tothe HCl in-bottle procedure as outlined insection 6. After the preparatory procedure,the digestate can be analyzed by using anyof the methods listed in table 1. Details of
these analytical methods can be obtained inFishman (1993), Fishman and Friedman(1989), Garbarino and Struzeski (1998), andJones and Garbarino (1999).
3. Interferences
There are no known interferencesassociated with procedures described in thisreport.
4. Apparatus and Materials
4.1 Clean bench, class-100.
4.2 Filter paper, Whatman No. 41 orequivalent.
4.3 Disposable filter funnels, WhatmanNo. 1920-1441 or equivalent.
4.4 Drying oven, mechanical convectionheating, with controlled time and temperatureaccurate to ±1 percent.
4.5 Analytical balance, Mettler ModelPM600 or equivalent capable of accuratelyweighing 0.01 g.
4.6 Sample bottles, made of polyethyleneor polypropylene.
4.7 Filter-funnel racks, variable heightadjustable, nonmetallic construction thattolerates dilute acid.
5. Reagents
5.1 Nitric acid (HNO3), concentrated(specific gravity 1.41), a grade verified to haveelemental contaminant concentrations, after theprescribed dilution, that are less than themethod detection limits for the method ofanalysis being used.
ANALYTICAL METHODS 3
Table 1. Methodologies used to determine whole-water recoverable elements in thehydrochloric acid in-bottle digestate
[Method, analytical methods are listed in the order of decreasing method detection limit; DCP–AES, direct current plasma–atomic emission spectrometry; ICP–AES, inductively coupledplasma–atomic emission spectrometry; ICP–MS, inductively coupled plasma–mass spectrometry;HG–AAS, hydride generation–atomic absorption spectrophotometry; GF–AAS, graphite furnace–atomic absorption spectrophotometry; F–AAS, flame–atomic absorption spectrophotometry]
Element orconstituent
Labcodes Method Element or
constituentLab
codes Method
Aluminum 1283 DCP–AES Lithium 277 F–AAS2351 ICP–AES 2361 ICP–AES2372 ICP–MS 2381 ICP–MS
Antimony 80 HG–AAS Magnesium 261 F–AAS2373 ICP–MS 2362 ICP–AES
Arsenic 118 HG–AAS Manganese 41 F–AAS2162 GF–AAS 2363 ICP–AES
Barium 234 F–AAS 2382 ICP–MS2352 ICP–AES Molybdenum 2364 ICP–AES2374 ICP–MS 1999 GF–AAS
Beryllium 236 F–AAS 2383 ICP–MS2353 ICP–AES Nickel 198 F–AAS2375 ICP–MS 2365 ICP–AES
Boron 1286 DCP–AES 1563 GF–AAS2354 ICP–AES 2384 ICP–MS
Cadmium 131 F–AAS Potassium 321 F–AAS2355 ICP–AES Selenium 286 HG–AAS1555 GF–AAS 2163 GF–AAS2376 ICP–MS 2385 ICP–MS
Calcium 244 F–AAS Silica (SiO2) 2366 ICP–AES2356 ICP–AES Silver 2367 ICP–AES
Chromium 246 F–AAS 1553 GF–AAS1937 GF–AAS 2386 ICP–MS2377 ICP–MS Sodium 320 F–AAS
Cobalt 149 F–AAS 2368 ICP–AES2391 ICP–AES Strontium 290 F–AAS1557 GF–AAS 2369 ICP–AES2378 ICP–MS 2387 ICP–MS
Copper 156 F–AAS Thallium 2388 ICP–MS2358 ICP–AES Uranium 2389 ICP–MS1559 GF–AAS Vanadium 2370 ICP–AES2379 ICP–MS Zinc 296 F–AAS
Iron 189 F–AAS 2371 ICP–AES2359 ICP–AES 2390 ICP–MS
Lead 192 F–AAS2360 ICP–AES1561 GF–AAS2380 ICP–MS
Comparison of a Nitric Acid In-Bottle Digestion Procedureto Other Whole-Water Digestion Procedures
4
5.2 Water, ASTM Type I reagentwater (American Society for Testing andMaterials, 1995).
5.3 0.1N HNO3 is prepared by adding6.4 mL of acceptable concentrated nitricacid to 500 mL of water and dilute to 1Lwith water.
6. Nitric Acid In-Bottle DigestionProcedure
Unfiltered, acidified (also known asraw acidified, RA) samples are digested byusing the following procedure:
6.1 Weigh the sample bottle, cap, andcontents to determine the gross weight.
6.2 Subtract the average weight of anidentical size capped bottle to estimate thevolume of the sample.
6.3 Add 1.6 mL of concentratedHNO3 for every 50 mL (or about 3 percentby volume) of sample.
6.4 Recap the bottle and shakevigorously.
NOTE 1: Prepare a reagent blank and asynthetic whole-water sample with each setof samples digested (see sections 6.1–6.4).
6.5 Place the capped sample bottles ina 65°C oven and heat the samples for 8hours. Heating time includes the timerequired for the samples to reach oventemperature.
6.6 Preparation for filtering sampledigestate
6.6.1 Open the sealed disposablefilter funnels inside the clean bench andplace in the filter-funnel rack.
6.6.2 Rinse each funnel byrapidly filling with 250 mL of 0.1NHNO3; repeat rinsing with another 250mL of 0.1N HNO3.
6.6.3 Similarly rinse eachfunnel three times with water. Allowthe funnels to drain completely betweeneach rinse.
6.7 Sample digestate filtration
6.7.1 Place a clean, empty,acid-rinsed and labeled bottle undereach funnel.
6.7.2 Vigorously shake thesample bottle containing digestate afterit has been removed from the oven. Letstand for 30 minutes, and filter aliquotsof the digestate by using the filterfunnel.
6.7.3 Discard unfiltereddigestate. Rinse the original samplebottle twice with water and dispose ofthe rinse into a suitable containerclearly labeled as acid waste.
6.7.4 Transfer filtrate (seesection 6.7.2) into its original samplebottle and seal with a new, clear cap.
6.7.5 Use aliquots of thisfiltered solution to determine whole-water recoverable elemental concentra-tions by the appropriate analyticalmethods.
NOTE 2: Filtration of 100 percent ofthe digestate volume is not required ifthe sample bottles are shakenvigorously after removal from the oven.At least 75 percent of the sample mustbe filtered to ensure sufficient volumefor multiple analyses.
DISCUSSION OF RESULTS 5
NOTE 3: If a filter becomes pluggedduring filtration, replace it with a rinsedfilter funnel and continue the filtration.
7. Calculations
No calculations are required.
8. Reporting Results
Whole-water recoverable concentra-tions are reported in micrograms per liter tothe number of significant figures outlined inthe analytical method being used forquantitation.
DISCUSSION OF RESULTS
Currently (1999), selected USGSmethods are used to analyze the HCl in-bottle digestate. However, new methodsthat expand the scope of elementaldeterminations that are adversely affected bythe presence of HCl in the in-bottle digestatehave been developed. It is advantageous tohave one in-bottle digestion procedure thatis compatible with all the USGS methodsused to determine the elements listed intable 1. Such a procedure is the HNO3 in-bottle digestion. Its digestate is entirelycompatible with all whole-water recoverablemethods because HNO3 does not causespectral interferences. The extractionefficiency of HNO3, however, is most likelydifferent from that of HCl. All the digestionmethods tested in this report are proceduraland use different acids, acid concentrations,and methods of heating. For example, theUSEPA procedure refluxes the digestate,whereas the in-bottle procedures do not.
The bias and variability associatedwith the HNO3 in-bottle digestion procedurewere determined by using results obtainedfor synthetic whole-water samples that weremade from reference sediment. Synthetic
whole-water samples are used asbenchmarks in this study, as in thestudy by Hoffman and others (1996),because they are based on readilyavailable certified reference materialsand because the mixtures can beaccurately reproduced.
The synthetic whole-watersamples were prepared by weighing 200to 600 mg of the National Institute ofStandards and Technology (NIST)Standard Reference Material (SRM)2704 Buffalo River Sediment, 1645Riverine Sediment, or 1646 EstuarineSediment into 200 to 500 mL of 0.1NHNO3. Following preparation, thesynthetic whole-water samples wereshaken and allowed to stand at roomtemperature for about 3 days to simulateactual whole-water samples that arecollected and acidified on-site. Foursamples of each synthetic whole waterwere digested using the HCl in-bottleprocedure (Hoffman and others, 1996),the HNO3 in-bottle procedure, and theUSEPA procedure. Aluminum,antimony, arsenic, barium, beryllium,boron, cadmium, chromium, cobalt,copper, iron, lead, lithium, manganese,molybdenum, nickel, selenium, silver,strontium, thallium, uranium, vanadium,and zinc were determined in everysynthetic whole-water digestate byICP–MS. Calcium, iron, magnesium,silica (SiO2), and sodium weredetermined by inductively coupledplasma–atomic emission spectrometry(ICP–AES). Potassium was determinedby using flame–atomic absorptionspectrophotometry (F–AAS). Aliquotsof each HCl in-bottle and USEPAdigestate were processed before ICP–MS analysis to remove chloride byusing the procedure described in theAppendix of this report.
Comparison of a Nitric Acid In-Bottle Digestion Procedureto Other Whole-Water Digestion Procedures
6
Elemental concentrations from ICP–AES, ICP–MS, and F–AAS for all syntheticwhole-water digestates are listed in tables 2through 4 with corresponding percentageyields listed in tables 5 through 7.Percentage yield was calculated from theconcentration results by using equation 1.
Percentage yield = [(CS × VS) ⁄ (CR × WR)] × 100 (1)
where CS is the elemental concentration (inmicrograms per liter) in the digestate, VS isthe total volume (in liters) used to preparethe synthetic whole-water sample, CR is theelemental concentration in the referencesediment (in micrograms per gram), and WR
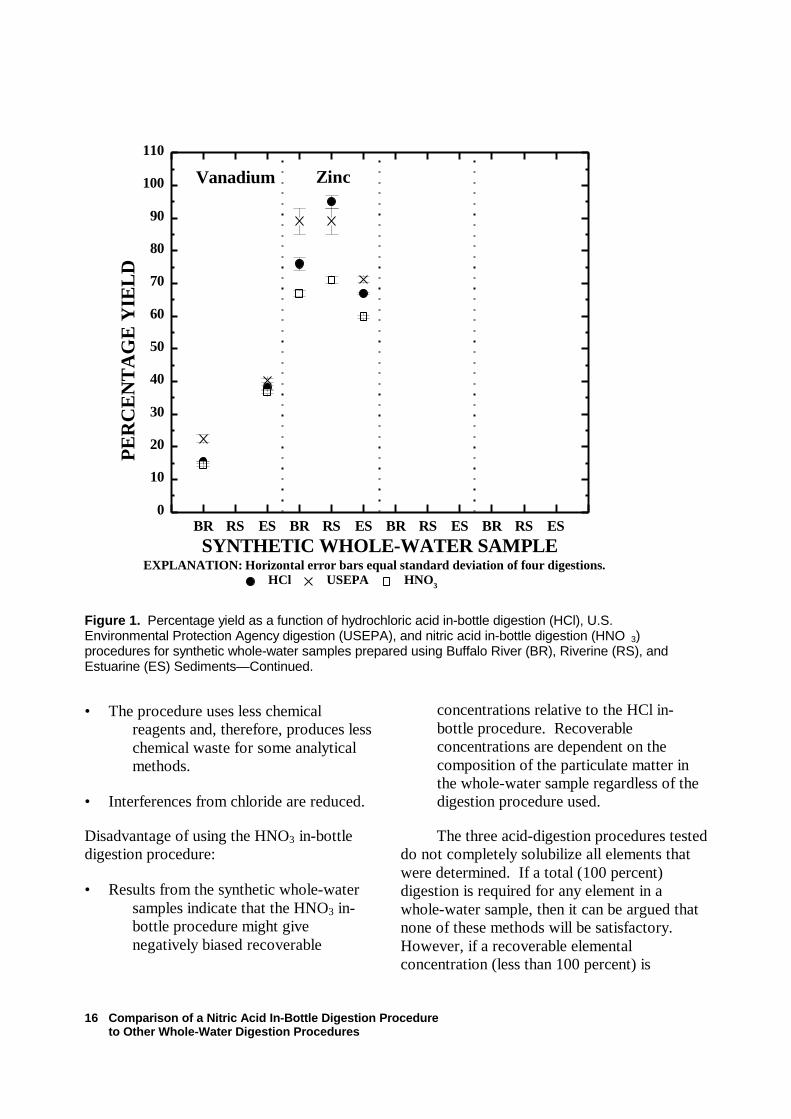
is the weight of reference sediment (ingrams) used to prepare the synthetic whole-water sample. Percentage yields listed intables 5 through 7 are also plotted infigure 1. For some elements (for example,boron and silver), yields could not becalculated because elemental concentrationsin the reference sediment were not reported.In these cases, the digestate concentrationscan be used to compare different digestprocedures.
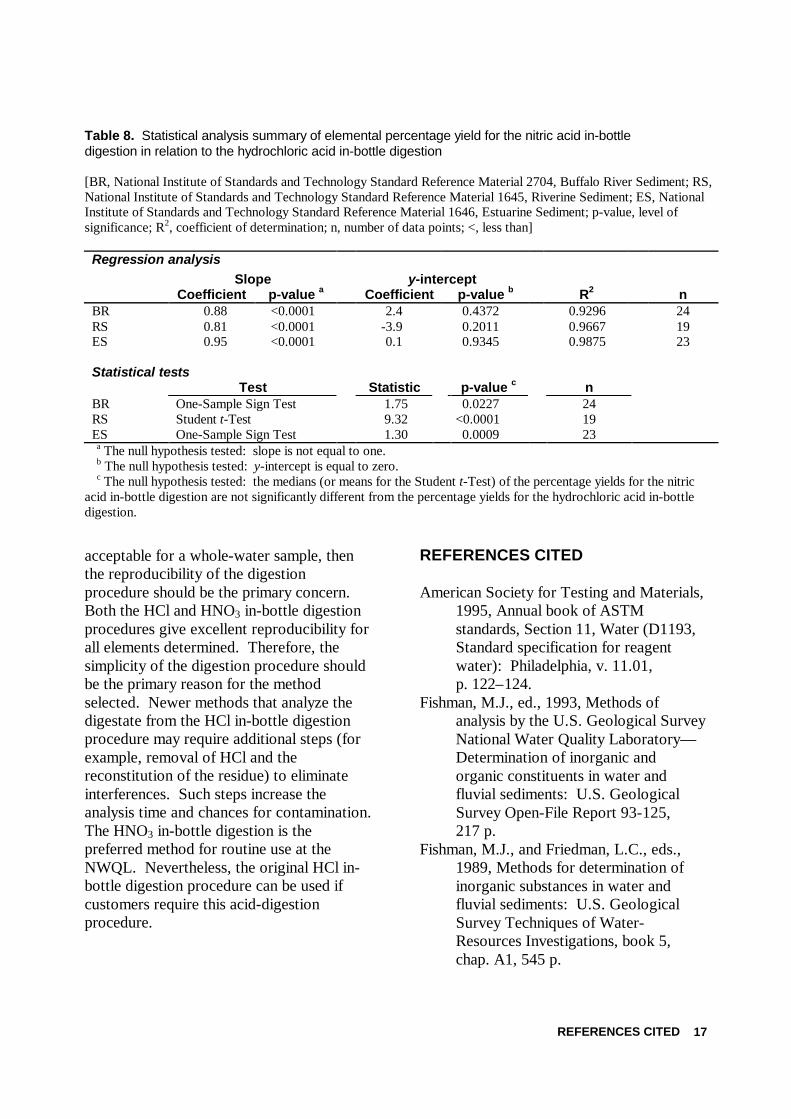
Linear regression analysis andstatistical tests were used to establish thebias and variability of the HNO3 in-bottleprocedure. All the mean percentage yieldslisted in tables 5 through 7, regardless of theelement or method of analysis, were treatedas a single data set for a given syntheticwhole-water sample. Statistical results arelisted in table 8 and the regression lines areshown in figures 2 through 4.
Because the yield data range over awide percentage, the authors used linearregression analysis to calculate the slope, y-intercept, and coefficient of determination(R2) for the equation describing the relationbetween percentage yield from the HNO3 in-bottle digestion to the HCl in-bottledigestion. A slope coefficient of one and a y-intercept of zero indicate exact correlation.
The corresponding p-values indicate thedegree of confidence in each coefficient.For additional confirmation, the One-Sample Sign Test or the Student t-Test,depending on whether the data set wasnormally distributed with equal variance,was used to test the null hypothesis. Thenull hypothesis tested whether thepercentage yields for the HNO3 in-bottledigestion are significantly different thanthe percentage yields for the HCl in-bottle digestion. The p-values werecalculated for each synthetic whole-water sample to provide a level ofconfidence in accepting the nullhypothesis. The larger the p-value thegreater the confidence in accepting thenull hypothesis. When the p-valueexceeds 0.05, the null hypothesis isacceptable at the 95-percent confidencelevel.
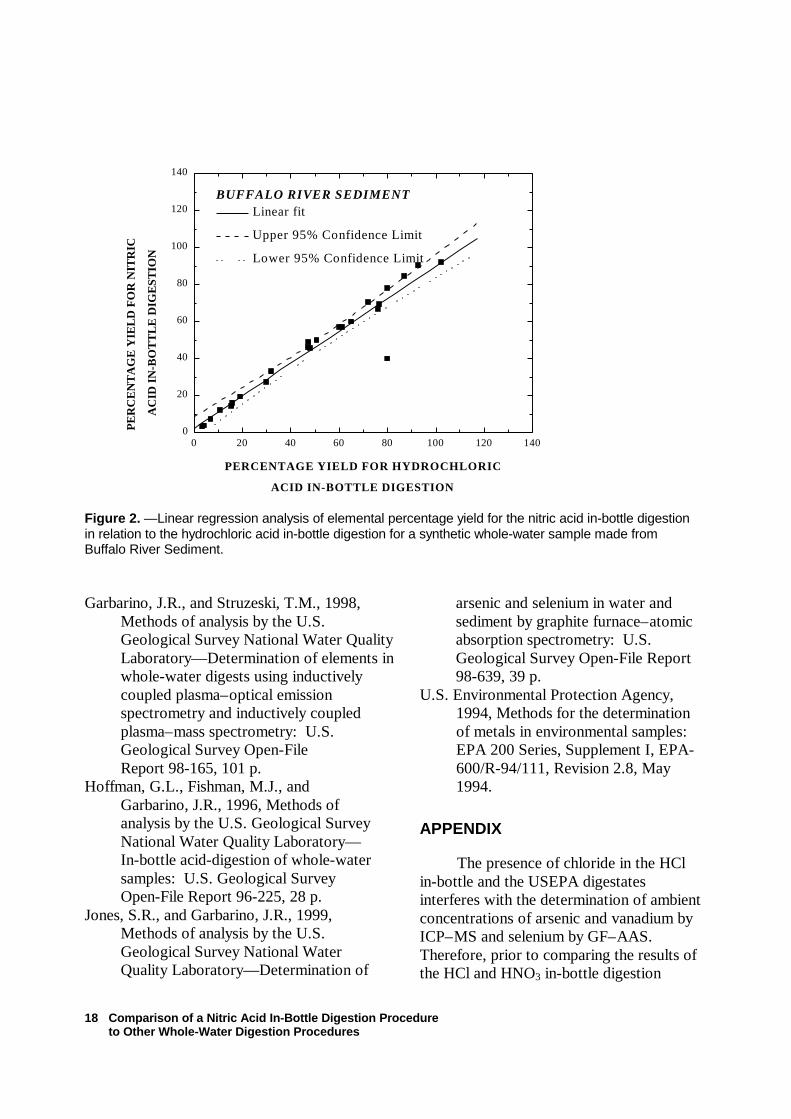
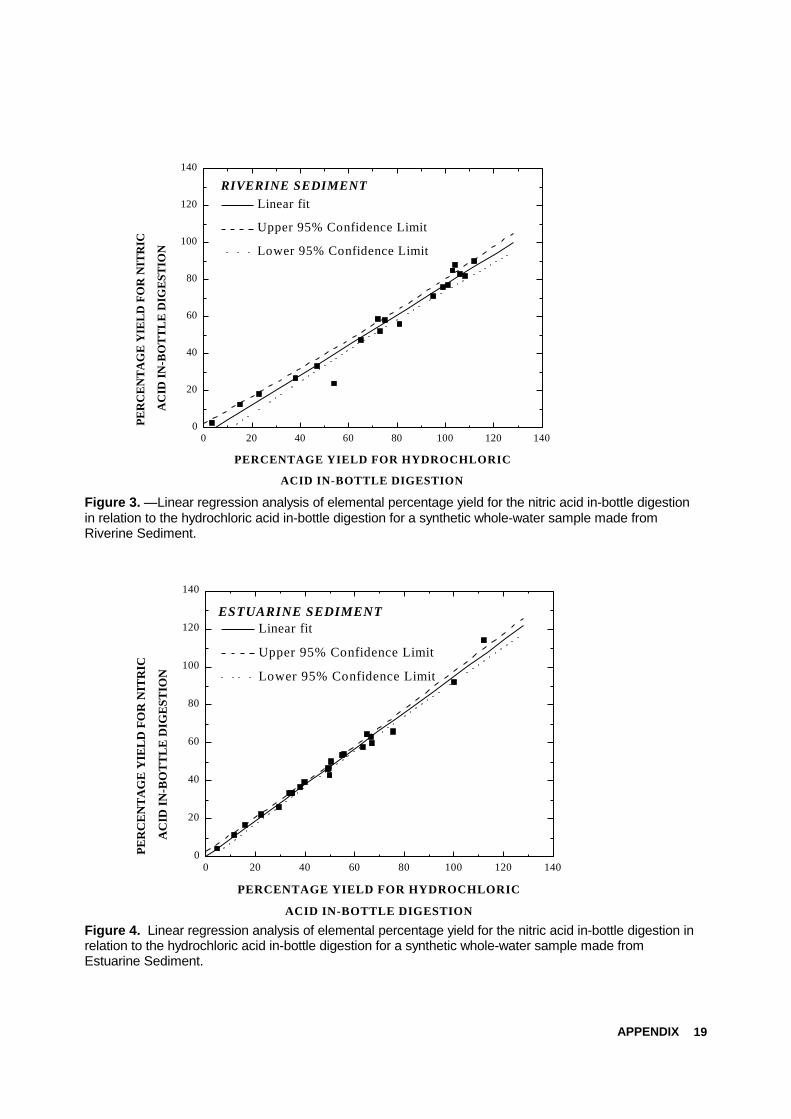
Slope coefficients indicate that theHNO3 in-bottle procedure providespercentage yields that are 5 to 20 percentlower than the HCl in-bottle procedure,depending on the type of synthetic whole-water sample (see table 8). For everysynthetic whole-water sample tested, mostelemental results are highly correlated andwithin the 95-percent confidence limit (seefigs. 2–4). The One-Sample Sign Test orthe Student t-Test results shown in table 8indicate that there is a statisticallysignificant difference (p-value less than0.05) between percentage yields, dependingon the acid used for the in-bottle digestion.
Percentage yields for the BuffaloRiver Sediment synthetic whole-watersample indicated that the differencebetween the HCl and HNO3 in-bottleprocedures is less than 10 percent for all theelements except for selenium (fig. 1). Allelemental percentage yields for theEstuarine Sediment synthetic whole-watersamples are within 10 percent of the
DISCUSSION OF RESULTS 7
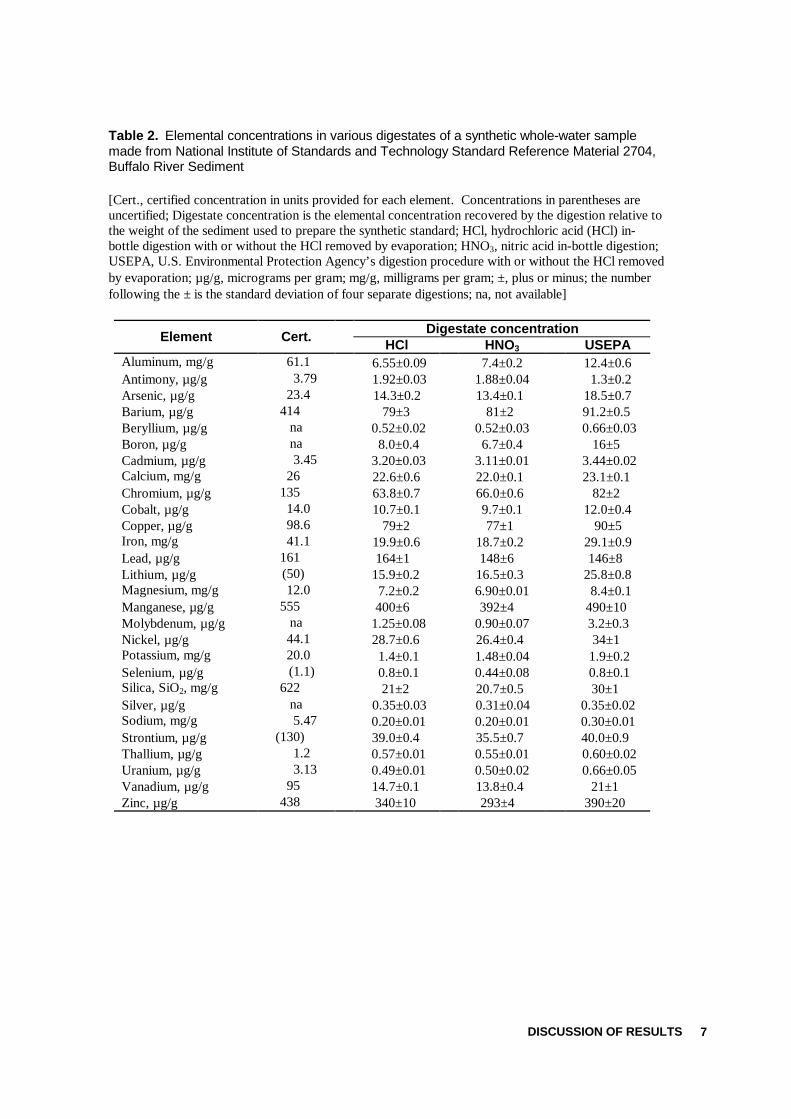
Table 2. Elemental concentrations in various digestates of a synthetic whole-water samplemade from National Institute of Standards and Technology Standard Reference Material 2704,Buffalo River Sediment
[Cert., certified concentration in units provided for each element. Concentrations in parentheses areuncertified; Digestate concentration is the elemental concentration recovered by the digestion relative tothe weight of the sediment used to prepare the synthetic standard; HCl, hydrochloric acid (HCl) in-bottle digestion with or without the HCl removed by evaporation; HNO3, nitric acid in-bottle digestion;USEPA, U.S. Environmental Protection Agency’s digestion procedure with or without the HCl removedby evaporation; µg/g, micrograms per gram; mg/g, milligrams per gram; ±, plus or minus; the numberfollowing the ± is the standard deviation of four separate digestions; na, not available]
Digestate concentrationElement Cert. HCl HNO3 USEPAAluminum, mg/g 61.1 6.55±0.09 7.4±0.2 12.4±0.6Antimony, µg/g 3.79 1.92±0.03 1.88±0.04 1.3±0.2Arsenic, µg/g 23.4 14.3±0.2 13.4±0.1 18.5±0.7Barium, µg/g 414 79±3 81±2 91.2±0.5Beryllium, µg/g na 0.52±0.02 0.52±0.03 0.66±0.03Boron, µg/g na 8.0±0.4 6.7±0.4 16±5Cadmium, µg/g 3.45 3.20±0.03 3.11±0.01 3.44±0.02Calcium, mg/g 26 22.6±0.6 22.0±0.1 23.1±0.1Chromium, µg/g 135 63.8±0.7 66.0±0.6 82±2Cobalt, µg/g 14.0 10.7±0.1 9.7±0.1 12.0±0.4Copper, µg/g 98.6 79±2 77±1 90±5Iron, mg/g 41.1 19.9±0.6 18.7±0.2 29.1±0.9Lead, µg/g 161 164±1 148±6 146±8Lithium, µg/g (50) 15.9±0.2 16.5±0.3 25.8±0.8Magnesium, mg/g 12.0 7.2±0.2 6.90±0.01 8.4±0.1Manganese, µg/g 555 400±6 392±4 490±10Molybdenum, µg/g na 1.25±0.08 0.90±0.07 3.2±0.3Nickel, µg/g 44.1 28.7±0.6 26.4±0.4 34±1Potassium, mg/g 20.0 1.4±0.1 1.48±0.04 1.9±0.2Selenium, µg/g (1.1) 0.8±0.1 0.44±0.08 0.8±0.1Silica, SiO2, mg/g 622 21±2 20.7±0.5 30±1Silver, µg/g na 0.35±0.03 0.31±0.04 0.35±0.02Sodium, mg/g 5.47 0.20±0.01 0.20±0.01 0.30±0.01Strontium, µg/g (130) 39.0±0.4 35.5±0.7 40.0±0.9Thallium, µg/g 1.2 0.57±0.01 0.55±0.01 0.60±0.02Uranium, µg/g 3.13 0.49±0.01 0.50±0.02 0.66±0.05Vanadium, µg/g 95 14.7±0.1 13.8±0.4 21±1Zinc, µg/g 438 340±10 293±4 390±20
Comparison of a Nitric Acid In-Bottle Digestion Procedureto Other Whole-Water Digestion Procedures
8
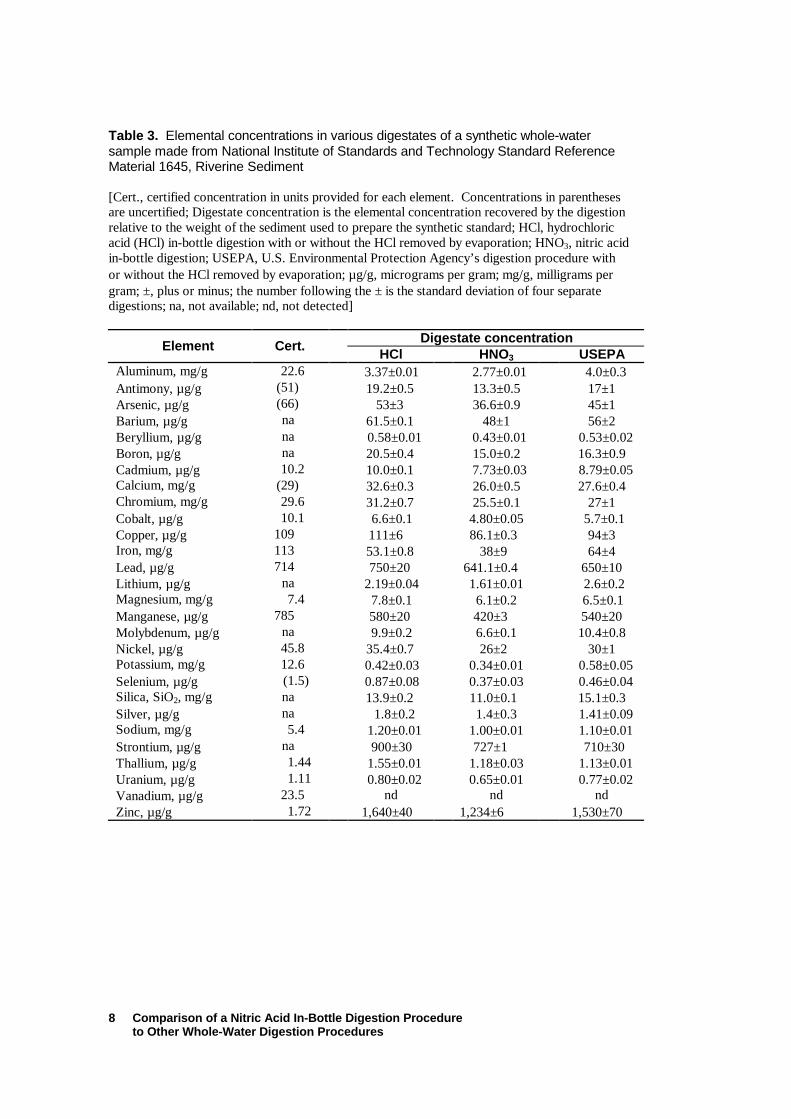
Table 3. Elemental concentrations in various digestates of a synthetic whole-watersample made from National Institute of Standards and Technology Standard ReferenceMaterial 1645, Riverine Sediment
[Cert., certified concentration in units provided for each element. Concentrations in parenthesesare uncertified; Digestate concentration is the elemental concentration recovered by the digestionrelative to the weight of the sediment used to prepare the synthetic standard; HCl, hydrochloricacid (HCl) in-bottle digestion with or without the HCl removed by evaporation; HNO3, nitric acidin-bottle digestion; USEPA, U.S. Environmental Protection Agency’s digestion procedure withor without the HCl removed by evaporation; µg/g, micrograms per gram; mg/g, milligrams pergram; ±, plus or minus; the number following the ± is the standard deviation of four separatedigestions; na, not available; nd, not detected]
Digestate concentrationElement Cert. HCl HNO3 USEPAAluminum, mg/g 22.6 3.37±0.01 2.77±0.01 4.0±0.3Antimony, µg/g (51) 19.2±0.5 13.3±0.5 17±1Arsenic, µg/g (66) 53±3 36.6±0.9 45±1Barium, µg/g na 61.5±0.1 48±1 56±2Beryllium, µg/g na 0.58±0.01 0.43±0.01 0.53±0.02Boron, µg/g na 20.5±0.4 15.0±0.2 16.3±0.9Cadmium, µg/g 10.2 10.0±0.1 7.73±0.03 8.79±0.05Calcium, mg/g (29) 32.6±0.3 26.0±0.5 27.6±0.4Chromium, mg/g 29.6 31.2±0.7 25.5±0.1 27±1Cobalt, µg/g 10.1 6.6±0.1 4.80±0.05 5.7±0.1Copper, µg/g 109 111±6 86.1±0.3 94±3Iron, mg/g 113 53.1±0.8 38±9 64±4Lead, µg/g 714 750±20 641.1±0.4 650±10Lithium, µg/g na 2.19±0.04 1.61±0.01 2.6±0.2Magnesium, mg/g 7.4 7.8±0.1 6.1±0.2 6.5±0.1Manganese, µg/g 785 580±20 420±3 540±20Molybdenum, µg/g na 9.9±0.2 6.6±0.1 10.4±0.8Nickel, µg/g 45.8 35.4±0.7 26±2 30±1Potassium, mg/g 12.6 0.42±0.03 0.34±0.01 0.58±0.05Selenium, µg/g (1.5) 0.87±0.08 0.37±0.03 0.46±0.04Silica, SiO2, mg/g na 13.9±0.2 11.0±0.1 15.1±0.3Silver, µg/g na 1.8±0.2 1.4±0.3 1.41±0.09Sodium, mg/g 5.4 1.20±0.01 1.00±0.01 1.10±0.01Strontium, µg/g na 900±30 727±1 710±30Thallium, µg/g 1.44 1.55±0.01 1.18±0.03 1.13±0.01Uranium, µg/g 1.11 0.80±0.02 0.65±0.01 0.77±0.02Vanadium, µg/g 23.5 nd nd ndZinc, µg/g 1.72 1,640±40 1,234±6 1,530±70
DISCUSSION OF RESULTS 9
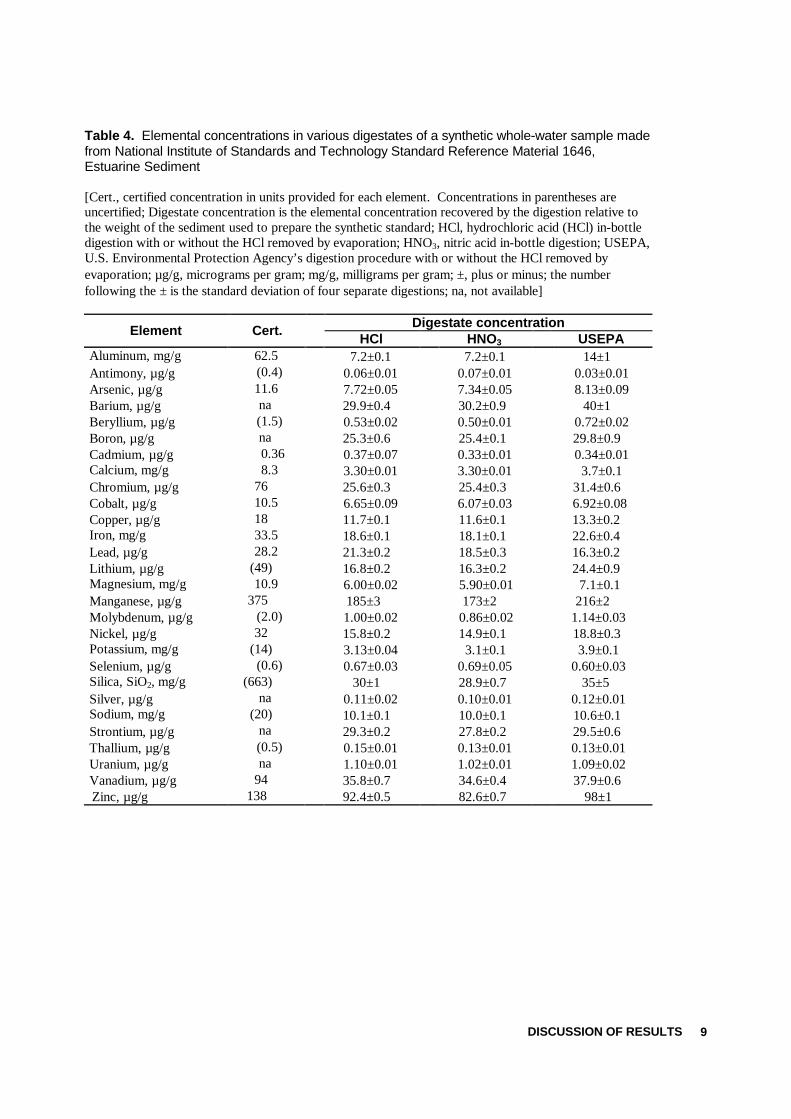
Table 4. Elemental concentrations in various digestates of a synthetic whole-water sample madefrom National Institute of Standards and Technology Standard Reference Material 1646,Estuarine Sediment
[Cert., certified concentration in units provided for each element. Concentrations in parentheses areuncertified; Digestate concentration is the elemental concentration recovered by the digestion relative tothe weight of the sediment used to prepare the synthetic standard; HCl, hydrochloric acid (HCl) in-bottledigestion with or without the HCl removed by evaporation; HNO3, nitric acid in-bottle digestion; USEPA,U.S. Environmental Protection Agency’s digestion procedure with or without the HCl removed byevaporation; µg/g, micrograms per gram; mg/g, milligrams per gram; ±, plus or minus; the numberfollowing the ± is the standard deviation of four separate digestions; na, not available]
Digestate concentrationElement Cert. HCl HNO3 USEPAAluminum, mg/g 62.5 7.2±0.1 7.2±0.1 14±1Antimony, µg/g (0.4) 0.06±0.01 0.07±0.01 0.03±0.01Arsenic, µg/g 11.6 7.72±0.05 7.34±0.05 8.13±0.09Barium, µg/g na 29.9±0.4 30.2±0.9 40±1Beryllium, µg/g (1.5) 0.53±0.02 0.50±0.01 0.72±0.02Boron, µg/g na 25.3±0.6 25.4±0.1 29.8±0.9Cadmium, µg/g 0.36 0.37±0.07 0.33±0.01 0.34±0.01Calcium, mg/g 8.3 3.30±0.01 3.30±0.01 3.7±0.1Chromium, µg/g 76 25.6±0.3 25.4±0.3 31.4±0.6Cobalt, µg/g 10.5 6.65±0.09 6.07±0.03 6.92±0.08Copper, µg/g 18 11.7±0.1 11.6±0.1 13.3±0.2Iron, mg/g 33.5 18.6±0.1 18.1±0.1 22.6±0.4Lead, µg/g 28.2 21.3±0.2 18.5±0.3 16.3±0.2Lithium, µg/g (49) 16.8±0.2 16.3±0.2 24.4±0.9Magnesium, mg/g 10.9 6.00±0.02 5.90±0.01 7.1±0.1Manganese, µg/g 375 185±3 173±2 216±2Molybdenum, µg/g (2.0) 1.00±0.02 0.86±0.02 1.14±0.03Nickel, µg/g 32 15.8±0.2 14.9±0.1 18.8±0.3Potassium, mg/g (14) 3.13±0.04 3.1±0.1 3.9±0.1Selenium, µg/g (0.6) 0.67±0.03 0.69±0.05 0.60±0.03Silica, SiO2, mg/g (663) 30±1 28.9±0.7 35±5Silver, µg/g na 0.11±0.02 0.10±0.01 0.12±0.01Sodium, mg/g (20) 10.1±0.1 10.0±0.1 10.6±0.1Strontium, µg/g na 29.3±0.2 27.8±0.2 29.5±0.6Thallium, µg/g (0.5) 0.15±0.01 0.13±0.01 0.13±0.01Uranium, µg/g na 1.10±0.01 1.02±0.01 1.09±0.02Vanadium, µg/g 94 35.8±0.7 34.6±0.4 37.9±0.6Zinc, µg/g 138 92.4±0.5 82.6±0.7 98±1
Comparison of a Nitric Acid In-Bottle Digestion Procedureto Other Whole-Water Digestion Procedures
10
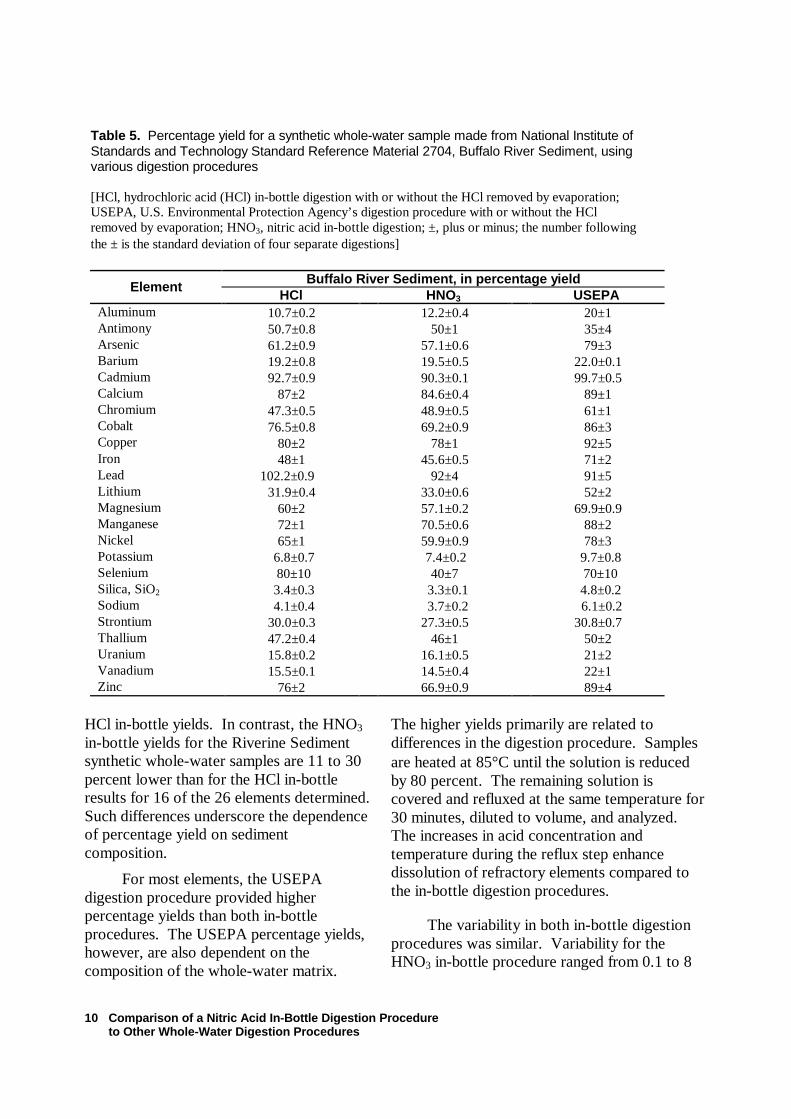
Table 5. Percentage yield for a synthetic whole-water sample made from National Institute ofStandards and Technology Standard Reference Material 2704, Buffalo River Sediment, usingvarious digestion procedures
[HCl, hydrochloric acid (HCl) in-bottle digestion with or without the HCl removed by evaporation;USEPA, U.S. Environmental Protection Agency’s digestion procedure with or without the HClremoved by evaporation; HNO3, nitric acid in-bottle digestion; ±, plus or minus; the number followingthe ± is the standard deviation of four separate digestions]
Buffalo River Sediment, in percentage yieldElement HCl HNO3 USEPAAluminum 10.7±0.2 12.2±0.4 20±1Antimony 50.7±0.8 50±1 35±4Arsenic 61.2±0.9 57.1±0.6 79±3Barium 19.2±0.8 19.5±0.5 22.0±0.1Cadmium 92.7±0.9 90.3±0.1 99.7±0.5Calcium 87±2 84.6±0.4 89±1Chromium 47.3±0.5 48.9±0.5 61±1Cobalt 76.5±0.8 69.2±0.9 86±3Copper 80±2 78±1 92±5Iron 48±1 45.6±0.5 71±2Lead 102.2±0.9 92±4 91±5Lithium 31.9±0.4 33.0±0.6 52±2Magnesium 60±2 57.1±0.2 69.9±0.9Manganese 72±1 70.5±0.6 88±2Nickel 65±1 59.9±0.9 78±3Potassium 6.8±0.7 7.4±0.2 9.7±0.8Selenium 80±10 40±7 70±10Silica, SiO2 3.4±0.3 3.3±0.1 4.8±0.2Sodium 4.1±0.4 3.7±0.2 6.1±0.2Strontium 30.0±0.3 27.3±0.5 30.8±0.7Thallium 47.2±0.4 46±1 50±2Uranium 15.8±0.2 16.1±0.5 21±2Vanadium 15.5±0.1 14.5±0.4 22±1Zinc 76±2 66.9±0.9 89±4
HCl in-bottle yields. In contrast, the HNO3
in-bottle yields for the Riverine Sedimentsynthetic whole-water samples are 11 to 30percent lower than for the HCl in-bottleresults for 16 of the 26 elements determined.Such differences underscore the dependenceof percentage yield on sedimentcomposition.
For most elements, the USEPAdigestion procedure provided higherpercentage yields than both in-bottleprocedures. The USEPA percentage yields,however, are also dependent on thecomposition of the whole-water matrix.
The higher yields primarily are related todifferences in the digestion procedure. Samplesare heated at 85°C until the solution is reducedby 80 percent. The remaining solution iscovered and refluxed at the same temperature for30 minutes, diluted to volume, and analyzed.The increases in acid concentration andtemperature during the reflux step enhancedissolution of refractory elements compared tothe in-bottle digestion procedures.
The variability in both in-bottle digestionprocedures was similar. Variability for theHNO3 in-bottle procedure ranged from 0.1 to 8
DISCUSSION OF RESULTS 11
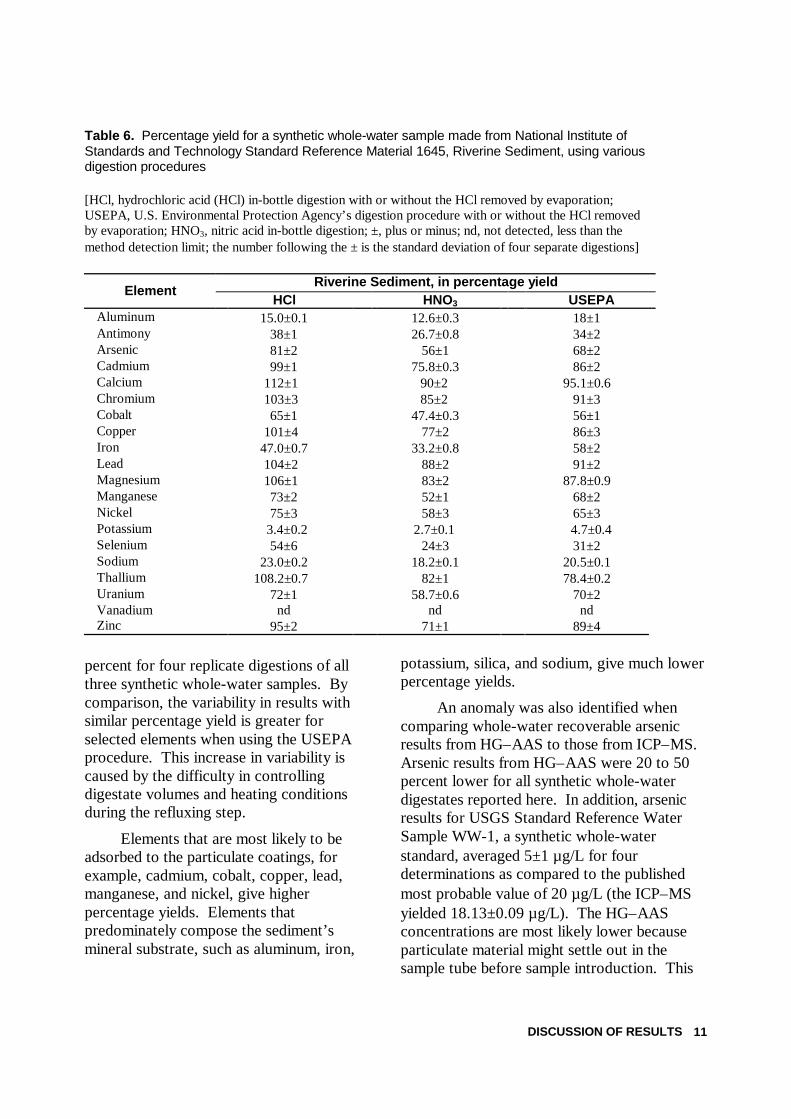
Table 6. Percentage yield for a synthetic whole-water sample made from National Institute ofStandards and Technology Standard Reference Material 1645, Riverine Sediment, using variousdigestion procedures
[HCl, hydrochloric acid (HCl) in-bottle digestion with or without the HCl removed by evaporation;USEPA, U.S. Environmental Protection Agency’s digestion procedure with or without the HCl removedby evaporation; HNO3, nitric acid in-bottle digestion; ±, plus or minus; nd, not detected, less than themethod detection limit; the number following the ± is the standard deviation of four separate digestions]
Riverine Sediment, in percentage yieldElement
HCl HNO3 USEPAAluminum 15.0±0.1 12.6±0.3 18±1Antimony 38±1 26.7±0.8 34±2Arsenic 81±2 56±1 68±2Cadmium 99±1 75.8±0.3 86±2Calcium 112±1 90±2 95.1±0.6Chromium 103±3 85±2 91±3Cobalt 65±1 47.4±0.3 56±1Copper 101±4 77±2 86±3Iron 47.0±0.7 33.2±0.8 58±2Lead 104±2 88±2 91±2Magnesium 106±1 83±2 87.8±0.9Manganese 73±2 52±1 68±2Nickel 75±3 58±3 65±3Potassium 3.4±0.2 2.7±0.1 4.7±0.4Selenium 54±6 24±3 31±2Sodium 23.0±0.2 18.2±0.1 20.5±0.1Thallium 108.2±0.7 82±1 78.4±0.2Uranium 72±1 58.7±0.6 70±2Vanadium nd nd ndZinc 95±2 71±1 89±4
percent for four replicate digestions of allthree synthetic whole-water samples. Bycomparison, the variability in results withsimilar percentage yield is greater forselected elements when using the USEPAprocedure. This increase in variability iscaused by the difficulty in controllingdigestate volumes and heating conditionsduring the refluxing step.
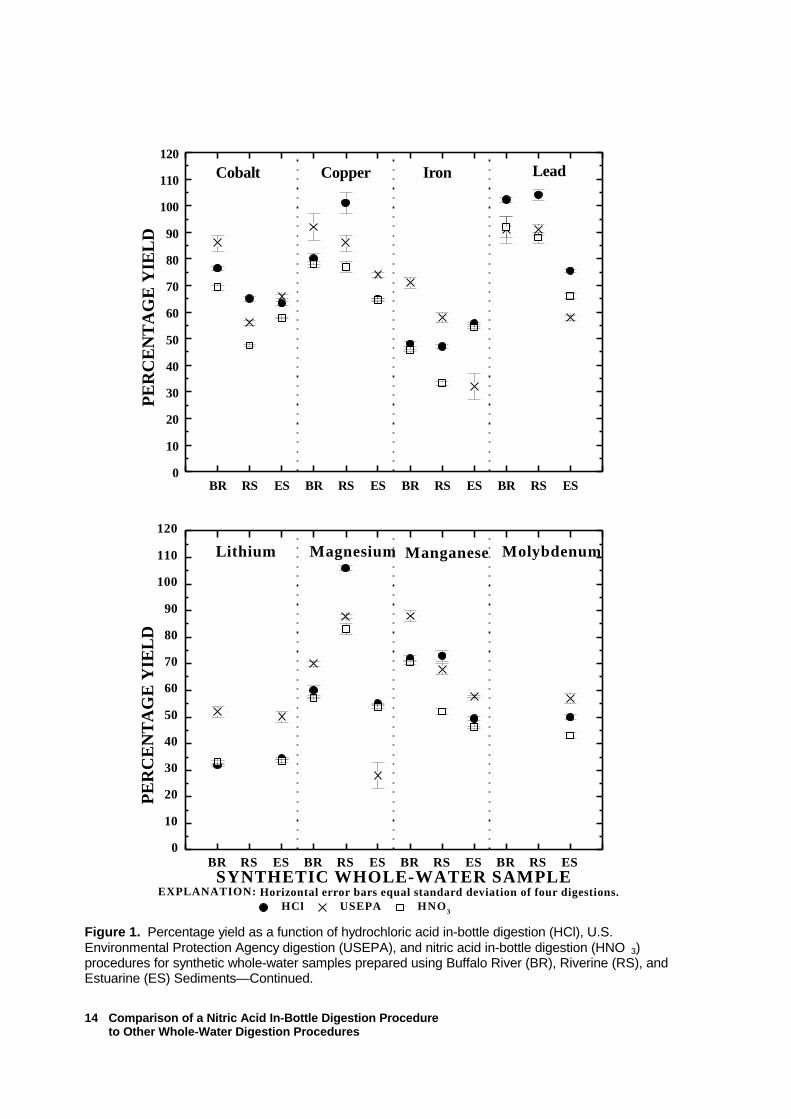
Elements that are most likely to beadsorbed to the particulate coatings, forexample, cadmium, cobalt, copper, lead,manganese, and nickel, give higherpercentage yields. Elements thatpredominately compose the sediment’smineral substrate, such as aluminum, iron,
potassium, silica, and sodium, give much lowerpercentage yields.
An anomaly was also identified whencomparing whole-water recoverable arsenicresults from HG–AAS to those from ICP–MS.Arsenic results from HG–AAS were 20 to 50percent lower for all synthetic whole-waterdigestates reported here. In addition, arsenicresults for USGS Standard Reference WaterSample WW-1, a synthetic whole-waterstandard, averaged 5±1 µg/L for fourdeterminations as compared to the publishedmost probable value of 20 µg/L (the ICP–MSyielded 18.13±0.09 µg/L). The HG–AASconcentrations are most likely lower becauseparticulate material might settle out in thesample tube before sample introduction. This
Comparison of a Nitric Acid In-Bottle Digestion Procedureto Other Whole-Water Digestion Procedures
12
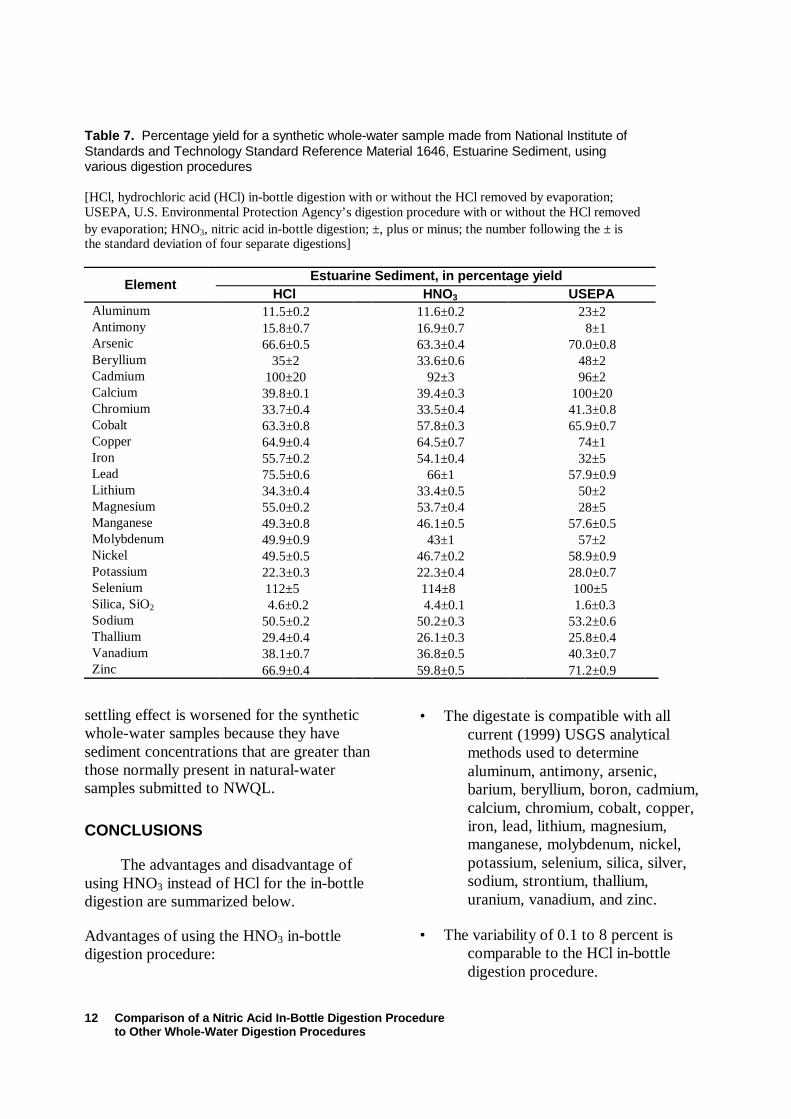
Table 7. Percentage yield for a synthetic whole-water sample made from National Institute ofStandards and Technology Standard Reference Material 1646, Estuarine Sediment, usingvarious digestion procedures
[HCl, hydrochloric acid (HCl) in-bottle digestion with or without the HCl removed by evaporation;USEPA, U.S. Environmental Protection Agency’s digestion procedure with or without the HCl removedby evaporation; HNO3, nitric acid in-bottle digestion; ±, plus or minus; the number following the ± isthe standard deviation of four separate digestions]
Estuarine Sediment, in percentage yieldElement
HCl HNO3 USEPAAluminum 11.5±0.2 11.6±0.2 23±2Antimony 15.8±0.7 16.9±0.7 8±1Arsenic 66.6±0.5 63.3±0.4 70.0±0.8Beryllium 35±2 33.6±0.6 48±2Cadmium 100±20 92±3 96±2Calcium 39.8±0.1 39.4±0.3 100±20Chromium 33.7±0.4 33.5±0.4 41.3±0.8Cobalt 63.3±0.8 57.8±0.3 65.9±0.7Copper 64.9±0.4 64.5±0.7 74±1Iron 55.7±0.2 54.1±0.4 32±5Lead 75.5±0.6 66±1 57.9±0.9Lithium 34.3±0.4 33.4±0.5 50±2Magnesium 55.0±0.2 53.7±0.4 28±5Manganese 49.3±0.8 46.1±0.5 57.6±0.5Molybdenum 49.9±0.9 43±1 57±2Nickel 49.5±0.5 46.7±0.2 58.9±0.9Potassium 22.3±0.3 22.3±0.4 28.0±0.7Selenium 112±5 114±8 100±5Silica, SiO2 4.6±0.2 4.4±0.1 1.6±0.3Sodium 50.5±0.2 50.2±0.3 53.2±0.6Thallium 29.4±0.4 26.1±0.3 25.8±0.4Vanadium 38.1±0.7 36.8±0.5 40.3±0.7Zinc 66.9±0.4 59.8±0.5 71.2±0.9
settling effect is worsened for the syntheticwhole-water samples because they havesediment concentrations that are greater thanthose normally present in natural-watersamples submitted to NWQL.
CONCLUSIONS
The advantages and disadvantage ofusing HNO3 instead of HCl for the in-bottledigestion are summarized below.
Advantages of using the HNO3 in-bottledigestion procedure:
• The digestate is compatible with allcurrent (1999) USGS analyticalmethods used to determinealuminum, antimony, arsenic,barium, beryllium, boron, cadmium,calcium, chromium, cobalt, copper,iron, lead, lithium, magnesium,manganese, molybdenum, nickel,potassium, selenium, silica, silver,sodium, strontium, thallium,uranium, vanadium, and zinc.
• The variability of 0.1 to 8 percent iscomparable to the HCl in-bottledigestion procedure.
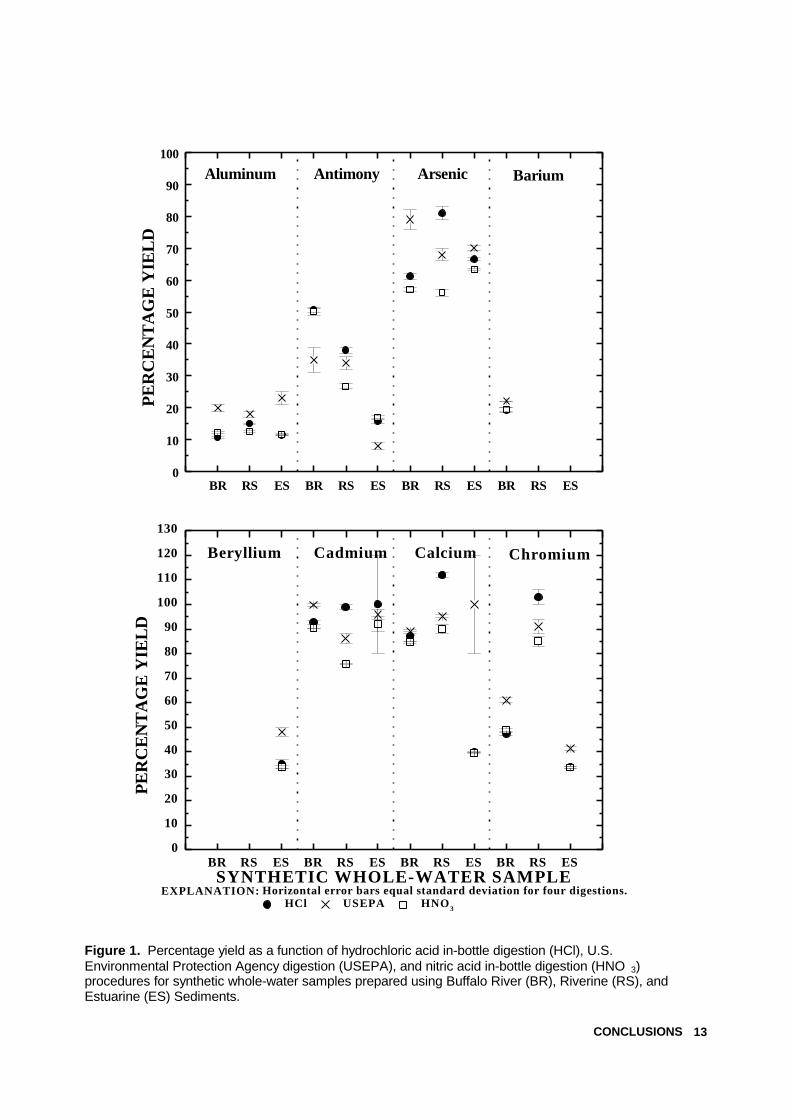
CONCLUSIONS 13
Figure 1. Percentage yield as a function of hydrochloric acid in-bottle digestion (HCl), U.S.Environmental Protection Agency digestion (USEPA), and nitric acid in-bottle digestion (HNO 3)procedures for synthetic whole-water samples prepared using Buffalo River (BR), Riverine (RS), andEstuarine (ES) Sediments.
BR RS ES BR RS ES BR RS ES BR RS ES0
10
20
30
40
50
60
70
80
90
100
BariumArsenicAntimonyAluminum
PER
CE
NT
AG
E Y
IEL
D
BR RS ES BR RS ES BR RS ES BR RS ES0
10
20
30
40
50
60
70
80
90
100
110
120
130
Horizontal error bars equal standard deviation for four digestions.EXPLANATION:
ChromiumCalciumCadmiumBeryllium
HCl USEPA HNO3
PER
CE
NT
AG
E Y
IEL
D
SYNTHETIC WHOLE-WATER SAMPLE
Comparison of a Nitric Acid In-Bottle Digestion Procedureto Other Whole-Water Digestion Procedures
14
Figure 1. Percentage yield as a function of hydrochloric acid in-bottle digestion (HCl), U.S.Environmental Protection Agency digestion (USEPA), and nitric acid in-bottle digestion (HNO 3)procedures for synthetic whole-water samples prepared using Buffalo River (BR), Riverine (RS), andEstuarine (ES) Sediments— Continued.
BR RS ES BR RS ES BR RS ES BR RS ES0
10
20
30
40
50
60
70
80
90
100
110
120LeadIronCopperCobalt
PER
CE
NT
AG
E Y
IEL
D
BR RS ES BR RS ES BR RS ES BR RS ES0
10
20
30
40
50
60
70
80
90
100
110
120
Horizontal error bars equal standard deviation of four digestions.EXPLANATION:
MolybdenumManganeseMagnesiumLithium
HCl USEPA HNO3
PER
CE
NT
AG
E Y
IEL
D
SYNTHETIC WHOLE-WATER SAMPLE
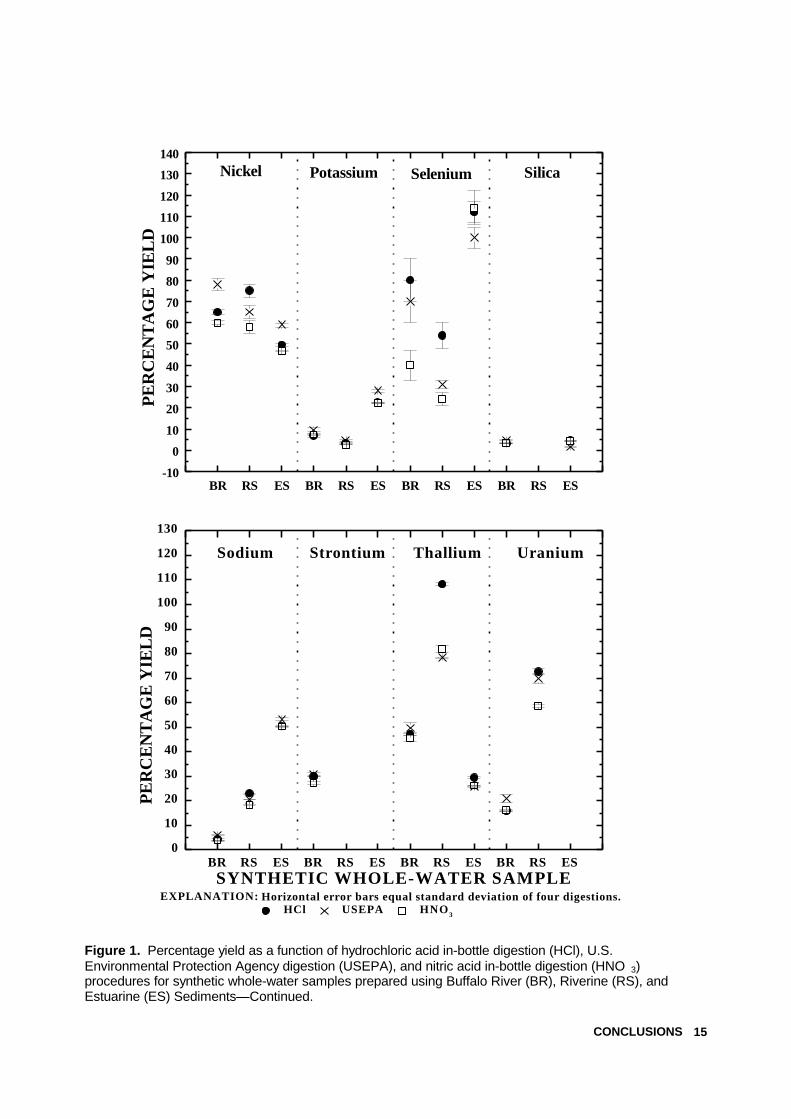
CONCLUSIONS 15
Figure 1. Percentage yield as a function of hydrochloric acid in-bottle digestion (HCl), U.S.Environmental Protection Agency digestion (USEPA), and nitric acid in-bottle digestion (HNO 3)procedures for synthetic whole-water samples prepared using Buffalo River (BR), Riverine (RS), andEstuarine (ES) Sediments— Continued.
BR RS ES BR RS ES BR RS ES BR RS ES-10
0
10
20
30
40
50
60
70
80
90
100
110
120
130
140SilicaSeleniumPotassiumNickel
PER
CE
NT
AG
E Y
IEL
D
BR RS ES BR RS ES BR RS ES BR RS ES0
10
20
30
40
50
60
70
80
90
100
110
120
130
Horizontal error bars equal standard deviation of four digestions.EXPLANATION:
Sodium UraniumThalliumStrontium
HCl USEPA HNO3
PER
CE
NT
AG
E Y
IEL
D
SYNTHETIC WHOLE-WATER SAMPLE
Comparison of a Nitric Acid In-Bottle Digestion Procedureto Other Whole-Water Digestion Procedures
16
Figure 1. Percentage yield as a function of hydrochloric acid in-bottle digestion (HCl), U.S.Environmental Protection Agency digestion (USEPA), and nitric acid in-bottle digestion (HNO 3)procedures for synthetic whole-water samples prepared using Buffalo River (BR), Riverine (RS), andEstuarine (ES) Sediments— Continued.
• The procedure uses less chemicalreagents and, therefore, produces lesschemical waste for some analyticalmethods.
• Interferences from chloride are reduced.
Disadvantage of using the HNO3 in-bottledigestion procedure:
• Results from the synthetic whole-watersamples indicate that the HNO3 in-bottle procedure might givenegatively biased recoverable
concentrations relative to the HCl in-bottle procedure. Recoverableconcentrations are dependent on thecomposition of the particulate matter inthe whole-water sample regardless of thedigestion procedure used.
The three acid-digestion procedures testeddo not completely solubilize all elements thatwere determined. If a total (100 percent)digestion is required for any element in awhole-water sample, then it can be argued thatnone of these methods will be satisfactory.However, if a recoverable elementalconcentration (less than 100 percent) is
BR RS ES BR RS ES BR RS ES BR RS ES0
10
20
30
40
50
60
70
80
90
100
110
Horizontal error bars equal standard deviation of four digestions.EXPLANATION:
ZincVanadium
HCl USEPA HNO3
PER
CE
NT
AG
E Y
IEL
D
SYNTHETIC WHOLE-WATER SAMPLE
REFERENCES CITED 17
Table 8. Statistical analysis summary of elemental percentage yield for the nitric acid in-bottledigestion in relation to the hydrochloric acid in-bottle digestion
[BR, National Institute of Standards and Technology Standard Reference Material 2704, Buffalo River Sediment; RS,National Institute of Standards and Technology Standard Reference Material 1645, Riverine Sediment; ES, NationalInstitute of Standards and Technology Standard Reference Material 1646, Estuarine Sediment; p-value, level ofsignificance; R2, coefficient of determination; n, number of data points; <, less than]
Regression analysisSlope y-intercept
Coefficient p-value a Coefficient p-value b R2 nBR 0.88 <0.0001 2.4 0.4372 0.9296 24RS 0.81 <0.0001 -3.9 0.2011 0.9667 19ES 0.95 <0.0001 0.1 0.9345 0.9875 23
Statistical testsTest Statistic p-value c n
BR One-Sample Sign Test 1.75 0.0227 24RS Student t-Test 9.32 <0.0001 19ES One-Sample Sign Test 1.30 0.0009 23
a The null hypothesis tested: slope is not equal to one.b The null hypothesis tested: y-intercept is equal to zero.c The null hypothesis tested: the medians (or means for the Student t-Test) of the percentage yields for the nitric
acid in-bottle digestion are not significantly different from the percentage yields for the hydrochloric acid in-bottledigestion.
acceptable for a whole-water sample, thenthe reproducibility of the digestionprocedure should be the primary concern.Both the HCl and HNO3 in-bottle digestionprocedures give excellent reproducibility forall elements determined. Therefore, thesimplicity of the digestion procedure shouldbe the primary reason for the methodselected. Newer methods that analyze thedigestate from the HCl in-bottle digestionprocedure may require additional steps (forexample, removal of HCl and thereconstitution of the residue) to eliminateinterferences. Such steps increase theanalysis time and chances for contamination.The HNO3 in-bottle digestion is thepreferred method for routine use at theNWQL. Nevertheless, the original HCl in-bottle digestion procedure can be used ifcustomers require this acid-digestionprocedure.
REFERENCES CITED
American Society for Testing and Materials,1995, Annual book of ASTMstandards, Section 11, Water (D1193,Standard specification for reagentwater): Philadelphia, v. 11.01,p. 122–124.
Fishman, M.J., ed., 1993, Methods ofanalysis by the U.S. Geological SurveyNational Water Quality Laboratory—Determination of inorganic andorganic constituents in water andfluvial sediments: U.S. GeologicalSurvey Open-File Report 93-125,217 p.
Fishman, M.J., and Friedman, L.C., eds.,1989, Methods for determination ofinorganic substances in water andfluvial sediments: U.S. GeologicalSurvey Techniques of Water-Resources Investigations, book 5,chap. A1, 545 p.
Comparison of a Nitric Acid In-Bottle Digestion Procedureto Other Whole-Water Digestion Procedures
18
Figure 2. — Linear regression analysis of elemental percentage yield for the nitric acid in-bottle digestionin relation to the hydrochloric acid in-bottle digestion for a synthetic whole-water sample made fromBuffalo River Sediment.
Garbarino, J.R., and Struzeski, T.M., 1998,Methods of analysis by the U.S.Geological Survey National Water QualityLaboratory— Determination of elements inwhole-water digests using inductivelycoupled plasma–optical emissionspectrometry and inductively coupledplasma–mass spectrometry: U.S.Geological Survey Open-FileReport 98-165, 101 p.
Hoffman, G.L., Fishman, M.J., andGarbarino, J.R., 1996, Methods ofanalysis by the U.S. Geological SurveyNational Water Quality Laboratory—In-bottle acid-digestion of whole-watersamples: U.S. Geological SurveyOpen-File Report 96-225, 28 p.
Jones, S.R., and Garbarino, J.R., 1999,Methods of analysis by the U.S.Geological Survey National WaterQuality Laboratory— Determination of
arsenic and selenium in water andsediment by graphite furnace–atomicabsorption spectrometry: U.S.Geological Survey Open-File Report98-639, 39 p.
U.S. Environmental Protection Agency,1994, Methods for the determinationof metals in environmental samples:EPA 200 Series, Supplement I, EPA-600/R-94/111, Revision 2.8, May1994.
APPENDIX
The presence of chloride in the HClin-bottle and the USEPA digestatesinterferes with the determination of ambientconcentrations of arsenic and vanadium byICP–MS and selenium by GF–AAS.Therefore, prior to comparing the results ofthe HCl and HNO3 in-bottle digestion
0 20 40 60 80 100 120 1400
20
40
60
80
100
120
140
BUFFALO RIVER SEDIMENT Linear fit
Upper 95% Confidence Limit
Lower 95% Confidence Limit
PE
RC
EN
TA
GE
YIE
LD
FO
R N
ITR
IC
AC
ID I
N-B
OT
TL
E D
IGE
STIO
N
PERCENTAGE YIELD FOR HYDROCHLORIC
ACID IN-BOTTLE DIGESTION
APPENDIX 19
Figure 3. — Linear regression analysis of elemental percentage yield for the nitric acid in-bottle digestionin relation to the hydrochloric acid in-bottle digestion for a synthetic whole-water sample made fromRiverine Sediment.
Figure 4. Linear regression analysis of elemental percentage yield for the nitric acid in-bottle digestion inrelation to the hydrochloric acid in-bottle digestion for a synthetic whole-water sample made fromEstuarine Sediment.
0 20 40 60 80 100 120 1400
20
40
60
80
100
120
140
RIVERINE SEDIMENT Linear fit
Upper 95% Confidence Limit
Lower 95% Confidence Limit
PE
RC
EN
TA
GE
YIE
LD
FO
R N
ITR
IC
AC
ID I
N-B
OT
TL
E D
IGE
STIO
N
PERCENTAGE YIELD FOR HYDROCHLORIC
ACID IN-BOTTLE DIGESTION
0 20 40 60 80 100 120 1400
20
40
60
80
100
120
140
ESTUARINE SEDIMENT Linear fit
Upper 95% Confidence Limit
Lower 95% Confidence Limit
PER
CE
NT
AG
E Y
IEL
D F
OR
NIT
RIC
AC
ID I
N-B
OT
TL
E D
IGE
STIO
N
PERCENTAGE YIELD FOR HYDROCHLORIC
ACID IN-BOTTLE DIGESTION
Comparison of a Nitric Acid In-Bottle Digestion Procedureto other Whole-Water Digestion Procedures
20
procedures, it was necessary to removechloride from the HCl in-bottle digestates.The method used is outlined here.
Subboiling Evaporation Procedure
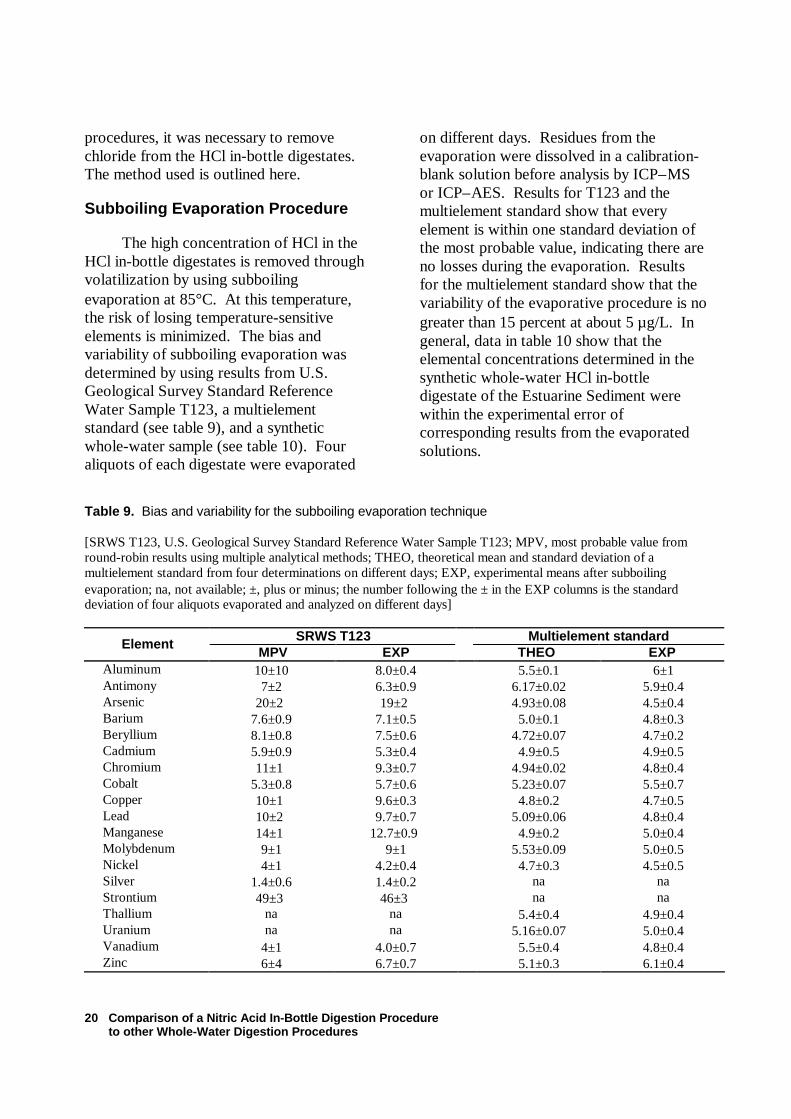
The high concentration of HCl in theHCl in-bottle digestates is removed throughvolatilization by using subboilingevaporation at 85°C. At this temperature,the risk of losing temperature-sensitiveelements is minimized. The bias andvariability of subboiling evaporation wasdetermined by using results from U.S.Geological Survey Standard ReferenceWater Sample T123, a multielementstandard (see table 9), and a syntheticwhole-water sample (see table 10). Fouraliquots of each digestate were evaporated
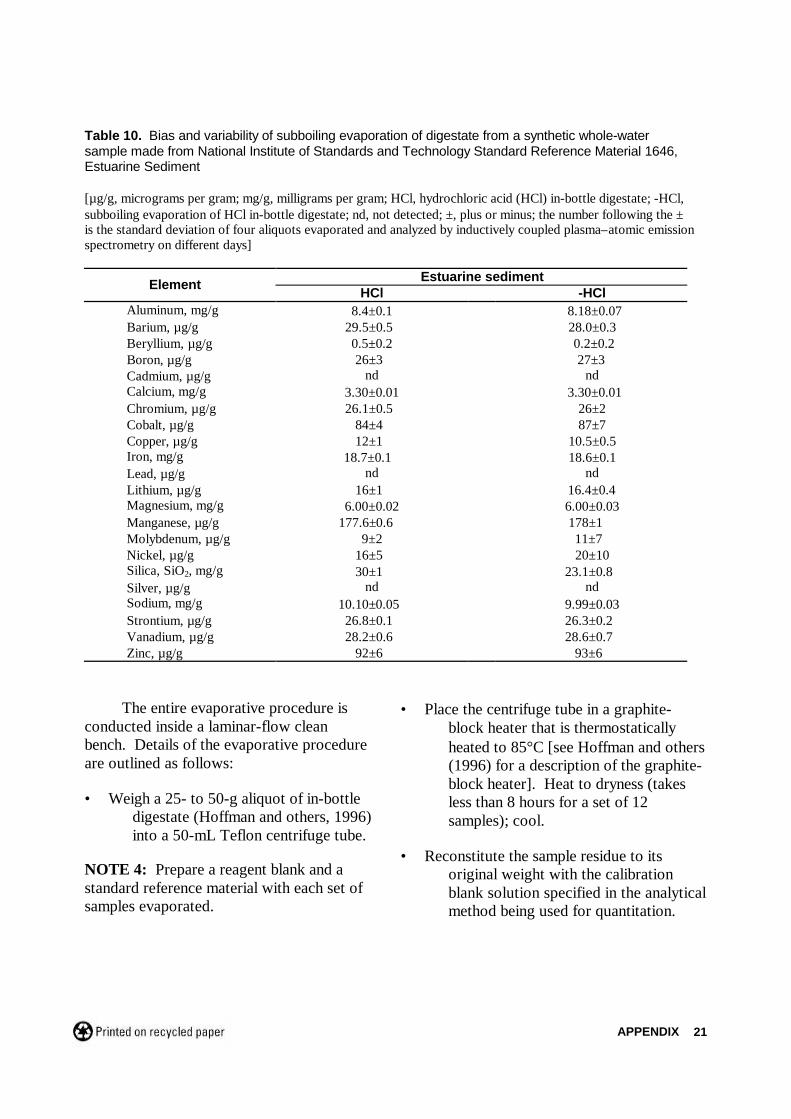
on different days. Residues from theevaporation were dissolved in a calibration-blank solution before analysis by ICP–MSor ICP–AES. Results for T123 and themultielement standard show that everyelement is within one standard deviation ofthe most probable value, indicating there areno losses during the evaporation. Resultsfor the multielement standard show that thevariability of the evaporative procedure is nogreater than 15 percent at about 5 µg/L. Ingeneral, data in table 10 show that theelemental concentrations determined in thesynthetic whole-water HCl in-bottledigestate of the Estuarine Sediment werewithin the experimental error ofcorresponding results from the evaporatedsolutions.
Table 9. Bias and variability for the subboiling evaporation technique
[SRWS T123, U.S. Geological Survey Standard Reference Water Sample T123; MPV, most probable value fromround-robin results using multiple analytical methods; THEO, theoretical mean and standard deviation of amultielement standard from four determinations on different days; EXP, experimental means after subboilingevaporation; na, not available; ±, plus or minus; the number following the ± in the EXP columns is the standarddeviation of four aliquots evaporated and analyzed on different days]
SRWS T123 Multielement standardElement MPV EXP THEO EXPAluminum 10±10 8.0±0.4 5.5±0.1 6±1Antimony 7±2 6.3±0.9 6.17±0.02 5.9±0.4Arsenic 20±2 19±2 4.93±0.08 4.5±0.4Barium 7.6±0.9 7.1±0.5 5.0±0.1 4.8±0.3Beryllium 8.1±0.8 7.5±0.6 4.72±0.07 4.7±0.2Cadmium 5.9±0.9 5.3±0.4 4.9±0.5 4.9±0.5Chromium 11±1 9.3±0.7 4.94±0.02 4.8±0.4Cobalt 5.3±0.8 5.7±0.6 5.23±0.07 5.5±0.7Copper 10±1 9.6±0.3 4.8±0.2 4.7±0.5Lead 10±2 9.7±0.7 5.09±0.06 4.8±0.4Manganese 14±1 12.7±0.9 4.9±0.2 5.0±0.4Molybdenum 9±1 9±1 5.53±0.09 5.0±0.5Nickel 4±1 4.2±0.4 4.7±0.3 4.5±0.5Silver 1.4±0.6 1.4±0.2 na naStrontium 49±3 46±3 na naThallium na na 5.4±0.4 4.9±0.4Uranium na na 5.16±0.07 5.0±0.4Vanadium 4±1 4.0±0.7 5.5±0.4 4.8±0.4Zinc 6±4 6.7±0.7 5.1±0.3 6.1±0.4
APPENDIX 21
Table 10. Bias and variability of subboiling evaporation of digestate from a synthetic whole-watersample made from National Institute of Standards and Technology Standard Reference Material 1646,Estuarine Sediment
[µg/g, micrograms per gram; mg/g, milligrams per gram; HCl, hydrochloric acid (HCl) in-bottle digestate; -HCl,subboiling evaporation of HCl in-bottle digestate; nd, not detected; ±, plus or minus; the number following the ±is the standard deviation of four aliquots evaporated and analyzed by inductively coupled plasma–atomic emissionspectrometry on different days]
Estuarine sedimentElement HCl -HClAluminum, mg/g 8.4±0.1 8.18±0.07Barium, µg/g 29.5±0.5 28.0±0.3Beryllium, µg/g 0.5±0.2 0.2±0.2Boron, µg/g 26±3 27±3Cadmium, µg/g nd ndCalcium, mg/g 3.30±0.01 3.30±0.01Chromium, µg/g 26.1±0.5 26±2Cobalt, µg/g 84±4 87±7Copper, µg/g 12±1 10.5±0.5Iron, mg/g 18.7±0.1 18.6±0.1Lead, µg/g nd ndLithium, µg/g 16±1 16.4±0.4Magnesium, mg/g 6.00±0.02 6.00±0.03Manganese, µg/g 177.6±0.6 178±1Molybdenum, µg/g 9±2 11±7Nickel, µg/g 16±5 20±10Silica, SiO2, mg/g 30±1 23.1±0.8Silver, µg/g nd ndSodium, mg/g 10.10±0.05 9.99±0.03Strontium, µg/g 26.8±0.1 26.3±0.2Vanadium, µg/g 28.2±0.6 28.6±0.7Zinc, µg/g 92±6 93±6
The entire evaporative procedure isconducted inside a laminar-flow cleanbench. Details of the evaporative procedureare outlined as follows:
• Weigh a 25- to 50-g aliquot of in-bottledigestate (Hoffman and others, 1996)into a 50-mL Teflon centrifuge tube.
NOTE 4: Prepare a reagent blank and astandard reference material with each set ofsamples evaporated.
• Place the centrifuge tube in a graphite-block heater that is thermostaticallyheated to 85°C [see Hoffman and others(1996) for a description of the graphite-block heater]. Heat to dryness (takesless than 8 hours for a set of 12samples); cool.
• Reconstitute the sample residue to itsoriginal weight with the calibrationblank solution specified in the analyticalmethod being used for quantitation.