Embed Size (px)
Citation preview
Methods for Enhancing Knowledge Sharing among Departments
at the University of Tennessee
Capstone Design Project for the
Master of Science Degree
The University of Tennessee, Knoxville
Levi D. Smith
April 2008

ii
Abstract
Methods for promoting collaboration and knowledge sharing between
academic departments at universities need to be established. This study uses the
industrial engineering department at the University of Tennessee as a case study.
This study analyzes the use of Communities of Practice to strengthen
collaboration and knowledge sharing. Additionally, this study explores the use of
the latest technologies, such as portals, to aid in collaboration across departments.
The portal developed promotes knowledge sharing by supplying news feeds in
expertise areas, tools to solve simple problems, and a wiki to be a common area
for the transfer and storage of knowledge. One of the tools is an expert locator,
which is an information system that allows users the ability to find experts in
specific knowledge areas. A survey was performed to identify the expertise areas
and collaborating departments for the case study.
iii
TABLE OF CONTENTS
Introduction 1
Description of Problem 1
Planned Goals and Objectives 4
Literature Search 4
Methodology 9
Results 28
Conclusions 29
References 30
Appendices 31
Resumé 41

iv
LIST OF TABLES
Table 1. Development Language Alternatives 23
Table 2. Database Alternatives 24
Table 3. Wiki Alternatives 25
Table 4. Portal Alternatives 25
Table 5. Expertise Area Totals 28
Table 6. Collaborating Department Totals 29
Table 7. Development Language Factor Comparisons 32
Table 8. Normalized Development Language Factor Comparisons 32
Table 9. Development Language Raw Scores 33
Table 10. Development Language Weights Applied 33
Table 11. Database Factor Comparisons 34
Table 12. Normalized Database Factor Comparisons 34
Table 13. Database Raw Scores 34
Table 14. Database Weights Applied 34
Table 15. Wiki Factor Comparisons 35
Table 16. Normalized Wiki Factor Comparisons 35
Table 17. Wiki Raw Scores 35
Table 18. Wiki Weights Applied 35
Table 19. Portal Software Factor Comparisons 36
Table 20. Normalized Portal Software Factor Comparisons 36
Table 21. Portal Software Raw Scores 36
Table 22. Portal Software Weights Applied 36
Table 23. Faculty Expertise Areas 37
Table 24. Faculty Locations 38
Table 25. Collaborating Departments 38
Table 26. Project Schedule 39

v
LIST OF FIGURES
Figure 1. Ishikawa Diagram 2
Figure 2. Collaborating Departments 10
Figure 3. Portal Architecture 11
Figure 4. Portal Display 12
Figure 5. Expert Locator Displays 15
Figure 6. Cash Flow Tool Displays 16
Figure 7. Publication Locator 17
Figure 8. Control Chart Tool 18
Figure 9. CPM Tool Displays 19
Figure 10. Box Plot Display 20
Figure 11. Wiki Display 21
Figure 12. ER Diagram for Expert Locator 27
Figure 13. Knowledge Expert Questionnaire 40

1
Introduction
Knowledge sharing across academic departments at universities can be
enhanced through the promotion of Communities of Practice. Being able to
leverage work and research done in one department could greatly benefit other
departments. However, in some cases that knowledge created through work and
research may only be kept within the individual departments or the individual
people. Better methods for sharing knowledge across academic departments are
needed. The methods must consider ways of sharing both explicit knowledge and
tacit knowledge. This research attempts to identify some of the commonalities
between the industrial engineering department and other departments at the
University of Tennessee. Some methods to promote knowledge sharing, such as
the development of a portal, are used to promote knowledge sharing among the
departments.
Description of Problem
An initiative to promote Communities of Practice among academic
departments is needed. There are many factors which may limit the amount of
collaboration between academic departments. In order to identify some of these
factors, an Ishikawa (Fishbone) diagram was constructed. Four causes have been
identified, which are people, tools, knowledge, and environment. People are the
faculty members within the departments who wish to collaborate. Tools are the
media that allow the people to connect with each other, such as e-mail, phone,
hard copy mail, and other Internet collaboration tools. The material that needs to
be shared is knowledge. Knowledge may be explicit (easily codified) or tacit

2
(difficult to codify). Explicit knowledge can be easily transferred and stored,
once extracted into a recorded medium. Tacit knowledge requires experience or
hands on training to transfer, so it is not easily transferred or stored. The last
cause identified is environment, which condition in which collaboration takes
place. The environment can consist of both tangible and intangible factors.
Figure 1. Ishikawa Diagram
A possible reason why collaboration may not take place between academic
departments is because the faculty members from one department are not familiar
with the expertise areas of faculty in other departments. A method for finding
knowledge experts across departments is needed. If one faculty member is aware
of the knowledge expert that needs to be reach, other obstacles such as scheduling
conflicts may prevent effective collaboration.

3
Improving the tools available to collaborate could also promote
collaboration. At the University of Tennessee, the primary collaboration tools are
e-mail, phone calls, and a collaboration tool called Blackboard. There is no tool
which serves as a repository of knowledge, which is updateable by all faculty
members. Additionally, there are no tools for finding knowledge experts from
other departments. Each department has its own website, which usually lists
faculty members and their interest areas. However, there is not a single source of
information for all expertise areas of all faculty members.
A program to establish a standard process to retain and share knowledge
would also promote knowledge sharing. The process should include identifying
what knowledge to retain, how long to retain the knowledge, where to store the
retained knowledge, and how to share the knowledge.
The environment can also be a factor that prevents effective collaboration
between faculty members. The University of Tennessee employs over 1,400
faculty across four main campuses across the state. The industrial engineering
department has faculty located in Knoxville, Tullahoma, and Oak Ridge.
Therefore, the needed expert may be miles away. Many technologies exist that
can aid with collaboration between faculty at remote locations.
Improvements to a system are always the result of a problem, opportunity,
or directive. Currently at the University of Tennessee, the ability to improve
collaboration is an opportunity. In order to get full support among all university
faculty, and directive may need to be established by a senior university official,
such as the president, in order to get all faculty to participate.

4
Planned Goals
The purpose of this design project is to identify knowledge sharing across
academic departments, using the University of Tennessee as a case study. The
project will use the perspective of the industrial engineering department, and how
its members collaborate with other departments. Current technologies will be
used to implement tools to promote knowledge sharing among departments.
A planned project schedule was developed as a rough estimate for when
each deliverable was to be completed (Table 26). All project work must be
completed by April 11, 2008, which is the day of the presentation of the project to
the graduate committee. Levi Smith will deliver a final written report (this
document) to his graduate committee on or before the day of the presentation.
The final report shall adhere to the guidelines defined in the industrial engineering
master's handbook. The project presentation will cover the content covered in the
paper, and shall last approximately 20 to 30 minutes.
Literature Search
Communities of Practice (CoPs) is a concept of knowledge sharing
between people in an organization for the transfer of tacit knowledge. According
to the Jean Lave and Etienne Wenger, who defined the concept of Communities
of Practice, CoPs can not be established or created. CoPs occur naturally, through
people who share common interests and specialization areas. Since it is not
possible to mandate CoPs, managers can only provide a good environment and
tools to help promote the existence of CoPs.

5
CoPs can have both short term and long term benefits for an organization.
Short term benefits are results such as people being able to get an answer to a
problem quickly (Wenger 2002). Long term benefits include the accumulation of
experience throughout the organization (Wenger 2002). CoPs can produce
tangible results such as quality documents or deliverables (Wenger 2002).
Intangible results, such as trust and innovation among people in the organization,
are also gained (Wenger 2002). CoPs can be a small group of people or can
consists of hundreds of people (Wenger 2002). The lifetime of CoPs can also
significantly vary (Wenger 2002). Some CoPs only exist for a short period of
time such as a few weeks to complete a project (Wenger 2002). Other CoPs may
exists for centuries, such as skill sets being passed on from one generation to
another (Wenger 2002). CoPs can be homogeneous, which consists of people
with similar skills (Wenger 2002). CoPs can also be heterogeneous, which
consists of people with different skill sets, but the people are trying to solve a
common problem (Wenger 2002). Seven principles have been proposed for
designing a CoP, which are design for evolution, open a dialogue between inside
and outside perspectives, invite different levels of participation, develop both
public and private community spaces, focus on values, combine familiarity and
excitement, and create a rhythm for the community (Wenger 2002). Five stages
have been suggested as the stages of community development, which are
potential, coalescing, maturing, stewardship, and transformation (Wenger 2002).
Communities of Practice are defined by three fundamentals, which are
joint enterprise, mutual engagement, and a shared repertoire of resources. A case

6
study was performed by Frances Rock to show how law enforcement officers can
benefit from effective CoPs (Barton 2005). The data for the case study was
collected between 1999 and 2001 in England (Barton 2005). The case study
focuses on the task of explaining the right to silence by the officer, which is called
"cautioning" (Barton 2005). Joint enterprise is what the community is about,
defined by stated and shared goals, and mutual accountability (Barton 2005). The
process of "cautioning" is loosely defined by the official guidelines, but the
officers still share the same common goal (Barton 2005). Mutual engagement is
how the CoP functions (Barton 2005). The regular interaction between the
officers was accomplished by formal mentoring relationships and informal talks at
lunch time (Barton 2005). Shared repertoire of resources is the capability
produced (Barton 2005). In this case study, the officers shared the same official
cautioning guidance (Barton 2005).
Studies have shown that cooperative learning is more effective than other
methods. A study of 323 students showed that cooperative methods lead to higher
achievement than competitive or individualistic methods (McConnell 2006). The
study defined four indices of achievement, which can be used to determine the
effectiveness of CoPs (McConnell 2006). The metrics are mastery and retention
of material, quality of reasoning strategies, process gains (ability to create new
ideas and solutions), and transference of learning (McConnell 2006). In the
study, WebCT software was used as the collaboration tool to enable the CoPs
(McConnell 2006).

7
Another successful case of using Communities of Practice and
collaboration technologies is the Deft Cluster project in the Netherlands (Kukuric
2001). The goals of the Delft Cluster were to provide support for research,
provide stakeholders with access to knowledge, and generate innovative solutions
to problems (Kukuric 2001). Since the Delft Cluster members were spread across
six projects in different locations, a virtual environment was setup to enhance
collaboration (Kukuric 2001). The CoPs and collaboration tools allowed the Delft
Cluster to effectively accomplish their goals
Portals are a current technology that can be used to promote knowledge
sharing. Portals provide a single point of aggregated content to the user. A portal
is not simply a single webpage or homepage. Portals consist of a standard look
and feel, centralized location of information, and personalized for each user
(Collins 2003). Portals can promote knowledge sharing among users by
providing event calendars, discussion forms, feedback forms, FAQs, and other
collaboration tools (Collins 2003). Portals usually provide the ability to search
for content in the system (Collins 2003). Learning is achieved on portals through
simulations, online wizards, and job learning aids (Collins 2003).
Two types of portals exist, which are called horizontal portals and vertical
portals. Horizontal portals serve to share general information across an
organization. Horizontal portals support business intelligence, collaboration and
communities, content management, and learning (Collins 2003). Vertical portals
support more specific functions, processes, and applications (Collins 2003).
Vertical portals require that the user authenticate ("log in") to gain access (Katz

8
2002). Vertical portals know information about the portal user, and display
information relevant to the user.
A portal usually consists of many portlets, which are complete
applications having multiple states and views. A portal should allow the user to
choose which portlets they wish to view. Most portlets are developed using Java
Servlets, and a specification named JSR168 exists which defines how portlets are
developed. However, a portlet can be developed using any technology as long as
it meets the definition of a portlet. Portlets usually have a titlebar, window
controls to maximize, minimize, close, and perform other configuration options
(Polgar 2006). Some examples of portal server software are Sun ONE Portal
Server, Web Sphere Portal, Apache Portal Tools and Server, Microsoft
SharePoint, and SAP Enterprise Portal (Polgar 2006).
One valuable tool that should be included in a portal is an expertise
locator, which can be used to aid in distributing tacit knowledge. Expertise
locators can connect people who would have otherwise never met (Ackerman
2003). A study has shown that teams that could effective find and contact experts
to solve problems were much more successful that those that could not
(Ackerman 2003). Some of the requirements for designing an expertise locator
are that it must be fast and easy to use, it must produce reliable search results, and
it must be scaleable (Ackerman 2003). One problem when designing the
expertise locator is deciding how to represent knowledge and skill areas, which
can be defined at either a high or low level (Ackerman 2003). In some
organizations, a person's title may give clues about their expertise areas
9
(Ackerman 2003). Ratings can also be applied towards the level of knowledge of
each area for each expert, but that rating would be somewhat subjective since
there is no quantitative metric for determining a person's knowledge in an area
(Ackerman 2003). The data in the expertise locator must be maintainable and
kept up to date (Ackerman 2003). One solution to that problem is to provide an
interface to allow the experts to update the information themselves (Ackerman
2003).
The company Accenture found that the development of an expertise
locator tool, Knowledge Xchange, was very valuable (Morrissey 2005). The tool
allowed people to find experts by specific project (Morrissey 2005). Accenture
employs over 100,000 people in 48 countries, so the expert locator greatly
benefits employees to quickly find the correct expert (Morrissey 2005).
Methodology
A questionnaire was given to many of the IE faculty, asking for the
departments that they collaborate. The questionnaire also asked for the specific
areas where knowledge sharing occurred with the other departments. The
questionnaire is shown in Appendix G. This information was gathered from the
questionnaire results, and from common areas identified through research. For
each department, specific topic areas are identified where knowledge sharing may
occur. A total of nine faculty members responded to the questionnaire. If more
time were available, acquiring this information from the remaining IE faculty and
faculty from other departments would provide a more complete view of the
knowledge sharing between the departments. Since the collection of this

10
information requires each participant self identification, an IRB Form B was
completed and submitted to the IRB for review and approval. An IRB Form B
must be completed for collection of information from human participants, who are
not anonymous. Figure 2 shows a hypothesized view of the primary departments
collaborating with industrial engineering, along with commonality areas where
knowledge sharing takes place.
Figure 2 Collaborating Departments

11
The UT IE Portal is an attempt to take the traditional portal technology
and framework and apply to an academic setting. The IE portal will provide
news, tools, and collaboration pertaining to industrial engineering topics. The
user will be able to customize their portal similar to a mainstream portal. People
outside of the industrial engineering department can view the portal to get a
general idea about some of the topics that industrial engineering covers.
Figure 3. Portal Architecture

12
Figure 4. Portal Display
The primary portal display consists of a menubar at the top of the screen
below the title graphics, news items below the menubar, and the tools to the right
of the menubar and news items. Both the news items and tools are portlets. A
typical display from the portal is shown in Figure 4. The menubar provides the
user the ability to choose functions from four different menus. The first menu
consists of news feeds which the user can add to the main display. The next menu
allows the user to select new tools to add to the display. The menu to select
different views follows. The final menu allows the user to view collaboration

13
functionality. The user has the ability to remove any news feed or tool from the
display by clicking on the "X" box in the title bar of the item to be removed.
Developing portal software is time consuming, but not an impossible task.
Ensuring that all functionality is distinct and loosely coupled is very important.
Session variables can be used to keep track of which portlet items the user wants
to view, and which items should be hidden. Each news item and tool is assigned a
unique identifier. The identifiers for the active portlets are stored as a variable,
which lives throughout the user's session. The portlets can be written as separate
web applications, and the portlets are shown on the main portal window using
iframes. Iframes is a standard HTML tag supported by all modern browsers that
allows a web page to be shown within another web page. A typical waterfall
lifecycle model was used for the development of the IE portal, which includes
defining requirements, design, implementation, and testing.
The news feeds provided on the portal will help IE faculty stay current
with the latest events in their expertise field. Visitors from other departments can
view the news feeds to learn more about the latest topics in IE. The news feeds
use the RSS standard for transferring the news information. RSS (really simple
syndication) provides a standard for transfer of news related information. Many
news readers support the RSS standard. RSS is implemented using XML files,
which are pulled down nightly to reduce traffic and slowdown. News from some
predominant IE societies, such as IIE (Institute of Industrial Engineers), ASQ
(American Society for Quality), and INFORMS are included as selectable news

14
sources. Additional news sources can be added, as long as their news feed
adheres to the RSS specification.
A UT IE news feed was developed to share news information at the
industrial engineering department at the University of Tennessee. Currently,
news is distributed through email which may not reach all of the intended
recipients. An IE department newsletter is usually published biannually, however
a news feed could be updated daily.
Two tools were developed to help faculty from other departments find the
knowledge they wish to obtain. One tool helps find knowledge experts and the
other helps find publications. Additional tools were developed to solve IE
problems. In case one of the IE knowledge experts is not available, these tools
can solve simple problems while the expert is away. The tools developed can
help solve engineering economy, quality, and project management problems.
Data for these tools will be stored in a relational database, so that anyone who is
familiar with relational databases can update and maintain the information.
The knowledge expert locator allows users to find a faculty member that is
an expert in a specific area. For instance, if someone in the mechanical
engineering department wanted to collaborate on lean manufacturing techniques,
then they could use the knowledge expert locator system to find someone in the
IE department who is an expert in lean manufacturing. The knowledge expert
locator tools allows the results to be filtered by location, since some of the IE
faculty are located on the main campus in Knoxville, while other faculty are

15
located at the UT Space Institute in Tullahoma. Additional locations may be
added to include the growing prescience in Oak Ridge.
Figure 5. Expert Locator Displays
The knowledge expert information was collected by providing a short
questionnaire to many of the IE faculty, shown in Appendix G. The questionnaire
asked to faculty to check off the areas that they considered themselves to be
experts. The questionnaire also provided an "Other" option, which allowed the
faculty member to specify other expertise areas that may have been missed. The
information was gathered, and entered into the system. In the future, an
automated process should be developed so that faculty can view and update their
expertise areas online.
The Cash Flow Diagram tool is an update of a tool that was written in
2004. The benefit of the new tool is that it is accessible over the Web as a portlet,
so that the user is not required to download any software. The cash flow diagram
tool allows the user to enter cash flow values for each period. As values are
entered, the present worth (PW), annual worth (AW), and future worth (FW) are
dynamically updated. At any time, the user can change the interest value, and the
calculated values will also update. For simplicity, the user can not modify cash

16
flow values entered. The user must clear all values and restart if a mistake is
made.
Figure 6. Cash Flow Tool Displays
The publication locator system was originally developed for another
research project. The information stored in the publication locator system could
be beneficial to others who wish to learn about publications from the industrial
engineering department at the University of Tennessee, so it was included in the
IE portal. The original system was implemented as a Microsoft Access database
with VBA forms for an interface. The data was easily exported into a mySQL
database, and a new front end was written in PHP. Since the information is now
accessible through a Web interface, the information can be distributed without
installing software on the user's client machine. The publication locator promotes
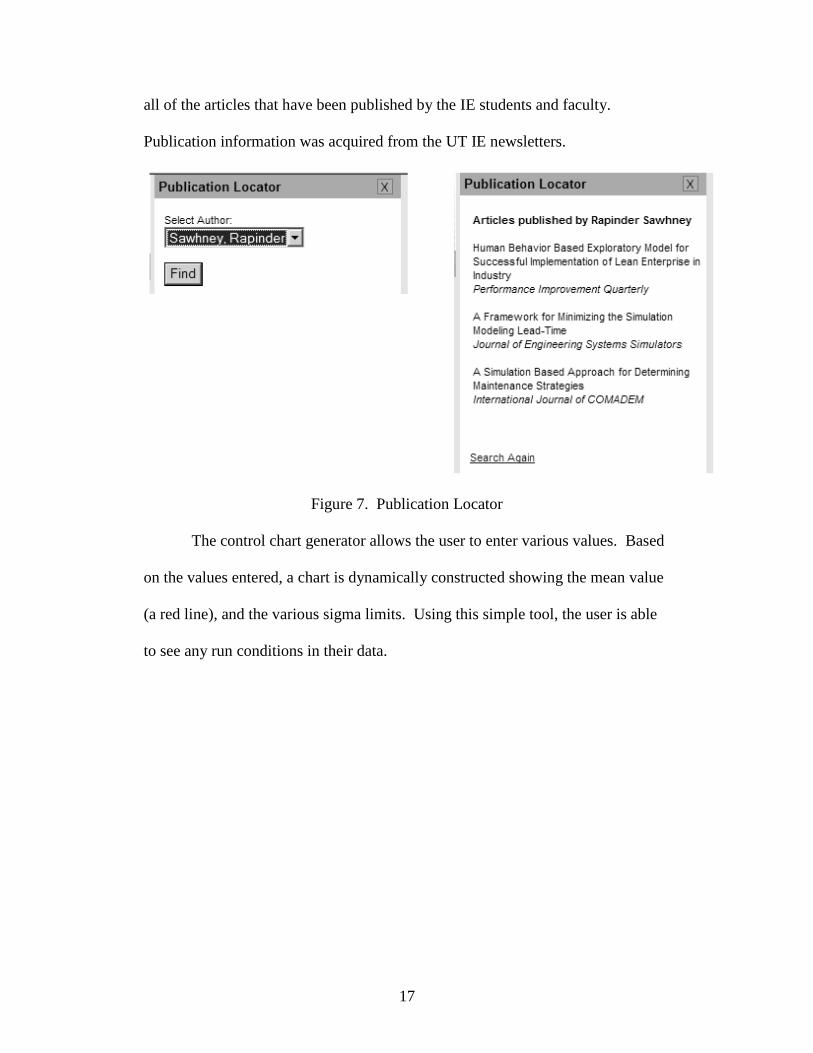
17
all of the articles that have been published by the IE students and faculty.
Publication information was acquired from the UT IE newsletters.
Figure 7. Publication Locator
The control chart generator allows the user to enter various values. Based
on the values entered, a chart is dynamically constructed showing the mean value
(a red line), and the various sigma limits. Using this simple tool, the user is able
to see any run conditions in their data.

18
Figure 8. Control Chart Tool
The CPM tool allows the user to enter various activities, along with
durations and dependencies. Based on the values entered by the user, the tool will
generate a chart listing the early start, late start, early finish, late finish, and slack
of each activity. The user will have the ability to specify multiple dependencies
for an activity.

19
Figure 9. CPM Tool Displays
The Box Plot tool constructs a box plot based on the numerical values
entered by the user, which is shown in Figure 10. When the user enters a value,
the display updates to show the median, the first quartile (25th percentile), the
third quartile (75th percentile), the total range, the interquartile range, the smallest
value that is not an outlier, and the largest value that is not an outlier. Currently,
the tool does not show outlier values, which are commonly represented by filled
and open dots depending on their distance away from the first and third quartiles.
The box plot tool is very effective in calculating measures of dispersion.

20
Figure 10. Box Plot Display
The user is able to select various views of the portal. For instance, if the
user is only interested in seeing information related to engineering management,
then they can choose the engineering management view. Then they will only be
shown news feeds and portlet tools related to engineering management.
The wiki allows faculty at UT IE to share information on various topics.
The wiki will promote sharing of information across the various departments.
The wiki is updateable by all UT IE faculty, and their collaborating partners in
other departments. Adding information to the wiki is a simple process, and it
does not require the user to be a technical expert to update the content on the
pages. The wiki does not require any additional tools to update content. Media
Wiki was used as the wiki software, since it is popular, and the same software that
one of the largest wikis (Wikipedia) uses. Media Wiki is relatively easy to install,
and works with an Apache Web server.

21
Figure 11. Wiki Display
A feasibility analysis was completed to determine the best technologies to
use for the development of the IE Portal and portlets. The AHP (Analytical
Hierarchy Process) was used to determine which web development language,
database software, wiki software, and portal server software to be used. AHP is
used to calculate weights for each of the factors for each alternative. Scores are
given for each factor for each alternative and then multiplied by the calculated
weight. The values for all the factors are summed for each alternative, which
gives an overall score for each alternative. The alternative with the highest score
is the recommended alternative to implement. A spreadsheet was created in
Microsoft Excel to perform the calculations, and the results are shown in
Appendix A, B, C, and D.
The alternatives for the development language are shown in Table 1. Five
factors were used to determine which Web development language to use for the

22
development of the portal. Server setup difficulty is the amount of time and effort
required to setup the environment needed to run the code. Almost all web
development languages require interpreter software to run the code. The cost of
the interpreter software and server are included in the cost factor. Portability is
the ease at which the code can be moved from one platform, such as Windows, to
another platform, such as Mac. Code execution speed is the amount of time that it
takes for the server to render the code to a user. Most users are not willing to wait
more than 7 seconds for content to load. Dynamic content generation is the
ability of the language to render pages based on the current state of the system,
opposed to static content which never changes. The final AHP calculations can
be found in Appendix A. Since PHP development language has the highest
calculated overall score, it was chosen to be used as the development language.

23
Table 1. Development Language Alternatives
Development
Language
Company /
Organization
Servers Server
setup
difficulty
Cost of
development
and server
software
Port-
ability
Code
Execution
Speed
Dynamic
content
generation
PHP The PHP
Group
PHP Low None High High Yes
JSP (Java Server
Pages)
Sun
Microsystems
Tomcat,
Sun Java
System
Web Server
Low None High Medium Yes
ASP (Active
Server Pages)
Microsoft MS
Internet
Information
Server
Medium None Low
(Windows
only)
Medium Yes
Java Applets Sun
Microsystems
None (built
into
browser)
Low None High Low Yes
Cold Fusion Adobe ColdFusion
Server
Medium High ($1299) Medium Medium Yes
HTML W3C None (built
into
browser)
Low None High High No
Flash Adobe None (free
browser
plug-in)
Low High ($699) High Medium Yes
Table 2 shows the alternatives for the database to be used for the system.
Five factors were considered for determining which relational database system to
be used. A database was necessary for the subject matter expert locator tool and
the publication locator tool. The database system is used to store all of the data
for those tools. Setup difficulty is the amount of time and effort required to install
and setup the database package and the time to ensure that the database is
operational. Security is the level of security features provided by the database
system to prevent unauthorized access to the data. Cost is the amount of money
required to purchase the database software. Portability is the level of ease at
which the database system can be moved to other platforms. Interface usage
difficulty is the quality of the tools provided by the database system to manage the

24
data contained in the database. The AHP calculations for the database can be
found in Appendix B, and mySQL had the highest overall score.
Table 2. Database Alternatives
Database Setup
Difficulty
Security Cost Portability Interface Usage
Difficulty
Oracle Medium High High High Medium (SQL
command prompt)
MS Access Low Low Medium
($229)
Low
(Windows
only)
Low (built in
query tools)
mySQL Low Medium None Medium
(Windows,
Linux)
Medium (SQL
command prompt;
query browser
addon)
MS SQL
Server
Medium High High Low
(Windows
only)
Medium (SQL
command prompt)
The portal will include a wiki, which will promote collaboration and the
establishment of communities of practice. Only two alternatives were considered
and four factors were analyzed, which are shown in Table 3. Setup difficulty is
the time and effort required to make the wiki software operational. Portability is
the difficulty of moving the software to another platform. Support is the level of
support provided by the developers of the wiki software. Support includes the
frequency at which the developers provide updates, bug fixes, new features, and
patches. Cost is the amount of money required to purchase the software. Media
Wiki is popular wiki software due to the ease of setup and support. Wikipedia is
built using the Media Wiki software. Swiki is wiki software frequently used in
academic environments, and is written using the Smalltalk programming
language. Media Wiki had the highest overall score as shown by the calculations
in Appendix C.

25
Table 3. Wiki Alternatives
Wiki Setup Difficulty Portability Support Cost
Media Wiki Medium Medium High None
Swiki Medium Medium Low None
Three different portal software packages will be considered as alternatives,
plus the alternative to custom build the portal. The custom built portal had the
highest overall score, which is shown in Appendix D.
Table 4. Portal Alternatives
Portal
Software
Cost Setup
Difficulty
Customizability Development
Time
Open Portal None High Low None
SAP Portal High High Low None
MS Share
Point
High High Low None
Custom Built None Medium High High
A laptop was procured to be used for hosting all of the software, since the
laptop can be transported to various locations. The laptop eliminates the factor of
problems with a remote server. If the software were to be used by real users, then
more powerful server hardware should be purchased to host the software. Instead
of individually installing mySQL, PHP, and Apache, a package called XAMPP
was downloaded and installed which includes all of those technologies in one
easy to install package. Windows Vista was used as the operating system, since it
was the default operating system installed on the laptop, and time was not
available to install and test other operating systems on the laptop.
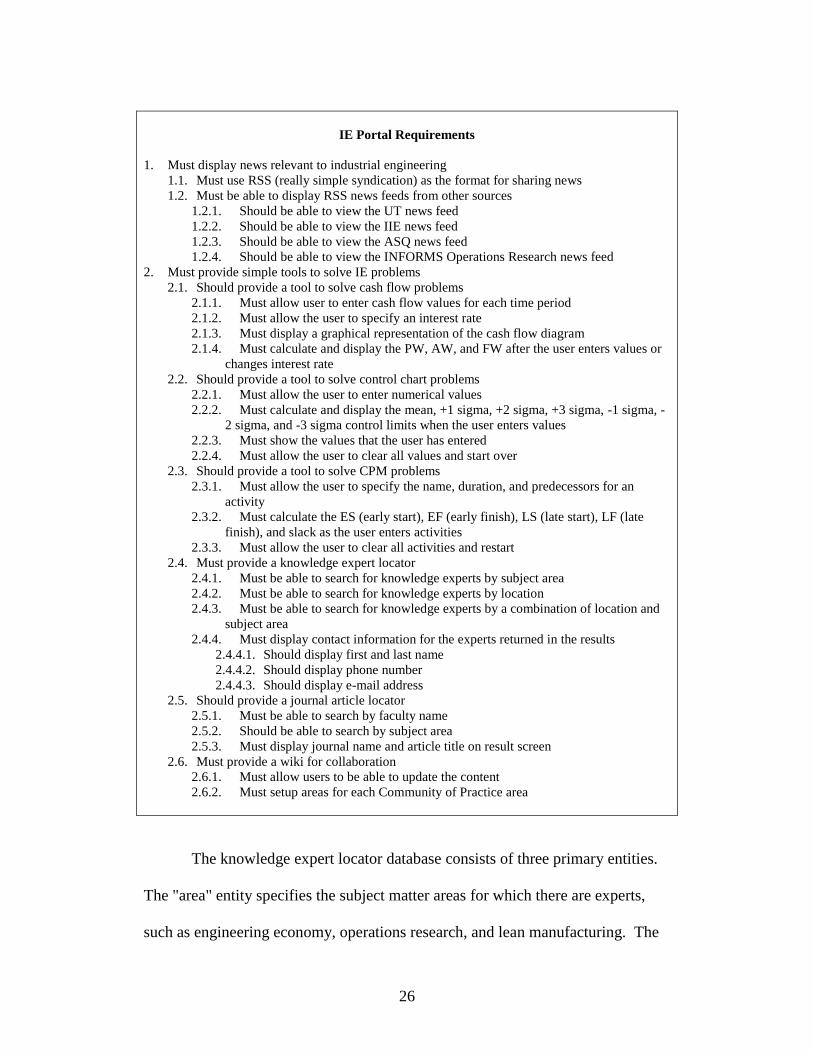
The following requirements were defined for the IE Portal software. A
formal test plan could be developed by testing to ensure that the delivered system
meets each of the requirements listed below.
26
IE Portal Requirements
1. Must display news relevant to industrial engineering
1.1. Must use RSS (really simple syndication) as the format for sharing news
1.2. Must be able to display RSS news feeds from other sources
1.2.1. Should be able to view the UT news feed
1.2.2. Should be able to view the IIE news feed
1.2.3. Should be able to view the ASQ news feed
1.2.4. Should be able to view the INFORMS Operations Research news feed
2. Must provide simple tools to solve IE problems
2.1. Should provide a tool to solve cash flow problems
2.1.1. Must allow user to enter cash flow values for each time period
2.1.2. Must allow the user to specify an interest rate
2.1.3. Must display a graphical representation of the cash flow diagram
2.1.4. Must calculate and display the PW, AW, and FW after the user enters values or
changes interest rate
2.2. Should provide a tool to solve control chart problems
2.2.1. Must allow the user to enter numerical values
2.2.2. Must calculate and display the mean, +1 sigma, +2 sigma, +3 sigma, -1 sigma, -
2 sigma, and -3 sigma control limits when the user enters values
2.2.3. Must show the values that the user has entered
2.2.4. Must allow the user to clear all values and start over
2.3. Should provide a tool to solve CPM problems
2.3.1. Must allow the user to specify the name, duration, and predecessors for an
activity
2.3.2. Must calculate the ES (early start), EF (early finish), LS (late start), LF (late
finish), and slack as the user enters activities
2.3.3. Must allow the user to clear all activities and restart
2.4. Must provide a knowledge expert locator
2.4.1. Must be able to search for knowledge experts by subject area
2.4.2. Must be able to search for knowledge experts by location
2.4.3. Must be able to search for knowledge experts by a combination of location and
subject area
2.4.4. Must display contact information for the experts returned in the results
2.4.4.1. Should display first and last name
2.4.4.2. Should display phone number
2.4.4.3. Should display e-mail address
2.5. Should provide a journal article locator
2.5.1. Must be able to search by faculty name
2.5.2. Should be able to search by subject area
2.5.3. Must display journal name and article title on result screen
2.6. Must provide a wiki for collaboration
2.6.1. Must allow users to be able to update the content
2.6.2. Must setup areas for each Community of Practice area
The knowledge expert locator database consists of three primary entities.
The "area" entity specifies the subject matter areas for which there are experts,
such as engineering economy, operations research, and lean manufacturing. The

27
"expert" is the faculty member, and contains contact information attributes. The
"location" is the physical location where the expert resides, such as Knoxville,
Tullahoma, or Oak Ridge. A many to many relationship exists between area and
expert, since one expert may be knowledgeable in many areas, and an area may be
studied by more than one expert. A many to many relationship also exists
between the expert and location, since in some cases an expert may reside at more
than one location. A location is usually inhabited by more than one expert.
Therefore two additional entities were created, "expert_area" and
"expert_location," to connect the primary entities. The ER diagram for the Expert
Locator is shown in Figure 11. This database design shows that a knowledge
expert locator can be created in a relatively short period of time at little cost.
Figure 12. ER Diagram for Expert Locator
As each module of software was developed, unit testing was performed to
ensure that the software met the specifications defined by the requirements.
Simple black box testing was performed, where data was entered as input and the
correct outputs were validated. If the correct values were not returned, then

28
further white box testing was performed to ensure that the code is executing as
planned.
Results
Detailed results for the questionnaire are shown in Appendix E. The totals
for each knowledge area are shown in Table 5. The top four expertise areas are
productivity and quality, other, lean manufacturing, and engineering management.
Table 6 shows that the top 3 collaborating departments are mechanical
engineering, nuclear engineering, and computer science. A further analysis
should be completed to determine if there is a distinct relationship between
expertise area and collaborating department. Since the areas and departments are
nominal values, a regression analysis can not be easily performed.
Table 5. Expertise Area Totals
Expertise Area Count
Productivity and Quality 5
Other 5
Lean Manufacturing 4
Engineering Management 4
Project Management 3
Operations Research 3
Knowledge/Intellectual Properties Management 3
Information Systems 3
Engineering Economics 3
Simulation 2
Industrial Safety 2
Human Factors / Ergonomics 2
Engineering Statistics 2
Reliability 1

29
Table 6. Collaborating Department Totals
Collaborating Department Count
Mechanical Engineering 4
Nuclear Engineering 3
Computer Science 3
Operations/Production Management 2
Civil Engineering 2
Safety (Sports) 1
Nursing 1
Management Science 1
Forest Product Center 1
Electrical Engineering 1
Education (Other) 1
Chemical Engineering 1
Biomedical Engineering 1
Conclusions
Through the promotion of communities of practice and use of the latest
technologies, knowledge sharing across academic departments can be
strengthened. The UT IE Portal should be put on a production system, so that the
software is available to faculty across the university. A follow up study should be
performed to determine if the development of the portal, tools, and wiki has
helped the amount of knowledge sharing across departments.

30
References
Ackerman, Mark S., Volkmar Pipek, and Volker Wulf (editors). Sharing
Expertise, Beyond Knowledge Management. Cambridge, MA: MIT
Press, 2003.
Barton, David and Karin Tusting. Beyond Communities of Practice. New York:
Cambridge University Press, 2005.
Collins, Heidi. Enterprise Knowledge Portals. New York: AMACOM, 2003.
Katz, Richard N. Web Portals and Higher Education. San Francisco: Jossey-
Bass, 2002.
Kukuric, N. and R. K. Price. Cross-organisational Knowledge Sharing:
Introducing Delft Cluster. January 16, 2001
<http://www.waitro.org/modules/wfsection/article.php?articleid=132>
April 6, 2008.
McConnell, David. E-learning Groups and Communities of Practice.
Maidenhead: Open University Press, 2006.
Morrissey, Steve. The Design and Implementation of Effective Knowledge
Management Systems. 2005.
Polgar, Jana, Robert Mark Bram, and Anton Polgar. Building and Managing
Enterprise-Wide Portals. Hershey, PA: Idea Group Pub, 2006.
Wenger, Etienne and Richard McDermott. Cultivating Communities of Practice.
Boston, MA: Harvard Business School Press, 2002.

31
Appendices

32
Appendix A
AHP Calculations for Development Language used
to Build the IE Portal
Table 7. Development Language Factor Comparisons
Server
Setup
Difficulty
Cost of
development
server and
software
Portability Code
Execution
Speed
Dynamic
Content
Generation
Server Setup
Difficulty
1.000 0.333 5.000 0.333 0.143
Cost of development
server and software
3.000 1.000 5.000 3.000 0.200
Portability 0.200 0.200 1.000 0.143 0.143
Code Execution
Speed
3.000 0.333 7.000 1.000 0.333
Dynamic Content
Generation
7.000 5.000 7.000 3.000 1.000
Total 14.200 6.866 25.000 7.476 1.819
Table 8. Normalized Development Language Factor Comparisons
Server
Setup
Difficulty
Cost of
development
server and
software
Portability Code
Execution
Speed
Dynamic
Content
Generation
Average
Server Setup
Difficulty
0.070 0.048 0.200 0.045 0.079 0.088
Cost of
development
server and
software
0.211 0.146 0.200 0.401 0.110 0.214
Portability 0.014 0.029 0.040 0.019 0.079 0.036
Code Execution
Speed
0.211 0.048 0.280 0.134 0.183 0.171
Dynamic Content
Generation
0.493 0.728 0.280 0.401 0.550 0.490

33
Raw scores were given for each alternative. High positive values are given a 3, medium values
are given a 2, and high negative values are given a 1.
Table 9. Development Language Raw Scores
Development
Language
Server
setup
difficulty
Cost of
development
and server
software
Portability Code
Execution
Speed
Dynamic
content
generation
PHP 3 3 3 3 3
JSP (Java Server
Pages)
3 3 3 2 3
ASP (Active
Server Pages)
2 3 1 2 3
Java Applets 3 3 3 1 3
Cold Fusion 2 1 2 2 3
HTML 3 3 3 3 1
Flash 3 1 3 2 3
Table 10. Development Language Weights Applied
Development
Language
Server
setup
difficulty
Cost of
development
and server
software
Portability Code
Execution
Speed
Dynamic
content
generation
Total
PHP 0.265 0.641 0.109 0.514 1.471 3.000
JSP (Java Server
Pages)
0.265 0.641 0.109 0.343 1.471 2.829
ASP (Active
Server Pages)
0.177 0.641 0.036 0.343 1.471 2.668
Java Applets 0.265 0.641 0.109 0.171 1.471 2.657
Cold Fusion 0.177 0.214 0.072 0.343 1.471 2.277
HTML 0.265 0.641 0.109 0.514 0.490 2.019
Flash 0.265 0.214 0.109 0.343 1.471 2.401

34
Appendix B
AHP Calculations for Database used to
Store Data for the Knowledge Expert Locator
Table 11. Database Factor Comparisons
Setup
Difficulty
Security Cost Portability Interface
Usage
Difficulty
Setup Difficulty 1.000 5.000 0.333 5.000 0.333
Security 0.200 1.000 0.143 0.333 0.143
Cost 3.000 7.000 1.000 7.000 3.000
Portability 0.200 3.000 0.143 1.000 0.143
Interface Usage
Difficulty
3.000 7.000 0.333 7.000 1.000
Total 14.200 6.866 25.000 7.476 1.819
Table 12. Normalized Database Factor Comparisons
Setup
Difficulty
Security Cost Portability Interface
Usage
Difficulty
Average
Setup Difficulty 0.135 0.217 0.171 0.246 0.072 0.168
Security 0.027 0.043 0.073 0.016 0.031 0.038
Cost 0.405 0.304 0.512 0.344 0.649 0.443
Portability 0.027 0.130 0.073 0.049 0.031 0.062
Interface Usage
Difficulty
0.405 0.304 0.171 0.344 0.216 0.288
Table 13. Database Raw Scores
Database Setup
Difficulty
Security Cost Portability Interface
Usage
Difficulty
Oracle 2 3 1 3 2
MS Access 3 1 2 1 3
mySQL 3 2 3 2 2
MS SQL Server 2 3 1 1 2
Table 14. Database Weights Applied
Database Setup
Difficulty
Security Cost Portability Interface
Usage
Difficulty
Total
Oracle 0.336 0.115 0.443 0.187 0.576 1.657
MS Access 0.505 0.038 0.886 0.062 0.865 2.356
mySQL 0.505 0.076 1.329 0.124 0.576 2.611
MS SQL Server 0.336 0.115 0.443 0.062 0.576 1.533

35
Appendix C
AHP Calculations for Wiki Software used
for Collaboration
Table 15. Wiki Factor Comparisons
Setup
Difficulty
Portability Support Cost
Setup Difficulty 1.000 7.000 3.000 0.200
Portability 0.143 1.000 0.333 0.143
Support 0.333 3.000 1.000 0.200
Cost 5.000 7.000 5.000 1.000
Total 6.476 18.000 9.333 1.543
Table 16. Normalized Wiki Factor Comparisons
Setup
Difficulty
Portability Support Cost Average
Setup Difficulty 0.154 0.389 0.321 0.130 0.249
Portability 0.022 0.056 0.036 0.093 0.051
Support 0.051 0.167 0.107 0.130 0.114
Cost 0.772 0.389 0.536 0.648 0.586
Table 17. Wiki Raw Scores
Wiki Setup Difficulty Portability Support Cost
Media Wiki 2 2 3 3
Swiki 2 2 1 3
Table 18. Wiki Weights Applied
Wiki Setup
Difficulty
Portability Support Cost Total
Media Wiki 0.497 0.103 0.341 1.759 2.700
Swiki 0.497 0.103 0.114 1.759 2.472

36
Appendix D
AHP Calculations for Portal Software
to be Used
Table 19. Portal Software Factor Comparisons
Cost Setup
Difficulty
Customizability Development
Time
Cost 1.000 5.000 0.333 1.000
Setup Difficulty 0.200 1.000 0.200 0.333
Customizability 3.000 5.000 1.000 5.000
Development
Time
1.000 3.000 0.200 1.000
Total 5.200 14.000 1.733 7.333
Table 20. Normalized Portal Software Factor Comparisons
Cost Setup
Difficulty
Customizability Development
Time
Average
Cost 0.192 0.357 0.192 0.136 0.219
Setup Difficulty 0.038 0.071 0.115 0.045 0.068
Customizability 0.577 0.357 0.577 0.682 0.548
Development
Time
0.192 0.214 0.115 0.136 0.165
Table 21. Portal Software Raw Scores
Portal Software Cost Setup
Difficulty
Customizability Development
Time
Open Portal 3 1 1 3
SAP Portal 1 1 1 3
MS Share Point 1 1 1 3
Custom Built 3 2 3 1
Table 22. Portal Software Weights Applied
Portal
Software
Cost Setup
Difficulty
Customizability Development
Time
Total
Open Portal 0.658 0.068 0.548 0.494 1.768
SAP Portal 0.219 0.068 0.548 0.494 1.329
MS Share
Point
0.219 0.068 0.548 0.494 1.329
Custom Built 0.658 0.135 1.645 0.165 2.603

37
Appendix E
Questionnaire Results
Table 23. Faculty Expertise Areas
Faculty Expert Area
Aikens, Hal Engineering Statistics
Aikens, Hal Lean Manufacturing
Aikens, Hal Operations Research
Aikens, Hal Productivity and Quality
Aikens, Hal Engineering Management
Dai, Shaun Information Systems
Dai, Shaun Reliability
Ford, Robert Engineering Economics
Ford, Robert Industrial Safety
Ford, Robert Project Management
Ford, Robert Human Factors / Ergonomics
Ford, Robert Configuration Control (Other)
Halstead, P. D. Industrial Safety
Halstead, P. D. Knowledge/Intellectual Properties Management
Halstead, P. D. Productivity and Quality
Halstead, P. D. Engineering Management
Halstead, P. D. Human Factors / Ergonomics
Jackson, Denise Engineering Economics
Jackson, Denise Information Systems
Jackson, Denise Knowledge/Intellectual Properties Management
Jackson, Denise Productivity and Quality
Jackson, Denise Project Management
Jackson, Denise Engineering Management
Li, Xueping Information Systems
Li, Xueping Lean Manufacturing
Li, Xueping Operations Research
Li, Xueping Simulation
Li, Xueping Scheduling & Optimization (Other)
Sawhney, Rupy Lean Manufacturing
Sawhney, Rupy Productivity and Quality
Sawhney, Rupy Simulation
Sawhney, Rupy Reliability (Other)
Sedrick, Gregory Engineering Economics
Sedrick, Gregory Engineering Statistics
Sedrick, Gregory Knowledge/Intellectual Properties Management
Sedrick, Gregory Lean Manufacturing
Sedrick, Gregory Productivity and Quality
Sedrick, Gregory Project Management
Sedrick, Gregory Engineering Management
Sedrick, Gregory Technology Based Economic Development (Other)
Zhu, Xiaoyan Operations Research
Zhu, Xiaoyan Reliability (Other)

38
Table 24. Faculty Locations
Faculty Campus Department
Aikens, Hal UTK IIE
Dai, Shaun UTK IIE
Ford, Robert UTK IIE
Halstead, P. D. UTK IIE
Jackson, Denise UTSI IIE
Li, Xueping UTK IIE
Sawhney, Rupy UTK IIE
Sedrick, Gregory UTSI IIE
Sedrick, Gregory UTSI EM
Zhu, Xiaoyan UTK IIE
Table 25. Collaborating Departments
Faculty Department
Aikens, Hal Mechanical Engineering
Aikens, Hal Management Science
Aikens, Hal Operations/Production Management
Aikens, Hal Education (Other)
Dai, Shaun Electrical Engineering
Dai, Shaun Nuclear Engineering
Dai, Shaun Computer Science
Dai, Shaun Forest Product Center
Ford, Robert Nuclear Engineering
Ford, Robert Civil Engineering
Halstead, P. D. Biomedical Engineering
Halstead, P. D. Safety (Sports)
Jackson, Denise Mechanical Engineering
Li, Xueping Civil Engineering
Li, Xueping Computer Science
Li, Xueping Nursing
Sawhney, Rupy Mechanical Engineering
Sawhney, Rupy Nuclear Engineering
Sedrick, Gregory Chemical Engineering
Sedrick, Gregory Computer Science
Zhu, Xiaoyan Mechanical Engineering
Zhu, Xiaoyan Operations/Production Management

39
Appendix F
Planned Project Schedule
Table 26. Project Schedule
Week Starting Date
Ending Date
Task Description
1 1/7 1/13 Define possible project topics and scope
2 1/14 1/20 Develop project schedule
Submit potential project topics
3 1/21 1/27 Meeting with Dr. Jackson to discuss project topics (1/23)
Begin work on revised project statement
Begin literature research
4 1/28 2/3
Finalize project topic
Revise project schedule
Submit draft outline
Continue literature research
5 2/4 2/10 Continue literature research
Finalize project goals
Complete requirements specification for project deliverables
Begin rough draft of research paper
6 2/11 2/17 Complete literature research
Continue work on research paper
Finalize requirements specification for project deliverables
Complete design of project deliverables
7 2/18 2/24 Continue work on research paper
Complete implementation of project deliverables
8 2/25 3/2 Continue work on research paper
Testing of project deliverables
9 3/3 3/9 Begin final draft of research paper
10 3/10 3/16 Complete and submit final draft of project research paper to graduate committee
Schedule date for project presentation to graduate committee (by 3/13)
11 3/17 3/23 Spring Break
Begin work on project presentation
12 3/24 3/30 Present design project work to graduate committee (by 4/4)
Take final oral examination (by 4/4)
13 3/31 4/6 Resolve any graduation related issues
14 4/7 4/13 Report of final examination (pass/fail) submitted to Registrar's Office (by 4/18)
15 4/14 4/20
16 4/21 4/27
17 4/28 5/4
18 5/5 5/11 Graduation Ceremony (Thursday 5/8)

40
Appendix G
Knowledge Expert Questionnaire
The information gathered from this questionnaire will be used to populate data in the "expert locator"
software on the industrial engineering portal, which is in development. This software is being
developed as a part of the capstone design project for MS IE student Levi Smith. The purpose of the
"expert locator" is to allow students and faculty to easily find experts in a given field, which will
promote knowledge sharing internally and externally to the industrial engineering department.
Name: ______________________ Institution: __________________ Department: _____________
I. Please select the Industrial Engineering (IE) areas in which you consider yourself an expert.
Teaching classes, completing research, publishing articles, or just a general interest in an area are
factors that may indicate that you are an expert in an area.
Engineering Economics
Engineering Statistics
Industrial Safety
Information Systems
Knowledge/Intellectual Properties Management
Lean Manufacturing
Operations Research
Productivity and Quality
Project Management
Engineering Management
Human Factors/Ergonomics
Simulation
Others (Specify): __________________________________________________
II. Please select the departments of faculty outside of IE with whom you have collaborated, and indicate
the subject area.
Department of Collaborating Faculty Area of Application
Mechanical Engineering
Electrical Engineering
Nuclear Engineering
Civil Engineering
Other Engineering (Specify: _______________)
Computer Science
Management Science
Operations/Production Management
Computer Science
Others ( Specify): ___________________
Figure 13. Knowledge Expert Questionnaire
41
RESUMÉ
Levi D. Smith
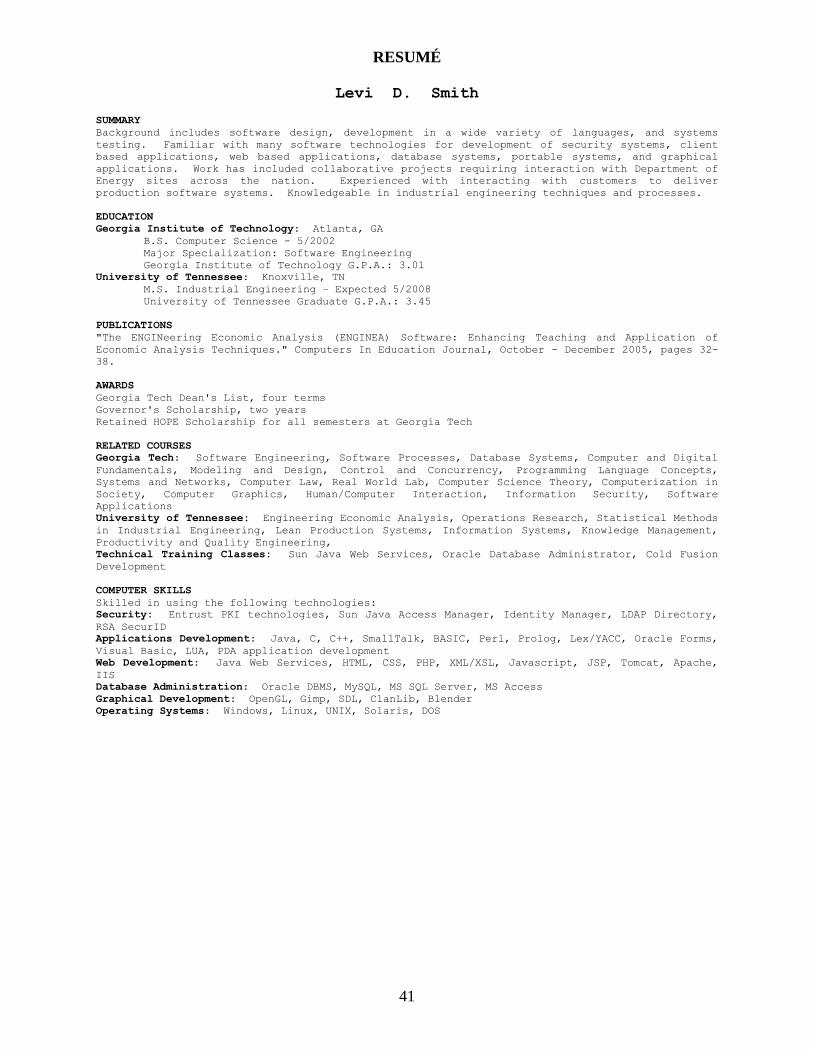
SUMMARY
Background includes software design, development in a wide variety of languages, and systems
testing. Familiar with many software technologies for development of security systems, client
based applications, web based applications, database systems, portable systems, and graphical
applications. Work has included collaborative projects requiring interaction with Department of
Energy sites across the nation. Experienced with interacting with customers to deliver
production software systems. Knowledgeable in industrial engineering techniques and processes.
EDUCATION
Georgia Institute of Technology: Atlanta, GA
B.S. Computer Science - 5/2002
Major Specialization: Software Engineering
Georgia Institute of Technology G.P.A.: 3.01
University of Tennessee: Knoxville, TN
M.S. Industrial Engineering – Expected 5/2008
University of Tennessee Graduate G.P.A.: 3.45
PUBLICATIONS
"The ENGINeering Economic Analysis (ENGINEA) Software: Enhancing Teaching and Application of
Economic Analysis Techniques." Computers In Education Journal, October - December 2005, pages 32-
38.
AWARDS
Georgia Tech Dean's List, four terms
Governor's Scholarship, two years
Retained HOPE Scholarship for all semesters at Georgia Tech
RELATED COURSES
Georgia Tech: Software Engineering, Software Processes, Database Systems, Computer and Digital
Fundamentals, Modeling and Design, Control and Concurrency, Programming Language Concepts,
Systems and Networks, Computer Law, Real World Lab, Computer Science Theory, Computerization in
Society, Computer Graphics, Human/Computer Interaction, Information Security, Software
Applications
University of Tennessee: Engineering Economic Analysis, Operations Research, Statistical Methods
in Industrial Engineering, Lean Production Systems, Information Systems, Knowledge Management,
Productivity and Quality Engineering,
Technical Training Classes: Sun Java Web Services, Oracle Database Administrator, Cold Fusion
Development
COMPUTER SKILLS
Skilled in using the following technologies:
Security: Entrust PKI technologies, Sun Java Access Manager, Identity Manager, LDAP Directory,
RSA SecurID
Applications Development: Java, C, C++, SmallTalk, BASIC, Perl, Prolog, Lex/YACC, Oracle Forms,
Visual Basic, LUA, PDA application development
Web Development: Java Web Services, HTML, CSS, PHP, XML/XSL, Javascript, JSP, Tomcat, Apache,
IIS
Database Administration: Oracle DBMS, MySQL, MS SQL Server, MS Access
Graphical Development: OpenGL, Gimp, SDL, ClanLib, Blender
Operating Systems: Windows, Linux, UNIX, Solaris, DOS