Embed Size (px)
Citation preview
Techniques of Water-Resources Investigations
of the United States Geological Survey
Chapter A3
METHODS FOR ANALYSIS OF
ORGANIC SUBSTANCES IN WATER
By Donald F. Goerlitz and Eugene Brown
Book 5
LABORATORY ANALYSIS
DEPARTMENT OF THE INTERIOR
WILLIAM P. CLARK, Secretary
U.S. GEOLOGICAL SURVEY
Dallas L. Peck, Director
First printing 1972Second printing 1972Third printing 1984
UNITED STATES GOVERNMENT PRINTING OFFICE, WASHINGTON : 1984
For sale by the Distribution Branch, U.S. Geological Survey 604 South Pickert Street, Alexandria, VA 22304
PREFACEThe series of manuals on techniques describes procedures for planning and
executing specialized work in water-resources investigations. The material is grouped under major subject headings called books and further subdivided into sections and chapters. The unit of publication, the chapter, is limited to a narrow field of subject matter. This format permits flexibility in revision and publication as the need arises. Section A of Book 5 presents techniques used in water analysis.
Provisional drafts of chapters are distributed to field offices of the U.S. Geological Survey for their use. These drafts are subject to revision because of experience in use or because of advancement in knowledge, techniques, or equipment. After the technique described in a chapter is sufficiently developed, the chapter is published and is for sale by the U.S. Geological Survey, 604South Pickett Street, Alexandria, VA 22304.
in

CONTENTS
Preface..,-.-----..- - ______________________Abstract. ____________________________________
Part I, Sampling- __ ____________ _____________Sample preservation _,____.___ ___.___.__._References- __________-._______,-_-___--_--
Carbon, all forms. ____-________---____.____References..-,. __._ _________________
Chlorophylls- .__-__ __._„____,_____._____Extractive spectrophotometric method. __ References. ______..„__________________
Color. ___---_-_._____. __---__-_-_-__-__.Comparison method _ _ _ _ _ ______ ______
Extractable organic matter. _.-_._-__-____„_Oils and waxes. ______ _________________References _, _ _ _ _ _ _ _ _.„_„____ _ .. _
Methylene blue active substances- ___________Synthetic anionic detergents ____________
Nitrogen, ammonia. __________ ____________Distillation method. __________________References. _ . - ______________________
Nitrogen, nitrate, _______ __-___.___,___.,-Brucine method. ________ _ _ __________Reduction method. _ _ _ ________________
Page
III11234446
66888999
11111113131315151517
Part II, ArNitrog
RNitrog
DR
NitrogK
Oxyge
HPhenc
EPestic
Ii
InseclCI
Chlorpen
CChlor
(I
Chloime
(
Nitrogen, nitrate—Continued References. __ _ __________
Diazotization method- References. __________
Kjeldahl method _ Reference- ______
Oxygen demand, chemical (COD). . Dichromate oxidation method- References-, ________________
References.Pesticides—gas chromatographic analysis.
References. -__.____.__.________.___
Gas chromatographic method ___________References. _ __________________________
Chlorinated hydrocarbon insecticides in sus pended sediment and bottom material _____
Gas chromatographic method ___________Chlorinated phenoxy acid herbicides in water.
Gas chromatographic method ___________Reference _____________________________
Chlorinated phenoxy acid herbicides in sedi ment (tentative) ________________________
Gas chromatographic method ___________
Page
17171718181820
20202222242429303032
3333353539
3939
TABLES
1. Retention values for chlorinated hydrocarbon insecticides,.________________2. Retention values for phosphorothioate insecticides.________________________3. Retention values for methyl esters of chlorinated phenoxy acid herbicides.4. Insecticides in water: recovery of compounds added to surface-water samples.
Page
25
262632

METHODS FOR ANALYSIS OF ORGANIC SUBSTANCES IN WATER
By Donald F. Goerlirz and Eugene Brown
Abstract
This manual contains methods used by the U.S. Geo logical Survey for the determination of organic substances in water. Procedures are included for the following cate gories of organic substances: Organic carbon, chlorophylls, color, detergents, nitrogen, oils and waxes, oxygen demand (chemical), phenolic materials, herbicides, and insecti cides. Procedures are also given for the determination of chlorinated hydrocarbon insecticides, as well as chlorinated phenoxy acid herbicides, in sediment and bottom materials.
IntroductionThe yellow or brown color commonly associated
with natural water is often the result of the de composition of naturally occurring organic matter. The most abundant sources of this material in clude decaying vegetation, algae, and microscopic organisms. These substances are produced mostly on land and during runoff are flushed into the water, where complex biological processes con tinue. The role of natural organic substances in water processes is not very well understood. These compounds are known to aid in transport ing and solubilizing many trace elements and are important in weathering. Further, natural or ganic substances interact with both organic and inorganic pollutants.
In addition to organic matter from natural sources, increasing amounts are entering water as a direct and (or) indirect result of man's activities. Leading sources of this material are industrial and domestic waste, agriculture, urban runoff, mining, and watercraft. Foaming deter gents have been observed in water supplies. Fish kills have been caused by toxic chemicals and have been linked to nutrient-induced algae blooms, which deplete the dissolved oxygen.
Because of the myriad of sources from both pollution and natural processes, organic matter is present in almost all surface and ground waters and directly influences the water quality.
In reviewing water-quality reports, one may observe that although color, oxygen consumed (chemical oxygen demand), and other criteria for the analysis of organic substances are described in the introductory remarks, seldom are such data included in the tables of the report. These data are noticeably absent from past reports because such crude measurements did not appear to serve any meaningful purpose in explaining most water processes. The value of even the most primitive measurements of organic substances in water is apparent, considering the general awareness of man's effect on the environment and the imple mentation of programs to stem the tide of water pollution, lake eutrophication, and similar prob lems.
The purpose of this manual is to provide direc tions for collection and analysis of water samples containing organic substances as required by the Geological Survey in making water-quality in vestigations. This manual is an updating and compositing of the organic analytical methods contained in Geological Survey Water-Supply Paper 1454, "Methods for Collection and Analysis of Water Samples" (Rainwater and Thatcher, 1960). The intense activity in the field of organic analysis is providing new and improved methods, and as appropriate methods become available they will be added to this manual. All methods as written may be subjected to revision from time to time. Methods labeled as tentative are as sumed to be adequate but need further testing before final acceptance.
TECHNIQUES OF WATER-RESOURCES INVESTIGATIONS
Part I. SamplingRefer to Part I, Chapter Al of Book 5, for
information on site selection, frequency, field safety, and first aid. Before a proper sampling program can be initiated, the nature of the organic compounds sought must be considered. As a general rule, organic compounds having less than six carbon atoms are water soluble, whereas compounds with more than six carbons are not. This generalization must be applied with care, however, because the presence of hydroxyl or other polar sites on a molecule increases its solubility. Even very soluble compounds, how ever, may prefer to reside on organic-layered sediment. Further, some insoluble compounds may be suspended on the water surface. In sum mary, organic matter in a body of water may be distributed on the surface, in suspension, ad sorbed on suspended sediment, in bed materials, and (or) in solution.
Because of this wide and generally unpre dictable distribution of organic material in a body of water, the collection of a truly repre sentative sample requires a great deal of care and often requires the use of specialized sampling equipment. In most instances, samples for organic analysis are best collected with the same equipment and technique used for the collection of samples for suspended-sediment measure ments. The technique and equipment used in such measurements have been extensively stud ied, and they are discussed at length in one of a series of reports by the Inter-Agency Committee on Water Resources (1963) and, more recently, in a report by Guy and Norman (1970). When more elaborate equipment is not available, a simple weighted bottle may often be used for sampling wells, lakes, and slow-moving streams with little suspended sediment. Other available samplers have rubber gaskets and valving ar rangements that may either contaminate the sample or remove organics from the water by adsorption. Such devices as the DH-48, D-49, or the P-46 samplers, which are specially de signed to collect suspended-sediment samples from fast-moving streams at water velocity, must be modified for organic sample collection. Most importantly, all the neoprene gaskets must be replaced by inert plastic material, such as teflon, and oil must be eliminated from valves.
Organic substances on the water surface or incorporated in the bed material present very difficult sampling problems. Surface films may appear chronically or intermittently and most often come from accidental spills or seepage. Samples taken from the surface of a body of water, especially moving water, are almost im possible to evaluate. Quite often the samples must be related to the total volume of water, surface area, film area, and film thickness. At present, no universally acceptable surface sam plers are available, and investigators are required to fabricate their own. Floating hoops or rec tangles covered with clean metal foil which delineate an area and allow skimming a surface sample from calm water have been used with limited success. Other methods for collecting films and slicks from surface waters, such as "dustpan skimmers," absorbent cloths, and floor mops, have been used, but none have been satisfactory for general application. The method most often used for describing a problem area when surface films are involved is identification of the material, locating the source, and then estimating the amount entering the water.
A rational approach to site selection for sampling stream bottoms is also difficult. Fortu nately, bed-material samplers are available. Ideally, bottom material, including that which is moving by saltation, rolling, or otherwise drifting along the streambed, should be included. It is also desirable to collect the water from the 3 or 4 inches of flow immediately above the stream bottom. This is commonly called the "unsampled zone/' because it is not sampled by suspended- sediment samplers or most other water-sampling devices because of mechanical limitations.
Bed-material and suspended-sediment samplers may be obtained through the Federal Inter- Agency Project, U.S. Army Engineer District, St. Paul, Minn. One of these is the piston-type bed-material hand sampler BMH-53 for shallow water, and the other is the BM-54 or BM-60 bed-material sampler for deeper water. Both of these are constructed to prevent sample washout when raised to the surface. Bed-material samplers to sample at the interface are now under develop ment and should be available soon.
Most investigations are not concerned with surface or bottom material, but rather with that within the body of the water. Most of samples are
ANALYSIS OF ORGANIC SUBSTANCES IN WATER
collected from just beneath the surface of the stream to as near the bottom as the sampling apparatus will allow. Accurate samples are taken either by depth integration or at a number of points in a transverse cross section. For small streams, a depth-integrated sample or a point sample taken at a single transverse position located at the centroid of flow is usually adequate. Larger streams require selection of several verti cals at centroids of equal flow after careful and often extensive measurement. Depth-integrated samples may also be taken by the ETR (equal transit rate) method, at equally spaced points across the stream cross section. In collecting these samples, the sampler is lowered and raised at each sampling point in the same length of time (Guy and Norman, 1970). Lakes are sampled on three-dimensional grids consistent with the shape and depth of the water body. Wells may be sampled from the pump, provided the oils from the mechanism do not contaminate the sample, otherwise a bottle sampler should be used. Compositing samples in the field is not recom mended. Individual samples for compositing should be taken to the laboratory, where careful control can be maintained. Organic sediments and soils tend to cling to sample containers, and special precaution must be taken to avoid im proper handling.
Glass bottles are the most acceptable con tainers for collecting, transporting, and storing samples for organic analysis. Glass appears to be inert relative to organic materials and can with stand a rigorous cleaning procedure. Because organic materials are so plentiful in the environ ment, it is extremely difficult to collect samples free from extraneous contamination. Apparatus for sampling or processing samples must be scrupulously clean. Sample bottles, especially, must be free of contaminating materials. Boston round glass bottles of 1-liter capacity with sloping shoulders and narrow mouths are satis factory for most applications. The closure should be metal, preferably inert, and lined with teflon. This plastic is the only organic material that should be allowed to contact the sample.
AH sample bottles, whether new or used, must be cleaned before collecting organic samples, and . the following procedure is recommended: After washing in hot detergent solution and rinsing in warm tapwater, the bottles are rinsed in dilute
hydrochloric acid. Following a rinse in distilled water, the glass containers are put into an oven and heated at 300°C (Celsius) overnight. The teflon cap liners and the metal closures are washed in detergent. After rinsing with distilled water, the caps are set aside to air-dry. The liners are rinsed in dilute hydrochloric acid and then soaked in redistilled acetone for several hours and heated at 200°C overnight. When the heat treatments are completed, the bottles are removed from the oven and capped with the closure and teflon liner. The clean bottles are usually stored or shipped in a "duo-pak" container—a form- fitting expanded polystyrene case in a corrugated cardboard carton.
In actuality, the analysis begins with the collection of the sample. The sample must represent the body of water from which it was collected at the time it was taken. The importance of the sample to the final result cannot be over emphasized. If possible, an analyst or a person directly concerned with the particular study should collect the samples. Inexperienced per sonnel should never be allowed to collect samples unless they are very closely supervised. If pos sible, the principal investigator should give personal instruction on sample collection. In all instances, detailed printed instructions should accompany each set of sample bottles. The sam ple containers should always be sent from the lab oratory directly to the person taking the samples just before sampling. Extra or spare sample bottles should be actively inventoried and remain under the control of the laboratory.
Sample preservation
Most water samples for organic analysis must be protected from degradation. Provisions for refrigerating or otherwise preserving the sample should be available. Icing is the most ac ceptable method of preserving a sample, but it is not always possible. Timing of collection should be arranged so that the sample can reach the laboratory in a minimum of time. There is no single preservative that may be added to a sample for all forms of organic analysis, but each sample must be treated according to the analytical procedure to be performed. For the determina tions in this manual, the following general methods
488-959 O - 72 - 2
TECHNIQUES OF WATER-RESOURCES INVESTIGATIONS
of sample preservation should be used:
Oxygen demand, chemical: Add concentrated H2S04 (sp gr 1.84) at a rate of 2 milliliters (ml) per liter of sample.
Carbon, inorganic: Refrigerate at 4°C.Carbon, organic: Add concentrated H2SO4 at a
rate of 2 ml per liter of sample and refrigerate at 4°C.
Chlorophylls: Refrigerate at 4°C.Color: Refrigerate at 4°C.Oils and ivaxes: Add concentrated H2S04 until
the pH of the sample is below 3.0. Generally, 5 ml per liter will be sufficient.
Surfactants: Refrigerate at 4°C.Nitrogen: Add 40 milligrams (mg) of HgCl2
per liter of sample and refrigerate at 4°C.Phenolic material: Acidify sample to pH 4.0
with H3P04 , add 1.0 gram (g) CuSO4 -5H 20 per liter of sample, and refrigerate at 4°C.
Herbicides: Acidify with concentrated H2SO4 at a rate of 2 ml per liter of sample and refrigerate at 4°C.
Insecticides: None required for chlorinated compounds.
ReferencesGuy, H. P., and Norman, V. W., 1970, Field methods for
the measurement of fluvial sediments: U.S. Geol. Survey Techniques Water-Resources Inv., book 3, chap. C2, 59 p.
Rainwater, F. H., and Thatcher, L. L., 1960, Methods of collection and analysis of water samples; U.S. Geol. Survey Water-Supply Paper 1454, 301 p.
[U.S.] Inter-Agency Committee on Water Resources, 1963, A study of methods used in measurement and analysis of sediment loads in streams, in Determination of fluvial sediment discharge: Washington, U.S. Govt, Printing Office, Rept. 14, 151 p.
Part II. Analysis of samples
Carbon, all forms
The procedure given affords an accurate de termination of carbon in water in solution as well as in suspended matter. Both organic and inorganic carbon can be selectively measured. The organic carbon determination gives a much truer measure of the organic matter present in aqueous solution and (or) suspension than does
the chemical oxygen demand determination. This technique is not hampered by the presence of reducing substances or affected by the type of organic material being oxidized. It cannot, how ever, be used to replace the biological oxygen demand determination.
1. Summary of method
Using a microsyringe, a fraction of a milliliter of sample is injected into a combustion tube under a sweep of ox}^gen gas. All the carbon in the sample is converted to carbon dioxide and measured by use of a nondispersive infrared analyzer (Van Hall and others, 1963).
2. Application
Water containing carbon from about 1.0 mg/1 (milligram per liter) to 1,000 mg/1 may be analyzed directly. For a more sensitive procedure, the analyst is referred to the work of Menzel and Vaccaro (1964). Higher carbon concentrations must be diluted. Water containing organic particulate matter may be analyzed directly provided the largest particle diameter is f—| the syringe needle diameter. Otherwise, the particles must be reduced in size by homogenizing or blending, and the resulting suspension must be fairly uniform and stable.
Depending on the sample treatment, results should be reported as follows:
2.1 Total carbon: Sample analyzed without filtration or acidification,
2.2 Total organic carbon: Sample analyzed without filtration, but acidified and purged with inert gas to remove inorganic carbon.
2.3 Dissolved carbon: Sample analyzed after filtration, but without acidification.
2.4 Dissolved organic carbon: Sample ana lyzed after filtration and acidification and purging to remove inorganic carbon.
In addition to these reporting forms, concen trations of inorganic carbon (dissolved and suspended) and suspended carbon (organic and inorganic) may be computed by differences from the above measurements.
3. Interferences
Strongly acidic solutions and some brines interfere with this technique by producing infrared-absorbing fogs. Very volatile carbon
ANALYSIS OF ORGANIC SUBSTANCES IN WATER
compounds may be lost during carbonate elimina tion. Injections in excess of 0.08 ml result in incomplete combustion owing to the large volume increase associated with the water vaporization.
4. Apparatus
4.1 Carbonaceous analyzer, Bookman Model llf>-A, Model 915, or equivalent.
4.2 Ulicroh'ter syringe, 100-//1 (inicroliter) capacity with large-bore needle,
4.3 Micvofiltration apparatus: Use only silver metal filters having 0.45 /im (micrometer) maxi mum pore size, obtainable from Solas Flotronics. Filters should be heated at 300°0 overnight to remove organic matter.
5. Reagents
All reagents must be chocked for organic con tamination.
5.1 Carbonate-bicarbonate standard solution, 1.00 ml = 1.00 mg carbon: Dissolve 3.500 g sodium bicarbonate and 4.418 g sodium car bonate, both dried at 1Q5°C for 1 hr (hour), in carbon-free distilled water and dilute to 1,000 ml.
5.2 Hydrochloric acid, concentrated (sp gr 1.19).
5.3 Xilrogen gas, free of carbon dioxide and organic impurities.
5.4 Oj-ygen gas, free of carbon dioxide and organic impurities.
5.5 I'otassiwn hydrogen phthalate standard solution, 1.00 ml —1.00 mg carbon: Dissolve 2.128 g potassium hydrogen phthalate, primary standard grade, which has boon dried at 105°C for 1 hr, in carbon-free distilled water and dilute to l,00()ml.
6. Procedure
6.A Instrument standardization6.A.I Single-channel analyzer, Bockman
Model 115-A, or equivalent.6. A. 1.1 Prepare a series of standards
containing 5, 10, 20, 40, 60, and 80 rng/1 of carbon by dilution of the potassium hydrogen phthalate standard stock solution.
6.A.1.2 Successively introduce 20-^1 sam ples of the 20-mg/l standard into the carbona ceous analyzer until the response is reproducible. Allow the recorder to return to the original
baseline between injections. Run duplicate de terminations, at the lonst, for each standard and plot the milligrams per liter of carbon versus peak height measured from baseline on the recorder.
6.A.2 Dual-channel analyzer, Bockman Model 915, or equivalent.
6.A.2.1 Prepare a standard curve for the organic carbon channel of the analyzer as in stop 6.A.1 above.
6.A.2.2 Prepare a standard curve for the inorganic channel of the analyzer, using the same technique, by injection of standards prepared by dilution of the carbonate-bicarbonate stock stand ard.
6.B Analysis of samples6.B.I Single-channel analyzer
6.B.1.1 Depending on how the results are to be reported, the sample may be filtered and (or) acidified. If the sample is to be filtered through the metal membrane filter, the filtration must be done before acidification. Only enough filtrate for the determination need be collected.
6.B.1.2 Adjust the pH of the sample to 2 or below, using concentrated hydrochloric acid, and slowly bubble nitrogen gas through the solu tion for 3-5 min (minutes) to purge carbon dioxide.
G.B.I.3 Mix the sample well. Inject 20-80 jul of the sample into the combustion tube, using the same technique as for the standards. Record the peak heights from at least two determinations for each sample.
6.B.1.4 Prepare a blank from carbon-free distilled water and all the reagents used, and analyze the blank as the sample. If more than 1 percent of salts is present in the sample, the blank should be prepared similarly.
6.B.2 Dual-channel analyzer6.B.2.1 Depending on whether results are
desired for total or dissolved carbon, the sample may be injected untreated, or filtered through the 0.45-jum silver filter, but not acidified.
6.B.2.2 Make duplicate 20-/-J injections of each sample into each channel of the analyzer, using the same technique as in the preparation of the standard curves.
7. Calculations
7. A Single-channel analyzer7.A.I Concentrations of carbon, in milli
grams per liter, are obtained directly from ap-
6 TECHNIQUES OF WATER-RESOURCES INVESTIGATIONS
propriate standard curves, depending on the sample treatment used.
7.B Dual-channel analyzer7.B.I Concentrations of inorganic and in
organic-plus-organic carbon, in milligrams per liter, in each sample are obtained from the appropriate standard curves.
7.B.2 By difference, compute the concentra tion of organic carbon, in milligrams per liter, When this difference is small and the determined values are large, results should be verified. This may be done by injecting an acidified, nitrogen- purged sample into the high-temperature furnace to obtain a direct measure of organic carbon.
8. Report
Carbon concentrations are reported as follows: Less than 10 mg/1, one significant figure; 10 mg/I and above, two significant figures.
9. Precision
No precision data are available, but results are believed reproducible within ±1 mg/1 at the 100-mg/l level.
References
Beckman Instruments, Inc., 1966, Laboratory carbona ceous analyzer: Beckman Instructions 137879, Fuller- ton, Calif., 27 p.
———— 1968, Total organic carbon analyzer: Beckman In structions 81706-B, Fullerton, Calif., 34 p.
Menzel, D. W., and Vaccaro, R. F., 1964, The measure ment of dissolved organic and particulate carbon in seawater: Limnology and Oceanography, v. 9, p. 138-142.
Van Hall, C. E., Safranko, John, and Stenger, V. A., 1963, Rapid combustion method for the determination of organic substances in aqueous solutions: Anal. Chemistry, v. 35, p. 315-319.
Chlorophylls
The concentrations of photosynthetic pig ments in natural waters vary with time and with changing aquatic conditions. Chlorophyll a, b, and c concentrations are used to estimate the biomass and the photosynthetic capacity of phytoplankton. Ratios between the different forms of chlorophyll are thought to indicate the taxonomic composition or the physiological state of the algal community.
Extractive spectrophotometric method
1. Summary of method
Individual chlorophylls are determined simul taneously without elaborate separation. The sample is filtered, and the cells retained on the filter are mechanically disrupted to facilitate extraction of pigments into a solvent composed of 90 percent acetone and 10 percent water (volume per volume). The concentrations of chlorophylls are calculated from measurements of absorbance of the extract at 4 wavelengths, corrected for the 90-percent acetone blank.
2. Application
The method is suitable for all natural waters. The volume of water filtered should contain less than 10 jug (micrograms) chlorophyll a. (See step 6.1.)
3. Interferences
Large amounts of inorganic sediment in the sample may clog the filter. Erroneously high values may result from the presence of fragments of tree leaves or other terrestrial plant material.
The presence of phaeopigments, the decom position products of chlorophyll, results in over estimates of chlorophylls (Yentsch, 1965, 1969; Lorenzen, 1965, 1967).
4. Apparatus
4.1 Filtration equipment: Filter holder as sembly, Millipore XX63 001 20, or equivalent, and a source of vacuum.
4.2 (flass pestle-type tissue homogenize (grinder), 15-ml capacity, Corning 7725, or equivalent. Motor drive with low-torque clutch to operate at about 500 rpm (revolutions per minute).
4.3 Membrane Jilter, Millipore HAWP 047 00 type, HA 0.45-//m mean pore size, white, plain, 47-mm (millimeter) diameter, or equivalent.
4.4 Stving-out centrifuge, 4,000-5,000 gravity, with stoppered 15-ml graduated centrifuge tubes. Saveguard centrifuge, Model CT-1140, or equiv alent.
4.5 Spectrophotomeler (Beckman Model DU, or equivalent), with a bandwidth of 3 nm (na nometers) or less, allowing absorbance to be rend to ±0.001 units. Use cells with a light-path of from
ANALYSIS OF ORGANIC SUBSTANCES itf WATER
1 to 10 cm (centimeters). If only chlorophyll a is determined, instruments with interference filters with not more than 5-10 nm (Beckman Model B, or equivalent) half-bandwidth may be used.
4.6 Vacuum-pressure pump, Millipore XX60 000 00, or equivalent.
5, Reo gents
5.1 Acetone solution: To 900 ml acetone, add 100 ml distilled water.
5.2 Magnesium carbonate, powdered.
6. Procedure
6.1 Collect a sample of water which con tains less than 10 Mg, and preferably about 1 ^g, of chlorophyll a. A sample of 0.5-1.0 liter may be adequate for fresh or estuarine waters; 4-5 liters of ocean water may be required. Samples must be refrigerated at 4°C until time of analysis.
6.2 Cover the surface of a 0,45-/im membrane filter with finely powdered MgC03 , using about 10 mg/cm2 of filter area (about 170 mg for the 47-mm-diameter filter).
6.3 Filter the sample at no more than two- thirds atm (atmosphere).
6.4 Fold the filter with the plankton on the inside and proceed immediately with the extrac tion and measurement steps. If the sample must be stored, dry the filter in a silica gel desiccator in the dark at 1°C or less. Dry ice is recommended for storing samples in the field.
6.5 Place the filter in a glass homogenizer. Add 2 to 3 ml acetone solution. Grind 1 min (minute) at about 500 rpm.
6.6 Transfer to a graduated centrifuge tube and wash the pestle and homogenizer two or three times with acetone solution. Adjust the total volume to some convenient value, such as 5 or 10 ml dzO.l ml. Keep 10 min in the dark at room temperature.
6.7 Centrifuge for 10 min at 4,000 to 5,000 gravity.
6.8 Carefully pour or pipet the supernatant into the spectrophotometer cell. Do not disturb the precipitate. If extract is turbid, try to clear by adding a little 100-percent acetone or distilled water, or by recentrifuging.
6.9 Read the absorbance at 750, 663, 645, and 630 nm against an acetone-solution blank. (Dilute with acetone solution if the absorbance is
greater than 0.8.) If the 750-nm reading is greater than 0.005/cm light-path, reduce the turbidity as mentioned in step 6.8.
7. Calculations
Subtract the absorbance at 750 nm from the absorbance at 663, 645, and 630 nm. Divide the difference by the light-path of the cells, in centi meters. The concentrations of chlorophylls in the extract, as jug/ml (micrograms per milliliter), are given by the following equations:
chlorophyll a, in M= 11.646663-2.166645 + 0.106630
chlorophyll b, in Mg/ml= -3.94e663+20.97e645-3.66e63o
chlorophyll c, in
where:
absorbance at 663 nm _ _________—absorbance at 750 nm
light-path, in cm
absorbance at 645 nm _________— absorbance at 750 nm
light-path, in cm
6630 =
absorbance at 630 nm_____— absorbance at 750 nm
light-path, in cm
chlorophyll a, in Mg/1= chlorophyll a in Mg/ml
Xextract volume, in ml
sample volume, in liters
8. Report
Report chlorophyll concentrations as follows: Less than 1.0 Mg/1 (micrograms per liter), one decimal; 1.0 /ig/1 and above, two significant figures.
9. Precision
The precision of chlorophyll determinations is influenced by the volume of water filtered, the range of chloroph}'!! values encountered, the volume of extraction solvent, and the light-path of the spectrophotometer cells.
8 TECHNIQUES OF WATER-RESOURCES INVESTIGATIONS
The precision for chlorophyll a determination at the 5-//g level was reported to be ±5 percent in one study (Strickland and Parsons, 1960). The UNESCO (1966) report recommended that pre cision be determined by each analyst.
References
Lorenzen, C. J., 1965, A note on the chlorophyll and phaeophytin content of the chlorophyll maximum: Limnology and Oceanography, v. 10, p. 482-483.
———— 1967, Determination of chlorophyll and phaeo- pigments: Spectrophotometric equations: Limnology and Oceanography, v. 12, p. 343-346.
Strickland, J. D. H., and Parsons, T. R., 1960, A manual of sea-water analysis: Canada Fisheries Research Board Bull. 125, 185 p.
United Nations Educational, Scientific and Cultural Or ganization (UNESCO), 1966, Determination of photo- synthetic pigments in sea-water: Mon. Oceanog. Methodology 1, 69 p.
Yentsch, C. S., 1965, Distribution of chlorophyll and phaeophytin in the open ocean: Deep-Sea Research, v. 12, p. 653-666.
———— 1969, Methods for chemical analysis of fresh waters, in Golterman, H. L., (ed.), International Biological Programs Chemical Methods: Oxford, Blackwell Scientific Pubs., handb. 8, p. 114-119.
ColorThe color of water as considered herein is that
due only to substances in solution. Color in water may be of natural mineral, animal, or vegetable origin. It may be caused by metallic substances, humus material, peat, algae, weeds, or protozoa. Industrial wastes may also color water. Color may range from zero to several hundred units.
In domestic water, any noticeable color is un desirable. Color-imparting solutes may dull clothes or stain food and fixtures. The U.S. Public Health Service (1962) stated that the color shall not ex ceed 15 units in drinking and culinary water on carriers subject to Federal quarantine regula tions. Color is undesirable in water for many industries, particularly food processing, launder ing, ice manufacturing, bottled beverage, photo graphic, and textile (California State Water Quality Control Board, 1963).
Comparison method
1. Summary of method
The color of the water is compared with that of colored glass disks which have been calibrated
to correspond to the platinum-cobalt scale of Hazen (1892). The unit of color is that produced by 1 mg of platinum per liter. A small amount of cobalt is added to aid in color matching. The Hazen scale is satisfactory for most waters, but the hues and shades of some waters may not easily be compared with standards. If the hue of the water does not compare with that of the standard, there is very'little that can be done, other than to visually compare the optical densi ties of the sample and standard. Highly colored waters should not be diluted more than necessary because the color of the diluted sample often is not proportional to the dilution. The colored glass disks should be recalibrated at frequent intervals against platinum-cobalt standards, as their color may fade with time.
2. Application
This method may be used to measure the color of samples whose colors reasonably match the Hazen scale and which contain no excessive amount of suspended matter.
3. Interferences
Turbidity generally causes the observed color to be higher than the true color, but there is some disagreement as to the magnitude of the effect of turbidity. The removal of turbidity is a recurrent problem in the determination of color. Color is removed by adsorption on suspended material. Filtration of samples to remove turbidity fre quently removes some of the color-imparting solutes, possibly by adsorption on the sediments or on the filter medium. Centrifuging is preferable to filtration and is the only recommended method for the removal of suspended matter.
4. Apparatus
Color comparator, with standard color disks covering the range 0-500 color units.
5. Reagents
None.
6. Procedure
6.1 Remove turbidity by centrifuging the sample.
6.2 Fill one instrument tube with the sample of water, level the tube, insert the glass plug,
ANALYSIS OF ORGANIC SUBSTANCES IN WATER 9
making sure that no air bubbles are trapped, and insert the tube into the comparator.
6.3 Use distilled or demineralized water in the second tube as a blank.
6.4 The color comparison is made by re volving the disk until the colors of the two tubes match.
7. Calculations
The color is read directly from the matching color standard, and the proper dilution factor is applied.
8. Report
Keport color as follows:
Color unit
1-50-51-100_
101-250. 251-500.
Record units to nearest
..... 1
..._. 5.... 10
._.__ 20
9. Precision
Because of the many complicating factors in volved, the measurement of color is not a precise determination. No statements on the repro- ducibility of the tests can be made.
References
California State Water Quality Control Board, 1963, Water quality criteria: Pub. 3-A, p. 168.
Hazen, Alien, 1802, A new color standard for natural waters: Am. Chem. Soc. Jour., v. 12, o. 427.
U.S. Public Health Service, MI62, Drinking water stand ards: Public Health Service Pub. 956, p. 6.
Extractable organic matter
Oils and waxes
Oils and waxes in natural waters most likely come from vegetation and aquatic life. Oils or fats and waxes from plants and animals are, for the most part, of the ester type—that is, the combination of an alcohol with an organic acid. Petroleum oils and tars, otherwise known as mineral oils, are almost exclusively hydrocarbon in composition. Petroleum oils, on occasion, can enter the water from natural seeps but most often result from industrial pollution and accidental
spills (Dept. of Interior, Office of Secretary, 1968). Most oils are insoluble in water but may be dispersed by natural and waste chemicals such as soaps and detergents. Ester-type compounds can hydrolyze to become soluble, form soaps, and further aid dispersion of the insoluble material. Oils, greases, fats, and waxes can severely damage water quality by (1) producing a visible film on the surface, (2) imparting an odor to the water and causing a noxious taste, (3) coating the banks and bottoms of the water body by adsorbing on sediment, and (4) destroying aquatic life (Federal Water Pollution Control Administration, 1968).
1. Summary of method
Oils and waxes are removed from the water by extraction with organic solvents and are deter mined gravimetrically. This method is similar in principle to that found in "Standard Methods," 12th edition (Am. Public Health Assoc., 1965). For characterization, and for volatile substances, the analyst is referred to the papers by Kawahara (1969) and Maehler and Greenber (1968).
2. Application
The extraction method is applicable to the analysis of waters containing oil, fat, grease, wax, and other solvent-soluble substances.
3. Interferences
Organic solvents vary considerably in their ability to dissolve not only oily substances but other organic matter as well. The ester-type oils and waxes may be decomposed to alcohols and acids or soaps. Glycerine, the alcohol from animal or vegetable fats and oils which are known as triglycerides, defies extraction by this technique. Soaps must be acidified to release the organic part of the molecule. Storage of the sample must be avoided because many oils arc utilized by micro-organisms. Volatile compounds (boiling point <100°C) cannot be accurately determined by this method.
4. Apparatus
4.1 Kuderna-Danish concentration apparatus, 250-ml capacity. Use an ungraduated receiver and a 1-ball Snyder column.
4.2 Separatory funnel, 1-liter capacity, with unlubricated glass or teflon stopcock.
10 TECHNIQUES OF WATER-RESOURCES INVESTIGATIONS
5. Reagents
5.1 Chloroform, boiling range 61°-62°C, dis tilled in glass.
5.2 Petroleum ether, boiling range 30°-60°C, distilled in glass.
5.3 Sodium sulfate, anhydrous, ACS re agent, granular.
5.4 Sulfuric acid, 1:1 solution: Mix a volume of sulfuric acid (sp gr 1.84) with an equal volume of distilled water.
6. Procedure
Surface samples must be taken with great care. (See p. 2.) The relationship of the affected sur face to the body of water should be well docu mented. A complete written description of the sampling technique should be made for future reference. Samples of the water beneath the surface should be collected according to the recommended practice for organic samples. Usu ally 1-liter samples are sufficient for subsurface sampling.
6.1 Weigh the water and sample container with the cap removed. Pour the sample into the separatory funnel. Weigh the drained sample bottle and record the weight of the sample to three significant figures. (If an oil separation is observed, the weight of water may be obtained after a preliminary petroleum ether extraction before acidification.)
6.2 Rinse the sample bottle with 15 ml of petroleum ether and pour the washings into the separatory funnel. Rinse the sample bottle again with another 15 ml pf petroleum ether and pour the washings into the separatory funnel.
6.3 Acidify the sample by the addition of 5.0 ml of 1:1 H2S04 per liter of sample.
6.4 Shake the separatory funnel vigorously for 1-2 min, stopping to vent the pressure after the first few shakes. Allow the layers to separate for about 10 min. Draw off the water layer into the sample container and pour the solvent into a 125-ml erlenmeyer flask containing about 0.5 g anhydrous sodium sulfate. Difficult emulsions may be broken by shaking the funnel vigorously after most of the water has been withdrawn. Beware of excessive pressure buildup in the funnel at this step.
6.5 Pour the sample back into the separatory funnel. Rinse the sample bottle with 15 ml of
chloroform and add the washings to the separatory funnel. Pour an additional 15 ml of chloroform into the separatory funnel and shake 1-2 min. Allow the layers to separate. Collect the chloro form layer in the 125-ml erlenmeyer flask con taining the petroleum ether extract.
6.6 Filter the extract through a plug of ex tracted glass wool into a Kuderna-Danish ap paratus fitted with a tared (including a small boiling stone) receiver tube. Use liberal washings of petroleum ether to complete the transfer.
6.7 Remove the solvent by distillation on a steam bath and take nearly to dryness. As the last of the solvent is vaporizing, remove the apparatus from the heat and allow the vapor to condense and wash down the sides of the flask. After cooling, remove the receiver and volatilize the last of the solvent with a gentle stream of air or nitrogen gas.
6.8 Wipe the sides of the receiver tube with a moist tissue and allow to dry in the room for 30 min. Place the receiver in a desiccator for 30 min and then determine the weight of the sample.
7. Calculations
The concentration of material in the sample is calculated as follows:
Extractable organic matter (mg/1)
A-BX 1,000,
where
A = total weight (receiver+extract), in grams, B —receiver tare, in grams, and C —water sample volume, in liters.
The amount of material found in a surface sample may be related to an affected area provided the film is uniform. The weight of material per square meter of surface may be calculated as follows:
Extractable organic matter (mg/m2) = —A.
where
A =area sampled, in square meters (m2), and B = weight of extracted material, in milli
grams.
ANALYSIS OF ORGANIC SUBSTANCES IN WATER 11
8. Report
Concentrations of extractable organic matter are reported to two significant figures for values in excess of 10 mg/1, or to the nearest whole milligram.
9. Precision
The precision between samples depends upon the homogeneity of the dispersion and the volatility of the material. Duplicate results vary ing less than 5 percent from the mean have been obtained on prepared samples. Results from poorly dispersed material and surface film samples vary greatly.
References
American Public Health Association, 1965, Standard methods for the examination of water and waste- water [12th ed.]: New York, Am. Public Health Assoc., Inc., 769 p.
Kawahara, F, K., 1969, Laboratory guide for the identifica tion of petroleum products: Cincinnati, Federal Water Pollution Control Admin., 41 p.
Maehler, C. A., and Greenber, A. E., 1968, Identification of petroleum in estuarine waters: Am. Soc. Civil Eng. Proc., Jour. Sanitary Eng. Div., v. 94, No. SA5, p. %9-978.
[U.S.] Department of the Interior, Office of the Secre tary, 1968, Oil pollution; A report on pollution of the Nation's waters by oil and other hazardous sub stances: Washington, U.S. Govt. Printing Office, 31 p.
[U.S.] Federal Water Pollution Control Administration, 1968, Report of the committee on water-quality criteria: Washington, U.S. Govt. Printing Office, 234 p.
Methylene blue active substances
Synthetic anionic detergents
Methylene blue active substances (MBAS), synthetic detergents or surfactants, occur in natural waters almost exclusively as a result of pollution. Detergents in natural water can drastically alter the normal regimen. As surface- active agents, they disrupt the stability at the interface between water and other substances. In the presence of surfactants, normally insoluble organic compounds may be dispersed, and the function of vital membranes of aquatic organisms may be altered. Because they are water soluble, detergents can disperse toxic organic compounds normally incorporated in bottom muds, adsorbed
on sediment, or floating on the surface. In addi tion to acting synergistically to compound pollu tion problems, some detergents are toxic to certain aquatic life. According to the report of the Federal Water Pollution Control Adminis tration (1968) levels of LAS (linear alkylate sulfonates) exceeding 0.2 mg/1 may be harmful to aquatic life.
Three types of surface-active agents are in general use. They are classified by their chemical characteristics as anionic or cationic, indicating the charge of the active ions, and as nonionic hydrophilic organic compounds. Fortunately, anionic detergents react with cationic detergents to precipitate. Production of anionic detergents has greatly exceeded the other two, and, conse quently, greater amounts of anionic detergents may be expected in waste water. Owing to this excess, cationic detergents are almost always effectively precipitated and seldom appear in solution in sewage treatment facilities. Synthetic nonionic detergents, alkyl or aryl polyols, have not caused much concern because their use has been limited principally to industrial applications and as a minor additive in household detergents for foam control.
Until 1965, ABS (alkyl benzene sulfonates) anionic detergents were the most common surfactants on the market. Because ABS resist biological degradation, they are not easily re moved by waste treatment and were often found in water supplies, even drinking water. Since then, LAS (linear alkyl sulfonates), for the most part, have replaced ABS in detergent formulation because LAS surfactants are biodegradable and may be removed from waste water by ordinary treatment.
Both ABS and LAS are methylene blue active substances but are not identical in color produc tion for spectrophotometric determination. Owing to this, methylene blue active substances are measured in units relative to an ABS standard.
1. Summary of method
Methylene blue reacts with anionic surfactants, both ABS and LAS, to form a blue-colored dye complex. The complex is extracted in chloroform, and the methylene blue active substances are de termined spectrophotometrically. This method is similar in substance to "Standard Methods/' 12th edition (Am. Public Health Assoc., 1965).
488-959 O - 72 - 3
12 TECHNIQUES OF WATER-RESOURCES INVESTIGATIONS
2. Application
This method is applicable to the analysis of waters containing 0.025-100 mg/1 MBAS (meth- ylene blue active substances relative to ABS standard).
3. Interferences
Phenols, proteins, and inorganic chlorides, cyanates, nitrates, and thiocyanates will complex methylene blue and give positive interference in the determination. With ABS concentrations from 0.0 to 1.0 mg/1, tests have shown no inter ference from the following individual constituents: 10 mg/1 N02 , 25 mg/1 NO3 , 5 mg/1 phenol, and 1 mg/1 H_S. Organic compounds having amine groups cause low results.
4. Apparatus
4.1 Separatory funnels, 500-ml, unlubricated glass or teflon stopcock.
4.2 Spedrophotometer, Beckman Model B, or equivalent.
With this instrument the following conditions have been used:
Wavelength._.._.._________._-„___ 635 nm.Cells_----_---------_------------- 10mm.Phototube.__.___...___-._____--___ Red-sensitive.Initial sensitivity setting ____________ 2.Slit width._______________________ 0.2mm.Blank___,_____________„__________ CHC1S.
With these operating conditions, the following absorbances have been observed:
MBAS (as ABS) Absorbance (mg)
0,01 _......„.........__....„ 0.052.02____.____.__-__-__-_______ .150.05........-......-..-...---. -438.10...______________________ .870
5. Reagents
5.1 Chloroform, spectrophotometric grade.5.2 Detergent (ABS) standard solution I:
Dissolve 1.030 g 97.1-percent-purity ABS powder (obtained from Association American Soap and Glycerine Producers, Inc., 295 Madison Ave., New York, N. Y. 10010, and dried over H 2SO^ for 1 week) in 500 ml distilled water in a 1,000-ml volumetric flask with gentle swirling. Allow the foam to break and dilute to volume. Refrigerate during storage.
5.3 Detergent standard solution II, 1.00 ml = 0.010 mg ABS: Dilute 10.0 ml detergent standard solution I to 1,000 ml. Prepare fresh weekly.
5.4 Methylene blue reagent: Dissolve 0.35 g methylene blue in O.OLV sulfuric acid and dilute to 1,000 ml with same.
5.5 Sulfuric acid solution, 5A': Mix 245 ml concentrated H 2S04 (sp gr 1.84) in 500 ml water and, after c'ooling, dilute to 1,000 ml.
6. Procedure
Samples should be collected according to the recommended practice for organic analysis. Usu ally a 1-liter sample is adequate. LAS detergents are biodegradable; therefore samples should be analyzed as soon as possible after collection. All glassware should be rinsed with dilute hydro chloric acid after washing. As a further precau tion, sample bottles, separatory funnels, and beakers may be heat treated at 300°C overnight to remove organic matter.
6.1 Measure a volume of sample containing less than 0.10 mg MBAS and not to exceed 100 ml into separatory funnel. Dilute to 100 ml if necessary. Prepare a blank and detergent stand ards in the same manner.
6.2 Adjust the pH of the sample to near neutral if necessary. To the sample, blank, and standard solution, add 1.0 ml 5A~ H 2S04 , mix, then add 5.0 ml methylene blue solution. Mix thoroughly.
6.3 Add 25.0 ml chloroform and shake the contents of the separatory funnel for 1 min. Allow the layers to separate.
6.4 Drain the lower chloroform layer through a layer of absorbent cotton contained in a small filtering funnel into 1.0-cm cells and measure the absorbance of the sample and standards against the blank at a wavelength of 655 nm.
7. Calculations
Determine the amount of detergent contained in the sample, minus the blank, from the standard curve. Calculate the amount of MBAS in the sample using the following equation:
MBAS (relative to ABS standard) mg/I
mg MBAS
ml sampleX 1,000
ANALYSIS OF ORGANIC SUBSTANCES IN WATER 13
8. Report
Report synthetic anionic detergents concentra tions as follows: Less than 1 mg/1, two decimals; greater than 1 mg/1, two vsignificant figures.
9. Precision
Deviation of ±10 percent may be expected in the range of 1-5 mg/1 in surface water.
References
American Public Health Association, 11)05, Standard methods for the examination of water and wastewater [12th ed.]: New York, Am. Public Health Assoc., Inc., 769 p.
[U.S.] Federal Water Pollution Control Administration, 1968, Report of the committee on water-quality criteria: Washington, U.S. Govt. Printing Office, 234 p.
Nitrogen, ammonia
Ammonia nitrogen includes nitrogen in the forms of NH3 and NH4 +1 . As a component of the nitrogen cycle, it is often present in water, but usually in only small amounts. Ammonia is used in some water-treatment processes. More than 0.1 mg/1 usually indicates organic pollution (Rudolph, 1931).
There is no evidence that ammonia nitrogen in water is physiologically significant to man or livestock. Fish, however, cannot tolerate large quantities. The toxicity to fish is directly related to the amount of free ammonia in solution; hence, the toxicity is dependent on the pH of the water. Ammonia decreases the ability of hemoglobin to combine with oxygen, and the fish suffocate. Al though the tolerances of fish differ, 2.5 ml/1 of ammonia nitrogen is considered harmful in the 7.4-8.5 pH range (Ellis and others, 1948).
The low concentrations of ammonia in natural waters are of little industrial significance, except that ammonium salts are destructive to concrete.
Distillation method
1. Summary of method
The sample is buffered to a pH of 9.5 to mini mize hydrolysis of organic nitrogen compounds. Ammonia is distilled from the buffered solution,
and an aliquot of the distillate is then Nesslerized. Essentially, Nesslerization is the reaction between potassium mercuric iodide and ammonia which forms a red-brown complex of mercuric ammono- basic iodide:
*Hg(NH a)I+2KI + HI.
Concentrations of ammonia are then determined by standard spectrophotometric measurements. Alternatively, the distillate may be titrated with standard sulfuric acid solution.
Additional information on the principle of the determination is given by Kolthoff and Sandell (1952, p. 633) and by Blaedel and Meloche (1963).
2. Application
This method is recommended for analysis of samples containing less than 2 mg of ammonia and ammonium ion per liter. Higher concentra tions may be determined by the alternate titra- tion procedure provided.
3. Interferences
Calcium, magnesium, iron, and sulfide interfere with the Nesslerization, but the interference of the metals is eliminated by the distillation, and sulfide can be precipitated in the distillation flask with a little lead carbonate.
Some organic compounds may distill over with the ammonia and form colors with Nessler re agent which cannot be satisfactorily read with the spectrophotometer. Under such conditions, the sample should be distilled into H3B03 and titrated with standard H 2SO4 .
4. Apparatus
4.1 Kjeldahl distillation apparatus, 1,000-ml flasks.
4.2 Spectrophotometer, Beckman Model B, or equivalent.
With this instrument, the following operating conditions have been used:
Wavelength __ _____________ 425 nm.Cells__, ___________________ 40 mm.Phototube. __.._--_._..._,_ Blue-sensitive. Initial sensitivity setting _ _ _ _ 1.Slit width. _..„__..__..._-. 0.3 mm.Blank. . _-__--_._-_______,_ Ammonia-free water
plus reagents.
14 TECHNIQUES OF WATER-RESOURCES INVESTIGATIONS
With these operating conditions, the following absorbances have been observed:
\itrogen (mg}
0.02___.
.06.
.10.
Absorbance
0.24.47.70
1.16
5. Reagents
5.1 Ammonium chloride standard solution I, 1.00 ml-1.00 mg N: Dissolve 3.819 g NH4C1, dried overnight over sulfuric acid, in ammonia- free water and dilute to 1,000 ml.
5.2 Ammonium chloride standard solution II, 1.00 ml= 0.010 mg N: Dilute 10.00 ml ammonium chloride standard solution I to 1,000 ml with ammonia-free water. Prepare fresh.
5.3 Borate buffer solution: Dissolve 9.54 g Na2B 407'10H20 in ammonia-free water. Adjust the pH to 9.5 with IM NaOH (approx 15 ml) and dilute to 1 liter with ammonia-free water.
5.4 Boric acid solution: Dissolve 20 g H3BO3 in ammonia-free water and dilute to 1 liter.
5.5 Methyl red indicator solution: Dissolve 0.1 g methyl red indicator in 100 ml ethanol.
5.6 Xessler reagent (CAUTION: HgI 2 is a deadly poison, and the reagent must be so marked): Dissolve 100 g HgI 2 and 70 g KI in a small volume of ammonia-free water. Add this mixture slowly, with stirring, to a cooled solution of 160 g NaOH in 500 ml ammonia-free water and dilute to 1 liter. Allow the reagent to stand at least overnight and filter through a fritted-glass crucible.
5.7 Sodium carbonate solution, 0.0357 A': Dis solve 1.892 g primary standard Na^COs in carbon dioxide free water and dilute to 1,000 ml.
5.8 Sodium hydroxide solution, LI/: Dissolve 40 g NaOH in ammonia-free water and dilute to 1 liter.
5.9 Sulfuric acid standard solution, 0.0357A', 1.00 ml = 0.5 mg X: Mix 1.3 ml concentrated H 2SOi (sp gr 1.84) with demineralized water and dilute to 950 ml before standardization. Stand ardize by titrating 25.0 ml 0.0357A' Na,CO3 to pH 4.5.
6. Procedure
If acid has been added to the sample as a preservative at the time of collection, this must
be neutralized with NaOH solution before pro ceeding with the analysis. All glassware should be rinsed with ammonia-free water, prepared by passing distilled water through a mixed-bed ion- exchange resin.
6.1 Free the distillation apparatus of am monia by boiling ammonia-free water until the distillate shows no trace using Nessler reagent (CAUTION: Deadly poison).
6.2 Measure a volume of sample containing less than 1.0 mg ammonia nitrogen (500 ml maximum) into a 600-ml beaker, and adjust the volume to approximately 500 ml with ammonia- free water.
6.3 Add 25 ml borate buffer solution and adjust the pH to 9.5 with IM NaOH, if necessary.
6.4 Immediately transfer the solution into the distillation flask and distill at a rate of 6-10 ml per minute; catch the distillate in a 500-ml volumetric flask containing 50 ml boric acid solution. The tip of the delivery tube must be below the surface of the boric acid.
6.5 Collect approximately 250 ml of dis tillate, dilute to 500 ml with ammonia-free water, and mix.
6.6.A Xesslerization procedure6.6.A.I Pipet an aliquot of distillate contain
ing less than 0.1 mg ammonia nitrogen (50.00 ml maximum) into a graduate, and adjust the volume to 50.0 ml with ammonia-free water.
6.6.A.2 Prepare a blank of ammonia-free water and sufficient standards. Add 5 ml boric acid solution to each, and adjust the volumes to 50.0 ml.
6.6.A.3 Add 1.0 ml Nessler reagent (CAU TION: Deadly poison), and mix.
6.6.A.4 Allow the solutions to stand at least 10 min, but not over 30 min.
6.6.A.5 Determine absorbance of test sample and standards against the blank.
6.6.B Titration procedure6.6.B.I To the distillate, and an ammonia-
free water blank containing the same volume of H3B03 , add 3 drops methyl red indicator solution, :md titrate with sulfuric acid standard solution.
7. Calculations
7.A Xesslerization procedure7.A.I Determine mg N in aliquot from a plot
of absorbances of standards.
ANALYSIS OF ORGANIC SUBSTANCES IN WATER 15
7.A.2 Ammonia nitrogen as N, in mg/1
1,000 500= ————— X —~Tr~—— Xmg N in aliquot, ml sample ml aliquot
7.B Titration procedure7.B.1 Ammonia nitrogen as N, in mg/1
where
V.
ya = ml standard H 2S()4 used in titration ofsample minus ml used to titrate blank,
Ntt = normality of standard H^SO-i, and V 8 = m\ of original sample used for distillation.
7.C Ammonia nitrogen as NH 4+1 , in mg/I = mg/1 as NX 1.288. Ammonia nitrogen as free NH3 , in mg/1 = mg/1 as NX 1.216.
8. Report
Report ammonia nitrogen concentrations as follows: Less than 1 mg/1, two decimals; 1 mg/1 and above, two significant figures.
9. Precision
No precision data are available.
References
Blaedel, W. J., and Meloche, V. W., 1963, Elementary quantitative analysis—Theory and practice [2d ed.]: New York, Harper & Row, 826 p.
Ellis, M. M., Westfall, B. A.j and Ellis, M. D., 1948, Determination of water quality: U.S. Fish Wildlife Service Research Kept. 9, 122 p.
Kolthoff, I. M., and Sandell, E. B., 1952, Textbook of quantitative inorganic analysis [3d ed.]: New York, Macmillan Co., 759 p.
Rudolph, Z., 1931, Principles of the determination of the physical and chemical standards of water for drink ing, industrial, and domestic purposes: Water Pollu tion Abs, 4 [March],
few tenths to several hundred milligrams per liter, but in unpolluted water they seldom exceed 10 mg/1. Nitrate and chloride are major compo nents of human and animal wastes, and abnor mally high concentrations of both suggest pollution.
Cyanosis due to methemoglobinemia may occur in infants whose drinking or formula water contains a high concentration of nitrates. The nitrates, when ingested, are converted to nitrites in the digestive system of some infants. The nitrite ion oxidizes hemoglobin to methemoglobin and thereby causes cyanosis. It is widely recom mended that water containing more than 10-20 mg/1 of nitrate nitrogen should not be used in infant feeding (Comly, 1945).
Nitrates in large amounts are injurious to the dyeing of wool and silk and are undesirable in fermentation processes (California State Water Quality Control Board, 1963). At least 2 mg/1 of nitrate prevents intercrystalline cracking of steel in steam boilers.
Brucine method
1. Summary of method
The reaction between the alkaloid, brucine, and nitrate in acid medium produces a yellow color that may be measured by standard spectro- photometric procedures. Close attention must be given to procedural technique if accuracy and precision are to be obtained. The procedure is similar to that of Jenkins and Medsker (1964).
2. Application
This method may be applied to essentially colorless water containing up to 5.0 mg of nitrate per liter. Any significant amount of color should be removed. Samples containing higher concen trations must be diluted.
Nitrogen, nitrate
Nitrate is usually the most prevalent form of nitrogen in water because it is the end product of the aerobic decomposition of organic nitrogen. Nitrate from natural sources is attributed to the oxidation of nitrogen of the air by bacteria and to the decomposition of organic material in the soil. Fertilizers may add nitrate directly to water resources. Nitrate concentrations range from a
3. Interferences
Organic color, nitrite ion, and all strong oxidizing and reducing agents interfere. The interference by residual chlorine up to 5 mg/1 may be eliminated by addition of sodium arsenite, and interference of up to 1 mg/1 of nitrite elimi nated by use of sulfanilic acid. The interference by chloride is effectively masked by the addition of a large amount of chloride ion to the reaction mixture.
16 TECHNIQUES OF WATER-RESOURCES INVESTIGATIONS
4. Apparatus
4.1 Water bath, boiling.4.2 Spectrophotometer, Beckman Model B, or
equivalent.With this instrument, the following operating
conditions have been used:
Wavelength...____._.___--__.__ 410 nm.Cells..-._---____------_-------- 23 mm.Phototube-_._____-._-_._-._..-_ Blue-sensitive.Initial sensitivity setting, _______ 2.Slit width (approximate)___-__.__ 0.10 mm.
With these operating conditions, the following absorbances have been observed:
NO3(mg)
0.005. .010. .020, .030. .040. .050.
. I bsorbn nee
0.115.220.440.640.800.950
5. Reagents
5.1 Brucine-sulfanilic acid reagent: Dissolve 1 g brucine sulfate (CAUTION: Very poisonous) and 0.1 g sulfanilic acid in 70 ml hot demineralized water. Add 3 ml concentrated HC1 (sp gr 1.19), cool, and dilute to 100 ml. This solution is stable for several months. The pink color that develops does not affect its usefulness.
5.2 Nitrate standard solution I, 1.00 ml = 1.00 mg N03 : Dissolve 1.631 g KNO3 , dried overnight over concentrated H^SO-i, in demineralized water and dilute to 1,000 ml.
5.3 Nitrate standard solution II, 1.00 ml = 0.010 mg NO3 : Dilute 10.0 ml nitrate standard solution I to 1,000 ml with demineralized water.
5.4 Sodium chloride solution: Dissolve 300 g NaCl in 1 liter demineralized water.
5.5 Sulfuric acid, 29Ar : Add 500 ml concen trated H2SC>4 (sp gr 1.84) to 125 ml demineralized water.
6. Procedure
6.1 Pipet a volume of sample containing less than 0.05 mg NO3 (10.0 ml maximum) into a 23-mm absorption cell and dilute to 10.0 ml.
6.2 Prepare a demineralized-water blank and sufficient standards and adjust the volume of each to 10.0 ml.
6.3 Add 2.0 ml sodium chloride solution, and mix well by swirling.
6.4 Place the absorption tubes into a cold- water bath (15°-20°C) and add 10.0 ml 29N HsSOa. Mix well by swirling, return to cold-water bath, and allow the contents of the tubes to cool to water-bath temperature.
6.5 Add 0.5 ml brucine-sulfanilic acid solu tion and mix thoroughly.
NOTE.—If a deep-pink color forms immediately upon addition of the brucine-sulfanilic acid re agent, it is an indication of a high nitrate con centration—exceeding the range of the method. Such sample aliquots must be discarded at this point and the samples reanalyzed, using a smaller aliquot.
6.6 Remove the rack of tubes from the cold- water bath and place in a boiling-water bath for 20 min. The water bath must be sufficiently large so that boiling does not cease when the tubes are placed in it. This step is critical. All tubes must be heated uniformly.
6.7 Remove the tubes from the boiling-water bath and immerse them in the cold-water bath. Allow to cool before proceeding. This inhibits any further color change. The cold-water bath must be sufficiently large to cool all tubes uniformly. Circulation of water in the bath is desirable.
6.8 Determine the absorbance of the sample and standards against the blank within 1 hr.
7. Calculations
7.1 Determine the mg NO3 in the sample from n plot of absorbances of standards.
1 0007.2 N03 in mg/I= —.-——— Xmg NO3 in
ml sample
sample.7.3 To convert NO3 to N, multiply by 0.2259.
8. Report
Report NO3 concent rations us follows: Loss than 10 mg/1, one decimal; 10 mg/1 and above, two significant figures.
9. Precision
Single-laboratory analysis of two test samples resulted in mean values of 0.9 tind 2.9 mg/1, and standard deviations of 0.09 and 0.11 mg/1, respectively.
ANALYSIS OF ORGANIC SUBSTANCES IN WATER 17
Reduction method
Samples containing more than 30 mg/1 of NOs"1 may be analyzed by reduction using Devarda's alloy, distillation of the resulting NHs, and titration with standard H 2S04 solution. Details of the procedure are given by Blaedel and Meloche (1963) and by Kolthoff and Sandell (1952). For high concentrations of nitrate, the method yields results which are comparable in accuracy to those obtained by the brucine method.
References
Blaedel, W. J., arid Meloche, V. Wv 1963, Elementaryquantitative analysis—Theory and practice [2d ed.]:New York, Harper & Row, 826 p.
California State Water Quality Control Board, 1963, Waterquality criteria: Pub. 3-A, p. 226.
Comly, H. H., 1945, Cyanosis in infants caused by nitratesin well water: Am, Med. Assoc* Jour., v. 129.
Jenkins, D., and Medsker, L. L., 1964, Brucine methodfor determination of nitrate in ocean, estuarine, andfresh waters: Anal, Chemistry, v. 36, p, 610.
Kolthoff, I. M., and Sandell, E. B., 1952, Textbook ofquantitative inorganic analysis [3d ed.]: New York,Macmillan Co., 759 p.
Nitrogen, nitrite
Nitrite is unstable in the presence of oxygen and is, therefore, absent or present in only minute quantities in most natural waters under aerobic conditions. The presence of nitrite in water is sometimes an indication of organic pollution.
Recommended tolerances of nitrite in domestic water supplies differ widely. A generally accepted limit is 2 mg/1, but as little as 0.1 mg/1 has been proposed (California State Water Quality Control Board, 1963). Nitrite is undesirable in water used in dyeing wool and silk and in brewing.
Diazotization method
1. Summary of method
Nitrite is diazotized with sulfanilamide, and the resulting diazo compound is coupled with 1-naphthylethylenediamine dihydrochloride to form an intensely colored red dye (Rider and Mellon, 1945). The absorbance of the dye is proportional to the amount of nitrite present (Fishman and others, 1964).
2. Application
This method may be applied to samples con taining less than 4 mg nitrite per liter. Samples containing higher concentrations must first be diluted.
3. Interferences
None of the substances commonly occurring in natural water interferes with this method.
4. Apparatus
Spectropliotometer, Beckman Model B, or equivalent.
With this instrument, the following operating conditions have been used:
Wavelength......_..._._.._.... 535 nm.Cells-. „_-.-__-_..-___...--____ 10 mm.Phototube,._____.---____--.____ Blue-sensitive. Initial sensitivity setting__..__--__ 2.Slit width. _..____.____-__.___--.. 0.08 mm.
With these operating conditions, the following absorbances have been observed.
NO*(mg)
0.05, .10. .15. .20.
Absorbance
0.531.061.592.04
5. Reagents
5.1 Formic acirf, 87-90 percent.5.2 1-naphthylethylenediamine dihydrochloride
solution: Dissolve 0.5 g 1-naphthylethylene diamine dihydrochloride in 100 ml demineralized water. Store in refrigerator.
5.3 Xitriie standard solution I, 1.00 ml = 1.00 mg NO 2 : Dissolve 1.850 KNO2 in demineralized water and dilute to 1,000 ml.
5.4 Nitrite standard solution II, LOO ml = 0.010 mg N02 : Dilute 10.0 ml nitrite standard solution I to 1,000 ml with demineralized water.
5.5 Sulfanilamide solution: Dissolve 0.5 g sulfanilamide in 100 ml demineralized water.
6. Procedure
6.1 Pipet a volume of sample containing less than 0.20 mg N02 (50.0 ml maximum) into a 100-ml volumetric flask and adjust the volume to 50 ml with demineralized water.
18 TECHNIQUES OF WATER-RESOURCES INVESTIGATIONS
6.2 In a similar manner, prepare a blank and sufficient standards containing 0,00-0.20 mg N0 2 , and adjust the volume of each to 50 ml with demineralized water. Place in ice bath and allow to cool for about 2 min.
6.3 Add successively, while in the ice bath, and mixing thoroughly after each addition: 1.0 ml sulfanilamide solution, 4.0 ml formic acid, and 1,0 ml 1-naphthylethylenediamine dihydro- chloride solution.
6.4 Remove the flasks from the ice bath and allow at least 15 min for maximum color develop ment. Adjust each to exact volume with de- mineralized water. Mix thoroughly and measure the absorbance of samples and standards against the blank.
7. Calculations
7.1 Determine the mg N0 2 in the test samples from a plot of absorbances of standards.
7.2 N02 inmg/l =1,000
Xmg N02 inml aliquot
sample.7.3 To convert N0 2 to N, multiply by 0.3043.
8. Report
Report NO 2 concentrations as follows: Less than 1.0 mg/1, two decimals; LO mg/1 and above, two significant figures.
9. Precision
Xo precision data are available.
References
California State Water Quality Control Board, 1963, Water quality criteria: Pub. 3~A, p. 226.
Fishman, M. J-, Skougstad, M. W., and Scarbro, G. F., 1964, Diaxotixation method for nitrate and nitrite: Am. Water Works Assoc. Jour., v. 56, p. 633.
Rider, B. F., and Mellon, M. G., 1945, Colorimetric de termination of nitrites: Indus. Eng. Chemistry, Anal. Ed., v. 18, p. 76.
Nitrogen, organic
Organic nitrogen includes all nitrogenous or ganic compounds, such as amino acid, poly- peptides, and proteins. It is present naturally in all surface waters as the result of inflow of nitroge nous products from the watershed and the normal biological life of the stream. Effluents of sewage
and waste from slaughter houses and chemical plants often contain nitrogen in varying com binations. Organic nitrogen in unpolluted ground water is usually very low.
Organic nitrogen is not pathologically signifi cant but is sometimes an indication of pollution. Organic nitrogen is important to considerations involving aquatic biology.
KjeJdoh! method
1. Summary of method
Organic nitrogen is degraded to the ammonium ion by digestion with sulfuric acid in the presence of copper sulfate, which acts as a catalyst. The solution is made alkaline with sodium hydroxide, and the free ammonia is distilled off and Nessler- ized, The color developed is proportional to the organic nitrogen content.
Additional information on the principle of the determination is given by Kolthoff and Sandell (1952, p. 537).
2. Application
This method may be applied to most natural water containing less than 2 mg of nitrogen per liter. Higher concentrations must be reduced by dilution.
3. Interferences
Nitrate and nitrite do not interfere. The effect of ammonium ions and ammonia is strictly additive. Therefore, the organic nitrogen is normally determined on the residue of the am monia nitrogen determination.
Calcium, magnesium, iron, and sulfide interfere with the Nesslerization, but the interference of the metals is eliminated by the distillation. Sulfides interfere and must be precipitated in the distillation flask with a little lead carbonate be fore addition of sodium hydroxide.
Some organic compounds may distill over with the ammonia and form colors with Nessler re agent which cannot be satisfactorily read with the spectrophotometer. Under such conditions, the sample should be distilled into H3BO3 and titrated with standard H^SOj.
4. Apparatus
4.1 Kjeldald distillation apparatus, 1,000-ml flasks.
ANALYSIS OF ORGANIC SUBSTANCES IN WATER 19
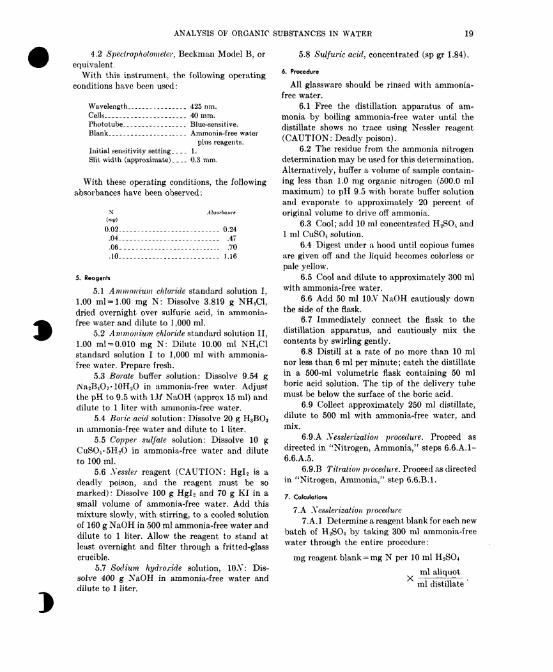
4.2 Spectrophotometer, Beckman Model B, or equivalent.
With this instrument, the following operating conditions have been used:
Wavelength__________,_„_„_ 425 nm.Cells...-.._.._...._...._.. 40 mm.Phototube^______--_..___,._ Blue-sensitive.Blank.._.__.___..._...._-_ Ammonia-free water
plus reagents.Initial sensitivity setting. . . _ 1. Slit width (approximate) ____ 0.3 mm.
With these operating conditions, the following absorbances have been observed:
N(mg)
0.02_ .04. .06. .10-
Absorbance
0.24.47.70
1.16
5. Reagents
5.1 Ammonium chloride standard solution I, 1.00 ml-1.00 mg N: Dissolve 3.819 g NHiCl, dried overnight over sulfuric acid, in ammonia- free water and dilute to 1,000 ml.
5.2 Ammonium chloride standard solution II, LOO ml = 0.010 mg N: Dilute 10,00 ml NH4C1 standard solution I to 1,000 ml with ammonia- free water. Prepare fresh.
5.3 Borate buffer solution: Dissolve 9.54 g l\a2B407'10H20 in ammonia-free water. Adjust the pH to 9.5 with \M NaOH (approx 15 ml) and dilute to 1 liter with ammonia-free water.
5.4 Boric acid solution: Dissolve 20 g H3B03 in ammonia-free water and dilute to 1 liter.
5.5 Copper sulfate solution: Dissolve 10 g CuSO4 -5H 20 in ammonia-free water and dilute to 100 ml.
5.6 Xessler reagent (CAUTION: HgI2 is a deadly poison, and the reagent must be so marked): Dissolve 100 g HgI2 and 70 g KI in a small volume of ammonia-free water. Add this mixture slowly, with stirring, to a cooled solution of 160 g NaOH in 500 ml ammonia-free water and dilute to 1 liter. Allow the reagent to stand at least overnight and filter through a fritted-glass crucible.
5.7 Sodium hydroxide solution, 10A': Dis solve 400 g NaOH in ammonia-free water and dilute to 1 liter.
5.8 Sulfuric aczV/, concentrated (sp gr 1.84).
6. Procedure
All glassware should be rinsed with ammonia- free water.
6.1 Free the distillation apparatus of am monia by boiling ammonia-free water until the distillate shows no trace using Nessler reagent (CAUTION: Deadly poison).
6.2 The residue from the ammonia nitrogen determination may be used for this determination. Alternatively, buffer a volume of sample contain ing less than 1.0 mg organic nitrogen (500.0 ml maximum) to pH 9.5 with borate buffer solution and evaporate to approximately 20 percent of original volume to drive off ammonia.
6.3 Cool; add 10 ml concentrated H 2S04 and 1 ml CuS04 solution.
6.4 Digest under a hood until copious fumes are given off and the liquid becomes colorless or pale yellow.
6.5 Cool and dilute to approximately 300 ml with ammonia-free water.
6.6 Add 50 ml 10.V NaOH cautiously down the side of the flask,
6.7 Immediately connect the flask to the distillation apparatus, and cautiously mix the contents by swirling gently.
6.8 Distill at a rate of no more than 10 ml nor less than 6 ml per minute; catch the distillate in a 500-ml volumetric flask containing 50 ml boric acid solution. The tip of the delivery tube must be below the surface of the boric acid.
6.9 Collect approximately 250 ml distillate, dilute to 500 ml with ammonia-free water, and mix.
6.9.A Xesslerization procedure. Proceed as directed in "Nitrogen, Ammonia/' steps 6.6.A.1- 6.6.A.5.
6.9.B Titration procedure. Proceed as directed in "Nitrogen, Ammonia/' step 6.6.B.I.
7. Calculation*
7.A Xesslerization procedure7.A.I Determine a reagent blank for each new
batch of H 2S04 by taking 300 ml ammonia-free water through the entire procedure:
mg reagent blank = mg N per 10 ml H 2SO4
ml aliquotX
ml distillate
20 TECHNIQUES OF WATER-RESOURCES INVESTIGATIONS
7.A.2 Determine the mg N in the aliquot from a plot of absorbances of standards.
7.A.3 Organic nitrogen as N, in mg/1
1,000 500
ml sample ml aliquot
X[(mg N in aliquot) —(mg reagent blank)]. 7.B Titmtion procedure
7.B.I Ammonia nitrogen as N, in mg/1
Va X X X 14,000V.
where
Fn = ml standard H 2SOi used in titration ofsample minus ml used to titrate blank,
X« = normality of standard H 2$O4 , and t r * = ml of original sample used for distillation.
7.C Ammonia nitrogen as NH l+l , in mg/l = mg/1 as NX 1.288.
Ammonia nitrogen as free NH;J , in mg/l = mg/1 as NX 1.216.
8. Report
Report organic nitrogen concentrations as follows; Less than LO mg/1, two decimals; 1 mg/1 and above, two significant figures.
9. Precision
No precision data are available.
Reference
Kolthoff, I. M., and Sandell, 10. B., 1952, Textbook of quantitative inorganic analysis |3d ed.j: New York, Macmillan Co., 759 p.
Oxygen demand, chemical (COD)
The oxygen-demand determination is a measure of the readily oxidizable material in the water, and it furnishes an approximation of the minimum amount of organic and reducing material present. In reality, the term "chemical oxygen demand" is defined by the method used for its determina tion. In the method given below it is defined as the amount of oxygen used by the sample when refluxed 2 hr with an excess of acid-potassium dichromate solution. The determined value may correlate with natural-water color or with car
bonaceous organic pollution from sewage or in dustrial wastes.
Normal, unpolluted river waters generally have a COD from about 10 to 30 mg/1; mildly polluted river waters, 25 to 50 mg/1; and domestic sewage about 250 mg/1 (It. C. Kroner, written commun., 1970).
Tolerances for oxygen-demand values in feed water for low- and high-pressure boilers are 15 and 3 mg/1, respectively. Wash water containing more than 8 mg/1 has been reported to impart a bad odor to textiles; concentrations for water used in beverages and brewing range from 0.5 to 5.0 mg/1 (California State Water Quality Control Board, 1963).
Dichromate oxidation method
1. Summary of method
Organic and other oxidizable material is oxi dized by refiuxing with standard acid-dichromate solution in the presence of silver sulfate catalyst. The excess dichromate is titrated with standard ferrous ammonium sulfate, using orthophenan- throline ferrous complex as indicator (American Society for Testing and Materials, 1968).
2. Application
This method can be used for analysis of natural waters and industrial wastes containing less than 2,000 mg/I chloride ion and more than 50 mg/1 chemical oxygen demand (COD). Samples con taining less than this amount should be analyzed as directed in step 6.9. COD values for waters containing more than 2,000 mg/1 of chloride ion should be corrected as indicated in step 6.10.
3. Interferences
Reducing substances such as ferrous iron and chlorides interfere since they are oxidized. Chlorides constitute by far the largest and most common interference, being quantitatively oxi dized by dichromate in acid solution. One mg/1 C 1 !- 1 is equivalent to 0.226 mg/1 COD. To elimi nate chloride interference, mercuric sulfate is added to the sample to form a soluble mercuric chloride complex.
Care should be taken to prevent heating of the samph1 during addition of reagents to minimize loss of volatile constituents.
ANALYSIS OF ORGANIC SUBSTANCES IN WATER 21
4. Apparatus
4.1 Reflujr apparatus consisting of a 500-ml erlenmeyer flask and water-cooled condenser, with ground-glass joints and made of heat- resistant glass.
4.2 Hot plate or heating mantle.
5. Reagents
5.1 Ferrous ammonium sulfate standard solu tion, 0.2500.Y: Dissolve 98.0 g FeSO^(KH 4) 2S04 - 6H 20 in demineralized water. Add 20 ml concen trated H 2S04 , cool, and dilute to 1 liter. To standardize, dilute 25.0 ml standard 0.2500.Y K 2Cr2O7 solution to 250 ml. Add 20 ml concen trated H 2S04 and cool. Titrate with the ferrous ammonium sulfate solution, using 8-10 drops Ferroin indicator. The solution must be stand ardized daily, or before use.
5.2 Mercuric sulfate, powdered HgS04 .5.3 Orthophenanthroline ferrous sulfate (Fer
roin) indicator solution: Dissolve 1.48 g 1,10- (ortho)-phenanthroline monohydrate and 0.70 g FeSO,-7H 20 in 100 ml of water. The prepared indicator is available commercially.
5.4 Potassium dichromate standard solution, 0.2500A': Dissolve 12.259 g K 2 Cr,O7 primary standard, dried for 2 hr at 100°C, in demineralized water and dilute to 1,000 ml.
5.5 Silver sulfate, powder,5.6 Sulfuric acid, concentrated (sp gr 1.84).
6. Procedure
6.1 Pipet 50,0 ml of sample or a smaller aliquot diluted to 50.0 ml into the reflux flask and add slowly, over a period of 2-3 min, 1 g HgSO4 ; allow to stand 5 min, swirling frequently.
6.2 Add 1 g Ag.:S04 and a few glass beads that have been ignited at 600°C for 1 hr.
6.3 Cool in ice water and add 75 ml concen trated H 2SOj, slowly enough, with mixing, to present appreciable solution heating with the consequent loss of volatile constituents.
6.4 Add 25.0 ml 0.2500A7 K 2 Cr2O 7 solution and mix thoroughly by swirling.
6.5 Attach flask to condenser, start water flow, and reflux for 2 hr.
NOTE.—If contents are not well mixed, super heating may result, and the contents of the flask may be blown out of the open end of the con denser.
6.6 Allow flask to cool, and wash down con denser with 25 ml water.
6.7 Dilute to 300 ml with demineralized water, cool to room temperature, and titrate the excess dichromate with 0.2500A' ferrous am monium sulfate solution, using 8-10 drops Ferroin indicator solution. The end point is a sharp change from blue green to reddish brown.
6.8 A demineralized-water blank is carried through all steps of the procedure with each group of samples.
6.9 Samples containing less than 50.0 mg/1 COD should be reanalyzed, using 0.025.Y solu tions of potassium dichromate and ferrous ammonium sulfate. A sample size should be selected so that no more than half the dichromate is reduced. A further increase in sensitivity may be obtained by evaporating a larger sample to 150 ml in the presence of all reagents. A blank should be treated in a similar manner.
6.10 To obtain more accurate COD values for samples containing more than 2,000 mg/1 of chloride ion, the following procedure may be used (Burns and Marshall, 1965). A series of chloride solutions are analyzed by the procedure indicated above, except that 10 mg of HgS04 is added to each solution for each milligram of chloride ion present instead of a constant l~g quantity. The chloride concentrations should range from 2,000 mg/1 to 20,000 mg/1, with the concentration interval not exceeding 4,000 mg/1. Plot the COD values obtained versus milligrams per liter chloride. From this curve, COD values may be obtained for any desired chloride concentration. This value is subtracted as a correction factor to obtain the COD value of a sample.
7. Calculations
Calculate the COD in each sample as follows:
7.1 For samples not requiring chloride cor rection:
COD, in mg/1 =(a-6)cX8,000
ml sample
7.2 For samples requiring chloride correction :
sample
22 TECHNIQUES OF WATER-RESOURCES INVESTIGATIONS
\vhere:
COD = chemical oxygen demand from di-chromate,
a = ml ferrous ammonium sulfate forblank,
b = ml ferrous ammonium sulfate forsample,
c = normality ferrous ammonium sulfate, c/ = chloride correction value from graph
of chloride concentration versus COD,and
1.20 = empirical compensation factor.
8. Report
Report COD as follows: Less than 10 mg/1, whole numbers; 10 mg/1 and above, two signifi cant figures.
9. Precision
No precision data are available. The general precision of COD determinations has been re viewed by the Analytical Reference Service of the U.S. Public Health Service (1965).
References
American Society for Testing and Materials, 1968, Water; atmospheric analysis, pt. 23 of 1968 Book of stand ards: Philadelphia, Am. Soc. Testing Materials, p. 244.
Burns, E. R., and Marshall, C., 1965, Correction for chloride interference in the chemical oxygen demand test: Water Pollution Control Federation Jour., v. 37, p. 1716.
California State Water Quality Control Board, 1963, Water quality criteria: Pub. 3-A, p. 233.
U.S. Public Health Service, 1965, Water oxygen demand no. 2: Public Health Service Study 21, Pub. 999-WP-26.
Phenolic materialPhenolic material in water resources is usually
a result of pollution from oil refineries, coke plants, and from chemical manufacture. Mixed phenolic wastes at 0.02-0.15 mg/1 levels in water cause tainting of fish flesh. Low concentrations of phenol impart a very disagreeable taste to drink ing water. Reported thresholds of taste and odor range from 0.01 to 0.1 Mg/1- Chlorination produces an even more disagreeable taste and odor by re acting with the phenols to form chlorophenols. Concentrations of phonolic material up to 1,000 Mg/1 are not believed toxic to animals, but 5.0
Mg/1 is harmful to many fish (Federal Water Pollution Control Administration, 1968).
1. Summary of method
The steam-distillable phenols react with 4-ami- noantipyrine at pH lO.OrtO.2 in the presence of potassium ferricyanide to form a colored anti- pyrine dye. This dye is extracted from aqueous solution with chloroform, and the absorbance is measured at a wavelength of 460 nm. The con centration of phenolic compounds is expressed as micrograms per liter of phenol (C6H5OH). This method is similar in principle to, but different in detail from, ASTM Method D 1783-62 (1969, p. 515-521).
2. Application
This method may be used to analyze waters containing from 0.0 to 1,000 Mg/1 of phenolic material.
3. Interferences
Other phenolic compounds, as determined by this method, may produce less color than an equivalent amount of phenol itself. The introduc tion of substituent groups to the benzene nucleus of phenol lowers the sensitivity of the particular compound to color formation. The composition of various phenolic compounds which may be present in a given water sample is unpredictable. Phenol itself, therefore, has been selected as the standard for reference. Using this basis, the amount of phenol determined represents the minimum con centration of phonolic compounds present in the sample.
Certain bacteria, oxidizing and reducing sub stances, and highly alkaline waste waters may interfere with this method. Information for re moval of major interference may be found in ASTM Method D 1783-62 (1969, p. 515-521).
4. Apparatus
4.1 Distillation apparatus, nil glass, consisting of a 1-liter Pyrex distilling apparatus and a water-cooled condenser.
4.2 Funnels, Buchner type with fritted-glass disk (15-ml Corning 36060, or equivalent).
4.3 Photometer, spectrophotometer or filter photometer suitable for use at a wavelength setting to 460 nm, and accommodating cells having light paths of 1.0 and 10 cm.
ANALYSIS OF ORGANIC SUBSTANCES JN WATER 23
4.4 pH meter, glass electrode.4.5 Separator^ funnels, 1-liter capacity,
Squibb type, with unlubrieated glass or teflon stopcock.
5. Reagents
All reagents must be prepared with phenol-free distilled water. De-ionized water is usually not satisfactory.
5.1 Aminoantipyriue solution; Dissolve 2.0 g 4-aminoantipyrine in distilled water and dilute to 100 ml. This solution is not stable for storage and should be prepared each day of use.
5.2 Ammonium chloride solution: Dissolve 20 g of reagent-grade ammonium chloride in water and dilute to 1 liter.
5.3 Ammonium hydroxide, concentrated (sp gr 0.90), ACS reagent grade.
5.4 Chloroform, spectrophotometric grade.5.5 Copper sulfate solution: Dissolve 100 g of
CuS04 '5H 20 in water and dilute to 1 liter.5.6 Phenol standard solution, 1.00 ml = 1.00
mg phenol: Dissolve 1.00 g analytical reagent phenol in 1,000 ml freshly boiled and cooled dis tilled water. Solution may be used for up to 1 month.
5.7 Phosphoric acid solution: Dilute 10 ml 85-percent H3P04 to 100 ml with distilled water.
5.8 Potassium ferricyanide solution: Dissolve 8.0 g K3Fe(CN) 6 in water, dilute to 100 ml, and filter. This solution is not stable and should be prepared each day of use.
5.9 Sodium sulfate, anhydrous, ACS reagent grade, granular.
6. Procedure
Samples should be collected according to the recommended practice for organic samples. Sam ples must be preserved with 10 ml of copper sulfate and 2 ml of phosphoric acid solution. A sealed glass ampoule of the preservative, with instructions, should accompany the sample con tainer. A 1-liter sample should be collected for each analysis. Samples should be protected from light and analyzed as soon as possible. The analyst is referred to "Standard Methods/' 12th edition (Am. Public Health Assoc., 1965), for the analysis of very alkaline or highly polluted water.
6.1 Measure 500 nil of the sample into a beaker. Determine the pH and adjust below 4.0
if necessary. (Add 5.0 ml of copper sulfate solu tion if for any reason it was not added at sam pling.) Transfer the solution to the distillation apparatus, add boiling stones, and set for dis tillation. Collect 450 ml of distillate and stop. Add 50 ml of distilled water to the residue and proceed with the distillation until 500 ml of distillate is collected..
6.2 Prepare a 500-ml distilled-water blank. Also prepare 500-ml standards containing 5, 10, 20, 30, 40, and 50 Mg of phenol, using the standard phenol solution.
6.3 Treat the sample, blank, and standards as follows: Add 10,00 ml ammonium chloride solu tion and adjust the pH to 10.0±0.2 with concen trated ammonium hydroxide. Transfer the solu tion to a 1-liter separatory funnel, add 3.00 ml of aminoantipyrine solution, mix, add 3.00 ml of potassium ferricyanide solution, and again mix. Allow the color to develop for 3 min, and a clear to light-yellow solution should result.
6.4 Add 25.0 ml chloroform for 1- and 5-cm cells and 50.0 ml for 10-cm cells. Shake the separatory funnel vigorously for 1 min. Allow the layers to separate and repeat the shaking.
6.5 After the layers have separated, draw off the lower chloroform layer and filter through a 5-g layer of sodium sulfate, using the sintered glass funnel, directly into the appropriate ab sorption cell. Avoid working in a draft to reduce evaporation of the solvent.
6.6 Measure the absorbance of the sample and standards against the blank at a wavelength of 460 nm. Prepare a calibration curve plotting absorbance against micrograms of phenol.
7. Calculations
where
A B
Phenol Oig/l)=-Xl,000,D
= iug phenol measured, and= ml of the original sample used.
8. Report
Report phenolic material concentration for less than 100 jug/1 to the nearest whole microgram, and greater than 100 pig/1 to two significant figures.
9. Precision
Precision at 5 mg/1 for phenol only is ±5 per cent but is variable for other phenolic materials.
24 TECHNIQUES OF WATER.RESOURCES INVESTIGATIONS
Because of interferences and because it is only a relative measure, the result should be considered as a minimum value.
References
American Public Health Association, 1965, Standard methods for the examination of water and waste- water [12th ed.]: New York, Am. Public Health Assoc., Inc., 769 p.
American Society for Testing and Materials, 1969, Water; atmospheric analysis, pt. 23 of J969 Book of stand ards: Philadelphia, 1032 p.
[U.S.] Federal Water Pollution Control Administration, 1968, Report of the committee on water-quality criteria: Washington, U.S. Govt. Printing Office, 234 p.
Pesticides—Gas chromatographic analysis
The term "pesticide" encompasses a broad class of toxicants used to control insects, mites, fungi, weeds, aquatic plants, and undesirable animals. More specific designations include such terms as insecticides, miticides, fungicides, herbi cides, and rodenticides.
Synthetic organic pesticides have introduced a far-reaching technological advance in the control of pests. Although the compound DDT (dichloro- diphenyltrichloroethane) was first synthesized in 1874, its insecticidal properties were not dis covered until 60 years later. Since the introduc tion of synthetic chemical pesticides in the United States, annual production has reached 1 billion pounds. There are almost 60,000 pesticides formulations registered, and each contains at least one of approximately 800 different pesticide compounds (Simmons, 1969).
With the increased concern by noted world ecologists over the effects of toxic pesticides on the environment, efforts are being made to substi tute more specific, fast-acting, and easily de- gradable compounds for the chlorinated hydro carbon pesticides. These pesticides were developed for general application and have proved to be very resistant to environmental degradation.
1. Summary of method
Prepared extracts of water or sediment are analyzed for pesticides by gas chromatography.
The technique of gas chromatography is most useful for qualitative and quantitative analysis of multicomponent mixtures. Small volumes of ex tract, as little as 1 jj, are injected into the gas chromatograph, where the components are sepa rated and detected. The separation of vaporized material takes place in the chromatographic column as it is carried along by a fiow of inert gas. Actual separations occur as the component vapors partition between the vapor phase and a non volatile stationary liquid incorporated in the column. Each component, according to its physi cal and chemical properties, enters and leaves the stationary liquid at a unique rate. Because this partitioning is occurring between a moving vapor and a stationary liquid, components injected at one end of a column emerge from the other end at different times.
Several different devices are available for de tecting and measuring pesticides as they emerge from the column. The electron-capture detector is highly sensitive, responding to as little as 0.1 pg (picogram) of lindano, and is used extensively for detecting the presence of pesticides in water. Other somewhat less sensitive detectors, such as microcoulometric and flame photometric, are used in pesticide analysis because they respond only to specific elements incorporated -in the pesticide molecules, and thus aid identification. There arc numerous books and papers on the analysis of pesticides by gas chromatography. One such treatment is "Pesticide Residue Analysis Hand book" (Bonelli, 1965). The book, "A Programmed Introduction to Gas-liquid Chromatography" (Pattison, 1969), is a good source for beginning gas chromatographers.
2. Application
Organic insecticides and herbicides which are volatile or can be made volatile for gas chromato- graphic purposes may be analyzed by this tech nique.
3. Interferences
The most .seriously interfering substances for chlorinated pesticide analysis are halogcnated organic compounds, such as "polychlorinated biphenyls" from industrial waste. Any compound or compounds having chemical properties similar to the pesticides of interest may cause inter-
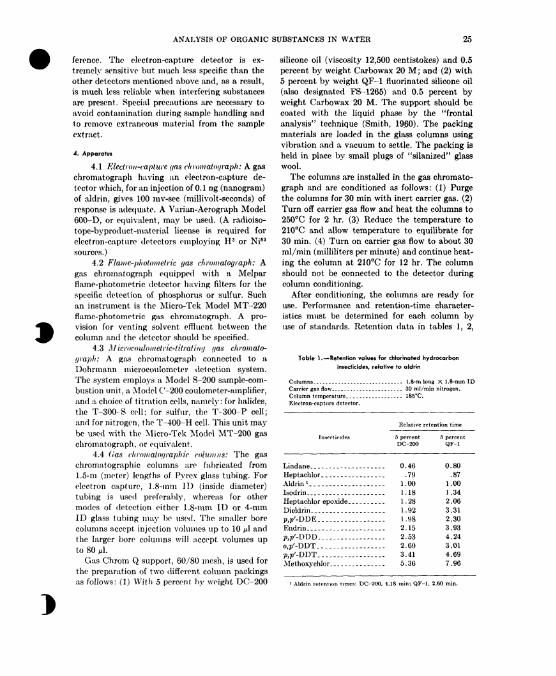
ANALYSIS OF ORGANIC SUBSTANCES IN WATER 25
ference. The electron-capture detector is ex tremely sensitive but much less specific than the other detectors mentioned above and, as a result, is much less reliable when interfering substances are present. Special precautions are necessary to avoid contamination during sample handling and to remove extraneous material from the sample extract.
4. Apparatus
4.1 Electron-rapture yds cttromatoyraph: A gas chromatograph having an electron-capture de tector which, for an injection of 0.1 ng (nanogram) of aldrin, gives 100 mv-sec (millivolt-seconds) of response is adequate. A Varian-Aerograph Model 600-D, or equivalent, may be used. (A radioiso- tope-byproduct-matcriiil license is required for electron-capture detectors employing H 3 or Ni63 sources.)
4.2 Flame-photometric (/as chromatograph: A gas chromatograph equipped with a Melpar flame-photometric detector having filters for the specific detection of phosphorus or sulfur. Such an instrument is the Micro-Tek Model MT-220 flame-photometric gas chromatograph. A pro vision for venting solvent effluent between the column and the detector should be specified.
4.3 Microcoulometric-titratinij (/as chromato- yraph: A gas chromatograph connected to a Dohrmann microcoulometer detection system. The system employs a Model S-200 sample-com bustion unit, a Model C-200 coulometer-amplifier, and a choice of titration cells, namely: for halides, the T-300-S cell; for sulfur, the T-300-P cell; and for nitrogen, the T-400-H cell. This unit may be used with the Micro-Tek Model MT-200 gas chromatograph, or equivalent.
4.4 (ras chroinaloyraplric columns: The gas chromatographic columns are fabricated from 1.5-m (meter) lengths of Pyrex glass tubing. For electron capture, 1.8-mm ID (inside diameter) tubing is used preferably, whereas for other modes of detection either 1.8-mm ID or 4-mm ID glass tubing may be used. The smaller bore columns accept injection volumes up to 10 M! and the larger bore columns will accept volumes up to 80 /xl.
Gas Chrom Q support, 60/80 mesh, is used for the preparation of two different column packings as follows: (1) With 5 percent by weight DC-200
silicone oil (viscosity 12,500 centistokes) and 0.5 percent by weight Carbowax 20 M; and (2) with 5 percent by weight QF-1 fluorinated silicone oil (also designated FS-1265) and 0.5 percent by weight Carbowax 20 M. The support should be coated with the liquid phase by the "frontal analysis" technique (Smith, I960). The packing materials are loaded in the glass columns using vibration and a vacuum to settle. The packing is held in place by small plugs of "silanized" glass wool.
The columns are installed in the gas chromato graph and are conditioned as follows: (1) Purge the columns for 30 min with inert carrier gas. (2) Turn off carrier gas flow and heat the columns to 250°C for 2 hr. (3) Reduce the temperature to 210°C and allow temperature to equilibrate for 30 min. (4) Turn on carrier gas flow to about 30 ml/min (milliliters per minute) and continue heat ing the column at 210°C for 12 hr. The column should not be connected to the detector during column conditioning.
After conditioning, the columns are ready for use. Performance and retention-time character istics must be determined for each column by use of standards. Retention data in tables 1, 2,
Table 1.—Retention values for chlorinated hydrocarbon insecticides, relative to aldrin
Columns.-__.-__------------_-------- 1.8-m long X 1.8-mm IDCarrier gas flow..„___..____________.__ 30 ml/min nitrogen.Column temperature.. ._._._......__.. 185°C.Electron-capture detector.
Relative retention time
Insecticides
Lindane. - _ _ . _ , _ _..
Aldrin 1 ...-.............
Heptachlor epoxide. .__._.Dieldrin ____.__,__-___-.p,p'-DDE. ----.--------.
p,p'-DDD_.-. ... --------o,p'-DDT._ .............p,p'-DDT... .---------_.Methoxychlor, .._..--.-.
5 percent DC-200
0.46
791 001.181 . 281.921.982.152.532.693.415.36
5 percent QF-1
0.80
.871.001.342.063.312.303.934.243.014.697.96
i Aldrin retention times: DC-200, 4.18 min; QF-1, 2.00 min.
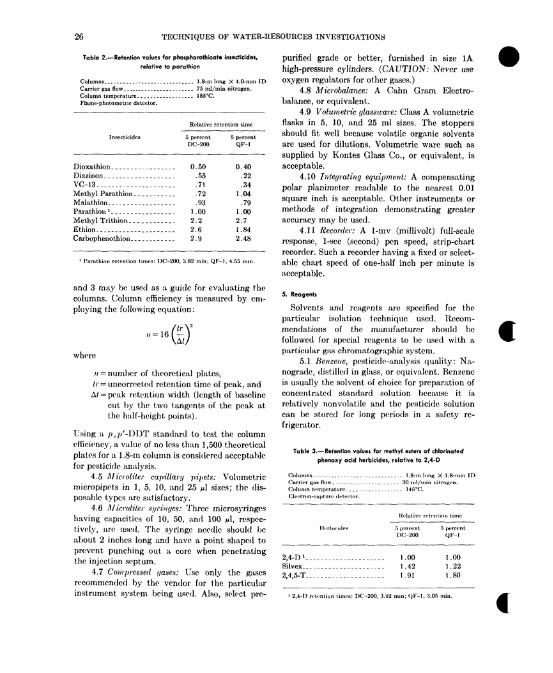
26 TECHNIQUES OF WATER-RESOURCES INVESTIGATIONS
Table 2.—Retention values for phosphorothioate insecticides, relative to parathion
Columns...._.._..-..__..--..__..__.. 1.8-m long X 4.0-mm IDCarrier gas flow. ______________________ 75 ml/min nitrogen.Column temperature....___..,..._____. 185°C.Flame-photometric detector.
Relative retention time
Insecticides
Dioxathion ,_______-__-__Diazinon __ _ _ _ _ ________VC-13----.---- -_...-._.Methyl Parathion ________Malathion_ _ ____ ______Parathion 1 __..__ _______Methyl Trithion _________Ethion__._______ ______Carbophenothion_ ________
5 percent DC-200
0.50
.55
.71
.72
.931.002.22.62.9
5 percent QF-1
0.40
.22
.34
1.04.79
1.002.71.842.48
1 Parathion retention times: DC-200, 3.82 min; QF-1, 4.55 mm.
and 3 may be used as a guide for evaluating the columns. Column efficiency is measured by em ploying the following equation:
where
n — number of theoretical plates, fr = uncorrected retention time of peak, and
A/ = peak retention width (length of baseline cut by the two tangents of the peak at the half-height points).
Using a ;>,//-DDT standard to test the column efficiency, a value of no less than 1,500 theoretical plates for a 1.8-m column is considered acceptable for pesticide analysis.
4.5 Microliter capillary pipets: Volumetric micropipets in 1, 5, 10, and 25 /_! sizes; the dis posable types are satisfactory.
4.6 Idicroliter syringes: Three microsyringes having capacities of 10, 50, and 100 p\, respec tively, are used. The syringe needle should be about 2 inches long and have a point shaped to prevent punching out a core when penetrating the injection septum.
4.7 Compressed gases: Use only the gases recommended by the vendor for the particular instrument system being used. Also, select pre-
purified grade or better, furnished in size 1A high-pressure cylinders. (CAUTION; Never use oxygen regulators for other gases.)
4.8 Microbalance: A Cahn Gram Electro- balance, or equivalent.
4.9 Volumetric glassware: Class A volumetric flasks in 5, 10, and 25 ml sizes. The stoppers should fit well because volatile organic solvents are used for dilutions. Volumetric ware such as supplied by Kontes Glass Co., or equivalent, is acceptable.
4.10 Integrating equipment: A compensating polar planimeter readable to the nearest 0,01 square inch is acceptable. Other instruments or methods of integration demonstrating greater accuracy may be used.
4.11 Recorder: A 1-mv (millivolt) full-scale response, 1-sec (second) pen speed, strip-chart recorder. Such a recorder having a fixed or select able chart speed of one-half inch per minute is acceptable.
5. Reagents
Solvents and reagents are specified for the particular isolation technique used. Recom mendations of the manufacturer should be followed for special reagents to be used with a particular gas chromatographic system.
5.1 Benzene, pesticide-analysis quality: Na- nograde, distilled in glass, or equivalent. Benzene is usually the solvent of choice for preparation of concentrated standard solution because it is relatively nonvolatile and the pesticide solution can be stored for long periods in a safety re frigerator.
Table 3.—Retention values for methyl esters of chlorinated phenoxy acid herbicides, relative to 2,4-D
Columns_-______.---.______________-_ 1.8-m Ions X 1.8-mrn IDCarrier gas fiow_ _____________________ 30 ml/min nitrogen.Column temperature. _________________ 145°C.Klcctron-capturc detector.
Relative retention time
Herbicides
2,4-D l ...._.... .........Silvex-________ ________2,4,5-T... _-__--_--.
5 percent DC-200
1. 00.___ 1.42
1.91
5 percent QF-1
1.00
1.22
1.80
1 2,4-D retention times: DC-200, 3.U2 mm; QF-1, 3.05 min.
ANALYSIS OF ORGANIC SUBSTANCES IN WATER 27
5.2 Pesticide standards: Reference or analyti cal-grade pesticide chemicals may be obtained from gas chromatography specialty suppliers and often also by written request from the manu facturer. It is desirable to obtain a particular pesticide from at least two different suppliers. The pesticide standards should be refrigerated during prolonged storage, and appropriate hazard warnings should be posted on the refrigerator.
6. Procedure
6.1 StandardizationEach gas chromatographic system must be
calibrated to reference standards at the operating conditions to be used for analysis.
6.1.1 Picogram standards: Weigh 1.00 mg of pesticide on the microbalance and transfer into a 10.00-ml volumetric flask., Dilute to volume with benzene and mix thoroughly. Prepare a series of required picogram standards from this solution. (Example: Take 1.00 jul of the above pesticide solution and dilute to 10.00 ml with the solvent to be used in the analysis. The concentration of pesticide in the resulting solution is 10X10~ 12 g/Vl (grams per microliter), or 10 pg/^l (pico- grams per microliter).)
6.1.2 Nanogram standards: Weigh 5.00 mg of reference pesticide into a 5.00-ml volumetric flask and dilute to volume with benzene. Make a series of appropriate nanogram standards from this solution. (Example: Take 10.0 /*! and dilute to 10.00 ml with the solvent to be used in the analysis. The concentration of pesticide in the resulting solution is 1.0X10"9 g//il, or 1.0 ng/Vl (nanogram per microliter).)
6.1.3 Calibration: The picogram standards are used for electron-capture gas chromatography, and the nanogram standards are used for flame- photometric and microcoulometric gas chroma tography. A 5.0-jul volume of each of the ap propriate standard solutions is injected into the gas chromatograph. The concentration of pesticide in the series of standard solutions should be such to calibrate either the full range of linear detector response or the range of anticipated pesticide concentration in the sample, whichever is less. The injection should be made so that the solution enters the injection port in a single volume and in a reproducible manner. The volume injected should be measured by reading the syringe before and after injection. All information pertinent to
the standardization should be written directly on the recorder chart. Calibration should be per formed on both the DC-200 and the QF-1 columns.
6.2 Sample analysisThe sample extracts are analyzed in the same
manner as the standards and under the same operating conditions.
6.2.1 The first analysis is performed by electron-capture gas chromatography using the DC-200 column. Concentration or dilution of the extract may be required to allow a 5.0-Ml injec tion. Proceed with the analysis by injecting 5.0 /il of the sample into the chromatograph, record ing the extract volume and the volume injected. Do not make any subsequent injections until the last compound has eluted and the baseline has returned to normal.
6.2.2 Run a calibration-retention-time stand ard and a reagent blank as an analysis check. Should a pesticide be detected in the sample, a standard containing the same pesticide at nearly the same concentration is also analyzed just after the sample.
6.2.3 Pesticides detected in concentrations ranging from 0.01 jug/1 to 1.0 Mg/1 for water samples, or from 0.10 Mg/kg (microgram per kilogram) to 1.0 Mg/kg for sediment, must be analyzed a second time by electron-capture gas chromatography, on the QF-1 column, for con firmation.
6.2.4 The presence of pesticides at concen trations greater than 1.0 Mg/1 in water or 1.0 jug/kg in sediment samples must be confirmed by microcoulometric or flame-photometric gas chro matography on both the DC-200 and QF-1 columns. This requirement is not intended to restrict the use of specific detectors but rather to indicate concentrations above which they must be used. Specific detection should always be used whenever practical. Volumes of extract up to 10 Ml for the smaller diameter columns and up to 80 lA for the larger diameter columns may be in jected. In this instance, a check standard at nearly the same concentration should also be run.
7. Calculations
Each gas chromatographic system must be calibrated with standards. The response of the gas chromatographic detector is usually the dis play of an analog signal on a strip-chart recorder.
28 TECHNIQUES OF WATER-RESOURCES INVESTIGATIONS
The signal is recorded as a differential curve or peak. The area inscribed beneath the peak is proportional to the amount of material passing through the gas chromatographic detector. The time elapsed from the introduction of the sample to the differential curve maximum is designated as the retention time for a particular component, The retention time for a compound on a specified column is nearly unique and is used for quali tative analysis. Also, the retention time relative to another selected compound is often used be cause this expression reduces variation usually found in day to day operation. The response of the chromatograph must be standardized at optimum conditions and enough determinations made so that the data may be treated by the method of least squares. During analysis, the standard curve must be checked by running at least two standards at different concentrations so corrections can be made for day to day fluctua tions.
7.1 Qualitative analysisDirectly comparing the retention times of a
sample component and a reference standard on both DC-200 and QF-1 columns is the method used for qualitative identification. Additionally, specific detection is employed to further confirm the presence of a particular component at levels greater than 1.0 /*g/I for water samples and 1.0 Mg/kg for sediment. Relative retention time, the ratio of the retention time of an unknown to that of a selected standard, may be used to determine which reference standard to choose for comparison. The pesticides selected for this purpose are: Aldrin for the chlorinated hydro carbon insecticides, parathion for the phosphoro- thioate insecticides, and the methyl ester of 2,4-D for the chlorinated phenoxy acid herbi cides. The following equation is used in qualitative identification:
RTuRRT (relative retention time) = -77^.-
rti r
whore
= retention time of the unknown compound, and
RTr = rctcntion time of the reference com pound.
7.2 Quantitative, analysis Measurement of gas chromatograrn peak ureas
by use of a planimeter or by any method of equal or greater accuracy is acceptable. If a planimeter is used, the average of at least two measurements is taken as the peak area.
Interpretation of the chromatogram is very important to the precision of area measurement. Reliable interpretation comes with experience and much can be gained by careful study of the elu- tion patterns and peak shapes of individual mixed standards. In general, peaks may appear in four different ways, which are: (1) A single peak, (2) two or more discrete peaks not completely sepa rated, (3) a small peak or shoulder on the leading or trailing edge of a relatively large peak, and (4) two or more peaks perfectly overlapping one another. The presentation of a single peak is ideal and allows precise area measurement. Peaks not completely resolved are graphically separated by drawing a line from the valley point between two adjacent peaks down to the baseline. It is >very difficult to isolate a shoulder from the1 larger peak in a reproducible manner. Also the retention time is biased toward the larger component. In this situation a line is drawn to conform with the shape of the major peak. Although the area under the larger peak is usually quite reliable, that of the shoulder is not. Other steps should be taken, such as gas chromatography using a different column or techniques of column or thin-layer chromatogrnphy, to isolate the shoulder com pound for quantitative determination. The same consideration must bo given to overlapping peaks. Components elating at nearly the same time to form a single peak are easily misinter preted. Correlation of retention times arid peak areas on both the DC-200 and QF 1 columns is extremely important in this instance. To obtain reliable qualitative and quantitative analysis, other isolation techniques may have* to be em ployed whenever this occurs (Federal Water Pollution Control Administration, 1969).
7.2.1 Standard curveUsing log-log graph paper, plot area of re
sponse, in square inches fin 2), against nnnogrnms of pesticide injected. If six or more values fall in the linear response region of the detector, the equation of the line may be found by the method of least squares, as follows:
€
ANALYSIS OF ORGANIC SUBSTANCES IN WATER 29
and
where
r = injection amounts (ng), # = area response values (in2), b — y intercept,
w — slope, and n = number of points selected.
For the equation of the straight line,
the value for 6, the y intercept, is an indication of whether any experimental bias exists. It is usually small enough to be insignificant so that the equation of the standard curve may be ex pressed as:
y = wjr.
The two or more daily response check standards are used to correct the slope of the standard curve, as follows:
Ac
where
fromC = correction factor,
.4c = area of check standard obtainedthe standard curve, and
As = area obtained from chromatogram of thecheck standard.
The slope of the standard curve is corrected by multiplying it by the correction factor.
7.2.2 Calculations for samples The concentration of pesticides in water
samples may be determined using the following equation:
Concentration of pesticide (/ig/1)
1 Vert 1_ A v ___ V ____ V __— ^ /^ ^ tr ' • ^ TT- JCm Vinj Vs
where
A =area of component (in2), Cm ~ corrected slope (in2/ng),
Vejrt = volume of extract (ml), Vinj= volume injected (ml), and
Fs = volume of water sample (liters).
This equation may be used to calculate the con centration of pesticides in sediment or soil by
substituting the weight of sample in kilograms for the sample volume (Vs) with the resulting concentration expressed as //g/kg.
8. Report
Pesticides found in water samples are reported as follows: At concentrations of less than 1.0 /zg/1, two decimals and report less than 0.005 jitg/1 as 0,00 Mg/1; at concentrations of 1.0 Mg/1 and greater, two significant figures. Pesticides in sediment and soil samples are reported as follows: Less than 1.0 Mg/kg to one decimal; 1.0 jitg/kg and above, two significant figures. The identities of pesticides found in concentrations greater than 0.01 Mg/1 in water or 0.1 jug/kg in sediment must be confirmed by two-column gas chromatography. For concentrations greater than 1.0 jug/1 in water and 10 Mg/kg in sediment, specific detection must be employed. Identities of compounds in concen trations greater than 10 Mg/1 in water and 100 Mg/kg in sediment must be confirmed by mass spectromotry.
9. Precision
Precision of the gas chromatographic technique is variable for multicomponent analysis. The re sponse of one component may be considerably greater or less than that of another. Peaks of compounds having longer retention times are af fected more by instrumental noise and drift. Under ideal conditions repetitive analysis of a single component may be determined to a pre cision of ±3 percent.
References
Bonelli, E. J., 1965, Pesticide residue analysis handbook: Walnut Creek, Calif., Varian Aerograph, 124 p.
Pattison, J. B., 1969, A programmed introduction to gas- liquid chromatography: Philadelphia, Sadtler Re search Labs, Inc., 303 p.
Simmons, S. W., 1969, PHS pesticide program: Natl. Agr. Chem. Assoc., News Pesticide Rev., v. 27, no. 5, p. 10-12.
Smith, E. D., 1960, Preparation of gas chromatographic packings by frontal analysis: Anal. Chemistry, v. 32, p. 1049.
[U.S.] Federal Water Pollution Control Administration, 1968, Report of the committee on water quality criteria: Washington, U.S. Govt. Printing Office, 234 p.
———— 1969, FWPCA method for chlorinated hydrocarbon pesticides in water and wastewater: Cincinnati, Federal Water Pollution Control Administration, 29 p.
30 TECHNIQUES OF WATER-RESOURCES INVESTIGATIONS
Insecticides in water
Gas chromatographic method
1. Summary of method
The insecticides are extracted directly from the water sample with n-hexane. After drying and removing the bulk of the solvent, the insecticides are isolated from extraneous material by micro- column adsorption chromatography. The insecti cides are then analyzed by gas chromatography. This method is a modification and extension of the procedures developed by Lamar, Goerlitz, and Law (1965, 1966). For the analysis of in secticides in waters that are grossly polluted by organic compounds other than pesticides, the analyst is referred to the high-capacity cleanup procedure detailed in Federal Water Pollution Control Administration "Method for Chlorinated Hydrocarbon Pesticides in Water and Waste- water" (1969).
2 Application
This method is usable for the analysis of water only. The insecticides and associated chemicals (aldrin, 7>,7>',DDD, p,pVDDE, o,?/-DDT, p,pf- DDT, dieldrin, endrin, hcptachlor, hcptachlor epoxide, isodrin, lindane (BHC), and methoxy- chlor) may bo determined to 0.005 jig/1 in 1-liter water samples. The insecticides carbophonothion, chlordan, dioxathion, diazinon, ethion, malathion, methyl parathion, Methyl Trithion, parathion, toxaphene, and VC-13 may be determined when present to higher levels (method for organophos- phorus pesticides similar to that of Zweig and Dovino, 1969). Also, the chemicals chlordeno, hoxachlorobicycloheptadiene, and hoxaehlorocy- clopentadieno, which are pesticide manufacturing precursors, may bo analyzed by this method.
3. Interferences
Any compound or compounds having chemical and physical properties similar to the pesticide of interest may cause interference. The procedure incorporates a column chromatographic tech nique which eliminates most extraneous material. Special precautions arc necessary to avoid con tamination during sampling arid analysis.
4. Apparatus
See step 4, "Gas Chromatographic Analysis of Pesticides."
4.1 Concentrating apparatus: A Kudernii- Danish concentrator, 250-ml capacity with a1-ball Snyder column, is used for .the initial con centration step. Final concentration is performed in the receiver using .a 1-ball Snyder micro- column. A' calibrated 4.00-ml receiver tube is used with the concentration apparatus.
4.2 Cleanup microcolumns: Disposable Pas teur pipets, 14-cm long and 5-mm ID, are used for the chromatographic cleanup columns. The pipets are washed in warm detergent solution, thoroughly rinsed with dilute hydrochloric acid and organic-free distilled water, then heated to 300°C overnight to remove any traces of organic matter. A column is prepared by plugging the pipet with a small amount of specially cleaned glass wool, adding enough deactivated alumina through a microfunnel to fill 3 cm of the column, followed by another 1 0.5 cm of anhydrous sodium sulfate.
4.3 Sandbath, ftuidizcd, Tecam, or equiva lent.
4.4 Separatory funnels, Squibb form, 1- or2-liter capacity. No lubricant is used on the stopcocks.
5. Reagents
5.1 Alumina, neutral aluminum oxide, ac tivity grade I, Woelm. Weigh 19 g activated alumina into a 50-ml glass-stoppered orlenmoyor flask and quickly add 1.0 ml distilled water. Stopper the flask and mix the contents thoroughly by tumbling. Allow 2 hr before uso. The do- activated alumina may be used for 1 week.
5.2 Benzene, distilled in glass, pesticide- analysis quality.
5.3 ii-Hejrane, distilled in glass, pesticide- analysis quality.
5.4 Sodium sulfate, anhydrous, granular. Prepare by heating at 300°O overnight and store at 130°C.
5.5 Water, distilled, obtained from a high- purity tin-lined still. The feed water is passed through an activated carbon filter. Tho distillate1 is collected in a tin-silvor-linod storage tank, and the water is constnntlv irradiated with ultraviolet
ANALYSIS OF ORGANIC SUBSTANCES IN WATER 31
light during storage. A gravity delivery system is used, and no plastic material other than teflon is allowed to contact the distilled water.
6. Procedure
Samples should be collected according to the recommended practice for the collection of samples for organic analysis. A 1-liter bottle of water should be collected for each sample. No preservative is used. Samples should be shipped promptly. Unless analyzed within a few days, the water should be protected from light and re frigerated. If the sample contains sediment, then the sediment must be analyzed separately. Re move the sediment by centrifugation or nitration through a metal membrane filter. See step 6.1, "Chlorinated Hydrocarbon Insecticides in Sus pended Sediment and Bottom Material."
All glassware, except volumetric flasks, should be washed in the usual manner, rinsed in dilute hydrochloric acid and distilled water, and heat treated at 300°C overnight. Instead of heat treating, the volumetric ware may be solvent rinsed or steamed to remove organic matter. A reagent and glassware blank should accompany each analysis.
6.1 Water samples (800-900 ml) are ex tracted with n-hexane in such a manner that the water and the container itself are exposed to the solvent. Weigh the uncapped bottle of water on a triple-beam balance and pour the sample into a 1-liter separatory funnel. Allow the bottle to drain for a few minutes, weigh again, and record the weight of water to three significant figures.
6.2 Add 25 ml n-hexane to the empty sample bottle and gently swirl to wash the sides of the container with the solvent. Pour the contents of the sample bottle into the separatory funnel containing the water. Stopper and shake the separatory funnel vigorously for 1 full min, venting the pressure often. Allow the contents to separate for 10 min and draw off the aqueous layer into the original sample bottle. If the hexane layer emulsifies, separate as much water as possible, then shake the contents of the funnel very vigorously so that the liquids contact the entire inside surface of the vessel. (CAUTION: Vent often!) Allow the layers to separate and add approximately 5 ml distilled water to aid the separation, if necessary. Remove the water and
pour the extract from the top of the separatory funnel into a 125-ml erlenmeyer flask containing about 0.5 g anhydrous sodium sulfate.
6.3 Repeat a second and third extraction of the water sample in the same manner using 25 ml n-hexane each time, and collect the extracts in the 125-ml erlenmeyer flask containing the drying agent. Cover the flask containing the extract with foil and set aside for 30 min.
6.4 Filter the dried extract through glass wool into the Kuderna-Danish apparatus. Add a sand-sized boiling stone and remove most of the hexane by heating on a fluidized sandbath at 100°C in a hood. When the ball in the Snyder column just stops bouncing, remove the ap paratus from the heat and allow to cool. Add another small boiling stone, fit the receiver with a Snyder microcolumn and reduce the volume to between 0.4 and 0.5 ml on the sandbath. Set aside to cool. When changing columns, sand must be, cleared from the glass joint before opening.
6.5 Quantitatively transfer the contents of the Kuderna-Danish receiver (0.4-0.5 ml) to the top of a deactivated alumina cleanup micro- column. Use a disposable pipet to transfer. Not more than 0,1-0.2 ml hexane should be needed for washing. Using hexane, elute the extract from the column to a volume of 8.5 ml in a calibrated 10.00-ml receiver. Add only enough hexane so that the solvent level enters the column packing just as the 8.5-ml elution level is reached. Change receivers and continue the elution using 1:1 benzene-hexane solvent. Collect 8.5 ml of eluate in a second receiver. The first fraction of eluate should contain all the chlorinated hydrocarbon insecticides, and carbophenthion, Methyl Tri- thion, and VC-13. The remaining phosphorus- containing pesticides are eluted in the benzene- hexane fraction. Reduce the volume of each eluate to 1.00 ml using a Kuderna-Danish micro- apparatus on the sandbath.
NOTE.—The insecticides are separated chromat- ographically in a predictable order on the micro- column, and this may be used to augment gas chromatographic analysis. Although alumina is the adsorbent of choice for the majority of water and sediment samples, occasionally a second pass through a different column is needed for more difficult samples. The analyst is referred to the work of Law and Goerlitz (1970) for a more
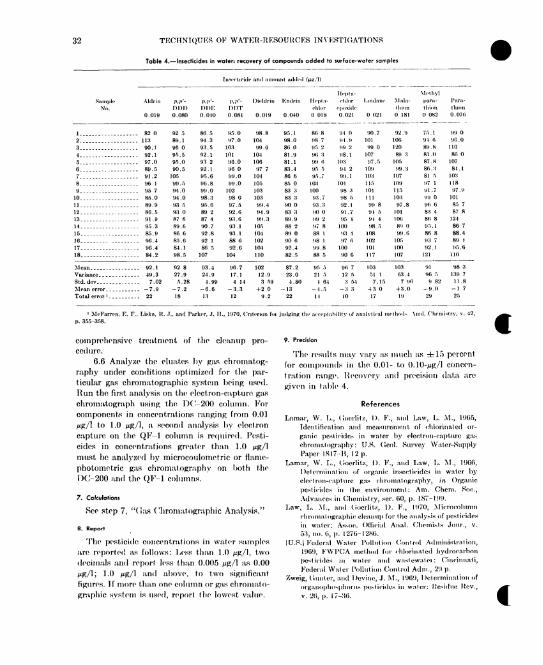
32 TECHNIQUES OK WATER-RESOURCES INVESTIGATIONS
Table 4.—Insecticides in water: recovery of compounds added to surface-water samples
TiisoctiouU1 und amount luMod (/_K/1)
Sample No.
1. _______________2...... __________3________________4__ ______________56._-__---_-_---__
8_.__.______...._9. _____-_______...
10______ ___-_._-__11. ._._________.._12, ____..__.__.____13. ....„______...14. _______________15. _______________16. ________ ......17... _____________18__. __._.____._..
Variance, ___ ...Std.dev. ____.__„..Moan error. _____ Total error »_ ______
1 McFarrpn, E.
AMrin
0.019
... 82 0___ 113... 90 . 1... 92 . 1... 07.0... 89.5... 91.2... 96 1... 95 7_.. 85.0... 89.9... 86.5... 91.9... 95.3... 85.9
96.4._-_ 96.4.... 84.2
. . _ . 92 . 1
. _ . _ 49 . 3
.... 7.02
.... -7.9
..__ 22
F., Liskn, 1..
p,p'-nnn0.080
92 5 89.1 96 0 95.5 95.0 90.5
105 99.5 94.0 94.0 93 59:1 o87 6 89.6 86 6 85.6 84.1 98 . 5
92 8 27.9 5.28
-7.2 18
P.P'-ni)K o.oio
86.5 94.3 93 . 5 92.1 93 2 92.1 95.6 96 . 8 99.0 98.3 95.6 89 2 87 4 90.7 92.8 92 1 80 5
107
93.4 24.9 4.99
-6.6 13
,!., and Parker, ,1. II .
P,P'~
DOT 0.081
95.0 97.0
103 101
9G.O 96 0 99.0 99.0
102 98 0 97.5 92.6 93.6 93.1 93.1 88 6 92.6
104
96.7 17.1
4 14 -3.3
12
, 1970, (
Dk'ldrin
0.019
98.8 104 99.6
104 106 97 7
104 105 103 103 99.4 94.9 99.3
105 104 102 104 110
10212.9 3 59
+2 0 9.2
'ntonon foi
Kndrin
0.040
95 . 1 98.0 86 0 81.9 81.1 83.4 86 6 85 0 83 3 83 3 90 0 83 3 89 . 9 88 2 89 0 90 6 92.4 82.5
87.2 23.0 4.80
-13
22
.mining the
Hcptn-
rhlnr 0 018
86 8 98 7 95 2 96 3 99 <i 95 5 95.7
103 100 93 . 7 93.3 90 0 99 2 97 8 88 1 98 1 99 . 8 88 5
95 .I 21 5
t 64 - 4 . 5
14
• arooptubi
Hrpta-
chlor 1 jmhuir cpoxido 0.021 0 021
9. 0 90.7 .M.9 101 99 2 99 0 98.1 107
103 97.5 94 2 109 99.1 103
101 115 98 3 101 98 5 111 92.1 99 8 91.7 91 5 95 t 91 4
100 98.5 93 4 108 97 6 102
100 101 90 6 117
96 7 103 12 5 51 1
3 54 7.15 -H 3 430
10 17
ilifv of analytical i
Mala-
ttuon 0 181
92.9 106 12089 :i
105 99.3
107 109 115 103 97.8
101 106 89 0 99 . 6
105 100 107
103 63.4
7 96 +3.0 19
methods Vn
Methyl jmra-
thion 0 082
75 . 1 91 6 89.8 81.0 87.8 86.3 81 5 97 1 91 .7 99 0 96 6 83 4 86 8 95 . 1 86 8 93 7 92 . 1
121
91 96 5
9 82 -9.0
29
Para-
tluon 0.076
99 0 96.0
110 86 0
107 8-1. 1
10:i 118 97.9
101 85 7 87 8
124 86 7 88.4 89 1 95.6
110
98 3 139 7 11.8
-1 7 25
:il. Chemistry, v. 42,p. 355-358.
comprehensive treatment of the cleanup pro cedure.
6.6 Analyze the eluates by gas chromatog- raphy under conditions optimized for the par ticular gas chromatographic system being used. Run the first analysis on the electron-capture gas chromatograph using the DC-200 column. For components in concentrations ranging from 0.01 Mg/1 to 1.0 /ug/1, a second analysis by electron capture on the QF 1 column is required. Pesti cides in concentrations greater than 1.0 ^.g/1 must be analyzed by microcoulometric or flame- photometric gas chromatography on both the DC-200 and the QF-1 columns.
7. Calculations
See step 7, "(!us Chron.atographic Analysis/'
8. Report
The pesticide concentrations in water samples are reported as follows: Less than 1.0 jug/l, two decimals and report less than 0.005 /jg/1 as 0.00 jug/1; 1.0 jug/I <-nd above, to two significant figures. If more than one column or gas chroma! o- graphic system is used, report the lowest value.
9. Precision
The results may vary as much as ±15 percent for compounds in the 0.01- to O.lO-jug/l concen tration range. Recovery and precision data are given in table 4.
References
Lamar, W. L., (.oerlit/, I). F., and Law, L. M. f 1065, Identification and measurement of chlorinated or ganic pesticide* in water by electroi.-o.ipt.ure gas chromat ography: U.S. (Jcol. Survey Water-Supply Paper 1817-H,*12p.
Lamar, W. L., CloerliU, 1). F., and Law, L. M., 1966, 1 )etcM'mination of organic insertioides in water by electron-capture gas ohroinatography, in Organic pesticides in the environ men t: Am. Chem. Soo., Advances in Chemistry, ser. 60, p, 187-19*).
Law, L. M., and (ioerlit./, I). F., 1970, Mieroc.olumn chrom.itngraphio cleanup for the analysis of pesticides in water: Assoc. Official Anal. Chemists Jour., v. o:$, no. 0, p. 1276-1286.
[U.S.] Federal Water Pollution Control Administration, 1969, FWPCA method for chlorinated hydrocarbon pesticides in water and wastewalei: Cincinnati, Federal Water Pollution Control Adm., 29 p.
/weig, (iunter, and Devine, .1. M., 1969, Determination of organophosphorus pesticides in water: Kesidue Kev., v. 26, p. 17-30.
ANALYSIS OF ORGANIC SUBSTANCES IN WATER 33
Chlorinated hydrocarbon insecticidesin suspended sediment and
bottom material
Gas chromatographtc method
1. Summary of method
The insecticides are extracted from the sedi ment or soil using acetone and n-hexane. The vsolid is dispersed first in acetone, and then hexane is added to recover the acetone together with the desorbed insecticides. The extract is washed with distilled water and dried over sodium sulfate. A preliminary gas chromato graphic analysis is performed before concentration and cleanup. Following this, the volume is re duced and extraneous material is removed by microcolumn adsorption ehromatography. The insecticides are determined by gas chromatog- raphy.
2. Application
Sediment and bed material may be analyzed by this method. Water samples containing sus pended sediment may also be analyzed by this technique. The insecticides aldrin, p,7/,DDD, p,p'-DDE, o,p-DDT, p,p'-DDT, dioldrin, en- drin, heptachlor, heptachlor epoxide, isodrin, lindane, and methoxychlor, may be determined down to 0.20 jug/kg for a 50.0-g sample, on a dry-weight basis. The pesticide chemicals chlor- dan, chlordene, hexachlorobicydoheptadiene, hex- achlorocyclopentadiene, and toxaphene may also be determined by this method.
3. Interferences
As in the analysis of water for pesticides, chlorinated hydrocarbon compounds similar to pesticide chemicals give the most interference. Organic coextractivcs, occurring naturally in sediments and soils, are usually adequately re moved from extracts by the cleanup micro- column. Sulfur compounds present in some bottom muds often hinder electron-capture chro- matography but do not appear to interfere with microcoulometrie gas chromatography.
4. Apparatus
See step 4, "Gas Chromatographic Analysis of Pesticides."
4.1 Centrifuge: A medium-speed centrifuge with a head capable of accepting large-volume glass centrifuge bottles and tubes is adequate.
4.2 Concentrating apparatus: A Kuderna- Danish concentrator, 500-ml capacity with a 1-ball Snyder column.
4.3 Erlenmeyer flasks, 250-ml and 500-ml, having ground-glass stoppers, and having spring clips for securing the stoppers.
4.4 Microfiltration apparatus: Use only silver metal niters having 0.45 fjun maximum pore size, obtainable from Solas Flotronics. Filters should be rinsed with acetone and heated to 300°C over night to reduce interfering substances,
4.5 Shaker table, or combination shaker table and wrist-action shaker having a 12-container capacity.
5. Reagents
5.1 Acetone^ distilled in glass, pesticide- analysis quality,
5.2 n-hejrane, distilled in glass, pesticide- analysis quality,
5.3 Sodium sulfate, anhydrous, granular. Prepare by heating at 300°C overnight and store at 130°C,
5.4 Water, distilled water obtained from a high-purity tin-lined still. The feed water is passed through an activated carbon filter. The distillate is collected in a tin-silver-lined storage tank, and the water is constantly irradiated with ultraviolet light during storage. A gravity system is used, and no plastic material other than teflon is allowed to contact the distilled water.
6. Procedure
Samples should be collected according to the recommended practice for suspended sediment and bed materials. Special care should be taken to avoid contaminating the sample with oil from the sampling device. Rubber gaskets should be replaced with teflon. Two suspended-sediment samples should be taken, one for insecticide analysis and the other for determining the sedi ment concentration and particle-size distribution. A 1-liter suspended sediment sample is needed for the insecticide determination.
At least 150 g of material should be collected for each sample when only solids are to be ana lyzed. All samples must be kept in watertight
34 TECHNIQUES OF WATER-RESOURCES INVESTIGATIONS
glass containers to prevent water loss and con tamination. No preservative is added. Unless analyzed within a few days of collection, the samples should be refrigerated and protected from light.
6.1 Procedure JOT water samples having suspended sediment. A reagent blank must accompany the analysis.
6.1.1 Allow the water-sediment sample to re main undisturbed until the sediment has settled. Weigh the uncapped bottles on a balance to three significant figures and carefully decant the water into a soparatory funnol of appropriate size. (Sepa rate by contrifugation as in 0.2.2 below and (or) filtration through motal membrane* filters if necessary.)
6.1.2 Measure 10 ml acetone or a volume approximately half the equivalent volume of solid, whichever is greater, into the sample bottle containing the sediment. Replace the cup and gently mix the contents of the bottle on a shaker table for 20 min. Add 25 ml n-hcxane and mix the contents for an additional 10 min. Decant the extract into the separatory funnel containing the water from the sample. Repeat the extraction of the sediment in the same manner two more times, using fresh acetone and hexane each time.
NOTK.—Additional hcxnno may be needed to recover the acetone extract from the sediment. Also, the extract may have to be filtered through a plug of glass wool. Anhydrous sodium sulfate may bo added to uid in separating the solvent from the sediment. Add the sodium sulfate slowly and mix to the desired consistency. A quantity of sodium sulfate equal to the amount of sediment may bo added if necessary.
6.1.3 Shako tho combined extracts with the water from the sample for 1 min. Rinse tho sodi- mont from iho sample bottle with distilled water and collect tho wator from tho sample in tho sample bottlo. Tho sediment may bo discarded. Decant, tho extract from tho top of tho separatory funnol info a 250-ml orlonmoyor flask.
6.1.4 Extract the wator from tho sample with an additional 25 rnl hexano and discard tho wator. Weigh tho sample bottlo to determine tho weight of tho sample.
6.1.5 Combine tho extracts in tho separatory funnol and wash two times with 500 ml distilled wator oach time. Collect tho extract in tho 250-ml orlomnoyor flask containing approximately 0.5 g
Na2S04 , and continue the analysis as in the pro cedure, beginning step 6.4, "Insecticides in Wator."
6.2 Analysis of sediment, soil, and bed-material samples. A reagent blank must accompany the analysis.
6.2.1 Desiccated samples, such as bed mate rial from dry streams, should be moistened with distilled water (to about 15 percent by weight). Samples to which water is added are first pul verized, then mixed with the water, and then kept in an airtight glass container. A minimum of 2 hr should be allowed for equilibration. Start the analysis of homogeneous samples at step 6.2.3, below.
6.2.2 Excessive water in sediment and bot tom-mud samples must be separated from the solids in order to obtain a homogeneous fraction of tho sample. A proportionate amount of this wator is used later so that any suspended material is included in the analysis. This technique may also be used whenever wator and solids are to be analyzed separately. Weigh the container and contents and transfer the sample to centrifuge bottles. Spin tho solids at a relative centrifuge force of 500-1,000 times gravity. Use tho super natant water to complete the transfer and ropoat the centrifugution as necessary. Decant tho separated water into the empty tared sample container, (See step 6.2.5.) Calculate the weight of the solid by difference.
6.2.3 Thoroughly mix tho moist solid until homogeneous and then weigh 50.0 g into a 250-ml orlonmoyor Mask having a ground-glass stopper. Also at this time, weigh an additional 10.00 g of the solid into a tared 50-ml beakor to be heated at 130°C overnight for moisture determination.
6.2.4 Measure 40 ml acetone into the erlen- meyer flask containing tho sample and clamp the stopper in place. (If tho sediment is sandy, use 20 ml acetone instead.) Mix the contents of the flask for 20 rnin using a wrist-action shaker. Add 80 ml hexane and shako again for 10 min. Decant the extract into a separatory funnol containing 500 ml distilled water. Add 20 ml acetone to tho orlonmoyor flask and shako 20 min. Again add 80 ml hexane, shako 10 min, and decant, the extract into the separatory funnol. Repeat as in tho second extraction one more time,
NOTE. If the* sediment is not wet. enough to agglomerate when tho hexane is added, add water,
ANALYSIS OF ORGANIC SUBSTANCES IN WATER 35
by drops, while swirling the flask and observe if this helps. Very sandy material may remain dis persed. Extremely wet, mucky sediments may be better handled by the addition of anhydrous sodium sulfate. Add sodium sulfate, in small quantities, until the desired consistency is at tained or until the amount added approximates the weight of the sediment. The extract volume recovered should be measured at each extraction to insure that 75 percent or more is regained. If not, additional extractions are necessary to ob tain quantitative removal of the insecticides.
6.2.5 If any water was separated in step 6.2.2 above, mix thoroughly and weigh out an aliquot equivalent to the fraction of solid taken for analysis. Transfer the aliquot of water into the separatory funnel containing the sample ex tract and distilled water.
6.2.6 Gently mix the contents of the separa tory funnel for about 1 min and allow the layers to separate. Collect the water in a clean beaker and decant the extract into a 500-ml erlenmeyer flask. Back-extract the water wash with 25 ml hexane. Combine the solvent layers and wash with fresh 500-ml quantities of distilled water two more times. Discard the water layers and collect the washed extract in the 500-ml erlen meyer flask to which has been added about 0,5 g anhydrous sodium sulfate.
NOTE.—A preliminary gas chromatographic analysis at this point is helpful for determining the volume reduction necessary.
Proceed with the analysis beginning at step 6.4, "Insecticides in Water/'
7. Calculations
See step 7, "Gas Chromatographic Analysis of Pesticides."
8. Report
The pesticide concentrations in water-sediment mixtures should be reported as in step 8, "In secticides in Water," and the sediment concen tration should accompan}7 the report. The concentration of pesticides in sediment, soil, and bed material is reported on a dry-weight basis as follows: Less than 1.0 Mg/kg to one decimal; 1.0 Atg/kg and greater to two significant figures. Be cause negative bias exists in the extraction pro cedure, insecticides found in sediments and solids are considered minimum amounts.
9. Precision
The recovery of pesticides from sediments and soils is mainly dependent on two factors: (1) the ability of the solvent to remove the pesticide from the solid, and (2) the amount of solvent re claimed at each extraction step. Comparative studies of single and exhaustive extractions of soil samples taken from contaminated fields showed that the extraction technique described removed 90-95 percent of the chlorinated pesti cides. Dehydrated clay soils, however, proved slow to yield the pesticides unless they were premoistened. Apparently, the collapsed layers of certain dehydrated clays and the resulting agglomerates entrap the pesticides, and the addition of water prior to analysis helps to open the layers and separate the aggregation. It is imperative that sufficient solvent be reclaimed at each extraction to avoid low results. Removal of 90-95 percent of the desorbed pesticides may be expected if at least 75 percent of the solvent is recovered at each extraction step.
Chlorinated phenoxy acid herbicides in water
Gas chromatographic method
1. Summary of method
Chlorinated phenoxy acids and their esters are extracted from the acidified water sample with ethyl ether. The extracts are hydrolyzed, and extraneous materials are removed with a solvent wash. The acids are converted to their methyl esters and are further cleaned up on an adsorp tion microcolumn. The esters are determined by gas chromatography. This method is a modifica tion and extension of the procedure developed by Goerlitz and Lamar (1967).
2. Application
The method is usable for the analysis of esters and salts of 2,4-D (2,4-dichlorophenoxyacetic acid), silvex [2-(2,4,5-trichlorophenoxy) propi- onic acid], 2,4,5-T (2,4,5-trichlorophenoxy- acetic acid), and similar herbicides found in water. Concentrations as .low as 0.02 /zg/1 of 2,4-D and 0.005 Mg/1 of silvex and 2,4,5-T in 1 liter of water may be determined.
36 TECHNIQUES OF WATER-RESOURCES INVESTIGATIONS
3. Interferences
Halogenated organic acids and their salts and esters cause interference when BF3-methanol esterification is used, and both the acids and halogenated phenols interfere when diazomethane is used for esterification.
4. Apparatus
See step 4, "Gas Chromatographic Analysis of Pesticides."
4.1 Concentrating apparatus. A Kuderna- Danish concentrator, 250-ml capacity, with a l-ball Snyder column is used for the initial con centration step. Final concentration is performed in the receiver using a l-ball Snyder micro- column. A 4.00-ml graduated receiver tube is used for the diazomethane esterification, and a 5.00-ml volumetric flask receiver is utilized for the boron trifluoride-methanol esterification.
4.2 Erlenmeyer flasks, 250 ml and 500 ml, having ground-glass stoppers.
4.3 Pasteur pipets, disposable, 14-cm long and 5-mm inside diameter.
4.4 Sandbath, fluidized, Tecam, or equiva lent.
4.5 Separatory funnels, Squibb form, some of 1-, or 2-liter capacity and others of 60-ml ca pacity. No lubricant is used on the stopcocks.
5. Reagents
All reagents must be checked for purity as re agent blanks using the gas chromatographic procedure. Effort is saved by selecting high- quality reagents that do not require further preparation. However, some purification of re agents may be necessary as outlined below.
5.1 Boron trifluoride-methanol, esterification reagent: Dissolve 14,0 g BF3 gas in 86.0 g an hydrous methanol.
5.2 Benzene, distilled in glass, pesticide- residue quality, such as Nanograde, or equivalent.
5.3 2-(2-Ethoxyethoxy) ethanol, high purity, AV6°C 1.4068.
5.4 Ethyl ether, reagent grade, redistilled from an all-glass packed-column still, after re- fluxing over granulated sodium-lead alloy for 8 hr. Purity is checked by gas chromatography after a part is evaporated to one-tenth the original volume. The purified ether should be distilled as needed and should never be stored for more than 1 month. Explosive peroxides readily
form in redistilled ether, making it hazardous for storage and subsequent use.
5.5 Florisil adsorbent, Florisil, PR grade, commercially activated at 650°C and stored at 130°C in a glass-stoppered bottle.
5.6 Herbicides, chlorinated phenoxy acids, reference grade: 2,4-D mp (melting point) 138°- 139°C; silvex, mp 181°-182°C; and 2,4,5-T, mp 154°-155°C. The methyl esters of the herbicides may be obtained from commercial sources. The methyl esters may also be prepared by reacting 0.5-1.0 g herbicide acid with 50 ml BF3-methanol reagent at reflux for 1 hr. The methyl ester is ex tracted in ether, washed with 5-percent Na2CO3 solution, and finally washed with distilled water. The ether extract is dried over anhydrous Na.2C03 , and the ester is isolated by removing the ether under vacuum.
5.7 HI'ethanol, reagent grade, redistilled from an all-glass packed-column still after reacting with 5 g of magnesium lathe turnings per liter of solvent.
5.8 X-methyl-N-nitroso-p-toluenesulfonamide, mp 60°-62°C.
5.9 Potassium hydroxide reagent, 1M solu tion: Prepare by dissolving 78 g KOH reagent- grade pellets in 200 ml carbon-dioxide-free distilled water. Reflux for 8 hr to reduce inter fering substances. A calcium chloride tube filled with Ascarite is used at the top of the reflux condenser to exclude carbon dioxide.
5.10 Silicic acid, chromatographic grade, 100/200 mesh, heated at 300°C overnight and stored ut 130°C in a glass-stoppered bottle.
5.11 Sodium sulfate, reagent grade, an hydrous, granular; heat-treated at 300°C for 24 hr. The heat-treated material is divided, and one part is labeled "neutral- sodium sulfate" and stored at 130°C in a glass-stoppered bottle. The other part is slurried with enough ether to cover the crystals und acidified to pH 4 by adding a few drops of purified sulfuric jicid. (To determine the pH, a srnnll quantity of the slurry is removed, the ether evaporated, water added to cover the crystals, ;ind the pH is measured on a pH meter.) The ether is removed by vacuum, and the treated material is labeled "acidified sodium sulfate" and stored at 130°C in a glass-stoppered bottle.
5.12 Sodium sulfate solution, 0.35717: Prepare by dissolving 50 g neutral sodium sulfntc in 1.0 liter distilled water.
€
ANALYSIS OF ORGANIC SUBSTANCES IN WATEU 37
5.13 Sulfuric acid, reagent grade (sp gr 1.84), purified by distilling off water until a constant boiling solution remains. The acid is refluxed for about 4 hr.
6. Procedure
Water samples for herbicide analysis should be collected according to the procedure described for the collection of organic water samples. The samples may be preserved with sulfuric acid at the collection site only if the acid is supplied with the sampling package. Regardless of whether preserved or not, the samples must be iced or refrigerated in the dark within 4 to 5 hr of collec tion. Samples must reach the laboratory within 24 hr of collection if not acidified. A 1-liter sample should be collected for each analysis.
6.1 Immediately upon receipt in the labora tory, the samples are acidified to pH 2 or lower with the specially prepared sulfuric acid. If more than 24 hr is required for shipment, then the samples must be acidified at the collection site. For this purpose, 5 ml of 1:1 diluted sulfuric acid, sealed in a prescored glass ampoule must accom pany each empty sample container. Detailed instructions for proper addition should also be included. After adding the acid the bottles should be loosely capped for 5 min or so before closing tightly. Refrigerate the sample until analysis.
6.2 Weigh the opened bottle containing the sample. Pour the sample into a 1- or 2-liter separatory funnel. Allow the bottle to drain for a few minutes and then weigh. Record the sample weight to three significant figures. Add 150 ml ethyl ether to the sample bottle, rinse the sides thoroughly, and pour the solvent into the funnel. Shake the mixture vigorously for 1 min. Allow the contents to separate for at least 10 min. Occasionally, emulsions prevent adequate separa tion. In this event, draw off the clear aqueous layer, invert the separatory funnel and shake. (CAUTION: Vent the funnel frequently to pre vent forming excessive pressure.) Addition of small volumes of distilled water often aids re moval of sediment from the ether layer. Small amounts of water included in the extract do not interfere with the analysis. Collect the extract in a 250-ml ground-glass erlenmeyer flask containing 2 ml 7I\f potassium hydroxide solution. Extract
the sample two more times, using 50 ml ether each time, and then combine the extracts in the 250-ml erlenmeyer flask,
6.3 Add 15 ml distilled water and a boiling chip to the extract and fit the flask with a 1-ball Snyder column. Remove the ether on a steam bath in a hood and continue heating for a total of 90 min.
6.4 Allow to cool and transfer the water to a 60-ml separatory funnel. Extract the basic solu tion once with 20 ml and two more times each with 10 ml of ether and discard the ether layers. The herbicides remain in the aqueous phase. Add 2 ml cold (4°C) dilute sulfuric acid (1 part con centrated H 2SO4 (sp gr 1.84) diluted to 4 parts with distilled water) to the contents of the funnel to bring the pH to 2 or below, and extract the herbicides once with 20 ml and two times each with 10 ml of ether. Collect the extracts in a 125-ml erlenmeyer flask containing about 0.5 g acidified anhydrous sodium sulfatc. Cover the flask with foil and allow the extract to remain in contact with the sodium sulfate, preferably in an explosion-proof refrigerator, for at least 2 hr. (Refer to steps 6.6 and 6.7, below, before con tinuing.)
6.5 Transfer the other solution into the Kuderna-Danish apparatus through glass wool in a funnel, Use liberal washings of ether and break up the hardened sodium sulfatc to obtain quanti tative transfer. Concentrate the extract to about 0.5 ml on the fluidized sandbath heated to 60°- 70°C. Under no circumstances allow the extract to evaporate completely to dryness. Clear sand from the glass joints before opening.
6.6 Esterijicatioji with diazouiethaiie. A 4.00-ml graduated receiver tube is used with the Kuderna- Danish apparatus when the sample is to be esterified with diazomethano. Add a volume of anhydrous methanol equal to 0.1 of the volume of the concentrated extract. Connect two 20- by 150-mm test tubes in sorios with glass tubing through neoprene stoppers so that incoming nitrogen bubbles through the liquid in the tubes. At the outlet, position a piece of glass tubing having a right-angle bend and a drawn-out tip so that the gas can be bubbled through the sample. Add about 5 ml othor to the first test tube. To the second test tube, add 0.7 ml ether, 0,7 ml 2-(2-ethoxyethoxy) othanol, 1.0 ml 7M potassium hydroxide solution, and 0.1-0.2 g
38 TECHNIQUES OF WATER-RESOURCES INVESTIGATIONS
N-methyl-N-nitroso-p-toluenesulfonamide. Imme diately position the second test tube and adjust the nitrogen flow through the apparatus to about 10 ml per minute. (CAUTION: Diazomethane is a toxic and explosive gas. The use of a good fume hood is absolutely necessary.) Place the Kuderna- Danish receiver so that the gas bubbles through the sample. Allow the reaction to proceed for about 10 min, or less if the yellow color of diazo- methane can be observed to persist in the sample tube. Remove the tube containing the sample, stopper, and allow to stand in the hood for about 30 min. Carefully discard all waste from the reac tion. Add about 0.1-0.2 g silicic acid to the sample solution to destroy excess diazomethane. After evolution of nitrogen has subsided, pass the solu tion through a disposable pipet plugged with glass wool and packed with 1.5 cm neutral anhydrous sodium sulfate over 1.5 cm Florisil adsorbent. The eluate is collected in a graduated receiver tube. The transfer is completed by washing the receiver tube several times with small quantities of ether to a final volume of 2.00 ml. The tube is stoppered and the contents thoroughly mixed and analyzed by gas chromatography.
6.7 Esterijication ivith boron trifluoride-meth- atwl. A 5.00-ml volumetric receiver flask is used with the Kuderna-Danish apparatus when the sample is to be esterified with boron trifluoride- methanol reagent. Prior to the initial concentra tion step described previously (see step 6.5, above), 0.5 ml benzene is added to the extract in the Kuderna-Danish apparatus. The extract is concentrated to less than 1 ml, and the walls of the flask are washed down with a small amount of ether. Sand adhering to the joint is cleared off with an air gun or brush, and the receiver is fitted with a 1-ball Snyder microcolumn. The liquid volume is further reduced to 0.5 ml in the sandbath. After the benzene solution in the re ceiver has cooled, 0.5 ml boron trifluoride- methanol reagent is added. The Snyder column is used as an air-cooled condenser, and the con tents of the receiver are held at 50°C for 30 min in a sandbath. The reaction mixture is allowed to cool to room temperature. About 4.5 ml of the sodium sulfate solution is added to the reaction mixture so that the benzene-water interface is observed in the constricted neck of the receiver flask. The flask is stoppered with a glass plug and vigorously shaken for about 1 min. Allow to stand
for about 3 min for phase separation. Twirling the flask between the palms of the hands from time to time aids separation. The benzene layer is pipetted from the receiver and passed through a small cleanup column prepared by plugging a disposable pipet with glass wool and packing with 2,0 cm neutral anhydrous sodium sulfate over 1.5 cm Florisil adsorbent. The eluate is collected in a graduated receiver. The transfer is completed by repeating the extraction step with small quanti ties of benzene until a final volume of 2.00 ml is attained. Add a few crystals of neutral anhydrous sodium sulfate to the benzene solution and thoroughly mix for gas chromatographic analysis.
6.8 Analyze the extract by gas chromatog raphy under conditions optimized for the par ticular gas chromatographic system being used. Run the first analysis on the electron-capture chromatograph using the DC-200 column. For components in concentrations ranging from 0.01 //g/1 to 1.0 Mg/1, a second analysis by electron capture on the QF-1 column is required. Pesticides in concentrations greater than 1.0 jug/1 must be analyzed using microcoulometric detection on both the DC-200 and QF-1 columns.
7. Calculations
See step 7, "Gas Chromatographic Analysis of Pesticides."
Each gas chromatographic system must be calibrated with standards. Methyl ester stand ards of the herbicides must be converted to the acid equivalent. During analysis, at least two standards should be run so that the standard curve can be corrected for day-to-day instru mental fluctuation.
8. Report
The pesticide concentrations are reported as follows: Less than 1.0 Mg/1, two decimals, and report less than 0.005 ptg/1 as 0.00 Mg/1; 1.0 /*g/l and above, two significant figures. If more than one column or gas chromatographic system is used, report the lowest value found.
9. Precision
The results vary ±20 percent for 2,4-D at the 0.10-Mg/l level and ±10 percent at LO-jug/1 concentration.
ANALYSIS OF ORGANIC SUBSTANCE^ IN WATER 39
Reference
Goerlitz, D. F., and Lamar, W. L., 1967, Determination of phenoxy acid herbicides in water by electron- capture and microcoulometric gas chromatography: U.S. Geol. Survey Water-Supply Paper 1817-C, 21 p.
Chlorinated phenoxy acid herbicides in sediment (tentative)
Gas chromatographic method
1. Summary of method
Chlorinated phenoxy acids and their salts and esters are extracted from an acidified slurry of sediment and water with acetone and ether. The extract is hydrolyzed, and extraneous materials are removed with a solvent wash. The acids are converted to their methyl esters and are further cleaned up on an adsorption microcolumn. The esters are determined by gas chromatography.
2. Application
This method may be used for the analysis of esters and salts of 2,4-D (2,4-dichlorophenoxy- acetic acid), silvex [2-(2 ,4,5-trichlorophenoxy) propionic acid], and 2,4,5-T (2,4,5-trichloro- phenoxyacetic acid), and similar herbicides found in sediments.
3. Interferences
Halogenated organic acids having properties similar to the herbicides cause interference when BF3-methanol esterification is used, and both the extraneous acids and halogenated phenols inter fere when diazomethane is used for esterification.
4. Apparatus
See steps 4, "Gas Chromatographic Analysis of Pesticides'* and "Chlorinated Phenoxy Acid Herbicides in Water,"
4.1 Shaker table, or combination shaker table and wrist-action shaker having a 12-container capacity.
5. Reagents
See step 5, "Chlorinated Phenoxy Acid Herbi cides in Water."
5.1 Acetone, distilled in glass, pesticide-
analysis quality, such as Nanograde, or equiva lent.
5.2 Hydrochloric acid, concentrated (sp gr 1.18), ACS reagent grade.
5.3 Sodium sulfale solution, 0.35 Jl/: Prepare by dissolving 50 g neutral sodium sulfate in 1.0 liter distilled water.
6. Procedure
Samples should be collected according to the recommended practice for suspended sediment or bed materials. The samples must be iced or re frigerated. The analysis should begin as soon as possible because the herbicides, particularly 2,4-D, may decompose significantly in a few hours. Samples should be kept in tightly closed glass containers to prevent water loss and con tamination. A reagent blank must accompany the analysis.
6.1 Excess water is separated from the sedi ment as described in steps 6.1 and 6.2, "Chlo rinated Hydrocarbon Insecticides in Suspended Sediment and Bottom Material." The water from suspended sediment samples is analyzed as in the procedure, "Chlorinated Phenoxy Acid Herbi cides in Water/ 7 using proportionally less ether for smaller amounts of water. Water separated from bed material is included in step 6.5, below.
6.2 Thoroughly mix the moist solid until homogeneous and weigh 50.0 g into a 250-ml eiienmeyer flask having a ground-glass stopper. Also at this time, weigh an additional 10.00 g of sample into a tared 50-ml beaker to be heated at 130°C overnight for moisture determination.
6.3 While stirring, slowly add water to the sample in the erlenmeyer flask until the mixture has the consistency of paste, or until water begins to separate. Acidify the slurry to pH 2 or below by the addition, by drops, of concentrated hydro chloric acid. Allow to stand with occasional stirring for 15 min, and insure that the pH re mains below 2. Add more acid if necessary and until stabilized.
6.4 Measure 40 ml acetone into the erlen meyer flask containing the acidified sample and clamp the stopper in place. Mix the contents of the flask for 20 min using the wrist-action shaker. Add 80 ml ether and shake again for 10 min. De cant the extract into an appropriate-sized separa- tory funnel containing 250 ml 0.35M sodium sulfate.
40 TECHNIQUES OF WATER-RESOURCES INVESTIGATIONS
NOTE.—If the sediment does not settle to allow decanting the solvent, add anhydrous sodium sulfate in small amounts until the mixture separates. A quantity of sodium sulfate equal to the amount of sample may be added if necessary. To ensure adequate recovery, measure the volume of extract at each decanting step.
Add 20 ml acetone to the erlenmeyer flask and shake 20 min. Again, add 80 ml ether, shake 10 min, and decant the extract into the separatory funnel. Repeat the process as in the second ex traction one more time, and collect the acetone- ether extract in the separatory funnel containing the 0.35M sodium sulfate solution.
6.5 If any water was separated in step 6.1 above, mix thoroughly and weigh out an aliquot equivalent to the fraction of solid taken for analysis. Transfer the aliquot of water to the separatory funnel containing the sample extract and the sodium sulfate solution.
6.6 Gently mix the contents of the separa tory funnel for about 1 min and allow the layers to separate. Collect the aqueous layer in a clean beaker and collect the extract in a 500-ml ground- glass erlenmeyer flask. Back-extract the water wash with 25 ml ether. Separate the aqueous layer and discard. Pour the ether layer into the erlenmeyer flask containing the sample extract.
6.7 Add 5 ml 7M aqueous potassium hy
droxide and 15 ml distilled water to the extract in the 500-ml erlenmeyer flask. Add a boiling chip and fit the flask with a 1-ball Snyder column. Evaporate the ether on a steam bath in a hood and continue the heating for a total of 90 min. Continue the analysis, beginning at step 6.4, "Chlorinated Phenoxy Acid Herbicides in Water."
7. Calculations
See step 7, "Gas Chromutographic Analysis of Pesticides."
Each gas chromatographic system must be calibrated with standards. Methyl ester standards of the herbicides must be converted to the acid equivalent. During analysis, at least two stand ards should be run so that the detector response curve can be corrected for day-to-day instru mental fluctuation.
8. Report
Pesticide concentrations in sediment are re ported as follows: Less than 1.0 jug/kg; two decimals; 1.0 Mg/kg and above, to two significant figures. If more than one column or the gas chromatographic system is used, report the lowest value found.
9. Precision
No precision d;iUi are :ivail;ible ;it this time.