Embed Size (px)
Citation preview

PRODUCTION PLANNING AND PRODUCTIVITYMETHODS FOR A MOLDING MANUFACTURING FACILITY
by
Mary Elaine Johnson
B.S. Chemical Engineering, Massachusetts Institute of Technology (1993)
Submitted to theDepartment of Chemical Engineering
and theSloan School of Management
in Partial Fulfillment of theRequirements for the Degrees of
MASTER OF SCIENCE IN CHEMICAL ENGINEERING
and
MASTER OF SCIENCE IN MANAGEMENTat the
MASSACHUSETTS INSTITUTE OF TECHNOLOGYJune, 1995
C Massachusetts Institute of Technology 1995. All rights reserved
Signature of Author 2I MIT Department of Climical Engineering
MIT Sloan School of ManagementMay 12, 1995
Certified bye r 'erick J. McGarry
Professor o g neering and Polymer Engineering
Certified by _ _ / _ -...._James Utterback
ssor of Management and Engineering
Accepted by
MASSACHi SErTS INSTITUTERobert E. Cohen
Chairman, Committee for Graduate Students
JUL 12 1995

PRODUCTION PLANNING AND PRODUCTIVITYMETHODS FOR A MOLDING MANUFACTURING FACILITY
by
Mary Elaine Johnson
Submitted to the Department of Chemical Engineeringand the Sloan School of Management in partial
fulfillment of the requirements for the Degrees ofMaster of Science in Chemical Engineering
and Master of Science in Management
Abstract
This thesis focuses on production planning and productivity improvement efforts for amolding operation. The goal of these efforts is to reduce variation in quality measurementand control at its facilities and increase capacity. The facilities that are a part of themolding division are experiencing material shortages, seasonality in demand, and capacityshortages. Data collection and measurement inconsistencies provide an additionalchallenge. The limited testing of raw material inputs adds to process variation. Qualityimprovement efforts, production system yield model and production planning model arethree strategic tools used to address the issues facing the facilities.
Quality improvement efforts include increasing incoming inspection of raw materials,improving measurement of material losses through the process, and establishing theappropriate measures and procedures to determine and eliminate root cause of materialloss. Concentrating on improved product quality will reduce customer returns, provideraw material savings, and increase capacity through productivity gains. As the productreceives more processing and increases in value, the cost implications of scrapping itincrease.
The production system yield model, a facility asset utilization model, was applied toseveral facilities. This model calculates an efficiency metric for each facility based on fiveparameters: Rate of Quality Products, Run Speed Efficiency, Scheduled Time, NetProduction Rate, and Molder Run Hours. This model is a tool for management todetermine where to focus improvement efforts and to assist in standardizing productionmeasures at various facilities.
The purposes of the production planning model are to assist management in makingdecisions about the business unit on a regional level, and in establishing a strongercommunication link with all functions of the organization. The production planning modelis a spreadsheet tool that incorporates information from the Production System Yield
2

model to establish demonstrated capacity and to analyze the ability to meet variousdemand scenarios. A key finding was that a 67 percent decrease in internal process scrapwas shown to increase regional capacity five percent. For effective use andimplementation of the production planning model, production system yield model andquality improvement efforts the following is recommended: increasing transfer ofmanufacturing operating knowledge between facilities, determining appropriate levels ofexcess demonstrated capacity and levels of product inventory, and improving forecastingtools and techniques.
Thesis Supervisors:Professor Fred McGarry, Professor of Civil Engineering and Polymer EngineeringProfessor James Utterback, LFM Professor of Management and Engineering
3

Acknowledgements
The author gratefully acknowledges the support and resources made available to herthrough the Leaders for Manufacturing Program, a partnership between MIT and majorU.S. manufacturing companies.
I would like to thank my thesis advisors, Fred McGarry and Jim Utterback. Also, aspecial thanks to Dick Garrett. The author is also grateful for the support and guidanceshe received from several members of the host company. I would like to thank JimCiccarelli, Ed Selby, Mike Zurawski, Dave Pritchett, Chip Brown, Gary Petee and theentire division for their assistance throughout the internship.
In addition, I would like to thank my family for their encouragement and support.
4

Table Of ContentsAbstract .................................... ................... 2...........
A cknow ledgem ents .......................................................................................................... 4
List of Figures ............................... ........................................................ .................... 7
L ist of T ables ................................................................................................................... 9
Chapter 1: Introduction ............................................................................................ 101.1 Company Background ...................................................................... 10
1.1.1 Manufacturing Process Flow ......... 11 .................. l...111.2 Highlights of Research ............................. 121.3 Motivation for Research ............................ .......................... 3
1.3.1 Measurement of Process ............................... 151.3.2 Raw Material ........................................ 151.3.3 Scrap Rates ................................... 19
Chapter 2: Method for Improvement ....................................................................... 232.1 Quality Definition .............................. 242.2 Benefits of Quality ............................... 25
2.2.1 Relationship With Vendors ........................................ 26
Chapter 3: Production System Yield ................................... 303.1 PSY: Asset Utilization Model ................................... 31
3.1.1 Components Of The PSY Model ................................ 323.2 Analysis of PSY Model .................................. 373.3 Applications of PSY .................................. 413.4 Limitations of PSY .......................................................................... 43
Chapter 4: Production Planning Model ................................... 454.1 Components of Production Planning Model ....................... 46
4.1.1 Aggregate Sales . ....................................................................... 464.1.2 Theoretical Capacity ................................ 474.1.3 Speed Adjustments ............................. 524.1.4 Capacity Adjustments ............................. 524.1.5 Demonstrated Capacity ................... ............................... 534.1.6 Production/ Inventory Plan ........................................................ 534.1.7 Materials Requirements ............................................................. 54
4.2 Facilitating Communication .......................... 544.3 B ase Case ........................................................................................ 55
4.3.1 Comparison of 1994 Data ................................. 57
5

4.4 15% Increase in Demand ............................................................ 594.4.1 Adding Machinery .................................. 594.4.2 Productivity Improvements ................................... 674.4.3 Comparison of Alternatives ....................................................... 68
4.5 Other Production Planning Scenarios ............................... 694.5.1 Implementation of New Product Design .................................. 69
4.6 Limitations of Production Planning ........................................... 70
Chapter 5: Conclusions and Recommendations ................................... 725.1 Conclusions .................... ............................... 725.2 Recommendations for Future Work .................................... 76
Bibliography ............................ ........... ............................................................................78
Appendix .................. ................................... ...................................... 79
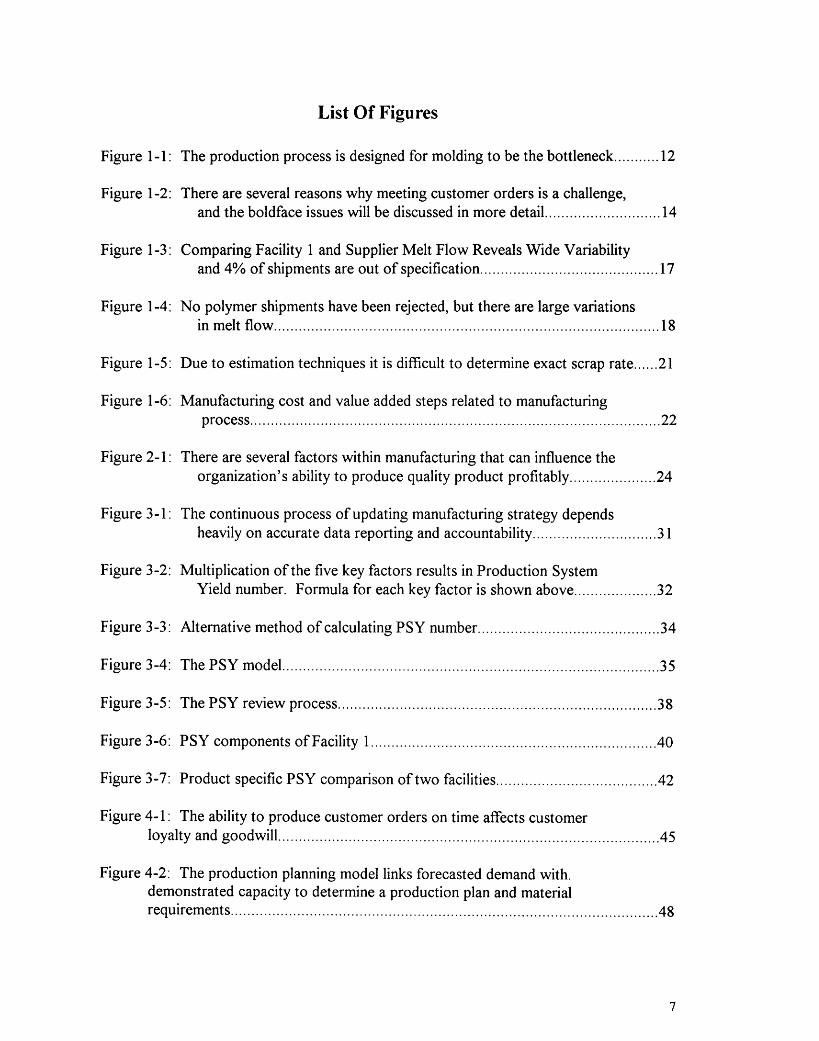
List Of Figures
Figure 1-1: The production process is designed for molding to be the bottleneck ........... 12
Figure 1-2: There are several reasons why meeting customer orders is a challenge,and the boldface issues will be discussed in more detail .......... ...............14
Figure 1-3: Comparing Facility 1 and Supplier Melt Flow Reveals Wide Variabilityand 4% of shipments are out of specification ......................................... 17
Figure 1-4: No polymer shipments have been rejected, but there are large variationsin m elt flow .................. ......... ......................................... 18
Figure 1-5: Due to estimation techniques it is difficult to determine exact scrap rate ...... 21
Figure 1-6: Manufacturing cost and value added steps related to manufacturingprocess ................................ ............................ 22
Figure 2-1: There are several factors within manufacturing that can influence theorganization's ability to produce quality product profitably ..................... 24
Figure 3-1: The continuous process of updating manufacturing strategy dependsheavily on accurate data reporting and accountability .............................. 31
Figure 3-2: Multiplication of the five key factors results in Production SystemYield number. Formula for each key factor is shown above .................... 32
Figure 3-3: Alternative method of calculating PSY number ......... .............................. 34
Figure 3-4: The PSY model . ........................................................... 35
Figure 3-5: The PSY review process ............................................................ 38
Figure 3-6: PSY components of Facility 1 . ................................................. 40
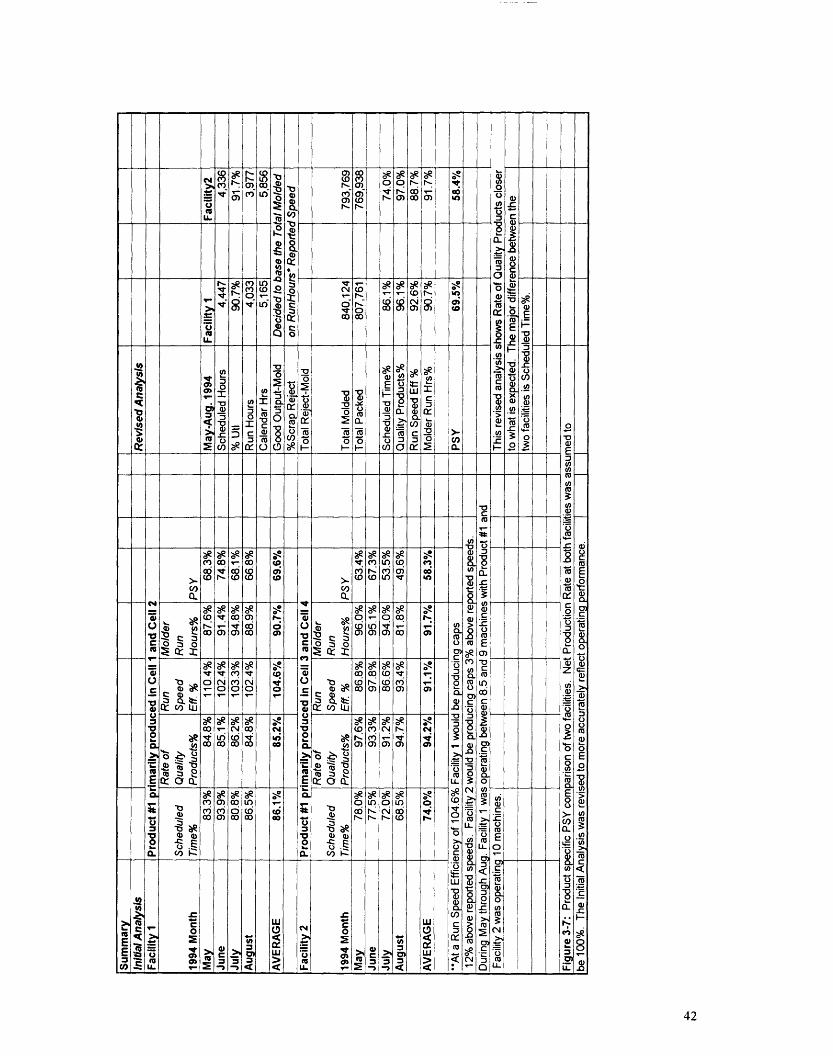
Figure 3-7: Product specific PSY comparison of two facilities ....................................... 42
Figure 4-1: The ability to produce customer orders on time affects customerloyalty and goodwill . ........................................................... 45
Figure 4-2: The production planning model links forecasted demand with.demonstrated capacity to determine a production plan and materialrequirem ents ......... .............................................................................................. 48
7

Figure 4-3: Cumulative production information shows that if demandincreases 15% every month that after May demand will not be met ..................... 58
Figure 4-4: In order to meet a demand 15% stronger than expected,given no changes in productivity, 13% more machines wouldhave to be added(total of 1.13Y machines) to the base case toensure no product shortfalls ........................................................... 61
Figure 4-5: The internal rate of return assuming existing machine throughputvaries depending on the life of the machines ........................................................ 64
Figure 4-6: The internal rate of return given a percentage change in product costfor a three, four, and five year operational period ........................................ 64
Figure 4-7: An increase in throughput increases the internal rate of return ..................... 66
Figure 4-8: A decrease in machinery utilization lowers internal rate of return .................66
Figure 5-1: A proactive improvement effort enhances a company's abilityto meet customer requirements ........................................................... 73
Figure A-1: Garvin's analysis of quality and profitability ................................................ 80
Appendix 1: This production planning model examines the impact of a new productdesign ...................... ................................... ...................................... .. 81
8

List Of Tables
Table 4-1: Capacity adjustment categories with corresponding product losses ............... 56
Table 4-2: With 1.13Y machines the region will be able to meet all orderswithout delay if demand increases 15 percent ...................................................... 62
Table 4-3: Increasing number of machines and maintaining productivitylevels increases scrapped material while orders will still be missedif productivity improvements in scrap occur but scrapped materialwill be reduced ....................................................... 68
9

Chapter 1: Introduction
1.1 Company Background
This thesis focuses on production planning and productivity improvement efforts for a
molding operation. The molding operation is part of a division of a diversified
multinational corporation. The molding division has numerous facilities manufacturing
similar products on machines at various locations globally. Some facilities are small
operations with a handful of machines while others are much larger and operate numerous
machines. In addition, a group within the division is an original equipment manufacturer
of the machinery that produces the product. Some of their competitors buy equipment
from them, while other competitors purchase an alternative technology. Research and
development, product design, and other support functions are located at headquarters.
Depending on regional markets, the intensity of competition and number of competitors
vary. Product mix varies depending on facility. Also, customer order quantity varies at
locations, with some locations having a higher product mix with many smaller orders. The
division has a large market share domestically, as well as in certain global markets. All of
the facilities combined produce billions of a similar product per year and this is on the
same scale as pill, disposable cup or paper clip production. Facilities are often regionally
located close to the customer to reduce shipping costs. In some markets, the product is a
commodity, while in others it is a specialty product. The product is generic in size, but
style, color, and appearance can change based on customer requirements.
In the past the strategy for manufacturing has been "make to order", but due to the need
to increase facility asset utilization, it is becoming "make to stock." All facilities have a
degree of seasonality for the products they produce. As the demand for the product
increases, in all of the markets they compete in, the level of competition is increasing. The
division is rapidly expanding internationally to better serve the increased demand, as well
as to better serve customers requiring in-country manufacture. To maintain high
utilization of capacity and ensure that orders are met, when possible or necessary, facilities
10

will support each other with product. Price and quality have increasingly been issues.
Certain customers are requiring shorter lead times between order placement and product
delivery. Due to the increased competitive environment, cost, quality, increased
productivity, and capacity are critical issues. Material costs are rapidly increasing due to
tight supply. Presently, the division relies on multiple suppliers of raw materials.
1.1.1 Manufacturing Process Flow
The process has three basic steps, as shown in Figure 1-1. In the first step, polymer is
extruded and molded into the product design shape. The rate limiting step in the process
varies, depending on equipment layout. Inspection of molded product is performed by
operators at regular time intervals to ensure the product has the correct dimensions and
meets specifications. There are numerous reasons why product could be scrapped and
these include machine startups, color changes, off-color product, other visual defects,
mechanical defects, incorrect dimensions, and process adjustment, etc.. Blocks of
extruded polymer that are not molded into product shape, polymer purge, are sold.
Generally, the amount of polymer purge is small in comparison to scrapped product and
may occur during startup or when a process upset occurs. Product that is scrapped after
the first step can be reground and the polymer can be reused in the process. During the
later steps of the process polymer cannot be recycled. Depending on the product and
customer specification, an off-line step may need to be performed or Step 2 and/or Step 3
may not be needed.
In Step 2, Post Mold Processing, additional functional requirements of the product are
added, and the product is modified to meet customer specification. A customer specified
and approved material, such as a customer approved polymer, will be incorporated into
the product. Customer approved polymer purge and scrapped product(molded unit with
or without customer approved polymer) are both sold. Product can be scrapped for the
same reasons as in molding. In addition to operator inspection, on-line and off-line
product inspection machines evaluate product for defects.
11

In Step 3, final finishing of the product is done, but no additional mechanical modification
is performed. This final step includes labeling and packaging the product. The operators
inspect the product at regular time intervals. Product scrap reasons are similar to those
mentioned earlier. After the product is packed into a box it is sent to the warehouse and
shipped to the customer.
Step 1
Heatedpolymer - 1extrudate
Step 2
Step 3
Warehouse andShip to customer
~- scrapped product ,-- polymer isrecycled
-- polymer purge*
customer approvedpolymer purge*
- scrapped product*
_. scrapped product*I *scrap and a percent ofpurge are sold
- > Customer Returns
The production process is designed for molding to be thebottleneck. During each step inspection determines if productcontains defects. Scrapped product at the molding step isrecycled and reused in the process while other scrap is sold.
1.2 Highlights of Research
The need for standardization and control as well as the present state of material and
quality management within the division lead to the thesis focus. The major topics of the
thesis are material and quality systems, measurement control and the benefits of
12
Mold
Post-MoldProcessing
(add requirements)
Finishing
(label and print)
Figure 1-1:
-
production planning at a regional aggregate level. The remainder of this chapter explains
the motivation for the thesis. In Chapter 2, an initial framework for addressing quality,
measurement control and the linkage between scrap, speed and capacity as it relates to
production planning is outlined. The need to define quality is discussed as well as how
quality can positively impact activities within the organization. In Chapter 3, a
measurement control model, Production System Yield, is explained and the benefits and
limitations of the model are examined. In Chapter 4, Production Planning expands on the
work of Chapter 3 and discusses capacity losses and their implications on manufacturing
and material requirements. Chapter 5 re emphasizes the benefits of quality measurement
processes and control and some of the key learnings.
1..3 Motivation For Research
As the business unit has grown in size many issues have arisen. Figure 1-2 shows several
major reasons why meeting customer orders has become an increasingly difficult task. As
the division begins to grow, linking demand forecast, production planning, productivity
and materials requirements become essential. Raw material shortages in 1994 and 1995
and limited capacity are major issues facing most locations. Planning production levels is
a challenge, since marketing could be off as much as 20 percent on forecasted demand.
Marketing states that the customers do not have a good feel for what their demand is and
this makes it difficult to determine. In the past, the strategy of manufacturing has been
make to order, but as demand increases beyond capacity in peak months it is difficult to
maintain this focus without adding capacity. To counteract the seasonality of the business,
inventory leveling is being attempted. However, excess capacity targets to provide
flexibility and inventory targets have not been firmly established. Product mix, tool
shortages, and product changeovers are major scheduling issues. Also, an effort to
standardize manufacturing performance measures is beginning since information is
required on issues such as downtime, scrap rates, and promised performance.
13

The organization has a very lean management structure. Being geographically spread out
increases the challenges of managing the business. The rapid growth and expansion has
created a reactionary environment where individuals are responding to day-to-day crises.
Therefore, a limited number of people are involved in planning, competitive
benchmarking, and sharing of knowledge between facilities. New customers are being
acquired, but not as quickly as they could be in specific markets since there is not enough
capacity to meet demand. In certain markets the facilities do not have space to add new
machines and the market is mature, therefore, the business unit does not want to add
additional capital. These more mature facilities are supporting demand in emerging
markets while plants are completed and expanded to support local demand. Resources at
the mature facilities are also being assigned to assist in plant start ups. Expansion has not
slowed, so the problem of mature markets supporting new markets will continue.
Limited Material Qualityand Quantity Result in Wasteand Shutdowns
Customer Returns
Product Bottlenecks,Tool Shortages, andProduct ChangeoversAffect Scheduling
L ,
Present MeasuresDo Not Lead ToBusiness Accountability
Better Tactical Data Expansion To AddTo Identify Causes of Plants and MachinesProblems is Needed Causes Delay
Wide Variations inAccuracy of ForecastedDemand
Figure 1-2: There are several reasons why meeting customer orders is achallenge, and the boldface issues will be discussed in moredetail.
14
·
Insufficient Capacityat Certain Facilities
Difficulty MeetingCustomer Orders
- Ii II i i
A

1.3.1 Measurement Of Process
The facilities collect a large amount of data. Data collection measures were implemented
because the information may be helpful in the future. When a new measurement system
was created, the old system was not modified or eliminated, since certain individuals still
use the old system. There is no agreement or standard on one measurement system. Also,
the data that is recorded does not always reveal the root cause of problems. When an
equipment failure occurs and results in the shutdown of a machine there may be several
options for the operator to record downtime for the same failure. For the first step in the
process there are 100 downtime codes for why a molding machine that is scheduled to run
is not operating. Facilities also have the ability to customize and add their own codes.
Oftentimes, there is no agreement on downtime definitions by data collectors and all users
of the data. Therefore, data accuracy is not consistent and becomes questionable when
making decisions. Also, the structure for people to be accountable for their data is not in
place. When a facility runs out of material unexpectedly it is not always clear who is
responsible for ensuring the situation is resolved.
1.3.2 Raw Material
There is a limited amount of raw material available to make the product. Increased
demand for polymer, natural disasters that have closed down polymer facilities, and the
delay of new plants producing the polymer all have contributed to creating a worldwide
shortage. Some suppliers will not guarantee that they can provide material. One supplier
has an exclusive contract with the competition. Also, the price of polymer is rapidly
increasing, escalating manufacturing costs. Although increases in the price of the product
have been announced, these increases have not kept up with the escalating material costs
to the facilities, and the customers have not always agreed to the increased price. One
facility shut down for several days since they could not get additional shipments of
polymer material. If a facility has 10 molding machines, shutting down one molding
machine for a day results in a ten percent average daily revenue loss. Based on facility
size, shutdowns due to material shortages can be extremely costly. Although some
15
recycling of material is done after the first process step, not all of the facilities are
committed to doing it. One facility has the equipment in place to recycle material, but
over time, recycling was stopped. Assuming that this one facility could recycle 70 percent
of scrapped material after the first process over an eight month period it could have saved
approximately one percent of material costs(this number is based on material cost during
the seven month period, and material costs have increased 20 percent since then).
There is limited or no quality inspection of incoming material. Raw material suppliers are
certified to ensure that material specifications can be met. The philosophy of the facilities
has been to trust the suppliers to test material in their performance laboratories.
Additional testing equipment and training are considered to be too costly. Also, labor
would need to be trained to do these tests. There are some questions regarding the
appropriate tests to perform, since correlations on which material properties will result in
product defects or increased process waste are not well defined. One facility does a melt
flow index as their check and it had rejected four percent of shipments in 1994 as shown in
Figure 1-3. Melt flow is a measure of polymer molecular weight or chain length, reported
in grams. The target melt flow is X grams and the upper and lower specifications are
1.1 8X grams and 0.82X grams respectively. The suppliers and facilities melt flow
measures cover the whole specification range during the given time period. Figure 1-4
shows that this facility has not rejected material in 1995, but the variation in melt flow is
considerable. Other facilities do not do this test, so there is no basis for them to reject
incoming raw material shipments.
16

c r.
wD '[ kL; o U- I
+1', 1 E,t i 5 .
(swer.i) .ia!lddnS pur l!!am Sq luauainsalN MoIj la]W °
0
o
C,
0
tr6/6 L Z/
t16/16,1L 'C
t6/lZ/O L
t?6/L/O L
t,6/Z/O 1
V6//6 0t'6/l6 0
t6/ 1/L C
tr6/6ZL/Z
t61/9/
tb6// I/S t6191/ r
b6/ZL/L
t61,L £ -
17

x x x00 X X - o
(swve) .ia!lddnS pue iatuosn Xq sluauwainsuaN MOi laWE
0
lo
,AI::
.C
S6191£ >
S6/l, /
S61/GZIZ co
S61I . , -
I~S6I 96/Z/Zm961/LZ -)
96/OZIL
S6/91 W 4
00
zS6SZIL l96/gL L
S6// L
C C:0 W =
S [+t= I K &
u = Pd2IIHIEn~:
18

1.3.3 Scrap Rates
In Figure 1-1 the various types of scrap that are measured are given. The definition of
scrap varies and all definitions have some component of estimation in them. Reported
Total Process Scrap is the daily scrap occurring during these three steps which direct labor
identifies, estimates and records as having been generated. Estimation techniques involve
direct labor visually determining how full a given container of scrap is and converting this
value to number of units scrapped. A gap between reported and calculated scrap rates
exists, and Figure 1-5 illustrates this gap over a ten month period. For the ten month
period, if calculated scrap was X percent, reported scrap was 0.3X percent. Part of direct
labor's performance evaluation is tied to individual scrap rates, and is one possible
indicator of why reported scrap rates are lower than calculated. Calculated Total Process
Scrap is a measure used in the Production System Yield model; the latter is defined in
detail in Chapter 3. Calculated total process scrap is a measure of scrap between the mold
process and completion of finishing process. There is an actual count of the product at the
Finishing step that is boxed and ready for shipment (packed), but the amount of product
molded is often estimated, which may cause some error in the calculated scrap number.
The definition of calculated total process scrap is one minus the quantity of product
packed divided by total product molded.
Since the calculated total process scrap measure relies on estimation, a check of the
assumptions suggests that this number overstates the scrap levels. Given the reported
total molded number, machine speeds can be back calculated. Operators record machine
speeds(this includes molder speeds) once a day and they are generally constant, with
minor fluctuations. The total product molded measure should approximately equal the
reported molding machine speed multiplied by molding machine run hours. Molding
machine run hours are recorded by the operator from the machine controller (electronic
control system that operator resets at given intervals). Molding machines would have to
operate between four to five percent faster than reported for the calculated total scrap
measure to be valid. Assuming the reported molder speed is correct, and using molding
machine run hours, a revised number for scrap, the Estimated Total Scrap Rate, can be
19

determined. This estimated scrap rate is 0.6X percent for the ten months (versus X
percent for calculated scrap) and this number is between reported and calculated. The
estimated scrap rate is one minus the quantity packed divided by the quantity molding
machine run hours multiplied by reported molder run speed. Although there is potential
for machine run hours to be understated, it is a more accurate number to use to calculate
total product molded than using a total molded number based on visual estimation. If
estimated total scrap rate is assumed to be the actual scrap rate, then approximately six
percent in potential revenue was foregone at Facility 1. Another way to state this is that
producing this level of scrap during the given ten month period is the same as having two
machines unable to operate for eight months.
Material usage is important to other functions within the organization outside of
manufacturing. The finance department keeps track of how much material was used for
the month based on silo inventory and compares this to the amount of quality product
produced and Reported Total Process Scrap Rates. A variance suggests that there is a
discrepancy between the amount of material used in the process and the amount of
material purchased for use. During a ten month period Facility 1 was able to account for
98 percent of purchased material that entered the process, with 97 percent ending up as
shipped product, and one percent ending up as reported scrap. At Facility 1, two percent
of material that entered the process could not be accounted for. Some information on
material usage is not recorded, since there is no process or procedure in place to capture
this information. An example is that research and development performs designed
experiments on production equipment, and may or may not use their own materials.
Generally, it is assumed that information that is not recorded is a small fraction of the
overall material used.
20

Month Calculated Total Reported Total Estimated TotalProcess Scrap Process Scrap Process Scrap
January Xl% 0.33 X1% 0.59 X1%February X2 % 0.41 X 2 % 0.67 X2 %
March X3% 0.34 X3 % 0.63 X 3%
April X4% 0.34 X 4 % 0.68 X4%
May X5% 0.28 Xs% 0.63 Xs%June X6% 0.23 X6% 0.56 X6%July X7% 0.23 X7% 0.47 X7%
August X8% 0.23 Xs% 0.60 Xs%September X9% 0.24 X9% 0.58 X9%October Xlo% 0.20 Xlo% 0.46 Xlo%Year to Date 1994 X% 0.3 X % 0.6 X %
CALCULATED = 1 - (PACKED/TOTAL MOLDED)REPORTED = VISUAL ESTIMATION BY OPERATORESTIMATED = 1 - (PACKED/(RUN HRS. x "REPORTED" MOLDER SPEED))
Figure 1-5: Due to estimation techniques it is difficult to determine the exact scrap rate.
Customer returns are also a part of scrap. At a minimum, when a customer returns
product, a partial or full product price credit is given, depending on the reason for the
return. Over an eight month period of time Facility 1 had 0.2 percent of product
shipments result in returns and Facility 2 had 1.3 percent of product shipments result in
returns. After the product goes through the finishing process, no additional value is
added to it but shipping product to the customer does add cost. Figure 1-6 show the
major cost steps and the value added steps that the product undergoes prior to leaving the
facility. The value added steps are during product processing. An additional cost that is
not shown is inspection cost incurred after each manufacturing step. There are more cost
steps in the process than value added steps.
21

MANUFACTURING STEPS COST STEPS
extrude polymer
Polymer Value
MoRegrind process
scrap
additional rawmaterial Functc
Requin
processscrap 1
sell I
Finishing
Processing/ScrapReprocessingCost
Raw Material Value
Processing Cost
Processing Cost
Provide ProductShape
Add FunctionalRequirementsand Customization
AdditonalCustomization
Warehouse
Ship to Customer
Holding Cost
Shipping Cost
Figure 1-6: Manufacturing cost and value added steps related to manufacturing process.
22
Silo withPolymer
VALUE-ADDEDSTEPS
Id
inalements

Chapter 2: Method For Improvement
A framework for addressing the issues facing the facilities will provide a systems approach
to working toward improvement. Included in this framework is an increased quality
focus, a measurement control plan emphasizing the reduction of disruptions and variations
in manufacturing, and an understanding of linkages between variables that will increase
capacity and throughput. Quality and quality goals need to be defined for the
organization, programs and measures determined to help the organization achieve these
goals, and documentation of results of quality initiatives provided. Process evaluation,
which includes measurement tools, can help determine the status of the process.
Monitoring, by measuring the process, assists in providing information to improve
troubled areas. The difficulty is to determine what to measure and what tools to use.
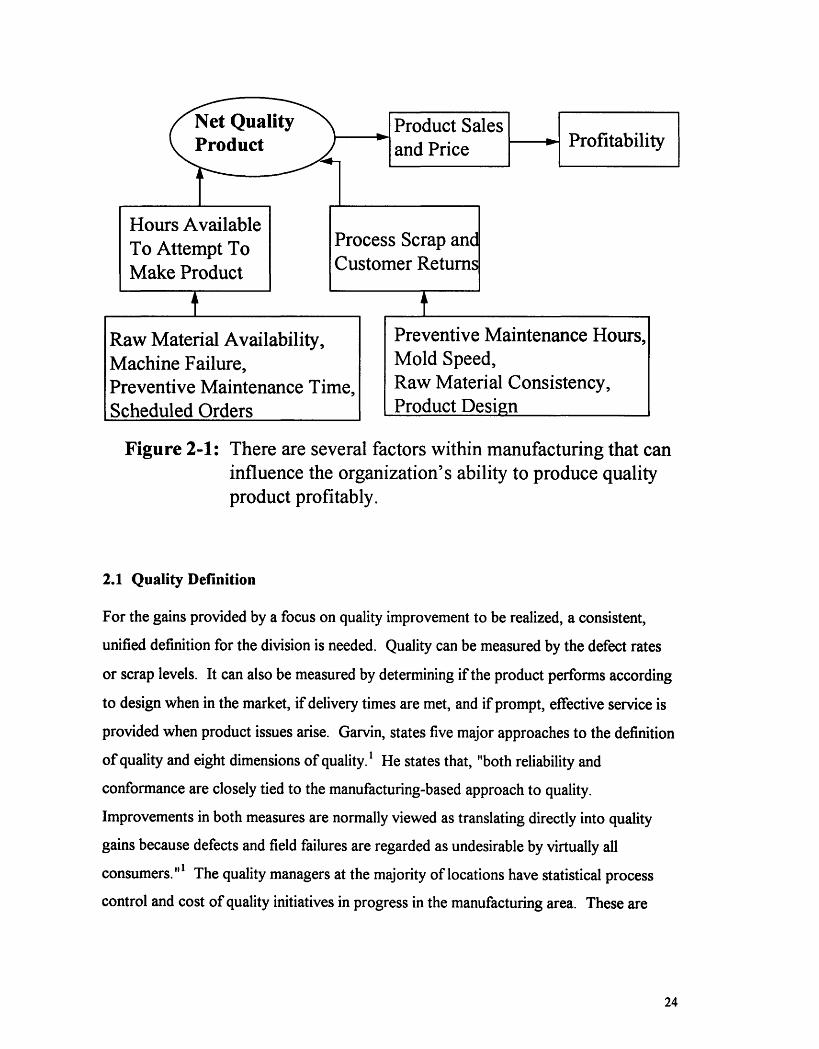
There are several factors that influence the organization's ability to produce quality
product profitably, as shown in Figure 2-1. The quantity and quality of raw material
available influence the time available to make product, as well as the quality of product
produced. There is a tradeoff between performing preventive maintenance versus not
performing preventive maintenance in order to continue making product. If preventive
maintenance is not performed, at some point, the machines will fail. Methods to improve
quality product are desirable, since quality product affects profitability. A quality initiative
is one method of increasing the amount of product that the customer receives. In later
chapters, other methods that can be implemented in conjunction with the quality control
program will be examined.
23
Raw Material Availability, Preventive Maintenance Hours,Machine Failure, Mold Speed,Preventive Maintenance Time, Raw Material Consistency,Scheduled Orders Product Design
Figure 2-1: There are several factors within manufacturing that caninfluence the organization's ability to produce qualityproduct profitably.
2.1 Quality Definition
For the gains provided by a focus on quality improvement to be realized, a consistent,
unified definition for the division is needed. Quality can be measured by the defect rates
or scrap levels. It can also be measured by determining if the product performs according
to design when in the market, if delivery times are met, and if prompt, effective service is
provided when product issues arise. Garvin, states five major approaches to the definition
of quality and eight dimensions of quality.' He states that, "both reliability and
conformance are closely tied to the manufacturing-based approach to quality.
Improvements in both measures are normally viewed as translating directly into quality
gains because defects and field failures are regarded as undesirable by virtually all
consumers."' The quality managers at the majority of locations have statistical process
control and cost of quality initiatives in progress in the manufacturing area. These are
24
Hours AvailableTo Attempt ToMake Product
Process Scrap andCustomer Return
Net Qualit Product Sales m rftbltProduct I-r and Price 'ftbly

both conformance quality measurement tools. Another component of conformance quality
is establishing accountability for quality.
A quality mandate will need to be initiated from a high level within the business. A
division wide standard for quality will allow all of the facilities to share resources to better
meet demand fluctuations. Although certain facilities feel that their product quality is
adequate for their market, the product quality is known to be unacceptable in other
markets. Therefore, a quality standard that will be suitable for all markets or the markets
a, facility could potentially support will need to be established. This standard will state
mold, post-mold, and finishing requirements for the product as well as what raw material
requirements are needed.
In order to make quality a competitive advantage there will need to be a cultural change
around how quality is viewed within the organization. Vendors will need to be held
accountable for providing quality products. If individuals within the organization are
unaware of what the appropriate parameters to test incoming material for quality are, then
efforts to investigate these parameters will need to be initiated. If quality is to be a priority
then a long term investment in it is necessary. The organization will have to undergo a
learning process. One result of the learning will be redesigned tasks, processes,
procedures and attitudes that ensure quality product is achieved. If the capabilities to
move forward with the quality initiative are not presently within the organization, again a
long term decision to invest in building and acquiring these capabilities will need to be
assessed. The result of a quality initiative should allow the organization to say how they
can differentiate themselves in regard to the competition when it comes to quality. The
goal of measurement is to help deliver more quality product to the customer effectively.
2.2 Benefits Of Quality
Some of the benefits of quality will be easy to measure, while it will be a challenge to
quantify others. Gordon and Wiseman conducted studies of Canadian manufacturers to
25

determine plant best practices and stated that, "the most successful manufacturing plants
participating in this survey emphasized quality-related practices over all other
manufacturing priorities."2 When the organization focuses on and accomplishes
producing the product to specified requirements the first time through the process, less
material will be wasted as scrap, customer returns will be reduced, and capacity to
produce additional good product will increase. All of these benefits will improve cost of
raw materials, cost of reprocessing customer returns and cost of crediting customer for
additional units and possible damages due to defects.' Garvin's analysis of the impact of
improved quality on profitability is given in the Appendix. Although the business unit
understands the customer's perception of quality, it is difficult to determine which
parameters influence quality. A quality effort that is made as a long term commitment that
results in a change in mind set within the organization will result in intangible benefits such
as more orders due to improved customer service and satisfaction, and improved
performance in the field. It is not sufficient to have pockets of your organization
preaching quality. In Juran's view, top management's role is to ensure that all of the
organization is quality focused.3 As quality levels increase at the various facilities, product
performance across facilities will increase, allowing the organization to leverage
worldwide capacity.
2.2.1 Relationship with Vendors
Ideally, the facility wants to have enough confidence in supplier quality that raw materials
do not need to be checked, but suppliers can adversely affect quality. Long term
relationships with suppliers are not sufficient to ensure quality; verification is. To ensure
the availability of raw materials the facilities use multiple suppliers, and this increases the
likelihood of variation in raw materials. Increased variation will cause operators to adjust
machines more frequently. To reduce this variation incoming inspection is needed. An
audit program is not enough because it does not guarantee that all product will meet
specification.
26
Due to polymer shortages it is a challenge negotiating terms with suppliers, but if possible,
working toward tightening specifications over time can help reduce variation. Melt flow
provides the opportunity to characterize polymer chain length. Adding the melt flow at all
locations will give at least some check on consistency of product at locations. Also, melt
flow on other raw materials used in post-mold processing would be beneficial. Otherwise,
there is no way at checking what is being fed to the process. In Chapter 1, the acceptable
melt flow range was large. Over time narrowing this range(i.e. 0.9X-1.09X grams, with a
target of X) will allow materials with less variation to enter the process. In addition, there
is value in examining other testing methods and the potential benefits versus costs.
Density measurement would provide additional polymer characterization. A technique for
gaining information on appropriate measures is to benchmark what other molding
manufacturers do to check suppliers. Possible benchmark candidates are direct
competition or molding manufacturer's in another industry, and in addition the experience
would be valuable in learning alternative material handling and analysis procedures.
Other factors that contribute to quality are product and process design; customer and
technical support and shipping companies. Shipping companies need to be accountable for
damaged boxes and late deliveries. Increased design for manufacturability efforts can
ensure products that are easier to manufacture. Issues such as improper cooling and tool
wear can contribute to product defects. The division can leverage the fact that it is an
original equipment manufacturer to learn ways to reduce equipment related defects.
Technical and customer support can assist in quality improvements by revising and
determining measures, processes and procedures to address root causes of product defect
and performance issues.
A material tracking initiative was started at Facility 1 in November 1994 after
discrepancies between calculated and reported scrap were emphasized. The purpose of
material tracking was to accurately track material usage through the process. The material
tracking team defined scrap as all losses of material that occur during the production
process, or any material entering into the process not resulting in good product. Presently
27

facility 1 has started to weigh scrap at the end of the shift. When there is a discrepancy
between total weighed scrap at the end of a shift and reported scrap, reported is increased
to reflect the weighed amount. The present technique does not allow the operators to
pinpoint at which process the discrepancy occurs. In the future the facility plans to have
scales at every process and as scrap occurs it will be weighed and the reason for scrap
recorded. This method will alleviate the need to estimate scrap. The facility is still
examining effective ways to measure the total amount of product molded at the molding
machine.
Material is considered to enter into the process as soon as it arrives at the facility.
Therefore scrap losses could occur before the material was processed and this needs to be
captured. Accurate data need to be obtained on where scrap is occurring. Also, working
with finance, who keep material variance information, will provide a cross check on data
accuracy. Other functions, such as purchasing may also be appropriate to work with. In
addition, procedures for material usage between groups such as research and development
and machinery will need to be set up.
Early detection of insufficient product quality is essential since as the material is processed
it goes through several steps which add value. Therefore, ensuring early on in the process
that material meets specifications will reduce the need to scrap product that has had value
added to it. The more processing that the product receives, the more value it has, and
more costly it is if the product needs to be scrapped. After the molding process the
polymer can be recycled, and this scrap does not add significantly to material costs. After
post-mold processing and finishing any scrap is sold and cannot be recycled, therefore
increasing raw material costs. If product is returned, the costs are significantly higher than
if the defect had been identified before the product was shipped. Therefore there may be a
tradeoff between higher internal scrap rates to reduce customer returns. Also, a tradeoff
between more costly incoming inspection to reduce internal scrap rates can exist. The
upfront, proactive investment to ensure quality when the product is still of very low value
will reduce costly quality issues later in processing chain. Over time the manufacturing
28

learning curve regarding quality increases and it becomes even more efficient to produce
quality product. Fine states that "economic conformance level analysis (i.e. cost of quality
minimization) provides an accurate model of the strategic quality optimization problem,
but that quality improvement enhances learning about the production process so that the
costs of achieving high quality decreases over time and zero defects becomes the long-run
cost minimizing quality level. " 4
29

Chapter 3: Production System Yield Model
The purpose of manufacturing strategy is to establish and implement a method to achieve
competitive advantage by determining what capabilities within the organization need to be
strengthened and built. Figure 3-1 illustrates the importance of data and accountability
throughout the manufacturing strategy process. Consistent and accurate data are essential
for any improvement plan, since data provide an indicator of existing performance. Once
a baseline level of performance is established, effective plans to improve performance can
be created. Progress over time will be monitored to ensure that the intended results are
being achieved. In addition, by having all facilities use common metrics performance
comparisons are less ambiguous, therefore facilitating communication and sharing of best
practices at facilities. Incentives and accountability can influence accuracy of data. To
ensure that strategy and improvement programs are on schedule, organizations need to set
up data reporting and accountability structure. As business needs change the system will
need to respond accordingly or be modified. Reassessment of data collection and
measurement systems should occur frequently to ensure that appropriate information is
available in a quick and reliable manner.
As the division's facilities began to expand, centralized manufacturing support wanted a
standardized method to compare performance across the facilities. It was considered by
manufacturing support to be valuable for each facility to more effectively manage their
operations by improving utilization of assets. Also, the company needed to increase
capacity without investing in additional equipment at certain facilities. The following
questions were asked: "Is existing equipment being used to its full potential?" and "Do
each of the facilities report performance information in a consistent format?" The
Production System Yield (PSY) model was created to address these questions. An
increase in Production System Yield would effectively result in a capacity increase.
30

Figure 3-1: The continuous process of updating manufacturing strategy dependsheavily on accurate data reporting and accountability.
3.1 PSY: Asset Utilization Model
The PSY model is a facility asset utilization model, developed by centralized
manufacturing support. This model is being used to measure performance at facilities over
a given time period and to determine areas where productivity improvement efforts can be
focused. Kerkhoff provides an example of an asset utilization model used to measure
individual machine performance measures to gain manufacturing improvements. 5
Opportunities for improvement are determined by tracking key performance factors that
indicate a facility's productivity levels. The five key factors are: Rate of Quality Products,
Run Speed Efficiency, Molder Run Hours, Scheduled Time and Net Production Rate.
Multiplication of the five factors results in a PSY number. Figure 3-2 provides a summary
of the PSY formulas.
31

PSY I SCHEDULED RATE% RUN MOLDER NETTIME % X QUALITY X SPEED X RUN X PROD
PRODUCTS EFFICIENCY% HOURS % RATE %
SCHEDULED HOURS PACKED + WIPa (TOTAL MOLDED/RUN MIN) RUN HOURS PACKED - RETURNS - INV OBSOMOLDERS X CALENDAR HRS TOTAL MOLDED DESIGN SPEED SCHEDULED HOURS PACKED
IDLE TIME LOSSES CLOSURE SCRAP RATE MOLDER SPEED DOWNTIME %
I -A 1 -B DESIGN SPEED X C 1-D
Figure 3-2: Multiplication of the five key factors results in Production SystemYield number. Formula for each key factor is shown above.
3.1.1 Components Of The PSY Model
Scheduled Time Percent, component A of the PSY formula in Figure 3-2, measures the
amount of time the facility was scheduled to operate against calendar hours. Scheduled
time percentage is calculated by dividing scheduled molder hours by the quantity number
of molders times calendar hours. Idle time losses equals 100 percent minus Scheduled
Time percent. Preventative maintenance is not an idle time loss, but is considered under
downtime. The model tracks the idle time losses such as seasonality, material shortages,
insufficient crewing, and no tooling. Also, sales versus projected production, order lead
times and equipment shortages are tracked in an effort to focus on what idle time losses
are occurring.
Rate of quality products, component B, measures the amount of quality sellable product
being boxed (packed) and ready for shipment to the customers. This is calculated by
dividing the quantity packed product plus change in Work in Progress(WIP) by total
32
product molded. Scrap equals 100 percent minus Rate of Quality Products percent.
Pareto charts of scrap by process, product, machine, and scrap cause by process assist in
understanding the calculated rate of quality products.
Run Speed Efficiency, component C, measures the performance of the molding machines
against the manufacturer's design speed. This is calculated by dividing the total quantity
molded product by machine run minutes (minutes machine operating and producing
product) and by design speed. The molder speed is calculated by multiplying the design
speed by the run speed efficiency. The model provides a Pareto of molder set speed by
product and color, since the run speed efficiency is based on a weighted product speed
average.
Molder run hours, component D of the PSY formula in Figure 3-2, is the percentage of
operating time that the molding machine is actually operating and producing product.
While operating, the product produced is either sellable product or scrapped product.
Molder run hours is calculated by dividing machine run hours (hours molding machine is
operating and producing product) by the scheduled molder hours(hours molding machine
is scheduled to operate). Downtime is the percentage of time a molding machine was
scheduled to operate but is not operating. Downtime equals 100 percent minus Machine
Run Hours percent. The PSY model then creates Pareto charts" of the downtime reasons
and tracks specific indicators such as turnover, absenteeism, and training hours to assist in
understanding why the machine is down.
Net Production Rate, component E, tracks how much product remains sold. It is
calculated by subtracting returns and inventory obsolescence from the quantity packed
product and then dividing by packed product. The model tracks inventory obsolescence
and customer returns. Other information that is pertinent to the facility's production can
A pareto chart is a bar graph that ranks the biggest problems on the left followed by lesser problems.Arranging problems in this order helps in determining which problem to attack first.
33

be found on the model. Product mix, closure colors, closure liners, score design, serious
injury rate, closure complaint rate, and a Pareto of top production system losses.
The PSY number can also be determined by the number of units packed and ready for
shipment minus the units that are returned and the units that are unsaleable(become
obsolete in inventory) divided by the theoretical production potential for the facility over a
given time period. Also the formula factors in work in process (WIP) changes during the
time period. This alternative formula is given in Figure 3-3.
PACKED - RETURNS - INV OBS + WIP APSY =
DESIGN SPEED x # MOLDERS x CALENDAR HRS x 60
Figure 3-3: Alternative method of calculating PSY number.
PSY can be calculated on a year to date (YTD) basis to indicate present performance or
on an estimated yearly basis to look at expected performance. With a make to order
strategy the first six months of the year may have a high average PSY due to seasonality
of the business, but the yearly estimated PSY may be much lower due to anticipated sales
decline. With a make to stock strategy the amount of packed product could increase, but
it may not be shipped to the customer. An example of a production system yield model is
shown in Figure 3-4.
34

a 'i;5 ndSw J
fo
a owI19 US0 0iI
2
wI08P A
z
35
,o,
I I As I I B
IIn ' ' i-'
8g _I I ,i :
o o g SNo e o X o
C)uscna.en
ene
z -0
t _
_ , a
I". g .1Iz3 o2
I
i;
3
,
I 1 1 94
I, g g g g g Is l~ R O
z
9 R9
: I ? > 9 '

-W
i 1 , I
I i - Il - -I
-
I l g z t I
I 6V7 z.0
I -o
u 8
~~1 IS~5
f .V)I C >~~
o~
_: ·: o% E9ffi
ozZ'
jI{c "-
po
laO ~ - ~- ~ - ~
z _ _uru
Z sol_IC) - c-
- Lo CL.:
- - o O O o o
4 1-
r I
I _
C
Toi 6D2
So
I I di
o E
o e8 E
si
o
oR
To
0L
mL1J0
U0R.
z3n
I
oo
8
3I?
0 0 0'C' 4-7 7
36
-.
Iir I - l rv
15
ei 1
t
9
02
9
-.
~~~~~~~~~~~~T
I '·
zi
-2I,
;z
4
-
I g o ee f f a Ima ma so
I
I9
9
L i.j 2 d --
d' g g g g g z i
t-
o-
9
4
'"
'"
�
'� -- P.
tuE
f
i , i -E - t r-~~~~~~~~~~~~~~~ Ii i i - s 6. . o I_ I _
I I I .I hi
i .0
1.
- I ~~r I ~~ i 9~ II iS I : i _ , I --
------ p!C:
I27
17 e I1..V)
~L· r, Iz
"9 Ih
I . . r"IQ C) C? 4
f Z .
cB.. DI.1 I-f·
. B
l11
1, ITr 1
2
0
's
U 1 I .. D-
__ e , I,�
l
I I

3.2 Analysis of PSY Model
After examining historical data for all facilities, a benchmark level of PSY was determined.
The facility that had sustained as a yearly average the highest level in a certain factor was
used as a benchmark for the given factor. Then, the five factors were multiplied together
to establish the benchmark PSY number. None of the facilities presently have attained the
benchmark PSY number, although some are close. A framework for analysis of each
facility's PSY was established. See PSY Review Process in Figure 3-5. The review
process has a location compare its PSY number and level of performance in each of the
five factors to the benchmark level. In the PSY model the factors and PSY number have
supporting data that would be analyzed to determine how to reach or exceed benchmark
levels in each area. At the end of the review process the facility's improvement action plan
would be updated to incorporate projects that increase PSY.
37

I - -1I xamme ana anaiyzepertinent data.
Figure 3-5: The PSY review process.
PSY targets were set for the worldwide organization. A one percent PSY improvement
would result in more product to the customer. There is a 35 percent difference between
high and low year to date PSY for worldwide facilities. A ten percent increase in PSY
results in effectively a ten percent increase in capacity. In Figure 3-6 the components of
PSY for Facility 1 are graphed. Monthly Percent Scheduled Time positively correlated
with monthly PSY over time. Scheduled time is an indicator where very little data is
presently recorded, but an increase in scheduled time will have the largest impact on PSY.
A larger increase in PSY will result by focusing on those factors with the lowest
percentages. This graph shows that PSY X Month and Scheduled Time have the same
trend. There is more variation monthly in Shipped PSY than PSY X Month. When
Shipped and monthly PSY are the same that means that the packed product equaled the
amount of product shipped in a given month. The year to date PSY numbers for Shipped
PSY and PSY X Month are very similar.
38

The PSY data revealed discrepancies in reporting. The Product Scrap Rate that was
calculated using the model was very different than the reported scrap rate at both facilities.
A team was set up to close the gap between reported and calculated scrap rate and to
implement procedures that would improve the accuracy of data collection, and identify
ways to reduce scrap losses. Facility 2 changed the definition of certain downtime codes
in August and this resulted in a much lower Molder Run Hours Percent for August,
September and October. Top downtime reasons generally included preventive
maintenance for most facilities. Other top downtime reasons were facility specific. As a
result of PSY analysis downtime codes would be reevaluated and operators retrained to
ensure downtime reasons that addressed root causes were being recorded. It was believed
that improved product design was the way for machine speeds to be increased.
39

(9
4-0
Z X7) 0
E E
[.01-
0)U.
mwLL
z
o o o o o o oo 0) Co D q) m~ .-6e ua~eluaeJad
40
O
aI-0a, tn
0w 0Rw ¢ z S
uJ wo uQ zWWw z OoIw o F>
L W z;w C ) ( X CL
0 w on. T9 R z G- U)
I I I I I I I

3.3 Applications of PSY
Facilities staff believed that comparing PSY models directly was inappropriate given the
different product mixes of facilities. Some facilities produce only two products with two
different color combinations, while others may make eight different products with 36 color
combinations. A PSY model can be set up for a specific product within a facility, and a
common product at two facilities can be compared. Also, a PSY model can be set up for
a plant that is starting up to begin to track their performance.
A comparison of two facilities running the same product is given in Figure 3-7. The color
combinations were approximately equal at both facilities. Color combination is important
since certain colors can affect speed in either direction. This is a product line where more
capacity is needed, therefore any improvements will result in increased product to
customer (and increased PSY). The run speed efficiency at both facilities appeared too
high, while rate of quality products was low. A further investigation into this led to the
discovery that total molded was an estimated number, and it was being over estimated.
When total molded was lowered at both facilities to reflect actual machine speeds, run
speed efficiency dropped. Rate of quality products increased, therefore causing no change
in PSY but giving a more accurate picture of where improvement opportunities were.
Actually, the facility had a reported scrap rate that was still lower than the adjusted scrap
rate with the modified rate of quality products. Closing this gap became one of the
improvement objectives. The facility that had a higher facility PSY also had a higher
product PSY for this particular product.
41
r: o
Q) 4- *
a t a0
't)b) .r.Ž Xoo0e
00S
ec0'5
00COm
Q~
9.502I
C,
c
C.)
U
o
L.
o.o
U
0.mr
e4
>5
m0-
0a,N('50)N-
'o(NJ
0-o
-
CO
- Q0
Q
0* E1 c z-aa
q)*
o2I Q)
1 Q. a~a00
CO -
c0
.5,00
od"It0o'0
'0CD
co0.
U)O.m
U.c
:3
C)-00
'a0
UCm0
FE-D4)
u)QC
0wmZr
i
42
Eu,)
U)
.a,
TIco
O
b4).aco
Ut
ac)
a.
0C)ocn
4*
E1=4)
(n)U)
U
0s~
w
/)Ca:
N>'
U-
U.cJii
'5,
02.00I
a,
Ci
ao0
CO(100
aRl-
CD
gRNl-:
09
COrco
a,
1DC,
(I
-e
a,0a,
'5,_i_T
N-'5,v5'5,
EU)
0I'a*0
(.)Co
a,
N
U)
aLO
00
aR
(Y)0F)
c,
CO
'54
e0
:3IOC
a,
0)
Cd
.DJc(oco0
a,
(0
leaR
oNl-
E
a):3
a)04*
Un
U)
u0
o
(D
(O
.o
0a,cocr,
CDNrl-0cow.C
'aoC.)0ma.IZi
coi,
(D0le
a,a,
co0
0laN-
-
: 00)
o9-.
0C')Msf8uU.aU)0
'a
0
0CD
o0
oi(D
oO
W
O9C,'e
00r
leC)
0.4aE_F
_2:oCI
(0a)
ao
Or
-
L)a)
ad(D
U)
0t4*
U)
*:cx
1tU)0
0ou)0UU)0
a!r00
C
U).U)mc
(a_8W
u)
.)c
0m
E
lo'
10c
fuw0.0U)
(N
0U-
-1
0c arnoO
(.oic~co
o\o
rlm
c1
oC0
-.5
W
*(,Nl-a,
to0
uia,0C,,
0)
-N
N
C,
0
C.0
0
1.O
u.
U-
0EEU)
- - - - :-
.
:- : - --
w
:
r
i :.S :S
-
rl
rl
:- I .
ZL
1:
o
I I7
III
-- . __U . . �--- -- -- - . -- -- It
l
--
i
S -I
:
rt r
L_ X
. _
E
L II
rk
_ Ii
._ ._ _- _
-
. _ I Il-
I
I
I
l

This product PSY analysis can be used to evaluate standard operating policies such as one
facility running the same product at a slower speed. Facility one, with a faster machine
speed, provided more product to the customer using one less machine during the same
time period than facility two. Facility one had a slightly lower rate of quality products,
but this could be the tradeoff of running faster. Also, looking at the data, there is a
significant difference in scheduled time between the two facilities. More investigation into
the discrepancy revealed that facility 2 had not staffed for the present demand levels, and
other issues such as absenteeism and employee turnover were causing a lower scheduled
time.
3.4 Limitations of PSY
PSY can be used as a high level tool to identify significant improvement opportunities. To
enhance the model's effectiveness it needs to be used in conjuction with other data. Those
using the model need to realize how data are being obtained, so that they can assess its
accuracy. If measures are not in place for areas where data are needed a process to obtain
information will need to be developed. This model is data intensive, and data entry is an
issue. Presently, the model is being updated on a monthly basis, but the facilities that
desire to use the model want to be able to update it on a weekly or daily basis.
Suggestions and buy in from individuals who have to collect the data are needed for
successful implementation.
There is very little data on idle time losses, and more is needed since it has a large
influence on Production System Yield. One reason that the facility cannot be fully
scheduled is due to tooling shortages. Tooling shortages are not desirable if there is free
capacity. Tools are a capital investment, but given the potential monetary profits, excess
tooling could make sense.
In the model Pareto charts are created from reported data. Pareto charts will assist in
answering questions about where to close gaps. Monthly run charts will assist in
43

determining root cause of a change over time. The five factors are calculated. When
there is a discrepancy between the calculated factor, and reported information, i.e. Rate of
Quality Products, how helpful are the data in understanding why there is a gap and where
efforts to close the gap should be focused? Other information not available in the model
will have to be brought in to determine what is causing the gap.
There are 100 downtime codes for molding. A review needs to be made to determine if
any of these codes can be grouped together into broader areas. Downtime may be
decreased with increased communication and coordination between machine operators.
Also, when addressing downtime issues the downtime information only looks at
information on molder downtime. When Downstream Process down is a high downtime
reason, information that provides insight into downtime for the other processes is needed.
Although 100 percent is an unrealistic goal, given the right circumstances benchmark
performance is attainable. Preventative maintenance and major repair and maintenance
need to happen otherwise the machines would constantly be shutting down. Everything is
on a molder basis. This may not be the bottleneck of the process given the product
profile. Even if a facility does not run a seven day week, theoretical capacity is based on
this. So that barriers to increasing capacity can be understood, staff at facilities using the
PSY model should increase interaction involving comparison of standard measures and
sharing of best practices.
Given the initial work with the Production System Yield Model the following parameters
are key focus areas: quality, idle time losses(tool shortages), speed, downtime codes. A
coherent plan that addresses these areas and incorporates them into manufacturing
strategy will be a start at building long term capabilities.
44

Chapter 4: Production Planning Model
Planning allows an organization the opportunity to anticipate and prepare for customer
orders. The ability to produce customer orders affects customer loyalty and goodwill, as
shown in Figure 4-1. To ensure that no orders are delayed or missed there is a customer
satisfaction tradeoff, as well as, a cost and feasibility tradeoff regarding capacity. Orders
may have to be delayed if no material is available. Although adding machinery is costly, it
may provide needed extra capacity. Productivity improvements occur over time, and it is
harder to predict when a capacity increase due to productivity improvements will be
available. Other methods of increasing capacity include inventory leveling, support from
other facilities, and varying labor usage. To minimize inconvenience to the customer,
considering alternative plans will allow the facilities to be prepared when demand changes,
or capacity is constrained, given existing machines, materials and production plan.
Ability to Prouce ustomer Perception of ustomer Loyalty andustomer Orders sponsiveness to Needs odwill(new and return
ustomers)
Prepare Production Plan ustomer Satisfaction Tradeoff- Prepare Production Plan
Percent Delayed/Missedotrdire
Assess Present Cost/Feasibility Capacity TradeoffDemonstrated CapacityCapability Inventory Leveling, Material and Labor
Support from Other Facilities, Availability and UsageAdd Machinery,Productivity Improvements
Figure 4-1: The ability to produce customer orders on time affectscustomer loyalty and goodwill.
45
Compare DemonstratedCapacity to ForecastedDemand
The purposes of the production planning model are to assist management in making
decisions about the business unit on a regional level, and to assist management in
establishing a stronger communication link with all functions of the organization. The
major components of the production planning model are aggregate sales, theoretical
capacity, speed adjustments, capacity adjustments, demonstrated capacity,
production/inventory plan and materials requirements. The production planning model is a
spreadsheet tool that incorporates information from the PSY model to establish
demonstrated capacity, indicates major product loss categories and how these impact
capacity, provides ability to analyze various demand scenarios, determines amount of good
product a region is capable of producing on an aggregate level and determines the amount
of polymer needed for this production level. The production planning model links
forecasted demand with demonstrated capacity to determine a production plan and
materials requirements. Raw material requirements are necessary well in advance due to
material shortages. Also, when demand exceeds capacity, advance planning assists in
establishing methods to minimize or avoid product shortfalls. Various management
decisions can be considered with this model to understand how certain decisions influence
demonstrated capacity, the production plan, and materials requirements. Also, this tool
addresses how changes in the demand will affect the region's ability to meet customer
orders. The model covers a two-year time frame, in monthly increments at a regional
level. This region can be serviced by one or multiple plants. Generally, facilities do their
own planning. Regional planning on aggregate level provides more flexibility in
determining how to best use assets to meet customer orders.
4.1 Components Of Production Planning Model
An example of a production planning model is shown in Figure 4-2. The components of
the model are explained below.
4.1.1 Aggregate Sales
Aggregate sales is the forecasted sales for the region of interest. In section 1A of the
model forecasted sales for 1995 are shown. Generally, there is wide variation in the
46

accuracy of the forecasted demand. To determine the impact of a low sales forecast the
forecasted 1995 sales were increased by 15 percent each month (and is stated as 1995-
15%). Although it is not provided in the example, sales below 15 percent could also be
evaluated. Forecasted sales for 1996 are shown. The value of having two years of
forecasted sales information ensures that December 1995 production plan is based on
ability to meet customer orders in the future versus ability to meet end of the year
production goals. The monthly expected sales information is then discussed with all
functions and will be used to establish a monthly production plan. Depending on the
manufacturing strategy, the amount of product produced in a given month may be
different than the amount of product sold.
4.1.2 Theoretical Capacity
The theoretical capacity is the monthly product output for 365 days of production, given
the number of molders within the region and the molder design speed. Capacity is based
on molding since the process is designed for molding to be the rate limiting step. In
section 1B output for 1995 and 1996 are given in z units.* This example shows
theoretical yearly output for 1995 and 1996 at 120 z. These yearly outputs could differ if
additional molders were added over time or design speed increased as result of machine
modifications. Generally, the region will not be producing product at the theoretical
capacity due to holidays, slower machine speeds, preventive maintenance and other
capacity losses.
z is picked as the unit of measure for the examples throughout the text, but the author does not specifyfurther detail in order to maintain facility confidentiality.
47

,~~~~n~ inOl ~ (0)' -- 0 · (.r-0)c O 0
CP CR C~~~~li C6a8""08~ 1I 1T 6 ,- ,-dldld ~~~- ''0~ 'Id~'~0 ~ddll0I II II ~1 I I IU' CO Wr -oCO 6 O6 0I 0 0CL -9C, '- I 0 s 6> jl- O co 'co 0 d lOd O
OC 00 0(0 0 cO O~ 'cO0 o '~ o ~-- 0 0I or--
6r-co 'o '- In>- !6 6imn81r~- 0 >- ~ ui-o I~, - 0 000i 0 O0 C 'T
Or q 0~ N 08.- -!o 0 --r- w 6 -6VPC) 6 6 6 u 6 6
0 CN° 91 0co.-C
II~~~ ~~~~~~ o c co CD co In O Lo O1~1
(~0 ~ ) 0 ~ ~ I 0 oCj~d 8 - 8 oV0ol~~~lln ~ o~ o~~ Ob'C'o ,-308111~ ~~I c-(u,0( CM (. 0 L 0) 'T0 c0-o o '
N r-r- '6 'o V~~~~~~~~~~~~~~~~~~~~~~~~~~~~~~~~~~~~~~~~~~~'~~~~~0 7 0 6 6u .IT~< > - I I >-Ior,-c o 8-6;; 6o CuLl 6 0 6&8 N N v
~ - - a0(co ·- 0 ) c ~ir-co *.j 1 cE ld~lI1 -d i L( "6 i'o in 6l 6 6lui6dl~- - - - I>- - ....04 Cl)a8 1 8 , o .o
c -~~~- c 6 N ) ~0 (Ci U') "8o 0 U' )('C IO, ' I 0 !"~ Cc1610 CJ iu, o -ioi~n itg , a- E -
LI I ~ IQO ,-N ~lodlt ' I I' - a. C ,_Cu4l l.
0 m U) ( U')1 0 G(I. LO V V6
(U ~ ~ ~ ~ ~ ~ ( 'a - U co - ,-~o - o~ o e!.t o - "I'"~~~~~r. ~00 MI CN0 M 0O0r-
U' H( U, 0 U-)
. EE--ooo -:)o E 5 ~~~~~~~~~~~>-
i~~~~~~~~c ,i , ,-- · ~ d o o < 0 6 o
3 Q ~ " 8iM a3 O (U 0 ~ ~ cr, n C 18 0 7 X CL '5ca t~ in oO cv c~r 0 cu om a. c crm0 c~r a ~O1CV Ln 0 -- Ier LO U k. 'a E 'O' 0 w-0 w -- (
>- .w !' !
040 oO '0 0'----- ~~~~~~~~~~~~~~~~~~~'o o0, - ,-i 0r < 0, o Er r.(A~il=6R0E (ti; C iL a 16" li. Zo ~0 - 8 ! o · , ' ,- ,-u) o, o cnOal -1: i5 ) -2- - v- 0) I B 'a
m " ~~~~~~cL ' "" " ) C C C :-6 a_ o- 0 CILdd =1 '" =' 3 =a __j_~ a
_z . 'PoS " o
, ~ ~ ~ o ~l~ B r 3 ~:::= ' - ~'8~ ol I~-o', ~~ A';, ~ Oae~o nEIE~~~~~ EI . o En . ~0 o, li 1 a-J I
c
EE
.8
VCC(o
C
En0a(Uom
0
cC
coa.m
0E,Uo
io8V
(U
81
.4.81
48

cd o ol,8roe~co V) M M,._cS ,"-o o cS cSldl~d~ . co i Ir N C4 aP to M V) a lCi u1081 5i 1
co ;dQ dp ml -lr c ro N14 , - r- co-~
CV ojaR 8C'40) o 0
cS c3 i . . ;.
co , !. 0) )1 Dc o · ; , .. ed , T0 o' ·Cc -..o : d d dci c:5 c2i C6 0 Ca~~. 0r ~ ,.- coa 0 a )s0)0 0' C"'nC r-. ,,,
oo i Le .h co v 0 4 to co0 IL.~ ' ' ! ~8~ i ~uld~00 ~ ~ ~ ~ ~ ~ o aoR 0~ oo o~.~:.-,.-,,-,.-,-.!c: '-c c: Lo : ' 'ci : .. ...... o C6 q o o P ii o ' " 1 e 6O ),C a Wam °
I- co Lr) AMSV80N~ ~~~~~~~~~~~~~~~~~~~~~- co,:~ C) I'.,:. I8 'N . cq . 0 C'q q I .
' Ul . - 0) r oo re u, unlo~~~M0 0 e 9U 0
,.. -.olo dp dp~g 3 vo CID ~ -4 (n C? tl a n14. .
dzJ~~~~ldP($Jdzl~~~~~~S .z d l, (, , , , s ,o srl iii d ~~~ ~~I q d d C, N d) r- I- V cnl 0 dl0 d o
(0 a~~~~~~~~~~~~~~~~~~~~~~~~~~~~~~~~~~~~~~~~~~~~~~~~~~~~~~~~~~~~~~~~~~~~~~~~~~~~~~~~~~~~~~~~~~ -08t o0 -ILO N8 'r ( c
to 9 ra n m ci 5 0 m N 0 0,
IQ: r Cs C5 0 C0
cm C ~ ~ ~ ~ i` I 0 La cnuc I2 IVg o r u~~a. . C 0 cm Lc nro o
'O 'O (A 'a ID0 a 8 I 0. > a a- m 0
0 aa .w 'o C M E C rrr cr U)j Q81~~~nldz dz dz dz a r r~~~~~~~~~~~~~~~~~~.2- a,
IV
oC0
as
.5m0E
EC nE
0,po
-gE~Ioo
e
CC
~~~~~~~. .._
49

vCzj c v , -- Co -O Vo r ~ -0 ) 0
~ 0)-CO 0 CJc- 0 o cD
~~~~~~~~~~~~~~~~~~-0
r- co c'.Iuio - 0 13 c'J~~~~~~~~~~~~~~~Oif c o 6(LO ocv)6Q , 8 .( ' T, _~~o L~-o 0Q 6 O
)CC CC ) ito o --U->r-~o r.- 66 e(D 6 CI - cO 266 u666
0 - oo~ > In 'I) I ~v~Ilz I
(v,-.(J ~C O 0 '-- --O Or (
~~,T03 C.)u'i C ) cj ic u iCo~~~~~~~~~~~~~~~~~~Cu'lcd d oo cjaui6d (v ci c'460)i '0d 6 6urrj6dl6cv c- - I~~~~~~~~~~~~~~- ~ -Q - -- O O c
(.U )c .. )- . C oC g 6o,6 eo-CD U) ~~~~'r ~ 0 0Co(D U, U) 0~~~ c~~)C\J I '~~r~ c v - O O O N -- UC'J)
~~~~~~~~~~~9 ~ ~ ~ ~ ~ ~ ~ ,.. . ~- u3 ('6.I-, U,~~~~~~~~~~~~~r-C4 -'4 I C,4 -0
C 10
r-U C
U , (" o ( 0 (U 0 1 0 )C 0 ) 0 ) I (0 0 0 0 - O U (N), '
0 N -Lo .. m -(D- 0C'J0)CJ U ,0 O N -cO
.- co 9 cvo 6o 6 6 c0 c'oo~/ ~ '6 6 6ui6 ~?mlo~ ~,~~ oo v ~~~~cI 0
N- .-
U (N J
~81F3 a)" ola~~a~vn ~ c) r- a~ O~ICII I i iIa) r 0 'IT 1q 0'C U) C14Z
q 0, (. co 6U) 614 6 c' -6 6 c6u0 ci 6 )6 c
U,--Ov, N )0o I01 0 OCO
cr Cy - L6 6 6 c6 o 0 00CU,~~~~~~~~~C
L" P0(O( MU)) M 0 - - 8 0-0 -- O C U, 0)-o..0 C'J'ltO r'l Co6? -6 9 lC9 cv N 0) Oo C?' 0 (,) -- O UCN
(U) co - - .~~~~~~~~~~~~~~ iol
M CN 0) U') zc-; r CN 0) CN LO M 0 8 t rl_~~~~~~~~~~~~~~~~~~C) C P (fU. v
~-- ° ~
co ,.. coU~ C? LO C9 -
'IT . 0 0 I- O
0 E
-~ ~ ~n o " " o
r n C a a~~~~~~~~C4
0 n n a inNla C u, w 0r-c
O ~~~~~~~~~~~~~~~~~~~. (I)n )v )V D C: 0 0 I-9 - U M. (U *-CO C 0 - . IR C) C,?) 4 4 E
8 ~~~ o o, Il, u c -o~ er ~ o 1
0)- C U ,-- o4o3 o 4 - 0 0. 0 r-
_~ 0 ) oOCn0 c QJ(D C? ~l O I' .- C- 2
L OX O5 Ct91 ~~~~~~~~~~~~i~~r X: (I,~~~~1 -t ,- E o d,0i ' 00
I•10 o
uW~~~~~ u0 c o o 0
'~ d o>~~~~~~~~~~~~~~~ =·~ ~ B c . 4Pg,: o~
Cu, - -d ""o'B~~~~~~aR-1U
U C -
~o~~~~~~~~C 03C~
________a~~ __ K 'w' I I w <O U C O I',
ara,~~~~~o '-o o31 ol ~Jj~ c~ -r c~ a o
, 0o 5.
2 u3) 75' a-
5 0 ~C~~~~ ~ ~~~~~ o> x r , - o o o a,-uCo - w -S UJ cc) x ui c of W~~ ~>~ - ,-a
E
E
0EoC0.
0
A.
E"oo
Eac
o)
E
to
._
.2
50

E
·~ uio 'L( ~~o 0 0 Ln 0 cd cl: q t000
o i .N- a '
o et,Z 'ldZ(~ cS c~ l ~ o B o .ilcdRo c .P ·0in /vj d~~~~~~~~~~~~1 L 0 d guW
0 - i7
Z c I'- C', r- -I2P dZ ~ l~l~ld %($S: o~r-l< 8 q $ i Cic "Cs'- o C s i; c ' 4
d~ Cs (A I0 0 4
zcl? Be t C4 z~~~~~~~~~~~~~~~~~~~~~~~~~~~~~~~~~~~~~~~~~~~~~~~~~~~~~~~~~~~~~~~~~~~~~~~~n(llDlcQI-a......; ci · o4
Lo co M Lo 0 o 4
dz(--(dz dz mlsl~~d 0 0 q 4m W 0) 04 Lq N ui ci ri N
C5, ooo cI?
d Cj Ic: rdl~~~~ d "' I-
.... I-"III ~ dl-l dP L" LO j e Lldl~!co id ziodico id C
~P(=(d aol~i e aR o( Ln U9 CCCVIarm m m N (D0 C"
dl'ldl'ldbdT q U.) ri q I I4d 0 4 n
d p, ci~~~,-co i
ci'i C4 l Or 0
0 E
C~~~~~~~~~~C
L6 E O
0)31918 s c B E F s 9 t to u Ce ia M N tor- W 30 a~~~~~~0 d c; ci 8 0 L LO co
`P ~~3C~~q R OR
m NI I
cm L Z, C0
O CL O Q. Q. a lj E m a Ox a a, ~~5il L:2 Ae : 2 d a oa 0 V
51

4.1.3 Speed Adiustments
Speed adjustments are a revised output based on product losses due to speed. In section
1C demonstrated UPC(units per time cycle) or actual machine speed is an aggregate
product speed based on product mix and the speed at which each product is presently
manufactured. The 1996 speed adjustments are shown in section 1J of the Production
Plan. In the example, product not produced due to speed losses is given as a yearly
percentage of theoretical capacity(percent loss).
4.1.4 Capacity Adjustments
Capacity adjustments are the losses from various production parameters that result in the
region not achieving revised output levels. The production system yield model provides
data to determine the monthly losses. The intention of the capacity adjustments is to
reveal to management actionable items that generate capacity losses. By seeing how much
capacity is lost by a certain parameter, management can make informed decisions on how
to change certain parameters to increase capacity. In Section 1D of the model eight
capacity parameters are given. These parameters are: employee absence, holidays, major
R&M(repair and maintenance), PM(preventive maintenance), mold equip failures(molding
equipment failures), all other downtime, scrap and product losses due to tool shortages.
The scrap parameter is comprised of the following subcomponents: scrap at mold, post
mold, finishing, off line processing and other. Capacity adjustment parameters are those
items that have a significant impact on capacity, have the potential to be altered, and
management desires to know the present and future effects of these parameters.
Depending on the regions' needs, the parameters that are detailed can be modified. For
certain facilities, employee absence may not be a large capacity loss, and this may want to
be considered in with product losses due to all other downtime. Presently, product loses
from a given parameter are a function of demonstrated unit per time cycle(or present
machine operating speeds). Scrap is a function of revised output. As relationship between
parameters is more fully understood, equations linking these could be put into the model.
52

4.1.5 Demonstrated Capacity
Demonstrated capacity is quality sellable output the region can realistically produce given
present performance levels. Therefore, Demonstrated Capacity equals Theoretical
Capacity minus Speed Adjustments minus Capacity Adjustments. Section 1E shows the
monthly and yearly demonstrated capacity for the region and this information will be
important in establishing a production plan.
4.1.6 Production/Inventory Plan
The production/inventory plan establishes the amount of useable product(quality sellable
product) that will be produced on a monthly basis, and determines what inventory targets
are desired. The capacity adjustments section has accounted for the scrapped product that
will be produced for the given month. The aggregate sales demand from section 1A is
shown again in section F as 1995 Demand. The production/inventory plan is given an
initial beginning inventory of product and calculates beginning and ending inventory for
subsequent months. If a make to order strategy is intended, then inventory targets can be
set to zero. Setting inventory targets can be helpful when implementing a make to stock
strategy since difference to target shows how many units above or below the stated
inventory target were produced in a given month. If the ending inventory is negative, then
the demand for the given month was not met. A new production plan could be established
but if the excess demonstrated capacity is negative then this shortfall cannot be produced.
Excess demonstrated capacity is demonstrated capacity minus production plan useable
product. Excess demonstrated capacity needs to be zero or positive at all times for the
plan to be feasible. The region can establish an amount of excess capacity that will be
carried at all times, allowing them to prepare for unexpected demand. Given variations in
demand, desired excess capacity may vary depending on monthly volatility. Also,
accounting could assess the cost and benefit tradeoffs of extra inventory and of excess
capacity.
53

4.1.7 Materials Requirements
Materials requirements establishes how much raw material must be received to meet
production requirements and scrap allowance. In Section 1G of the model only polymer
raw material requirements for molding are presently established. Post-mold processing
raw material requirements could be incorporated at a later date. An initial beginning
inventory is entered and beginning and ending inventory of polymer is calculated for
subsequent months. An inventory target can be set monthly based on the amount of raw
material the facility intends to have available at any given time. By setting the inventory
target and examining the difference to target number it can be determined if monthly
shipments need to be modified. Knowing the amount of usable units that will be produced
and using the average weight per unit a calculation determines how much material will be
needed for production. Material wasted as scrap can be determined based on anticipated
scrap levels, given in the capacity adjustments section. Scrap material that will be recycled
is not considered in the material requirements, even though there is a time lag on its use.
Entering the intended receipts of material for the month allows the user to determine if the
yearly material requirement will be met. If the ending monthly inventory is negative then
more material receipts will be needed. To ensure that material ending inventory is zero or
positive, the production plan will need to be modified if increasing material receipts is not
a feasible option.
4.2 Facilitating Communication
The production planning model incorporates information from various functions of the
organization. Some of these functions include: marketing/sales, manufacturing,
design/research and development, purchasing and finance. Each function has a role within
the organization. The results of the model provide management a mechanism for
discussion and information exchange on the important linkage each function has in
assisting the organization in meeting its objectives. In order for a feasible production plan
54

and materials requirements to be generated, forecast accuracy and a realistic demonstrated
capacity are critical.
The model allows each function to examine the impact of their information and other
group information on the present and future organization's ability to meet customer
orders. The marketing/sales group interacts with the customer and will provide forecasted
demand data for the model. Given historical sales data, as well as industry trends a
confidence level can be assigned to the forecast. Based on the forecast, manufacturing
will have to determine how many individuals to hire, and purchasing will decide on
materials requirements. Manufacturing has data around their performance, and this
information will assist in determining a demonstrated capacity. If manufacturing does not
deliver the stated demonstrated capacity the implications could include unmet orders or if
they exceed the expected demonstrated capacity, there could be excess capacity which
was not utilized. The design/research and development group contributes technology
advances that assist in increasing demonstrated capacity, as well as establishing new
markets. These advances, which can be analyzed with the production planning model,
could include a new design, or different materials. The purchasing group needs to know
how much raw material to buy and when. Given raw material shortages, the earlier they
have material needs the quicker they can ensure availability. Finance is involved because
they can state how much does it cost to have a certain excess capacity position, as well as
what technology advances make sense from a cost perspective. Also, if ways to increase
demonstrated capacity are examined, the finance group can suggest which options are
fiscally feasible.
4.3 Base Case
A hypothetical example of a production planning model is shown in Figure 4-2. The 1996
sales were calculated based on 2 percent growth for the industry. The theoretical capacity
in 1995 and 1996 is the same, since this region is not expected to add any machinery. The
capacity adjustment categories and product losses are listed in Table 4-1.
55

Capacity Adjustment Category Yearly Product Losses (Z Units)Speed 11.67Total Scrap 9.38Tool Shortages 6.63Other Downtime 3.31Holidays 2.97Equipment Failures 1.16Repair and Maintenance 0.44Absences 0.35Preventive Maintenance 0.3Total 36.21
Table 4-1: Capacity adjustment categories with corresponding product losses.
Speed, total scrap, other downtime, equipment failures, and repair and maintenance data
was obtained from the production system yield model. Tool shortages were established
based on comparing demand for a given product profile versus tooling capacity for the
product profile. Holidays were obtained from human resource department. Losses due to
absences were estimated based on limited absentee data and turnover data. In 1995 this
region is starting a new preventive maintenance cycle. As a result of doing testing on a
selected group of machines, preventive maintenance schedules will be doubled throughout
the region. On the old preventive maintenance cycle yearly product losses due to
preventive maintenance were 1.13 z. Losses due to the new cycle are incorporated into
the model and these losses are intended to be considerably lower. The demonstrated
capacity for 1995 and 1996 are similar. This model does not account for productivity
increases in 1996, but this could be achieved by speed increases or improvement in a
capacity adjustment parameter. The 1995 demonstrated capacity is 23 percent less than
the revised output( output after speed adjustments) and 33 percent less than the
theoretical capacity. The region had not established a level of excess demonstrated
capacity for the production plan. The goal of the production plan was to meet customer
demand every month, and use make to stock strategy if necessary. It was assumed that
January 1995 beginning inventory was 0.3 z. In terms of material requirements, polymer
is the primary raw material. It is assumed that there is not a limitation on the amount of
56
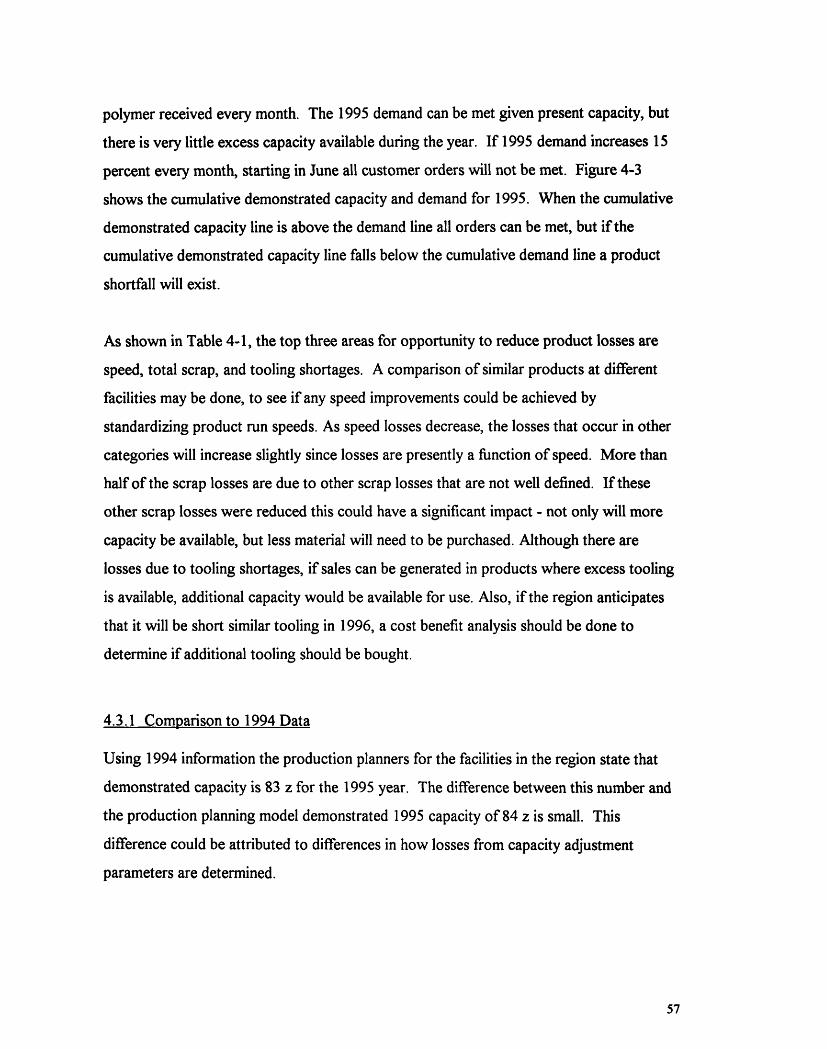
polymer received every month. The 1995 demand can be met given present capacity, but
there is very little excess capacity available during the year. If 1995 demand increases 15
percent every month, starting in June all customer orders will not be met. Figure 4-3
shows the cumulative demonstrated capacity and demand for 1995. When the cumulative
demonstrated capacity line is above the demand line all orders can be met, but if the
cumulative demonstrated capacity line falls below the cumulative demand line a product
shortfall will exist.
As shown in Table 4-1, the top three areas for opportunity to reduce product losses are
speed, total scrap, and tooling shortages. A comparison of similar products at different
facilities may be done, to see if any speed improvements could be achieved by
standardizing product run speeds. As speed losses decrease, the losses that occur in other
categories will increase slightly since losses are presently a function of speed. More than
half of the scrap losses are due to other scrap losses that are not well defined. If these
other scrap losses were reduced this could have a significant impact - not only will more
capacity be available, but less material will need to be purchased. Although there are
losses due to tooling shortages, if sales can be generated in products where excess tooling
is available, additional capacity would be available for use. Also, if the region anticipates
that it will be short similar tooling in 1996, a cost benefit analysis should be done to
determine if additional tooling should be bought.
4.3.1 Comparison to 1994 Data
Using 1994 information the production planners for the facilities in the region state that
demonstrated capacity is 83 z for the 1995 year. The difference between this number and
the production planning model demonstrated 1995 capacity of 84 z is small. This
difference could be attributed to differences in how losses from capacity adjustment
parameters are determined.
57

'aDC
LO mo) E
o C '- a)>1 0cu0. a,(no a)
a) C a
E , ocn a, ina, 0) 0)
o o 0 0 0 0 0 0 0o o o o o o0 o o0c) oo) ' (n LO t c
(z)si!un o JaqwunN OA!Ielnun3
o
cO
C
CD
Ea)
LO
-c(-
0oE
()
c)La ,nn0 )E U)(n
Co 0
CE EEa, .*
_ OC
Cu, a.-
CC
.-
O
O
E
58
ooo

The 1994 yearly PSY number for each facility in the region can be used to obtain an
average PSY for the region of 60 percent. By establishing demonstrated capacity at 33
percent less than theoretical capacity the production planning model suggests that the
region has the capability to achieve 67 percent PSY. There are several possible reasons
why 67 percent PSY was not attained. In 1994, the region may not have had enough
orders, therefore having excess demonstrated capacity during the year. The lower PSY
could be a result of a higher product loss due to capacity adjustment parameter downtime
being inconsistently recorded. Also, the PSY model takes into account customer returns
and inventory obsolescence whereas the production planning model does not include this.
If customer returns and inventory obsolescence require production of additional product,
then this would result in changes in demand, and the production plan and require
additional materials. This information could be incorporated into the model.
4.4 15% Increase In Demand
The production plan will allow management to analyze alternative ways of ensuring that
the region can meet a 15 percent increase in demand. Examining two options: adding
more machinery, or reducing scrap show that there are tradeoffs to each alternative.
4.4.1 Adding Machinery
Management may want to consider adding more machines to ensure meeting demand.
When increasing the number of molders for 1995, the model calculates a new
demonstrated capacity and a revised production plan can be created. It was assumed that
productivity levels remained the same as in the base case, and machines were added until
monthly demand was met. For the region to meet a 15 percent increase in demand
without delaying orders, 13 percent additional machines will need to be added to the
59
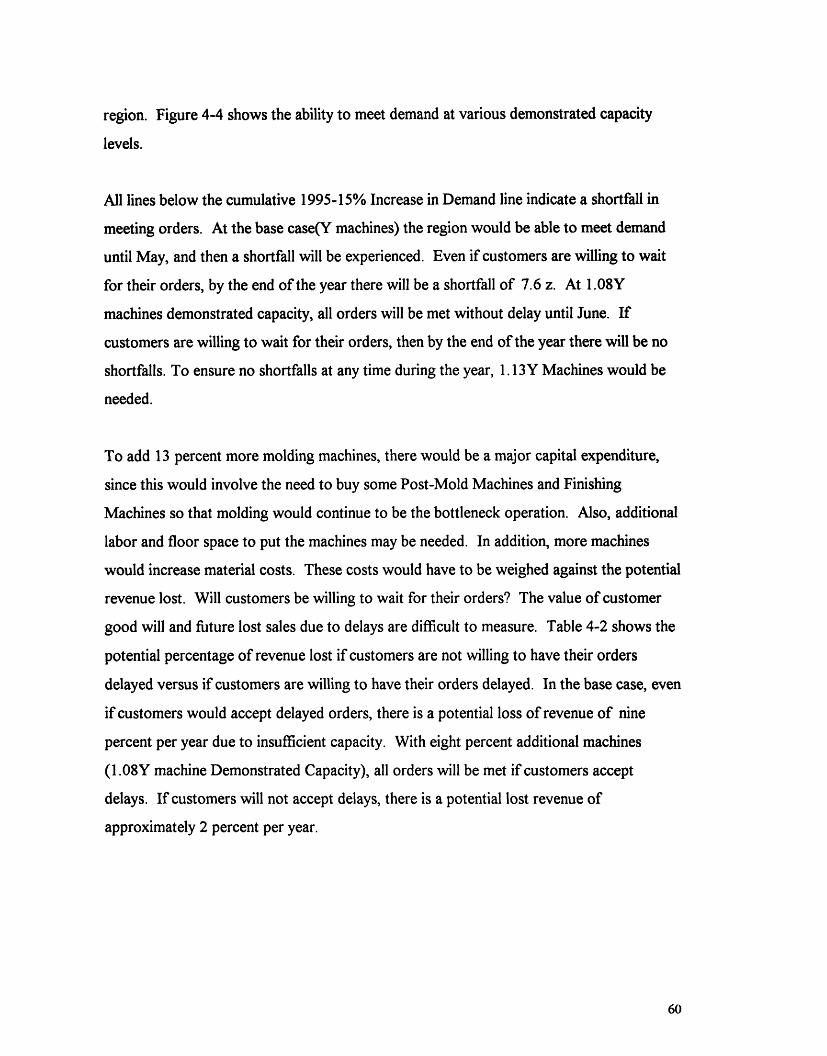
region. Figure 4-4 shows the ability to meet demand at various demonstrated capacity
levels.
All lines below the cumulative 1995-15% Increase in Demand line indicate a shortfall in
meeting orders. At the base case(Y machines) the region would be able to meet demand
until May, and then a shortfall will be experienced. Even if customers are willing to wait
for their orders, by the end of the year there will be a shortfall of 7.6 z. At 1.08Y
machines demonstrated capacity, all orders will be met without delay until June. If
customers are willing to wait for their orders, then by the end of the year there will be no
shortfalls. To ensure no shortfalls at any time during the year, 1.13Y Machines would be
needed.
To add 13 percent more molding machines, there would be a major capital expenditure,
since this would involve the need to buy some Post-Mold Machines and Finishing
Machines so that molding would continue to be the bottleneck operation. Also, additional
labor and floor space to put the machines may be needed. In addition, more machines
would increase material costs. These costs would have to be weighed against the potential
revenue lost. Will customers be willing to wait for their orders? The value of customer
good will and future lost sales due to delays are difficult to measure. Table 4-2 shows the
potential percentage of revenue lost if customers are not willing to have their orders
delayed versus if customers are willing to have their orders delayed. In the base case, even
if customers would accept delayed orders, there is a potential loss of revenue of nine
percent per year due to insufficient capacity. With eight percent additional machines
(1.08Y machine Demonstrated Capacity), all orders will be met if customers accept
delays. If customers will not accept delays, there is a potential lost revenue of
approximately 2 percent per year.
60

Co o oC) 0 0o cn oao 0 c
o o o o o o oO C 0 0 0 O 0o o o o o o o(z , o o u) o o4 -
(Z) s!un o aqtunu aA!IelunDn
oo0i
U)
oa)C.UEa)
oo
O0CL
a)C
C a)an3E a) > a)a O)Z C> C
COa) a)
-C0oa)) C0.
CE
a)-a) o
Cu L a)
O >a) EL
'. 0*
.- 1O)
i1
61
uLOc CDE -
o: > coQ a*.
Cu Cco
0) E0 o O)C) O c CC a) m' -= t
g, Eo) cIIo a)uO '
'-9i
.

Number of Potential Lost Potential Lost Shortfall MonthsMachines Revenue Revenues
With No Delay With DelayAccepted Accepted(Percentage/Year) (Percentage/ Year)
Y (Base Case) 10.12% 9.08% May -December1.08Y 2.27 0 July-October1.13Y 0 0 none
Table 4-2: With 1.13Y machines the region will be able to meet all orders without delayif demand increases 15 percent.
Cost of machinery, the value of meeting customer orders on time, and other alternatives to
meeting customer orders are all factors that influence a decision to determine if machinery
should be added. If meeting customer orders on time is critical, then a certain amount of
excess capacity at all times will be desired.
To assess the cost and feasibility of adding machines, a net present value(NPV) and
internal rate of return(IRR) calculation was performed.*" The company expects a
minimum of a 20 percent rate of return on any investments they proceed with. Five
additional molding machines and the corresponding Post Mold Processing and Finishing
machines would be a significant investment. It was assumed the machinery would be
operational immediately after investment and added to an existing facility in the region,
where floor space was available. The corporate tax rate is 34 percent and a seven year
straight line machinery depreciation schedule was used. If the existing product price,
manufacturing cost, throughput rates, and 352 day yearly machine operation of all five
machines are maintained, then a net present value analysis of this investment is positive at
a 20 percent rate of return for four years of machine use or beyond. The IRR of this
NPV is the present value of cash inflows less the present value of cash outflows, or the increase inwealth accruing to an investor when they undertake an investment. IRR is the discount rate at whichprojects net present value equals zero. Rate at which funds left in a project are compounding(c. f. rate ofreturn or yield obtainable on an asset)6 .
62
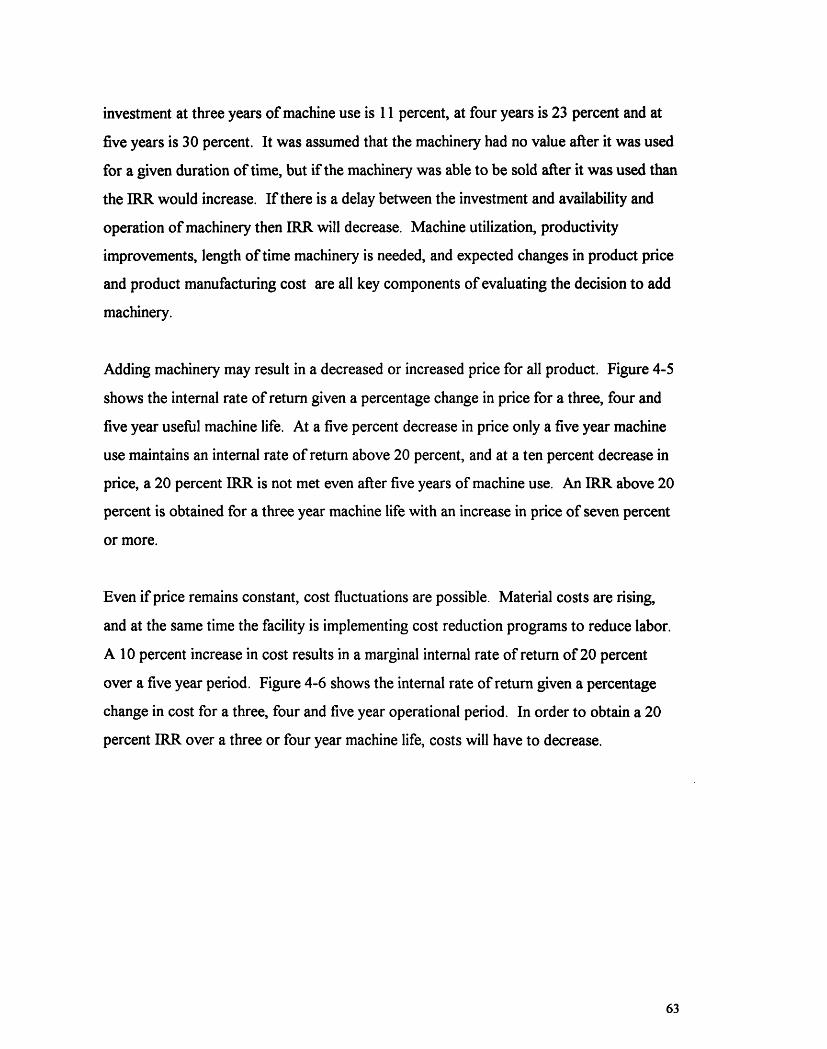
investment at three years of machine use is 11 percent, at four years is 23 percent and at
five years is 30 percent. It was assumed that the machinery had no value after it was used
for a given duration of time, but if the machinery was able to be sold after it was used than
the IRR would increase. If there is a delay between the investment and availability and
operation of machinery then IRR will decrease. Machine utilization, productivity
improvements, length of time machinery is needed, and expected changes in product price
and product manufacturing cost are all key components of evaluating the decision to add
machinery.
Adding machinery may result in a decreased or increased price for all product. Figure 4-5
shows the internal rate of return given a percentage change in price for a three, four and
five year useful machine life. At a five percent decrease in price only a five year machine
use maintains an internal rate of return above 20 percent, and at a ten percent decrease in
price, a 20 percent IRR is not met even after five years of machine use. An IRR above 20
percent is obtained for a three year machine life with an increase in price of seven percent
or more.
Even if price remains constant, cost fluctuations are possible. Material costs are rising,
and at the same time the facility is implementing cost reduction programs to reduce labor.
A 10 percent increase in cost results in a marginal internal rate of return of 20 percent
over a five year period. Figure 4-6 shows the internal rate of return given a percentage
change in cost for a three, four and five year operational period. In order to obtain a 20
percent IRR over a three or four year machine life, costs will have to decrease.
63

-.- 5 years IRR ......
-+- 4 years IRR
- 3 years IRR ...-
1%
Change in Price (percentage)Figure 4-5: The internal rate of return assuming existing machine throughput varies depending on the life of the
machine.
EU7O
35%
, 30%C
0 20%o
6-
0
5 10%
5%
0%
-0.1 -0.05 0 0.05 0.1
Change n Cost (percentage)Figure 4-6: The internal rate of return given a percentage change in product cost for a three, four and five year
operational period.
64
45%
40%
35%
C) 30%
0E 25%00.
E 20%
15%
10%
E 5%
-So%
-1
-· F
AnQ

If the throughput was increased by productivity improvements, then more product could
be produced and sold without increases in labor costs. Figure 4-7 shows that IRR
increases as a result of throughput increases. A five percent throughput increase results in
a smaller change in IRR than a five percent change in price or cost. If machine utilization
was decreased, then internal rate of return would be lowered as shown in Figure 4-8. An
80 percent machine utilization (or four out of five machines used) over the useful life of a
machine results in an IRR slightly above 20 percent for a five year machine life.
One way to meet a 15 percent increase in demand is to add machines. Under the right
circumstances investing in machinery is a sensible decision. The investment has a positive
net present value at 20 percent discount rate given present price, cost and throughput
rates. Fluctuations in price, cost, utilization and throughput can change the expected
return from such an investment, therefore accuracy and validity of demand forecasts and
assumptions are very important. Also, the impact of adding machines on the price and
cost structure of the rest of the business needs to be evaluated. If demand is expected to
be above regional capacity for several years, and productivity improvements cannot be
obtained fast enough, investment in machinery needs to be considered.
65

3%
Change in Throughput (percentage)
Figure 4-7: An increase in throughput increases the internal rate of return.
5%
Machine Utilization (Percentage)
Figure 4-8: A decrease in machinery utlization lowers internal rate of return.
66
35%
4)
Cl.-00.CI-
I.-0
C
c.
25%-
20%
15%
10%
.. .... .. .. .... ... .- . - .. .-. - - -.-....... .- - -
-- 5 years IRR .
--- 4 years IRR
^- 3 years IRR
0%0%
30I
25%H
20%
15%
10%
091
-5%
-10
-15%N
30%
A
_
5.% -
. _ .

4.4.2 Productivity Improvements
If management feels that there are opportunities for productivity improvements the model
can be used to evaluate these alternatives. The region's level of scrap is difficult to
precisely measure. The production system yield model calculated a scrap rate that was
used in the base case model. The scrap calculations in Chapter 1 suggest that this could
be a high rate. The other component of the scrap parameter, scrap the region can not
account for, is the majority of the scrap. Using the model it was assumed that all or a
fraction of the other component of scrap was eliminated. If all of the other component of
scrap was eliminated the result is a 67 percent decrease in total process scrap and a 5
percent increase in capacity. Still, with a 15 percent increase in demand, there would be a
shortfall starting in June. Therefore, a 67 percent decrease in scrap alone would not be
enough to ensure that all orders would be met on time.
Productivity improvements along with reduction of other capacity adjustment parameters
would increase capacity. If all holidays were eliminated, except for three in December,
and the 67 percent decrease in scrap was achieved this combined would be equal to adding
five machines worth of capacity during the year. Therefore the lost revenues are similar to
those given in Table 4-2 for 66 Machines, or approximately two percent of revenue lost if
customers do not accept delays. Also reducing scrap would result in a materials saving
that could be substantial. The region will need to determine if it is possible to eliminate
holidays, and if this is cost effective. Loss of holidays may lower employee morale. Also,
the region will need to determine if productivity improvements, such as scrap reduction
are feasible.
67

4.4.3 Comparison of Alternatives
Table 4-3 shows the tradeoff of a variety of alternatives that would
the increase in demand to be met.
allow some fraction of
*Improvement costs may include cost of training individuals in new techniques, cost of designedexperiments, cost of improved measurement devices or equipment devices so that productivity gain couldbe realized.
Table 4-3: Increasing number of machines and maintaining productivity levels increasesscrapped material while orders will still be missed if productivity improvements in scrapoccur but scrapped material will be reduced.
If the region has a limited polymer raw material supply, certain options are more appealing
than others. If the scenario allows all of the 15 percent increase in demand to be produced
on time or by delaying orders, with 0.4 z inventory of product in December, then 79.67
million pounds of polymer is needed for yearly production of salable product. The amount
of material that will be produced as scrap varies depending on number of machines, since
scrap is a percentage of machine output. Decreasing scrap considerably reduces the
amount of material that will not be able to be used.
68
Scenario Costs Orders Yearly Material UsedMissed/Delayed
Base Case cost of missing and May -Dec. delays Production: 72.73(Y Machines) delaying orders 7.6 z missed Wasted as Scrap: 7.211.13Y Machines Capital costs-buy none missed or delayed Production: 79.67
machinery Wasted as Scrap 8.16additional laboradd floor spacematerial costs
1.08Y Machines same as 69 Machine July-Oct. delays Production: 79.67scenario plus cost of Wasted as Scrap: 7.8missing and delayingorders
Reduce Scrap 67% improvement costs* June-Dec. delays Production: 77.85(Y Machines) cost of missing and 0.8 z missed Wasted as Scrap: 2.23
delaying ordersReduce Scrap 67%/+only improvement costs* and July-Oct. delays Production: 79.673 Holidays holiday pay Wasted as Scrap: 2.23(Y Machines) cost of missing and
delaying orders

There are tradeoffs to adding additional machines to meet demand versus achieving
productivity improvements. Additional machines are costly, but capacity gains can be
realized in a short period of time, given that there is space, machines can be purchased
when needed and trained labor is available. Also, more machines will allow potential
excess demonstrated capacity. When evaluating the reduction of scrap using the model it
was assumed that scrap was decreased in the beginning of 1995. Productivity
improvements take time and have learning curves associated with them, therefore
assuming that scrap rates would be decreased across the board may need to be modified to
better account for learning curves. Depending on the manufacturing strategy a
combination of adding machines and productivity improvements may make sense.
Productivity improvements, such as reducing scrap, are generally lower cost solutions to
increasing capacity than adding machinery.
4.5 Other Production Planning Scenarios
The production planning model can assist management in examining projects that will
affect capacity in the future. The model will allow the region to determine if the timing of
the project is correct. The project may be great, but it may have had a larger impact if it
was implemented earlier, or the model may show that the timing will meet the needs of the
organization.
4.5.1 Implementation of New Product Design
Due to market demands calling for a product with superior functional performance the
design group is planning to implement a new product design starting in April 1995.
Implementation will be complete in June 1995. The new product will assist in improving
manufacturing speeds, and has been designed with the intention of design for
manufacturability. Other benefits of the new design include reduced tooling shortages
since it will be a substitute for an existing product profile and lower scrap rates, since the
new design is intended to process less defective caps. This new design affects between 10
-20 percent of the product mix. The newer speeds were put into the production planning
69
model. Data on improved defect levels and effects on tooling were not available, therefore
these numbers were unchanged. The new design production planning model can be found
in the appendix. Speed losses were reduced by two percent for the year 1995, resulting in
a two percent increase in demonstrated capacity. All orders were met in 1995 and a 0.1 z
excess demonstrated capacity was maintained, or slightly greater than one percent of
demonstrated capacity. In 1996, a 0.2 z excess demonstrated capacity was able to be
maintained. If demand increased 15 percent in 1995 all orders would not be met after the
month of June, but implementing the new product does allow the facility to produce 1.6 z
more product than the base case.
4.6 Limitations of Production Planning Model
The production planning model is an effective tool at revealing product losses, providing
production levels and materials requirements, but a framework for analysis of the model
will need to be customized by the company. As a company, business philosophy and
strategy will determine how certain scenarios the model provides are analyzed. What
priority is material conservation and meeting customer orders on time? These decisions
will influence the recommended material safety stocks and demonstrated excess capacity
that is desired when using the model. A make to order strategy may require longer lead
times in peak season. Starting the year with a given amount of excess capacity may be
costlier than none, but will allow more flexibility when order load varies unexpectedly.
The assumptions used to create the model will affect the production information. Once a
regional production plan is established, and tradeoffs of various management decisions
are examined, the next step is implementing a regional plan at the facility level. Although
the facilities were involved in providing information for the production planning model,
disaggregating the demand and production plan can be challenging depending on the
assumptions. One facility may be required to make certain product due to in country
manufacturing requirements or customer preference. In the production planning model,
70
where possible, aggregate planning attempted to take into account losses created due to
product mix and tooling shortages. Product mix and scheduling issues can create
difficulties in achieving the intended production plan.
The model does not take into consideration costs. Price is a factor for competitiveness,
therefore costs are key. If cost reductions are made, such as reducing labor (but this
decision does not affect productivity and or materials requirements), then the model will
not be useful in evaluating this decision. Profitability of product lines will need to be
examined, especially if certain customers will be turned away due to insufficient capacity.
To improve a region's ability to meet demand, could certain orders be subcontracted out
by buying a competitor's capacity versus adding capacity?
The production planning model can be effective in establishing aggregate levels of
production. Several scenarios were shown to indicate various ways the model could be
used as a tool. It can provide information on: demonstrated capacity, ability to meet
forecasted demand, ability to meet increases in demand with productivity improvements or
by adding machinery, provide production and material information for a cost analysis and
evaluate the effects of technology/machinery advances. It is a good tool for making broad
decisions, and to help foster communication between various functions of the
organization. For this to be an effective tool, accurate data needs to be inputted. Planning
on a facility level will still need to be done. Variations between the regional aggregate
model and the facility level include tool shortages, as well as product mix. Other
variations will need to be identified and evaluated.
71

Chapter 5: Conclusions And Recommendations
5.1: Conclusions
The objective of this thesis was to develop and demonstrate a framework for production
planning and productivity improvements. Several tools were recommended to address the
inconsistent measurement system, raw material shortages, and insufficient capacity issues
that are presently occurring at the molding facilities. These tools included the PSY model,
Production Planning model, and an increased quality control focus. Used together these
tools provide the facilities with a proactive approach to addressing how to meet customer
demand, and increase capacity. Management's use of PSY and Production Planning will
allow the facilities to have a baseline measure of initial capabilities and how this translates
into effective execution of meeting customer orders. These tools provide an information
platform to set direction and focus for continuous improvement efforts.
Continuous improvement and proactive planning provide assistance in meeting customer
requirements, as shown in Figure 5-1. Raw material can affect quality, constrain capacity,
and influence productivity gains. Therefore, material measurement and control is
important in reducing process variation. In addition, consistent and accurate data
reporting are key in evaluating capacity capabilities and measuring productivity gains.
Customer loyalty and good will are dependent on facility responsiveness to customer
demand. By considering capacity tradeoffs to maximize customer satisfaction, increased
quality product to the customer can be achieved, and this will effectively result in
increased profitability.
72
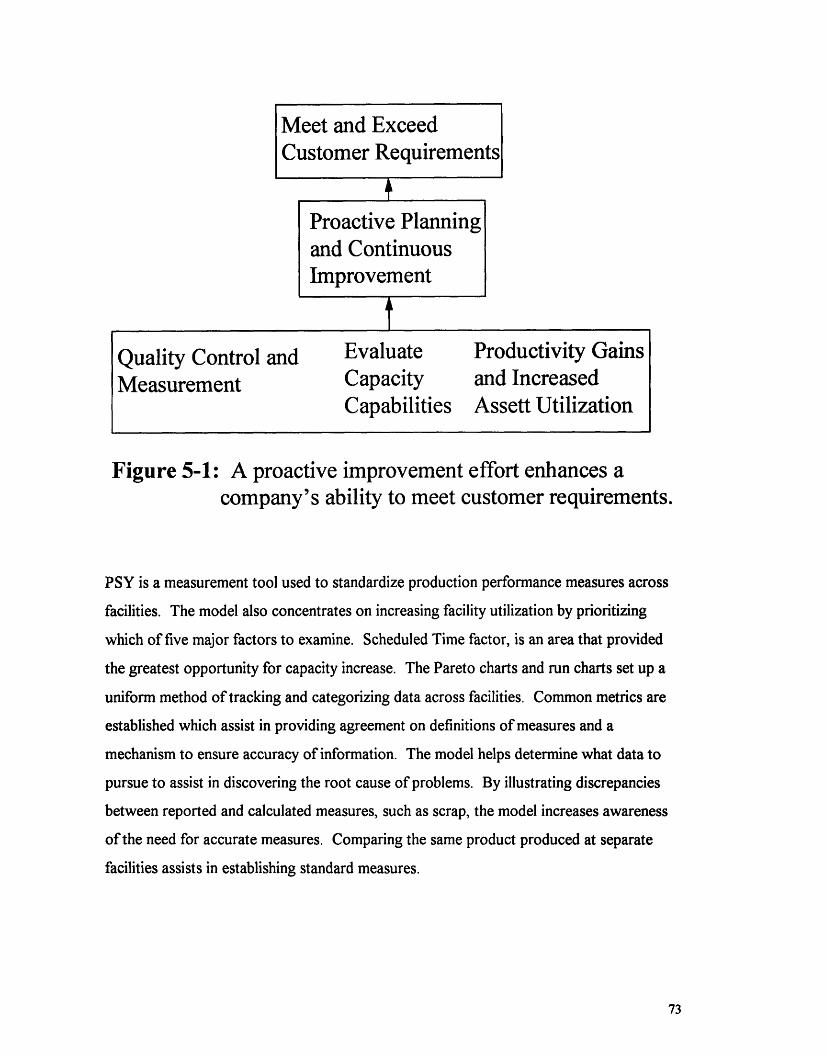
Meet and ExceedCustomer Requirements
Proactive Planningand ContinuousImprovement
Quality Control and Evaluate Productivity GainsMeasurement Capacity and Increased
Capabilities Assett Utilization
Figure 5-1: A proactive improvement effort enhances acompany's ability to meet customer requirements.
PSY is a measurement tool used to standardize production performance measures across
facilities. The model also concentrates on increasing facility utilization by prioritizing
which of five major factors to examine. Scheduled Time factor, is an area that provided
the greatest opportunity for capacity increase. The Pareto charts and run charts set up a
uniform method of tracking and categorizing data across facilities. Common metrics are
established which assist in providing agreement on definitions of measures and a
mechanism to ensure accuracy of information. The model helps determine what data to
pursue to assist in discovering the root cause of problems. By illustrating discrepancies
between reported and calculated measures, such as scrap, the model increases awareness
of the need for accurate measures. Comparing the same product produced at separate
facilities assists in establishing standard measures.
73

Production planning model is a tool for management to evaluate the impact of demand
fluctuations and productivity improvements on production plans and materials
requirements. This spreadsheet tool assists in fostering increased communication between
business unit functions, therefore providing management with information to make more
informed decisions at a regional level. Also, providing management with the opportunity
to determine where product losses are occurring lets them establish programs to address
these losses.
Both of these tools suggest that reductions in internal process scrap will provide increases
in capacity. As the product has more value and cost added to it during processing, it is
imperative that it will not be scrapped. To verify that suppliers have sent material within
specification, increased inspection of incoming raw material is recommended, which could
include visual as well as melt flow and other tests. Narrowing melt flow specifications will
help to reduce process variation. Process variation results in defects that can cause
internal process scrap or customer returns. Customer returns are more costly than internal
process scrap, and generally need to be reproduced. Minimizing internal process scrap
will help increase capacity. A 67% decrease in calculated internal process scrap for a
region results in a 5% capacity increase. Also, the estimated scrap rate at one facility
results in potential lost revenue of six percent, and wasted material. During a period of
raw material shortages, recycling of raw material provides cost savings, and more effective
material usage. Weighing scrap and relating scrap back to the root cause or process it
occurred at will increase accuracy, help to determine where to alleviate scrap and facilitate
improved material usage. Also, the ability to verify the amount of material received will
assist in quantifying all material usage.
Planning and linking quality and measurement control with planning, will help to meet
manufacturing strategy and to allow manufacturing to be seen as a competitive advantage
within the organization. Quality improvements will assist in several areas. The value of
systems such as production planning and production system yield is that they allow
management to determine where to focus for possible capacity increases. One thing that
74

must be kept in mind when using these tools is how improvement efforts affect value
added processes. The positive results of standardization is that it attempts to provide
consistency within the organization, in order to leverage capacity and resources. When
measurement processes are implemented it is important to determine data collection
requirements on what to measure and to not overwhelm individuals with data so that time
and effort are spent analyzing data that reports information about the status of the process.
These tools create value in several ways. The PSY model shows additional data to
address the root cause of problems that are interfering with higher facility utilization. The
Production Planning shows how improvements affect ability to meet customer orders.
The models can illustrate the value of productivity gains, but management must implement
the productivity gains. Also, the amount of delays or missed orders are revealed as well as
the major capacity parameters that contributed to not being able to meet orders. If a
competitor can meet a customer's order on time, the customer may not accept delayed
orders or may not return in the future if orders were missed. In addition, customer returns
not only impact scrap and materials usage, but potentially affect future orders. Therefore,
successfully implementing these tools will provide the molding facilities with tools to learn
about the impact of certain options on ability to meet customer orders as well as ways to
resolve issues that are lowering theoretical capacity. Investing in additional machines is a
method for increasing capacity and being able to meet demand volatility if productivity
improvements can not be achieved. A strategy that adds machines, increases productivity
or both, needs to be planned in advance and then implemented and monitored. Updating
and continuing to use these models allows management to track and modify strategy if
necessary.
There is a tradeoff in cost, time and material usage between increasing capacity by
investing in machinery versus investing in productivity improvements. The facilities may
lose orders forever if capacity is not in place. Management needs to decide if and how
customer orders will be met, and tools such as those mentioned can assist in the decision.
It is difficult to value the cost of a lost opportunity. The tools discussed will assist
75

management in establishing methods to meet as many customer orders as possible. These
methods may include a combination of buying machinery and productivity improvements.
The real gain that the tools provide is that since they are customized to the facilities and
regional markets they serve, as the issues change or more accurate data is available, the
models can be quickly adapted and updated if need be to measure other parameters and
exact results and information in appropriate areas.
5.2 Recommendations For Future Work
Continuous improvement efforts to increase quality and productivity and production
planning efforts to decrease delayed or missed orders are dependent on management's
timely access to and analysis of accurate data and their ability to implement methods that
assist the organization in profitably meeting orders. The following recommendations
would enhance implementation and usage of the production system yield model, the
production planning model, quality measurement and control efforts and other strategic
tools:
* Accelerating and broadening the quality effort will result in increases in productivity in
several areas within the organizations. A study on quality benefits would be helpful in
specifying the tangible as well as intangible benefits. Tracking and monitoring must be
done to produce improvements. Management should consider increasing quality to a
point where facilities can share resources.
* Forecasting affects the ability for manufacturing to plan and effectively execute the
plan. It has been stated that customers really do not know their demand. Identifying
tools and techniques that can be implemented will allow this organization to better
understand the customers' requirements. In addition, historical trends and cost benefit
analysis, will assist in establishing guidelines which indicate the desired levels of
regional and facility demonstrated capacity and product inventory.
76

* For effective implementation of a measurement control system, commitment to quality
improvement is required. An organizational analysis that examines the metamorphosis
that the facility undergoes can be documented. As the organization experiences
change, it will be critical for staff at all facilities to embrace these measurement control
and quality tools. Transfer of knowledge between facilities regarding best operating
practices can assist in increasing quality levels. In addition, standard product
operating procedures for all facilities will increase the value of common metrics.
* There are information resources that enable the facilities to learn from the machinery
group that produces the equipment. Additional benefits can be gained by increased
interaction between machinery and product manufacturing operations. Studying and
understanding the competitive advantage held by the molding division by producing
their own equipment will improve manufacturing policies and productivity.
In conclusion, this thesis has focused on the importance of tools to improve raw material
and manufacturing measurement and quality, and production planning. By achieving
productivity improvements, capacity can be increased without investing in machinery. If
improvements can not be gained fast enough, then an alternative method of meeting all
valued customer orders needs to be implemented. The production planning model, the
production system yield model and quality improvement efforts provide a framework for
management to evaluate and prioritize manufacturing decisions.
77

Bibliography
1. Garvin, David A. 1984, "What Does "Product Quality" Really Mean?," SloanManagement Review Series, Vol 26, No. 1 (Fall), pp. 25-43.
2. Gordon and Wiseman. 1994, "Best Plant Practices," Canadian ManufacturingCompetitiveness Proiect, Jan., pp. 1-8.
3. Juran, J.M. 1984, Upper Management and Quality, Juran Institute Inc. 4th ed, Wilton,CT.
4. Fine and Bridge. 1987, "Managing Quality Improvement," Institute of IndustrialEngineers, Industrial Engineering and Management Press, pp. 47-56.
5. Kerkhoff, Jonell. 1993, "A Systematic Approach and Framework for Optimizing aPolymer Sheet Manufacturing Operation," MIT Master's Thesis.
6. Higgins, Robert c. 1992, Analysis For Financial Managers, Irwin. Boston, MA.
7. Fine, Charles and Hax, Arnoldo. 1985, "Manufacturing Strategy: A Methodology andan Illustration," Interfaces, Vol 15, No. 6 (November-December), pp. 28-46.
8. Nahmias, Steven. 1993, Production and Operations Analysis, Irwin. Boston, MA.
9. Wheelwright, Steven and Hayes, Robert. 1985, "Competing through Manufacturing,"Harvard Business Review, (January-February), pp. 99-109.
10. Garrett, Dick; private communication, 1994
78

Appendix
79

I. Market Gains
II. Cost Savings
Figure A-I: Garvin's analysis of quality and profitability.
80

L o o o d o W) CR 9 s 8 2 8 o . . . .~l~
> Lf to Ici-I c 1 "l Y1 1i 0 Lf 1 0
0 d z I I-
v r- OR- -804 8 0 8 8 8 8 2 ~~~~~~~~~~~~~~~~~~~~~~~~~~~~~~~~~~~~~~~~~~~~~~~~~~~~~~~~~~~~~~~~~~~~~~~~~~~~~~~~~~~~~~~~~~~~~~~~~~~~~~~~~~~~~~~~~ 1 ~ ~ 2~~dlrldldld 'Id ,I, cr:i Cli CN c)
0 ~~~~~~~~~o a>l I I I I I I 1~1 I I I I 1~1 I I I ->-{n
,- l CC! ~~8 8O~8 8 18 aisi~s Y18 c 'o c~, c cdl~~1~6 'Id 'Id 0 d dluiN d M 9
'~ < > ~1IIIII-
u. aD- >-s{ w O Q ts 0 1; ( 8 Ui CR qlu ls 01118~8 P,'- : ·d ·-- ,-o cm cluc~ c
co-,,ro :P-co fl - Cs 10 C, cr c0 io8118~1 0D 1 >" I >" - I I I7 I~jl I I Il 1 R 1 8 & 1 1 P1o ' , - oim C{dl~l~dl I I I I I'ldl I I I I'ld 0 ~
0, "i"~srr,7i~;~, M co 8 C' 4 0 v 1~'0 V ) M 08088Nf: VO
a ~ o uilcddl n -w to In i Cs U4 ci
12 U,8 CN N lm woo 6 cs0 uiodl 0
(A m~~~~m a a x a- cI0 L) u) -0 X:uiCli
:6.9 0 . -M 2 '41 IUL J =) m 0
r 9, 0~~~~~~~~ ' a -5 ~~ilS u, o L u(A C -O Ct m
IE Ei o 32i~8~8 cr U~;i~~~C 0 CL 'S. V4 i1: ~ 9 la~a (~z z 0 0 z lo 0 I0
Qcm
t-
P
E'8'CLcE
._4!0i(g._v
Q
:Sc.9E
-
r'SEtm.S
81

( r- I- 0) W() m%*L A2~ ~q Qc Ic~ a, nt 0 0 L'UT) ()'(C I) ' d C ' ,i .. i ci N .- :'i 'dcricr c o6 d d 00 6 0 C4W
0 o e o o i,C4 (70 0 CO 00 3 a
Le. i~ , . q F5 aR aR ,. ~ ,.~ ca c58 I N , " ,T~~~~ U) co I-- CD.,..,C ! O co c
ci 6 a a 6 6 .... : ~ -'M-o~
I0.~~ ~ ~ 0~~~0 t-(0~~~~~(04 0(e O 01 - . .c5: o - -d cU5 dd dN) c); N
~~~~~E ~ ~ c C,.. ?D, ,- : ~o (,, . .od~~~~~~~ o o a
io a 0 I ',4 ,"r- co ig6)u,, V ... .C"ICD ; s$-(6 04 t- LA LACq DW0 C4
C', E o~~~ ~a
,_o o o ' i 'dd' c ~1 d. o cl c .8 -_. LI, co c 0 0 oIncN c eLo'cr-- cN P.
,.~~~~~~~~~~~~~~~~~~~.36 I , 0 0 0 P: ca 6 0 e o j ¢~.- (N ,I~lod~dh, (
· coC - - -0.i N 0 O 0 I0 0 ( - (D D L L~~~ ~ ~~~~6 o o ( C 0 cv)' 00(W 0)
o 'o ' . . dr U dV2 a o 0 0 0 F. r-Lr-c0 0 910 _v r Ui CLi ~ 0S2 0 0 0 oo 'i 0 0U0 loa
d Vdid I U1I- l~dI I.-C'CO '0 ~ 0 0 0 00 flv(4 0(0 '0~ 9I (
r-(0 ~~~~0*r-~~~ ~ ~ 00 m ov-0 )'
LA.. .... ( o t:.. L
0 W
EZE ~ ~ P 0','e, -a. LL -c C 0? 86u 6 090 0 y0 0 00
~~~CQ)$ r 3 0~~~~~~~~~~~~o 1 V ~ iU) ) ECo
* 0 c Li~ ~~. t E Do 2 0 a0 , co 0 CDa,
I~~~~~~~~ 5~~~a_ a i a a = CM O ';; ~~ V @1F U. IV r C
1< ~~~ a. g~~R.. a.- V- V- a.~U - 8C C) EC, .r c 0DC E I
se 0a ~t a 0U
Ed~ &0DI0&ca ri . b .
82

ct,)1i c('jci Ifl) # (00100 '- -- CY) - Cv ., IZ I in(lrll ~t , ioa~~l 0U) 0 'oo o N . -~~~C0 0 (~~~~~~~~r_0- 0 C) 0 0Cv)oc~~a,~~ 0
(0 I...(O 0 ) L CI(,I D80 0 OO r ,N C~~1'4('"~~~ o6ai 11 '-~dl o10o 6Cv 6 I~~16 ~~1, "1418 Q~~~~'P''"O'~~~'' ~~ C C 4 Ll/l(DOOO~ i)CVC'( 0)0 0'm -D
0 Cf I -
U)- (D> '0 (0 -000 r- '-UL CN> o r-- : , ° 8a - a-
.' d9~ o Hu5 ci- o5 d '- du0' O~d.~~~~~~Z~~~~~~~~~~~~~~~~~ E-t o0 n 0 V . . . . iO 0 t--
-I) ..)- .-0(1Co -r--~- ~mDO )lmu(0 ' . 0 O rO- '-C ONNCd, ' C d dllrjldr- C ~.', 9 . .) M " - 0 oC 0 Du) '- 0 0 00 o 0
~ 0(0Cv)(v)(v) 0I-Cv~o--'--- (:5(N 05' IT I '- Co( >(~ o co ,-o .') C) 00 -0(0 0,- C'-, )5'-0b(r'--1'0- -
8 (99 01T0 - 6 0 ) ) '-0 0 O(1 0N0 C EC0 '
I I I C, c I I I EI C
V? 6 ci 4 -r-- in aU')-0 I'- 0
Cu -~~~ ~ 0(00 0 0 0)~~~~~O0) - 0 0Uo, 0 0 i 9N- )U (v)'(" Cv)CO 0 r-)U U)C' 01 l i' C5 ~~~~~CL4Clt ~L U' 4 ~ , o Il o o I §- -M
,.-o o 0(06 , 'i '0( ,.o r,~ 'I C 0 0 0 r- -t·u 'ja ? I I I I I I I I I I I I I i I I I I I0 0 I7 (9 CN C1 q 0I _0 Ca cio to ( d5 CY O O Ic U, c~ "t 6 ' 2
r- O~L ( C)v)0C 00)'- r-'- o U" to1 I U) Cv)-0N ) C v) 'ci'0 0- CoLi?·U') 0 , 0 Lo N- o.0 ) OOO r--)CN0(0C '- IO c 6 0) 0 O ' 0 6 o6*06
CU…~~~~~~~~~~~~~~~~~~~ ----09·19; '-it Cu c0 ) U,) r-0 ). Lo Cl' C U - - o o o-
Cu AUCPq-cqc rfl 00 0 0 l -t
r- Cu 0 0 ) 0 13 (, ( 00 C~~~~~~~~~~~~~~~~~~~~~S16 ~~id 00 ~ LnlC~~lre I= to in ) Lo 0) 'IT LO m 0 0) (n V 0 N C...... ,"'ooldu50'd d (~O
' ' 9d d d 0Co IO5 O dl. J "-d IO!6 Ica~~~~~~~~cO .- (D'O Ol I E' '0_U It- C ! -C5 B
i.~o~~Cus~~~~~~~~~~~~~ , -~~~~~~~ a~,- .~~ ~,-~ o . E o i0~',~~~~~~~~~~~~~~-sI o: ,- o 0 r0) o (D - O (D n 0 Cci) - oI 6o -
0~- , . 00 ' ' Cl ooo0> 0 Cu 1.C =,Icu(5(0 ~ld dl) ' o dloo 0 0 0 u CL a;ioa.
IV -. 0 U)_ i0-V O- 0 O IO I- ww , c C_ ' vCL 0 m CO rr t= CL Z IC- r~ F- 0l o0 '-~~~~~E e , 1 5 I m (n 0 2 d ) Q U- CJ Z) .2 C;)--l: .- io_ z o o0 r,~~~~~~~~~~~~~~~~~~~~~~~~~~~~~~~~~S)- -a c 0~~~~~~~~~~~~~~~~~~~~~~~~~~~~~~~~ac Y~~~~~~~~~~~~ 0 o~l,: - D- .....n- L
,,,W ii(i~s El,_ 03 ~ ,to 0 E m ) - ( U
c cm tm (Urc Eti3 l~Y 1115 r- C CL a- 2-o 8 22 2~5 o
C~~~~~~~~~~~~~~~~~~~~~~~~~~~~~~~0Cc c r a, CL c 'j .5 r u, E L, L E I
Co w m a D CD r
83

CR 0 Q (6 0e (N(N CCI co cci 0c0 !0 0e r- [ 1u (0 co ,u- i6 o 0' '0
-() (0 r 0 ) ? In Vi
0 0 0) 0 0i0 0 -(l => f( L0 (N N(0 '-io, o (3 F-, Inlolco I.
00 ....... ,, C m . 'd d d d did dir: 4 z ild vj c~~~~~~~~~~~~~~~~~~~~~~ild cV 0 I.: l P l d
0P"~ ~~a 0 0 F 0 l 00~ O( (0~ Oel~c(0 C~( 00 6100 (c~ l)~
4:: -i ~ rlcl ~a~~~ 80~_lzO 03 0DS~ 0P 00ls lcu a ~ ~ -' ' -o -uo c.' '7~~~~~~~~~~~~f-.: I-- m co od (w Csl 'l r c- r I E_
0 0 0 0 00d '-cN (0 C6r- .1(60 cj0 (N 0100 I 0_~~~~~~~~,~~ S o,,.,.,.,.,, o. ,o., ~ ~ .,.
Y-IOIV- IO ~! .z(OCN - '-9(0 (N~~~~~~ ~ ~~~~~~~ (N..- 100( M C-Co ' . . . ..0,-,o 0 c: .,-r- '-( 0 0(1c 0m.
0 0 0 0 OR (~ 0 0 01: 019 9 -: -=r C~~~~~~~~~~~~
m ( o , 'cS)i.--,? . I I~~~~~~~09 ~ ~ ~ 0(
0 0 00 6..4 I-co rN W)1 10 (N w co i0 ...... CC! ~, IS- -
O 6 to "It"~S O d r d d dd d(N (',1e reo ,~ ,~ ,~ . ld d ...."-l'ldll G o "- ' ' Ld do c C Is u 0 9
ac .. - R 0 (N o 4
o ! a a . ) cCa
:;-i> . . M I §
O OO o q IJ0 5 .E.
' 5 c o 5(,i~'d 5c:i oc. ? ._60 *0 .C d 0 Elr c jl M u c Cc:5.w o 9 . IV0=0CN _______ 0 ) I Co .,
6 V In ~ O (P Cp q r- (P" ll ll ( CN POi O O] it:5 CD ~ O -r., u0 a3 . o o.u,~~~~~~~- = ] !
'o 'E L~ U ~ ,.Im CL 28 ar] '-~~~~~~~~~~~~~~~~~C ' RI0
- "'rg - " °elnlB B .~~~B B O 0 E_- _ J -- ~J t~~~~~~~ n1 ~· pe I ilj n!'s s Bf 21~~~~~~ MI- :* Vs '
la wCo M 0 t- -& ID ~-2 2-._ , ,_o E o > E
O , , , , i ,C, t cCL C CEIB LO C P~~ Ba. >
cnl a Il 1 lksa ,coa 2, ,
84


![Glossary Plastic Injection Molding Engineering Manufacturing[1]](https://img.pdfslide.us/doc/110x75/577d2ea21a28ab4e1eaf94c3/glossary-plastic-injection-molding-engineering-manufacturing1.jpg)