Embed Size (px)
Citation preview
CHAPTER 5
METHODS DEVELOPED FOR THE
ESTIMATION OF
HYDROXY CITRIC ACID
5.1 INTRODUCTION
Hydroxy citric acid, a reputed natural product in dietary supplement is the active
constituent of Garcinia cambogia fruit. HCA was identified by some scientists
worked at CFTRI, Mysore, during 1960s [Lewis ef a/. 19651. Previously HCA was
mistakenly identified as citric acid and tartaric acid and titration procedures were
used for estimations. The other methods available like, Paper chromatography,
HPLC by comparative method etc. provide inconsistent results. The need for a
reliable analytical procedures for estimation of HCA is essential at this moment,
since lot of products incorporating HCA are being marketed worldwide. In this
chapter new analytical procedures developed for the estimation of hydroxy citric
acid are described, which are;
Chapter 5 Methods developed for the estimation of HCA
1. Spectrophotometric determination of HCA
2. Estimation of HCA using HPTLC
3. Estimation of HCA by HPLC using Cqe RP arnide HPLC column
5.2 MATERIALS
The dried fruit rinds of Garcinia cambogia grown in Sri Lanka (commercial imported
variety) were used for the studies. The chemicals used were of AR grade. HPLC
grade solvents were used for HPLC and HPTLC analyses.
5.3 METHODS
5.3.1 Spectrophotornetric determination of HCA
Background of this investigation
While reviewing the literature no method has been seen using
spectrophotometer for the estimation of HCA. According to Lewis ef a/. (1964),
a colour spot was developed when sodium rneta vanadate solution was
sprayed on paper which is unique to HCA. So a standardized procedure was
developed based on this color complex formation.

Chapter 5 Methods developed for the estimation of HCA
Preparation of sample for Spectrophotometric analysis
Water extract of leaves, bark, rind and fruit of G. cambogia were used for the
experiment. About 100g-chopped dried material (moisture content-15%) was
boiled with 300mL water (3 times), filtered, concentrated under vacuum to 50%
moisture level. The thick concentrated liquid was filtered, washed the residue
with srnall portion of water and combined all washes with the mother liquid. It
was neutralized with 4N NaOH solution maintained at pH 7.5. Fifty percent
(50%) solution of CaCI, was added and stirred well. Precipitated residue was
filtered through a Buchner funnel and dried (Moisture - 4%). Twenty-five gram
material was obtained. Accurately weighed 0.29 of this material dissolved in
5mL of I N H2SO4 and diluted to 25mL with distilled water. This was decolorized
using 10% activated carbon. The solution was filtered into a 50mL standard
flask, washed the residue with srnall portion of distilled water and made up to
the volume.
Preparation of standard solution
Ethylene diamine salt of HCA was used as the standard. The standard
solutions were prepared as follows.
Working standards were prepared by ethylene diamine salt of HCA
(98% ED - HCA) The salt equivalent to 0.0429 of the free acid was weighed
accurately and dissolved in 5mL of I N H,SO, and approximately 25mL of
Methods developed for the estimation o f HCA
distilled water was added. It was filtered and transferred into a 50mL volumetric
flask and made up to the volume using distilled water [Conc. 828 pglmL].
Procedure
One milliliter of the above standard solution was pipetted out into a IOOmL
volumetric flask and made up to volume using distilled water. Exactly 0.9mL
5% sodium meta vanadate in water was added and noted the time. The color
of the solution became yellow. As time advanced, the yellow color slightly
changed to orange red. Absorbance was noted at 467nm after 20 minutes.
A blank solution was prepared. Repeated the same experiment using 1.5mL,
2mL, 25mL and 3mL of standard solution. A calibration graph was plotted
against the concentration of HCA and absorbance. Dilute the sample solution
so that final concentration should be 0.5mgImL. Repeated the same
experiment using sample solution and the amount of HCA was calculated from
the calibration graph.
5.3.2 Estimation of HCA using HPTLC
Thin Layer Chromatography (TLC) is one of the most flexible methods of
chromatographic analysis for the separation and identification of chemical
substances. It excels whenever large numbers of samples must be analyzed by
an economical method that is ready for immediate use and does not require
complicated sample preparation.
Methods developed for the estimation of HCA
HPTLC is a modern version of TLC with accurate spotting and quantification,
which plays an important role in the quality control of food stuffs, usually with
emphasis on the investigation of ingredients like lipids, carbohydrates, vitamins
and organic acids and the detection of harmful impurities (e.g. aflatoxins,
pesticides). HPTLC is a suitable technique for checking the purity and testing
the stability of raw materials and finished preparations.
The flexibility of HPTLC is a consequence of the absence of restrictions on the
choice of mobile and stationary phases. It is also convenient for data
processing and, therefore, for quantification I calibration reference and test
samples can be chromatographed on the same HPTLC plates and hence in the
same chromatographic system. Garcinia cambogia extracts were analyzed by
HPTLC for HCA content.
Sample preparation
Three hundred (300mg) milligram weight of standardized calcium hydroxy
citrate was dissolved in 10mL 0.1 N HCI. Filtererd and the filterate was used for
analys~s
Applicator DESAGA AS 30
Densitometer DESAGA CD 60
Chromatographic conditions
Method Ascending, one - dimensional development in
the HPTLC developing chamber, without chamber
saturation
Application 1-2 and 3pL with the applicator AS 30 as 5 mm
bands
116

Methods developed for the estimation of HCA
Stationary phase: Precoated HPTLC plates. NH2FZs4 S Merck
No:13192, prewashed with methanol
Mobile phase Methanol +water (6+2, v/v)
Distance run 7cm
Running time 30 min
Detect~on After development the plate was heated 10 min.
at 150°C and the resultant fluorescent zones were
examinated under the UV - lamp at 366 nm.
In situ quantitation
The fluorimetric analysis was carried out at 366 n m and 420 nm with the
densitometer CD60.
DESAGA CD 60 Method
DESAGA CD 60 method is shown below
Chromatogram No. : 0000230 printed 02/02/1999 10:59
Name of method Garcinia cambogia extract
Start - coordinate X : 12.0 [mm] Width of slit : 0.2 [mm]
Start - coordinate Y : 5.0 [mm] Height of slit : 3.0 [mm]
End - coordinate Y : 70.0 [mm] Filterposition : open 420 nm

Chapter 5 Methods developed for the estimation of HCA
Meandewidth : 0.0 [mm]
Number of lanes : 4 Wave length Measurement:366 nm
Distance of Lanes : 10.0 [mm] Wavelength Reference : 0 [nm]
Mode . Remission Fluorescence Signal positive Lamp Hg
Resolution at Measurement 0.100 [mm] Number of Measurements I Position : 4
Smoothing factor 0
Linearizing acc. to kubelka I Munk. : 0
Scale for signal in graphics 500
Backgroundcorr. (Meander only) : No
Automatic Zeroing at start Yes
Point after Measurement No printing
Data saving No
Call user program Start no Used Program
Spot Optimization No Optimization
Resolution for Optimization 0.025 [mm]
Number of Measurements / Position : 4
Evaluation during Measurement : Yes
Width of window (mm) 1.000
118

Methods developed for the estimation of HCA
Threshold for Peak detection 0.500
Maximum slope of Base line 10.000
Minimum Peak height 5.000
Minimum Peak area 0.000
Evaluation - Interval from to (mm) : 5.000 70.000
Number of components
Number of standard - concentrations:
Number of different samples
Unit of standard
Unit of results
Factor of conversion
Number of Digits of standard
Number of Digits of Results
Type of Calibration Function Straight Line y = a *x + b without (0,O)
Calibration on Peak - Height 1 Area : Height
Correlat~on of Lanes
Standard 1 1
Standard 2 3
Standard 3 4

Methods developed for the estimation o f HCA
Concentrat~on of standards :
Standard 1 K1 : 1 .OO
Standard 2 K1 : 2.00
Standard 3 K1 : 3.00
Automatic Peak identification :
Component Name of component Position [mm] Tolerance [mm]
1 Hydroxy citric acid 55.0 2.0

Methods developed for the estimation of HCA
5.3.3 Estimation of HCA by HPLC using Clg RP amide column
Preparation of standard
Fifty milligram of ethylene diamine salt of HCA was accurately weighed out into
a 50mL volumetric flask. Dissolved the material by adding 5mL 50% H,SO, and
made up to the volume by HPLC grade water. The resulting stock solution
contained 500pglmL HCA.
An internal standard solution was prepared by dissolving 50mg
L- aspartic acid in 5mL 50% H2S04 in water taken in a 100mL volumetric flask.
Made up to the mark using HPLC grade water. The concentration of the
solution was found to be 500 pgImL. Different strengths of standard solutions
were prepared by taking different volumes of the stock solution. 3mL of the
internal standard solution was added and made up to lOmL using HPLC grade
water.
Preparation of samples
Different salts of HCA and HCA lactone were prepared as described in
Chapter 4. Accurately weighed out 250mg sample into a 100mL standard flask.
Then added 5mL water and 5mL concentrated sulphuric acid. Dissolved the
material and made up to the volume using HPLC grade water. The pH was
adjusted to 2.1
Methods developed for the estimation of HCA
Sample solutions of other organic acids were prepared by taking 50 - 70mg
sample in 100mL HPLC grade water.
All the solutions including standard, and samples were sonicated for half an
hour and filtered in 0.45 micron filter.
Procedure
10 - 20pL of this solution was injected into the HPLC column and the elution
profile was noted.
Using standard solutions, regression graph was drawn
Instrument conditions
Instrument : HPLC class VP system supplied by Shimadzu, Japan
Column Supelco RP amide, 2.5cm x 4.6cm x 0.5pm CI6guard
column
Mobile phase: 01M sodium sulphate in HPLC water, pH adjusted to
2.1 with sulphuric acid, filtered and sonicated.
Flow rate : 0.5mLI minute
Detection wave length : 203nm
Injection volume : 10 - 20pL

Methods developed for the estimation of HCA
The percentage of HCA in the sample solution was calculated as
Area of HCA peak of sample Concentration of standard
Area of HCA peak of std. Concentration of sample
5.4 RESULTS
5.4.1 Color reaction between HCA and rneta vanadate
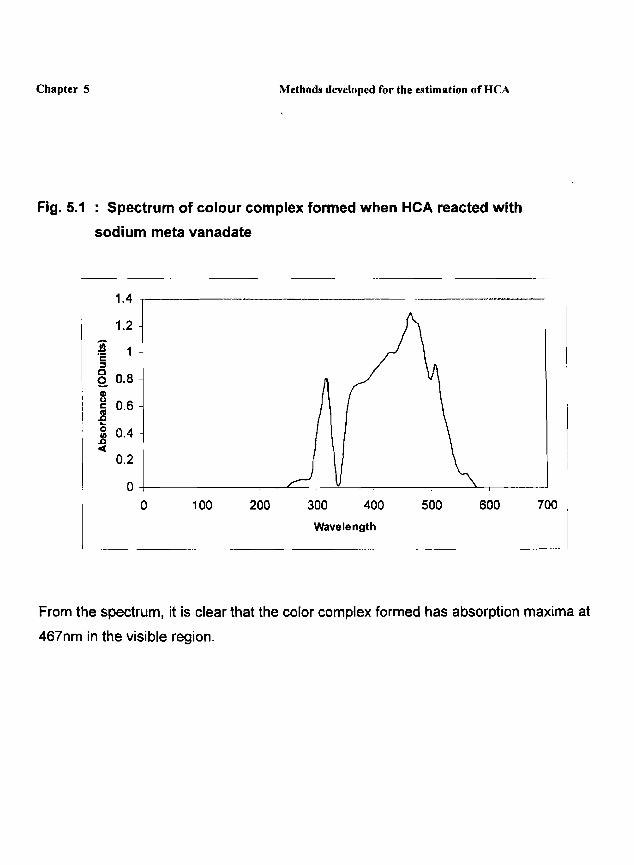
When HCA reacted with sodium meta vanadate, an orange red
coloured complex was formed. In order to find out the absorption
maxima of this product, the solution was scanned between 200 - 800nm
in UV Spectrophotometer. The absorbance measured was plotted against
wavelength. The spectrum obtained was shown in Figure 5.1.
Chapter 5 Methods developed for the estimation of HCA
Fig. 5.1 : Spectrum of colour complex formed when HCA reacted with
sodium meta vanadate
0 1 00 200 300 400 500 600 700 1
Wavelength
. . . . . . . . - . - -
From the spectrum, it is clear that the color complex formed has absorption maxima at
467nm in the visible region.

Methods developed for the estimation of HCA
5.4.2 Stability of color complex formed between HCA and sodium meta vanadate
When HCA mixed with sodium meta vanadate reacted, a yellow coloured
solution was formed immediately, which on keeping changed into an orange
colored complex. This colour remained for 10 minutes and then slowly its
intensity was decreased. The stability of the color complex was studied by
taking absorbance at 467 nm at different time intervals. The time scan of HCA
and sodium meta vanadate was done and shown in Figure 5.2.

Chapter 5 Methods developed for the estimation of HCA
Fig. 5.2: Time scan of HCA and sodium meta vanadate solution immediately after mixing
. - A
Time scan
500 I000 1500 2000 2500 3000 Time (seconds)
-. - -- --
The color tend to stabilize after 15 - 20 minutes of mixing between HCA and sodium
meta vanadate solutions and this color remains for 10 - 13 minutes and then started
decreasing .

Methods developed for the estimation of HCA
5.4.3 Optimization o f the Spectrophotometric procedure
After finding the absorption maxima and stabilizing the time interval, the other
parameters like concentration of sample solution, strength of meta vanadate
reagent and sulphuric acid to be needed were optimized. These optimum
parameters were shown in Table 5.1.
Concentration of sample solution*" 0.5 - O.6mglmL
Table 5.1: Optimum parameters required for estimation of HCA
by Spectrophotometric method
Parameters
Absorbance should
be taken exactly 20
minutes after the
addition of sodium
meta vanadate
Conditions*
2. Volume and strength of H2S0,
needed I
3. / Vol. of meta vanadate solution
The values were obined as the average of 6 experiments
** Samples were salta of HCA
5 mL 1 N H2S04
0.9mL 5% sodium
meta vanadate

Methods developed for the estimation of HCA
The optimum concentration of sample was 0.5 - 0.6mglmL. The quantity of
sulphuric acid was constant but volume of meta vanadate solution was critical
and found out that 0.9mL of 5% solution was required for 0.5 - 0.6mglmL of
sample solution. The most important point is the time of absorbance noted. The
colour remained stable from 15 - 25 minutes after the addition of sodium meta
vanadate and o~timum time for absorbance was found to be 20 minutes.
5.4.4. Analysis of Hydroxy citrates using UV - Spectrophotometric method
Different salts of hydroxy citric acid like calcium hydroxy citrate and potassium
hydroxy citrate were analyzed by Spectrophotometric method. The samples
were collected from different manufacturers. The datas are shown in the Table
5.2 and 5.3

Chapter 5 Methods developed for the estimation of HCA
Table 5.2: HCA Analysis of different samples of Calcium hydroxy
citrate by Spectrophotometric method
L! NutriSclence Innovations 1 53.8% 51.3% LLC - USA
--
1 : Arjuna Natural Extracts Ltd., India
I Batch No : I GCC - 033/0008/B - 7
l 3 I Transglobal Resources I 51.8% I 51 % Inc. -USA
54.1 %
The values expressed are the average of threeconsequetlve analysis
53.5%
4
The HCA analysis showed that, the content of HCA was almost same as that
claimed by manufacturer but with slight deviation in Quimdis product
Quimdis S.A, France 60.7% 56.5%
Methods developed for the estimation of HCA
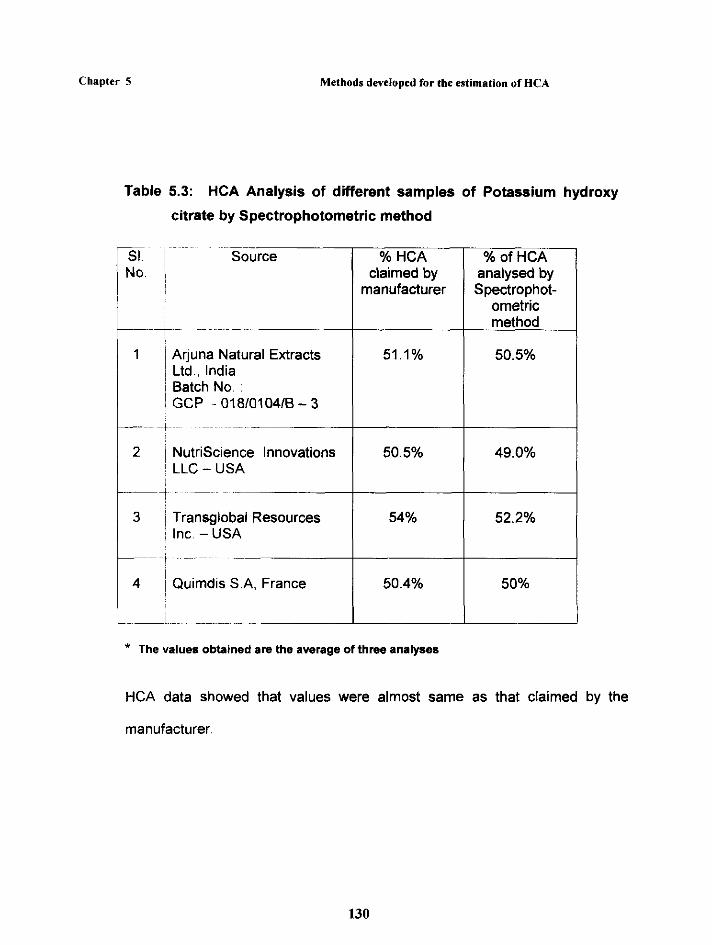
Table 5.3: HCA Analysis of different samples of Potassium hydroxy
citrate by Spectrophotometric method
~ --- Source
- - -
1 Arjuna Natural Extracts ; Ltd., India I Batch No. : ! GCP - 018101041B - 3
3 I Transglobal Resources I I 52.2% Inc -USA I
% HCA claimed by
manufacturer
2 Nutr~Sc~ence Innovations ' LLC - USA
I / 4 Quimdis S.A, France 1 50.4% 1 50% 1
% of HCA analysed by Spectrophot-
ometric method
51.1%
The values obtained are the average of three analyses
50.5%
50.5%
HCA data showed that values were almost same as that claimed by the
49.0%
manufacturer
Methods developed for the estimation o f HCA
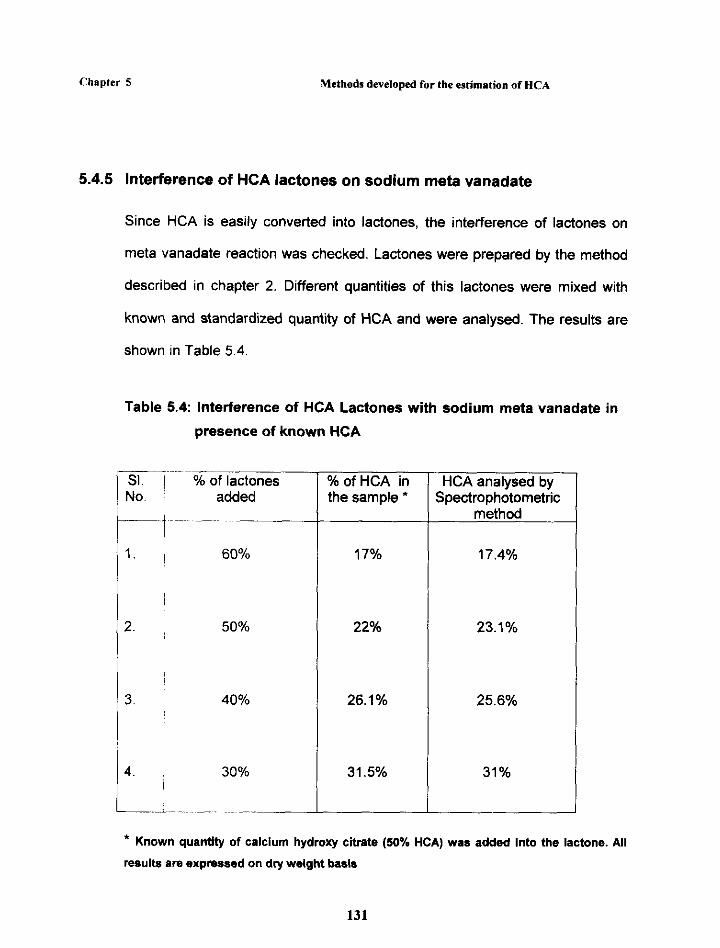
5.4.5 lnterference of HCA lactones on sodium meta vanadate
Since HCA is easily converted into lactones, the interference of lactones on
meta vanadate reaction was checked. Lactones were prepared by the method
described in chapter 2. Different quantities of this lactones were mixed with
known and standardized quantity of HCA and were analysed. The results are
shown in Table 5.4.
Table 5.4: Interference of HCA Lactones with sodium meta vanadate in
presence of known HCA
* Known quantlty of calcium hydroxy citrate (50% HCA) was added into the lactone. Ail
results are expnssed on dry weight baais
~ . . -
60%
50%
3. 40%
i
4. 30%
...~2~--. ~ - . ~~-
% of HCA in the sample
17%
22%
26.1 %
31.5%
HCA analysed by Spectrophotometric
method
17.4%
23.1%
25.6%
31 %

Methods developed for the estimation of HCA
Table 5.4 shows the non-interference of HCA lactone in color complex
formation with sodium meta vanadate and Hydroxy citric acid. We have seen
that colour complex formed between lactone and sodium meta vanadate was
yellow color but for HCA, color was orange reddish. This is a reliable method to
distinguish between HCA lactone and HCA.
5.4.6 Comparison of HCA by Spectrophotometric method and HPLC
methods
The HCA content obtained by Spectrophotometric method was compared with
HPLC method. HPLC analyses were carried out at Industrial Laboratories, USA
and Shiva Analytical Lab, Bangalore. These values are shown in Table 5.5.
From their analysis reports, it is clear that HPLC method is comparable with
that of UV - Spectrophotometric method.

Methods developed for the estimation of HCA
Table 5.5: Comparison of HCA by Spectrophotometric method and HPLC
method (for different samples)
No. content
Spectro- photo- metric
1. 1 Calcium hydroxy citrate 54.2% I I Batch No:
I GCC-023/0010/B-34
I (Arjuna Natural Extracts Ltd.) i I
2. 1 Potassium hydroxy citrate
/ Batch No.
I GCP - 018/0007/B- 4
1 (Arjuna Natural Extracts Ltd.)
HCA content by HPLC method loutside
52.6%
Magnesium hydroxy citrate
Batch No.:
i MHC - 01 1/0004/B - 1
( (Arjuna Natural Extracts Ltd.)
analysis) Industrial I Siva
56.4%
Analytical Bangalore
All samples were manufactured by Arjuna Natural Extracts Ltd., India
The Spectrophotometric analysis of HCA gives comparable results with that of
out side laboratories.

Methods developed for the estimation of HCA
5.4.7 Analysis of HCA using HPTLC
Method was developed for the analysis of HCA by HPTLC. Samples were
spotted on HPTLC plate, developed and scanned using Densitorneter CD 60.
The fluorescent chromatogram obtained was digitized by the frame grabber.
This is shown in Figure 5.3.

Chapter- 5 Method developed for the estimation of hydroxycitric acid
Fig. 5.3 Fluorescent Chromatogram of HCA by HPTLC Method
20 - 100 pg sample was loaded in precoated HPTLC plate, NH,F,,S (Merck). The plate was developed upto 7cm in the mobile phase (Methanol: Water 6:2). The plate was heated for 10'at 150° C. Cooled and scanned at 366 nm (Flourescence). Lanes 1, 3 and 4 represent Garcinia Cambogia Extract samples and lane 2 repr'esents pure citric acid.
Hydr citric
ow : acid

Methods developed for the estimation of HCA
DESAGA CD 60 Peak list
DESAGA CD 60 peak list is shown is shown below
Chromatogram No. : 0000230 printed 02/02/1999 11 :01
Name of object Hydroxy citric acid
Name of method Garcinia cambogia extract
Peak Comp. Name Y - Pos. Area Area height PM Std.Conc. No. No [mml (%) ng
Lane number : 1 (Standard No. 1) X - coordinate : 12.0 [mm]
1 13.4 347.2 70.8 134.93 b 2 37.5 56.9 11.6 25.06 b 3 1 Hydroxy citric acid 55.0 86.3 17.6 24.97 b 1.000
Lane number : 2 X - coordinate : 22.0 [mm]
1 13.1 350.0 100.0 267.32 b
Lane number 3 (Standard No. 2) X - coordinate : 32.0 [mm]
1 13.2 11.7 1.5 150.62 b 2 13.8 539.7 69.3 192.26 f 3 1 Hydroxy citric acid 55.1 227.7 29.2 56.20 b 2.000
Lane number : 4 (Standard No. 3) X - coordinate : 42.0 [mm]
1 8.6 4.1 0.3 5.31 b 2 12.3 123.9 9.8 146.53 b 3 13.4 711.7 56.1 165.86f 4 1 Hydroxy citric acid 55.5 428.8 33.8 88.25 b 3.000

Methods developed for the estimation of HCA
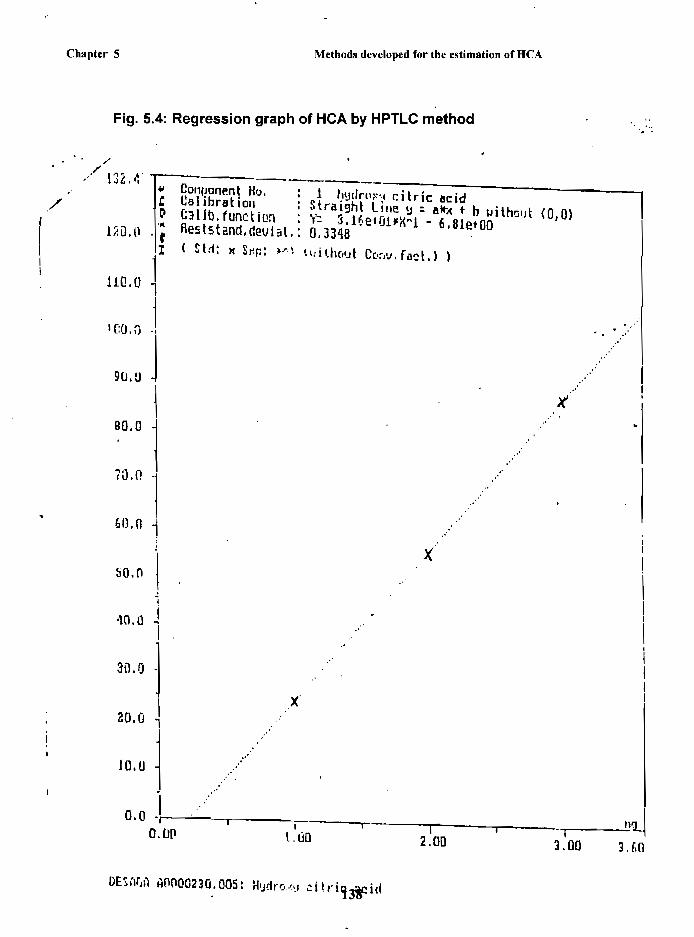
Regression graph of hydroxy citric acid by HPTLC is shown in Figure 5.4. The
detection level was found to be in between20pg-100pg. Citric acid in the
line 2 has different Rf value than HCA. Figure 5.5 shows the chromatogram of
the all-4 lanes.
5.4.8 Estimation of HCA by HPLC using C,) RP amide column
HCA and other organic acids had clear elution profile on CTB RP amide
column. The lactones also had separate peak.
Here the results obtained for the estimation of HCA present in different
hydroxy citrates, lactones and other organic acids were discussed. The
elution profile of HCA present in calcium hydroxy citrate, potassium hydroxy
citrate and sodium hydroxy citrate are shown in Figure 5.6, 5.7 and 5.8. The
regression graph obtained when different strengths of standard ethylene
diamine salt of HCA were injected is shown in Figure 5.9.
5.4.9 Elution profile of other organic acids using C.16 RP amide column
The elution profile of HCA lactone is shown in Figure 5.10. The elution profiles
of other organic acids like oxalic acid, tartaric acid, citric acid and aspartic
acid are shown in Figures 5.1 1, 5.12,5.13 and 5.14.
Chapter 5 Methods developed for the estimation of HCA
Fig. 5.4: Regression graph of HCA by HPTLC method
f -.' L32,i:
SO, 0
20.0
0.0

Chapter 5
Fig. 5.5:
Methods developed for the estimation of HCA
HPTLC profile of HCA
DESflG(I UOUO0.130.005: Hydl-ox~~ citric ac id
Chapter 5 Methods developed for the estimation of HCA
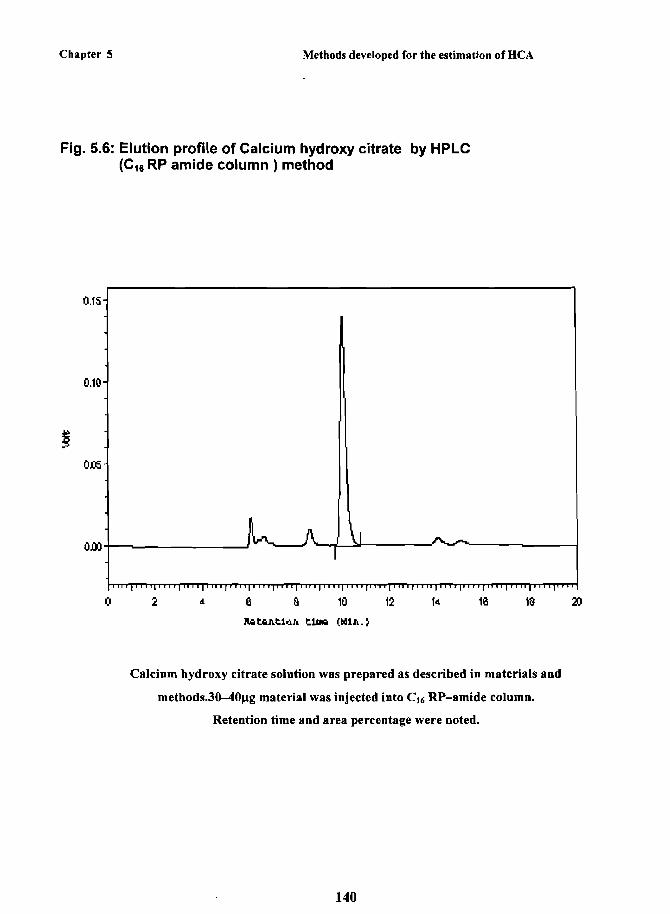
Fig. 5.6: Elution profile of Calcium hydroxy citrate by HPLC (C,, RP amide column ) method
Calcium hydroxy citrate solution was prepared as described in materials and
methods.3040pg material was injected into CIC RP-amide column.
Retention time and area percentage were noted.

Chapter 5 Methods deveIoped for the estimation of HCA
Fig. 5.7: Elution profile of Potassium hydroxy citrate by HPLC (Clb RP amide column ) method
Potassium hydroxy citrate solution was prepared as described in materials
and methods.50-60pg material was injected into CI6 RP-amide column.
Retention time and area percentage were noted.

Chapter 5 Methods developed for the estimation of HCA
Fig. 5.8: Elution profile of Sodium hydroxy citrate by HPLC (CI6 RP amide column ) method
Sodium hydroxy citrate solution was prepared as described in materials and
methods. 75-85pg material was injected into CI6 RFamide column.
Retention time and area percentage were noted.


Chapter 5 Methods developed for the estimation of HCA
Fig. 5.10: Elution profile of Lactones by HPLC (CI6 RP amide column ) method
Hydroxy citric acid lactone was prepared as described in materials and
method. 160-170p.g sample was injected into C16R&amide column.
Retention time and area percentage were noted.

Chapter 5 Methods developed for the estimation of HCA
Fig. 5.1 1 : Elution profile of Oxalic acid by HPLC (C,, RP amide column) method
Elution profile of oxalic acid using C16 RP - amide column.
60 - 65pg sample was injected.

Chapter 5 Methods developed for the estimation of IlCA
Fig. 5.12: Elution profile of Tartaric acid by HPLC (CI6 RP amide column ) method
Elution profile of tartaric acid using C16 RP - amide column.
60 - 65pg sample was injected.
Chapter 5 Methods developed for the estimation of HCA
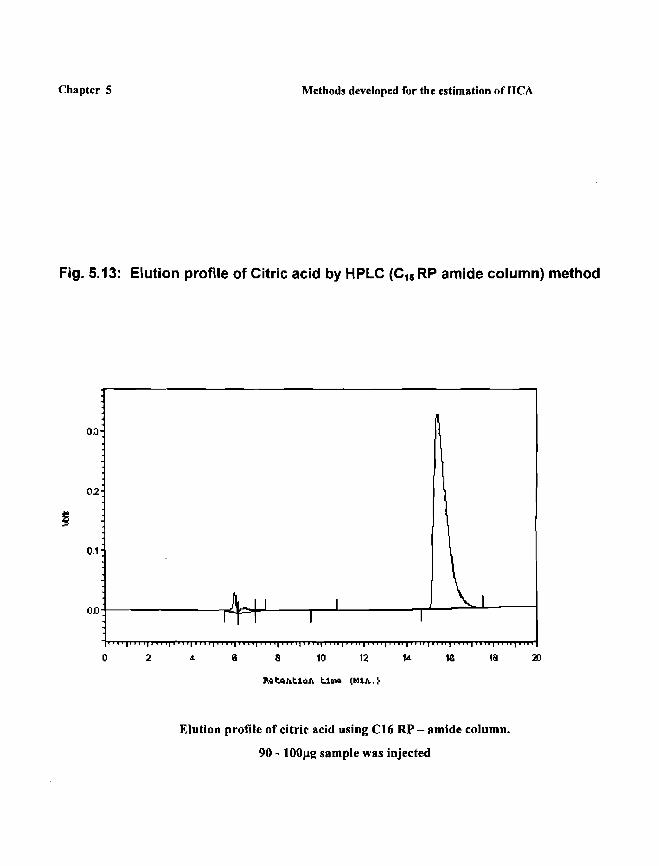
Fig. 5.13: Elution profile of Citric acid by HPLC (C,, RP amide column) method
Elution profile of citric acid using C16 RP - amide column.
90 - 100pg sample was injected
Chapter 5 Methods developed for the estimation of HCA
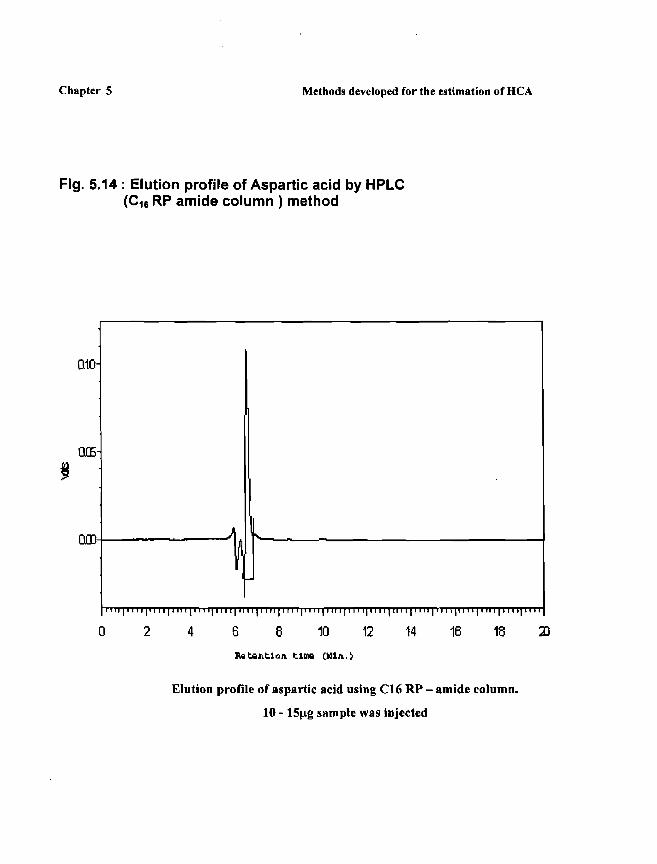
Fig. 5.14 : Elution profile of Aspartic acid by HPLC (C,, RP amide column ) method
Elution profile of aspartic acid using C16 RP - amide column.
10 - 15pg sample was injected
Methods developed for the estimation of HCA
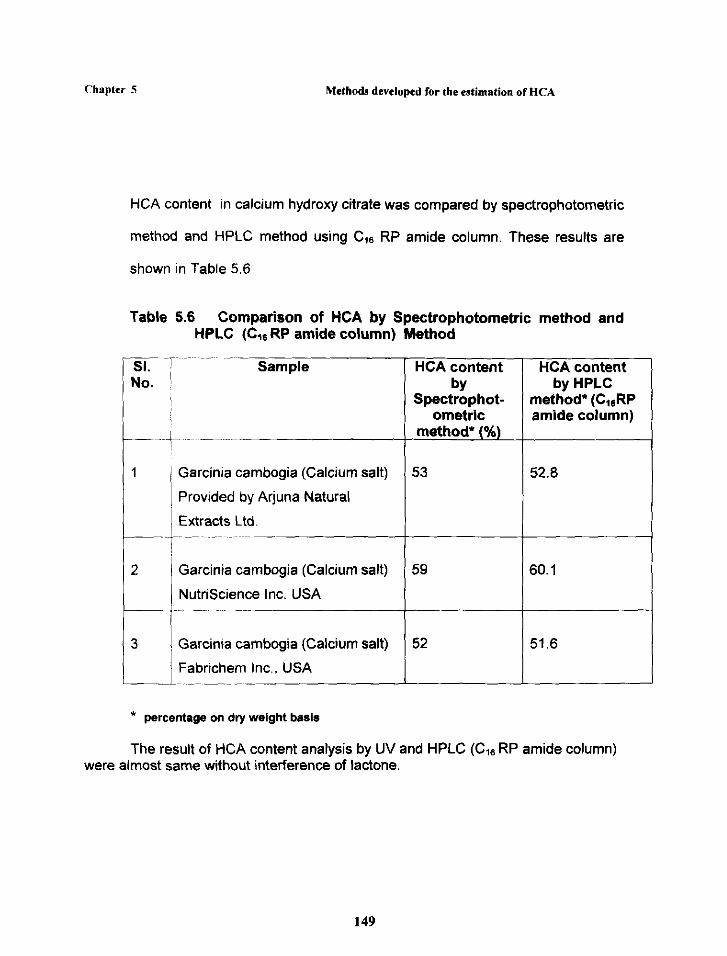
HCA content in calcium hydroxy citrate was compared by spedrophotometric
method and HPLC method using C,E RP amide column. These results are
shown in Table 5.6
Table 5.6 Comparison of HCA by Spectrophotometric method and HPLC (C,, RP amide column) Method
Garcinia cambogia (Calcium salt)
Provided by Arjuna Natural
! Extracts Ltd.
- 7 - SI. Sample No.
2 Garcinia cambogia (Calcium salt) 59
NutriScience Inc. USA
1 3 1 Garcinia cambogia (Calcium salt) 1 52
HCA content by
Spectrophot- ometric
1 / Fabrichem Inc., USA 1 1 I
HCA content by HPLC
method* (CI6RP amide column)
* percentage on dry weight basis
The resuti of HCA content analysis by UV and HPLC (Cis RP amide column) were almost same without interference of lactone.

Methods developed for the estimation of HCA
Table 5.7: Analysis of HCA in different branded products by Spectrophotometric and HPLC methods
Brand name
LivSlim MIS LivLong Neutraceutical Ltd.
Medication is a mixture of different ingredients Including Garcinia cambogia extract (calcium salt)
Ayurslim MIS Himalaya Drug Company
Different branded products of G.cambogia extract were tested and showed in
490 rng
Table 5.7. Content of G.carnbogia extract was different in the products. So the
495 rng.
HCA content also varied from product to product.
41.3% 40.6%
31.1% 30.9%
Methods developed for the estimation of HCA
5.5 Discussion
Some analytical procedures were developed in order to estimate HCA content in
hydroxy citrates, extracts and derivatives. Titration methods to find out acidity or
acid value provide only a crude or rough idea about the ingredient. Advanced
technology or elaborate analytical procedures are necessary for estimation of
HCA. The procedures developed using UV. HPLC and HPTLC were described in
this chapter provide an accurate estimation of HCA.
The analytical procedure for Spectrophotometric method is very simple. The color
complex formed when HCA reacted with sodium meta vanadate is unique and
specific. No color complex was formed when citric acid was taken as sample. This
indicates that color complex formed is directly proportional to quantity of HCA
present in Garcinia cambogia fruit. Citric acid is present in Garcinia cambogia at a
level of 3- 5%. This was estimated by pentabromoacetone method. Color complex
formed has absorption maxima of 467nm i.e., in the visible region. Lactone does
not interfere with color formation.

Methods developed for the estimation of HCA
The reaction is time dependant. It takes about 15 - 20 minutes to stabilize the
color. This incubation time is quite satisfactory to carry out the analysis. Hydroxy
citrates were hydrolyzed using H2SO4. The optimum conditions were also studied.
We have analyzed different samples collected from different manufacturers of
HCA. There was not much difference in HCA level based on the claims.
In the second method, HCA was separated by HPTLC. Here HCA is compared
with citric acid. Since the Rf values obtained for HCA and Citric acid are very
different, these can be detected very easily. One major advantage of method is
that, analysis is possible for a large number of samples simultaneously. This will
provide a comparative study for many samples. The detection level of HCA was
found to be in between 20pg - 100pg.
The third method described is HPLC using C,6 RP amide column. a -hydroxy
organic acids are easily separated and identified using this CIS RP amide column
and it is specific for a -hydroxy acids. The HPLC analysis done by
JIX Antony et a/. described a method for HCA analysis. But, the results are
obtained by a comparative method by calculating the total acids and by deducting
the percentage of citric acid from the total acids. Direct estimation of HCA is not
included in that procedure. The method described here has provided separate
Methods developed for the estimation of HCA
elution profile for organic acids, lactone and hydroxy citrates and can compare the
results. But analysis-using HPLC is more expensive than any of the other
methods. The only draw back of spectrophotometric method is its time
dependence. The color complex formed is unstable and change its color on
keeping. Though the HPLC analysis is time consuming and expensive, it is more
accurate and specific. For larger number of samples, HPTLC method is the best
and cheapest in terms of recurring cost.


![The Penultimate Scheme for Systems of Conservation Laws ...physbam.stanford.edu/~fedkiw/papers/cam1996-18.pdfmethods developed to deal with them can be found in Leveque’s book [8]](https://img.pdfslide.us/doc/110x75/5ec50f32bb95b959ec1a464f/the-penultimate-scheme-for-systems-of-conservation-laws-fedkiwpaperscam1996-18pdf.jpg)


![ESTIMATION THEORY - The Open Academy · [Kay’93] S. M. Kay, Fundamentals of Statistical Signal Processing: Estimation Theory, ... we use one of the previously developed estimation](https://img.pdfslide.us/doc/110x75/5b155eee7f8b9a382f8bdbe6/estimation-theory-the-open-academy-kay93-s-m-kay-fundamentals-of-statistical.jpg)


![INTRODUCTION · Web view] and seismic wave arrival time estimation. As a result, a number of TOF estimation methods have been developed in other disciplines. Methods based on cross-correlation](https://img.pdfslide.us/doc/110x75/5f6ca93d139fb2254e471a21/introduction-web-view-and-seismic-wave-arrival-time-estimation-as-a-result-a.jpg)


![Sparse Doubly-Selective Channel Estimation Techniques for … · 2020. 5. 27. · passing (AMP) approach has been developed in [15] with its application to sparse channel estimation](https://img.pdfslide.us/doc/110x75/61176e0b18692452b6640d95/sparse-doubly-selective-channel-estimation-techniques-for-2020-5-27-passing.jpg)