Embed Size (px)
Citation preview

Annals of the „Constantin Brâncuşi” University of Târgu Jiu, Economy Series, Issue 2/2014
„ACADEMICA BRÂNCUŞI” PUBLISHER, ISSN 2344 – 3685/ISSN-‐L 1844 -‐ 7007
METHODOLOGY OF THE STUDY “CORELATION OF COMPETENCES
OF ECONOMISTS WITH THE OFFER ON LABOR MARKET”
Minica Mirela, Associate professor, “Eftimie-Murgu” University, Resita, Romania, [email protected]
Gherghina Liliana,
Ph.D.Assistant, “Eftimie-Murgu” University, Resita, Romania, [email protected]
Abstract The article provides a general overview of the objectives and methods of research regarding a collective topic
covered in the research plan of the Department of Economics in 2013, for which the authors have performed the activity on scientific instruments.
Providing quality educational services by higher economic education in Romania, involves correlation of structures and contents of curricula with employers requirements, such that graduates integrate faster on an imperfect and dynamic labor market.
We therefore considered useful the submission for publication of the methodology on marketing research based on this research theme, for giving the opportunity to other specialists the opportunity to transmit improvement suggestions and to develop future partnership, in the purpose of extending the scope of this study.
The research aims to identify the competencies, skills and attitudes of future employee economists and design a trialogue learning model which leads to the formation and development of these demands of employers.
Key words: labor market, labor supply, skills, marketing research, research methodology 1. Introduction The knowledge society implies a fundamental change in approach to knowledge transfer, transition to
information involving jurisdiction skills development, specific attitudes of a period in which knowledge increases exponentially.(George Siemens, 2004)
“Our students have changed radically. They are not anymore the individuals that our educational system was designed to teach.” (Sami Paavola, Ritva Engeström, Kai Hakkarsinen, 2009).
Prensky M., in the paper “Digital natives, digital immigrants” stated in 2001, the need for major changes in the academic learning strategy.
Most universities fail to keep pace with these changes, and then it appears as a response from the labor market a response phenomenon: high unemployment rate among young people, even university graduates.
At the fundaments of a trialogue learning strategy, in which the learning is based on the investigation and project-based learning are essential, just connecting universities with real economy provides real opportunities to graduates entering the labor market.
The strategic management of higher education must necessarily take into account major changes in the knowledge society and adapt to a dynamic accelerated lifecycle of information to correlate with the attitude of lifelong learning skills.
Transforming universities in business organizations can only be achieved in a viable public-private partnership and mutual involvement in addressing needs and adapt to a difficult to predict economy with fluctuating business cycles in the globalized market.
2. Objectives of the study The research topic, whose methodology is presented in this article aims to create a basis for the trialogic
learning model by identifying knowledge artifacts, facts, ideas and experiences of stakeholders: employers and prospective employees – graduates of tertiary economic studies.
For this we identified the following objectives: The fundamental objective has been identifies as: Designing a coherent and unified learning strategy for
training and skills development of economics students. Specific objectives: • Specific objective 1: identification of competencies of economics graduates required by employers; • Specific objective 2: Creating a sustainable partnership between relevant actors in the faculties of regional
economics and the economic environment; • Specific objective 3: Designing and implementing a generic model for trialogue learning at the level of
economic specialization.
211
Annals of the „Constantin Brâncuşi” University of Târgu Jiu, Economy Series, Issue 2/2014
„ACADEMICA BRÂNCUŞI” PUBLISHER, ISSN 2344 – 3685/ISSN-‐L 1844 -‐ 7007
The target group that is conducting the research represents public and private units in the western part of Romania.
3. Research method 3.1. Marketing research methodology In order to achieve marketing research under optimal conditions, we have developed marketing research
methodology, processed by Balaure V. (2000), in three stages, namely: - Stage I – preliminary stage consisting of: detecting and defining the problem, establishing the purpose, identifying
goals, developing research hypotheses, preliminary estimate of the value of information obtained from research; - Stage II – design phase containing: choice of information sources, selecting the method of collection and
systematization of information, budgeting and timing of research; - Stage III – implementation phase consisting of: harvesting information, analysis and interpretation of research
findings and presentation of the report on marketing research. The article presents in more details the first two stages, the results of the research will be subject on further
study.
3.2. Stage I - Preliminary phase 1. Discovering and defining the investigated problem Considering the economic crisis of recent years and the fact that in Romania the labor supply has decreased, it
is necessary to develop a marketing study that will identify the causes directly dependent on universities for the decreasing of labor places vacant for graduate economists.
We also want to get information about professional skills that employers ask from economists at graduation, knowing that they are at the basis of recruitment and selection of future employees and at the foundation of staff performance evaluation in any public or private institution. 2. Purpose of research
The main purpose of marketing research is to know the degree of trust, satisfaction and importance an employer gives to the services provided by economic graduates.
Depending on the assessment made by employers, we develop marketing strategies that aim to design a learning system that generates skills for economic graduates (marketing strategies for product policy) in connection with the offer on the labor market (marketing strategies for quality policy).
3. Identifying research objectives General objective: evaluate employers’ attitudes on professional training of economic graduates in western region of Romania and identifying skills required by them. Specific objectives: - development of marketing strategies for product policy that will improve the confidence of employers (increased supply) to the satisfaction of the employer (employer satisfaction and retention of graduates) to increase the performance of graduates economists (improving the quality of study programs) and the improvement of curricula offer of Faculties of Economics. - development of marketing strategies for quality policy leading to adaptation of professional skills of economics graduates to the demands of employers, improving the knowledge of graduates by creating an information system that will centralize all proposals to redesign the structure of curricula, content and assessment systems generated by learning trialogue system. 4. Developing research hypotheses It can be said that business employers in the Western region of Romania want economics graduates highly professional trained, which requires that during college, graduates should acquire professional skills required by the job description according to the specificity of each activity domain. In developing the research hypotheses we considered the responses given by respondents to the pre-test questionnaire, namely:
a) regardless of the absolved specialization, all subjects must have an adequate set of knowledge in microenomics, management, marketing, bisiness economics, accounting, finance and business law on which to base their professional and technical skills (hard skills).
b) the main soft skills required are: teamwork, communication skills, initiative, persecerance, ethics, customer orientation, flexibility, adaptability, innovation, efficiency, empathy.
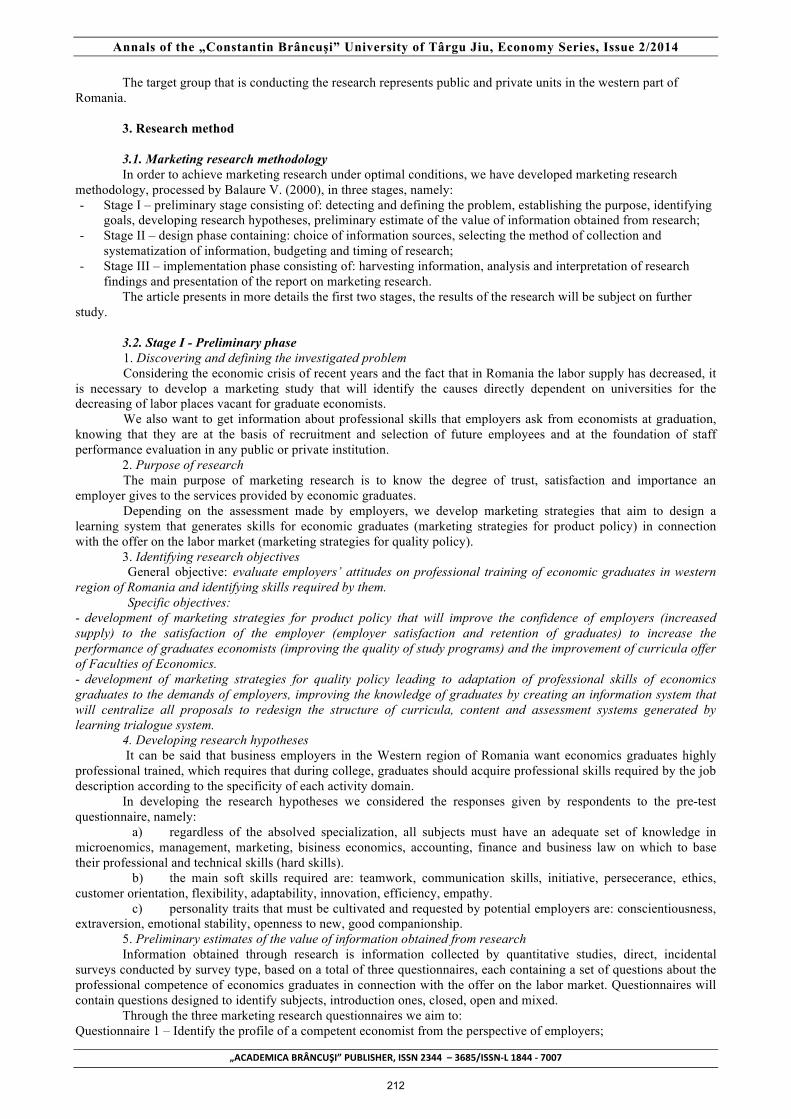
c) personality traits that must be cultivated and requested by potential employers are: conscientiousness, extraversion, emotional stability, openness to new, good companionship. 5. Preliminary estimates of the value of information obtained from research Information obtained through research is information collected by quantitative studies, direct, incidental surveys conducted by survey type, based on a total of three questionnaires, each containing a set of questions about the professional competence of economics graduates in connection with the offer on the labor market. Questionnaires will contain questions designed to identify subjects, introduction ones, closed, open and mixed. Through the three marketing research questionnaires we aim to: Questionnaire 1 – Identify the profile of a competent economist from the perspective of employers;
212
Annals of the „Constantin Brâncuşi” University of Târgu Jiu, Economy Series, Issue 2/2014
„ACADEMICA BRÂNCUŞI” PUBLISHER, ISSN 2344 – 3685/ISSN-‐L 1844 -‐ 7007
Questionnaire 2 – Create a profile for an effective economist and identify the need to train transversal competences; Questionnaire 3 – Identify employer attitudes regarding study programs offer of the Faculty of Economics. As a method of communication with subjects, our surveys are based on direct personal inquiries on the subjects (face to face), which gives us the advantage of the possibility of conviction subjects to participate in the interview (survey) and to answer questions that would otherwise remain unanswered, thus ensuring a high rate of participation of subjects in the conduct of investigations. It can be said that the information (answers) obtained from subjects are qualitative if the interviewer does not influence the subject’s responses.
3.3. Stage II –Step design Questionnaire 1
Identify the profile of a competent economist from the perspective of employers
1. The choice of research information sources In the present marketing research, information is obtained from individuals (individual inquiries) as
reprezentatives of enterprises with legal personality, chosen based on the sample structure of all enterprises in the Western Region of Romania. In this sense, a sampling method should be chosen and sample size should be determined.
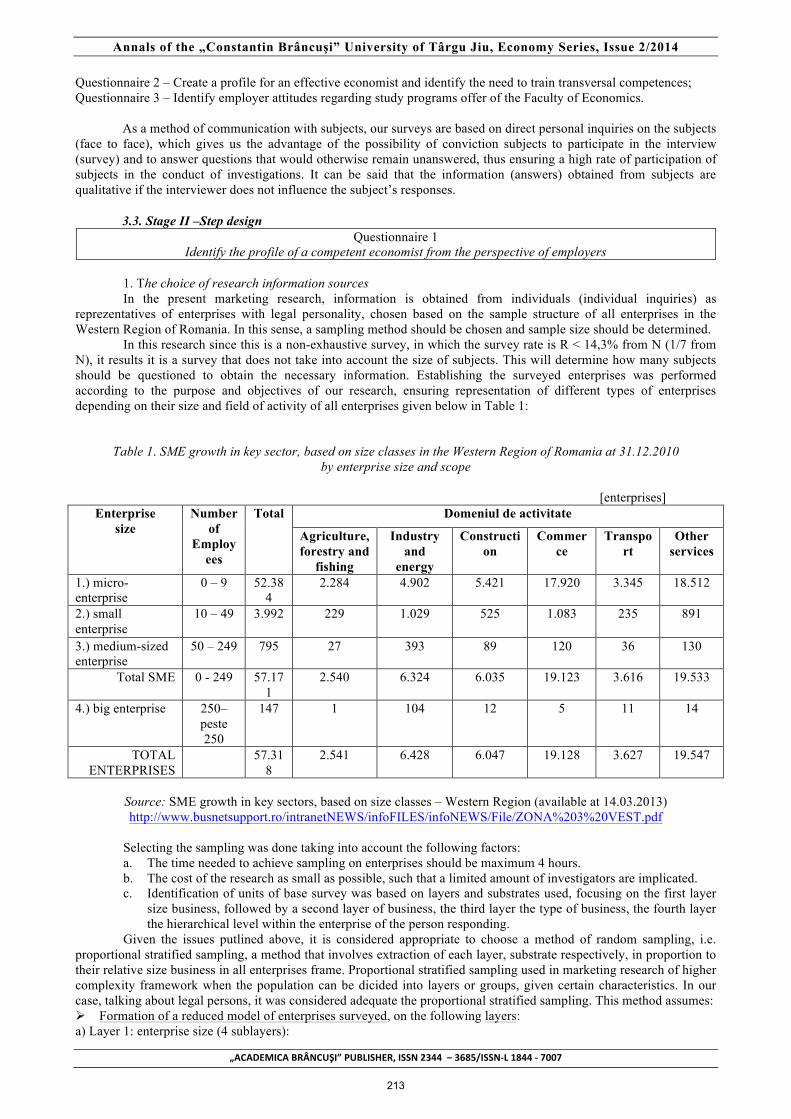
In this research since this is a non-exhaustive survey, in which the survey rate is R < 14,3% from N (1/7 from N), it results it is a survey that does not take into account the size of subjects. This will determine how many subjects should be questioned to obtain the necessary information. Establishing the surveyed enterprises was performed according to the purpose and objectives of our research, ensuring representation of different types of enterprises depending on their size and field of activity of all enterprises given below in Table 1:
Table 1. SME growth in key sector, based on size classes in the Western Region of Romania at 31.12.2010 by enterprise size and scope
[enterprises]
Enterprise size
Number of
Employees
Total Domeniul de activitate
Agriculture, forestry and
fishing
Industry and
energy
Construction
Commerce
Transport
Other services
1.) micro-enterprise
0 – 9 52.384
2.284 4.902 5.421 17.920 3.345 18.512
2.) small enterprise
10 – 49 3.992 229 1.029 525 1.083 235 891
3.) medium-sized enterprise
50 – 249 795 27 393 89 120 36 130
Total SME 0 - 249 57.171
2.540 6.324 6.035 19.123 3.616 19.533
4.) big enterprise 250–peste 250
147 1 104 12 5 11 14
TOTAL ENTERPRISES
57.318
2.541 6.428 6.047 19.128 3.627 19.547
Source: SME growth in key sectors, based on size classes – Western Region (available at 14.03.2013) http://www.busnetsupport.ro/intranetNEWS/infoFILES/infoNEWS/File/ZONA%203%20VEST.pdf
Selecting the sampling was done taking into account the following factors: a. The time needed to achieve sampling on enterprises should be maximum 4 hours. b. The cost of the research as small as possible, such that a limited amount of investigators are implicated. c. Identification of units of base survey was based on layers and substrates used, focusing on the first layer
size business, followed by a second layer of business, the third layer the type of business, the fourth layer the hierarchical level within the enterprise of the person responding.
Given the issues putlined above, it is considered appropriate to choose a method of random sampling, i.e. proportional stratified sampling, a method that involves extraction of each layer, substrate respectively, in proportion to their relative size business in all enterprises frame. Proportional stratified sampling used in marketing research of higher complexity framework when the population can be dicided into layers or groups, given certain characteristics. In our case, talking about legal persons, it was considered adequate the proportional stratified sampling. This method assumes: Ø Formation of a reduced model of enterprises surveyed, on the following layers: a) Layer 1: enterprise size (4 sublayers):
213

Annals of the „Constantin Brâncuşi” University of Târgu Jiu, Economy Series, Issue 2/2014
„ACADEMICA BRÂNCUŞI” PUBLISHER, ISSN 2344 – 3685/ISSN-‐L 1844 -‐ 7007
- micro-enterprise; - small enterprise; - medium-sized enterprise; - big enterprise.
b) Layer 2: field of activity (6 sublayers): - agriculture, forestry and fishing; - industry and energy; - constructions; - commerce; - transport; - other services;
c) Layer 3: type of activity (4 sublayers): - administration; - production; - trade-marketing; - accounting.
d) Layer 4: hierarchical level in the company of the person responding (2 sublayers): - leading function; - execution function.
Ø Survey plan preparation: for this shall be considered the total size of enterprises, the sample size and the number of field operators (investigators).
Stratified proportional sampling involves the need for statistics on the firms studied, shown in Table 1. As a form of research we opted for an independent investigation based on a structured questionnaire consisting of 12 closed questions, 4 questions of identification and 8 questions on the subject of study.
To determine the sample size, we took statistics existent today. Determination of sample size is based on the rate of the survey. Suppose the value of the sample size provided by statistical studies of n = 384 enterprises, knowing that all enterprises registered in the Western Region of Romania is N = 57 318 companies. The formula used for the calculation of survey rate is (Dobre C., Negruţ C., Venczel M., 1995):
R = 100⋅Nn (1)
R = 100⋅Nn = [384/ 57.318] x100=0,66994% < 1 / 7 (14,286%) from N
ð Non-exhaustive survey (survey does not take into account the size of enterprises)
If we do not know the minimal sample size, the following formula will be applied:
n = ( )2
2
2
2 1e
ppte
qpt −×=
×× (2)
n = minimum sample size quota; t = statistical coefficient whose value depends on the confidence level used (in this case study t = 1.96, corresponding to a confidence level or probability guarantee of research results being i = 0.95 = 95%); p = frequency of occurance in the sample studied phenomenon (in our study p = 0.50, such that the dispersion will have the maximum possible value); the proportion of those who chosen a positive response (YES); q = 1 – p (q = 0,50) – the dispersion of the studied phenomenon will have the maximum possible value; the proportion of those who chosen a negative answer (NO); p = q = 0,50; e = margin error (deviation allowed) that can tolerate the estimate, in our case the confidence interval e = ±5 % = ± 0,05.
The minimum size of non-exhaustive sampling will be:
n = 16,3840025,09604,0
0025,025,08416,3
05,050,050,096,1
2
2
==×
=×× enterprises
n = 384 persons (subjects) because it approximates at a natural number. The value of the sample size will be corrected by using the following formula: n’ =
NnNn
+
× (3)
n’ = 382444,381702.57112.010.22
318.57384318.57384
===+
×=
+
×
NnNn enterprises
So the sample size will be n = 382 enterprises. When designing the questionnaire, we have to consider the 4 layers, such that when pre-testing the
questionnaire the number of firms does not exceed the product of the 14 sublayers and the size of the pilot sample size is equal to:
ð Pilot sample for pre-testing the questionnaire was: np = 4 sublayers (enterprise size) * 6 sublayers (activity domain) * 4 sublayers (type of activity) * 2 sublayers
(hierarchical level in the company of the person responding) = 192 enterprises.
214
Annals of the „Constantin Brâncuşi” University of Târgu Jiu, Economy Series, Issue 2/2014
„ACADEMICA BRÂNCUŞI” PUBLISHER, ISSN 2344 – 3685/ISSN-‐L 1844 -‐ 7007
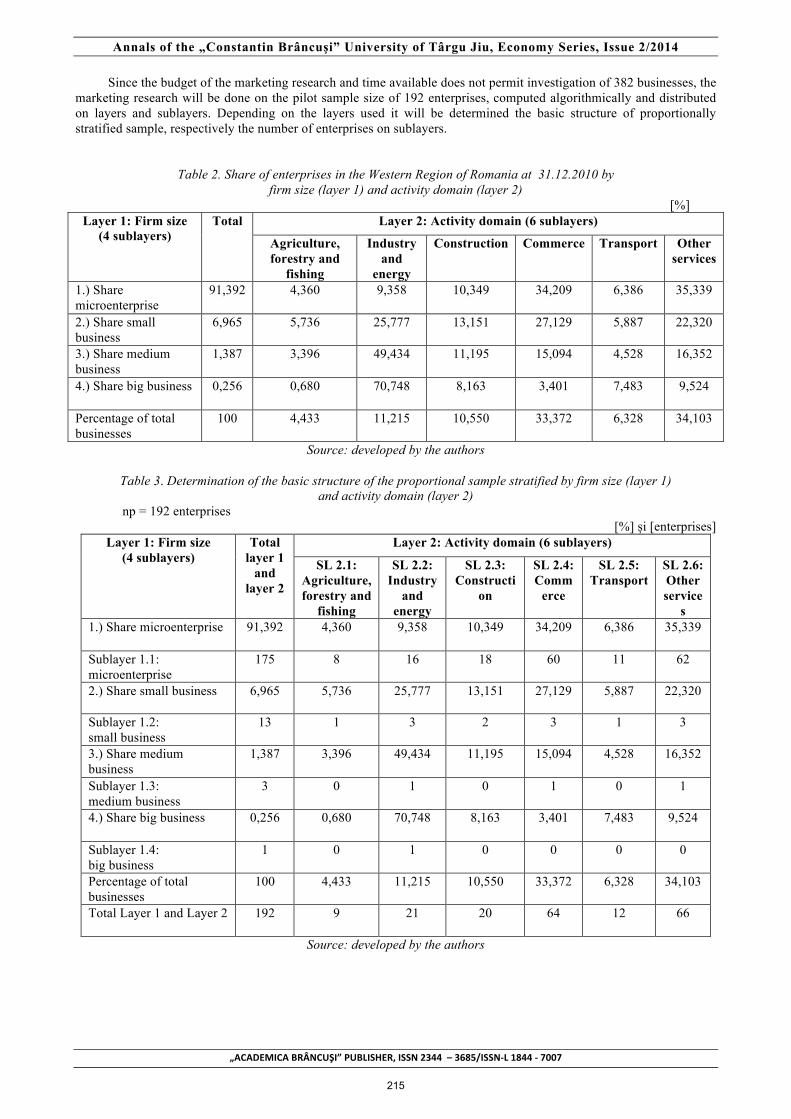
Since the budget of the marketing research and time available does not permit investigation of 382 businesses, the marketing research will be done on the pilot sample size of 192 enterprises, computed algorithmically and distributed on layers and sublayers. Depending on the layers used it will be determined the basic structure of proportionally stratified sample, respectively the number of enterprises on sublayers.
Table 2. Share of enterprises in the Western Region of Romania at 31.12.2010 by firm size (layer 1) and activity domain (layer 2)
[%] Layer 1: Firm size
(4 sublayers) Total Layer 2: Activity domain (6 sublayers)
Agriculture, forestry and
fishing
Industry and
energy
Construction Commerce Transport Other services
1.) Share microenterprise
91,392 4,360 9,358 10,349 34,209 6,386 35,339
2.) Share small business
6,965 5,736 25,777 13,151 27,129 5,887 22,320
3.) Share medium business
1,387 3,396 49,434 11,195 15,094 4,528 16,352
4.) Share big business 0,256 0,680 70,748 8,163 3,401 7,483 9,524
Percentage of total businesses
100 4,433 11,215 10,550 33,372 6,328 34,103
Source: developed by the authors
Table 3. Determination of the basic structure of the proportional sample stratified by firm size (layer 1) and activity domain (layer 2)
np = 192 enterprises [%] și [enterprises]
Layer 1: Firm size (4 sublayers)
Total layer 1
and layer 2
Layer 2: Activity domain (6 sublayers)
SL 2.1: Agriculture, forestry and
fishing
SL 2.2: Industry
and energy
SL 2.3: Constructi
on
SL 2.4: Comm
erce
SL 2.5: Transport
SL 2.6: Other service
s 1.) Share microenterprise 91,392 4,360 9,358 10,349 34,209 6,386 35,339
Sublayer 1.1: microenterprise
175 8 16 18 60 11 62
2.) Share small business 6,965 5,736 25,777 13,151 27,129 5,887 22,320
Sublayer 1.2: small business
13 1 3 2 3 1 3
3.) Share medium business
1,387 3,396 49,434 11,195 15,094 4,528 16,352
Sublayer 1.3: medium business
3 0 1 0 1 0 1
4.) Share big business 0,256 0,680 70,748 8,163 3,401 7,483 9,524
Sublayer 1.4: big business
1 0 1 0 0 0 0
Percentage of total businesses
100 4,433 11,215 10,550 33,372 6,328 34,103
Total Layer 1 and Layer 2 192 9 21 20 64 12 66
Source: developed by the authors
215
Annals of the „Constantin Brâncuşi” University of Târgu Jiu, Economy Series, Issue 2/2014
„ACADEMICA BRÂNCUŞI” PUBLISHER, ISSN 2344 – 3685/ISSN-‐L 1844 -‐ 7007
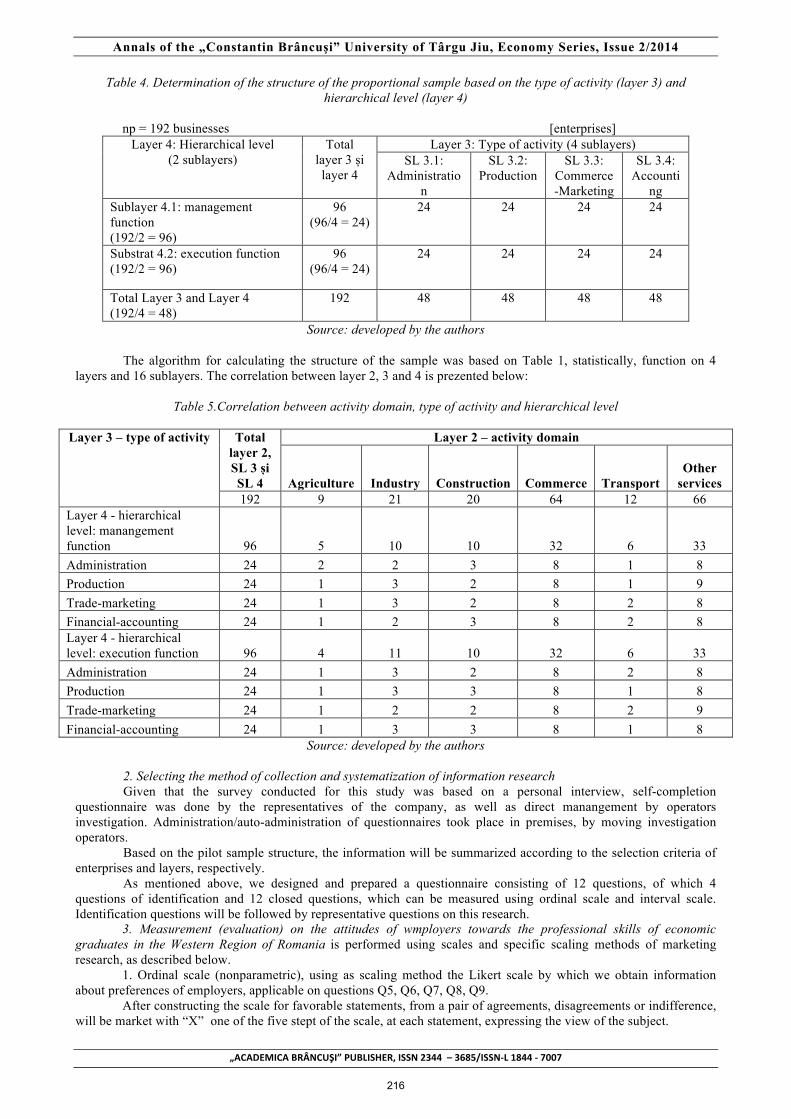
Table 4. Determination of the structure of the proportional sample based on the type of activity (layer 3) and hierarchical level (layer 4)
np = 192 businesses [enterprises]
Layer 4: Hierarchical level (2 sublayers)
Total layer 3 și layer 4
Layer 3: Type of activity (4 sublayers) SL 3.1:
Administration
SL 3.2: Production
SL 3.3: Commerce-Marketing
SL 3.4: Accounti
ng Sublayer 4.1: management function (192/2 = 96)
96 (96/4 = 24)
24 24 24 24
Substrat 4.2: execution function (192/2 = 96)
96 (96/4 = 24)
24 24 24 24
Total Layer 3 and Layer 4 (192/4 = 48)
192 48 48 48 48
Source: developed by the authors
The algorithm for calculating the structure of the sample was based on Table 1, statistically, function on 4 layers and 16 sublayers. The correlation between layer 2, 3 and 4 is prezented below:
Table 5.Correlation between activity domain, type of activity and hierarchical level
Layer 3 – type of activity Total
layer 2, SL 3 și SL 4
Layer 2 – activity domain
Agriculture Industry Construction Commerce Transport Other
services 192 9 21 20 64 12 66
Layer 4 - hierarchical level: manangement function 96 5 10 10 32 6 33 Administration 24 2 2 3 8 1 8 Production 24 1 3 2 8 1 9 Trade-marketing 24 1 3 2 8 2 8 Financial-accounting 24 1 2 3 8 2 8 Layer 4 - hierarchical level: execution function 96 4 11 10 32 6 33 Administration 24 1 3 2 8 2 8 Production 24 1 3 3 8 1 8 Trade-marketing 24 1 2 2 8 2 9 Financial-accounting 24 1 3 3 8 1 8
Source: developed by the authors
2. Selecting the method of collection and systematization of information research Given that the survey conducted for this study was based on a personal interview, self-completion
questionnaire was done by the representatives of the company, as well as direct manangement by operators investigation. Administration/auto-administration of questionnaires took place in premises, by moving investigation operators.
Based on the pilot sample structure, the information will be summarized according to the selection criteria of enterprises and layers, respectively.
As mentioned above, we designed and prepared a questionnaire consisting of 12 questions, of which 4 questions of identification and 12 closed questions, which can be measured using ordinal scale and interval scale. Identification questions will be followed by representative questions on this research.
3. Measurement (evaluation) on the attitudes of wmployers towards the professional skills of economic graduates in the Western Region of Romania is performed using scales and specific scaling methods of marketing research, as described below.
1. Ordinal scale (nonparametric), using as scaling method the Likert scale by which we obtain information about preferences of employers, applicable on questions Q5, Q6, Q7, Q8, Q9.
After constructing the scale for favorable statements, from a pair of agreements, disagreements or indifference, will be market with “X” one of the five stept of the scale, at each statement, expressing the view of the subject.
216

Annals of the „Constantin Brâncuşi” University of Târgu Jiu, Economy Series, Issue 2/2014
„ACADEMICA BRÂNCUŞI” PUBLISHER, ISSN 2344 – 3685/ISSN-‐L 1844 -‐ 7007
2. Scale interval (parametric) using the semantic differential scaling method by which information about employers’ attitudes and opinions.
The subject is asked to express opinions about the feature under investigation, which can be measured through levels 3, 5, 7, located between two opposite marks.
Pre-testing the questionnaire in the Western Region of Romania was conducted on a sample size of 192 pilot enterprises, distributed according to the table below, the 4 counties: Timis, Arad, Caras-Severin and Hunedoara.
Table 6. Business distribution in the Western Counties of Romania
County (equal groups in each county by area of
activity)
Total Layer 2 – activity domain
agriculture industry construction commerce transport other
services 192 9 21 20 64 12 66
Timis 48 3 5 6 16 2 16 Arad 48 2 6 4 16 2 18 Caras Severin 48 2 6 4 16 4 16 Hunedoara 48 2 4 6 16 4 16
Source: developed by the research team
4. Budgeting and timing of research Administration of the questionnaire is based on: work program of the surveyed employers, representants of
businesses, time budget allowed for the survey (time allocated to administrate the questionnaire), money budget granted for: multiplication of questionnaires, transport and accommodation for investigators, payment of staff, other expenses. The questionnaire was conducted from March to April 2013 for 2 days, in the time interval 8:00-16:00. The average time necessary to complete a questionnaire is about 30 minutes.
Reducing the number of days for administrating the questionnaire could be achieved by allocating a total of 6 investigator operators, like: 192 questionnaires : 6 operators = 32 questionnaires / operator (32 questionnaires/ operator x 30 minutes/ questionnaire) / 60 min/hour = 16 hours (2 days) 32 questionnaires / operator: 2 days = 16 questionnaires / day (8 hours)
The money budget granted to duplicate questionnaires, transport and accommodation for operators, staff payment and other expenses is estimated at 10 000 lei. Administration/auto-administration of the questionnaire will be conducted on the enterprises that can be part of the sample computed, with the help of 6 trained persons.
3.4. Stage III – implementation phase
Questionnaire 1 Identify competent economist profile from the perspective of employers
1. Gathering research information Gathering research information was conducted by operators, who are well trained, so they can make the
subjects interested in the subjects of the survey, to convince them that their cooperation has an important contribution to solving the problem under investigation.
It seeks a partnership with the West University of Timisoara and Vasile Goldis University of Arad to collect information from the other three counties in the Western Region, to decrease costs and project sustainability. In the context of future regionalization, economics graduates will have greater mobility, so a collaborative approach is more appropriate than a competition. Strategically thinking, our educational quality has as result indicators the number of students who find a job in the field studied and employers’satisfaction regarding the quality and skills they possess, no matter what university they graduated from. When gathering information from Caras-Severin county and processing the results, only teachers from the Faculty of Economics of the University “Eftimie-Murgu” Resita had participated. To facilitate collection of research information, we have codified the questionnaires.
217
Annals of the „Constantin Brâncuşi” University of Târgu Jiu, Economy Series, Issue 2/2014
„ACADEMICA BRÂNCUŞI” PUBLISHER, ISSN 2344 – 3685/ISSN-‐L 1844 -‐ 7007
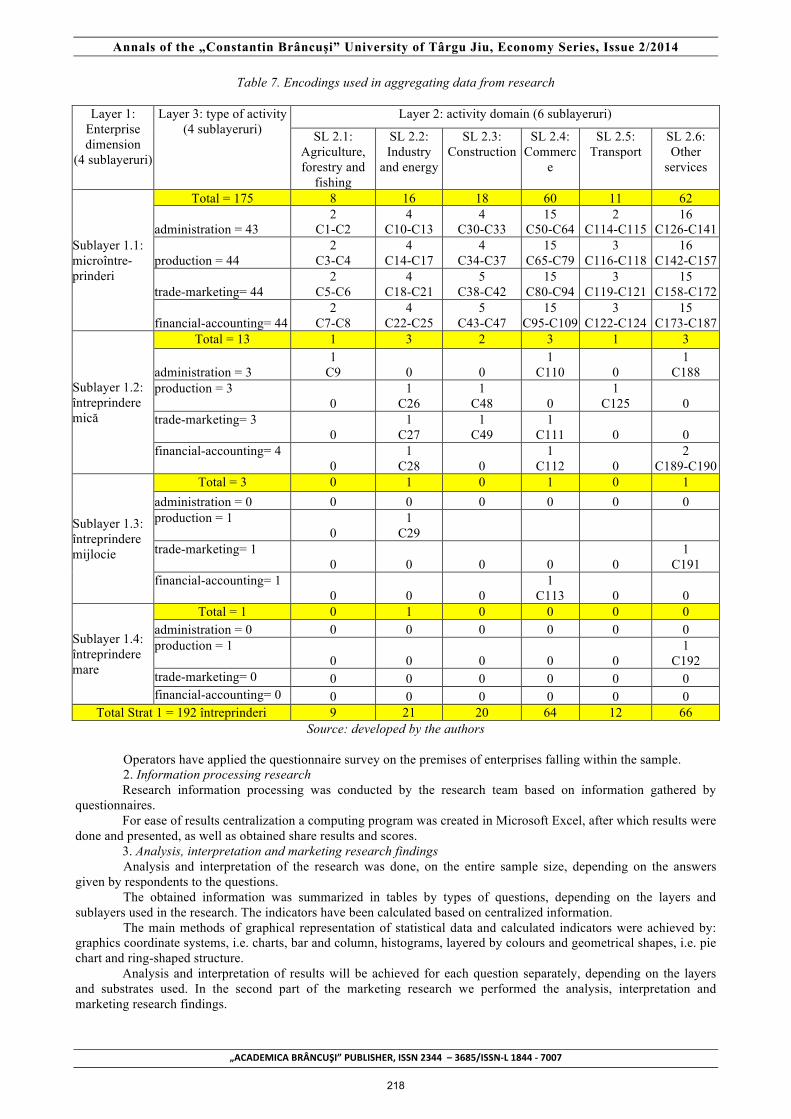
Table 7. Encodings used in aggregating data from research
Layer 1: Enterprise dimension
(4 sublayeruri)
Layer 3: type of activity (4 sublayeruri)
Layer 2: activity domain (6 sublayeruri)
SL 2.1: Agriculture, forestry and
fishing
SL 2.2: Industry
and energy
SL 2.3: Construction
SL 2.4: Commerc
e
SL 2.5: Transport
SL 2.6: Other
services
Sublayer 1.1: microîntre-prinderi
Total = 175 8 16 18 60 11 62
administration = 43 2
C1-C2 4
C10-C13 4
C30-C33 15
C50-C64 2
C114-C115 16
C126-C141
production = 44 2
C3-C4 4
C14-C17 4
C34-C37 15
C65-C79 3
C116-C118 16
C142-C157
trade-marketing= 44 2
C5-C6 4
C18-C21 5
C38-C42 15
C80-C94 3
C119-C121 15
C158-C172
financial-accounting= 44 2
C7-C8 4
C22-C25 5
C43-C47 15
C95-C109 3
C122-C124 15
C173-C187
Sublayer 1.2: întreprindere mică
Total = 13 1 3 2 3 1 3
administration = 3 1
C9 0 0 1
C110 0 1
C188 production = 3
0 1
C26 1
C48 0 1
C125 0 trade-marketing= 3
0 1
C27 1
C49 1
C111 0 0 financial-accounting= 4
0 1
C28 0 1
C112 0 2
C189-C190
Sublayer 1.3: întreprindere mijlocie
Total = 3 0 1 0 1 0 1 administration = 0 0 0 0 0 0 0 production = 1
0 1
C29 trade-marketing= 1
0 0 0 0 0 1
C191 financial-accounting= 1
0 0 0 1
C113 0 0
Sublayer 1.4: întreprindere mare
Total = 1 0 1 0 0 0 0 administration = 0 0 0 0 0 0 0 production = 1
0 0 0 0 0 1
C192 trade-marketing= 0 0 0 0 0 0 0 financial-accounting= 0 0 0 0 0 0 0
Total Strat 1 = 192 întreprinderi 9 21 20 64 12 66 Source: developed by the authors
Operators have applied the questionnaire survey on the premises of enterprises falling within the sample. 2. Information processing research Research information processing was conducted by the research team based on information gathered by
questionnaires. For ease of results centralization a computing program was created in Microsoft Excel, after which results were
done and presented, as well as obtained share results and scores. 3. Analysis, interpretation and marketing research findings
Analysis and interpretation of the research was done, on the entire sample size, depending on the answers given by respondents to the questions. The obtained information was summarized in tables by types of questions, depending on the layers and sublayers used in the research. The indicators have been calculated based on centralized information.
The main methods of graphical representation of statistical data and calculated indicators were achieved by: graphics coordinate systems, i.e. charts, bar and column, histograms, layered by colours and geometrical shapes, i.e. pie chart and ring-shaped structure. Analysis and interpretation of results will be achieved for each question separately, depending on the layers and substrates used. In the second part of the marketing research we performed the analysis, interpretation and marketing research findings.
218
Annals of the „Constantin Brâncuşi” University of Târgu Jiu, Economy Series, Issue 2/2014
„ACADEMICA BRÂNCUŞI” PUBLISHER, ISSN 2344 – 3685/ISSN-‐L 1844 -‐ 7007
4. Conclusions Given that the marketing research aims specific marketing strategies for product policy and quality policy, that we can use to design competences of economics graduates in connection with the offer of employment, will be taken into account the skills that employers ask from economics graduates. Regarding global product policy, we know that this is the most important component of the marketing mix in services and represent all actions that the firm uses to: establish objectives, select strategies, schedules and conducts practical steps (tactics). In this sense, global product strategy development policy should target the following objectives: improve service quality, increase productivity, differentiation of services and balancing action-oriented performance and market. When elaborating product policy strategies we take into account how the economics graduate should be and what skills must have when graduating. In other words, he should have superior performance, providing reliability, timeliness, security, customization, guarantees and competitive advantage. The partial marketing research, conducted only in Caras-Severin county, revealed that graduate economist must have the following characteristics: 1. to be trustworthed, by mitigating the negative actions of process performance; 2. to be prompt, by finishing on time and correctly the all work tasks and requests from employer and cliets; 3. provide maximum satefy to employers by providing job duties in compliance with the legal framework of the
obligations of individual and collective employment contract, of Internal Regulations; 4. to achieve highly customizable, through the procedures for preparing, movement and document archiving and
manangement system implemented at company level; 5. provide high tangibilization, by ambience (use of advanced equipment, staff with behavior and high training level
with a pleasant appearance), communication (using a specific mix of promotion) and price (training mode, flexibility of prices/tariffs);
6. to present quarantees to the employer, by removing irregularities in the system, through goof management, coordination purposes, involvement and verifying the achievement of duties by subordinate employees if the economist graduate occupies a leading position;
7. to generate competitive advantage by improving the offer of the company where he works, in relation to competing units on the market;
8. to help create a work environment that facilitates teamwork, innovation, initiative, mutual respect and professionalism;
9. to generate added value for employers by increasing productivity and resucing costs; 10. to be involved in creating a sustainable organizational culture and helps support a positive image for the
company/public institution in which he works. The report for the pilot research will be presented to the other faculties of economics at universities in the
region, completing the final results that will be presented in a following article.
5. Bibliography [1] Balaure V. (coord.), Marketing, Uranus, Bucureşti, 2000 [2] Dobre C., Negruţ C., Venczel M., Marketing, Editura Amphora, Timişoara, 1995 [3] Engeström, Y. & Sannino, A., “Studies of expansive learning: Foundations, findings and future challenges”, Educational Research Review, 2010, 5(1), 1-24 [4] Gherghina L., [5] Hakkarainen, K., Palonen, T., Paavola, S. & Lehtinen, E., Communities of networked expertise: Professional and educational perspectives, Amsterdam: Elsevier, 2004 [6] Minică, M., “New challenges for the training of the human capital through the system of tertiary education in the context of the knowledge economy”, 20th International Economic Conference – IECS 2013 "Post crisis economy: challenges and opportunities”, Sibiu, may 2013 [7] Paavola, S., Lipponen, L., & Hakkarainen, K., “Models of Innovative Knowledge Communities and Three Metaphors of Learning”, Review of Educational Research, 2004, 74(4), 557-576.
219