Embed Size (px)
Citation preview
AD-A205 214 AD NUMBER
TECOM PROJECT NO. 7-CO-R88-EPO-007
METHODOLOGY INVESTIGATION
FINAL REPORT
ADVANCED RADAR TESTING TECHNIQUES II
BYDEWEY J. MORSE
SURVEILLANCE AND RANGE DIVISIONELECTRONIC TECHNOLOGY TEST DIRECTORATE
US ARMY ELECTRONIC PROVING GROUNDFORT HUACHUCA, ARIZONA 85613-7110
SEPTEMBER 1988 DT1C
PERIOD COVERED: MARCH 1988 - SEPTEMBER 1988 ( 2 MAR198.2.MAR
PREPARED FOR:
US ARMY TEST AND EVALUATION COMMAND APPROVED FOR PUBLIC RELEASE;
ABERDEEN PROVING GROUND, MD 21005-5055 DISTRIBUTION UNLIMITED
89 024
DEPARTMENT OF THE ARMYHEADQUARTERS. U.S. ARMY TEST AND EVALUATION COMMAND ?
ABERDEEN PROVING GROUND. MARYLAND 21= -
REPLY toATTENTION of FEE -L
AMSTE-TC-M (70-10p)
MEMORANDUM FOR: Commander, U.S. Army Electronic Proving Ground,ATTN: STEEP-ET-U, Fort Huachuca, AZ 85613-7110
SUBJECT: Transmittal of Final Report - MethodologyInvestigation Advanced Radar Testing Techniques (II), TECOMProject No. 7-CO-R88-EPO-007
1. Subject report is approved.
2. Point of contact, this headquarters, is Mr. Richard V.Haire, AMSTE-TC-M, [email protected], AV 298-3677/2170.
FOR THE COMMANDER:
GROVER H. SHELTONChief, Meth Imprv DivDirectorate for Technology
Accef'-S1"fl For
DTIC '-,9
J11:. .t . .! Cu t ion /
Av.ilability Codes
A-1l and/or
Dist Special
1.I
[ . ... ......... . ~ m m m lm Il IIIII III)
-UNCLASSIFIEDSECURITY CLASSIFICATION OF THIS PAGE
Form ApprovedREPORT DOCUMENTATION PAGE OMB No 0704-0188
_ Exp. Date Jun30, 1986
la. REPORT SECURITY CLASSIFICATION lb. RESTRICTIVE MARKINGSUnclassified None
2a. SECURITY CLASSIFICATION AUTHORITY 3. DISTRIBUTION/AVAILABILITY OF REPORTApproved for Public Release
2b. DECLASSIFICATION /DOWNGRADING SCHEDULE Distribution Unlimited
4. PERFORMING ORGANIZATION REPORT NUMBER(S) S. MONITORING ORGANIZATION REPORT NUMBER(S)
TRMS No. 7-CO-R88-EPO-007
6a. NAME OF PERFORMING ORGANIZATION 6b. OFFICE SYMBOL 7a. NAME OF MONITORING ORGANIZATION
US Army Electronic (If applicable)Proving Ground I
6c. ADDRESS (City, State, and ZIP Code) 7b. ADDRESS (City, State, and ZIP Code)Fort Huachuca, US Army Test and Evaluation Command
Arizona 85613-7110 ATTN: AMSTE-TC-M
8a. NAME OF FUNDING/SPONSORING 8 8b. OFFICE SYMBOL 9. PROCUREMENT INSTRUMENT IDENTIFICATION NUMBERORGANIZATION (If applicable) Aberdeen Proving Ground,
I Maryland 21005-5055
8c. ADDRESS (City, State, and ZIP Code) 10. SOURCE OF FUNDING NUMBERS
PROGRAM ' PROJECT TASK WORK UNITELEMENT NO. NO. NO. ACCESSION NO
11. TITLE (Include Security Classification)
Unclassified - Methodology Investigation Final Report Advanced Radar Testing Techniques II
12. PERSONAL AUTHOR(S)
Dewey J. Morse and ANRO Engineering Consultants. Inc.13a. TYPE OF REPORT 13b. TIME COVERED 14. DATE OF REPORT (Year, Month, Day) 115. PAGE COUNTFinal FROM Oct 87 TO Sep 88 1988 September 30 101
16. SUPPLEMENTARY NOTATION
17, COSATI CODES 18. SUBJECT TERMS (Continue on reverse if necessary and identify by block number)FIELD GROUP SUB-GROUP Methodology investigation, advanced radar test capabilities
radar system characteristics, performance measurements.
ABSTRACT (Continue on reverse if necessary and identify by block number)The objective of this methodology investigation was to provide a detailed instruction set forthe purpose of planning and conducting system level testing of advanced radars at USAEPG.The objective of this methodology investigation has been realized by the preparation of de-tailed instructions for performing system level testing of radar system characteristics. Themethodology report specifies measurement instructions for modern radar parameters includingultra low sidelobes, probability of intercept, velocity response, target acquisition time,digital subsystem response, antenna.beam forming control, and radar data processing.Test measurement accuracy issues have been discussed and err- analyses have been provided.Recommendations for radar test facility improvements and for Test Operations Procedures (TOPs)have been included in the report.The analysis has provided needed methodology for the USAEPG to support the future testing ofeapons loaticn rdars, search and acquisition radars, and battlefield surveillance radars._
20. DISTRIBUTION/ AVAILABILITY OF ABSTRACT 21 ABSTRACT SECURITY CLASSIFICATION /1 UNCLASSIFIED/UNLIMITED 0 SAME AS RPT. 0 DTIC USERS Unclassified
2a. NAME OF RESPONSIBLE INDIVIDUAL 22b TELEPHONE (Include Area Code) 22c. OFFICE SYMBOL
Dewey J. Morse 602/538-6581 STEEP-ET-U
DD FORM 1473, 84 MAR 83 APR edition may be used until exhausted. SECURITY CLASSIFICATION OF THIS PAGEAll other editions are obsolete. UNCLASSIFIED
TABLE OF CONTENTS
Foreword iv
I. Summary 1
2. Details of Investigation 22.1 Philosophy of System-Level Testing 2
2.1.1 Radar System and Subsystem Specifications 22.1.2 System-Level Testing 2
2.2 Radar System Performance Specifications and Characteristics 32.2.1 Radar Subsystems 32.2.2 Receiver Subsystem 52.2.3 Digital Subsystem - A General Description 7
2.2.3.1 Antenna Beamsteerlng Unit 72.2.3.2 Radar Signal Processor 92.2.3.3 Radar Control Processor 11
2.3 System Test Planning 122.3.1 Statement of Requirements 132.3.2 Evaluation by Analysis 162.3.3 Evaluation by Simulation 182.3.4 Determination of Test Conditions 192.3.5 Test Design 192.3.6 Test Procedure 192.3.7 Recorded Data 202.3.8 Evaluation 202.3.9 Interpretation 20
2.4 Test Methodology and Procedures - Closed-Loop and Field Testing 202.5 Closed-Loop Testing Procedures 23
2.5.1 Computer-Aided Testing 232.5.2 Waveform Simulation 232.5.3 Procedures 25
2.5.3.1 Velocity Response (Test 2.3) 252.5.3.2 Target Acquisition Time (Test 3.1) 282.5.3.3 Simultaneous Target Handling Capacity
(Test 4.1) 282.5.3.4 Target Resolution 292.5.3.5 Doppler Resolution (Test 5.2) 302.5.3.6 Angle Resolution (Test 5.3) 30
• i I l l I III II
2.5.3.7 Electromagnetic Compatibility (EMC) 33
2.5.3.8 Alternate Test Procedures (Test 5.3, 8.3, 9.2) 34
2.6 Field Testing Procedures 35
2.6.1 Detection Range and Coverage 35
2.6.2 Subclutter Visibility (SCV) Tests 2.1 and 2.2 382.6.3 Target Acquisition Time (Test 3.2) 42
2.6.4 Resolution In Four Radar Coordinates (Test 5. 1) 42
2.6.5 Angle Tracking Response (Test 6.1) 442.6.5.1 Step Response 442.6.5.2 Frequency Response 45
2.6.5.3 Servo and Receiver Noise 45
2.6.6 Angle Tracking Response (Test 6.1) 45
2.6.6.1 Thermal Noise Test 462.6.6.2 Clutter and Multipath Error Test 46
2.6.6.3 Target Noise Test 47
2.6.6.4 Jamming 47
2.6.7 Electromagnetic Compatibility (EMC) Test 7.3 472.6.8 Vulnerability to ECM (Tests 8.1 and 8.2) 482.6.9 Testing Vulnerability of Radars to Interception
and Location (Test 8.4) 502.6.9.1 Vulnerability of Conventional Radars 502.6.9.2 Vulnerability of LPI Radars 50
2.6.9.3 Evaluation Requirements 512.6.9.4 Electromagnetic Environment 512.6.9.5 Physical Environment 512.6.9.6 Test and Evaluation Facilities 522.6.10 Target Discrimination (Test 9.1) 532.6.11 Airborne Radar Special Requirements
(Tests 10.1 and 10.2) 532.7 Radar System Examples 54
2.7.1 Weapon Location Radars 552.7.2 Search/Acquisition Radar for Short-Range Air Defense 602.7.3 RPV-Based Battlefield Surveillance Radar 63
2.7.3.1 Real-Beam Mapping Radar 632.7.3.2 Synthetic Aperture Radar (SAR) 68
2.8 Test Procedures for Specific Radars 712.8.1 Test Design for Radar Accuracy 752.8.2 Test Design for Vulnerability to Intercept 77
2.8.2.1 Definition of Test Objectives 77
Ul
2.82.2 General Test Procedures 792.8.3 Test Procedures for RPV-Based Battlefield
Surveillance Radar 792.9 Test Data Recording and Evaluation 802.10 Test Equipment and Facilities 81
2.10.1 Requirements 812.10.2 Test Facilities - Available and Required 87
2.11 Conclusions and Recommendations 95
ill
FOREWORD
The U.S. Army Electronic Proving Ground (USAEPG) initiated a two-partinvestigation to identify necessary actions required to fulfill the mission of
testing present and future radar systems. The first phase of the effort has
been completed and has provided a requirements analysis of the USAEPG.
This final report covers the second phase, and presents a detailed
methodology for radar system testing. This report was prepared by ANROEngineering Consultants, Inc., Lexington, Massachusetts. The technical
expertise at ANRO was provided by Mr. David K Barton, Vice President forEngineering, and by senior staff engineers Mr. Robert N. Maglathlin, Dr.
Joseph D. DeLorenzo, and Mr. Edwin R. Hiller.
iv
I. Summary
The Advanced Radar Testing Methodology Investigation (H), described In this report,was a continuation of work performed at the U.S. Army Electronics Proving Ground during1987 [1]. In this second phase, the emphasis was placed on testing of radar system per-formance parameters. for which a combination of subsystems or a complete radar systemoperating in a realistic electronic environment Is required. The system performanceparameters are defined by the equipment specification, and the test procedures describedin this report are designed to establish the degree to which the system under test satisfiesthe specification.
The general approach to system-level testing s addressed in Section 2.1. This isfollowed by general descriptions of an advanced radar and its critical subsystems, inSection 2.2. and system test procedures, In Section 2.3. In Sections 2.4. 2.5 and 2.6. testmethodology and procedures are developed for general radar application, the procedurescovering both closed-loop testing of combinations of subsystems. and field testing of thecomplete radar.
A list of references resource material used in the Investigation is included at the back
of the report.
In order to make the test procedures more specific, several radar system examples.synthesized to represent actual testing problems without use of actual classified militaryequipment, are described n Section 2.7. Test procedures developed for the general caseare applied to these radar examples in Section 2.8, and specific comments are made onspecial problems and requirements for testing of these systems. Requirements for test
data recording and evaluation are addressed in Section 2.9, and test equipment andfacilities are discussed in Section 2.10. Conclusions and recommendations, includingrequirements for new Test Operation Procedures, are given In Section 2.11.
- - • , ,, ii li i1
2. r'talls of Investigation
2.1 Philosophy of System-Level Testing
2.1.1 Radar System and Subsystem Specifications
The first step in development of a radar system to meet a given performance specifi-cation is to interpret this specification In terms of subsystem design parameters: e.g.,transmitter power and waveform, antenna gain and beamwidth. receiver noise factor andfrequency response, and signal processor characteristics. This interpretation is performedby the system engineer (normally during the contract definition phase. as part of the
contractor's study effort). During development and assembly of the prototype radar, testingis carried out by the contractor and the government on critical components, circuits, andsubsystems to determine that these portions of the system will support the roles assignedto them by the interpretation of the system specification. Standardized Test OperationProcedures are available which guide test personnel in performing and interpreting thesetests. Many of the subsystem characteristics covered by this phase of testing are listedin Section 2.2 of this report.
2.1.2 System-Level Testing
Following successful testing of individual subsystems, the radar is assembled into anoperating prototype system, on which some testing will normally be performed at thedevelopment laboratory or contractor's facility. These tests may include operation in thephysical environments covered by the specification (e.g., temperature, moisture, vibration),and limited tests of performance. However, the ability of the radar to meet its over-allsystem performance specification can only be evaluated by tests of the entire system inthe field environment, which includes a realistic electronic environment (e.g., movingtargets, clutter reflections, interfering signals, and possibly attempts at ESM intercept of
the radar signals).
The purpose of the investigation reported here is to define the process by which thissystem-level testing can be planned, carried out. and evaluated, and to identify facilitiesand equipment which may be required. The test requirements will be governed by theoverall system performance specification, not necessarily by interpretations of this spec-
ification used in subsystem design. Detailed testing of individual subsystems is notrequired in the ,wocess, although a validation of certain subsystem characteristics maybe desirable in order to diagnose shortfalls in system performance.
2
The emphasis on field tests of the over-all system does not exclude the use ofclosed-loop tests utilizing portions of the system (e.g., the combined receiver and digitalsubsystems). Such tests can support the field tests by evaluating more thoroughly andefficiently certain performance parameters. Both closed-loop and system field tests willbe described in this report.
2.2 Radar System Performance Specifications and Characteristics
2.2.1 Radar Subsystems
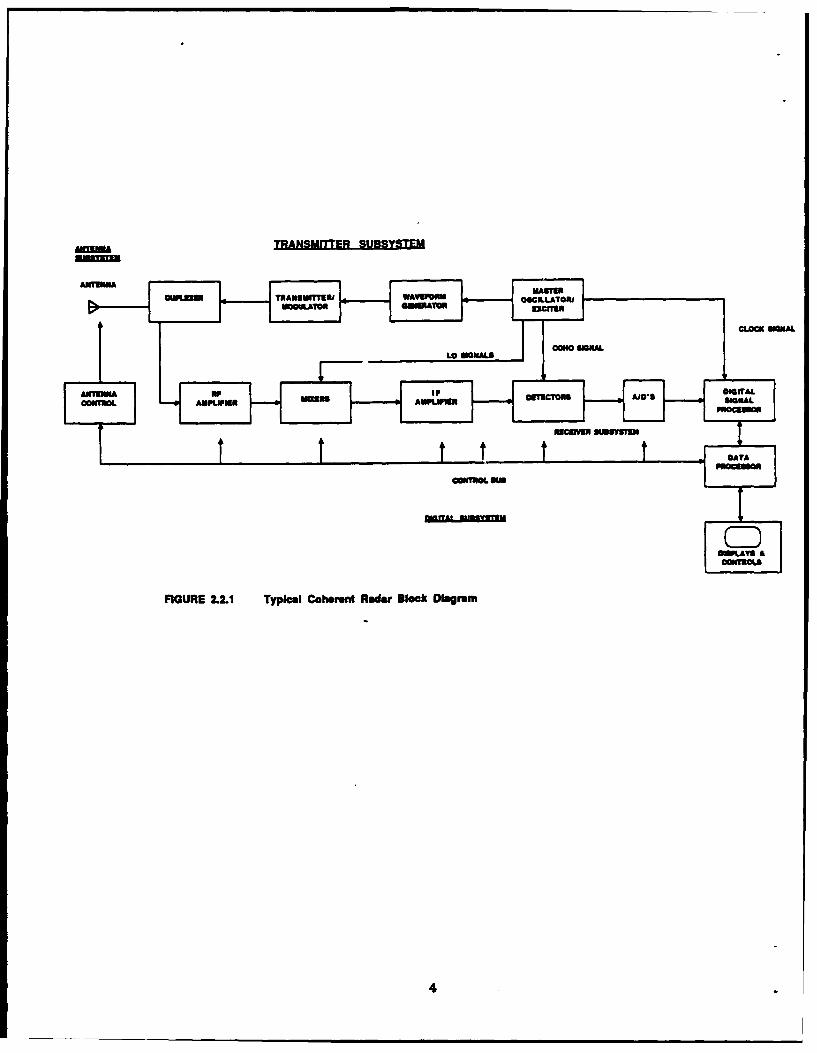
The block diagram of a typical coherent radar system is shown in Figure 2.2.1. Themajor subsystems are:
Antenna: The interface with the target and the surroundingenvironment. This subsystem includes the antenna and antenna
control unit.
* Transmitter. The source of target illumination. This subsystemincludes the transmitter/modulator, duplexer, waveform generator,and master oscillator/exciter.
* Receiver: The amplifier and Initial filter for selection of target
echoes. This subsystem includes the RF amplifier, mixers, IFamplifier, and detectors.
* Digital Subsystem: A group of special and general purpose processorswhich may perform the final stages of signal processing, dataprocessing on selected targets, radar control, and antenna control.This subsystem includes the A/Ds, digital signal processor, dataprocessor, control bus, plus the displays and controls.
The major characteristics of these subsystems are listed in Table 2.2.1. These char-acteristics are selected during the radar design process to meet the system specifications.The relationships between the characteristics and system performance parameters arelisted in Table 2.2.2.
3
TRANSMITTER SURSYTM
Como $10MAL
t t t DTAONTROL O
IFIGURE 2.2. Typical Coherent Rader Block Diagrm
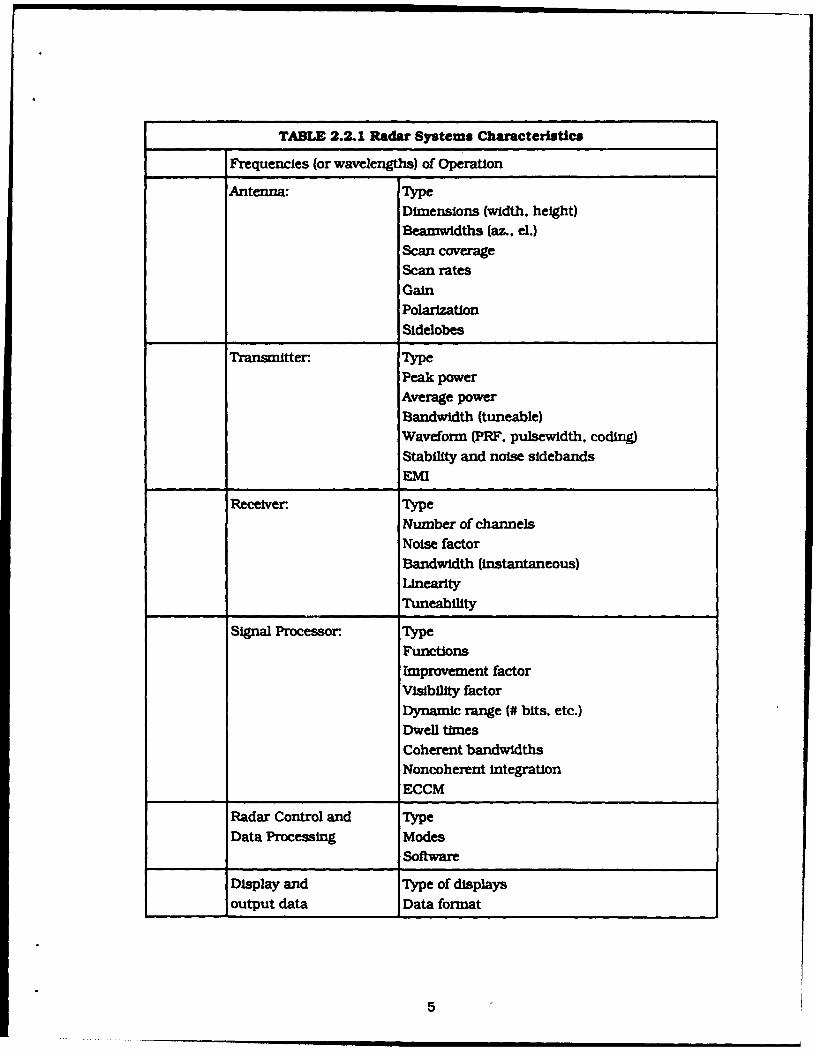
TABLE 2.2.1 Radar Systems Characteristics
Frequencies (or wavelengths) of Operation
Antenna: Type
Dimensions (width, height)
Beamwidths (az., el.)
Scan coverageScan rates
GainPolarization
Sidelobes
Transmitter: TypePeak power
Average power
Bandwidth (tuneable)Waveform (PRF. pulsewidth, coding)
Stability and noise sidebandsEMI
Receiver. Type
Number of channelsNoise factor
Bandwidth (instantaneous)Unearity
Tuneability
Signal Processor. Type
Functions
Improvement factorVisibility factor
Dynamic range (# bits, etc.)
Dwell timesCoherent bandwidths
Noncoherent integration
ECCM
Radar Control and Type
Data Processing ModesSoftware
Display and Type of displaysoutput data Data format
5
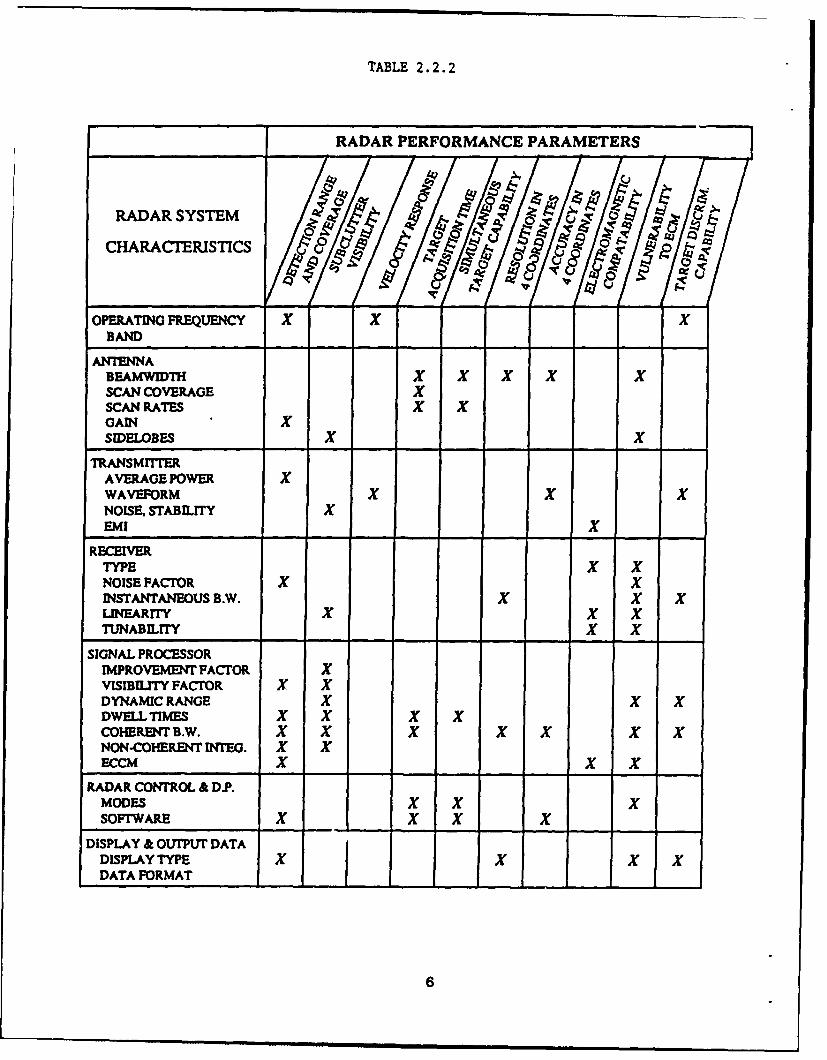
TABLE 2.2.2
RADAR SYSTEM ;? : 04
CHARACTERISTICS0
OPERATING FREQUENCY X XBAND
ANT7NNABEAMWIDTH x XSCAN COVERAGE XSCAN RATES xGAINSIDELOBES X X
TRANSMIRAVERAGE POWERt XWAVEFORM X X XNOISE. STABILITY XEMI X
RECEIVERTYPE X XNOISE FACTOR X XINSTANTANEOUS B.W. X X XLINEARITY X X XTUNABILITY X X
SIGNAL PROCESSORIMPROVEMENT FACTOR XVISIBILITY FACTOR X XDYNAMIC RANGE X x xDWIELLTIMES X X X XCOHERmE4TB.W. X X X X X X xNON-COHERENT INTEG. X XECCM X x X
RADAR CONTROL & D.P.MODES x x XSOFTWARE K K X K
DISPLAY & OUTPUT DATADISPLAYTYPE x x x KDATA FORMATj--------- ---- -
6
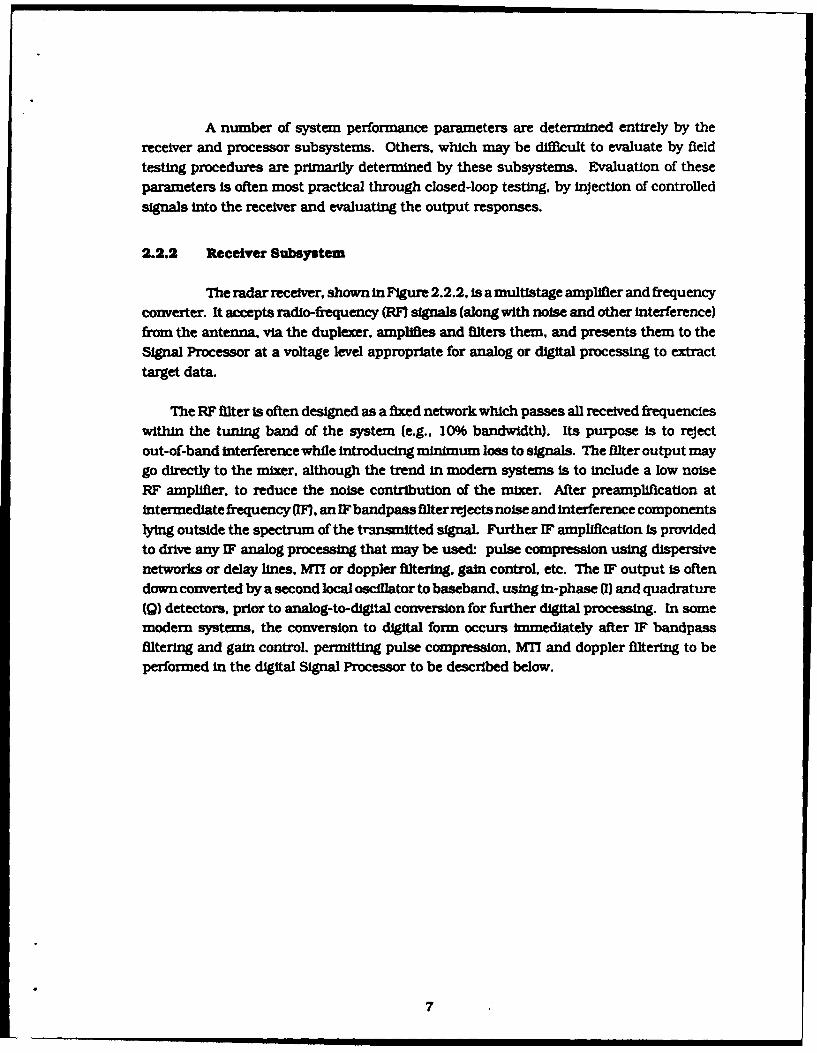
A number of system performance parameters are determined entirely by thereceiver and processor subsystems. Others, which may be difficult to evaluate by fieldtesting procedures are primarily determined by these subsystems. Evaluation of theseparameters is often most practical through closed-loop testing, by Injection of controlledsignals Into the receiver and evaluating the output responses.
2.2.2 Receiver Subsystem
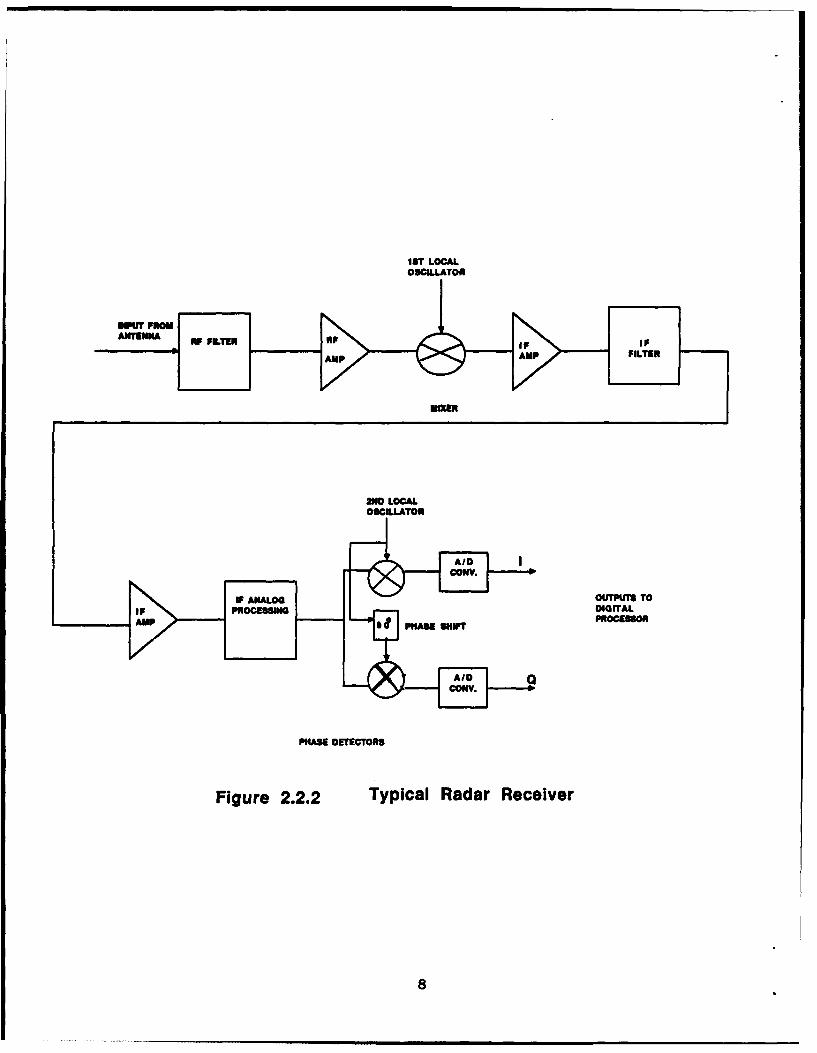
The radar receiver, shown In Figure 2.2.2, is a multistage amplifier and frequencyconverter. It accepts radio-frequency (RF} signals (along with noise and other interference)
from the antenna, via the duplexer. amplifies and filters them, and presents them to theSignal Processor at a voltage level appropriate for analog or digital processing to extracttarget data.
The RF filter Is often designed as a fixed network which passes all received frequencieswithin the tuning band of the system (e.g.. 10% bandwidth). Its purpose is to reject
out-of-band interference while introducing minimum loss to signals. The filter output maygo directly to the mixer, although the trend in modem systems is to include a low noiseRF amplifier, to reduce the noise contribution of the mixer. After preamplification atintermediate frequency (IF, an IF bandpass filter rejects noise and interference componentslying outside the spectrum of the transmitted signal. Further IF amplification is providedto drive any IF analog processing that may be used: pulse compression using dispersivenetworks or delay lines, MTI or doppler filtering, gain control. etc. The IF output is oftendown converted by a second local oscillator to baseband. using in-phase (I) and quadrature(Q) detectors, prior to analog-to-digital conversion for further digital processing. In somemodem systems, the conversion to digital form occurs Immediately after IF bandpassfiltering and gain control. permitting pulse compression, MTI and doppler filtering to beperformed In the digital Signal Processor to be described below.
7
IS? LOCALOSCILLATOR
nowROFSOM
PHASEOSCILCTOOS
Figue 2..2 Tpica Radr Reeive
8 OV
2.2.3 Digital Subsystem - A General Description
Most modem radar systems make extensive use of digital hardware and software toprovide overall control of the radar, as well as to provide signal and data processingfunctions. This digital subsystem provides a convenient Interface for the control andexecution of various types of closed-loop testing, since it Is Instrumented to exert controlover the other subsystems that constitute the radar system.A general description of theorganizaton of functions in the digital subsystem in modem radar systems Is presented
in the following subsection. This will support the later discussion of the manner in whichclosed-loop testing can be accomplished utilizing the digital subsystem as the test controlinterface.
The Digital Subsystem in modem radar systems may provide the following functions:
* Antenna beam steering and control* Radar signal processing" Radar data processing• Radar control
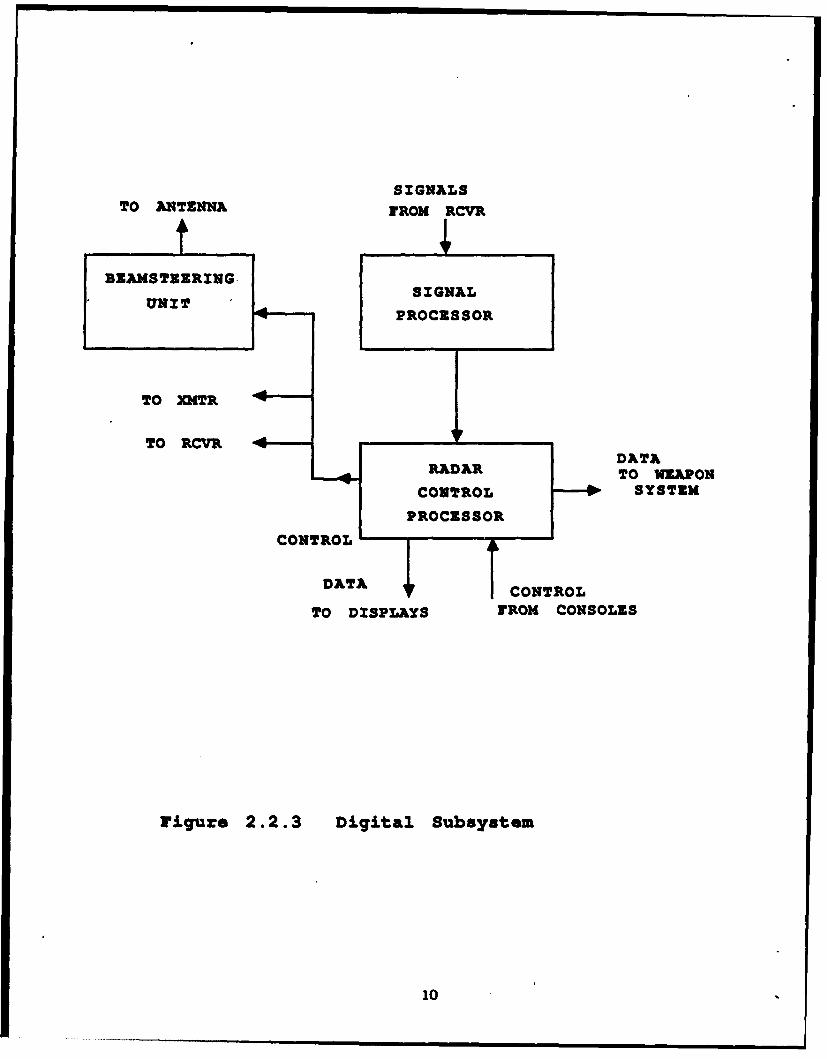
Two classes of process are typically utilized In the organization of the Digital Sub-system. Signal processing oriented architectures such as data flow. systolic array orpipeline designs are well suited to the high throughput, repetitive processes such asbeamforming. clutter filtering. doppler processing and other signal processing functions.A more general purpose architecture Is better suited to provide the functions of radar
control, radar detection post-processing and report formatting. Within the class of highthroughput repetitive processing, a further distinction can be made between (a) beam-forming, which Is a dedicated, single function process, and (b) signal processing, whichrequires the use of a number of algorithms to support the various radar modes.
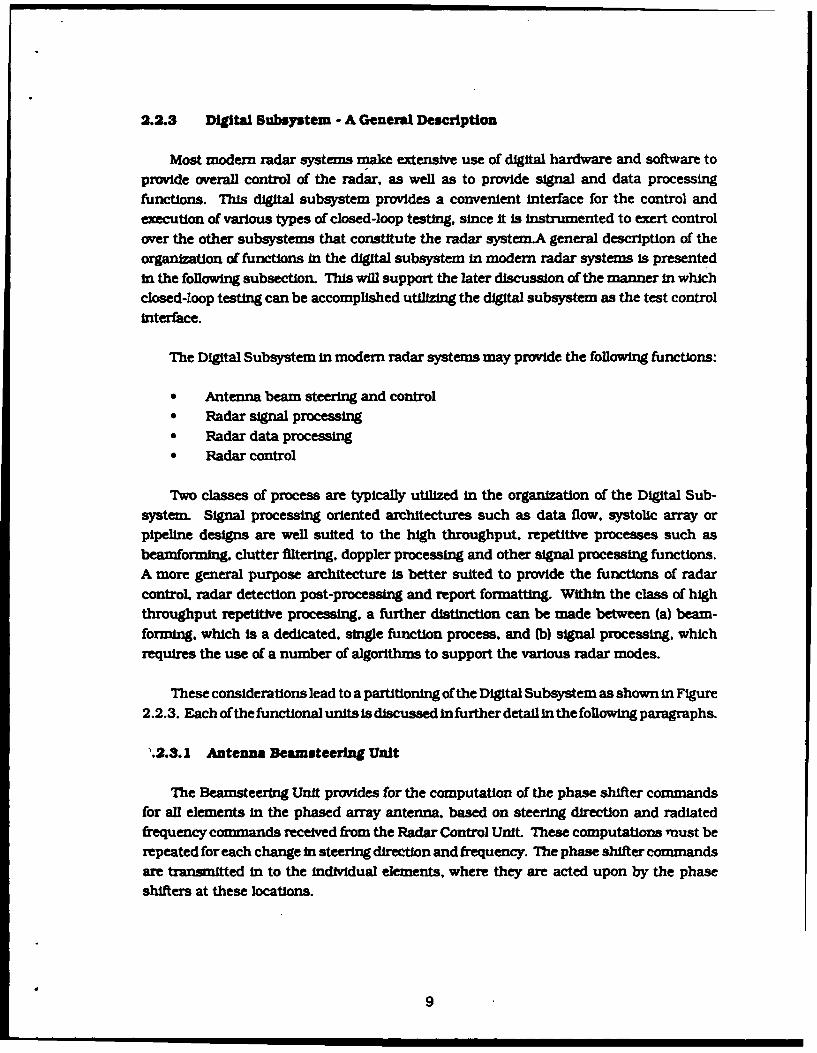
These considerations lead to a partitioning of the Digital Subsystem as shown In Figure2.2.3. Each of the functional units Is discussed infurther detail in the following paragraphs.
1.2.3.1 Antenna Beamsteerlng Unit
The Beamsteering Unit provides for the computation of the phase shifter commandsfor all elements in the phased array antenna, based on steering direction and radiatedfrequency commands received from the Radar Control Unit. These computations must berepeated for each change in steering direction and frequency. The phase shifter commands
are transnitted in to the individual elements, where they are acted upon by the phaseshifters at these locations.
9
SIGNALSTO ANTENNA IrRou RCVR
BEAMSTEERING-SGA
UNIT SGAPROCESSOR
TO 2OITR
TO RCVR 14RAA DATA
RADAR TO WEAPON
CNOLCONTROL --- O- SYSTEM
PROCESSOR
DATA ICONTROLTO DISPLAYS rROM CONSOLES
rigure 2.2.3 Digital Subsystem
10
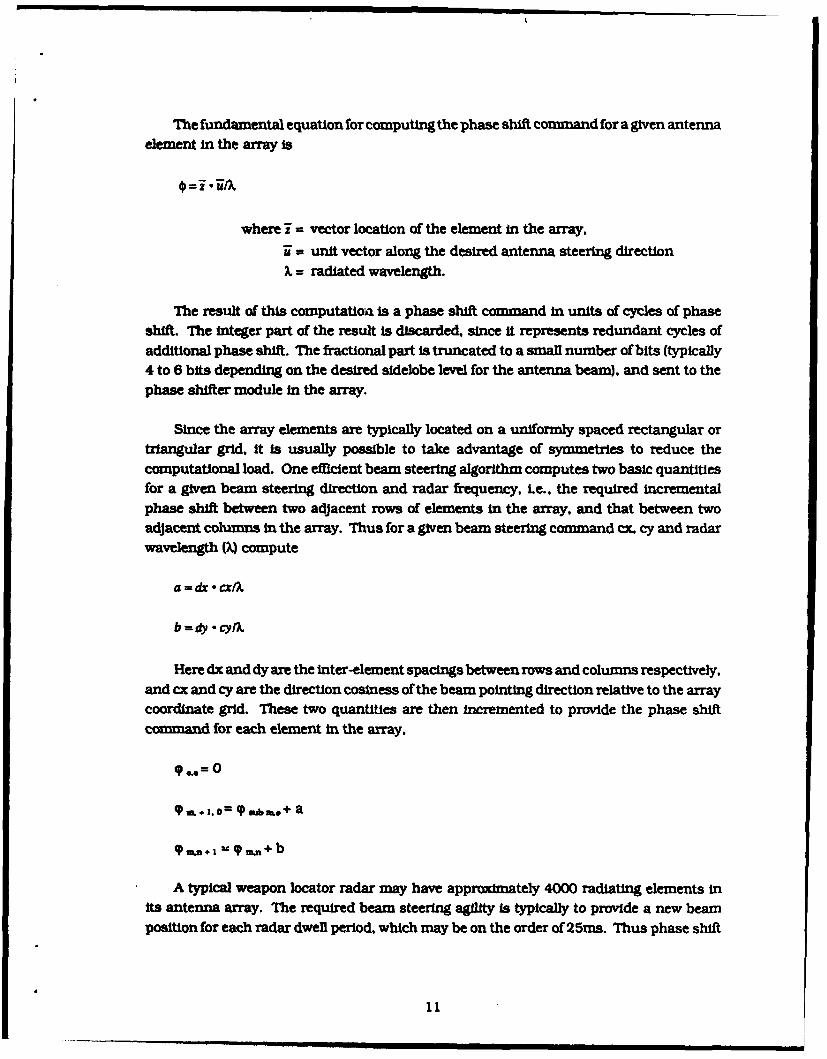
The fundamental equation for computing the phase shift command for a given antenna
element in the array is
where i = vector location of the element in the array.
i = unit vector along the desired antenna steering direction
X = radiated wavelength.
The result of this computationl is a phase shift command in units of cycles of phaseshift. The integer part of the result is discarded, since it represents redundant cycles ofadditional phase shift. The fractional part is truncated to a small number of bits (typically4 to 6 bits depending on the desired sidelobe level for the antenna beam), and sent to thephase shifter module In the array.
Since the array elements are typically located on a uniformly spaced rectangular ortriangular grid, it is usually possible to take advantage of symmetries to reduce thecomputational load. One efficient beam steering algorithm computes two basic quantitiesfor a given beam steering direction and radar frequency, Le.. the required incrementalphase shift between two adjacent rows of elements in the array, and that between twoadjacent columns In the array. Thus for a given beam steering command cx, cy and radarwavelength (W compute
a =dx t crX
b = dy cy/X
Here dx and dy are the Inter-element spacings between rows and columns respectively.and cx and cy are the direction cosiness of the beam pointing direction relative to the arraycoordinate grid. These two quantities are then incremented to provide the phase shiftcommand for each element in the array,
'0 .= 0
vaL. .o = ipmb,.+ a
9 ma~ I' +, m4 b
A typical weapon locator radar may have approximately 4000 radiating elements inits antenna array. The required beam steering agility is typically to provide a new beamposition for each radar dwell period, which may be on the order of 25ms. Thus phase shift
11
commands would be required at a rate of 160,000 per second. By using efficient algorithmssuch as the one outlined above the actual computational load to accomplish this beam
steering agility can be reduced significantly.
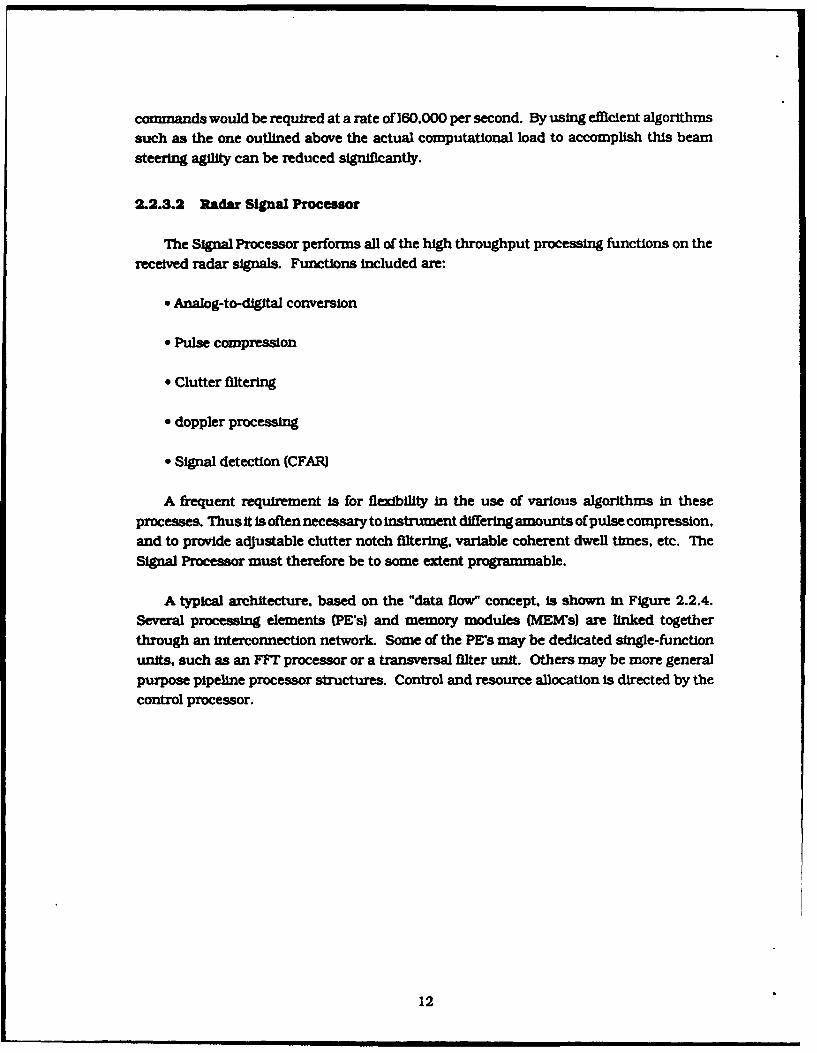
2.2.3.2 Radar Signal Processor
The Signal Processor performs all of the high throughput processing functions on the
received radar signals. Functions included are:
" Analog-to-digital conversion
" Pulse compression
" Clutter filtering
" doppler processing
* Signal detection (CFAR)
A frequent requirement is for flexibility in the use of various algorithms in these
processes. Thus it is often necessary to instrument differing amounts of pulse compression.and to provide adjustable clutter notch filtering, variable coherent dwell times. etc. The
Signal Processor must therefore be to some extent programmable.
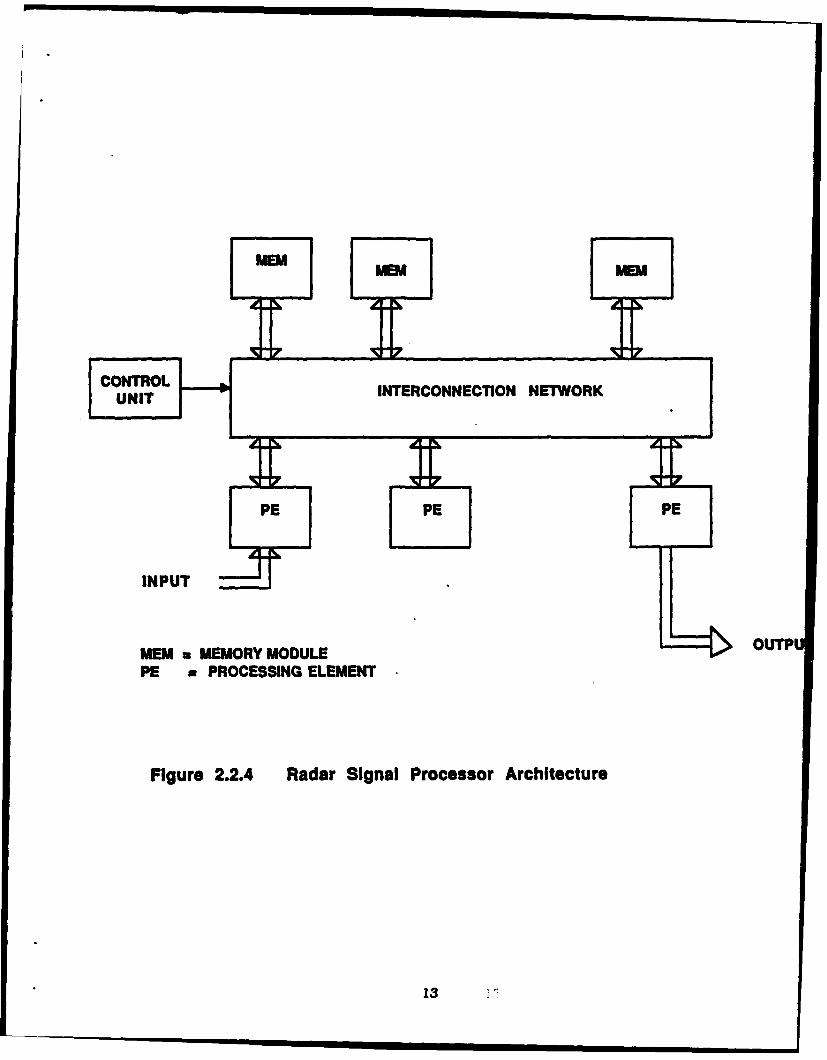
A typical architecture, based on the "data flow" concept, is shown in Figure 2.2.4.Several processing elements (PE's) and memory modules (MEM's) are linked together
through an interconnection network. Some of the PE's may be dedicated single-functionunits, such as an FFT processor or a transversal filter unit. Others may be more general
purpose pipeline processor structures. Control and resource allocation is directed by the
control processor.
12
M-I MEM M-
CONTROL INTERCONNECTION NETWORK
UNIT
PE PE PE
INPUT :_
MEM MEMORY MODULE E OUTPU
PE a PROCESSING ELEMENT
Figure 2.2.4 Radar Signal Processor Architecture
13
In a radar that provides monopulse tracking capabilities there are three channels of
radar signals to be processed coming from the receiving subsystem: the monopulse sum
channel and the two monopulse difference channels. Coherent processing of these signalsrequires that both the In-phase and the quadrature coherent video components of each
channel be provided to the signal processor. Thus the analog to digital (A/D) conversionconsists typically of six separate convertors. The required accuracy of the conversion istypically 8 to 10 bits per sample. The sample rate for each convertor is set by the radarsignal bandwidth, which in the case of a weapon locator radar may be on the order of 2
Pulse compression can be accomplished either in the receiving subsystem in analogform, or in the digital subsystem in digital form If it is to be accomplished in the digitalsubsystem, the computational process is typically one of a sliding window transversal filter
that instruments a linear function (a weighted combination) of the adjacent signal sampleswithin the window.
Clutter filtering is included to provide for rejection ofnonmoving or slow moving clutter,and to provide moving target indication (MTI. It typically consists of computing weightedcombinations of corresponding range samples from a small number (two to four) ofsuccessive pulse repetition intervals. Buffering of the range samples from one or moresuccessive repetition intervals is therefore required.
Target velocity measurement (as well as clutter rejection) is provided by instrumentinga set of doppler filters. This is typically accomplished by an FFT algorithm that generatesa set of contigous filters that span the complete unambiguous doppler interval (equal tothe radar pulse repetition frequency). During each coherent radar dwell period thesesamples are processed. one range at a time, in an FFT process that results in separatingthe returns from a given range into a set of doppler bins.
The range samples arrive at the Signal Processor in range sequence following each
transmitted pulse. The doppler filter processing requires that all samples received froma given range during the coherent dwell period be processed together. Thus a memoryorganization that provides efficient two-dimensional "comer turning is desired. Thesuccessive range samples are stored in the two-dimensional structure as successivehorizontal vectors, and then read out as successive vertical vectors. During the data
storage time the read-in sequence is as follows: All range samples from the first pulseInterval, followed by all range sampies from the next interval. etc. During the data retrievaltime the read-out sequence Is all samples received during the dwell from the first rangegate. followed by all samples from the second range gate. etc. The actual FFT computation
Is accomplished by repeated application of a basic multiply and add function to appro-priately selected pairs of data samples.
14
Target detection consists of reporting out to the Radar Control Processor those cells
that exceed a threshold. It is usually required that some CFAR (constant false alarm rate)
control be included. One method ofproviding this function consists of varying the detection
threshold for each resolution cell, based on an analysis (averaging, for example) of the
signal strengths in a number of surrounding resolution cells.
Frequency agility is often included In the design of the radar in order to provide ECCM
advantages, to provide for resolution of range ambiguities. etc. The Radar Control Processor
generates the sequences of frequencies to be used by the systenL
All antenna steering commands are generated by the Radar Control Processor and
provided to the beam steering unit for translation into detailed phase shifter commands
for the array antenna. The basic search pattern scanning routines for the antenna are
generated in this unit. The angular coordinates of initial target detections are utilized ingenerating antenna pointing commands for reconfirmation dwells. The pointing commandsfor tracking are also generated here.
An important function is the control of system and subsystem testing. It s typical to
provide for automatic sequencing of system health checks under the control of the RadarControl Processor. This often takes the form of the execution of a set of diagnostic routines
that issue commands to the various subsystems and monitor the results that are fed backto the Radar Control Processor. These processes are executed in an interleaved manner
with the normal operations of the radar system.
The radar data processing functions include:
" Monopulse angle estimation
* Range ambiguity resolution
* Dwell-to-dwell correlation
2.2.3.3 Radar Control Processor
The Radar Control Processor provides for the overall control of the radar system. Italso processes and interprets the output data from the radar signal processor.
Since the functions to be performed by this portion of the Digital Subsystem do not
require a high throughput rate, they are typically instrumented with general purpose
15
computer architecture. Multi-function interrupt driven processing Is typical, withhousekeeping tasks being relegated to the background, or postponed, when higher priorityfunctions are required to be performed.
The radar control functions include:
* Radar mode tmg and control
* Frequency agility
• Antenna steering command generation
• Built-in-test (B control
Typically the overall timing control for the radar system is provided by this unit. Thisincludes the generation and distribution of all synchronization timing for the transmitter,receiver and signal processor. The radar operating modes, Le., target search, targetconfirmation, target track, clutter mapping. etc., must be interleaved adaptively accordingto the requirements of the following:
* Multiple scan target association
• Target tracking
* Weapon launch site estimation (weapon locator radar)
* Target reporting and display
These functions all involve processing of data received from the Signal Processor, andare of a more general computational form.
2.3 System Test Planning
Before a radar system design or model Is evaluated, the requirements for its modesof operation and Its performance in these modes must be known, so that the evaluationcan be made with respect to these requirements. This means that a system-level speci-fication must be available, describing the functions to be performed by the radar, theregions over which these functions are to be performed, the targets to be detected,measured, or identified, and the background environment in which this is to take place.
16
Evaluations are normally made in several steps, depending on the status of the radarprogram and the resources available to the evaluator
Analysis and simulation
Field testExtrapolation from field test, using both analysis and simulation.
2.3.1 Statement of Requirements
For each type of evaluation, a different statement of radar system requirements maybe necessary. In the analysts phase, for example, the target cross section is specified byits mean value in square meters, with a fluctuation model usually from the Swerling cases.Atmospheric conditions will be calculated from models and used to adjust the signalstrength In the simulator. In field tests, a specific aircraft is used, its cross section (possiblyaugmented) having been measured in advance to relate it to the radar specificationrequirements. Weather conditions are observed by standard meteorological instruments,with rainfall estimated over the radar-target path. Extrapolation to other targets Is doneby scaling to their physical sizes or by using measurements from a cross-section range.Extrapolation to other weather environments relies on models or direct measurement ofattenuation on communication circuits or radars simflar to the radar under evaluation.
The difficulty In this evaluation process is that the specification, against which theradar system may have been proposed or developed. may have stated the requirements Inonly one way (e.g., detect a 1.0 ma aircraft target (Swerling Case 1), flying at one km altitudein 4 mm/h rain, with 0.9 single-scan probability of detection at a range of 100 kn. Theprocedures for analysis and simulation in this case are well defined, but the translationto a specific test target and the establishment of the rainfall rate under test conditions aremore difficult. The evaluator must be able to translate the numerical specifications to theactual target and envIrnment, and back again, if the field evaluation is to be meaningful.
The following system performance parameters are to be evaluated by the system leveltesting:
a. Detection range and coverageb. Subclutter visibility and velocity responsec. Target acquisition timed. Number of targets handled simultaneouslye. Resolution in four radar coordinates (angles, range, radial velocity)f. Accuracy In four radar coordinates and in output coordinatesg. Electromagnetic compatibilityh. Vulnerability to ECML Target discrimiation capability
17
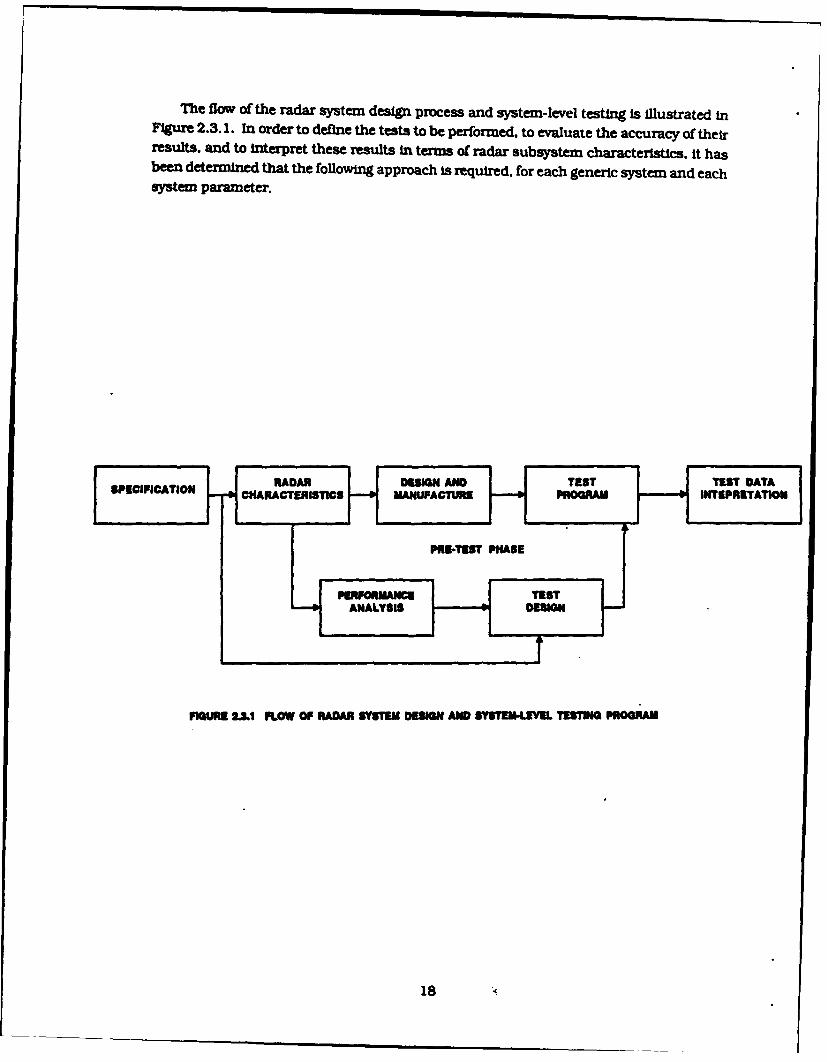
The flow of the radar system design process and system-level testing Is illustrated InFigure 2.3. 1. In order to define the tests to be performed. to evaluate the accuracy of theirresults, and to interpret these results in terms of radar subsystem characteristics, It hasbeen determined that the following approach is required, for each generic system and eachsystem parameter.
RADA DEIGN ND ESTTEST DATA
FIGURE W.. FLOW OF RADAR SYSTEM DO3M AND SYSTEM.LEVU TESTING PROGRAM
18
The basic purpose of the test program is to relate the actual performance of the radarto the requirements imposed by the specification. These requirements may either bespelled out explicitly in the specification, or they may be derived from over-all performancerequirements or goals. The first step in the process, before test procedures are prepared.will be to establish the requirements for items (a)-(i) listed above, and the basis for eachrequirement: Specification paragraph or method of derivation from the specification.
2.3.2 Evaluation by Analysis
In the early stages of a radar development or procurement program, the hardware isnot available for test, and evaluation must be made o-i paper, using analytical techniques.The necessary analyses may start from fundamental theoretical models of radar per-formance, or from available test data on similar radar equipment which may be adaptedor improved to meet the new requirement. Some areas of radar performance are wellunderstood, so that accurate calculations of system performance can be made from knownradar parameters and models of the external environment in which the radar is intendedto operate. In other areas, theoretical procedures have not been developed to the extentnecessary for accurate prediction of radar performance, and simulation or field test willbe required. Even in areas where adequate theory exists, there remains considerableuncertainty as to the validity of the models used to represent targets and environmentaleffects, and key aspects of performance must be validated by test. A thorough analyticalevaluation is required, however, to identify the critical areas in which tests are mostnecessary to resolve uncertainties.
The need for analytical evaluation prior to testing is based on the limited test resourcesavailable, and the statistical nature of most radar performance measures. If the testresources are spread over the entire range of conditions in which the radar is expected tooperate, there is little chance that the number of data points in any one region will beadequate to arrive at statistically valid conclusions. Analysis, if properly carried out, canidentify the most critical regions, in which the radar design is marginal or the analyticalmodels are weak, as well as broad regions in which satisfactory performance can beexpected with high confidence. A relatively few tests in these regions, repeated to givevalid statistical measures of performance, can serve to validate or correct the analytical
and simulation models near their boundaries of uncertainty, and give confidence to theiruse in extrapolation to other cases. The purpose of testing is to resolve uncertainties.
Little new information is obtained when the tests merely confirm things that are alreadyknow. Nith high confidence.
19
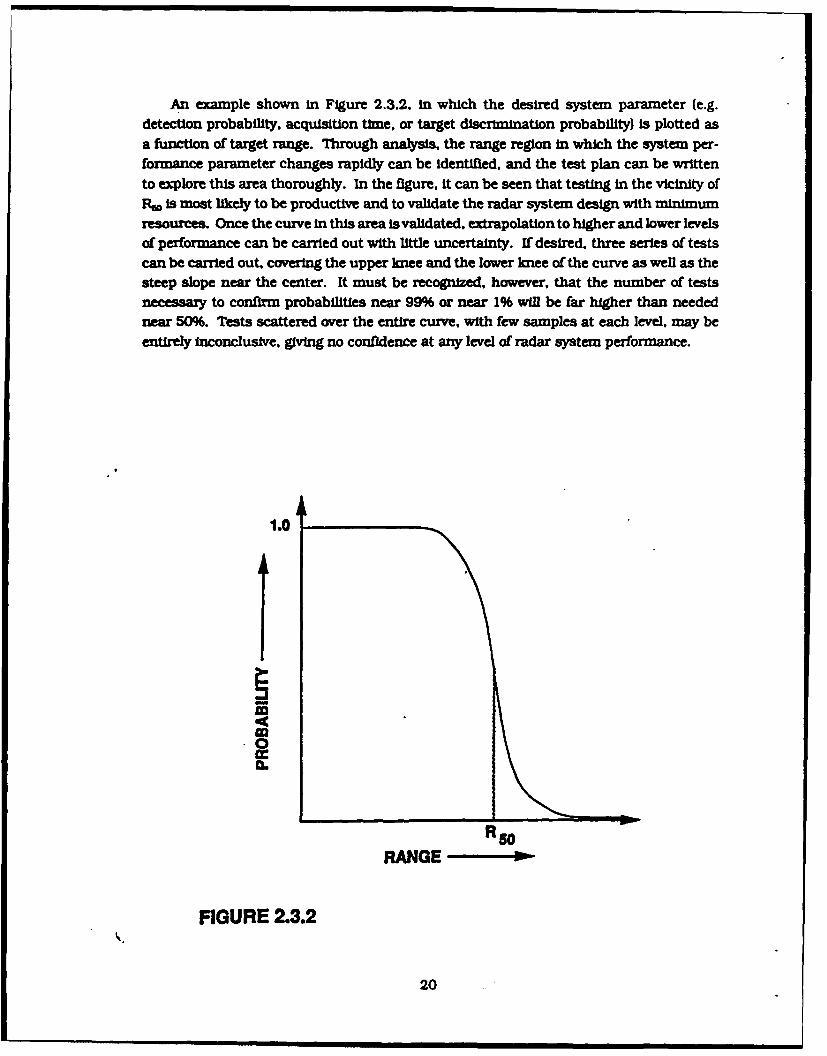
An example shown In Figure 2.3.2. in which the desired system parameter (e.g.detection probability, acquisition time, or target discrimination probability) Is plotted asa function of target range. Through analysis, the range region in which the system per-formance parameter changes rapidly can be identified, and the test plan can be written
to explore this area thoroughly. In the figure. it can be seen that testing in the vicinity ofRwo is most likely to be productive and to validate the radar system design with minimumresources. Once the curve in this area is validated, extrapolation to higher and lower levelsof performance can be carried out with little uncertainty. If desired, three series of testscan be carried out, covering the upper knee and the lower knee of the curve as well as thesteep slope near the center. It must be recognized, however, that the number of testsnecessary to confirm probabilities near 99% or near 1% will be far higher than needednear 50%. Tests scattered over the entire curve, with few samples at each level, may beentirely inconclusive, giving no confidence at any level of radar system performance.
1.0
0 5
RANGE
FIGURE 2.3.2
20
2.3.3 Evaluation by Simulation
In many areas of radar performance, the processes applied to the signals and theresulting output data are complex. involving nonlinear operations and logical paths whichmay not lend themselves to any reasonable mathematical analysis. While simplified modelscan be created to obtain approximate analytical results, simulation may be the only wayto predict the actual performance of these processes with multiple inputs from targets andInterference. This is especially true In areas such as target Identification and multiple-target tracking. Again, however, it is Important to perform as thorough an analysis aspossible to guide the choice of parameters for simulation and to help Interpret the results.
2.3.4 Determination of Test Conditions
The techniques of analysis and simulation are seldom reliable enough to permitfavorable decisions on production of radars to be made without validation by actual fieldtest. On the other hand, designs which have fundamental flaws or limitations can oftenbe rejected on the basis of analysis alone. Given particular areas of concern. Identified byanalysis or simulation, it will usually be possible to design test programs to determinewhether these areas are adequately addressed by the radar design. The key to a successfultest program is to reduce the number of test variables so that the test data will be definitiveenough, In the statistical sense, to resolve the Initial uncertainties.
In general, field test conditions are difficult to determine and describe accurately,especially those related to clutter and propagation effects. Given the limited resourcesusually available for testing, it is preferable to perform repeated tests under a few welldefined conditions which will permit adequate statistical validation of system performancefor those conditions, than to spread the test resources over all possible combinations of
operating conditions and end up with too little data and questionable results In each area.It is then possible to use analytical models to extrapolate performance to conditions nottoo distant from those covered by test data.
2.3.5 Test Design
After suitable analysis, tests may be designed to measure each system performanceparameter. The test design consists of specifying such factors as the following:
a- Target type, size. velocity, flght path
b. Radar location, mode, waveform, scan procedurec. Environment: weather, ECM, clutter (determined by location)d. Presence of multiple targets, real or simulatede. Types of data to be recorded
21
The test design is not carried out to the level of step-by-step procedure, but rather asa description of the test objectives, general methods to be used, and conditions of the radar
and its environment.
2.3.6 Test Procedure
The detailed, step-by-step procedure to be followed during the test can now be preparedon the basis of the test design.
2.3.7 Recorded Data
The details of data to be recorded, its format, and how the start and stop times of each
batch of data are to be determined can now be specified.
2.3.8 Evaluation
The methods of evaluating the data should be determined and specified during thepreparation of the test plan and procedure. An example of this process would be to specifythat target position data from the radar under test will be reduced to Cartesian coordinates.compared with range instrumentation radar data (e.g., AN/FPS-16). and differences cal-culated. The mean and standard deviations of the differences would be the output If thedesired data are errors In radar spherical coordinates, the AN/FPS-16 data would beconverted to spherical coordinates at the test radar, differences obtained, and the meanand standard deviations of those differences would be the outputs.
2.3.9 Interpretation
The final step in the system test process is the interpretation of the test results interms of subsystem parameters: such characteristics as transmitter power, receiver noisefactor, or antenna gain and pattern. This interpretation can lead to decisions as to thenext lower level of radar testing: the detailed evaluation of subsystems, circuits andcomponents to determine reasons for any departure of the radar system from its specifiedor expected performance. It can also lead to discovery of defects in the test procedure orenvironment of the test, as a guide to retesting under more accurately controlled conditions.
22
2.4 Test Methodology and Procedures - Closed-Loop and Field Testing
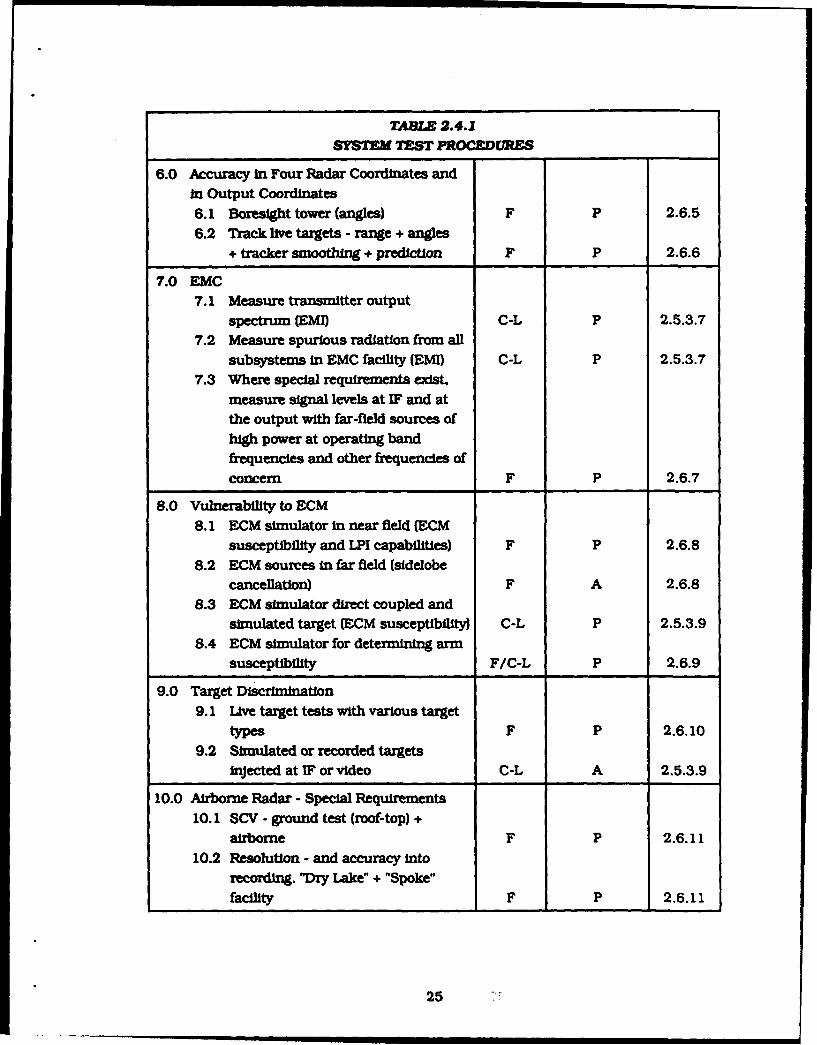
Test procedures have been Identified for use in evaluating system level performancefor each of the system parameters given in Section 2. These procedures are listed in Table2.4.1, together with their classification as either closed-loop (C-L) or field tests (F andrecommendatons as preferred (P) or alternate (A) approaches. These procedures aredescribed in detail in Section 2.5.3 and 2.6, together with the rationale for choosingpreferred and alternate approaches.
23
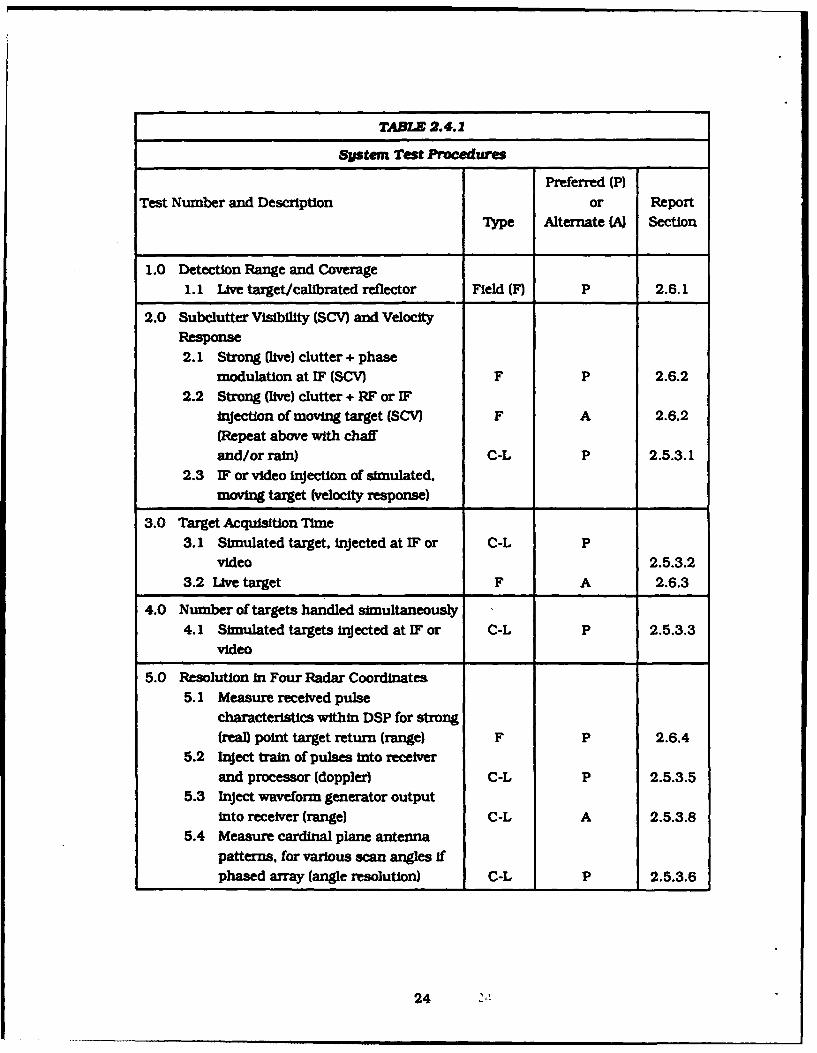
TABLE 2.4.1
System Test Procedures
Preferred (P)Test Number and Description or Report
Type Alternate (A) Section
1.0 Detection Range and Coverage1.1 Live target/calibrated reflector Field (F) P 2.6.1
2.0 Subclutter Visibility (SCV) and VelocityResponse2.1 Strong (live) clutter + phase
modulation at IF (SCV) F P 2.6.22.2 Strong (live) clutter + RF or IF
Injection of moving target (SCV) F A 2.6.2(Repeat above with chaff
and/or rain) C-L P 2.5.3.12.3 IF or video injection of simulated.
moving target (velocity response)
3.0 Target Acquisition Time3.1 Simulated target, injected at IF or C-L P
video 2.5.3.23.2 Live target F A 2.6.3
4.0 Number of targets handled simultaneously4.1 Simulated targets injected at IF or C-L P 2.5.3.3
video
5.0 Resolution in Four Radar Coordinates5.1 Measure received pulse
characteristics within DSP for strong(real) point target return (range) F P 2.6.4
5.2 Inject train of pulses into receiverand processor (doppler) C-L P 2.5.3.5
5.3 Inject waveform generator outputinto receiver (range) C-L A 2.5.3.8
5.4 Measure cardinal plane antenna
patterns, for various scan angles ifphased array (angle resolution) C-L P 2.5.3.6
24
TANE 2.4.1SYSTEM 77SW PROCEDURES
6.0 Accuracy In Four Radar Coordinates and
In Output Coordinates
6.1 Boresight tower (angles) F P 2.6.5
6.2 Track live targets - range + angles
+ tracker smoothing + prediction F P 2.6.6
7.0 EMC
7.1 Measure transmitter output
spectrum (EM!) C-L P 2.5.3.7
7.2 Measure spurious radiation from all
subsystems in EMC facility (EM!) C-L P 2.5.3.77.3 Where special requirements exist,
measure signal levels at IF and atthe output with far-field sources of
high power at operating band
frequencies and other frequencies of
concern F P 2.6.7
8.0 Vulnerability to ECM
8.1 ECM simulator in near field (ECM
susceptibility and LPI capabilities) F P 2.6.8
8.2 ECM sources in far field (sidelobecancellation) F A 2.6.8
8.3 ECM simulator direct coupled and
simulated target (ECM susceptibility) C-L P 2.5.3.9
8.4 ECM simulator for determining arm
susceptibility F/C-L P 2.6.9
9.0 Target Discrimination
9.1 Live target tests with various target
types F P 2.6.10
9.2 Simulated or recorded targets
Injected at IF or video C-L A 2,5.3.9
10.0 Airborne Radar - Special Requirements
10.1 SCV - ground test (roof-top) +
airborne F P 2.6.11
10.2 Resolution - and accuracy into
recording. "Dry Lake" + "Spoke"facility F P 2.6.11
25
2.5 Closed-Loop Testing Procedures
Closed-loop testing consists of injection of specific test signals into the receiver anddigital subsystems and analyzing the responses obtained. A signal simulator generatessignals representing target returns, clutter, ECM, etc. These are injected into the radarsystem under test. The radar system performance with respect to these signals is observed.
2.5.2. Computer-Aided Testing
This closed-loop testing of the radar system involves a set of tasks that are ideallysuited to Computer-Aided Testing (CAT, which is well suited to implementing a well definedset of repetitive tasks where timing, accuracy, and repeatability are Important. The factthat modem radars operate under computer control and that significant portions of thereceiver are digital processors makes the CAT approach the most appropriate for this typeof system level testing. However, it should be recognized that access points at inputs andoutputs of the subsystems must be provided.
2.5.2 Waveform Simulation
In using the (CATI Computer Aided Testing approach to closed-loop testing it isrequired that receiver input waveforms be simulated and that specific waveform charac-teristics can be related to realistic target threat situations. The threat model defines thenumber of targets and, for each target, provides a waveform sequence with parametricvariations (appropriate sum and difference channel amplitude, phase and frequency) thatcorresponds to the trajectory of that particular target in the threat model. Threat modelscan be constructed to cover the entire operating environment of the radar. The CATcomputer can be programmed to record and display a wide array of subsystem data aswell as system level mission results. Since the CAT computer established the threat it isa straightforward matter to display and score the resulting radar report. The threat modelshould include the ability to incorporate both clutter and ECM waveforms with the abilityto vary these inputs to cover the expected range of battlefield conditions. The CAT computershould be capable of varying the key receiver parameters over a range of values that iscommensurate with the realistic variation to be expected as a function of environmentalconditions.
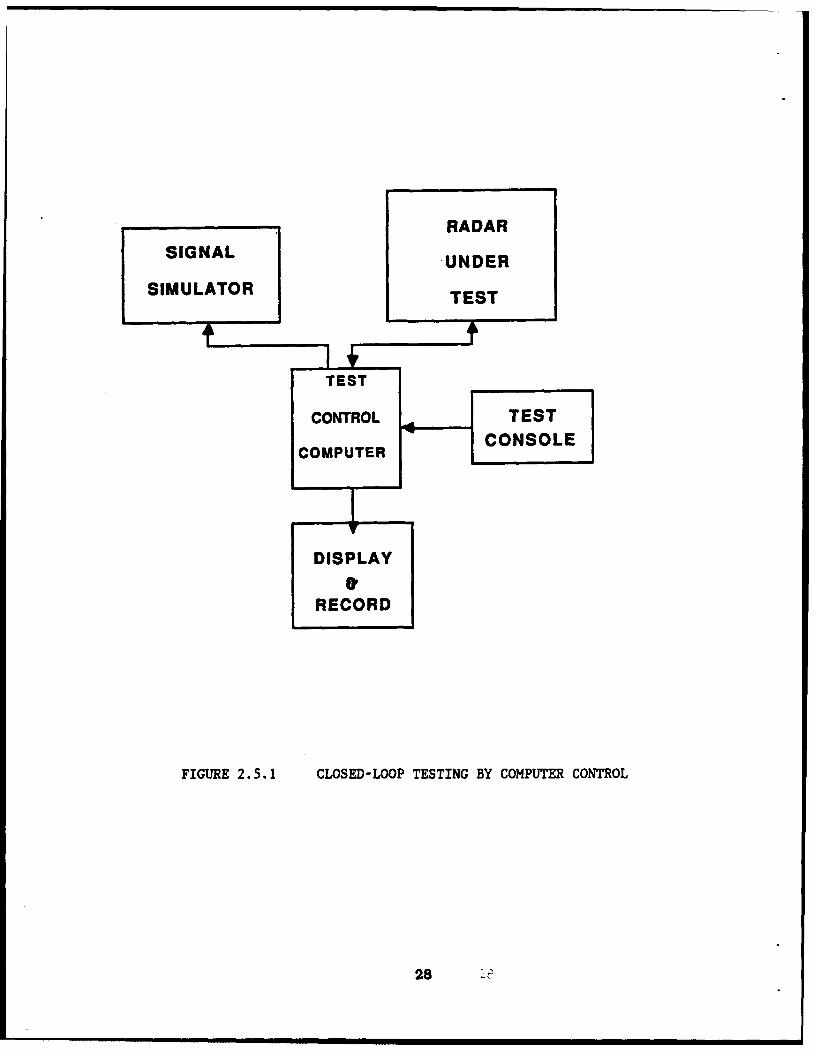
The general test approach is diagrammed in Figure 2.5.1. Simulated signals areinjected into the receiv.- and digital subsystems. The performance of the radar isdetermined through monitoring of the digital subsystem outputs. The tests are controlledand managed by means of a Test Control Computer (TCC) which typically would be a small
26
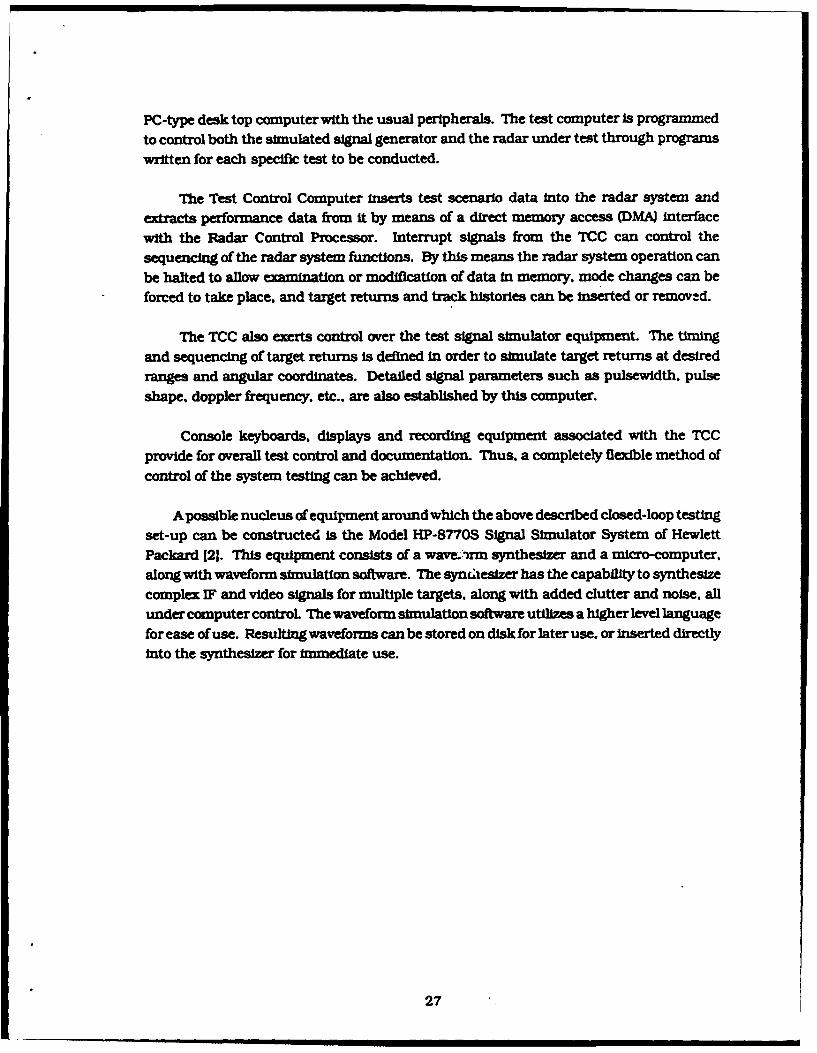
PC-type desk top computer with the usual peripherals. The test computer Is programmedto control both the simulated signal generator and the radar under test through programs
written for each specific test to be conducted.
The Test Control Computer inserts test scenario data into the radar system andextracts performance data from it by means of a direct memory access (DMA) interface
with the Radar Control Processor. Interrupt signals from the TCC can control the
sequencing of the radar system functions. By this means the radar system operation can
be halted to allow examination or modification of data in memory. mode changes can beforced to take place, and target returns and track histories can be inserted or removed.
The TCC also exerts control over the test signal simulator equipment. The timing
and sequencing of target returns Is defined In order to simulate target returns at desiredranges and angular coordinates. Detailed signal parameters such as pulsewldth. pulse
shape. doppler frequency. etc.. are also established by this computer.
Console keyboards, displays and recording equipment associated with the TCCprovide for overall test control and documentation. Thus, a completely flexible method ofcontrol of the system testing can be achieved.
A possible nucleus of equipment around which the above described closed-loop testingset-up can be constructed Is the Model HP-8770S Signal Simulator System of HewlettPackard 121. This equipment consists of a wave. *rm synthesizer and a micro-computer,along with waveform simulation software. The syncLesizer has the capability to synthesize
complex IF and video signals for multiple targets, along with added clutter and noise, allunder computer control The waveform simulation software utilizes a higher level language
for ease of use. Resulting waveforms can be stored on disk for later use, or inserted directlyinto the synthesizer for immediate use.
27
RADARSIGNAL UNDER
SIMULATOR TEST
TEST
CONTROL .,TEST
COMPUTERCOSL
DISPLAY
RECORD
FIGURE 2.5.1 CLOSED-LOOP TESTING BY COMPUTER CONTROL
28
2.5.3 Procedures
Specific system level parameters that are best evaluated using closed-loop testing
include:
a. Velocity response (Test 2.3)
b. Target acquisition time (Test 3.1)
c. Simultaneous target handling capacity (Test 4.1)
d. Doppler resolution (Test 5.2)
e. Angular resolution (Test 5.4)
A discussion of each of these system performance parameters and the method of
evaluating each using the above described closed-loop testing procedures will be outlined
in the following paragraphs:
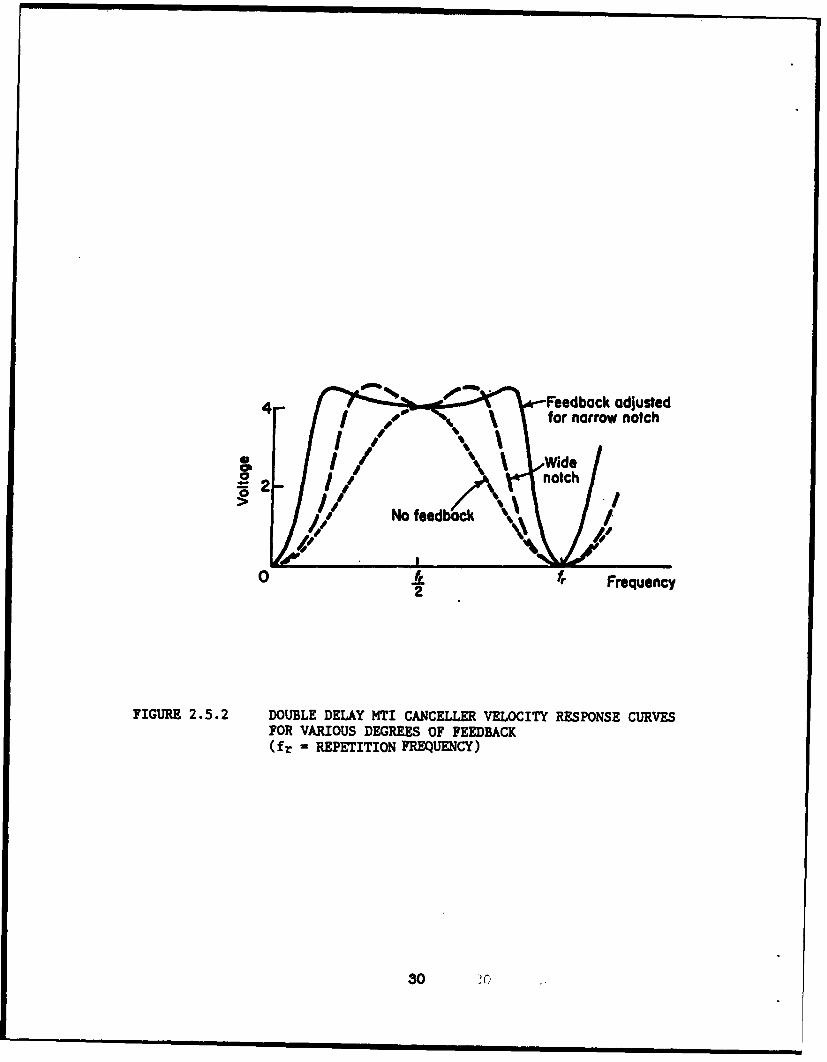
2.5.3.1 Velocity Response (Test 2.3)
The velocity response of a radar is represented by a plot of the [3.p.2391 relative target
output signal level as a function of target radial velocity (as measured by the doppler
frequency of the target). Typical velocity response curves are shown in Figure 2.5.2,
representing a radar with a fixed PRF and a signal processor filter characteristic of a
double-delay hMi canceller with various degrees of feedback. The relationship between
the doppler frequency. fj and the radial velocity vt of the target Is given by
For a radar having a single PRF, the velocity that gives a doppler frequency equal to
the PRF f, is the first blind speed. And the velocity corresponding to a doppler frequency
of is known as the "optimum velocity".
29
4 Feedback adjusted4- /for narrow notch
6%
# No feedback
._...
0 A fr Frequency2
FIGURE 2.5.2 DOUBLE DELAY MTI CANCELLER VELOCITY RESPONSE CURVESFOR VARIOUS DEGREES OF FEEDBACK
(fr - REPETITION FREQUENCY)
30 ?C."
The velocity response of a given radar design Is determined by the PRF values, thewavelength and the filtering characteristics of the signal processor. Multiple PRFs (or
staggered repetition periods) are frequently used to eliminate blind speeds within the targetvelocity region of interest. Complex filter characteristics (typically MTI plus coherentdoppler filtering with FFT algorithms) are employed to achieve the desired rejection of thevarious types ofclutter (e.g.. ground clutter, weather clutter, chaff. and birds). Performancewith respect to clutter of various types is most accurately determined at the system levelby field measurement of subclutter visibility (SCV) (see 2.6.2).
The velocity response could conceivably be measured by flying live targets with knownradar cross sections toward the radar at all (achievable) velocities of interest, but thiswould be a very inefficient use of resources. Closed-loop measurements can completelycharacterize the relative velocity response function. A small number of field measurementsof SCV and detection range can be used to calibrate the velocity response curves.
The technique for measuring the velocity response of the radar system utilizing thecomputer assisted testing set-up shown in Fig. 2.5.1 is as follows. The signal simulatorgenerates target echo pulses with varying amounts of doppler shift. These pulses aretriggered by the timing signals generated in the Radar Control Processor, so they representproperly any staggered PRF scheme utilized by the radar. The pulses can be injected intothe radar under test either at the IF or the video portion of the receiver. The velocity
response is obtained by monitoring the output of the signal processor where the dopplerfiltering is accomplished.
2.5.3.2 Target Acquisition Time (Test 3.1)
Target acquisition time limits in modem radars are determined by signal processorfiltering and signal integration delays, plus the delays resulting from data processingfunctions associated with detection, target reporting, classification, track initiation, etc.
Since target tracking is not typically effected with electro-mechanical servos, but in a modeof operation with an electronically scanned array antenna, the delay times associated withantenna beam steering are negligible compared with the above signal and data processingdelays. Track-while-scan systems introduce delays associated with the scan rates andcoverage volumes (or revisit times), with the remaining factors influencing acquisition timebeing the above signal and data processor delays. Thus, target acquisition times are bestmeasured on a closed-loop basis, involving only the digital subsystem.
Measurement of target acquisition time with the computer assisted testing configu-ration of Fig. 2.5.1 is as follows. The signal simulator generates a train of pulses repre-senting the radar returns from a target. These pulses are injected into the IF or video
31
portion of the receiver, or directly into the signal processor in digital form. The test computercauses the radar system to proceed through the normal operational steps of signal ifitering,detection, post-detection integration, target verification, classification. etc... and trackinitiation. The effects of scan coverage procedures and revisit times are included throughcoordinated control by the test control computer of the pulse train timing of the signalsimulator and of the mode sequencing of the radar control computer. The progress of thesimulated target signals through the various steps leading to acquisition is monitored andreported by the test control computer.
2.5.3.3 Simultaneous Target Handling Capacity (Test 4.1)
The number of resolvable targets that can be handled simultaneously by a given radaris determined partly by signal processor delays and. more particularly, by the speed andmemory capacity of the data processor for performing its functions of target reporting,target verification and classification, track initiation, track continuation. etc. The lim-itations imposed by the switching of electronically scanned antenna beams from target totarget are determined by the dwell time requirements (integration delays) and the dataprocessor scheduling function, rather than the antenna beam switching times (which aretypically measured in microseconds). Thus, closed-loop tests involving the digital sub-system will suffice to evaluate the system-level capabilities for target handling.
Closed-loop evaluation of this target handling capability is accomplished by pro-gramming the sgnal simulator to generate a number of simultaneous target returns atresolvable ranges and dopplers. These pulses would be injected digitally at the Input tothe digital subsystem. Separate tests would involve having all simultaneous targets withinone antenna beam, or distributed throughout the scan volume. The test control computerwould monitor the operation of the radar in filtering, detecting and tracking these targets.Additional new target returns could be added to determine the capability of the radarsystem to establish new track ifies when already occupied with maintaining existing trackson previously detected targets.
2.5.3.4 Target Resolution
Target resolution in three of the four radar coordinates (doppler and two angles) ismost efficiently accomplished by closed-loop testing, since controlling field tests with livetargets spaced at barely resolvable separations is extremely difficult (measurement of rangeresolution is described as a field test in Section 2.6.4). The exceptions to this argum.: tare mapping radars. including airborne synthetic aperture radars, where resolution andmap quality are significantly affected by the accuracy achieved by the radar in compen-sating for non-ideal motion of the radar platform. In these cases radar maps of known
32
scenes (including test patterns of reflectors) must be acquired In field tests andsubsequently analyzed to determine resolution and map quality. These latter cases arediscussed in Section 2.6.11.
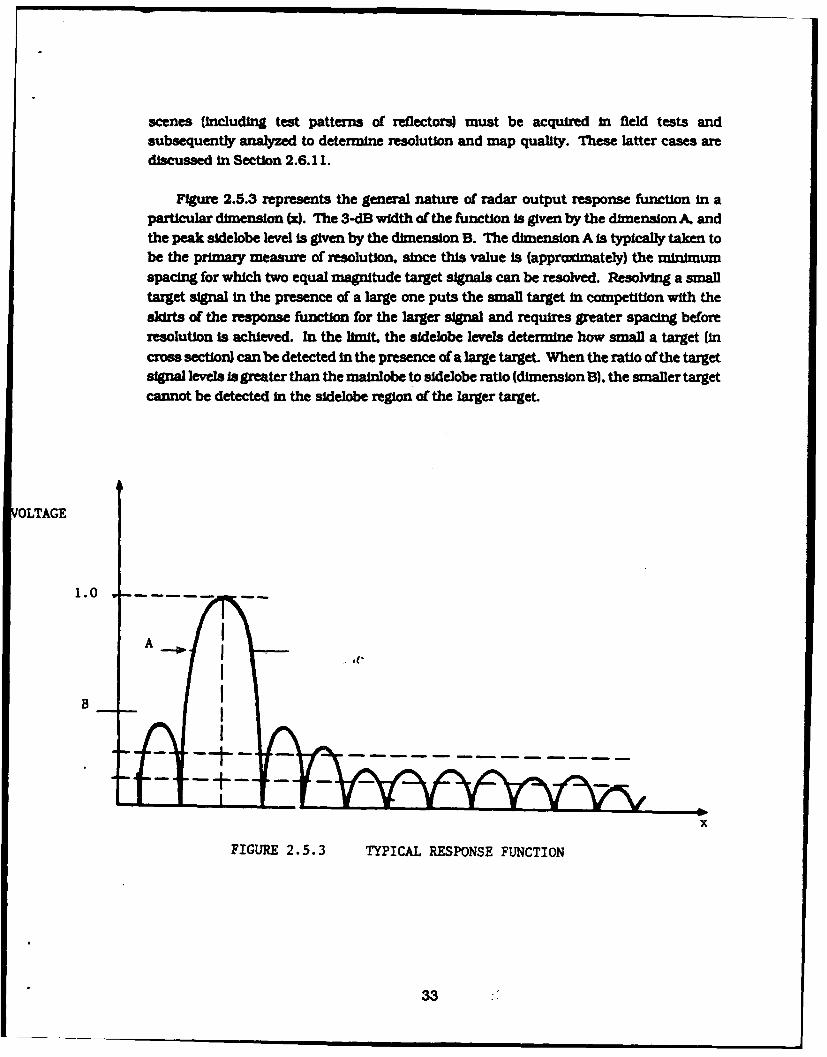
Figure 2.5.3 represents the general nature of radar output response function in aparticular dimension (x. The 3-dB width of the function Is given by the dimension A. andthe peak sidelobe level is given by the dimension B. The dimension A is typically taken tobe the primazy measure of resolution, since this value is (approximately) the minimumspacing for which two equal magnitude target signals can be resolved. Resolving a smalltarget signal In the presence of a large one puts the small target In competition with theskirts of the response function for the larger signal and requires greater spacing beforeresolution Is achieved. In the limit, the sidelobe levels determine how small a target (incross section) can be detected in the presence of a large target. When the ratio of the targetsignal levels is greater than the mainlobe to sidelobe ratio (dimension B). the smaller targetcannot be detected in the sidelobe region of the larger target.
OLTAGE
1.0 .-
A.
B
x
FIGURE 2.5.3 TYPICAL RESPONSE FUNCTION
W3
In general, radar requirements focus on resolution of targets of equal or nearly equal
sizes or signal strengths, although peak range sidelobes may be specified for pulse com-pression systems in order to accommodate small targets in the presence of large targets.
Also, synthetic aperture mapping radars typically require low sidelobes in both the range
and doppler frequency dimensions in order to map accurately areas of low reflectivity
adjacent to areas of high reflectivity (Le., land/water boundaries, etc.).
2.5.3.5 Doppler Resolution (Test 5.2)
In the doppler frequency dimension, A in Figure 2.5.3 Is approximately equal to the
coherent integration filter bandwidth, and the sidelobes result from the combined effectsof the filter characteristics and the finite dwell time of the transmitted pulses.
The doppler response function can be directly evaluated using the closed-loop mea-
surement set-up of Figure 2.5.1. The simulated target signal Is injected at the input ofthe digital signal processor. The output of the signal processor is recorded as the doppler
of the input siga is varied. A second type of test consists in applying simultaneouslytwo signals closely spaced in doppler to the signal processor input, to verify that they are
resolvable.
2.5.3.6 Angle Resolution (Test 5.3)
In the azimuth and elevation dimensions, the response function correspond to theantenna patterns in the two planes. Measurements of azimuth and elevation angle res-olutions are recommended to be effected by antenna subsystem pattern measurements.
These pattern measurements will also provide the data required to assess elevationcoverage for search radars with shaped beams in elevation (typically sc 2 shaping), andECM vulnerability through sidelobes.
Two methods for measuring antenna patterns are recommended. First the compact
antenna range, soon to be delivered to Fort Huachuca, promises to be an excellent facilityfor such measurements. Although it is yet to be determined what the limitations in sidelobelevel measurements will be for the compact range (as a result of spurious reflections or
non-planar phase fronts in the quiet zone), the presently available data suggest that these
limitations should be acceptable. (Capability to measure sidelobes down to -40 to - 50 dBin the microwave band is desired). The antenna sizes of interest (see Sections 2.7) are
considerably sma er than the width of the quiet zone of the compact range, hence sidelobemeasurement limitations for these antennas when located near the center of the quietzone should be very low.
34
The ability of the compact range positioner to rotate the antenna under test offers an
especially useful capability for pattern testing of electronically scanned antennas, since
the real patterns for such antennas can be measured by electronically fixing the beam
position relative to the array face and mechanically scanning the antenna. Without such
a positioner. patterns could be obtained by electronically scanning relative to the sourceposition., but these patterns are not the true spatial patterns that correspond to a particular
beam position. The procedure for makin such pattern measurements is the same as thatwhich is prescribed by the compact range suppliers. with the patterns of primary interest
being in the cardinal planes of azimuth and elevation.
An alternate approach to the compact range would be to Implement a conventional
far-field antenna range. Fort Huachuca appears to offer numerous possible sites for such
a range, where unobstructed line-of-sight for distances of 350 meters or more is available,
and bridges. towers and other objects are sufficiently far away to minimize reflectionswhich can limit the depth of sidelobes that can be measured. An antenna range of this
type would require a positioner similar to that used in the compact range In order to provideproper evaluation of electronically scanned antenna and even to permit pattern cuts at allangles with mechanically scanned antennas.
The general procedure for measuring antenna patterns in such a far-field range wouldinvolve the following steps:
1. Mount the test antenna on the positioner.
2. Rotate the positioner to establish the positioner scan plane tocorrespond to the plane of the desired pattern cut.
3. Rotate the polarizer at the signal source to correspond to thespecified antenna polarization.
4. Run the pattern measurement program by rotating the positionerangle to scan the antenna beam past the direction of the signal
source, and record the pattern.
Modern pattern test ranges (both compact and far-field types) are typically operatedunder complete computer control, including the scanning regimen and pattern plotting invarious formats.
Detailed procedures for conducting antenna tests are presented in references 141 and
[51.
35
2.5.3.7 Electromagnetic Compatibility (EMC)
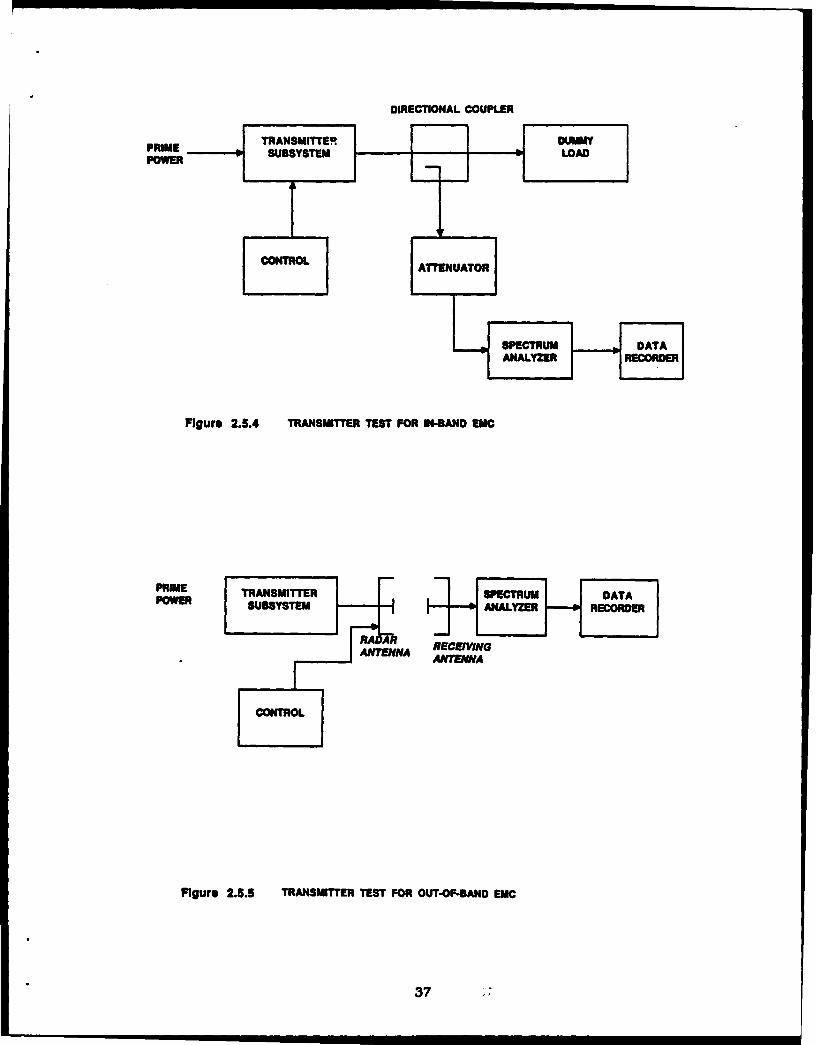
Electromagnetic interference caused by the radar to be evaluated is of concern for anumber of reasons. including: Interference with other radars of the same type operatingwithin the same band but on different channels, interference with other RF systems suchas other radar types, communications and data trnsmission systems. and possibleconcern about the radar being detected and located through spurious radiation. Evaluationof the radiated power levels within the radar operating band but outside the instantaneoustrnsmission bandwidth of the radar under test can be accomplished with the transmittersubsystem alone, using facilities like the Blacktail site and operating the transmitter intoa dummy load, as shown in Figure 2.5.4. Test procedures for these measurements areoutlined in fTOP. 6-2-530 [6, para. 3.21.
Evaluation of the radiated power levels outside the radar operating band should be
conducted with the transmitter feeding the antenna and the spectrum analyzer connectedto a receiving antenna as shown in Figure 2.5.5. The antenna is included in these tests,because it acts as a filter to out-of-band signals. These measurements should be madein the frequency regions where sum and difference plus harmonic combinations of exciterinternal frequencies can produce signals outside the radar band as well as at the secondand possibly (depending on how high the fundamental frequency is) the third harmonicof the radar (fundamental) carrier frequency. The Blacktail facility would, again, beappropriate for these tests. The receiving antenna can be either in the near field or farfield of the radar antenna beam.
36
DIRECTIONAL COUPLER
PRIMESUSTEPOWER
F~gre2..4 TNSME T FOR ITTN-AD E
SPECRU DATA
ANLYERWERODE
Figure 2.5.4 TRANSMITTER TEST FOR oU-OFAND C
PRIME TRANMITTR SPCTRU D37
The two Test procedures outlined above represent test 7. 1.
Spurious radiation from all subsystemswould Include radiation from the low frequencyoscillator and counters in the exciter and waveform generator and from the digital sub-system. In addition, radiation (both in-band and out-of-band) at the frequencies of Interestin the above paragraphs may be of concern where the radar transmitter can be turned offto avoid detection, location, and anti-radiation missile (ARM) attack.
Measurements for the latter case (Test 7.3) can be a repetition of the Test 7.1 withthe transmitter final amplifiers turned off. The low frequency radiations from the systemcan be measured at a facility such as the Blacktail facility, using the standard techniquewith a broadband receiving antenna and spectrum analyzer (plus data recorder) andputting the total radar system Into operation.
2.5.3.8 Alternate Test Procedures (Test 5.3, 8.3 and 9.2)
As stated earlier, a number of closed-loop test procedures are suggested as alternatesto the selected preferred or closed-loop tests, because of either limited facilities, availabletargets, or restrictions on transmissions. These include Tests 5.3, 8.3, and 9.2.
A closed-loop alternative to measuring range resolution and range sidelobe levels
(assuming pulse compression is employed) with real point target returns Is to inject thetransmitted pulse-waveform, as available from the waveform generator (at either an IFlevel or RF level) into the IF amplifier or into the RF amplifier (Test 5.3). To accomplishthis, the timing of receiver and signal processing operations relative to the pulse Initiation
(for each repetition Interval) must be adjusted to avoid having the simulated target appearat zero range. Resolution measurements would be accomplished as with Test 5.1. Thedisadvantage of this test method is that the possible effects of the transmitter on responsefunction (usually on range sidelobes) are not included In the test.
An alternative to evaluating ECM vulnerability with field Test 8. 1, where simulatedECM signals are radiated from an antenna in the near field, is to couple the simulatedECM signals directly to the radar receiver (at the antenna or RF amplifier) and to injectsimulated targets at the same point (Test 8.3). This technique would allow testing withoutexposing the threat scenarios to possible intercept. However, it has the disadvantage that
live target characteristics and clutter cannot be included in the tests without a specialsimulator which would be unduly complex. The evaluation process with this test wouldbe the same as with the preferred approach of Test 8.1, described in Section 2.6.8.
38
An alternative to field Test 9.1. described In Section 2.6.10, where live target tests are
preferred for evaluating target classification effectiveness, is to use simulated or recorded
target signals. typically injected at IF or video. Target classification, depending upon the
type of targets and radar functions. may be effected by analyzing phase or amplitude
modulations (e.g., turbine compressor blade modulations) or extremely fine resolution
(typically range). Hence, simulations would require faithful modelling of such charac-
teristics and recordings of live target returns (if available) would also have to be excellentreproductions in phase and amplitude and possibly have very wide bandwidths. The
advantage of this alternative approach (Test 9.2) would be that live targets of all the types
of interest for discrimination evaluation may not be available. Test methods for this case
would be the same as for Test 9. 1.
2.6 Field Testing Procedures
Radar field testing requires that a complete operating radar be placed in an openenvironment in which targets, clutter, and other source of interference can be coupled
through the antenna to the transmitter and receiver. Because the costs for this type of
testing are greater than for closed-loop tests, and the test conditions are more difficult to
control, field testing must be reserved for evaluation ofmajor radar performance parametersin which the electromagnetic test environment is a critical factor. The test procedures
described in this section are representative of such cases.
Data recording for these tests include the test conditions (site, weather, target char-acteristics, and target flight profile), target position and velocity during each run, radar
status, and radar output data. Recording, reduction, and analysis of radar output datawould be handled the same as described in Section 2.1.4.2. The measured detectionranges should be extrapolated to those target cross sections of interest (specified), and
factors can be applied to account for differences in target fluctuation models (Swerlingcases).
2.6.1 Detection Range and Coverage
The best system-level test for radar detection range is conducted with the radar in
full operation and with live targets that are calibrated with regard to radar cross section(Test 1.1) The radar should be sited so as to permit an unobstructed view of the regionwhere the single scan probability of detection of the test target Is expected to be 50% as
well as where the (aircraft) target can safely operate and its position can be accuratelydetermined. Clutter levels within this region should be well below the level for which thedetection performance becomes clutter limited (i.e., the clutter levels relative to the receivernoise level, measured in dB. should be at least 10 dB less than the SCV capability of the
radar).
39
The radar should be sited where the foreground terrain is moderately rough (such as
grassy. scrubby, or plowed fields) in order to avoid forward scattering from more reflective
ground that will introduce lobing in elevation coverage patterns. The latter effect will resultin increased detection ranges at the lobe peaks and reduced ranges midway between peaks.
The best target for these purposes is a calibrated reflector such as a metallic sphere,
corner reflector, or Luneberg lens type reflector. Inmost cases, the reflector will be attached
to an aircraft, so that it can be easily positioned and moved through the range interval ofinterest and so that approach speeds can be controlled to either position the target velocity
or know the location of the target within the velocity response function of the radar. Ideally,the target speed is controlled to place its approach velocity at the optimum velocity pointon the velocity response function. However, this is not always possible, and it is necessaryto account for the difference when evaluating the data.
Preferably, a small aircraf will carry the reflector in order to minimize the contributionof the aircraft radar cross section to the overall target cross section, since aircraft cross
sections vary significantly with small changes in aircraft aspect angle (toward the radar)
which typically result from winds aloft. Also, a constant cross section point target (overa wide aspect angle), such as one of the above calibrated targets, avoids the question ofthe Swerlng fluctuatlon model. Of the three examples above, the Luneberg lens is especiallyappealing, since it provides a large cross section as a result of its effective antenna gain.Hence, the cross section of the Luneberg lens reflector will substantially dominate that of
a small aircraft. A ratio of cross sections of at least 10 dB is desired.
One problem that a large cross section test target may present is that the range regionof interest (Pl = 50%) may be beyond unambiguous range of a radar designed to detect verylowcross section targets (e.g., an artillery locator). In this case, the data processing software
of the radar may have to be modified to overcome any technique that might be employedto reject ambiguous range targets, and the range ambiguities would have to be accountedfor in data evaluation.
In order to obtain a measure of the volumetric coverage of the radar, test runs should
be made at three or more target altitudes to obtain elevation coverage profiles. At leastten runs should be made at each level, in view of the statistical nature of the detectionprocess. Target position data, accurate to ±5% of detection range, can usually be obtainedfrom the navigation equipment on board the aircraft, but can also be obtained from othermeasurement systems such as a nearby tracking radar. The Fort Huachuca Instrumented
Test Range (rFR) offers a capability that is far more precise than is required tor these
detection range measurements.
40 4k)
Target velocity data can be obtained from the aircraft on-board Instruments and maybe obtained from the radar itself (if velocity measurement is a function within the digitalsubsystem). Approach velocity accuracy of ±5% is sufficient. Again, the ITR offers morecapability for accurate velocity measurement than Is required.
In determining the volumetric coverage of a radar with an electronically scanned
antenna, at least three azimuth scan angles should be evaluated, since antenna gain varieswith scan angle. The antenna (or radar) may be mechanically rotated In order to keep the
test target operations within the assigned flight zone.
2.6.2 Subelutter Visbilty (SCV) Tests 2.1 and 2.2
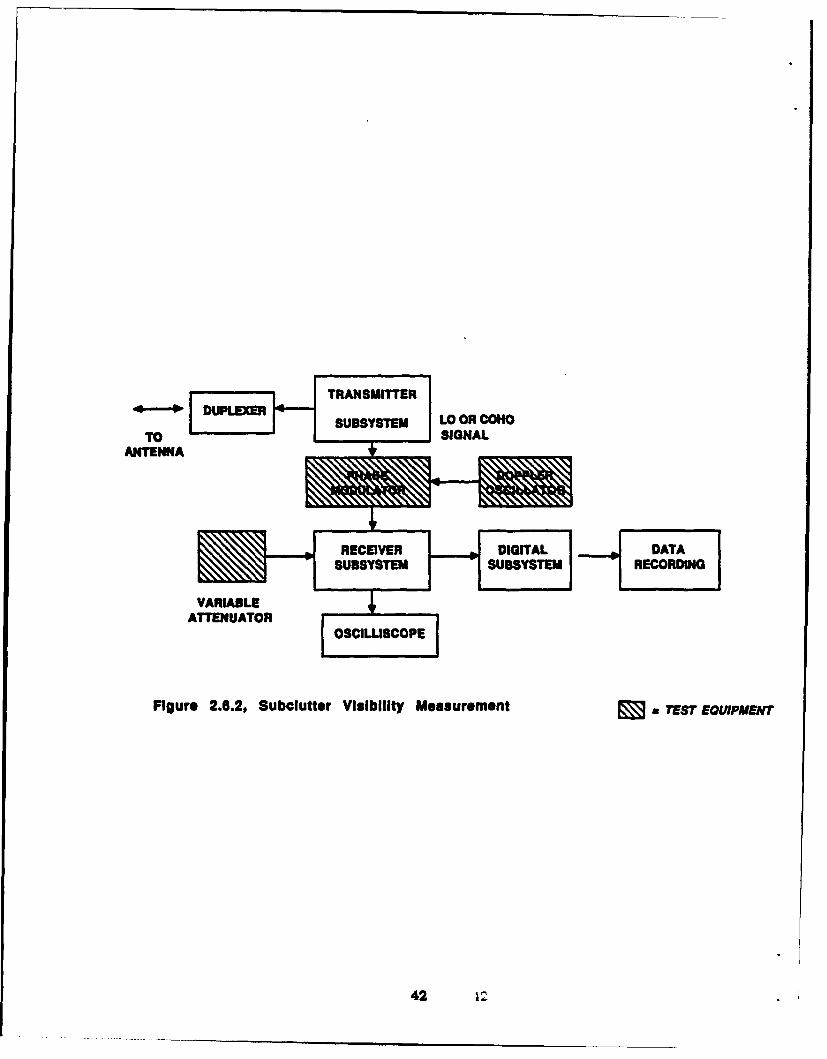
Although the most realistic method for this measurement would be to operate theradar against a live target and a background of live clutter, this approach presents somedifficulties due to uncertainties regarding the clutter signal level within the same resolutioncell as the target at any specific time during the test. The preferred method is to use liveclutter which is phase modulated to simulate a moving target (Test 2.1). 171 In this pro-cedure, a calibrated phase modulator is inserted in series with the first local oscillator (asshown in Figure 2.6.2. the IF reference oscillator, or the signal path (typically, at the IFlevel). By shifting the phase between alternate pulses by the same amount, the receivedclutter signal is modulated to achieve the effect of a target at optimum velocity (dopplerfrequency equals 1/2 PRF) and optimum phase being superimposed upon all the receivedclutter (i.e., within all range gates). The simulated target-to-clutter ratio is dependent onthe degree of phase modulation, and the optimum phase condition results in pure phase
modulation without accompanying amplitude modulation.
41
TO SGAANTENNA+
RECEIVER DIGITAL DATASUBSYSTEM SUBSYSTEM1 EODN
VARIABLEIATTENUATOR
CE
Figure 2.6.2, Subctutter Visibility Measurement 7 EST EQUIPMENVT
42
The procedure for conducting this test is as follows:
(I) Choose a strong isolated clutter point and set Its level byadjusting the preamplifier gain or an RF attenuator(see Figure 2.6.2) so that It Just saturates (maximizes) thereceiver output (as observed with an oscilloscope).
(2) Observe the output of the signal processor for the resolutioncell containing the selected clutter point and increase thephase modulation until a 50% probability of detection is obtained..
(3) The amount of phase modulation is then converted to SCV by applyinga number of factors.
One conversion factor relates the modulation to a clutter-to-target ratio. One way ofdoing this is to modulate a CW signal with the phase modulator and use a spectrumanalyzer to measure the sideband-to-carrier ratio. This ratio is 3.92 dB larger than theequivalent target-to-clutter ratio.
Another factor that may be applied in the process of comparing the results of the testwith specified performance is that relating the SCV at optimum velocity to the average overthe velocity response function. This factor depends upon the shape of the velocity responsefunction. It is typically the ratio of the average value of the response function over thespecified target velocity spread taken over the response level at optimum velocity.
One more correction that may be applied accounts for the optimum phase conditionof the test. This factor accounts for the signal loss that would normally occur under strongclutter conditions, when the clutter is at or above the receiver saturation level and thenon-optimum target phase conditions result in the loss of the target energy contained inAM sidebands. This factor ranges between 1.5 and 3 dB, depending upon the amount ofnon-coherent integration employed.
This test method can be accurate to about 1 dB. Its only disadvantage is that thephase modulator may have to be a special design. Even though this circuit is relatively
simple, it Is not generally found as a catalog item.
Siting of the radar for this test can be the same asfor the detection range measurementsabove, providing that one or more strong single points of clutter (e.g., towers, water tanks.mountain cliffs., etc.) are within radar view and at sufficiently close range to provide clutterreturn signals equal to or greater than the ratio of SCV over the receiver noise level. Findingsuch clutter sources at Ft. Huachuca doesn't appear to be a problem. Scott Peak presents
43
a potential point to use, and the AN/FPS- 16 on Scott Peak could be used as a strong fixedpoint of clutter by pointing its antenna directly at the test radar. The latter case wouldresult in a fixed target (clutter) of several thousand square meters.
An alternate SCV test procedure (Test 2.2) is that of superimposing (at RF or IF) asignal generator synthesized target on live clutter, which has the advantage of not requiringa special phase modulator since generally available test equipment is used. However, thelatter test equipment may be expensive If pulse compression waveforms are used by theradar. Also, the test target signal should be gated in range and angle to place it where thepoint target appears and errors in the measurements may result from misalignmentbetween the two signals.
This measurement is conducted much the same as Test 2.1 above, with the clutterlevel set at the receiver saturation level. Calibration is achieved by equalizing theamplitudes of the two signals as viewed at a point in the receiver before saturation occurs.The measurement is then made by reducing the amplitude of the test signal until 50%probability of detection Is obtained at the signal processor output The SCV is then equalto change in the signal generator attenuator, corrected for the ratio of average velocityresponse to response at the target velocity used in the measurement.
The need for knowing the simulated target velocity (to within ±5% of the PRF) suggeststhat an IF signal would be preferred because of the relaxed signal generator stabilityrequirements (as compared with RF injection). Exceptions to this argument would resultfrom concerns about nonlinearities in the RF amplifiers or the existence of a highly versatileand stable RF signal generator in the inventory.
Depending upon the emphasis placed on radar operation in rain, snow, and chaff, aswell as the design of the velocity response function to effectively reduce their effects, itmay be required to repeat SCV measurements under these clutter conditions. In this case,the above tests would be repeated under conditions where these forms of clutter occur,with added difficulties of calibrating the tests (and probable reduced accuracy of mea-surement) caused by the changing with time of the characteristics (cross sections, spectra.etc.) of the clutter.
These forms of clutter, being driven by wind, have similar characteristics. Theytypically have (frequency) spectra widths dependent upon the wind shear and turbulanceand, as compared with ground clutter, they are offset in doppler frequency as a result ofthe average wind speed component in the direction of the radar. Thus, SCV mzsurementswith chaff would not only cover that clutter form, but would be representative of SCVperformance with weather (various forms of precipitation) and to some degree could beextrapolated to these cases through analysis based on available weather and chaff cluttermodels.
44
2.6.3 Target Acquisition Time (Test 3.2)
An alternate method (to closed-loop Test 3.1) for measuring target acquisition timewith either an electronically scanned system that performs both search and track functions
or with a track-while-scan system Is to use a live target. This test (no. 3.2) can beaccomplished by recording the data processor outputs, as described In Section 2.4.1.2
(including a time tag on each data report. if the output data does not already include time)
and observing the time difference between the first reported detection of a target and thereporting of a target track being established. This test can be carried out as an adjunctto the measurements of detection ranges (Test 1. 1).
2.6.4 Resolution In Four Radar Coordinates (Test 5.1)
The preferred method for measuring range resolution and range sidelobes with a radaremploying pulse compression is with an isolated point target such as the clutter signalused in the SCV tests (tests number 2.1 and 2.2). This approach offers the advantage overclosed-loop Test 5.3 in that it includes the effects of the transmitter power amplifier (suchas amplitude limiting and phase ripple), particularly as they affect range sidelobes.
Figure 2.5.3 applies to the range dimension (x = range). with the sidelobes being thetime sidelobes of the pulse compression technique and its implementation (81. In thiscase, the dimension is approximately equal in time to the reciprocal of the signal bandwidth.with the degree of approximation being dependent upon the weighting (amplitude andphase) that is employed to control sidelobe levels. The extent of the sidelobes in time isequal to approximately twice the length of the transmitted pulse.
This test (number 5.1) would be conducted with the same test configuration as with
the SCV tests (number 2.1 and 2.2), but without simulation of moving targets (by injectionor modulation). With a sufficiently strong point target return (as required for the SCVtests, and typically more than 40 dB above the receiver noise), sampling the range gateoutputs with the signal processor over the range interval centered at the target rangehaving a width corresponding to twice the transmitted pulsewidth. A test point within thesignal processor may provide this data to be observed on an oscilloscope or the data may
be available to be called up to the radar display for diagnostic purposes. This test shouldbe an adjunct to the SCV tests (number 2.1 and 2.2).
2.6.5 Angle Tracking Response (Test 6.1)
The closed-loop response of the angle tracking servo loop, including the antenna andreceiver, s best evaluated on a target signal radiated from a boresight tower. Two typesof response should be measured: step response, and frequency response.
45
2.6.5.1 Step Response
A target signal is radiated from the boresight tower at a level well above noise (e.g.. +30 dB). and the radar is locked onto this signal in all tracking coordinates. The angletracking loop is then switched to manual, and the beam is displaced by 1 / 10 beamwldthin azimuth from the target. The azimuth data are recorded while the loop is switched to
automatic track, and the step response is observed in the recorded data. Analog. (strip-chart) recording of a DC error signal may be used, but in digital loops the error and beamposition should be recorded digitally, at a rate at least four times the loop bandwidth.
The test is repeated In the elevation coordinate.
To test the ability of the receiver AGC (or other normalization) to hold constant trackingloop gain on weak signals, the tests should be repeated for S/N ratios of + 10Db, +5dB.and 0dB (or as low as the radar will continue to track). It can be expected that the reducedloop gain for weak signals will produce a more sluggish response. The presence of loopvisibility (large overshoots in response. oscillating at a frequency well below the servobandwidth) may also be disclosed at certain low values of S/N ratio.
2.6.5.2 Frequency Response
The angle loop is locked on the strong boresight tower source as in the step-responsetest. A low-frequency function genemator signal is added into the error signal amplifier,and adjusted to produce 1/10 beamwidth (e.g.0.1 Hz). Peak beam deflection is recordedas the frequency is varied up to and beyond the nominal loop bandwidth. Azimuth andelevation loops are tested.
For digital loops, the function generator signal is passed through an A/D converterbefore being added to the receiver error signal. Alternatively, a variable-frequency sinewave may be generated digitally and added to the error signal.
The boresight tower signal is then reduced to levels of +10dB and lower, in steps, to
obtain the loop frequency response as the signal approaches the minimum for tracking.Loss of high-frequency response, and development of peaks in the low-frequency response,
may be expected.
2.6.5.3 Servo and Receiver Noise
Angle output data are recorded while tracking the boreslght tower signal, withoutexternally generated error signals. Samples of data are taken in each coordinate as thesignal level to reduced In steps to the minimum at which tracking is possible. The rmsvalue of beam position error, relative to the source, is determined for each value of S/N
46

ratio. The litlng value for high S/N will indicate the level of noise in the servo loop, whilethe curve of error vs S/N will measure the antenna and error detector slope constant forthermal noise.
2.6.6 Angle Tracking Accuracy (Test 6.2)
The purpose of this test is to establish the absolute angle accuracy of the radar systemunder field operating conditions. Previous analysis will have established the expectedcontributions of the following major error sources:
* Thermal noise• Target noise (glint and scintillation)* Clutter* Jamming" Multipath* Instrumental error in the radar
These components of error will vary with the scenario, and a limited number of realisticscenarios must be defined which will permit evaluation of the radar angle response to eachcomponent. Suggested step-by-step procedures, with scenarios chosen to isolate eachcomponent, are described below.
2.6.6.1 Thermal Noise Test
A well defined point target is provided by mounting a corner reflector, Luneberg lens,or repeater on a small target aircraft or drone. The target is flown at a range such thatS/N ratios near + 10dB are observed at elevations high enough to avoid clutter and mul-tipath errors. If necessary. radar power is reduced to obtain this level within theinstrumented range of the radar. The standard deviation of the angle data from a smoothedtarget trajectory provides a measure of thermal noise, at low S/N ratio, and the limit asS/N ratio is increased represents the instrumental error of the radar system.
2.6.6.2 Clutter and Multipath Error Test
The well defined target from the thermal noise test is flown at reduced elevation anglesto produce errors from clutter and multipath. The target trajectory is selected to pass
from a region In which strong clutter is coincident in range with the target to a region inwhich the target is relatively free of clutter. The terrain contributing multipath errorsshould be as near constant as possible, to permit the isolation of the clutter error componentas clutter varies.
47
Recorded target data are compared with reference data from optical or instrumentationradar (e.g. ANFPS-16). keeping in mind that the Instrumentation radar may also havemultipath errors at low elevation angle. If the siting is chosen to permit the instrumentationradar to track at shorter range (and higher elevation angle) than the radar under test, thisproblem may be minimized. The differences between recorded target data and the truetarget position represent the combined effects of the several sources listed above (pluspossible atmospheric refraction, which can be calculated and removed from the data). Thethermal noise and glint can be minimized by use of a large reflector or other source.Jamming is absent, and the target trajectory is selected to produce clutter and multipathwhich exceed the instrumental error.
The clutter and multipath components can also be separated from each other by
running the same test trajectory with large and larger reflectors, to reduce the relativeimportance of clutter. Small reflectors cannot be used to increase relative clutter unlessthe physical size of the target vehicle is small enough to avoid significant glint and sun-tillation components.
2.6.6.3 Target Noise Test
A target is flown without enhancements, providing realistic glint and scintillation. Thetrajectory is selected to provide a strong signal from an elevation high enough to minimizeclutter and multipath. Recorded data are analyzed to obtain rms deviations from the truetrajectory.
Flights at different ranges can be scheduled to isolate the glint errors from scintillationerrors. Glint is represented by a constant deflection in meters at the target, and hencethe angle error varies inversely with range. Scintillation produces a constant angle error,independent of range, if the target spectrum (Le.. rate of rotation about the radar line ofsight) remains constant. This rate can be held essentially constant by flying the targetwith a rate of turn which greatly exceeds the azimuth angle rate observed by the radar.
2.6.6.4 Jamming
The angle error effects of Jamming are tested by adding the jammer emission to anyother test environment, and comparing results. Because many Jamning techniques arebased on enhancement of a naturally occurring phenomenon, it may not be possible toevaluate the Jamming errors under conditions when other errrs are Ioi- For example,surface-bounce Jamming is most effective at low elevation angles where there is alreadysome multipath error. Certain impulse jammers have their greatest effect when the radaris attempting to reject clutter with coherent processing of many successive pulses.
48
The jamming scenario specifies the types of Jamming, locations of the jammers. fre-quencies and waveforms, effective radiated power levels, and timing of the jammer actions.These parameters must be selected to represent the specified threat against the particularradar under test.
2.6.7 Electromagnetic Compatibility (EMC) (Test 7.3)
Section 2.5.3.8 describes closed-loop tests of Electromagnetic Interference (EMI) levelsemitted by the radar under test. The tests for effects of EMI or intentional disruption ofthe radar by ele radiation are categorized as field tests, since the complete
radar Is involved (although the transmitter final power amplifier does not need to be turnedon). The radar specification, based on the anticipated threat, may specify EM! levels overthe full electromagnetic radiation spectrum (DC to millimeter wavelengths) to which theradar may be subjected (externally) without impairment of radar performance as a resultof excessive spurious signal levels entering the receiver, exiter, waveform generator. digitalsignal processor. data processor or display.
This test. which could be conducted at the Blacktal facility, would consist of thegeneration and radiation of CW and pulse signals at the specified frequencies (or frequencybands) and power levels (measured at the outside of the radar shelter). The radar wouldbe in operation, except for the final power amplifier. As the test signal frequencies, powerlevels, and wave forms (CW. pulses of various widths and PRF's) are varied, the IF receiverand radar output would be monitored. Visual monitoring would be accomplished with anoscilloscope connected to the IF amplifier outputs and at the radar output by the display.These points could also have recorders connected to record all data during the test.However, recording the IF channels requires recording bandwidths equal to the F amplifier
bandwidths.
Future radars may be concerned with intentional disruption by directed high poweredelectromagnetic energy. Typically, the frequencies of concern would be from the low endof the radar band up into the millimeterwave region (above the wavegulde cutoff frequency).The effects of such radiation would include receiver saturation and burnout Testing for
these effects would be conducted the same as above, with the far-field generation of thespecified energy levels measured at the radar antenna. In this case, simulated targetsshould be injected at RF. either by a sgal generator located in the antenna near field orfrom a boresight test tower. The radar output data and display would be monitored forsaturation effects (desensitization), front end burnout (total loss of signal), or excessivefalse alarms. An alternative to simulating target signals is to operate the radar at fullpower and monitor returns from strong fixed targets (clutter).
49
2.6.8 Vulnerability to ECM (Tests 8.1 and 8.2)
Modem tactical radars must be prepared to operate in an ECM environment. Hence,
the radar specification typically includes an ECM threat model.
A variety of ECM techniques may be employed by attack aircraft carrying jammers to
defeat certain types of battlefield radars or by ground vehicles with Jammers to defeat
airborne (and RPV) radars. ECM techniques that may be used against search and
acquisition radars would include repeaters or noise pulses to saturate target handling
circuits and noise jammers for the same purpose or to desensitize detection circuits.
Techniques used against tracking radars would include repeaters which effect range-gate
and velocity-gate pulloff, the so-called phase-front techniques (cross polarization, cross-
eye, and terrain bounce) as well as noise jammers. High powered standoff jammers are
tyically deployed well behind the FLOT in a number of large aircraft at high altitude. They
generally produce barrage Jamming with wideband noise to counter all of the opposing
radar types within the battle area, and attempt to introduce strong enough signals through
the radars sidelobes to greatly reduce their effectiveness regardless of their mainbeam
pointing directions.
The procedures for testing the vulnerability of radar to ECM (Test 8. 1) are essentiallythe same as the detection range measurement procedure (Test 1.1) and the live target test
for tracking accuracy (Test 6.2), with simulated ECM injected into the radar antenna by
means of a small antenna (e.g., a hom antenna) in front of the radar antenna. The simulator
signal generator could consist of a set of waveform generators modulating an RF power
source, a set of actual jammers, or the non communications simulator of the EMETF atFort Huachuca. The latter has substantial versatility for generating radar type signals
over the frequency bands of interest and should be capable of simulating many types ofECM, with the possible exception of noise Jamming. Hence, the EMETF may have to be
augmented with a noise Jammer (or simulator).
In conducting ECM vulnerability tests with search and acquisition radars (or search
and acquisition modes), the detection range limitations and the target acquisition prob-
abilities should be determined as a function of the types of ECM and the ECM power levels.
An alternative is to be establish the ECM power levels at the antenna corresponding to
the specified threat and determine if the radar performance parameters (detection range,
etc.) are met.
Evaluation of the effects of ECM on tracking radars should be based on the tracking
errors as a function of ECM levels (as compared with the specification) and ECM levels atwhich tracks are broken or lost.
5o
Future radars, designed to cope with strong ECM environments. may incorporate
antenna sidelobe cancellation techniques or adaptive (antenna) arrays for the purposesof negating the effects of a few powerfuljannmers that would otherwise upset radar operation
by entering the receiver through antenna sidelobes. Typically, standoff jammers are of
concern in this situation.
Sidelobe cancellers and adaptive arrays can be effectively evaluated only by testing
on an antenna range or in conjunction with field measurements of detection range and
tracking accuracy, with the simulatedjammer sources in the radar antenna far field. Thus,
the recommended approach to evaluating the ECM vulnerabilities of radars incorporatingthese techniques (test no. 8.2) Is to conduct tests as described above, using live targets,with simulated Jammers (or real Jammers, if available) located at diverse points in the farfield regions of the radars. The number ofJammer sources to be used in each case shouldequal the number called out in the radar performance specification, since cancellation
performance and other radar performance measures (e.g. tracking accuracies) are
dependent upon the number ofjammers (and number of canceller loops employed). Noise
Qanmer) sources are usually preferred for these tests, since the threat of concern is of the
standoff type.
2.6.9 Testing Vulnerability of Radars to Interception and Location(Test 8.4)
Past radar test and evaluation programs have concentrated on performance of the
radar in target detection, tracking, or imaging, with and without interference from clutter.
ECM. and other signals. New emphasis on vulnerability of radar signals to intercept andlocation, including homing by ARM seekers, requires the development of new test methods
and facilities.
2.6.9.1 Vulnerability of Conventional Radars
Conventional radars may be defined, with respect to intercept of their signals, as
radars in which pulse widths in the order of 0.1 to 100 I s are transmitted, with or withoutpulse compression modulations. Such radars, used for battlefield reconnaissance.intrusion detection, navigation, air defense, and hostile weapon location have long been
the target of intercept and warning receivers, and more recently of anti-radiation missles(ARMs). Their vulnerability to these EW devices results from the relatively large two-way
path loss involved in the basic radar-target geometrical situation, as cumpared with theone-way loss for the intercept receiver.
The one way advantage for an intercept receiver located on the target, compared with
the radar can be written 11. p. 12]:
51
S, A, 4IIR2
Q =s'=; a
where S, is the signal power available to the intercept receiver, S Is the signal poweravailable to the radar receiver. A, Is the effective aperture area of the intercept system
antenna. A is the effective area of the radar antenna, R is the target range and a is the
target cross section.
In a typical case, R =30 kIn. a=1.0 2 , A 1.0 mn2. and Q = 10=90 dB. This means
that the intercept receiver can afford to operate over an entire radar band (e.g., B = 1 GHz)
or even over an octave band (e.g., 8 to 16 GHz) with severe mismatch to the radar transmittedsignal, while retaining high probability of intercept of the radar signal.
2.6.9.2 Vulnerability of LPI Radars
Some modem radars are designed to use special frequencies, waveforms, low-sidelobeantenna patterns, and operational procedures to reduce the vulnerability to intercept.Such radars are described as 'low probability of intercept" (LPI) radars. Options in the
design of these radars include the following:
(a) Reduced average power, or "power management";(b Reduced peak power (e.g., CW or modulated CW};(c) Wide signal spectra (e.g.. wideband modulation, frequency hopping);(d) Low transmitting antenna sidelobes;(e) sporadic tranission;() Selection of frequencies in densely occupied bands;(g) Selection of frequency and waveform to simulate communicate signals;(h) Selection of frequencies in atmospheric absorption bands.
2.6.9.3 Evaluation Requirements
The process of evaluating vulnerability to interception of both conventional and LPI
radars is closely related to the evaluation of the intercept receivers. Indeed, many LPIradar analyses depend, for low vulnerability, on postulation of intercept receiver charac-teristics which are most Ideally mismatched to the radar signal. In the absence of a setof standard intercept receiver characteristics, against which to evaluate a radar, any radarwith any waveform can be claimed to have "LPr properties.
An initial step in evaluation Is then to establish the intercept receiver threat modelsagainst which the radar is to be evaluated, whether by analysis, computer simulation.closed-loop (indoor) test. or field test. The definition of these models must be done by aDOD organization familiar with the existing intercept receiver technology and with future
52
trends and forecasts in this technology and its probable deployment. Different models are
needed for strategic reconnaissance, tactical reconnaissance, radar warning receivers,
look-through receivers of ECM systems, and ARM seekers.
2.6.9.4 Electromagnetic Environment
Most LPI approaches are valid only in dense signal environments, where the intercept
receiver Is. in effect. Jammed by a multiplicity of irrelevant signals. Evaluation of radar
vulnerability to intercept depends on the production, at the intercept receiver, of a realistic
suite of such interfering signals. Again, models for this environment are best produced
by those organizations which deal with complex EW scenarios.
2.6.9.5 Physical Environment
The vulnerability of the radar to signal intercept depends, in many cases, on the
physical surroundings of the radar. Factors include the following:
(a) Atmospheric and weather attenuation of the signal;(b) Scattering of the signal by terrain or cultural features;(c) Scattering of the signal by rain or chaff(d) Masking by terrain.
For example, if low-sidelobe antenna features are depended upon to prevent the signal
from reaching the intercept receiver, scattering from sources within the main beam canprovide an unwanted path to the receiver. The accuracy of location in this case may not
be adequate for the intercept system (e.g., ARM seeker), but the receiver may be cued tothe correct frequency and waveform by the scattered signal.
Models are available for analysis and simulation of these environmental effects, but
field testing may be necessary to validate the models.
2.6.9.6 Test and Evaluation Facilities
To a large extent, the facilities required for evaluation of intercept vulnerability are
available as by-products of exdsting EW test programs. For example, at AEPG there aremany types of ESM equipment, either under evaluation or in use as support equipment,r other programs. The EMETF is equipped with advanced "stress loading" simulations
to produce EM environments according to standardized scenarios for different mlltary
situations. While this equipment has been designed to test Intercept receivers, commu-nications receivers, and radar receivers, It can also serve as the background environment
53
for evaluation of vulnerability of the conventional or LPI radar system to intercept of itssignals. Antenna test facilities, suitable for many varieties of radar antenna are installedat AEPG.
The additional facilities needed for complete evaluation of LPI radar systems includethe following:
(a) Special LPI waveform generators to simulate the signals from certainnew radar designs. in closed-loop tests:
(b) Antenna pattern generators to simulate the low sidelobes of newantenna designs. in sectors far from the main lobe;
(c) Multipath scattering models to simulate the effects of a number ofstandard terrain situations and radar siting options:
(d) Field test sites, chosen to represent these terrain situations, tovalidate the simulations and closed-loop test results on vulnerabilityto intercept;
(e) Generic airborne intercept and seeker receivers, to be used in thefield tests to validate the indoor test results and to provide data onlocation and homing accuracy (not readily obtained through simulationand closed-loop testing);
(i Field environment signal generators, to amplify and radiate the EMenvironment of the closed-loop models toward the airborne receiversduring field tests Involving the actual radar equipment.
2.6.10 Target Discrimination (Test 9.1)
Future radars may incorporate techniques for separating different types of targets forthe purposes of classifying or Identifying them and establishing threat situations. Thesetechniques typically exploit unique phase or amplitude modulation effects of given targettypes or extremely high range resolution.
The preferred method for evaluating these classification techniques is with live targetsof the types of Interest, including both the types to be recognized and types which representpossible false recognition. These tests would be conducted in the same manner as thedetection range measurement tests, with the evaluation criteria based on the target dis-crimination or classification specification.
54
Section 2.5.3.9 describes an alternate approach for this test, where simulation or
recorded target signals would be used when live targets are not available. Another pos-
sibility is to conduct the field tests with those targets that are available and augment thesetests with recorded target signals if they are available to cover the cases where live targets
cannot be obtained.
2.6.11 Airborne Radar Special Requirements (Tests 10.1 and 10.2)
The normal operating conditions for airborne radars clearly establish some specialrequirements for conducting field tests, since field conditions include in-flight operation.
However, many field tests can be run on the ground and should be done in this mannerin order to avoid undue expense of flight operations.
Essentially, all of the above closed-loop and field tests can be conducted on the ground,
with the radar preferably located on a high mount, such as a rooftop or at the edge of acliff. Thus, ground effects (e.g. multipath propogation and clutter) are more like thosewhen the radar is airborne at low altitude.
The SCV measurements effected in a rooftop environment represent the Inherentcapabilities of the radar above and must be interpreted In the light of typical flight con-ditions. For example, SCV in flight is reduced from the inherent measure above as a resultof clutter spectral spreading due to aircraft motion and imperfect own slip velocitycompen..ation by the Inertial measurement unit (IMU}. However, the rooftop measurementis an important benchmark. and, for a given set of radar characteristics (including velocityresponse), only the velocity compensation subsystem will contribute to SCV deteriorationbelow that which can be analytically derived from the above benchmark measurementsand the radar chajacteVistics.
Airborne (flight) tests (Test 10.1) should be conducted under representative clutterconditions with live targets to obtain qualitative and semi-quanitative (knowing the typeof clutter and approximate moving target cross section) measurements. These observationsand test results can then be compared with the expected performance measures derivedfrom the benchmark tests.
Of particular interest are the cases of airborne mapping radars, such as might bedeployed on RPVs. For these radars, non-coherent mapping can be evaluated by flyingover representative target areas and recording maps with whatev-r recording equipmentis contained within the system or with additional recording equipment (Test 10.2). Mapfidelity and accuracy can be evaluated at Fort Huachuca by mapping the Radar GeometricFidelity Facility, or "Dry Lake" facility.
55
Synthetic Aperture radars (SAR) can only be fully tested for map quality, resolution,
and accuracy by flight testing. The mapping and recording procedures apply here, as well
but the scenes selected should provide the opportunity to observe and measure the finest
resolutions specified. The Fort Huachuca Radar Spoke/Resolution Facility is an excellent
subject for these tests. The InstrumentedTest Range facilities can also be used to determinethe precise locations of the test aircraft for overall mapping system accuracy measure-
ments.
2.7 Radar System Examples
In order to make more specific the generic test procedures described in Sections 2.4- 2.6, five typical sets of radar characteristics are given in this section, and test proceduresfor these radars are described in greater detail. The radars include examples from thethree major types which may require testing at AEPG:
* Weapon location radars,
* Short-range air defense search radar," RPV-based battlefield surveillance radars.
2.7.1 Weapon Location Radars
Two types of radar for weapon location are used as examples:
* Artillery location radar (Table 2.7.1)* Mortar location radar (Table 2.7.2)
The two systems differ in that greater range and sensitivity are required for artillery location.Location accuracy Is the same for the two systems.
56
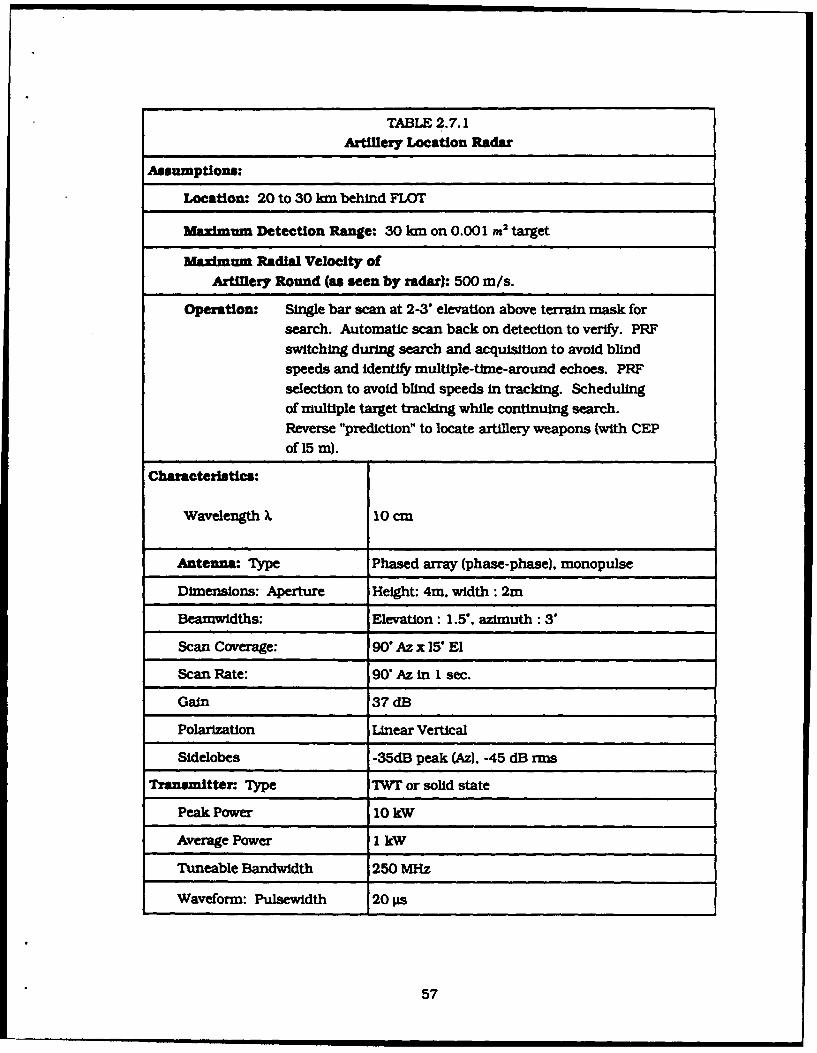
TABLE 2.7.1
Artillery Location Radar
Assumptions:
Location: 20 to 30 km behind FLOT
Maximum Detection Range: 30 km on 0.001 m2 target
Maximum Radial Velocity ofArtillery Round (as seen by radar): 500 m/s.
Operation: Single bar scan at 2-3" elevation above terrain mask forsearch. Automatic scan back on detection to verify. PRFswitching during search and acquisition to avoid blindspeeds and identify multiple-time-around echoes. PRFselection to avoid blind speeds in tracking. Schedulingof multiple target tracking while continuing search.Reverse "prediction" to locate artillery weapons (with CEPof 15 m).
Characteristics:
Wavelength . 10 cm
Antenna: Type Phased array (phase-phase). monopulse
Dimensions: Aperture Height: 4m, width: 2m
Beamwidths: Elevation: 1.5', azimuth: T
Scan Coverage: 90" Az x 15 El
Scan Rate: 90 Az in 1 sec.
Gain 37 dB
Polarization Linear Vertical
Sidelobes -35dB peak (Az), -45 dB rms
Transmitter. Type TWT or solid state
Peak Power 10 kW
Average Power 1 kW
Tuneable Bandwidth 250 MHz
Waveform: Pulsewidth 20 ps
57
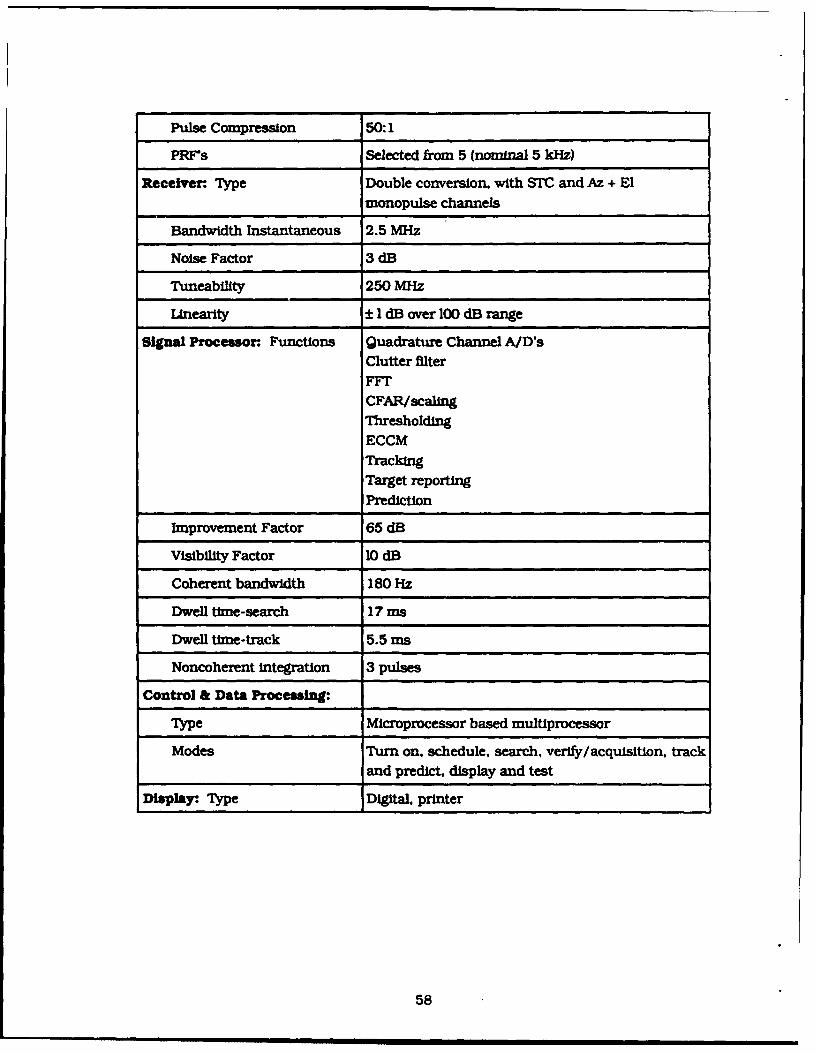
Pulse Compression 50:1
PRF's Selected from 5 (nominal 5 kHz)
Receiver. Type Double conversion, with SMC and Az + Elmonopulse channels
Bandwidth Instantaneous 2.5 Miz
Noise Factor 3 dB
Tuneability 250 MHz
Unearity ± I dB over 100 dB range
Signal Processor. Functions Quadrature Channel A/D'sClutter filter
FFCFAR/scalingThresholding
ECCMTrackingTarget reportingPrediction
Improvement Factor 65 dB
Visibility Factor 10 dB
Coherent bandwidth 180 Hz
Dwell ttme-search 17 ms
Dwell time-track 5.5 ms
Noncoherent integration 3 pulses
Control & Data Processing:
Type Microprocessor based multiprocessor
Modes Turn on. schedule, search, verify/acquisition, trackand predict, display and test
DIsplay Type Digital, printer
58
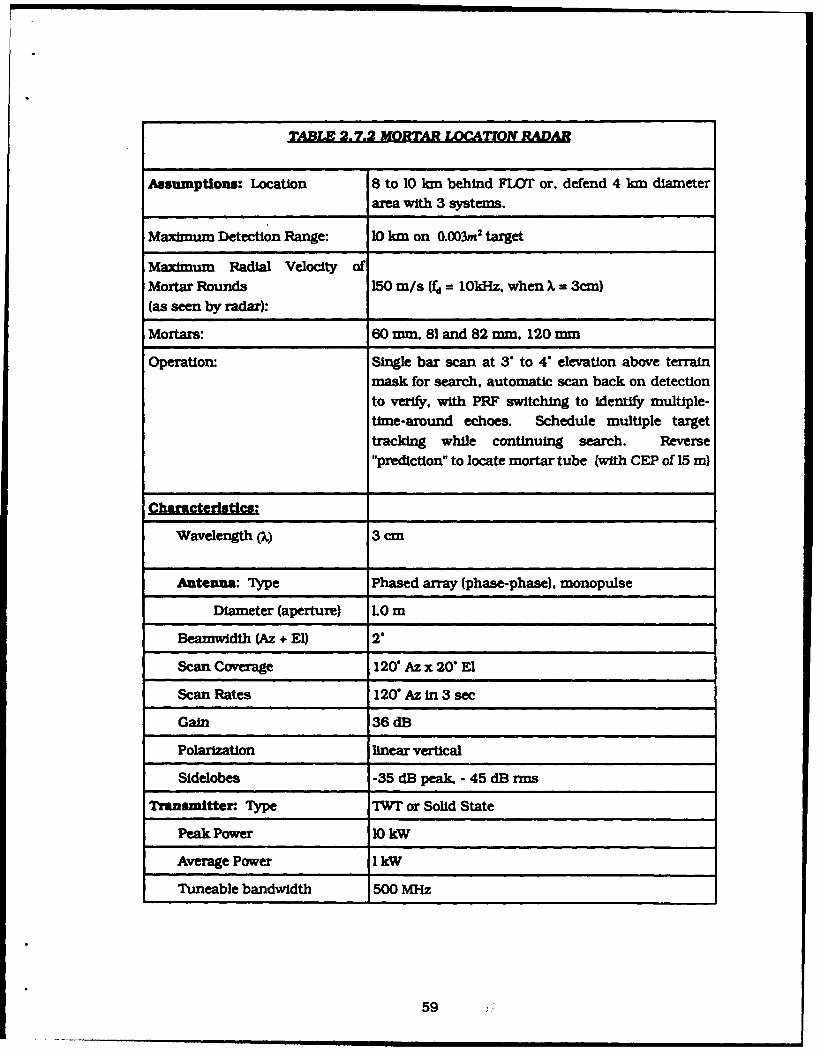
TAB&L 2.7.2 MORTAR LOAQTON RADAR
Assumptions: Location 8 to 10 1 m behind FLOT or, defend 4 km diameterarea with 3 systems.
Maximum Detection Range: 10 km on 0.003m 2 target
Maxdmum Radial Velocity ofMortar Rounds 150 m/s (fd = 10kHz. when X = 3cm)(as seen by radar):
Mortars: 60 mm. 81 and 82 mm. 120 mm
Operation: Single bar scan at 3' to 4' elevation above terrainmask for search, automatic scan back on detection
to verify, with PRF switching to Identify multiple-time-around echoes. Schedule multiple targettracking while continuing search. Reverse"prediction" to locate mortar tube (with CEP of 15 m)
Characteristics:
Wavelength (X) 3 cm
Antenna: Type Phased array (phase-phase), monopulse
Diameter (aperture) LO m
Beamwldth (Az + El) 2"
Scan Coverage 120" Az x 20" El
Scan Rates 120" Az In 3 sec
Gain 36 dB
Polarization linear vertical
Sidelobes -35 dB peak. - 45 dB rms
Transmitter:. Type TWT or Solid State
Peak Power 10 kW
Average Power I kW
Tuneable bandwidth 500 MHz
59 -
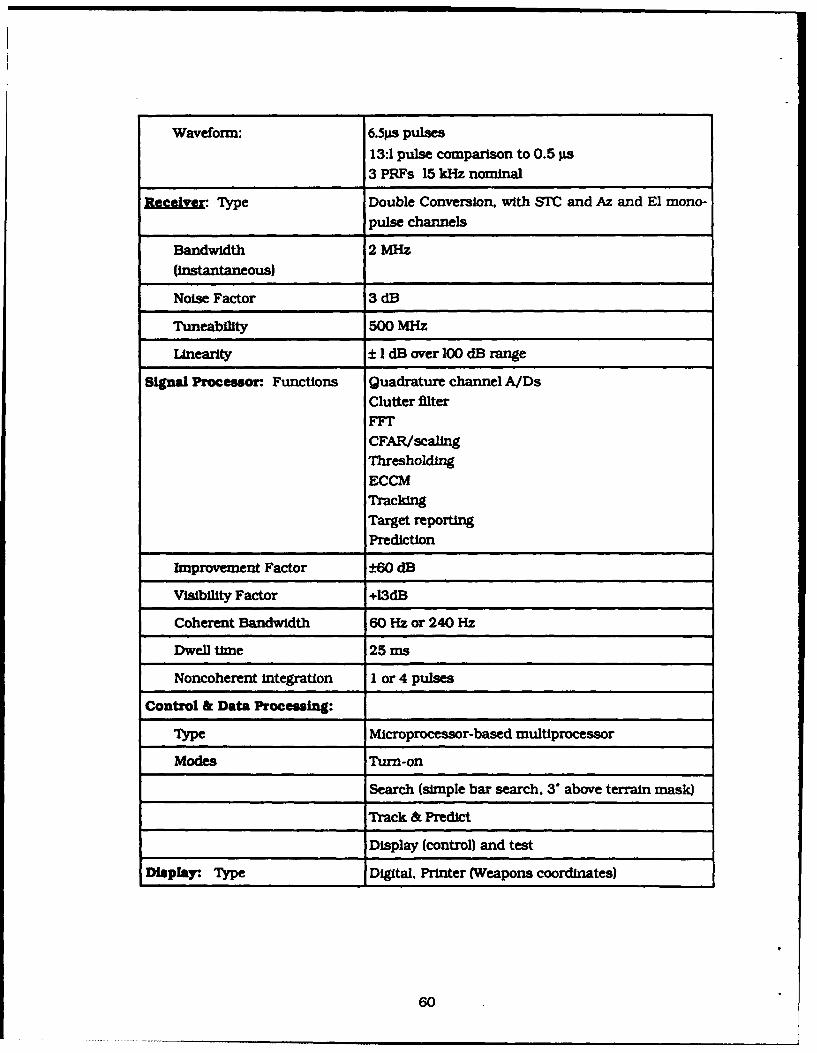
Waveform: 6.5ps pulses
13:1 pulse comparison to 0.5 ps3 PRFs 15 kHz nominal
Receive Type Double Conversion, with STC and Az and El mono-
pulse channels
Bandwidth 2 MHz
(instantaneous)
Noise Factor 3 dB
Tuneabflity 500 MHz
Unearity ± I dB over 100 dB range
Signal Processor. Functions Quadrature channel A/Ds
Clutter filterFFT
CFAR/scalingThresholdingECCMTracking
Target reportingPrediction
Improvement Factor ±60 dB
Visibility Factor +13dB
Coherent Bandwidth 60 Hz or 240 Hz
Dwell time 25 ms
Noncoherent Integration I or 4 pulses
Control & Data Processing:
Type Microprocessor-based multiprocessor
Modes Turn-on
Search (simple bar search. 3" above terrain mask)
Track & Predict
Display (control) and test
Display: Type Digital. Printer (Weapons coordinates)
60
2.7.2 Search/Acquisition Radar for Short-Range Air Defense
This radar is typical of systems which may be required to support short-range missle
systems using radar or electro-optical guidance. The range is sufficient to detect threats,
to form track flies in the associated computer, and to designate these threats to the
appropriate mIssle tinit.
61
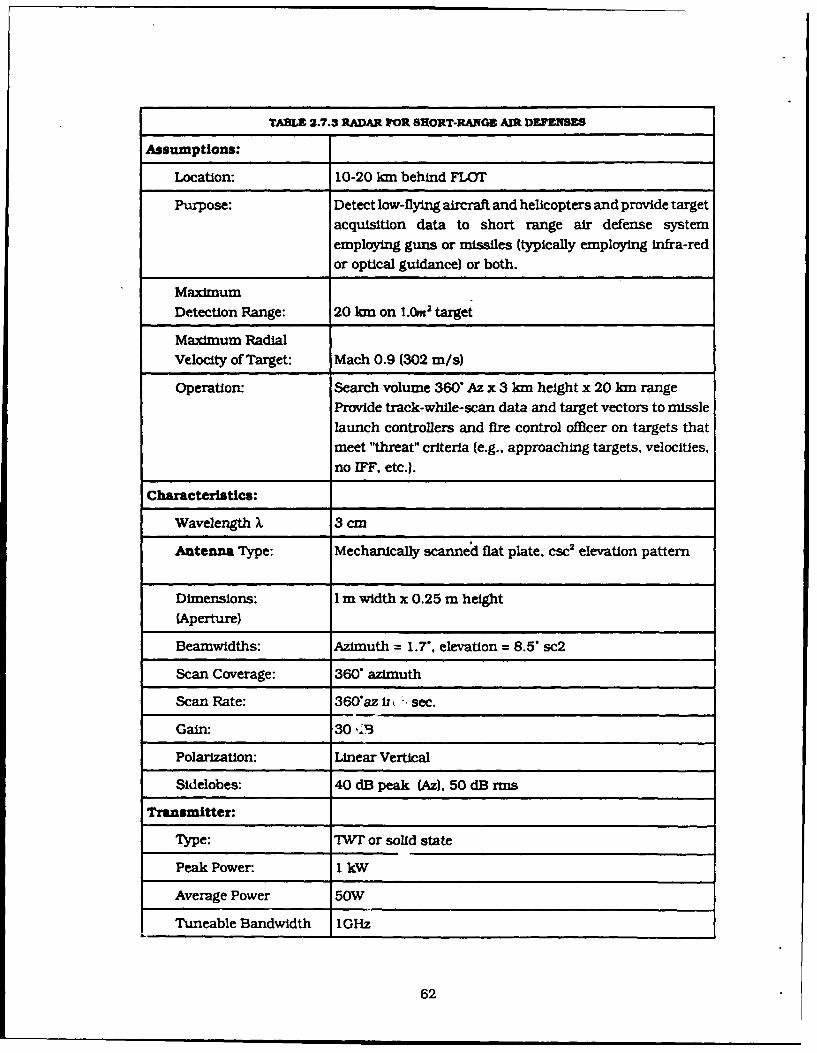
TABLE 2.7.3 RADAR FOR SHORT-RANGE AIR DEFENSES
Assumptions:
Location: 10-20 kIn behind FLOT
Purpose: Detect low-flying aircraft and helicopters and provide target
acquisition data to short range air defense system
employing guns or missiles (typically employing Infra-red
or optical guidance) or both.
Maximum
Detection Range: 20 km on l.0m 2 target
Maximum RadialVelocity of Target: Mach 0.9 (302 m/s)
Operation: Search volume 360 Az x 3 kin height x 20 km range
Provide track-while-scan data and target vectors to missle
launch controllers and fire control officer on targets that
meet "threat" criteria (e.g., approaching targets, velocities,
no IFF, etc.).
Characteristics:
Wavelength . 3 cm
Antenna Type: Mechanically scanned flat plate, csc 2 elevation pattern
Dimensions: 1 m width x 0.25 m height
(Aperture)
Beamwidths: Azimuth = 1.7, elevation = 8.5" sc2
Scan Coverage: 360" azimuth
Scan Rate: 360"az 11 ( sec.
Gain: 30 ,3
Polarization: Linear Vertical
Sidelobes: 40 dB peak (Az), 50 dB rms
Transmitter:
Tyrpe: 7W? or solid state
Peak Power: 1 kW
Average Power 50W
Tuneable Bandwidth 1GHz
62
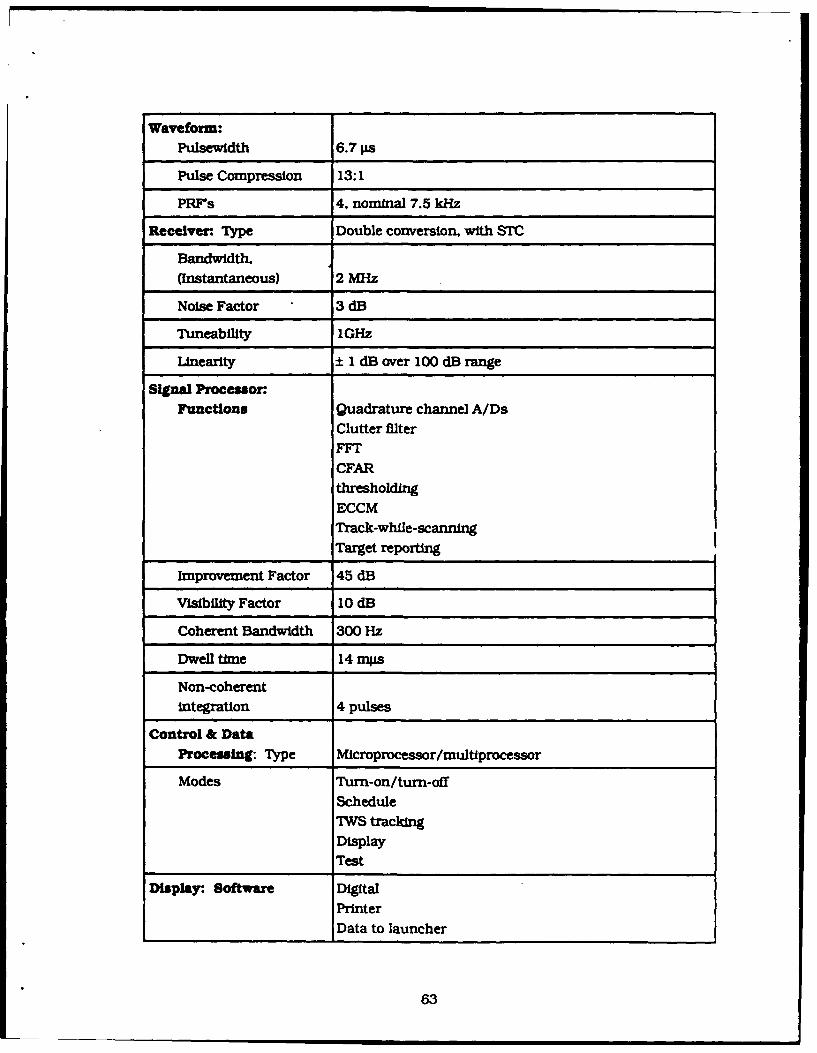
Waveform:Pulsewldth 6.7 pas
Pulse Compression 13:1
PRFs 4. nominal 7.5 kHz
Receiver. Type Double conversion, with STC
Bandwidth.(Instantaneous) 2 MHz
Noise Factor 3 dB
Tuneabillty IGHz
Linearity ± 1 dB over 100 dB range
Signal Processor.Functions Quadrature channel A/Ds
Clutter filterFFTCFARthresholdingECCMTrack-while-scanningTarget reporting
Improvement Factor 45 dB
Visibility Factor 10 dB
Coherent Bandwidth 300 Hz
Dwell time 14 mps
Non-coherentintegration 4 pulses
Control & DataProcessing: Type Microprocessor/multiprocessor
Modes Turn-on/turn-offScheduleTWS trackingDisplayTest
Display: Software DigitalPrinterData to launcher
63
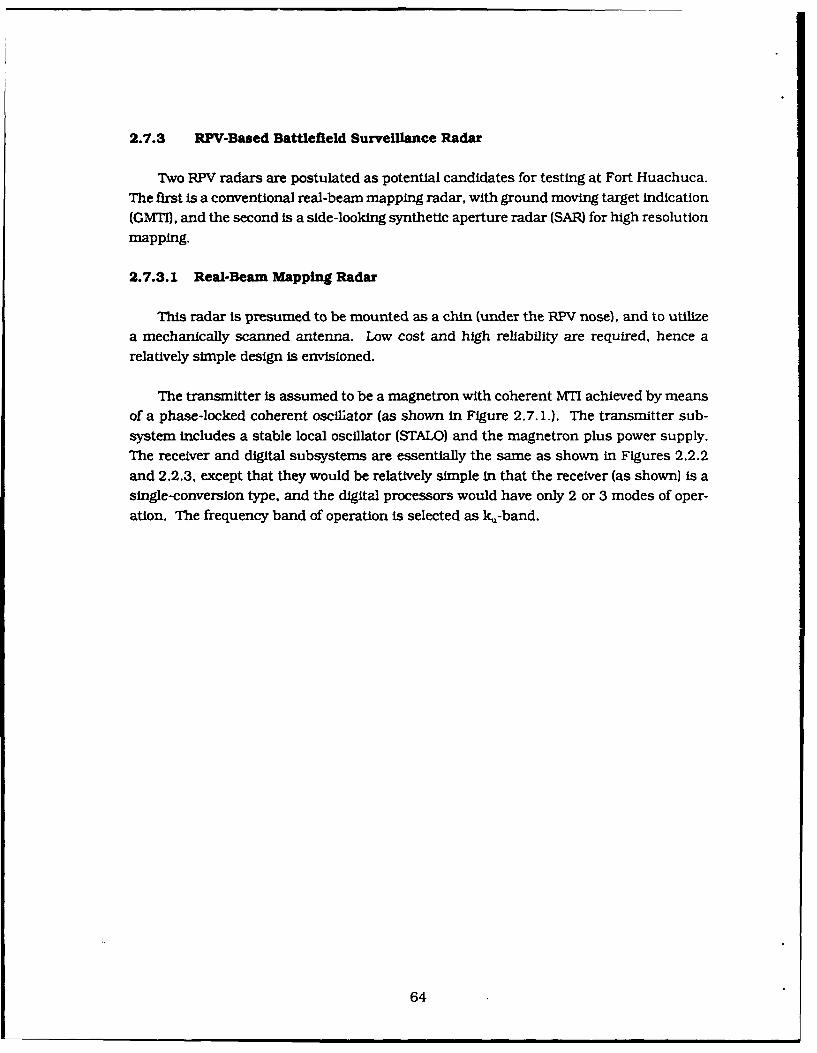
2.7.3 RPV-Based Battlefield Surveillance Radar
Two RPV radars are postulated as potential candidates for testing at Fort Huachuca.
The first is a conventional real-beam mapping radar, with ground moving target indication
(GMTI). and the second is a side-looking synthetic aperture radar (SA) for high resolution
mapping.
2.7.3.1 Real-Beam Mapping Radar
This radar is presumed to be mounted as a chin (under the RPV nose), and to utilize
a mechanically scanned antenna. Low cost and high reliability are required, hence a
relatively simple design is envisioned.
The transmitter Is assumed to be a magnetron with coherent MTI achieved by means
of a phase-locked coherent oscillator (as shown in Figure 2.7.1.). The transmitter sub-
system includes a stable local oscillator (STALO) and the magnetron plus power supply.
The receiver and digital subsystems are essentially the same as shown in Figures 2.2.2
and 2.2.3, except that they would be relatively simple in that the receiver (as shown) is a
single-conversion type, and the digital processors would have only 2 or 3 modes of oper-
ation. The frequency band of operation is selected as ku-band.
64
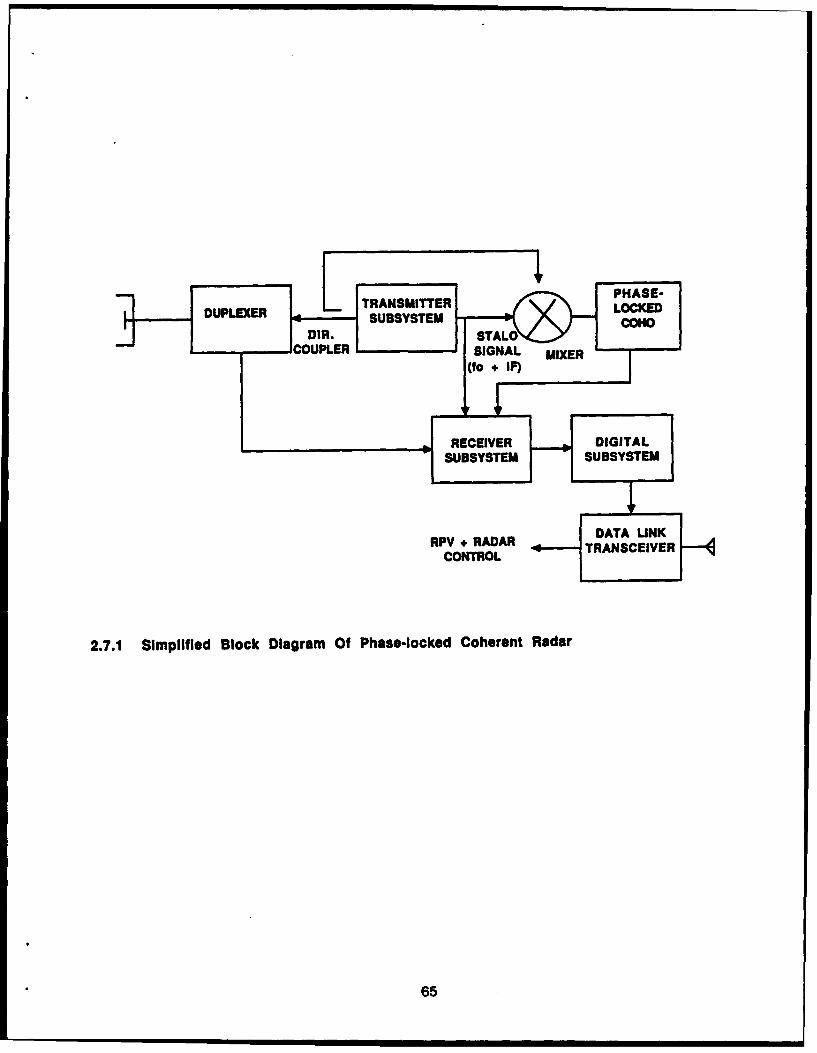
DUPLEXE L TRANSMITTER LCE
DIR. .RAALRNCIECOUPLER SCONTRL MIE
2.7. Simlif~d Sock iagrm O Phae-lokedCtohrn Radar
65G
On board digital control and signal processing is incorporated In the radar, with mapdata and moving target data transmitted to the ground by means of a microwave datatransmission link. A ground station would receive the latter transmissions and displaythe maps as well as to track and display moving target reports. The RPV and the radar(turn on, turn off, etc.) would be controlled from the ground station. The RPV wouldtypically operate In the altitude region of 1500 to 3000 m and would travel at speeds150-250 m/s. The maximum ranges of Interest would be about 15 km.
The characteristics of this radar are given in Table 2.7.4.
66
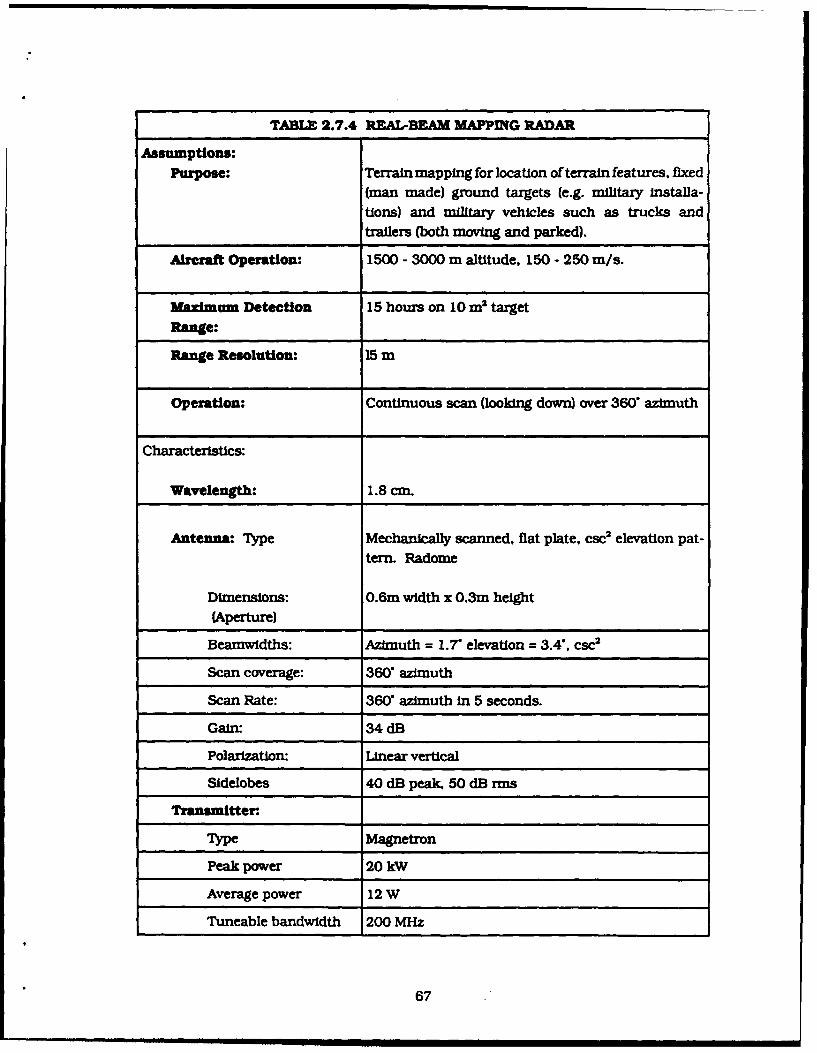
TABLE 2.7.4 REAL-BEAM MAPPING RADAR
Assumptions:Purpose: Terrain mapping for location of terrain features, fixed
(man made) ground targets (e.g. military Installa-tions) and military vehicles such as trucks andtrailers (both moving and parked).
Aircraft Operation: 1500 - 3000 m altitude, 150 - 250 m/s.
Mayimum Detection 15 hours on 10 m2 targetRange:
Range Resolution: 15 m
Operation: Continuous scan (looking down) over 360" azimuth
Characteristics:
Wavelength: 1.8 cm.
Antenna: Type Mechanically scanned, flat plate, csc2 elevation pat-tern. Radome
Dimensions: 0.6m width x 0.3m height(Aperture)
Beamwidths: Azimuth = 1.7 elevation = 3.4, csc2
Scan coverage: 360 azimuth
Scan Rate: 360" azimuth in 5 seconds.
Gain: 34 dB
Polarization: Linear vertical
Sidelobes 40 dB peak, 50 dB rms
Transmitter:
Type Magnetron
Peak power 20 kW
Average power 12 W
Tuneable bandwidth 200 MHz
67
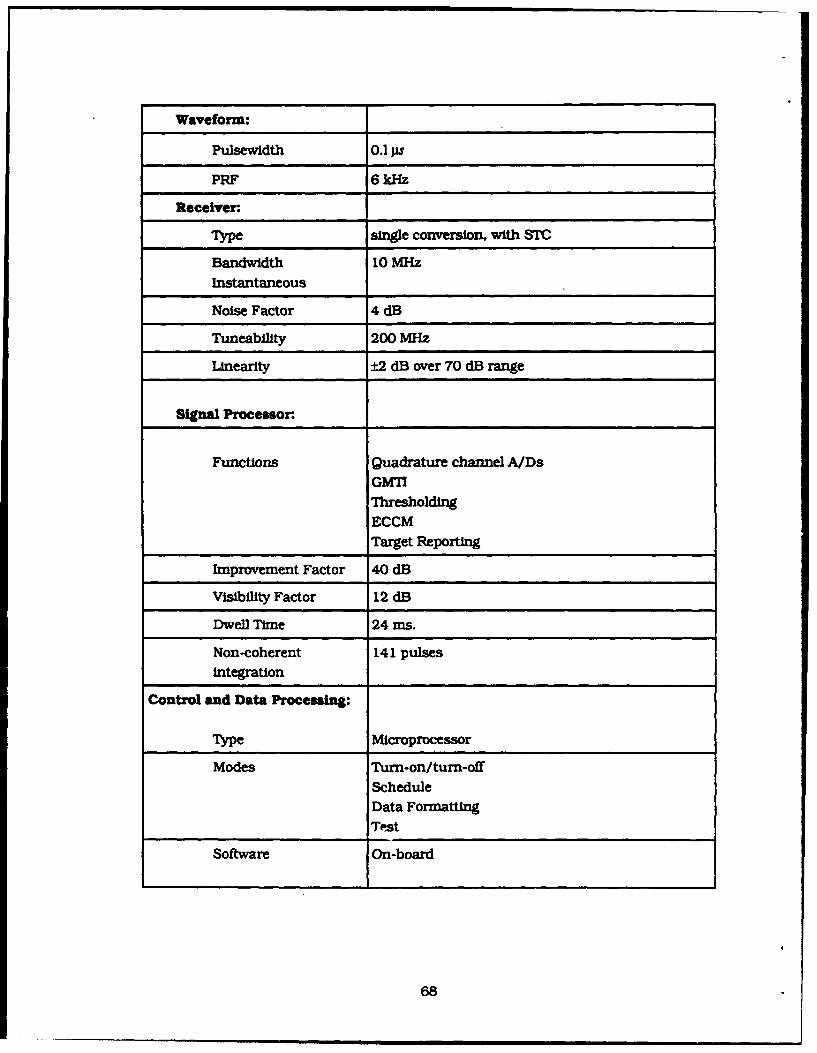
Waveform:
Pulsewidth 0.1 ILS
PRF 6 kHz
Receiver.
Type single conversion, with STO
Bandwidth 10 MI-IzInstantaneous
Noise Factor 4 dB
Tuneabllity 200 MHz
Lnearity ±2 dB over 70 dB range
Signal Processor.
Functions Quadrature channel A/DsGMT1
ThresholdingECCMTarget Reporting
Improvement Factor 40 dB
Visibility Factor 12 dB
Dwell TIme 24 ms.
Non-coherent 141 pulsesintegration
Control and Data Processing:
Type Microprocessor
Modes Turn-on/turn-offScheduleData FormattingTe'st
Software On-board
68
2.7.3.2 Synthetic Aperture Radar (BAR)
An example of a radar that provides high resolution mapping of the ground terrain isa battlefield surveillance radar mounted on a remote piloted vehicle (RPV). The purposeof this radar is to acquire high resolution Imagery of a battlefield area for the purposes ofdetecting armored vehicles, aircraft on runways, troop concentrations, etc. It Is usuallyrequired that the Imagery be calibrated in ground coordinates (i.e., latitude and longitude.or the equivalent) to allow accurate location of observed features.
A side-looking synthetic aperture radar (SAR) provides these functions. The radarantenna looks sideways, perpendicular to the flight path of the vehicle, illuminating aswath to the side of the flight path. High resolution in range is obtained through use ofa wideband transmitted signal waveform. High resolution in azimuth is obtained throughdoppler processing of the signals returned during a coherent dwell time. A number ofimages made sequentially with different radar frequencies are typically combined togethernon-coherently to improve the Image quality and to remove specular scintillation effects.
A significant aspect of a high resolution synthetic aperture radar is the need for motioncompensation. Deviations of the flight of the aircraft from a straight line path will lead tovariations in the radar line-of-sight path length. These variations, if not compensated,will induce phase errors that degrade the image resolution. Compensation requires aninertial measurement unit on the vehicle to monitor the vehicle motion and to sense the
departure from straight line motion. The outputs of this Inertial measurement unit arethen utilized by the radar control processor to compute phase shift commands to be appliedin the signal processor to compensate for the non-ideal motion.
The data provided by the inertial measurement unit also allow the flight path of thevehicle in ground coordinates to be monitored. This, in connection with the radar mea-surements, permits calibration of the ground coordinates of the Imagery.
In Table 2.7.5, the characteristics of a typical high resolution SAR radar are sum-marized. This radar provides a resolution of I meter for imaging out 20 kIn from the flightpath. It utilizes a circular flat plate antenna 0.3 meters In diameter mounted on the sideof the RPV. It requires only modest power (25 watts average) to provide high S/N on verylow reflectivity terrain such as runways, highways, etc.
The resulting imagery can be either stored on board the vehicle for later retr4val whenthe RPV returns to its base, or can be relayed back to the base by a microwave commu-nication link, for example.
69
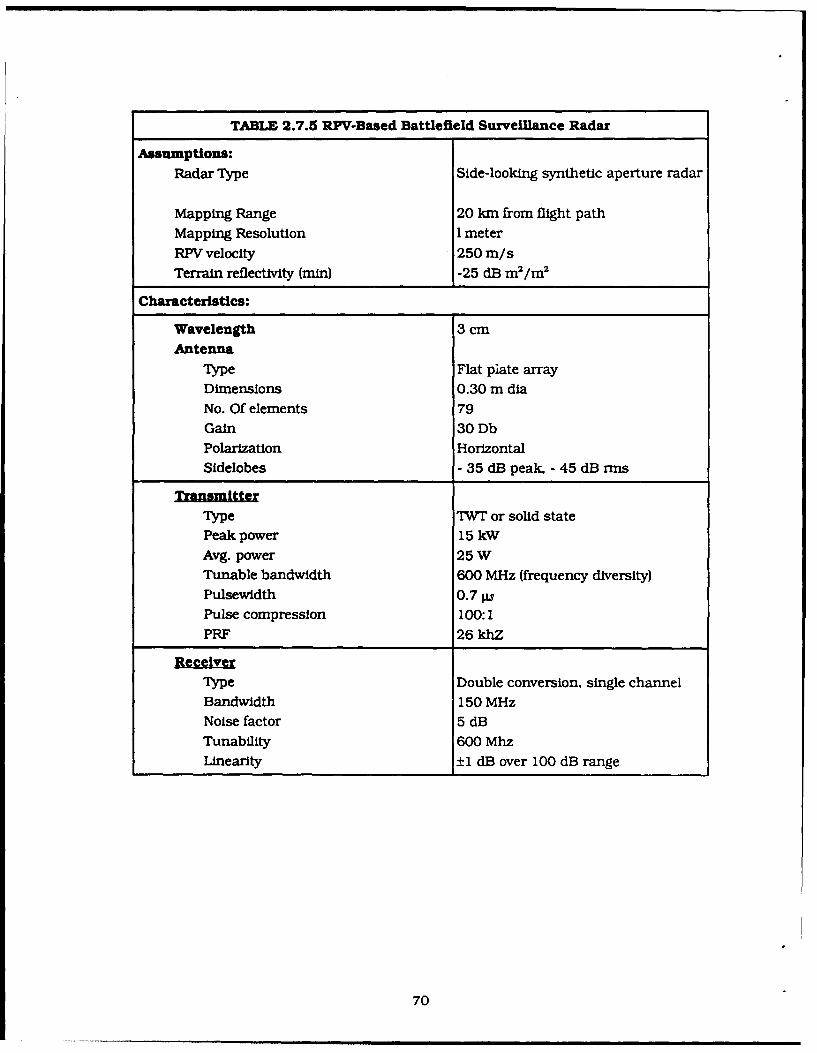
TABLE 2.7.5 RPV-Based Battlefield Surveillance Radar
Assumptions:
Radar Type Side-looking synthetic aperture radar
Mapping Range 20 km from flight path
Mapping Resolution 1 meter
RPV velocity 250 m/s
Terrain reflectivity (min) -25 dB m2 /m 2
Characteristics:
Wavelength 3 cm
Antenna
Type Flat piate array
Dimensions 0.30 m dia
No. Of elements 79
Gain 30 Db
Polarization Horizontal
Sidelobes - 35 dB peak, - 45 dB rms
Trasmtter
Type TWI' or solid statePeak power 15 kW
Avg. power 25 W
Tunable bandwidth 600 MHz (frequency diversity)
Pulsewidth 0.7 W
Pulse compression 100:1PRF 26 khZ
Receiver
Type Double conversion, single channel
Bandwidth 150 MHz
Noise factor 5 dB
Tunability 600 Mhz
Linearity ±1 dB over 100 dB range
70
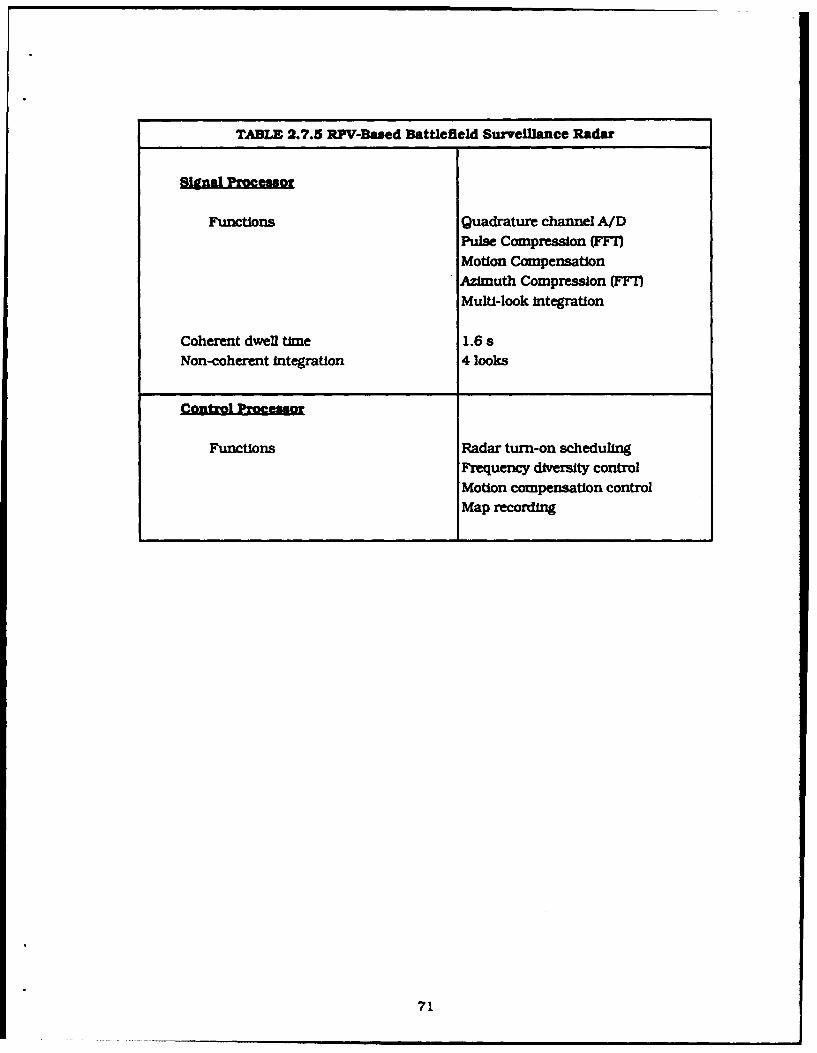
TABLE 2.7.5 RPV-Based Battlefield Surveillance Radar
Functions Quadrature channel A/DPulse Compression (FF1Motion CompensationAmuth Compression (FF21
Multi-look Integration
Coherent dwell time 1.6 sNon-coherent integration 4 looks
Cotrl Poeso
Functions Radar turn-on schedulingFrequency diversity controlMotion compensation controlMap recording
71

2.8 Test Procedures for Example Radars
This section describes test procedures for testing the artillery locator radar and theRPV-based SAR described above. Test procedures for vulnerability to intercept and radar
accuracy measurement are also described.
2.8.1 Test Procedures for Artillery Locator Radar
This radar has been chosen as an example for describing a representative test planand the pertinent test procedures and required facilities. The selection is based upon the
fact that this radar is representative of a sophisticated digitally-controlled multi-moderadar incorporating an electronically-scanned-array, pulse-doppler waveforms, pro-
grammable digital signal processing, and programmable data processing and display. Itis the most complex of the example radars described above, and the test procedures andfacilities required will suffice for testing of the other example radars. Exceptions to thelatter statement would of course, include the flight testing of the airborne radars. Theseexceptions are covered in Section 2.6.1. 1.
Fig. 2.8.1 shows the typical flow of a radar system-level test program. The closed
loop tests are selected to be accomplished first (unless facility unavailability dictates dif-ferent scheduling) to allow test personnel to become thoroughly familiar with the majorsubsystems and their operation one step at a time. These tests are shown to be done inparallel, the radar may not break down physically to allow the antenna to be at the patternrange, while the closed-loop tests proceed at other test sites (e.g. the EMC testing facility).In the latter case, the complete radar may have to be moved from site to site to conductthe various tests.
72
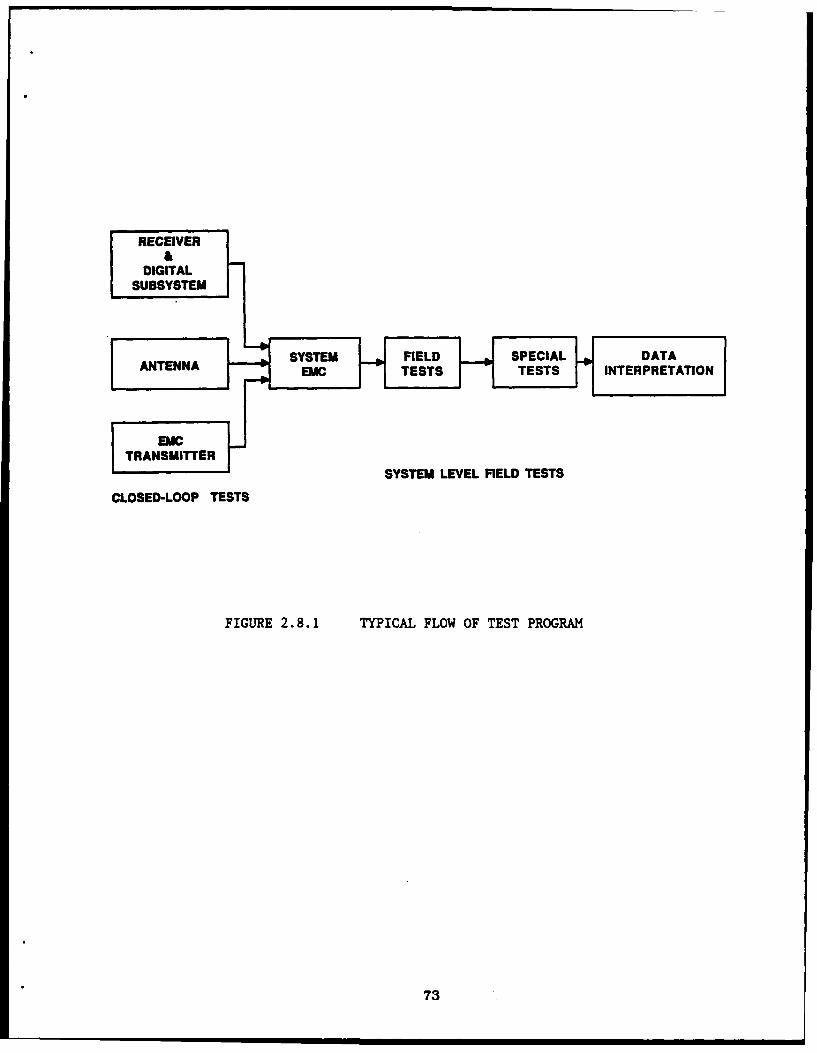
LRECEIVERa
DIGITALSUBSYSTEM
(ANTENNA SSFEDSEILDT
[TRA~~ERSYSTEM LEVEL FIELD TESTS
CLOSED-LOOP TESTS
FIGURE 2.8.1 TYPICAL FLOW OF TEST PROGRAM
73
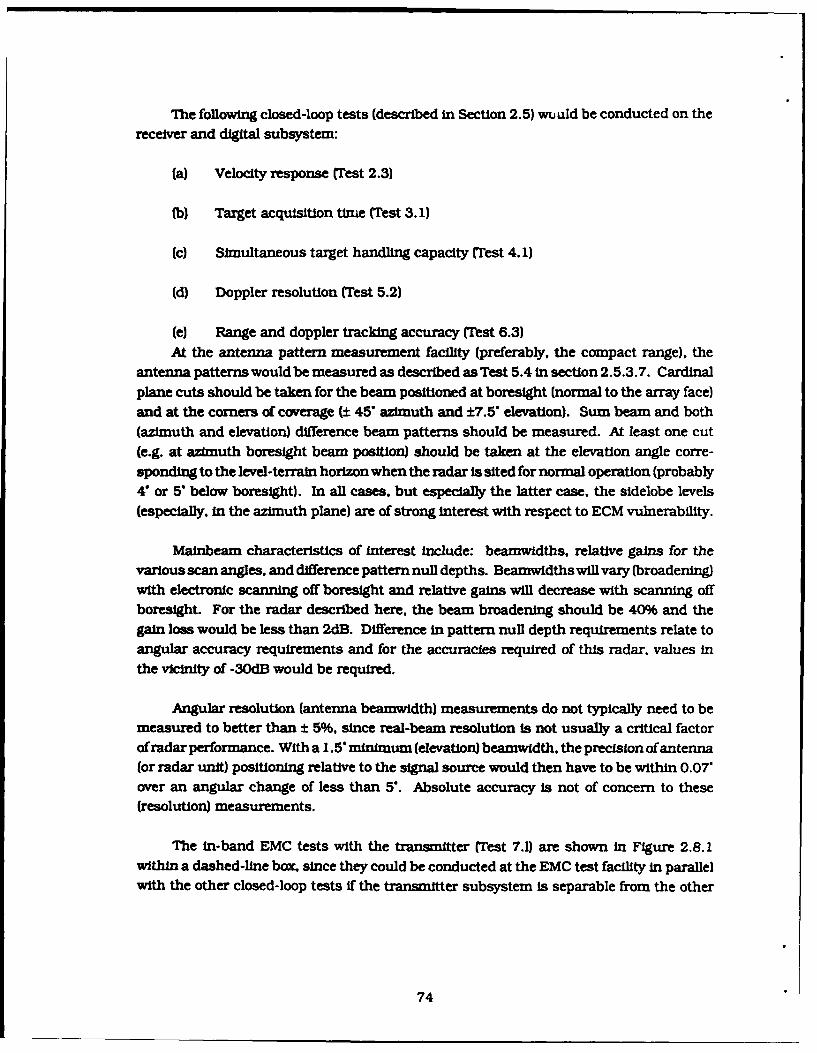
The following closed-loop tests (described in Section 2.5) wuuld be conducted on thereceiver and digital subsystem:
(a) Velocity response fTest 2.3)
(b) Target acquisition time (Test 3.1)
(c) Simultaneous target handling capacity (Test 4.1)
(d) Doppler resolution (Test 5.2)
(e) Range and doppler tracking accuracy (Test 6.3)At the antenna pattern measurement facility (preferably, the compact range), the
antenna patterns would be measured as described as Test 5.4 in section 2.5.3.7. Cardinalplane cuts should be taken for the beam positioned at boresight (normal to the array face)and at the corners of coverage (± 45" azimuth and ±7.5" elevation). Sum beam and both(azimuth and elevation) difference beam patterns should be measured. At least one cut(e.g. at azimuth boresight beam position) should be taken at the elevation angle corre-sponding to the level-terrain horizon when the radar is sited for normal operation (probably4" or 5" below boresight). In all cases, but especially the latter case, the sidelobe levels(especially. In the azimuth plane) are of strong interest with respect to ECM vulnerability.
Mainbeam characteristics of interest include: beamwidths, relative gains for thevarious scan angles, and difference pattern null depths. Beamwdths will vary (broadening)with electronic scanning off boresight and relative gains will decrease with scanning offboresight. For the radar described here, the beam broadening should be 40% and thegain loss would be less than 2dB. Difference in pattern null depth requirements relate toangular accuracy requirements and for the accuracies required of this radar, values in
the vicinity of -30dB would be required.
Angular resolution (antenna beamwidth) measurements do not typically need to bemeasured to better than ± 5%, since real-beam resolution is not usually a critical factorofradar performance. With a 1.5' minimum (elevation) beamwidth, the precision of antenna(or radar unit) positioning relative to the signal source would then have to be within 0.07'over an angular change of less than 5". Absolute accuracy is not of concern to these(resolution) measurements.
The In-band EMC tests with the transmitter (Test 7.1) are shown In Figure 2.8.1within a dashed-line box, since they could be conducted at the EMC test facility in parallelwith the other closed-loop tests if the transmitter subsystem is separable from the other
74
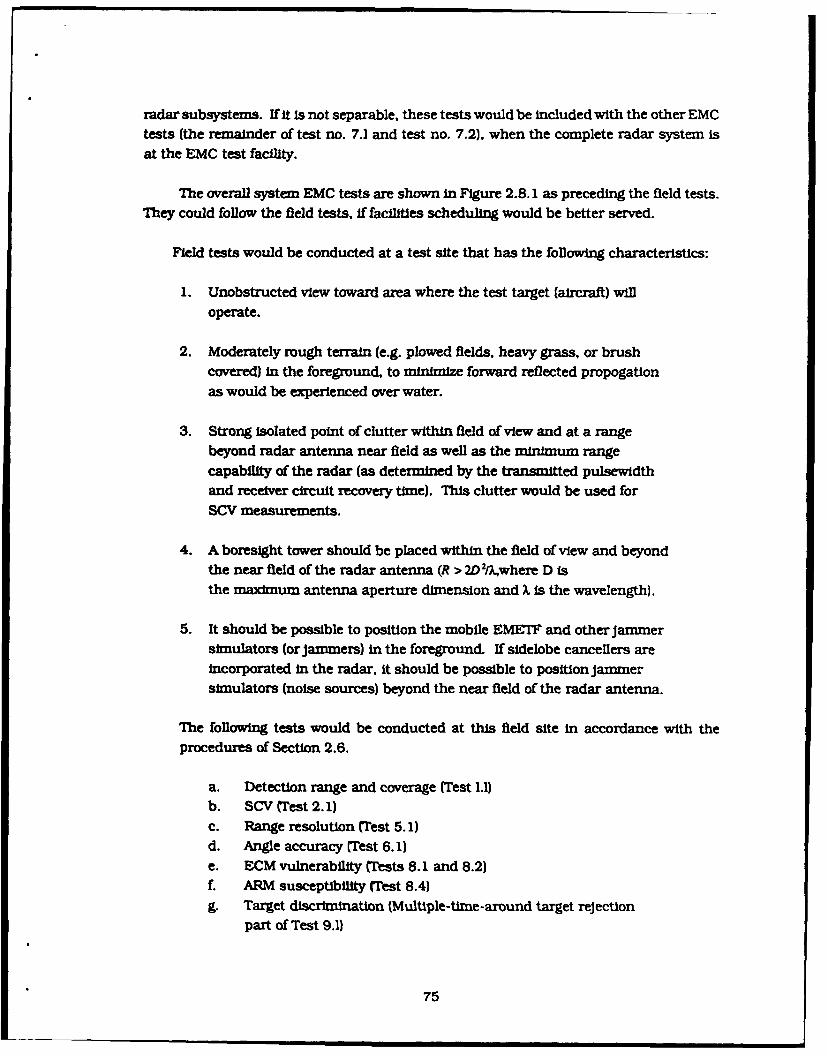
radar subsystems. If it is not separable, these tests would be included with the other EMCtests (the remainder of test no. 7.1 and test no. 7.2). when the complete radar system isat the EMC test facility.
The overall system EMC tests are shown In Figure 2.8.1 as preceding the field tests.They could follow the field tests, if facilities scheduling would be better served.
Field tests would be conducted at a test site that has the following characteristics:
1. Unobstructed view toward area where the test target (aircraft) wlloperate.
2. Moderately rough terrain (e.g. plowed fields, heavy grass, or brushcovered) in the foreground, to minimize forward reflected propogation
as would be experienced over water.
3. Strong isolated point of clutter within field of view and at a rangebeyond radar antenna near field as well as the minimum rangecapability of the radar (as determined by the transmitted pulsewidthand receiver circuit recovery time). This clutter would be used forSCV measurements.
4. A boresight tower should be placed within the field of view and beyondthe near field of the radar antenna (R > 2D 2/,where D isthe maximum antenna aperture dimension and X is the wavelength).
5. It should be possible to position the mobile EMETF and other Jammersimulators (orJammers) in the foreground. If sidelobe cancellers areincorporated in the radar, it should be possible to position jammersimulators (noise sources) beyond the near field of the radar antenna.
The following tests would be conducted at this field site in accordance with theprocedures of Section 2.6.
a. Detection range and coverage (Test 1.1)b. SCV (Test 2.1)c. Range resolution (Test 5.1)d. Angle accuracy (Test 6.1)e. ECM vulnerability (Tests 8. 1 and 8.2)f. ARM susceptibility (Test 8.4)g. Target discrimination (Multiple-time-around target rejection
part of Test 9.1)
75
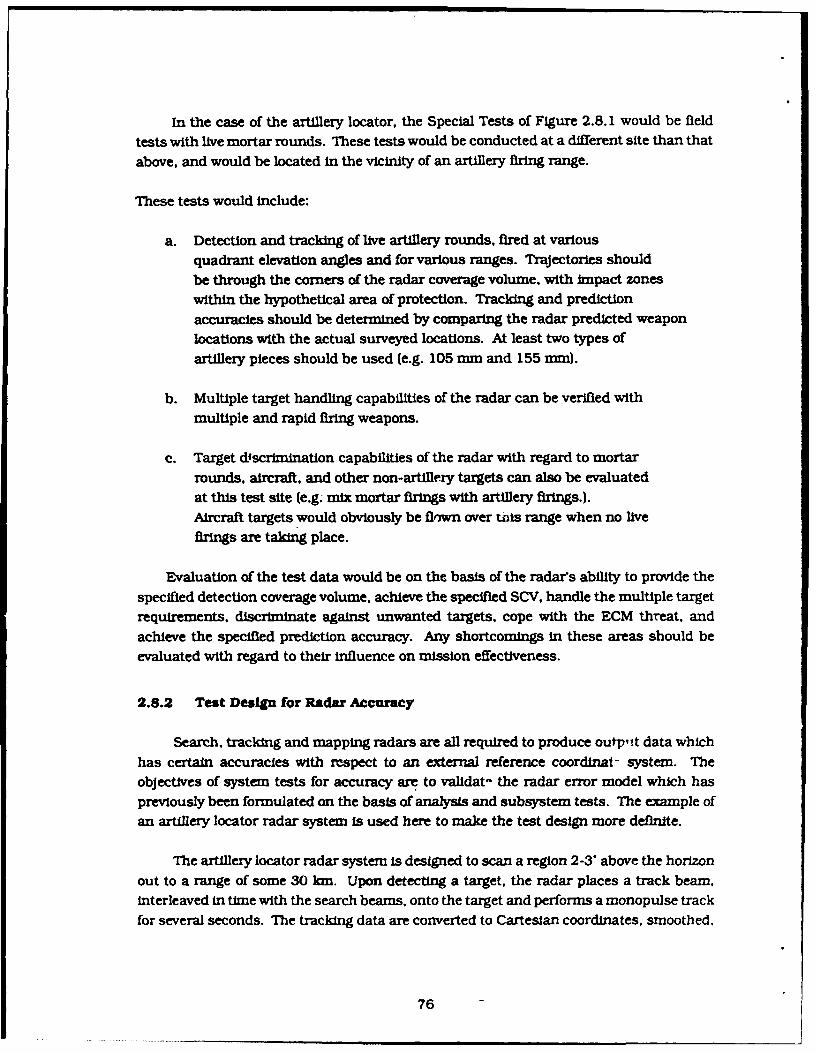
In the case of the artillery locator, the Special Tests of Figure 2.8.1 would be field
tests with live mortar rounds. These tests would be conducted at a different site than that
above, and would be located in the vicinity of an artillery firing range.
These tests would include:
a. Detection and tracking of live artillery rounds, fired at variousquadrant elevation angles and for various ranges. Trajectories should
be through the comers of the radar coverage volume, with impact zoneswithin the hypothetical area of protection. Tracking and prediction
accuracies should be determined by comparing the radar predicted weaponlocations with the actual surveyed locations. At least two types ofartillery pieces should be used (e.g. 105 mm and 155 mm).
b. Multiple target handling capabilities of the radar can be verified withmultiple and rapid firing weapons.
c. Target discrimination capabilities of the radar with regard to mortarrounds, aircraft, and other non-artillery targets can also be evaluatedat this test site (e.g. mix mortar firings with artillery firings.).Aircraft targets would obviously be flown over tais range when no livefirings are taking place.
Evaluation of the test data would be on the basis of the radar's ability to provide thespecified detection coverage volume, achieve the specified SCV, handle the multiple targetrequirements, discriminate against unwanted targets, cope with the ECM threat, and
achieve the specified prediction accuracy. Any shortcomings in these areas should beevaluated with regard to their influence on mission effectiveness.
2.8.2 Test Design for Radar Accuracy
Search, tracking and mapping radars are all required to produce outp,,t data whichhas certain accuracies with respect to an external reference coordinat- system. The
objectives of system tests for accuracy are to vaidat- the radar error model which haspreviously been formulated on the basis of analysis and subsystem tests. The example ofan artillery locator radar system is used here to make the test design more definite.
The artillery locator radar system is designed to scan a region 2-3" above the horizon
out to a range of some 30 km. Upon detecting a target, the radar places a track beam,interleaved in time with the search beams, onto the target and performs a monopulse trackfor several seconds. The tracking data are converted to Cartesian coordinates, smoothed,
76
and applied to estimation of a trajectory. The weapon is assumed to be located at theorigin of this trajectory. The intended accuracy of weapon location is 15 m CEP. includingeffects of terrain slopes and alignment of the radar to the reference coordinate system. Asa result. smoothed tracking accuracies of a few meters in range and tenths of one milliradianin angle are required.
In order to establish the objectives of a particular test, we must first define theoperational conditions to be simulated In the test:
(a) Type of weapon.(b) Type of trajectory.(c) Electronic and clutter environment.
The test objective is then to measure the radar system accuracy in a particularcombination of these three conditions.
General Test Procedures
The general test procedures must now be defined, based on the test objectives.
Boresight Tower Test for Angle Accuracy (Test 6.1). Define the following test con-ditions:
(a) Location of the tower from the radar.(b) Orientation of the radar array from the tower.(c) Signal power and fluctuation to be generated at the
boresight tower.(d) The nature of the terrain between the radar and the tower.
as it affects multipath error.(e) The signal environment to be modeled at the radar;
clutter, ECM, and friendly interference.
Boresight Tower Test for Range and Doppler Accuracy (Test 6.3). Define the followingtest conditions:
(a) Range and doppler shift vs. time.(b) Signal strength and fluctuation.(c) The signal environment at the radar receiver, clutter, ECM
and friendly interference.
Live Firing Test for Radar Accuracy (Test 6.2). Define the following test conditions:
77
(a) Specific type of projectile (e.g., 105-mm shell).(b) Trajectory. muzzle velocity, quadrant elevation, azimuth
from weapon.(c) Location of weapon from radar: range and azimuth.(d) Radar siting, assigned scan sector, and terrain characteristics.(e) Friendly signal environment in the band of radar operation.(1) Hostile signal environment in the band of radar operation.(g) Other instrumentation (e.g.. wind meastirement, impact location).(h) Data recording facilities and methods.(i) Real-time monitoring of test conduct results.Q) Data reduction. interpretation, and validation of test.
From (e) and (f) the location, type, and schedule of signal environment simulators isprepared.
2.8.3 Test Design for Vulnerability to Intercept
Hostile action against radars can take the form of active ECM passive ECM, evasion.or physical attack (e.g.. use of ARM's). In order to initiate this action, the presence andoperational state of the radar must be determined by the attacker, using either intelligencesources or real-time signal intercept. Both these sources of data may be Inhibited by useof radar waveforms and operating procedures which reduce the probability of signalintercept. Certain modem radars are designated as having low probability of intercept(LPI) features, some of which are common to conventional radars and others are uniqueto the LPI radar system. The purpose of this test is to evaluate the vulnerability of eithertype of radar to intercept of its signal by an ESM receiving system, and to location of theradar on the basis of this intercept data, in a realistic environment.
2.8.3.1 Definition of Test Objectives
The radar under test can always escape intercept If it falls to radiate a signal. Thesteps in defining the test objective are as follows:
Establish the normal operating mode or modes of the radar.
The radar specification must be reviewed to determine the characteristics of thesemodes, and to define the m fs in which the radar is to operate during the test. This datawill include the following:
78
(a) Transmitted waveform parameters.(b Antenna scan parameters.(c) Durations of radar emissions.
Define the environment (physical and electronic) In which the vulnerability of theradar Is to be assessed.
(a) Radar siting and terrain characteristics.(b) Associated vehicles and electronic equipment which may affect the
ability of the ESM system to locate and identify the radar.(c) Friendly signal environment In the band of radar operation and
adjacent bands. Relative location, fiequency and power ofsignal sources.
Define the location and type of ESM system against which the vulnerability is to beassessed. Prior analysis of the radar and its intended operational environment is requiredto establish reasonable or expected values for ESM location and type. For example, in thecase of a weapons location radar, the ESM may be land-based at ranges of I5 to 35 km,or airborne at 15 to 100 km. The conventional intercept receiver of today, optimized forradar signals used over the past several decades, canbe expected to achieve high probabilityof intercept on those signals, but not on new types or signal used in LPI radars. Wiley [91has discussed the approaches to design of intercept receivers for LPI waveforms, and atsome time in the future it may be necessary to test both conventional and LPI radarsagainst both conventional and new intercept receiver designs. The ESM system charac-teristics to be specified for test are as follows:
(a) Range and altitude of receiver.(b) Intervening terrain features.(c) Type of antenna and scan or printing angle.(d) Type of receiver and a priori data available to operator.
Define the time scale of the intercept operation (given enough time, most radars canbe intercepted and located even when the probability of signal intercept is low for a givenobservation): Desired probability of intercept = P in t seconds. Prior analysis of the radarand ESM system is required to establish reasonable or expected values of probability andtime.
Define the objective of the intercept system in radar location: Desired accuracy oflocation a* or ay, in t, seconds. Prior analysis of the radar and ESM system is needed toestablish reasonable values of accuracy and time.
79
2.8.3.2 General Test Procedures
The general test procedures must now be defined, based on the test objectives.
1. Radar location and schedule of operation.2. ESM system location and schedule of operation.3. Location, type and schedule of signal environment simulators.4. Other instrumentation (e.g., tracking of airborne platforms).5. Pre-test briefing of operating personnel.6. Data recording facilities and methods.7. Real-time monitoring of test conduct and results.8. Data reduction, interpretation, and validation of test.
2.8.4 Test Procedures for RPV-Based Battlefield Surveillance Radar
System level testing of a synthetic aperture radar (SAR) is devoted primarily to ver-ifying that the radar imaging capabilities satisfy the specifications. The characteristicsthat must be verified include:
- resolution- field of view- mapping accuracy- sensitivity
The imaging technique of SAR requires forward motion of the platform to sweep outthe synthetic aperture that provides the azimuthal resolution. Furthermore, the qualiyof the resulting imagery depends to a great extent on the accuracy with which the motioncompensation function in the radar measures and corrects for departures from a straight.constant velocity motion. Therefore, it is not possible to make significant tests of theimaging capability of SAR by bench tests in the laboratory.
The most useful approach to system testing of these radars is to fly them in the fieldagainst calibrated test scenes. A number of different test scenes are usually required.One scene provides resolution measurement, another provides dynamic range and sen-sitivity measurement, while others provide realistic targets for Image quality assessment.
A test scene for measuring the resolution capabilities of the radar consists of an arrayof radar reflectors aligned in a cross (or ell) formation on the ground. The alignment isoriented relative to the flight path so that one row of reflectors is along the range dimensionof the resulting imagery, while the other row is along the transverse dimension (the doppleror azimuth dimension). The spacing of reflectors along each row is made non uniform.
80
The spacing of the closest pair of reflectors is made equal to the specified resolution, withother pairs having increasing spacings. Corner reflectors or Luneburg lens reflectors canbe used in these arrays. however care must be taken to orient their direction of highreflectivity relative to the flight path so that they are visible to the radar. The test sceneis flown over and imaged. and the resulting imagery is analyzed to verify that the specifiedresolution is obtained in each coordinate. The Radar Spoke/Resolution Facility ("Spoke"Facility) at USAEPG represents such a capability.
A test scene for measuring the sensitivity and dynamic range of the SAR consists ofan array of reflectors of varying sizes, ranging from a minimum of approximately 1.0 n2
or less, up to 100 n2 or more. These reflectors are placed in a cross (or V) orientationaligned with the range and doppler coordinates of the SAR imagery so that any signalsaturation or suppression effects caused by saturation in the receiver or signal processorwill be observed. These effects are visible in the imagery as either (a) dark bands ofsuppressed signals extending to either side of the image of a large reflector, or (b) doubledor paired images of some of the smaller reflectors surrounding the image of a large reflector
(i.e.. mirror images).
Coordinate scaling nonlinearities and skewing in the imagery can be measured usinga test scene consisting of a set of radial lines of reflectors. A useful arrangement for thispurpose consists of a set of eight spokes radiating outward at 45 degree increments inbearing and extending as far as practicable relative to the size of knagezy to be generated.The imagery of this test scene is analyzed to determine the accuracy of scaling throughout
the Image area.
More elaborate test scenes can be used to verify the functional capability of the radarto provide the types of data and information intended for its tactical applications. A testscene containing a large number of armored and other tactical military vehicles andweapons (the BarstowArray) has been established by the U.S. Army at Barstow. California.This well documented test array is extremely useful for evaluating the suitability of theSAR imagery to support the detection and classification of targets by human (or computerbased) imagery analysis. Another very useful set of test scenes (the North East Test Area)has been established in the region near Griffiths Air Force Base in New York State. Thisset of scenes contains examples of various tactical (and strategic) target complexes such
as a coal-fired power plant, a hydro-electric plant, a set of runways, a warehouse area,and permits the assessment of the SAR image quality for these military significant andcomplex scenes.
81
2.9 Test Data Recording and Evaluation
Closed-loop testing described in Section 2.5 above is based on the use of a Computer
Aided Testing (CAT) approach which is organized around a desk top computer with its
common peripherals 1101. A typical configuration would include the following: computer,
keyboard, monitor, printer/plotter, operation system, internal RAM, hard disk, commu-
nications interface, high level program language compiler, and I/O devices that are
compatible with the radar test point terminations.
Data recording, analysis and evaluation are accomplished by appropriate software
written to implement the required functions. In the case of analysis and evaluation are
accomplished by appropriate software written to implement the required functions. In the
case of analysis of test data, off-the-shelf math packages are available that can perform
most of the analysis required for radar evaluation.
One issue that requires careful consideration is that of speed compatibility. Large
amounts of real time data manipulation will force some partitioning of computer tasks
into an off-line mode. Off-line data processing can be implemented in another computer
or in the CAT computer at a later time so long as the test data have been captured in real
time and stored on disk.
2.10 Test Equipment and Facilities
This section summarizes the test equipment and facilities requirements for conducting
the tests described in Sections 2.5 and 2.6. Facilities available at Ft. Huachuca areidentified, and representative commercially available test equipments are identified as
candidates for conducting the tests on the representative radars described in Section 2.7.
2.10.1 Requirements
Table 2.10.1 summarizes the requirements for the closed-loop tests listed in Table
2.4.1 and described in Section 2.1
Table 2.10.2 summarizes the requirements for the field tests listed in Table 2.4. 1 and
described in Section 2.6. These tests should be conducted at a site which provides a clearview in the foreground, and the latter should be characterized by moderately rough terrain
such as brush coverrd o, plowed fields (as contrasted with smooth surfaces, such as overwater, which will introduce a significant propagation factor due to surface reflection).
Strong point clutter scatter should be within the field of view to permit SCV measurements,
and a boresight tower should be available for tracking accuracy measurements.
82
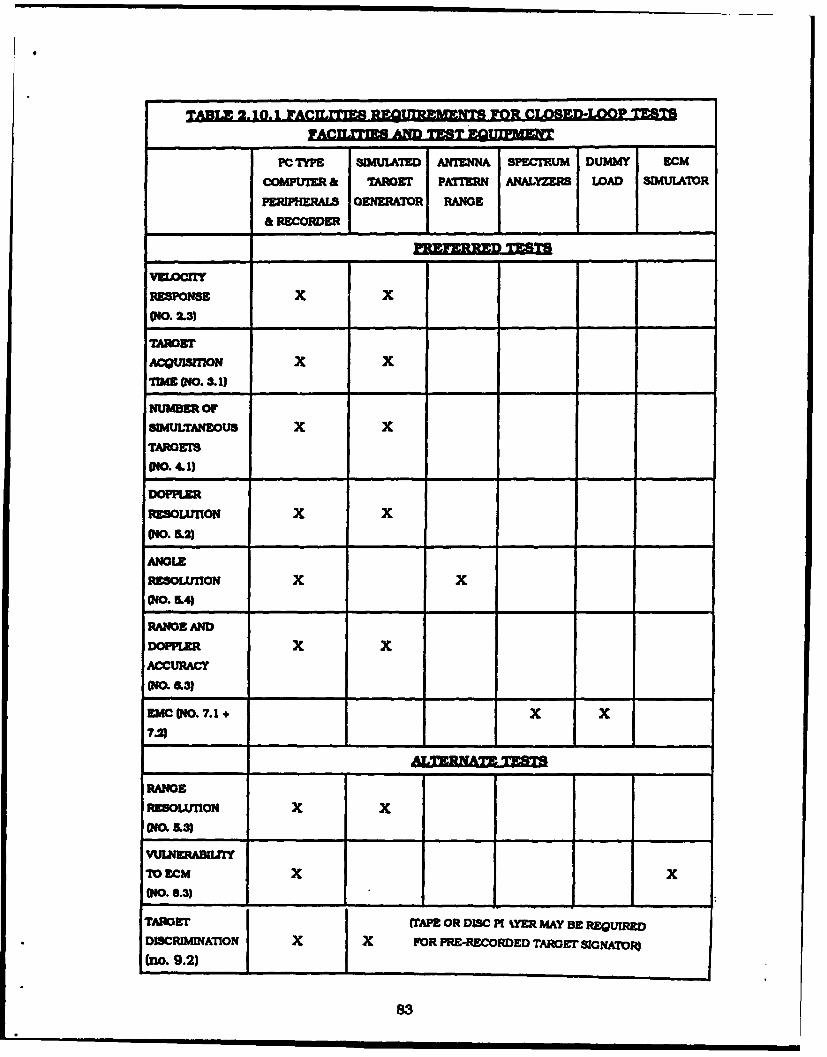
PCwTPE SI0a"TED AWIIINN SPECTUM DUMMIY ECM
COMPUIER & TAROET PATERN ANALYEMS LOAD SMUa"TOR
PEIPEALSA GENERATOR RANGE
&RECORDER II1-
RIMPONSE X X(NO.2.3)____
TARGET
ACQUISITIN X XtIlE (NO. 3.1)
SIMANEOUS X xTARGETS
010. -L1)
DOPPLER
RIESOLUTION X X(1. 5.2)
ANGIERESOLAtiON x x(NO. L41
RANGEAND
DOPPLER X xACCURACY
(NO. &3)
EMC (NO. 7.1 + xX
RANGE
RESOLUTION X XM O.53)
VULNEAMaff~
TO ECm x x(NO.8.3)
TARGLCT (rAPE OR DISC PI "IMR MAY BE REQUIREDDISCRIWMIN ON x X FOR PRE-RECORDED TARGET SIONATOR)
(no. 9.2) j83
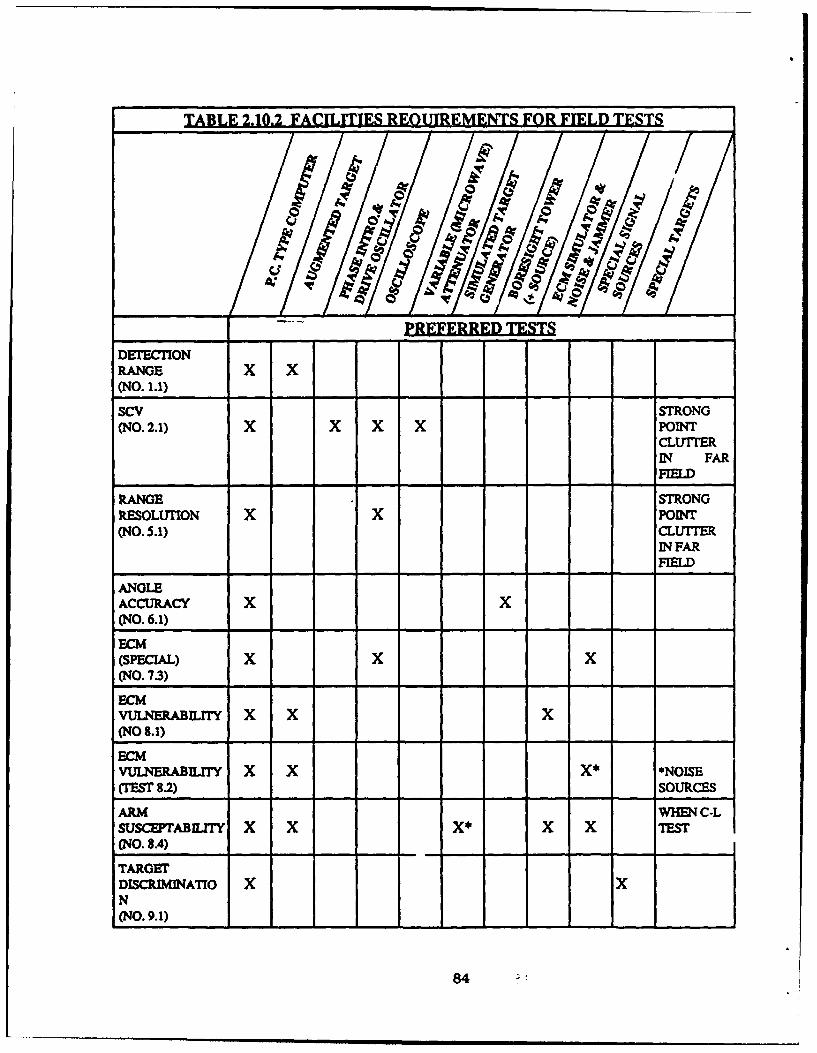
TABLE 2.10.2 FACILITIES REQUIREMENTS FOR FIELD TESTS
CI__________ PREFERRED TESTS____
DETECTIONRANGE X X(NO. 1.1)_ _ _ _
SCV STRONG(NO. 2.1) X X X X POINT
CLUTMP,IN FARFIELD
RANGE STRONGRESOLUTION X X POINT(NO. 5.1) CLurITE
IN FARFIELD
ANGLEACCURACY X X(NO. 6.1)
ECM(SPECIAL) X X X(NO. 73) 1___1_1
ECMVULNERAB Y x X X(NO 8.1)
ECMVULNERABILITY X X X* *NOISE(TEST 8.2) SOURCES
ARM WHEN C-LSUSCEPTABM X X X X rEST(NO. 8.4)
TARGETDISCRIMAINATIO X XN(NO. 9.1)
84
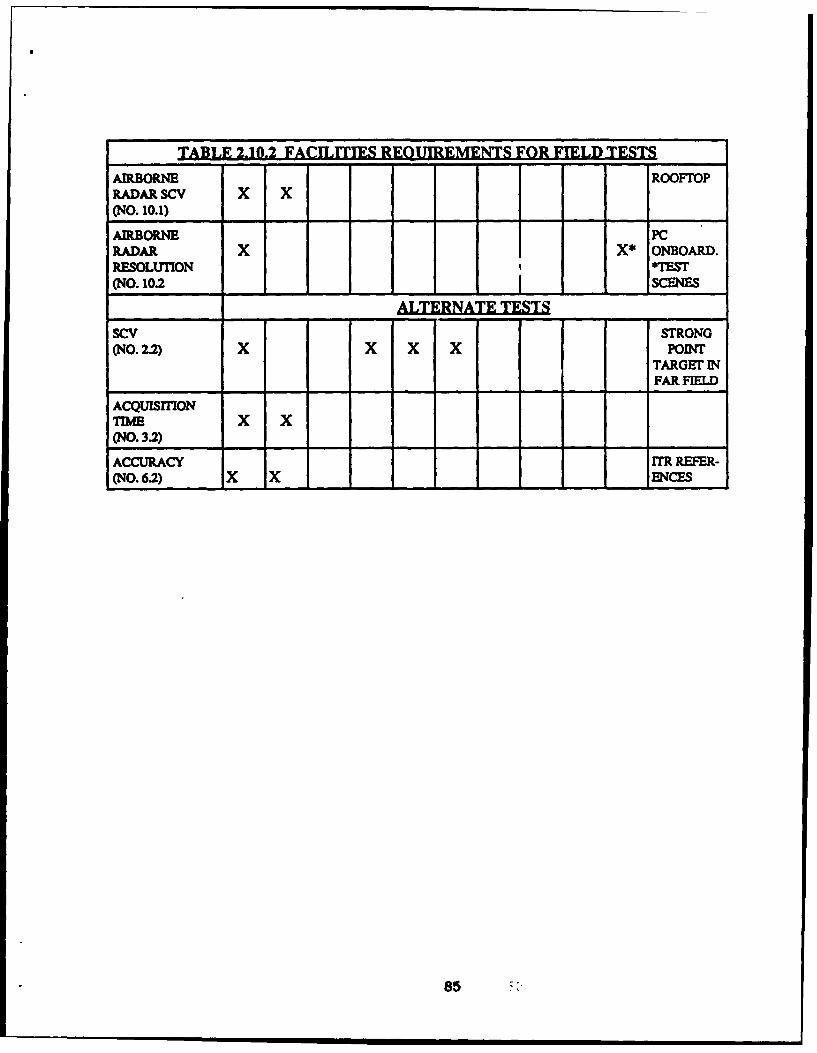
TABLE 2.10.2 FACILITIES REOUIREMENTS FOR FIELD TESTS
AIRBORNE ROOFTOPRADAR SCV X X(NO. 10.1)
AIRBORNE PCRADAR X X* ONBOARD.RESOLUTION TEST
(NO. 102 SCENES
ALTERNATE TESTS
SCV STRONG(NO. 2.2) X X X X POINT
TARGET INFAR FIELD
ACQUISITIONTIEX X(NO. 3.) 1 1
ACCURACY ITR REFER-(NO. 6.2) X X ENCES
85
The site should not preclude the location of the mobile (non-communications) EMETF
for the conduct of ECM vulnerability tests.
It can be seen that all of the tests with a modern digitally-controlled radar require a
PC-type computer plus peripherals and recording equipment for control of the tests anddata collection. In addition, test data processing (tabulating. plotting, statistical analysis,
etc.) should be done with this computer or a compatible computer.
Test software will have to be prepared for the radar system to be tested. Also, interfaces
between the PC and the radar will have to be established. These may be available through
the radar control computer bus or the built-in-test (Brl or fault isolation features of the
radar. However, it is very likely that some special hardware and software will be required
to effect the appropriate interfaces.
Airborne radar testing may not require a boresight tower for rooftop testing. Flight
tests will require an aircraft equipped with an adequate IMU and sufficient on-board space
to allow for the PC system and the test personnel as well as the radar. The test scenes for
SAR testing could be the Fort Huachuca "Spoke" and "Dry Lake" facilities.
The final field tests for an artillery locator (or mortar locator) should involve !ii .weapon
firings. In this case, target discrimination techniques are expected to be based on trajectoryanalysis and multiple-time-around echoes. Hence, field tests should be planned on thisbasis and incorporate targets and firing conditions which are to be discriminated against.
The Fort Huachuca Instrumented Test Range (rrR1) will provide an excellent reference
for use in position accuracy measurements in any radar tests involving airborne targetsor airborne radars which have position measurement features. (See I] and [11].)
Special targets for conducting discrmintion tests would be determined by the radar
performance specification.
The number of noise sources required for test 8.2 should equal the maximum numberof Jammers called out in the specification.
To a large extent, the facilities required for evaluation of intercept vulnerability areavailable as by-products of existing EW test programs. For example, at USAEPG there aremany types of ESM -quipment. either under evaluation or in use as support equipment
for other programs. The EMETF is equipped with advanced "stress loading' simulationsto produce EM environments according to standardized scenarios for different militarysituations. While this equipment has been designed to test intercept receivers, commu-
nications receivers, and radar receivers, it can also serve as the background environment
86
for evaluation of vulnerability of the conventional or LPI radar system to intercept of its
signals. Antenna test facilities, suitable for manyvarieties of rada, "' --nnas, are installed
at AEPG.
The additional facilities needed for complete evaluation of LPI radar systems include
the following:
(a) Special LPI waveform generators to simulate the signals from certain newradar designs, in closed-loop tests;
(b) Antenna pattern generators to simulate the low sidelobes of new antennadesigns, in sectors far from the main lobe;
(c) Multipath scattering models to simulate the effects of a number standardterrain situations and radar siting options;
(d) Field test sites, chosen to represent these terrain situations, to validatethe simulations and closed-loop test results on vulnerability to intercept;
(e) Generic airborne intercept and seeker receivers, to be used in the field teststo validate the indoor test results and to provide data on location andhoming accuracy (not readily obtained through simulation and closed-loop
testing):
(f) Field environment signal generators, to amplify and radiate the EM envi-ronment of the closed-loop models toward the airborne receivers duringfield tests involving the actual radar equipment.
2.10.2 Test Facilities - Available and Required
Tables 2.10.3 and 2.10.4 include brief descriptions of the facilities and test equipmentidentified In Section 2.10.1, together with the Identification of typical available facilitiesand equipment as well as an indication of availability at USAEPG. Where question marksare shown, It Is understood that equipments of the general types listed are at Fort Hua-chuca, but it Is not known if these equipments would meet all of the requirements or ifthey would be available to a given radar testing program.
The configuration suggested in Section 2.5.1 for closed-loop testing is based on asignal simulator that Injects various test signals, under computer control, into the receiver
87
and/or digital processor subsystems. A test control computer coordinates the test signal
inputs and evaluates the radar performance by monitoring the processing and data results
in the radar.
A suitable signal simulator is the Model HP-8770A Arbitrary Wavreform Synthesizer
of Hewlett-Packard [121. This synthesizer together with a control computer and waveform
synthesis software is termed the HP-8770S Signal Simulator System. [2]. Arbitrary
waveforms !n the frequency range of 0 to 50 MHz are define in the control computer using
the software provided. They can then be stored on disk for later use and also downloaded
to the signal simulator memory for immediate signal generation. The simulator can be
programmed to interlace various waveforms from its memory in a flexible manner, thus
providing a multiple target echo simulation capability.
88
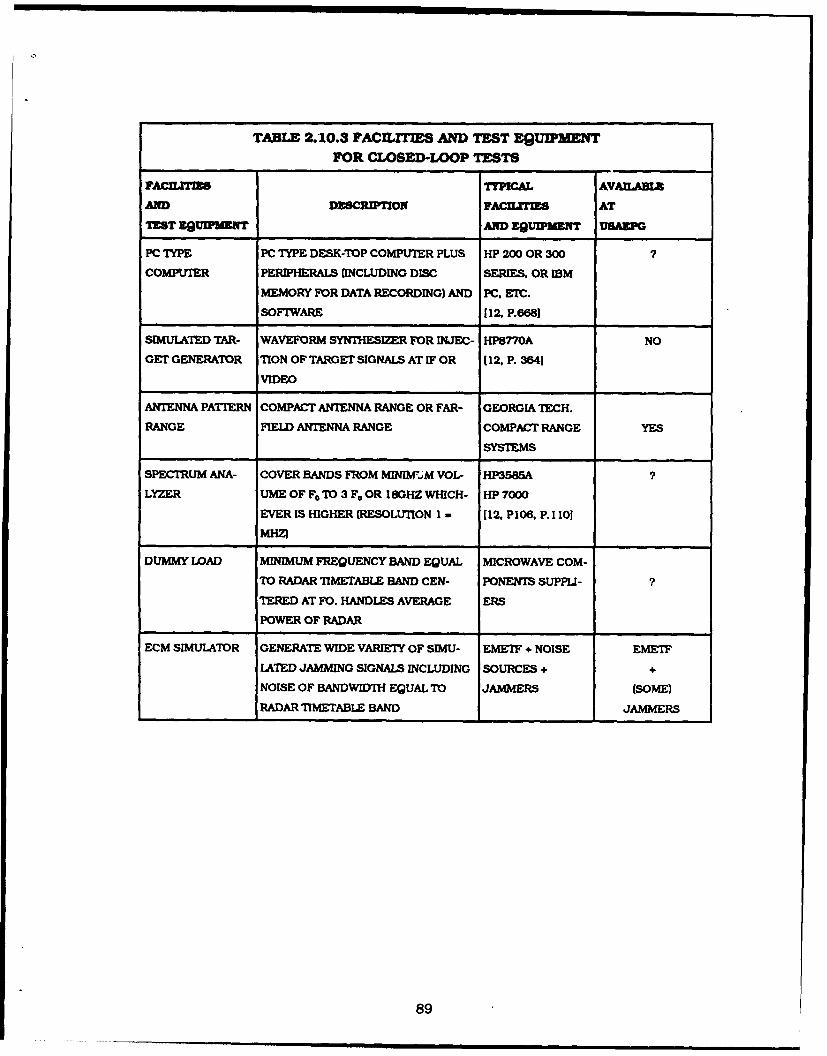
TABLE 2.10.3 FACILTIES AND TEST EQU1PMNTFOR CLOSED-LOOP TESTS
FACnILITIS TYPICAL AVALAMX
AND DE SCRWTON FACUXrrEMS AT
TEST EQUpaMET AND EQUIPMNT USAE
PC TYPE PC TYPE DESK-TOP COMPUTER PLUS HP 200 OR 300
COMPUTER PERIPHERALS (INCLUDING DISC SERIES, OR IBM
MEMORY FOR DATA RECORDING) AND PC. ETC.
SOFTWARE 112. P.6688
SIMULATED TAR- WAVEFORM SYNTHESIZER FOR INJEC- HP8770A NO
GET GENERATOR ION OF TARGET SIGNALS AT IF OR 112, P. 3641
VIDEO
ANTENNA PATTERN COMPACT ANTENNA RANGE OR FAR- GEORGIATECH.
RANGE FIELD ANTENNA RANGE COMPACT RANGE YES
SYSTEMS
SPECTRUM ANA- COVER BANDS FROM MINIMW.M VOL- HP3585A
LYZER UME OF F, TO 3 Fo OR 18GHZ WHICH- HP 7000
EVER IS HIGHER (RESOLUTION 1 - [12. P106. P. 1101MHZ)
DUMMY LO)AD MINIMUM FREQUENCY BAND EQUAL MICROWAVE COM-
TO RADAR TIMETABLE BAND CEN- PONENTS SUPPLI-
TERED AT FO. HANDLES AVERAGE ERS
POWER OF RADAR
ECM SIMULATOR GENERATE WIDE VARIETY OF SIMU- EMET + NOISE EMETF
LATED JAMMING SIGNALS INCLUDING SOURCES+ +
NOISE OF BANDWIDTH EQUAL TO JAMMERS (SOME)
RADAR TIMETABLE BAND JAMMERS
89
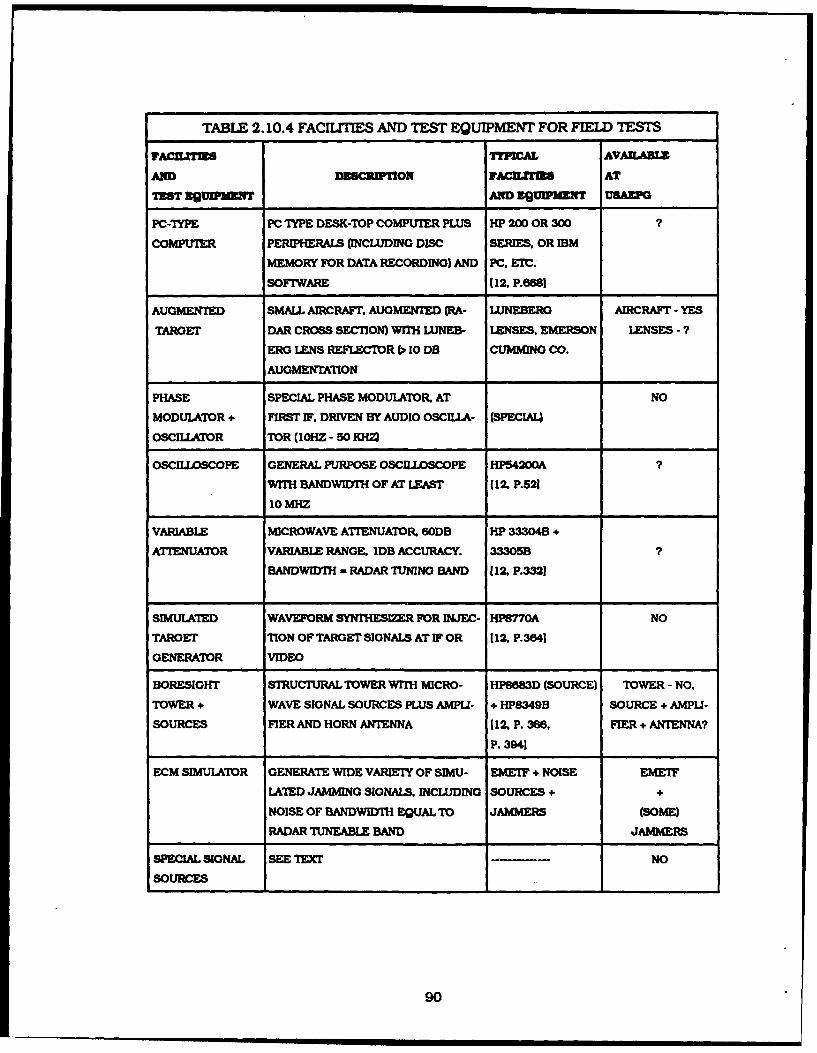
TABLE 2.10.4 FACIITInES AND TEST EQUIPMENT FOR FIELD TESTS
FACnJTIS TYPICAL AVAU.ADI
AND DiSCr tmON FAC I3JT AT
Tr nm it AND 9 WnUNT Ua&RPO
PC-TYPE PC TYPE DESK-TOP COMPUTER PLUS HP 200 OR 300
COMPUTER PERIPHERALS (INCLUDING DISC SERIES, OR IBM
MEMORY FOR DATA RECORDING) AND PC. ETC.
SOFTWARE [12. P.6681
AUGMENTED SMALL AIRCRAFT. AUGMENTED (RA- LUNEBERG AIRCRAFT - YES
TARGET DAR CROSS SECTION) WITH LuNEB- LENSES, EMERSON LENSES -?
ERG LENS REFLECTDR (> 10 DB CUMAING CO.
AUGMENTATION
PHASE SPECIAL PHASE MODULATOR, AT NO
MODULATOR + FIRST IF, DRIVEN BY AUDIO OSCILIA- (SPECIALU
OSCILLATOR TOR (10HZ - 50 KHZ4
OSCILLOSCOPE GENERAL PURPOSE OSCILLOS)COPE HPS4200A
WITH BANDWIDTH OFAT LEAST (12. P.521
10 MHZ
VARIABLE MICROWAVE ATTENUATOR. 60DB HP 33304B +
ATIENUATOR VARIABLE RANGE. IDB ACCURACY. 33305B ?
BANDWIDTH - RADAR TUNING BAND (12 P.3321
SIMULATED WAVEFORM SYNTHESIMR FOR INJEC- HP8770A NO
TARGET ION OF TARGET SIGNALS AT IF OR 112, P.364
GENERATOR VIDEO
BORESIGHT STRUCTURAL TOWER WITH MICRO- HP8683D (SOURCE) TOWER - NO,
TOWER . WAVE SIGNAL SOURCES PLUS AMPLI- + HP8349B SOURCE + AMPLI-
SOURCES FIER AND HORN ANTENNA 112. P. 366, FIER + ANTENNA?
P. 3941
ECM SIMULATOR GENERATE WIDE VARIETY OF SIMU- EMEF + NOISE EMET
LATED JAMMING SIGNALS. INCLUDING SOURCES+ +
NOISE OF BANDWIDTH EQUAL TO JAMMERS (SOME)
RADAR TUNEABLE BAND JAMMERS
SPECIAL SIGNAL SEE TEXT NO
SOURCES
90
Detailed specifications and descriptions of the Hewlett Packard equipments arecontained in [121. This equipment supplies is by no means the only source for suchequipments. However, the company offers a relatively complete line of equipment forsuch application, and it Is taken to be representative of what is generally available.
The EMEF is described In (Il and 113. The Compact Antenna Range (CATR) isdescribed in (1. P.261 and presentation notes by Georgia Tech Research Institute.entitled, "Fort Huachuca Compact Range".
2.11 Conclusions and Recommendations
This study has developed a methodology for radar system testing and evaluationwhich organizes the test procedures into laboratory-type testing, or closed-loop tests, tocharacterize system performance in a fine-grain sense, and field tests to benchmarkmajor system performance measures in a real-world enviro-nent. The result of suchan approach should be the achievement of a thorough and quantitative evaluation of aradar system at minimum cost.
Emphasis has been placed on modem and future radar designs, with the recogni-tion that such radars have and will have extensive digital technology incorporated inthem. This digital technology is largely of general purpose nature, including asignificant amount of software. Hence, one important conclusion is that PC-type com-puter systems will play an important role in radar system testing.
The evolving threat places increased emphasis on testing for ECM vulnerability,including the capabilities of radars designed to achieve low probability of intercept (LPI)to avoid being located and negated (e.g. by ARM missile attack).
A review of the requirements for facilities and test equipment to perform radar sys-tem tests, together with a review of Fort Huachuca facilities reveals that USAEPG offerssome unique facilities. In particular, the EMETF (non-communication portion) providesa strong potential for testing for ECM vulnerability. Of special interest is the potentialfor its use in creating an electromagnetic background wherein intercept receivers orARM seekers can be pitted against a radar system under test for LPI evaluation.
Other USAEPG facilities that are applicable to radar system testing include:
1. Compact Antenna Range - for low-sidelobe antenna patternmeasurements.
91
2. Radar Geometric Fidelity Facility at "Dry Lake" - for mapping radar
evaluation.
3. Radar "Spoke"/Resolution Facility - for evaluation for synthetic
aperture radars (SARs).
4. Blacktail Facility - for EMC testing.
5. Instrumented Test Range ffM - for radar accuracy measurements.
In addition, the geography of Fort Huachuca suggests that excellent field test sitescan be established for testing all radar types of interest to this study. The availability of
flight test aircraft, the potential for live firing tests for weapons location system, and thefavorable climate combine to enhance the potential of the Fort Huachuca area for these
purposes.
It Is recommended that a number of Test Operation Procedures (TOPs) be pre-pared for radar system testing, as follows:
1. Radar Receiver and Digital Subsystem Closed-loop Testing
2. Field Testing of Radar System Overall Performance
3. Testing Radar System Vulnerability to Active ECM
4. Testing Radar System LPI Performance
Item 1. above, would cover the tests described in Section 2.5.3 of this report. Item2 would cover the tests described in Sections 2.6.1 through 2.6.7. Item 3 would cover
Section 2.6.8, and item 4 would cover Section 2.6.9.
It is also recommended that a TOP be prepared (or modified) to cover radarantenna pattern measurements with the new compact antenna range.
92
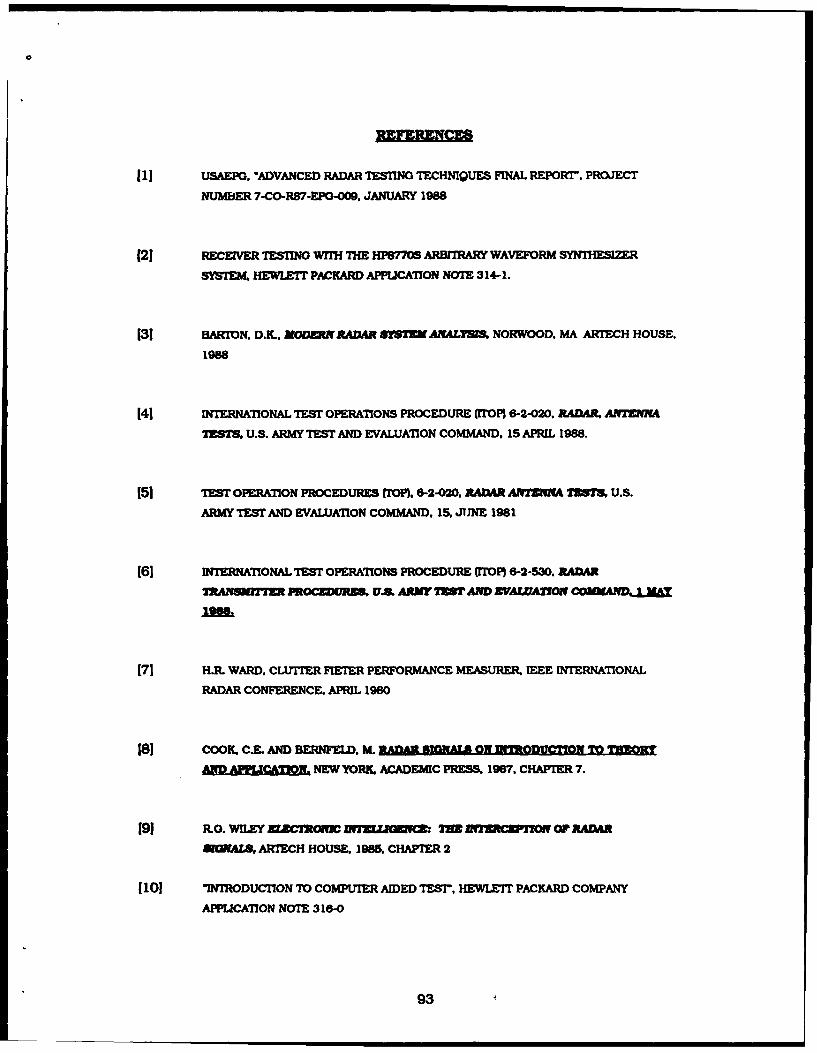
S USAEPG, "ADVANCED RADAR TESTNG TECHNIQUES FMLAL REPORT". PROJECT
NUMBER 7-CO-187-EPO-O09, JANUARY 1988
121 RECEIVER IESTIN wfX THE HP878 ARBITRARY WAVEFORM SYNTHESIZER
SYSM HEWLTnT PACKARD APPUCA7ON NOTE 314-1.
[31 BARION. D.K. MODERN RADAR 8rY'EMANALYSIS, NORWOOD, MA ARTECH HOUSE,
1988
141 INTERNATIONAL TEST OPERATONS PROCEDURE rroP) 6-2-2. RADAR. ANWE A
vTS, U.S. ARMY TEST AND EVALUATION COMMAND. 15 APRIL 1988.
151 TEST OPERATION PROCEDURES frOP. 6-2-20. RADAR AMrMi A IUS, U.S.
ARMY TEST AND EVALUATION COMMAND, 15, JU)NE 1981
[61 INTERNATIONAL TES OPERATIONS PROCEDURE crroP 6-2-530, RADAR
XRAN?2 FROCEDMUM, UAL ARMY XT rAND ,VAUA7ON COMUUA.j=. Y
171 H.R. WARD. CLUTTER FIETER PERFORMANCE MEASURER. IEEE INTERNATIONAL
RADAR CONFERENCE, APRIL 1980
181 COOK. C.. AND BERNFELD. M. ON s NTRoDUC=o TO
AND APPHJCATPLo. NEW YORK. ACADEMC PRESS, 1967, CHAPTER 7.
191 R.O. WILEY Z CM'OMC IZuiaiM IME ITWCTON Or RADAR
EORAZS, ARMCH HOUSE, 1985, CHAPTER 2
1101 "INIRODUCTION TO COMPUTER AIDED TES1 . HEWL.EIT PACKARD COMPANY
APPIUCAION NOTE 318-0
93
(11] CENTER OF EXCELLENCE (COE) FOR REMOTELY PILOTED/UNMANNED AIRBORNE
VEHICLE TESTING. FORT HUACHUCA
1121 TEST AND MEASUREMZNT CATALOG. HEWLEIr-PACKARD COMPANY. 1988
1131 OPERATiON AND PERFORMANCE OF THE TACTCAL ELECrRONIC WARFARE
ENVIRONMENTAL SaMJIATOR rEWES). RD. OPLEY. R.L ROBINSON, AND AR.
ICER NRL REPORT 8878. APR L 15, 198.
94